Headlines
|
|
What lagging Small Caps suggest about recession:
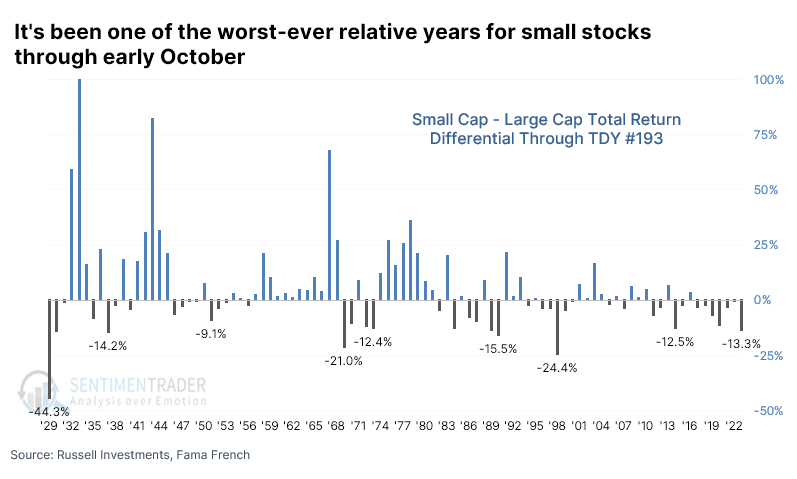
Through early October, Small Caps have underperformed Large Caps by more than -13%, the 8th-worst showing in the past 95 years. Other years when Small Caps lagged by more than -10% tended to preceded bad absolutely total returns for Small Caps, especially in relation to larger stocks.
|
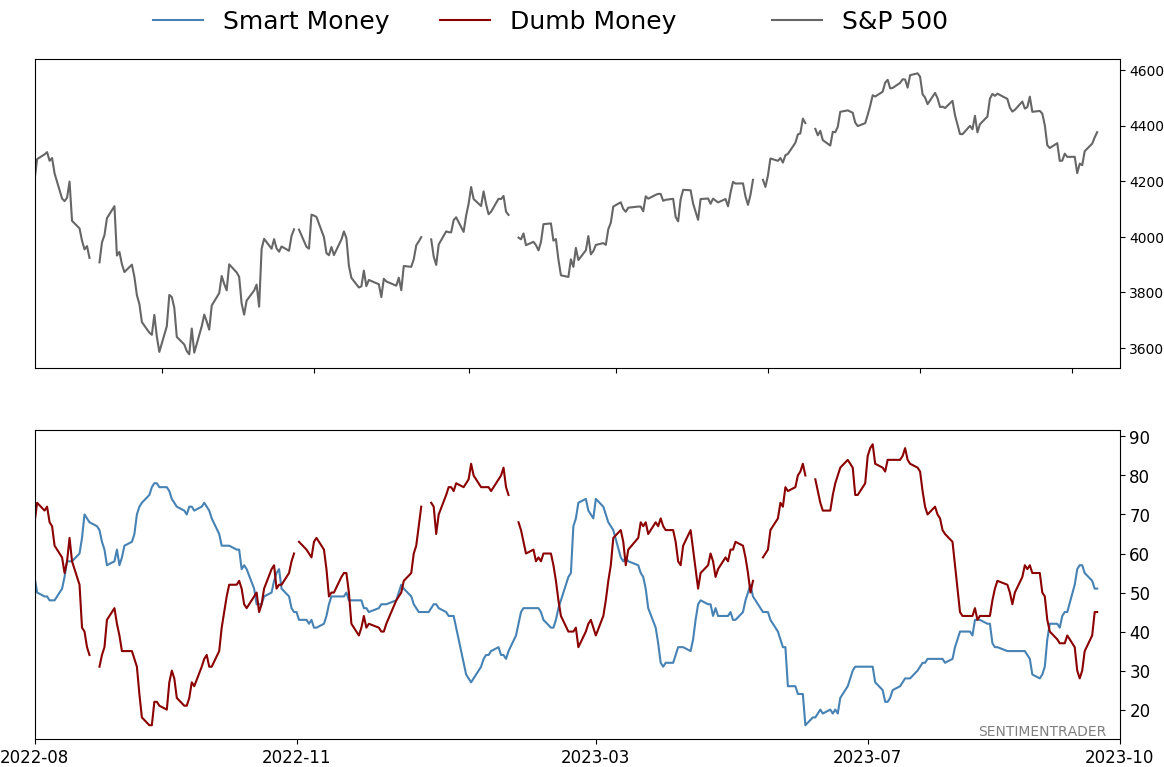
Smart / Dumb Money Confidence
|
Smart Money Confidence: 51%
Dumb Money Confidence: 45%
|
|
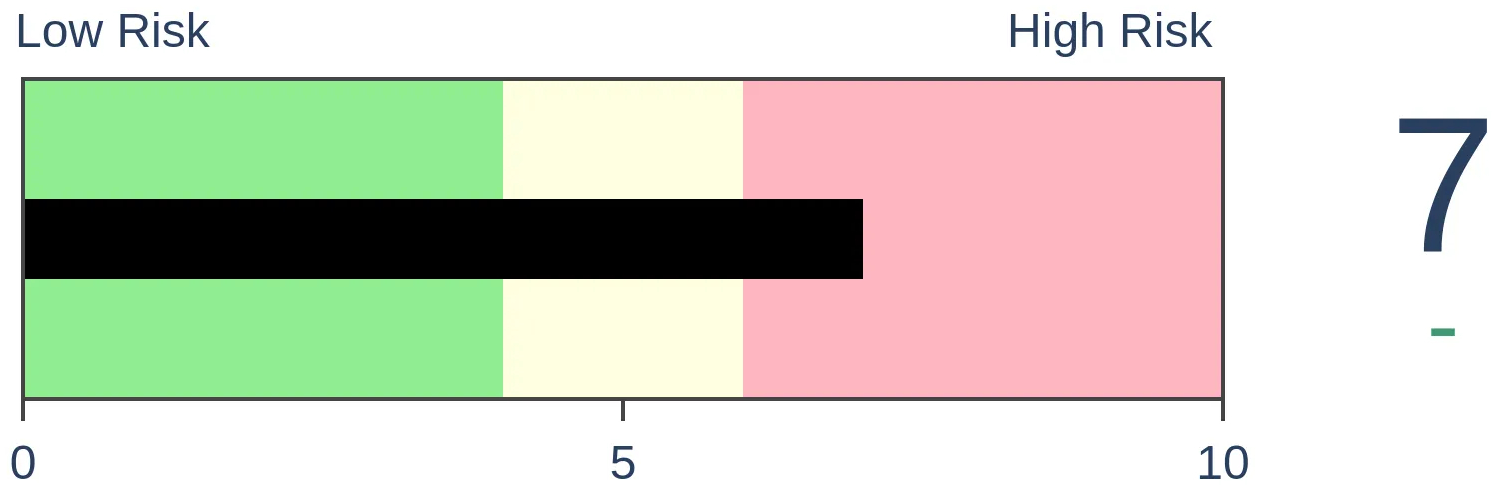
Risk Levels
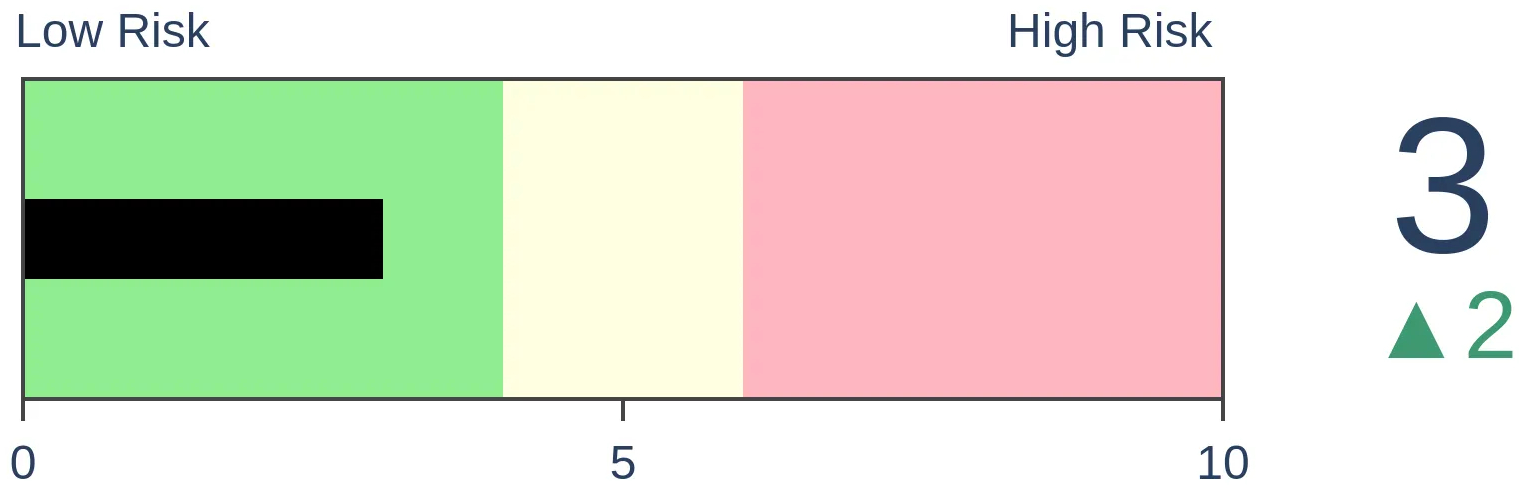
Stocks Short-Term
|
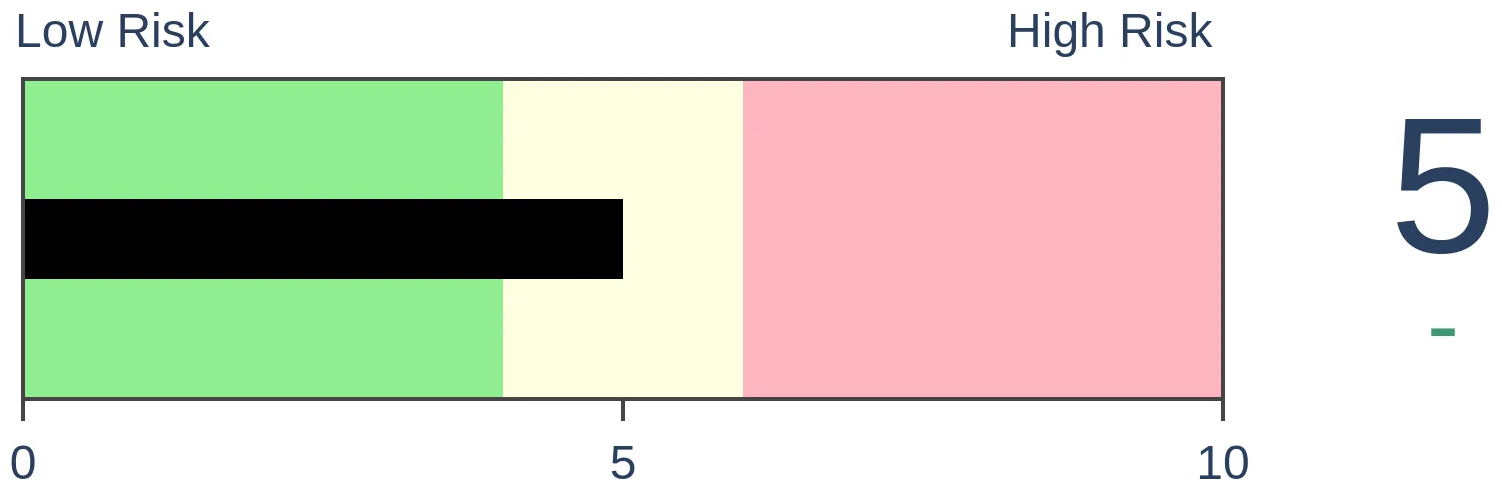
Stocks Medium-Term

|
|
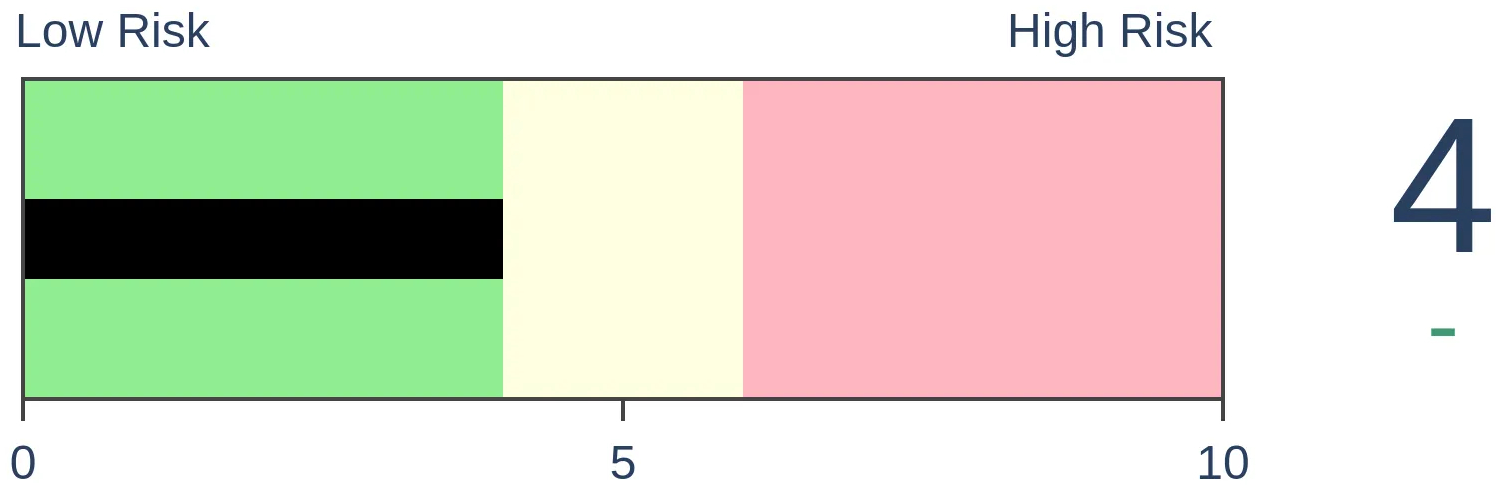
Bonds
|
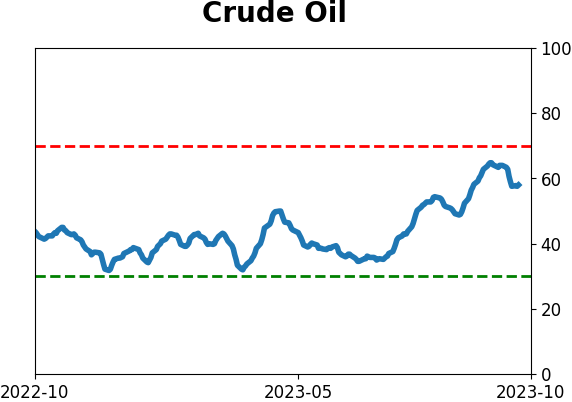
Crude Oil
|
|
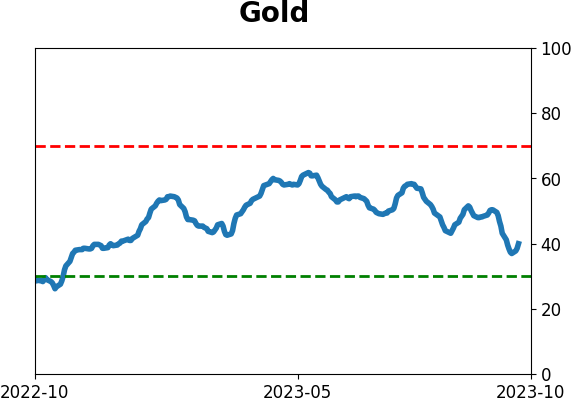
Gold
|
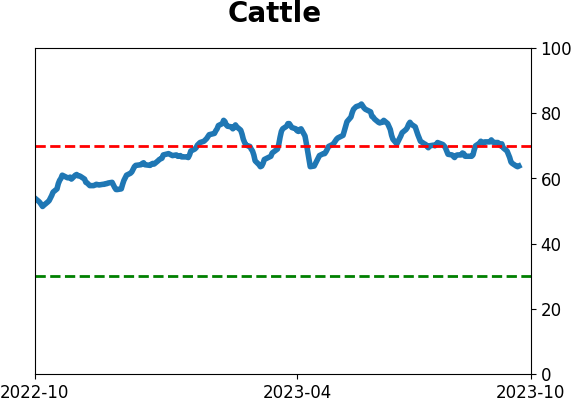
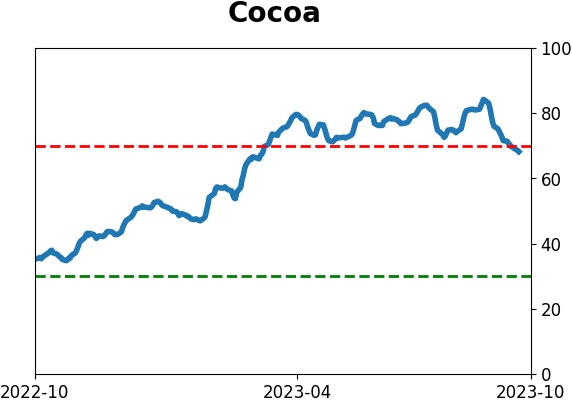
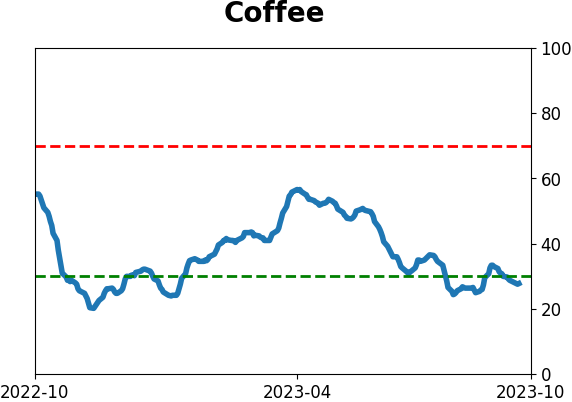
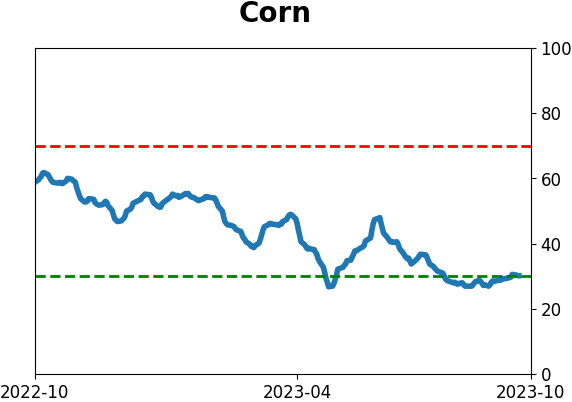
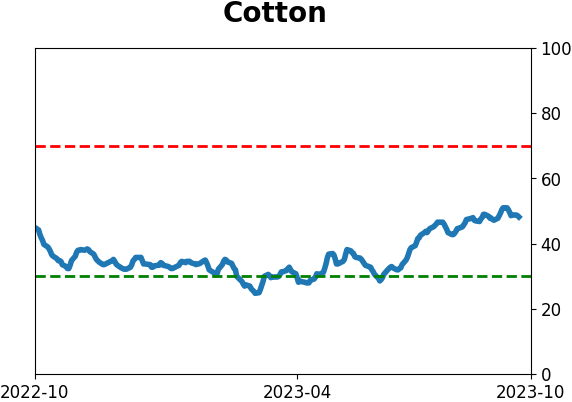
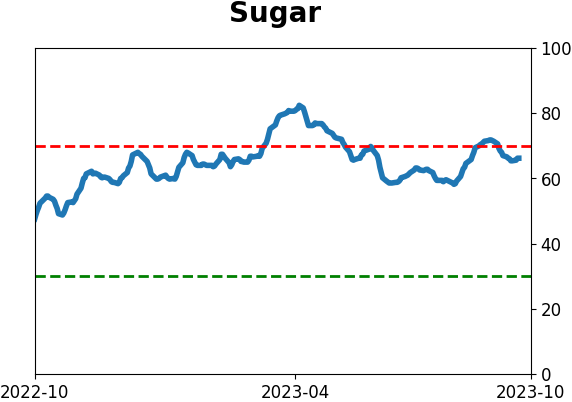
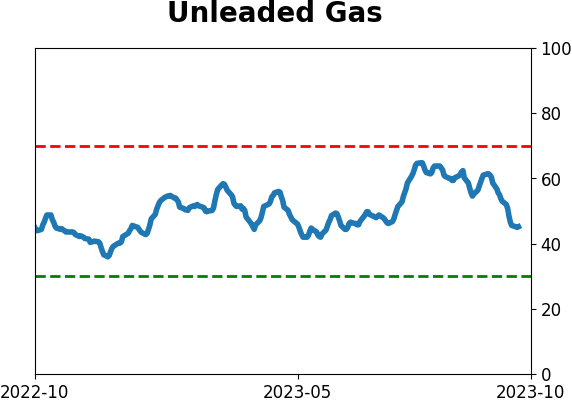
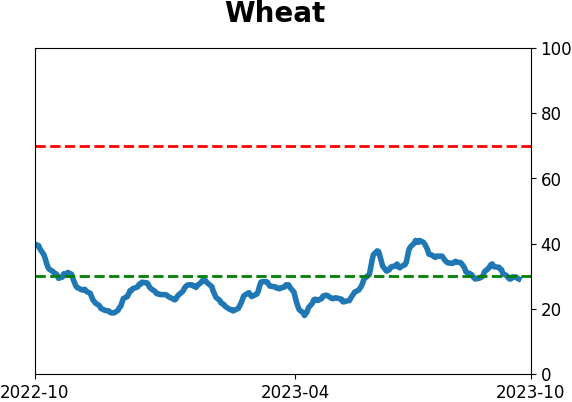
Agriculture

|
|
Research
By Jason Goepfert
BOTTOM LINE
Through early October, Small Caps have underperformed Large Caps by more than -13%, the 8th-worst showing in the past 95 years. Other years when Small Caps lagged by more than -10% tended to preceded bad absolutely total returns for Small Caps, especially in relation to larger stocks.
FORECAST / TIMEFRAME
None
|
Key points:
- Small Caps have underperformed Large Caps by more than 13% through early October
- This is their 8th-worst underperformance over the last 95 years
- Other years with more than 10% underperformance tended to lead to more of the same
Small stocks continue their miserable year (relatively)
Small stocks continue to lag, and the consensus is building that this signals recession ahead.
We've looked at the spread between small and large stocks several times in recent months, almost always suggesting that underperformance by smaller stocks would most likely continue but also that it doesn't necessarily mean much for the rest of the market.
According to The Wall Street Journal:
The Russell 2000 index remains in a bear market since peaking in late 2021 and has lagged behind the large capitalization Russell 1000 by a whopping 13 percentage points this year. The upshot? These stocks have been good at signaling recessions but are also those that investors have been best off owning after one has materialized.
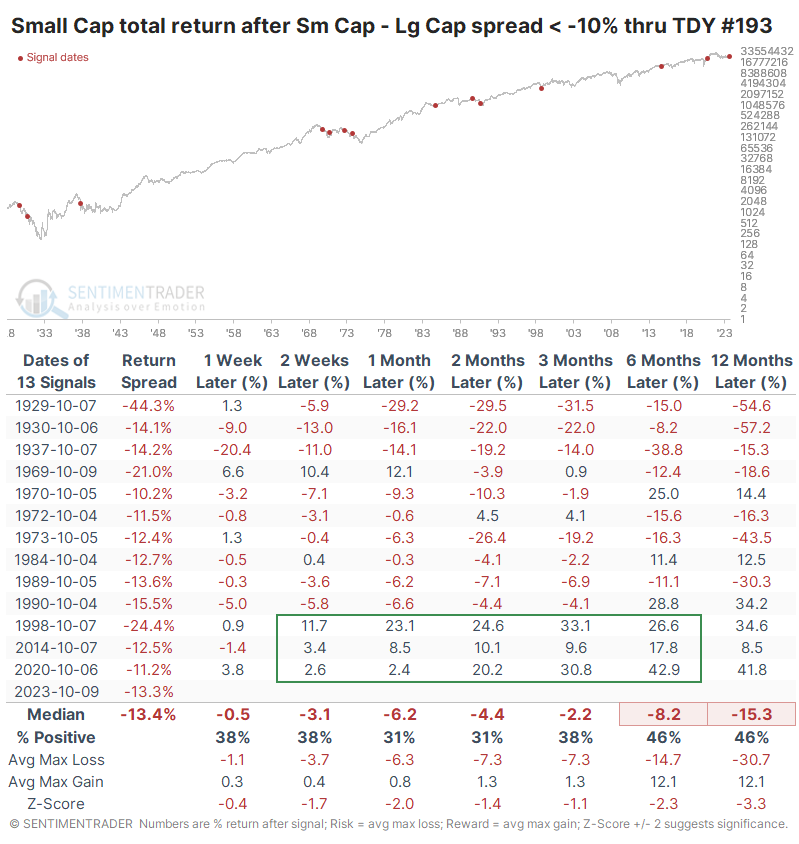
This is surely one of the worst years in nearly a hundred for Small Cap stocks relative to Large Caps, based on their total returns through Trading Day of the Year (TDY) #193. With Small Caps underperforming by more than -13%, the spread is the 8th-worst out of the last 95 years.
For small stocks, this was a bad sign. They tended to show weak absolute returns in the months ahead, even including dividends. Over the next two to three months, their consistency, returns, and risk/reward skew were particularly woeful. The only positive takeaway for bulls is that the last three signals all bucked the long-term trend.
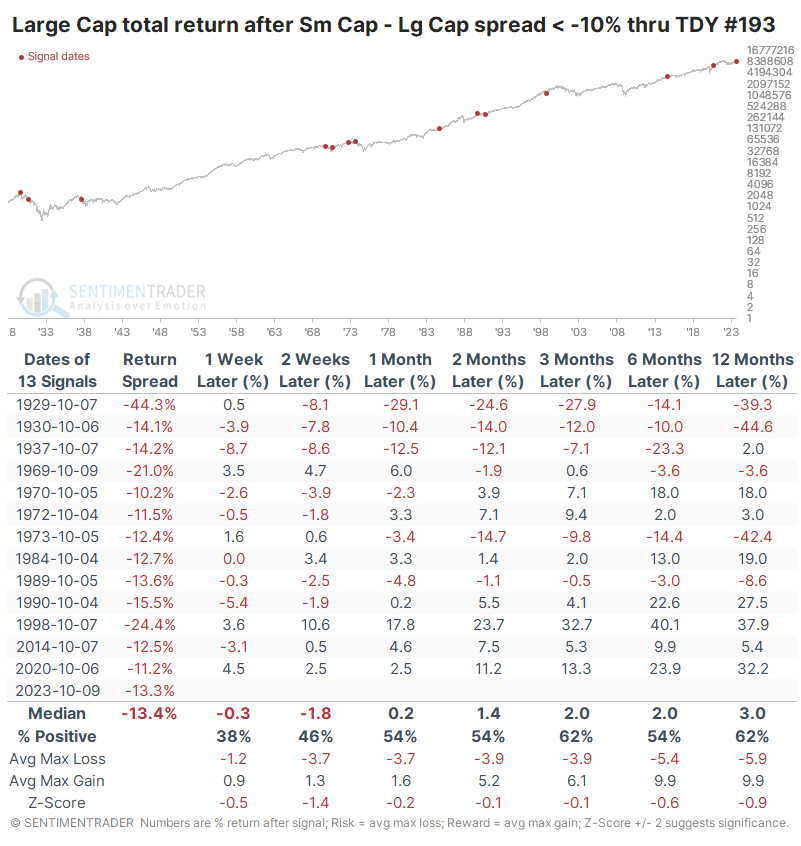
It wasn't such a bad sign for larger stocks, especially during the last 50 years. Nothing was spared during the 1930s, but outside of that, only one signal preceded a double-digit decline.
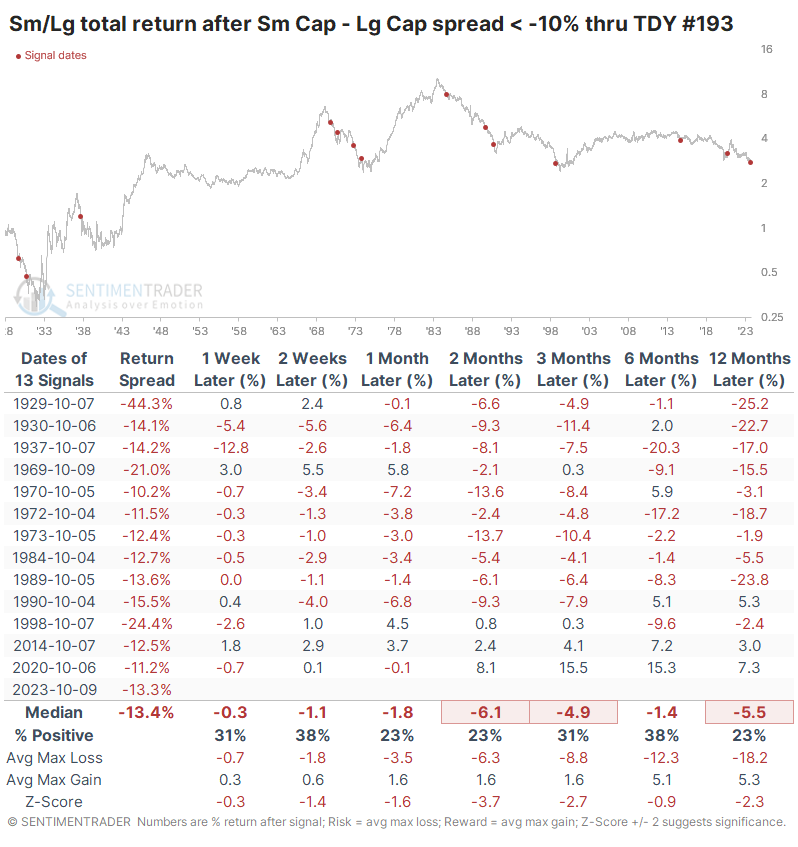
The relative ratio between the two shows that smaller stocks had a strong tendency to continue to underperform. Even up to a year later, small stocks outperformed only 23% of the time, though once again, the worst signals were concentrated in earlier decades.
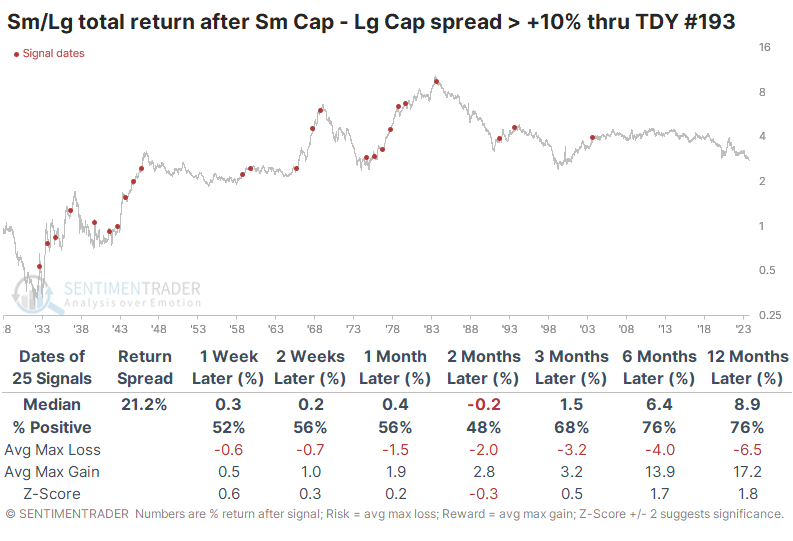
It was a much different story during those years when Small Caps outperformed Large Caps by +10% or more, which happened about twice as frequently as Small Caps underperforming. After these signals, smaller stocks showed a tendency to continue their outperformance. Over the next 6-12 months, they beat larger stocks more than three-quarters of the time.
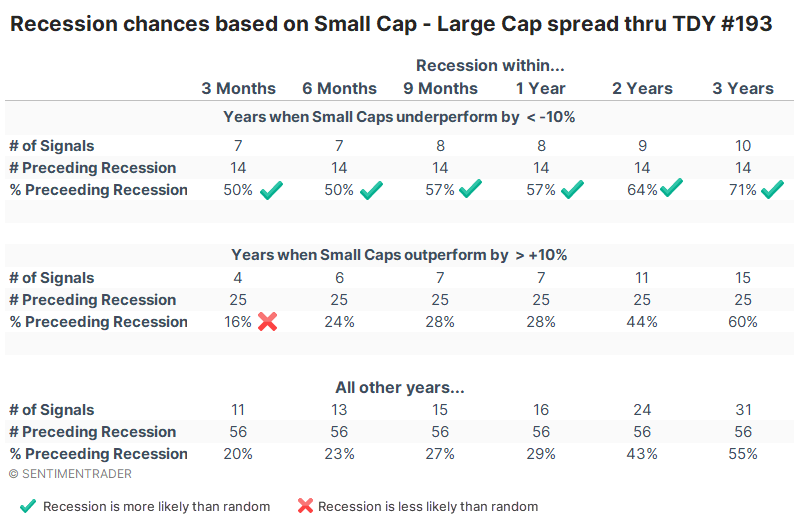
There might be something to the idea of these signals leading to recessions. The table below shows how often a recession happened within six time frames based on whether Small Cap stocks underperformed or outperformed Large Caps through day #193 each year.
Across all time frames, a recession was more likely to happen if Small Caps underperformed. When they lagged Large Caps by more than -10%, the U.S. was in recession within a year 57% of the time. If Small Caps had outperformed by more than +10%, then that probability fell to only 28%. That wasn't much different than any other year at 29%, but it was about half as likely as when smaller stocks underperformed as they have this year.
What the research tells us...
We've looked at the remarkably poor trend persistency in Small Caps in various ways lately, and none of them suggested a high likelihood of mean reversion, especially relative to Large Caps or the broader market. Other metrics, like relative valuations, might be more compelling, but we're clearly seeing extreme behavior regarding pure price performance or total return.
But that extreme behavior has tended to precede even more persistency in the existing trend, which is down for smaller stocks relative to larger ones. When they've underperformed by this much, they've shown poor absolute returns and terrible relative ones. The last few signals have bucked that overall trend, and maybe this one, too. It's just fighting the long-term behavior of investors.
Indicators at Extremes
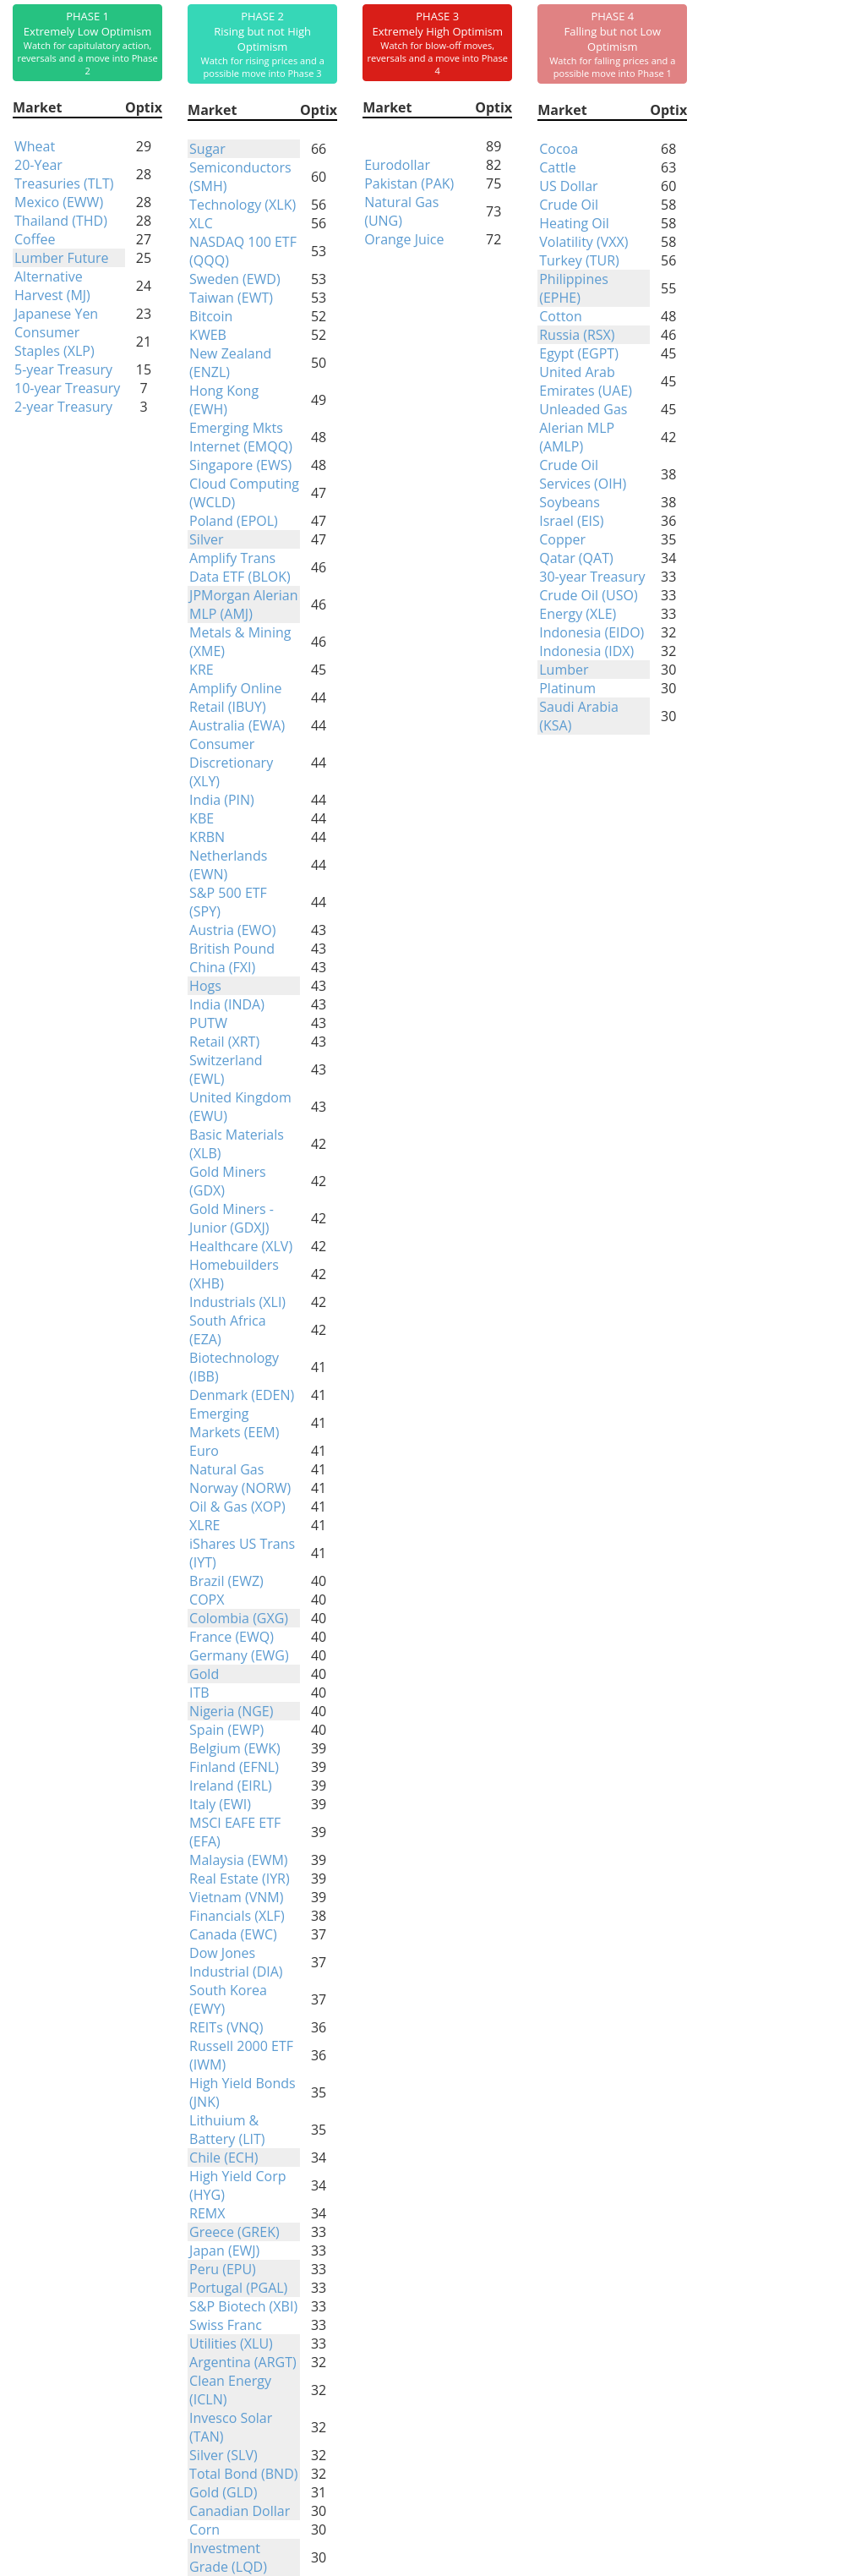
Phase Table
Ranks
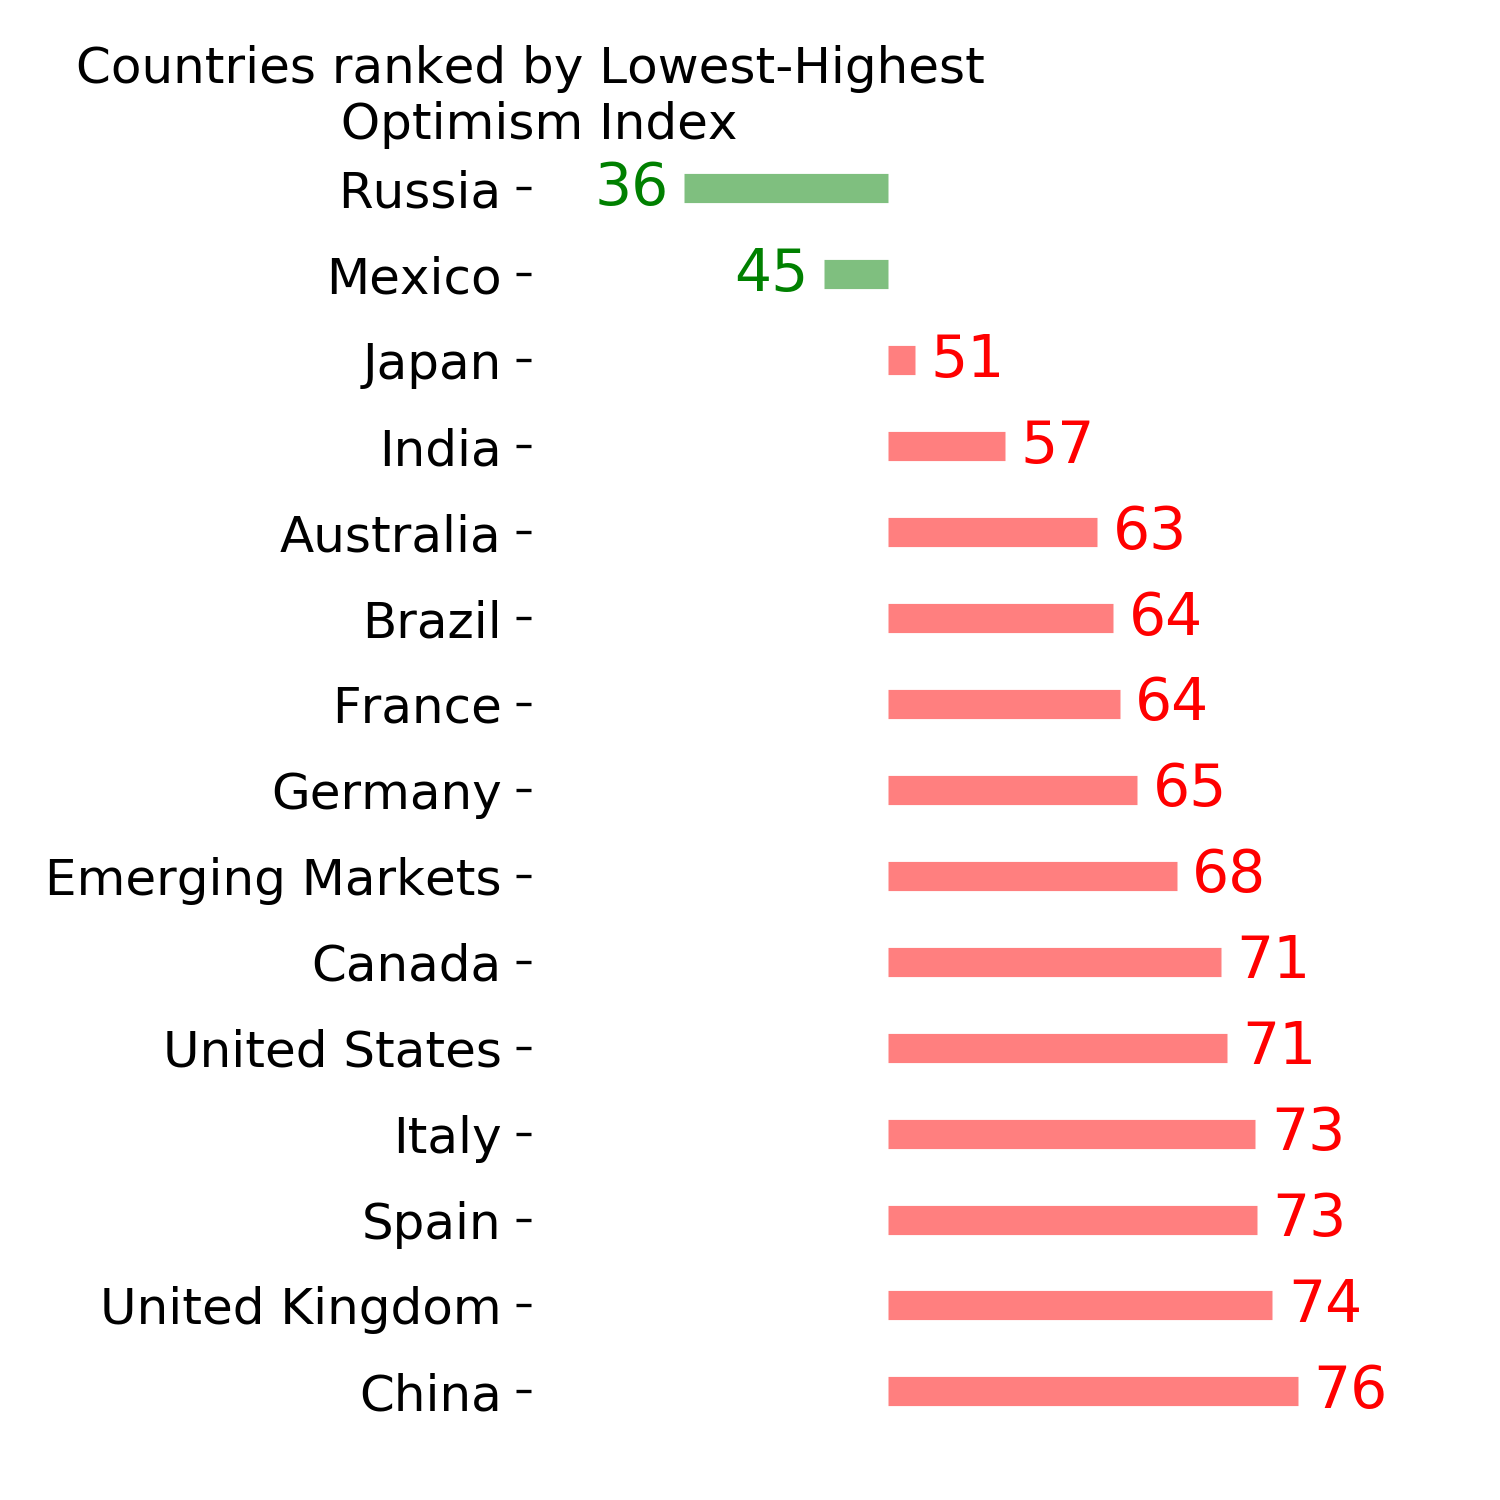
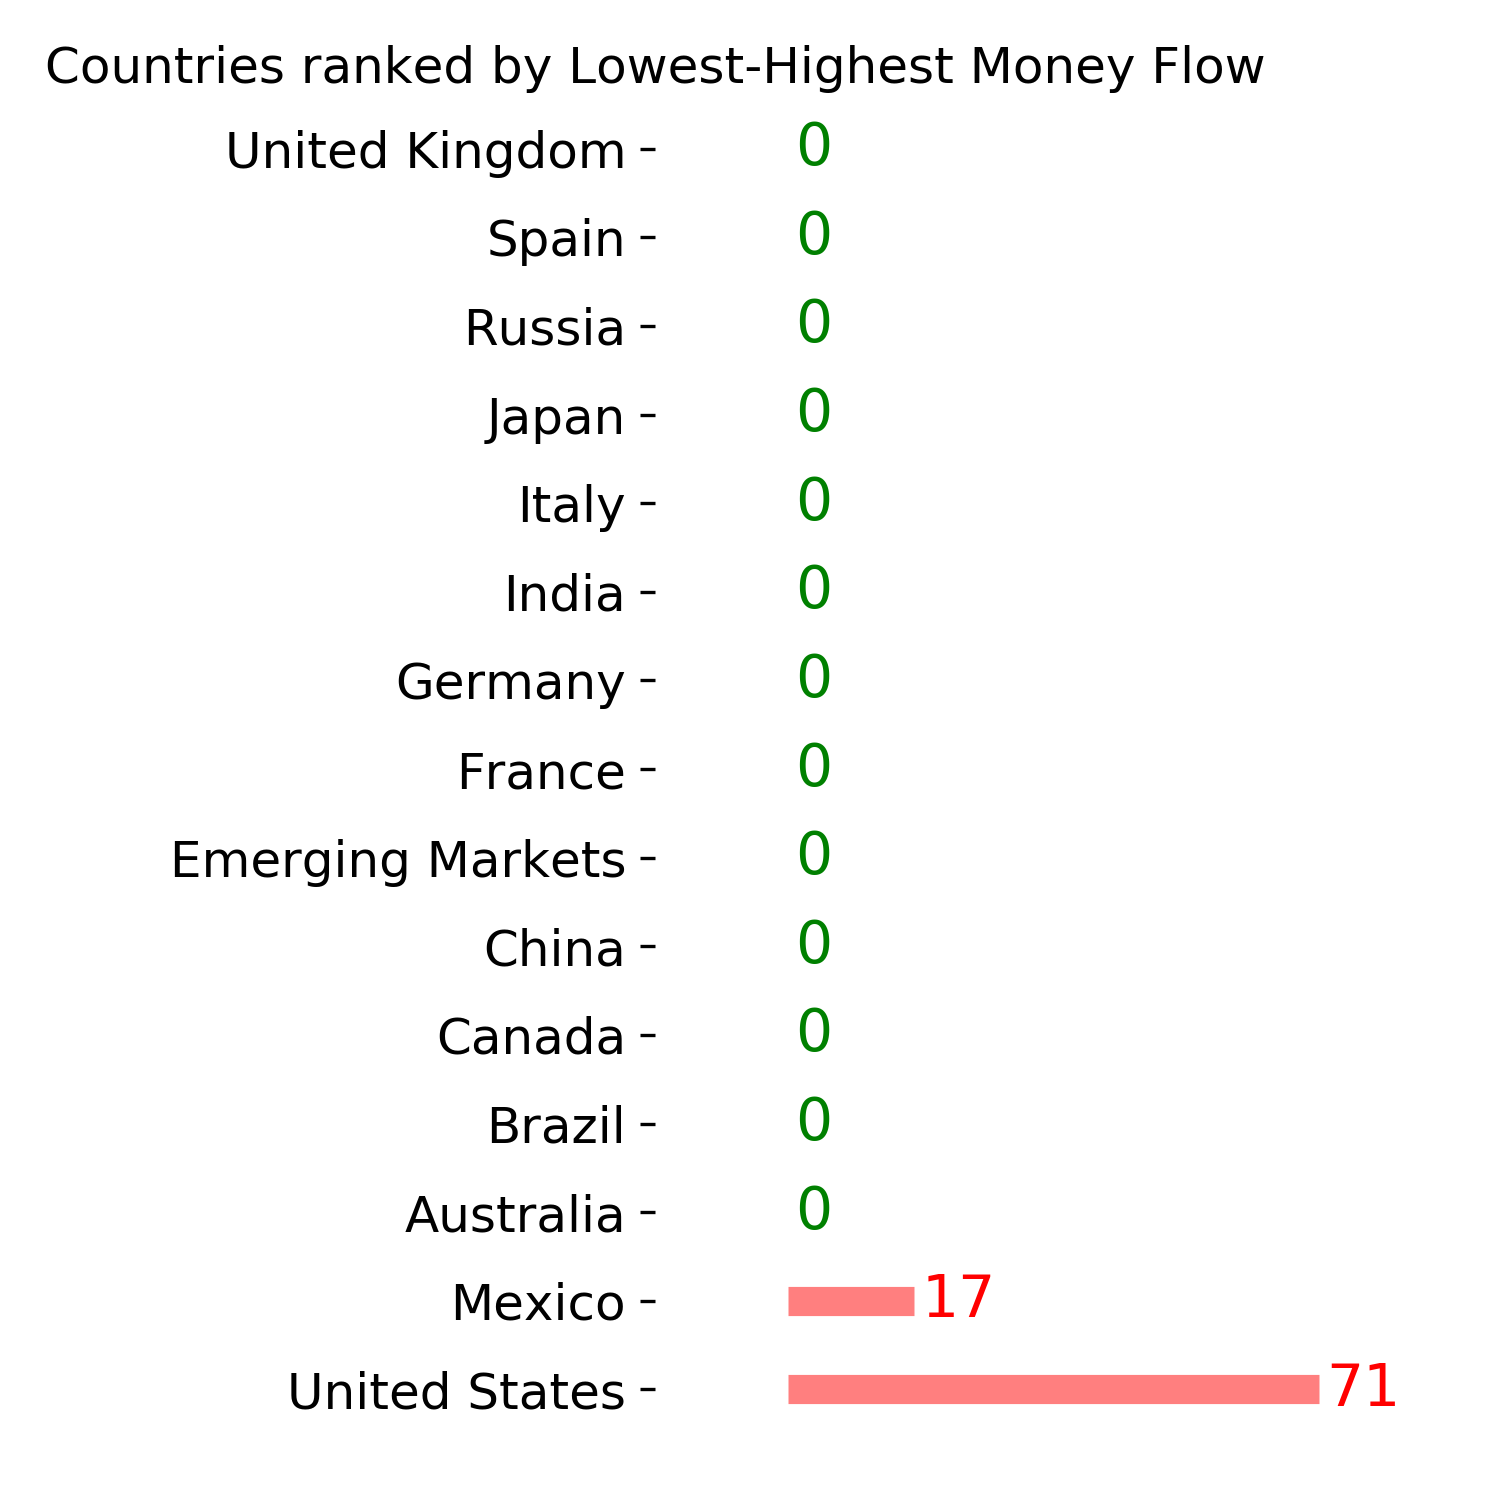
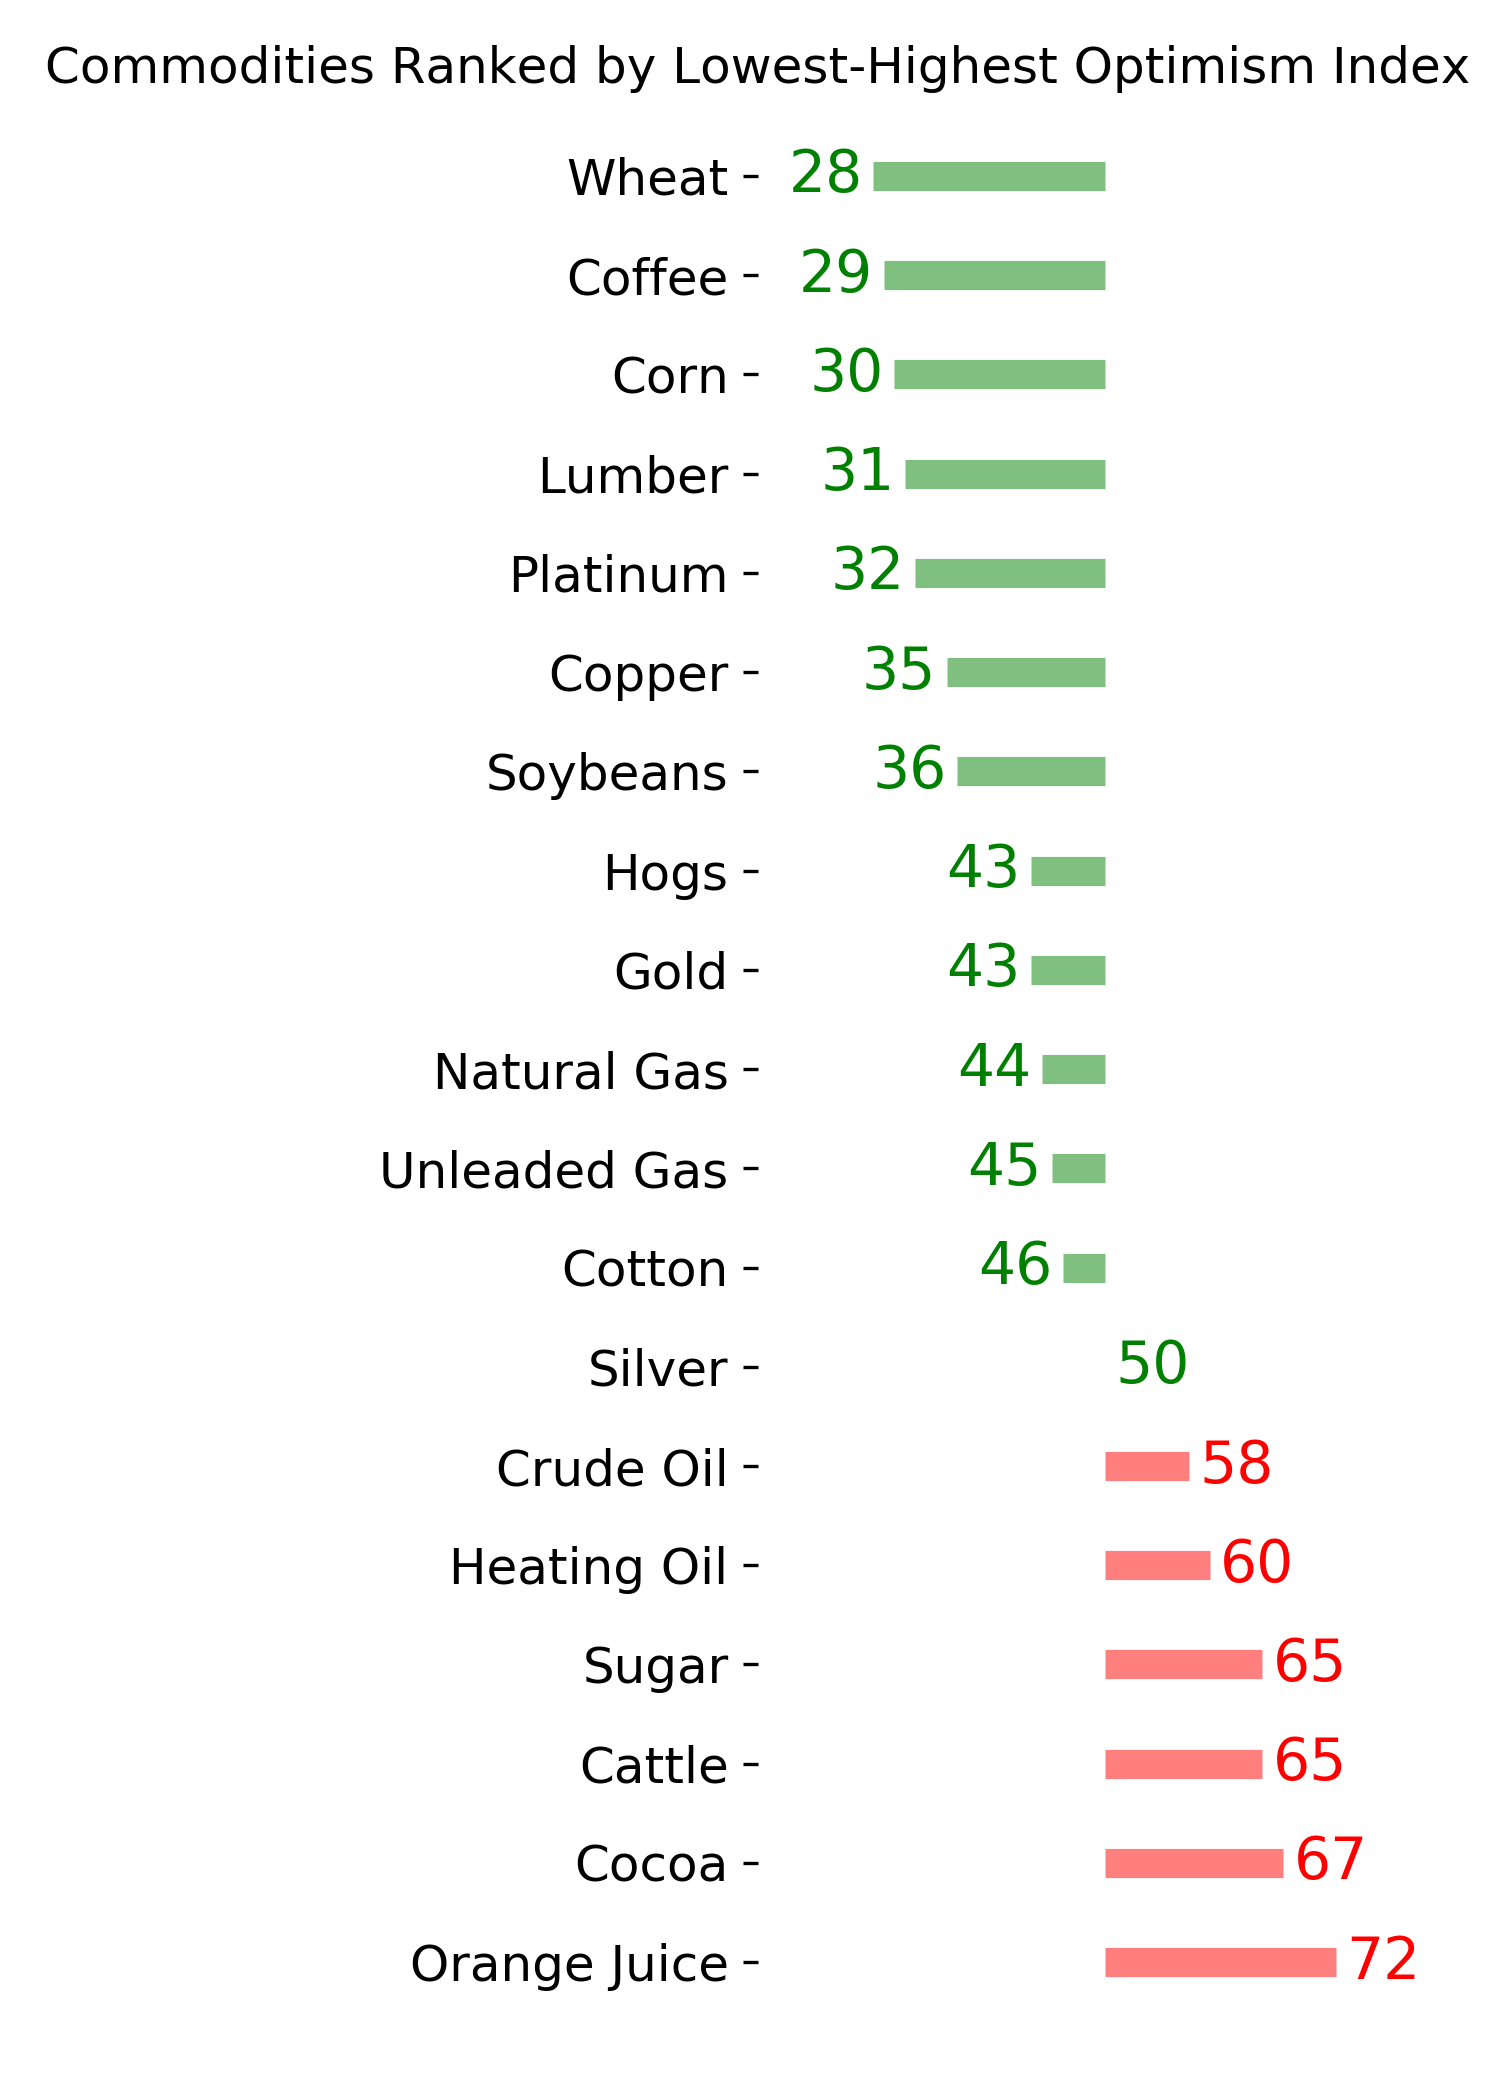
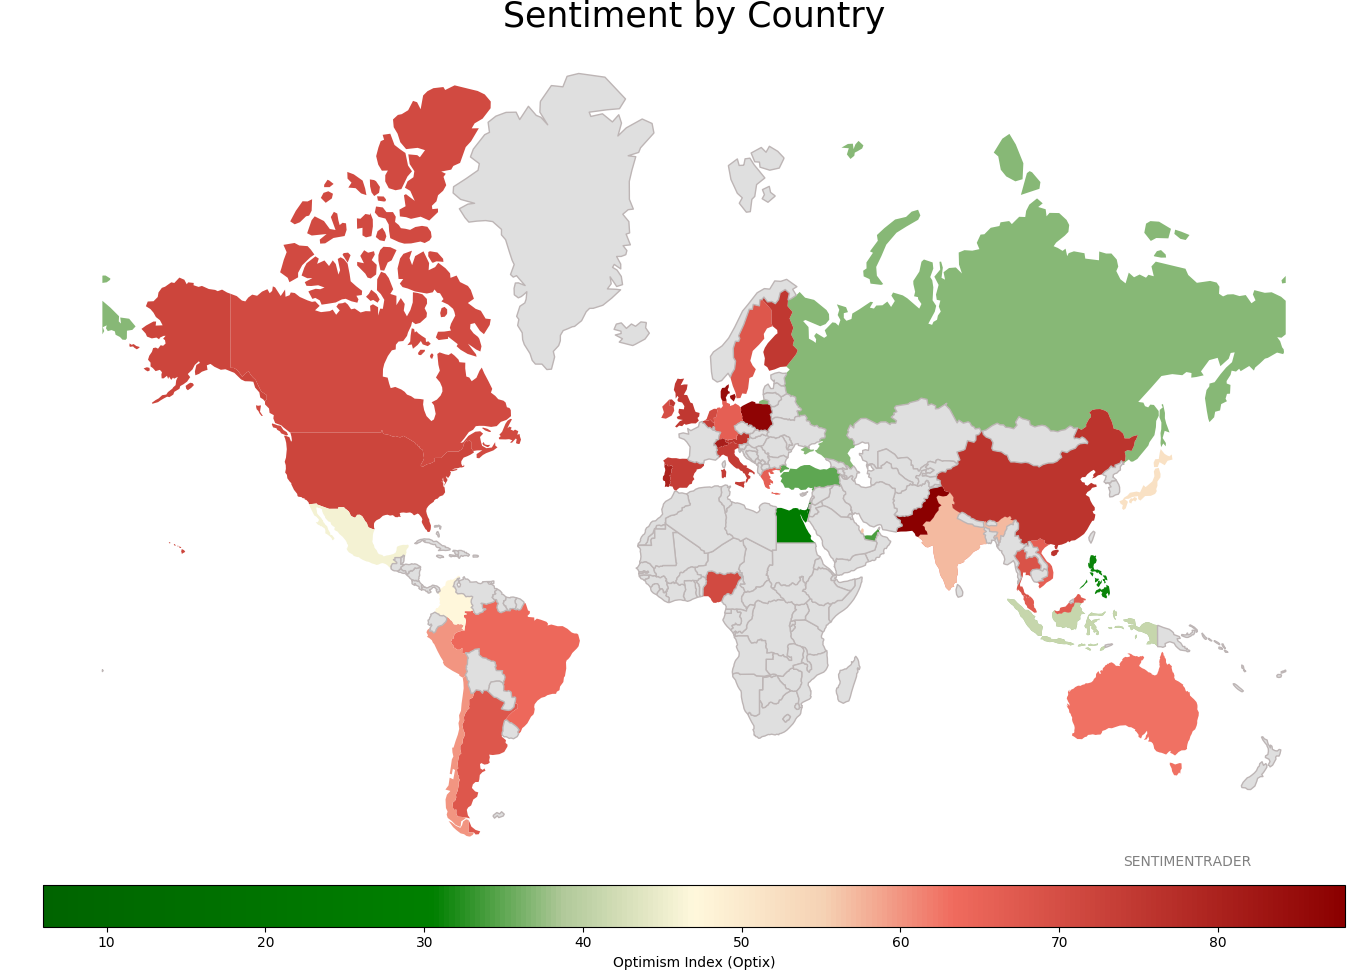
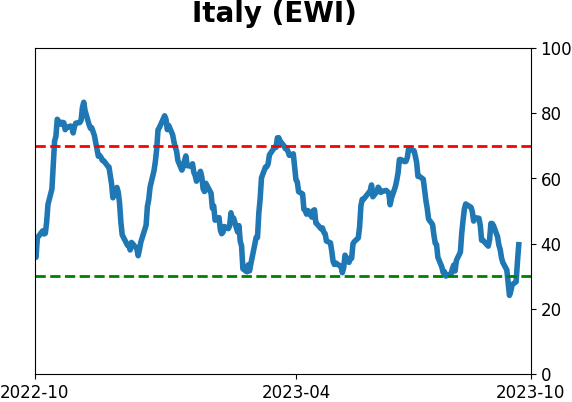
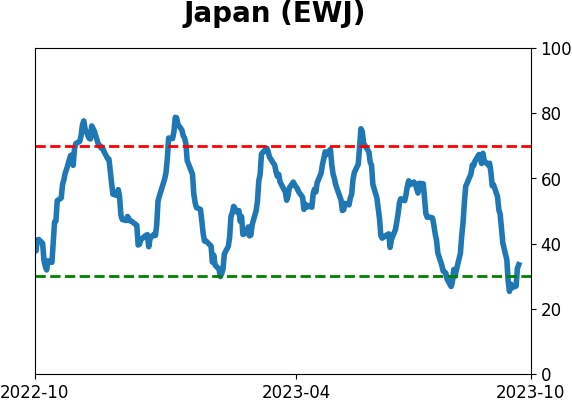
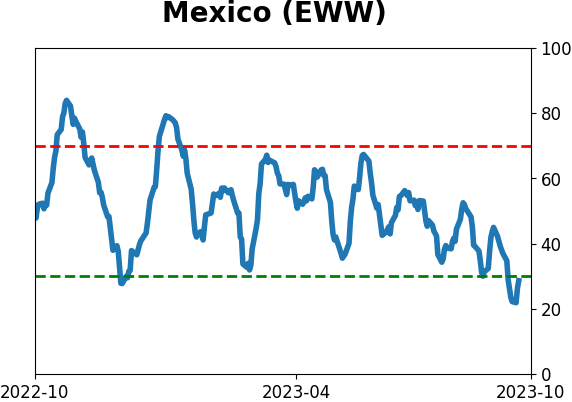
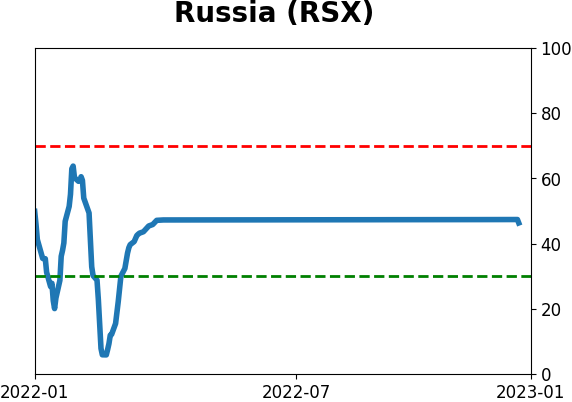
Sentiment Around The World
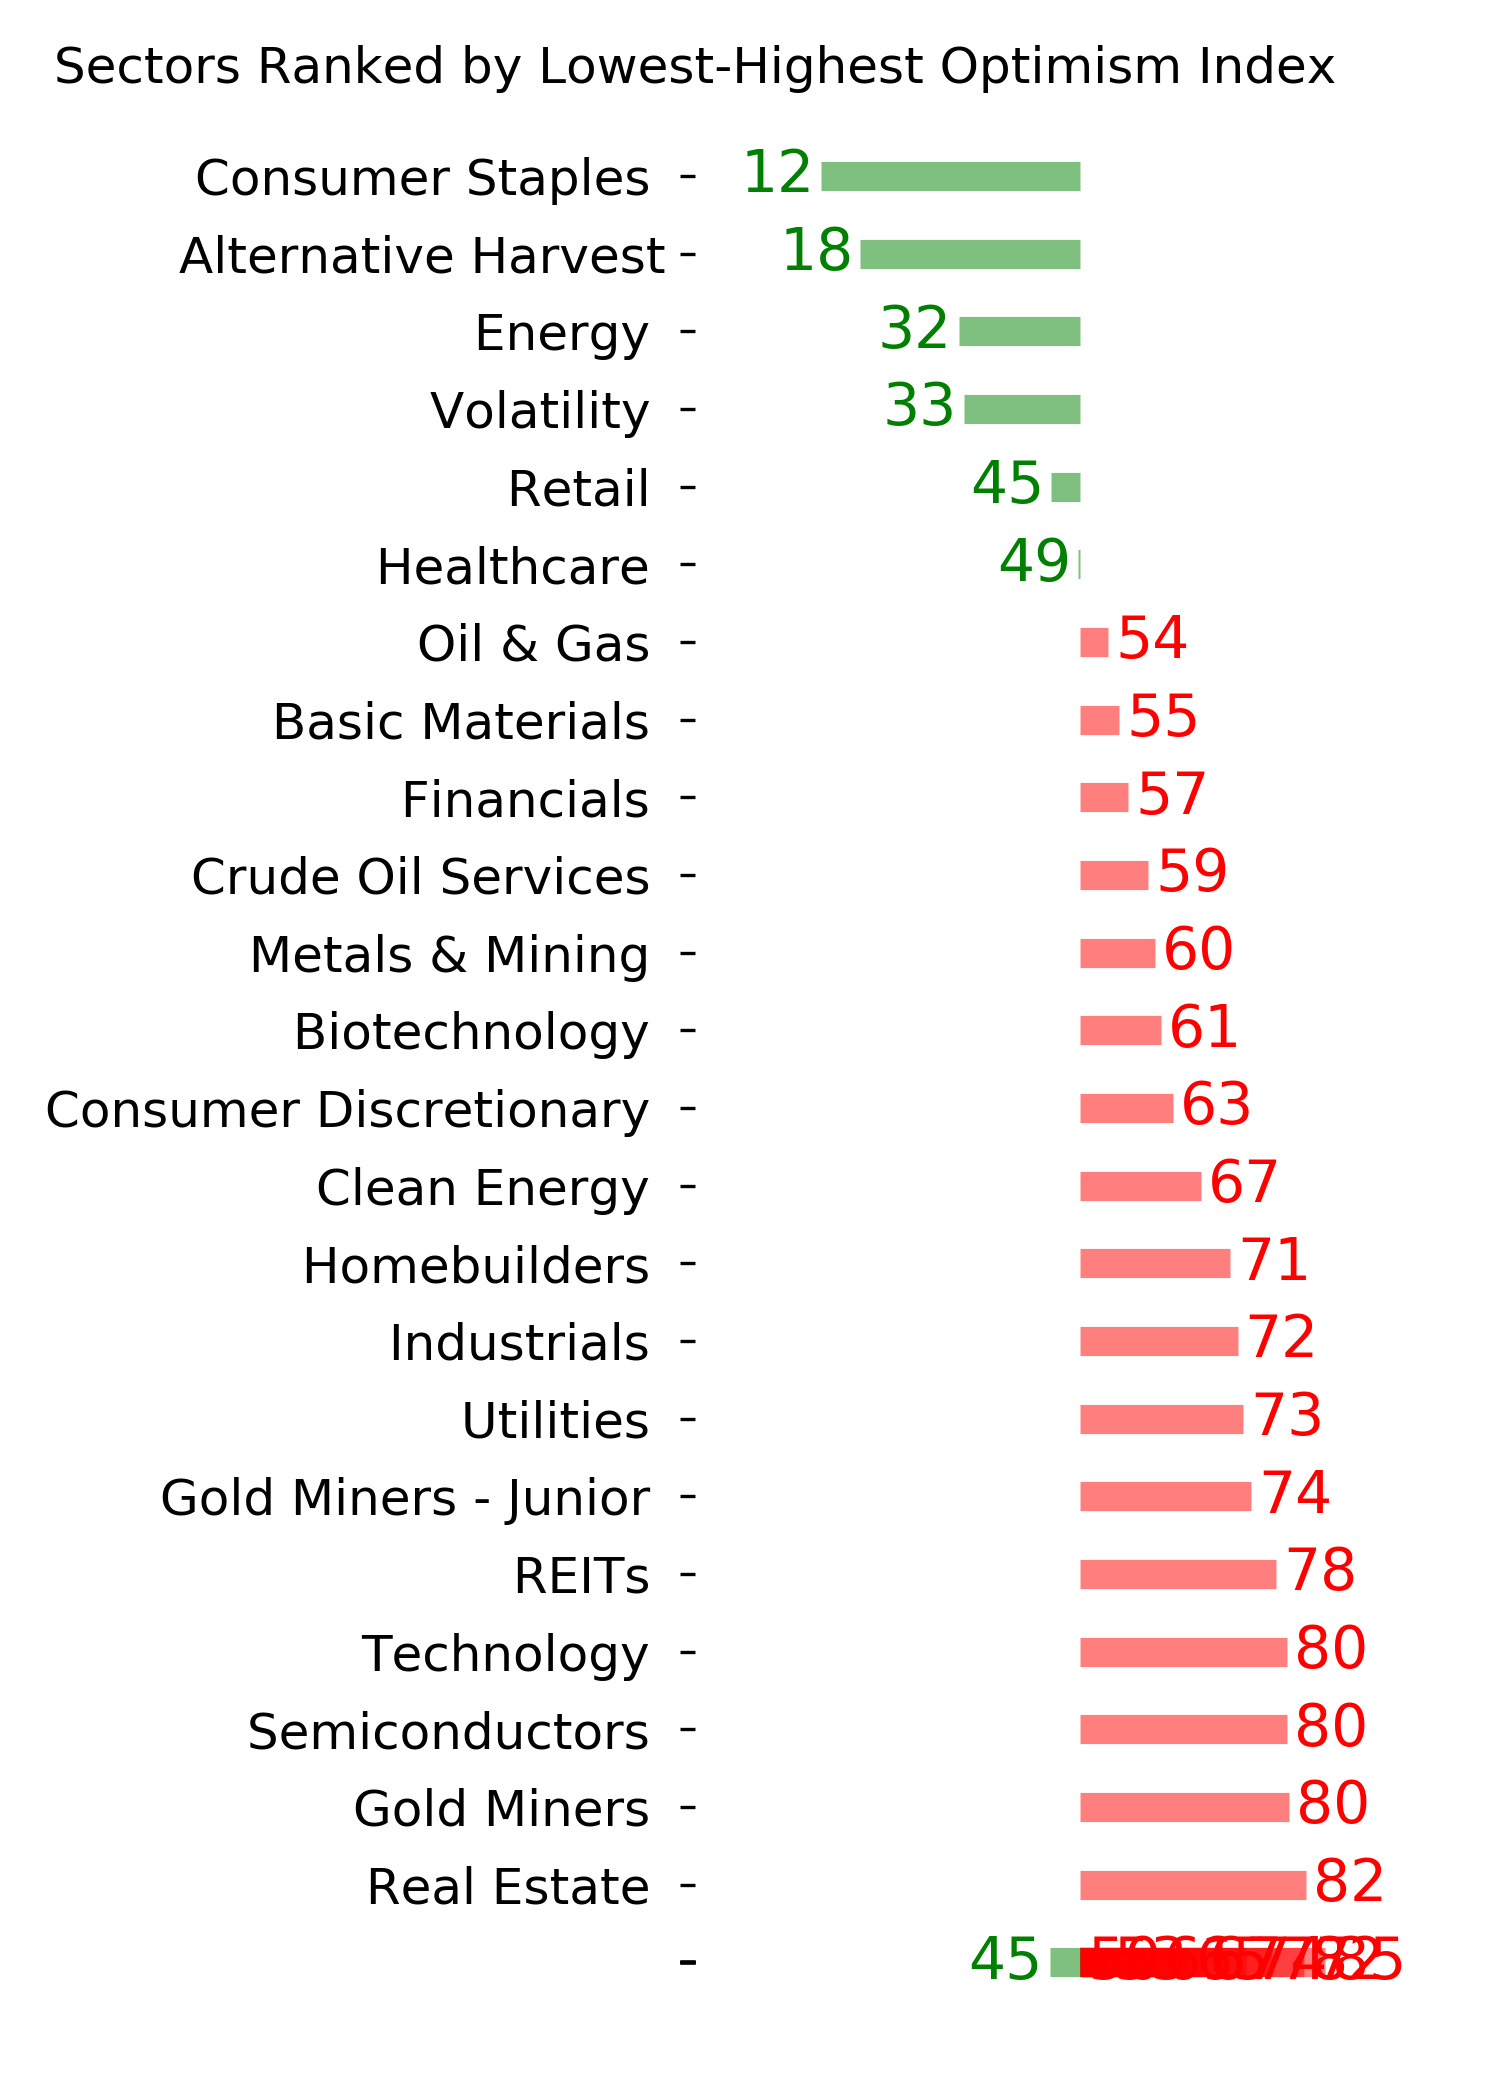
Optimism Index Thumbnails
|
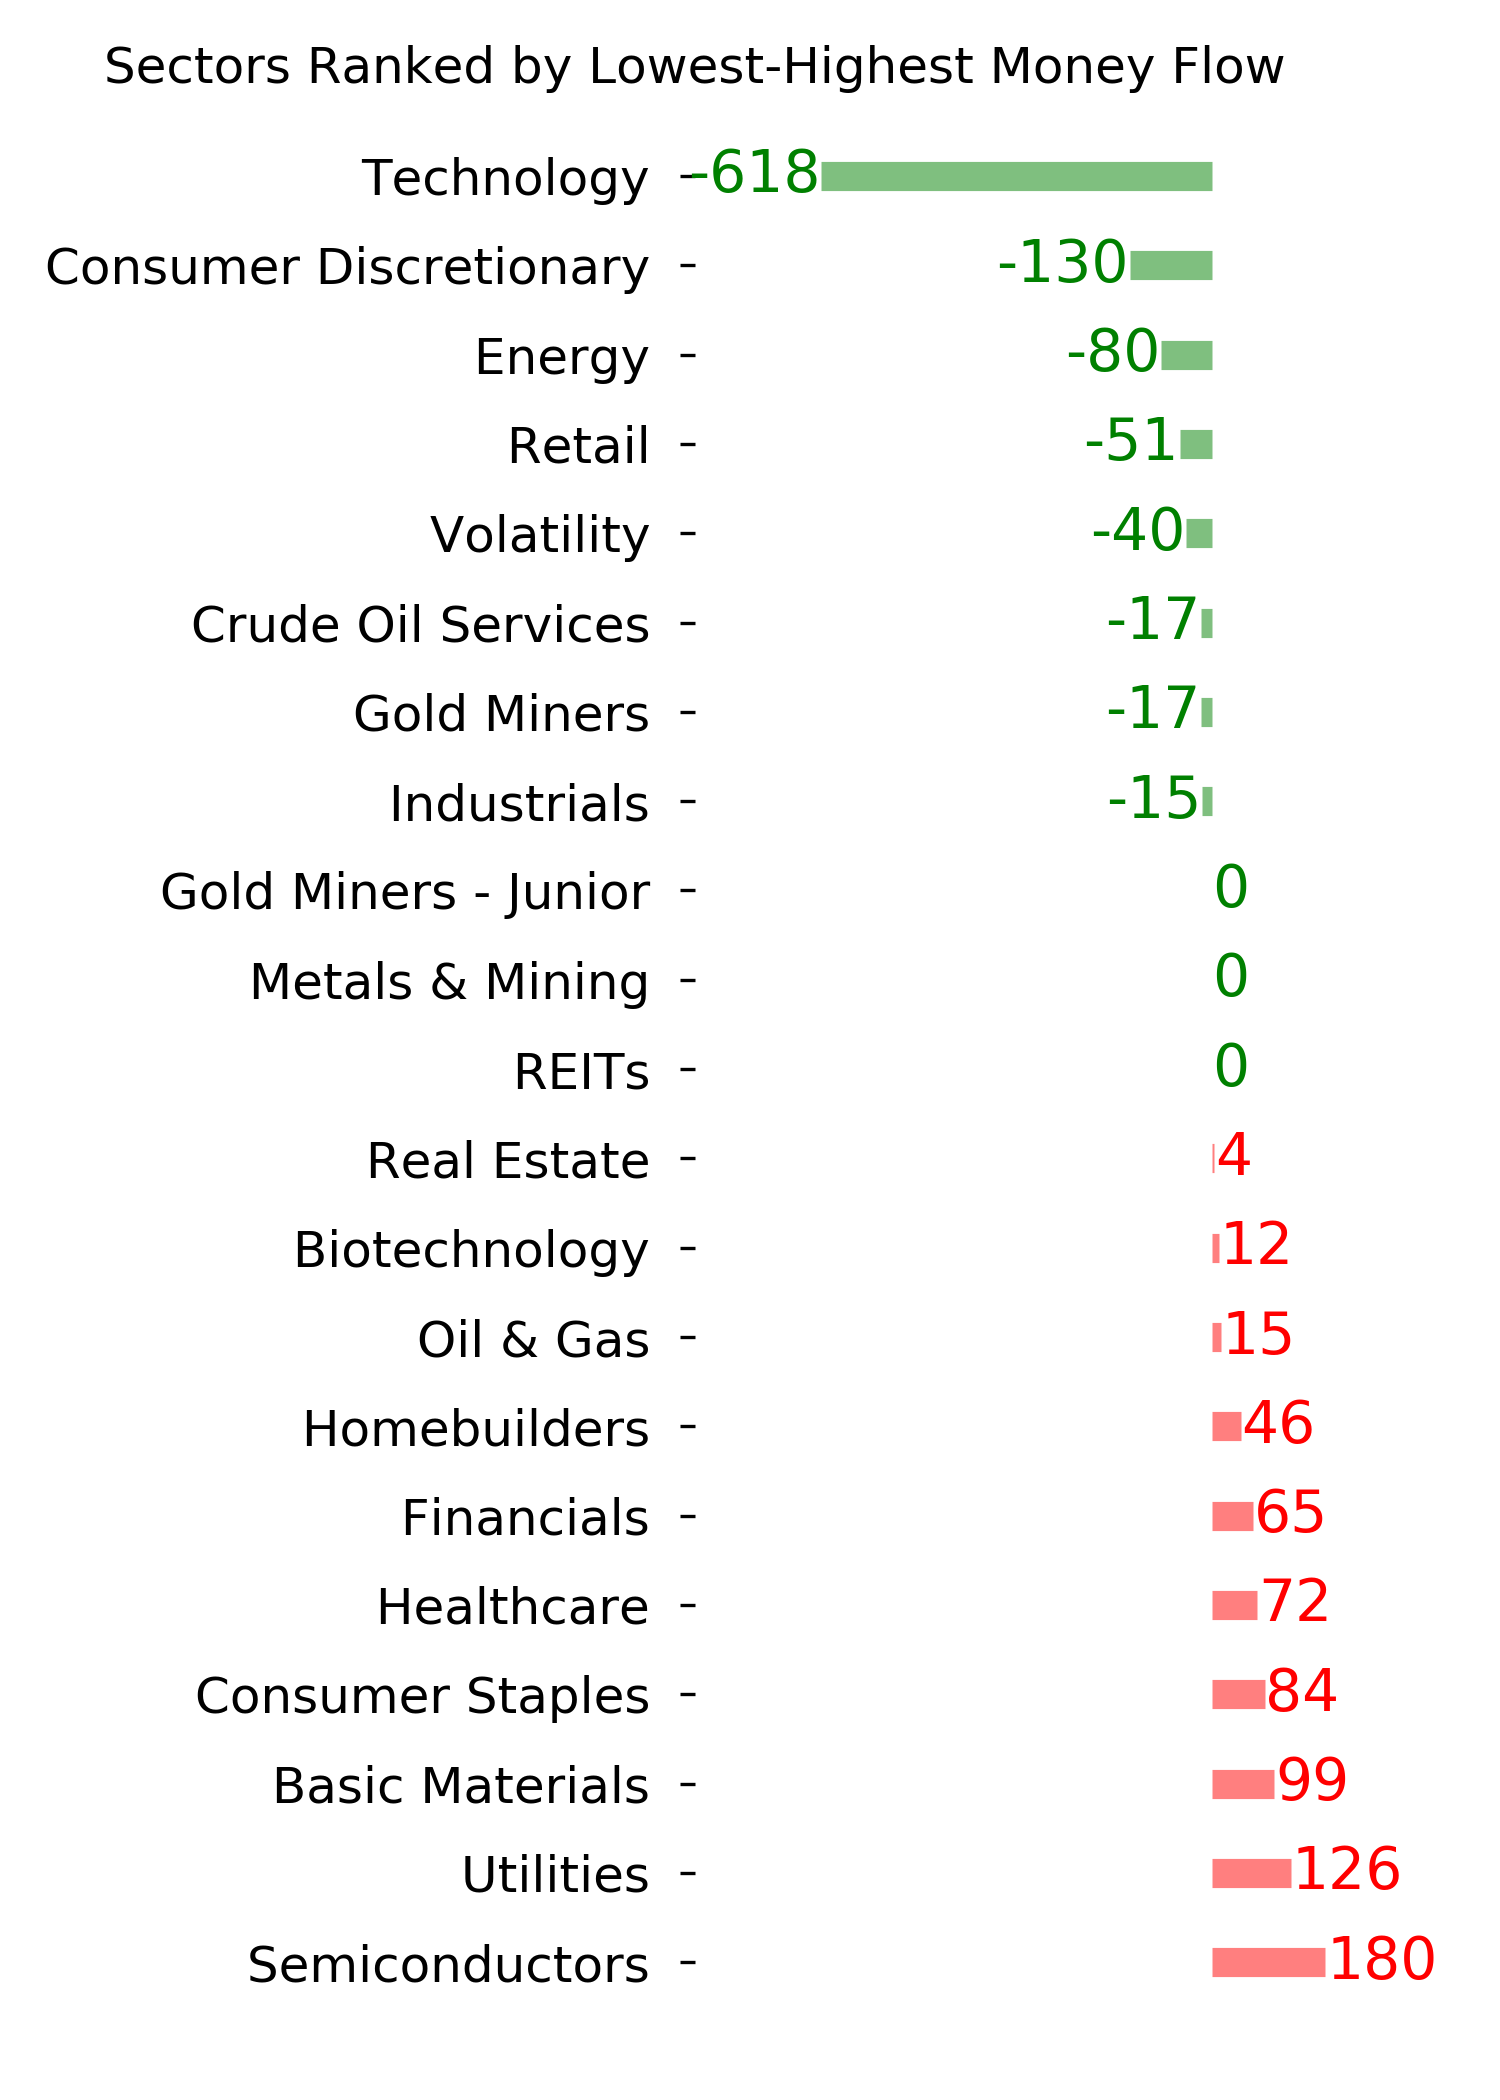
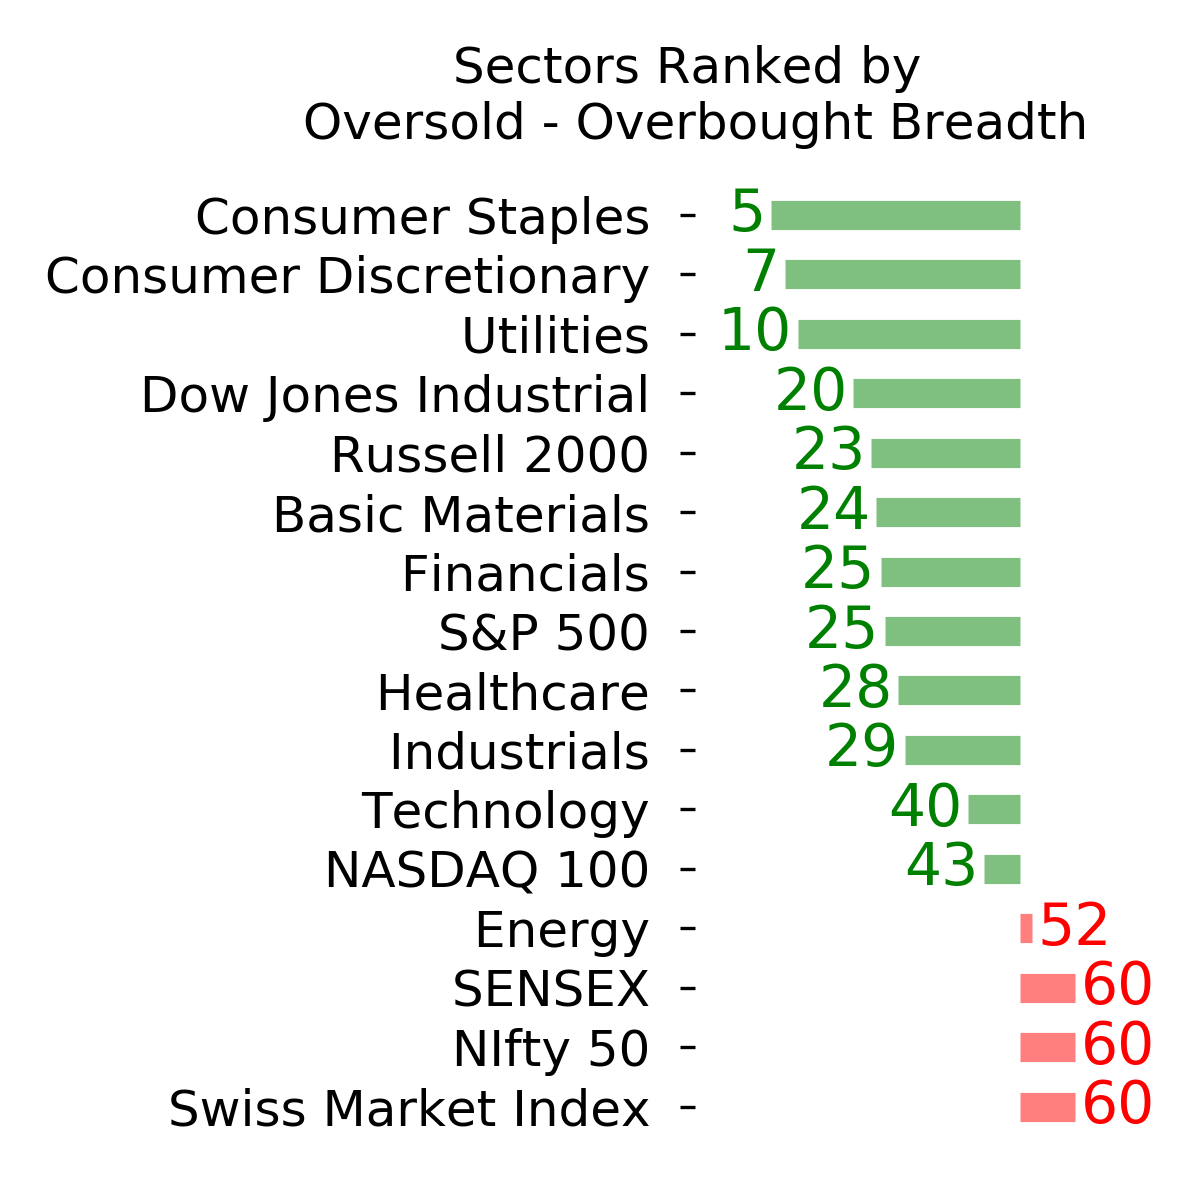
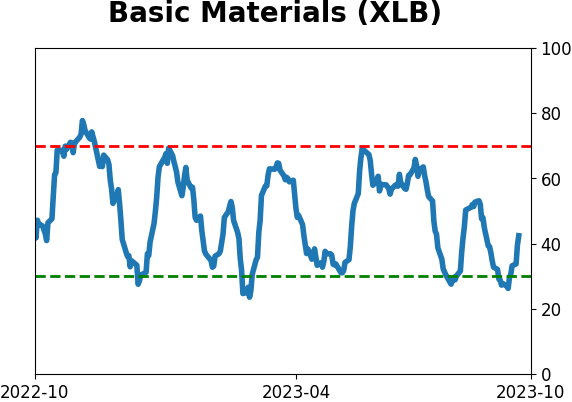
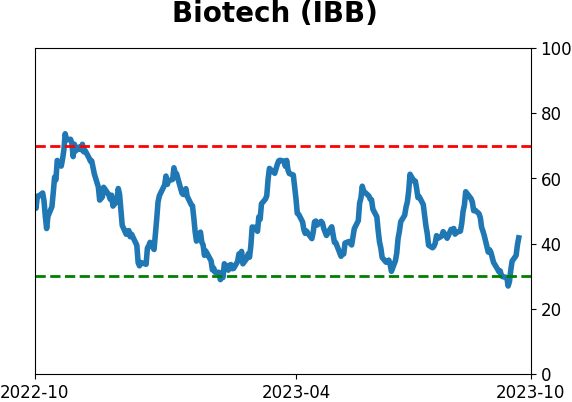
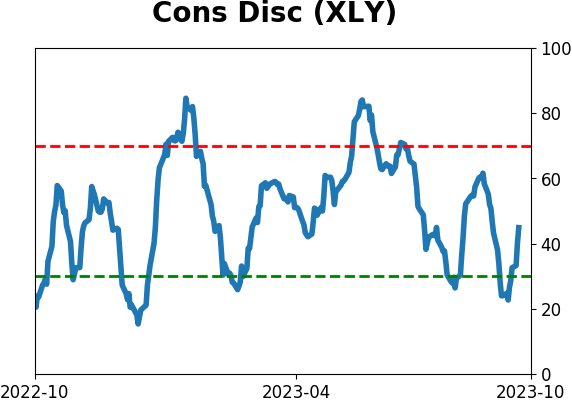
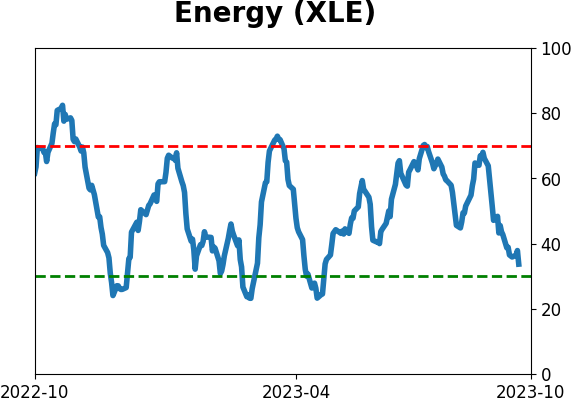
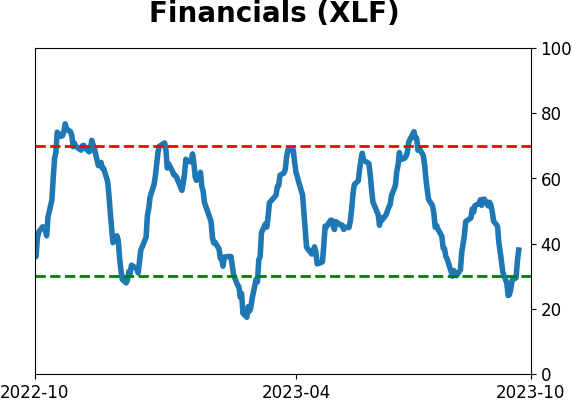
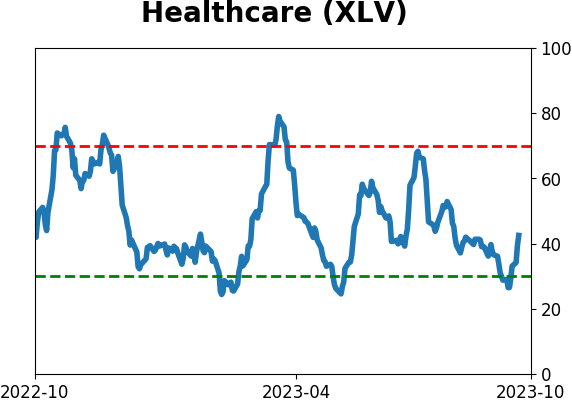
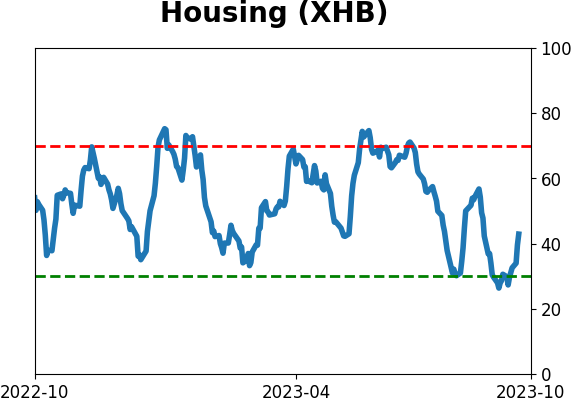
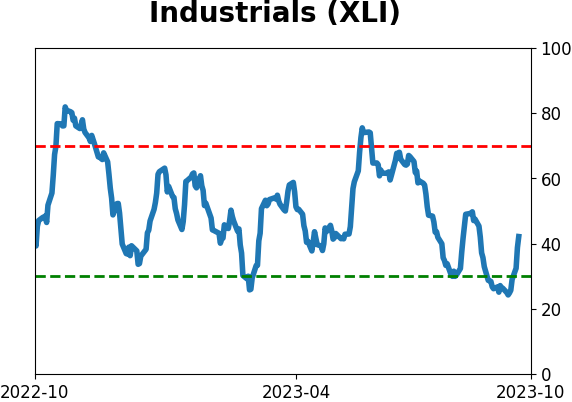
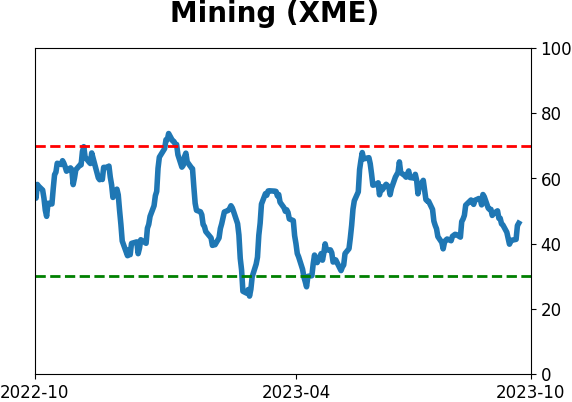
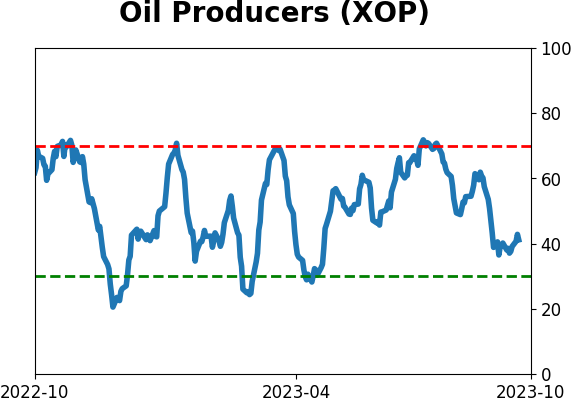
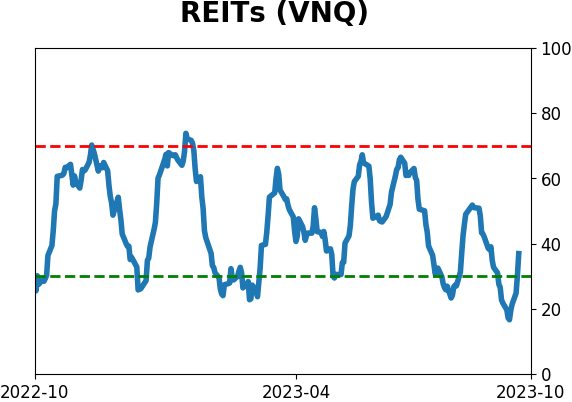
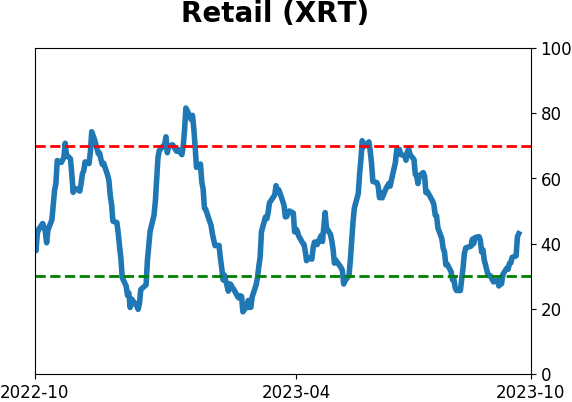
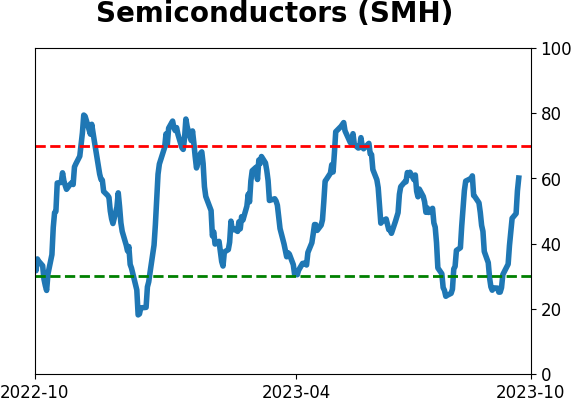
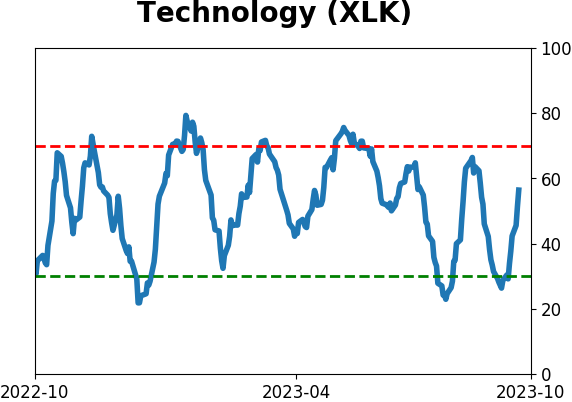
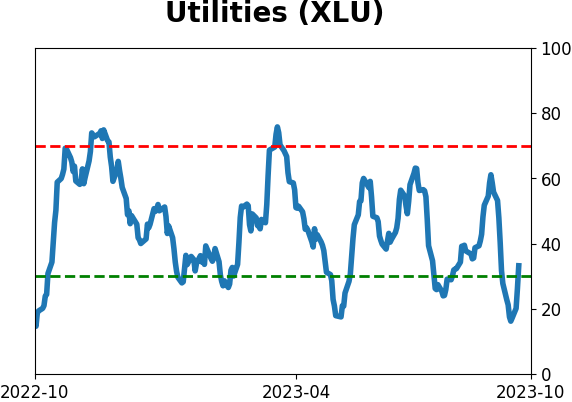
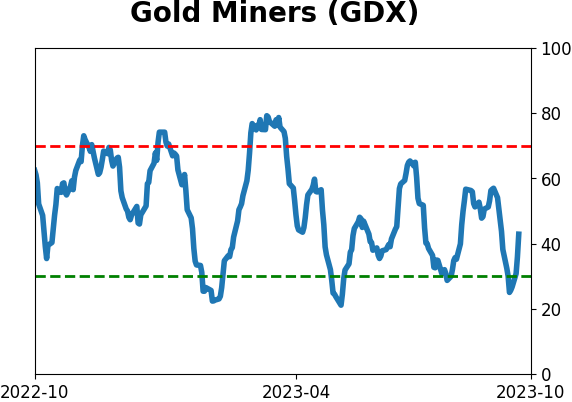
Sector ETF's - 10-Day Moving Average
|
|
|
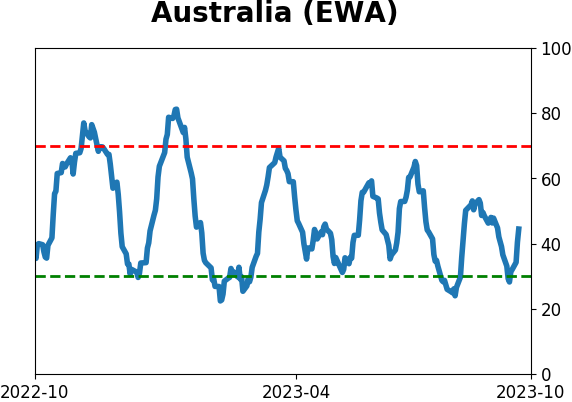
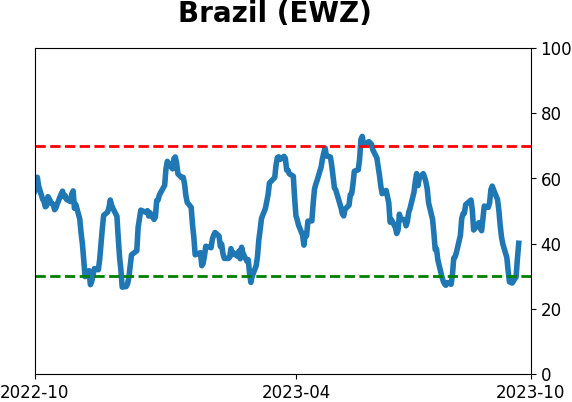
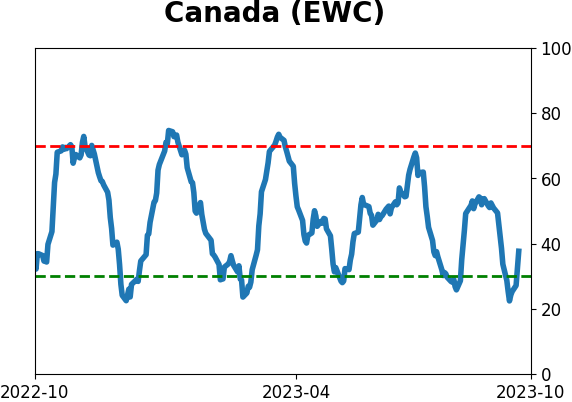
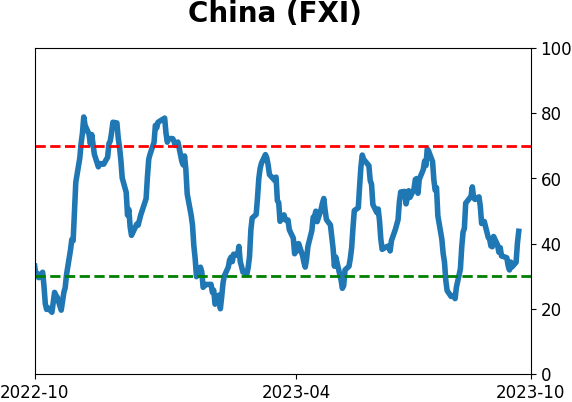
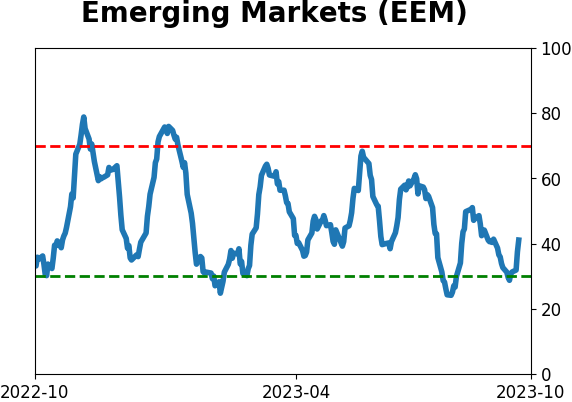
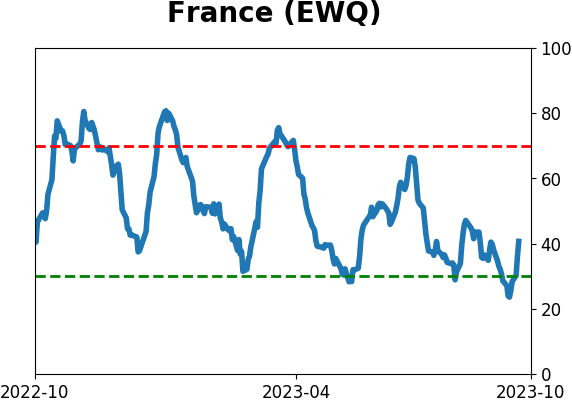
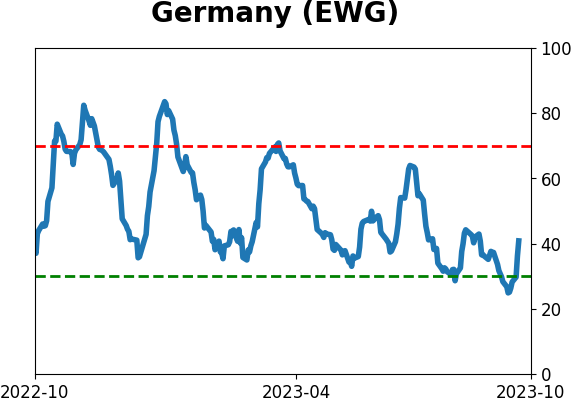
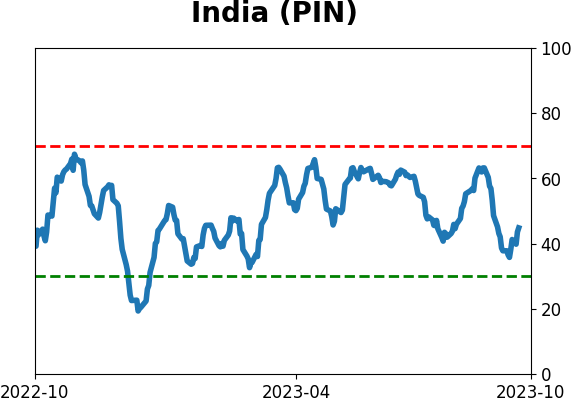
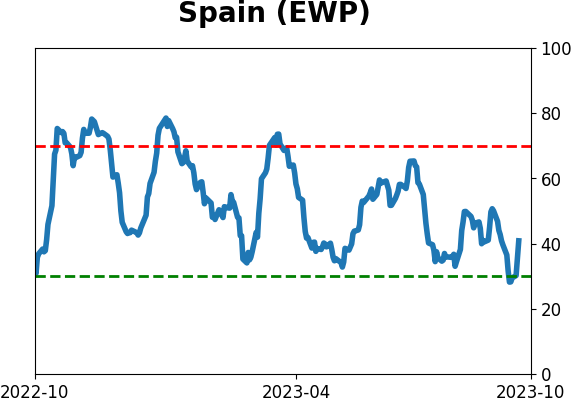
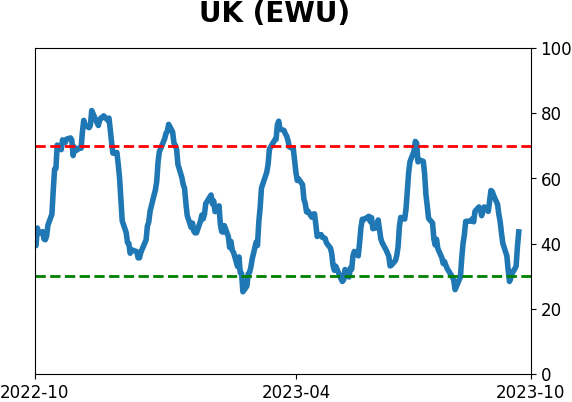
Country ETF's - 10-Day Moving Average
|
|
|
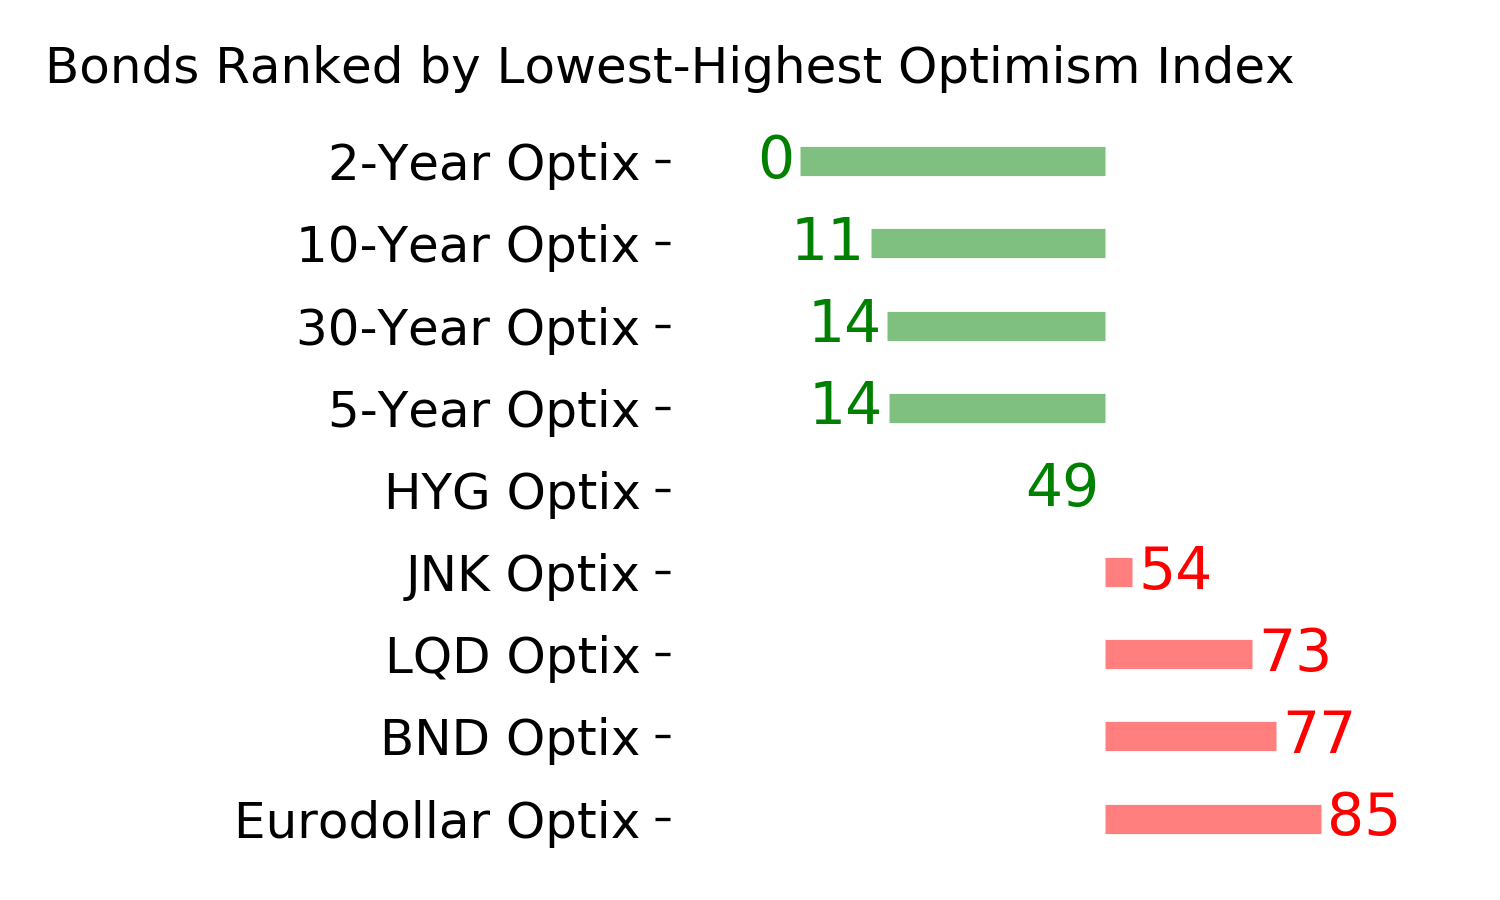
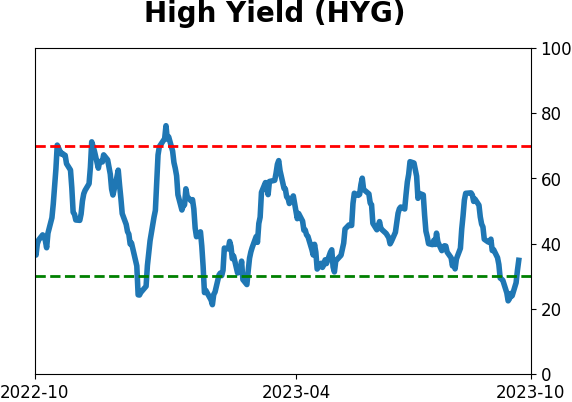
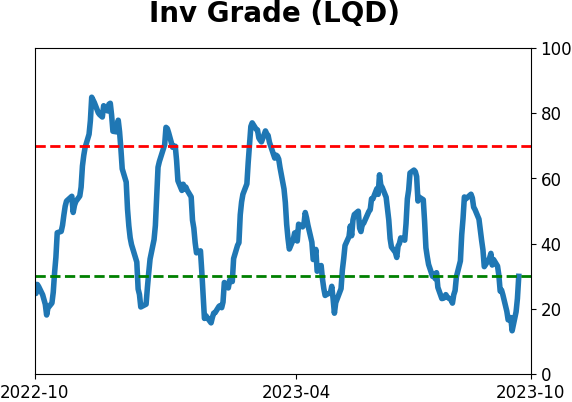
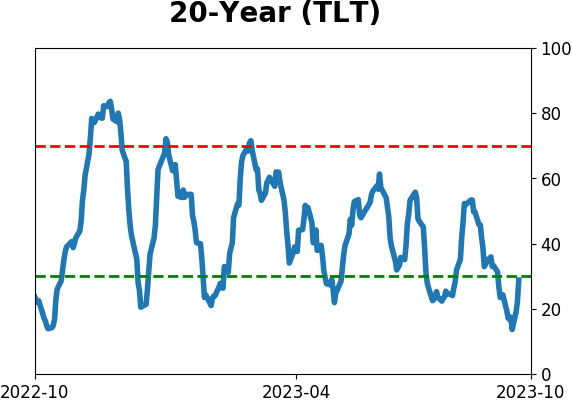
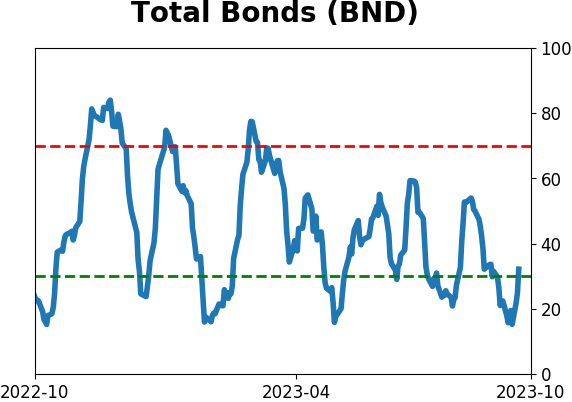
Bond ETF's - 10-Day Moving Average
|
|
|
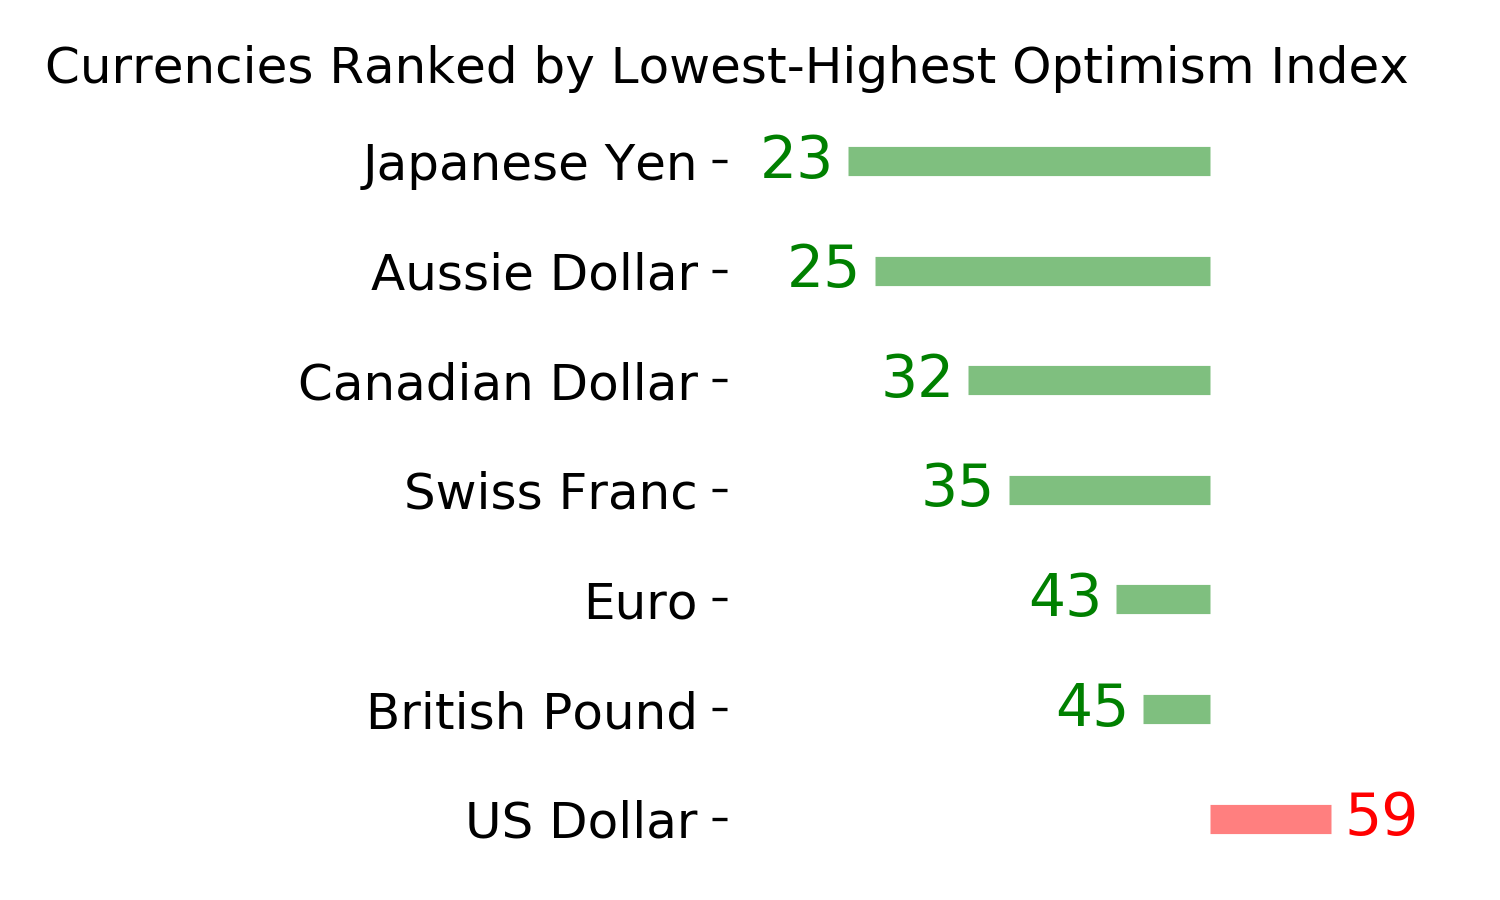
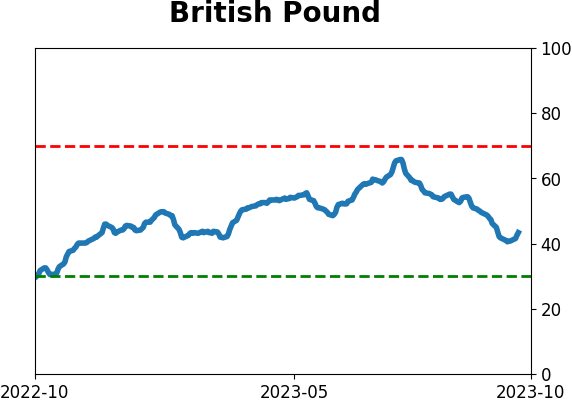
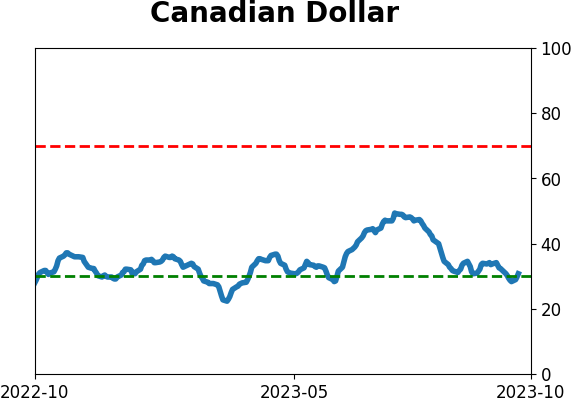
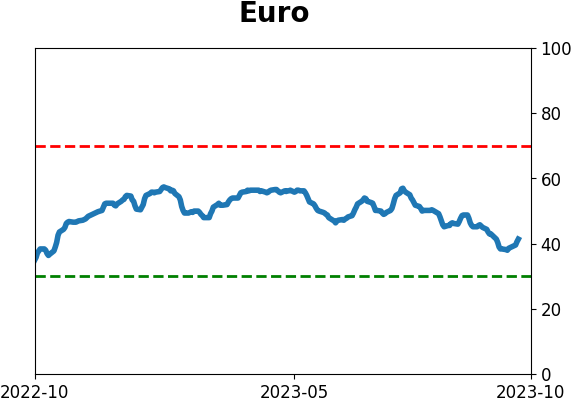
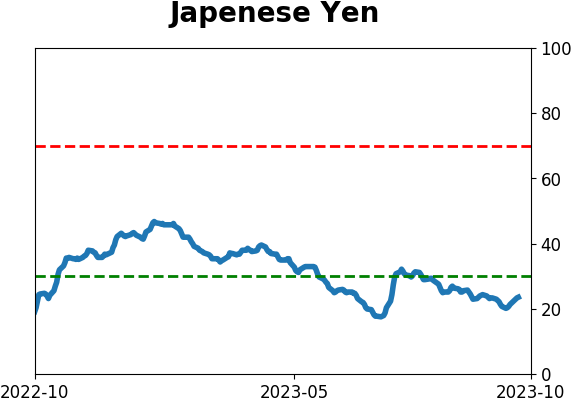
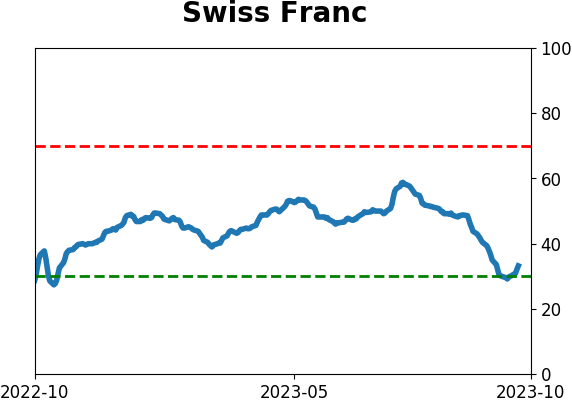
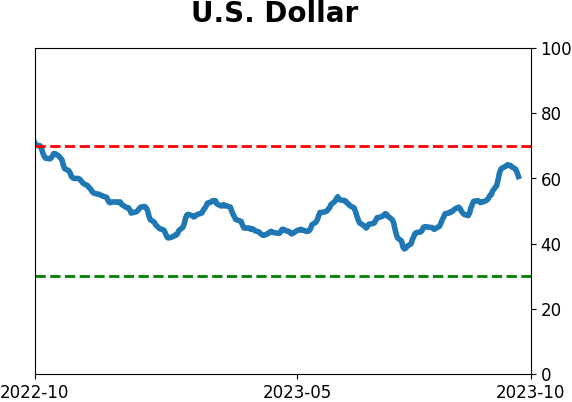
Currency ETF's - 5-Day Moving Average
|
|
|
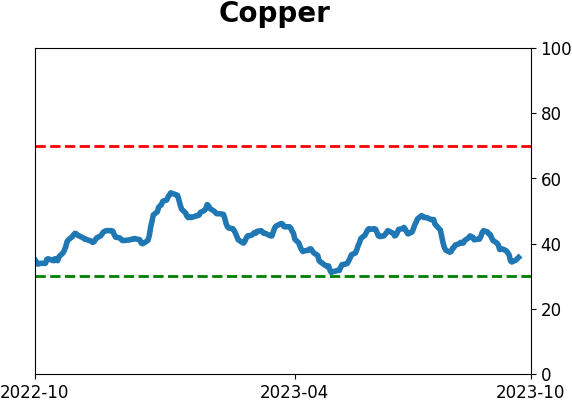
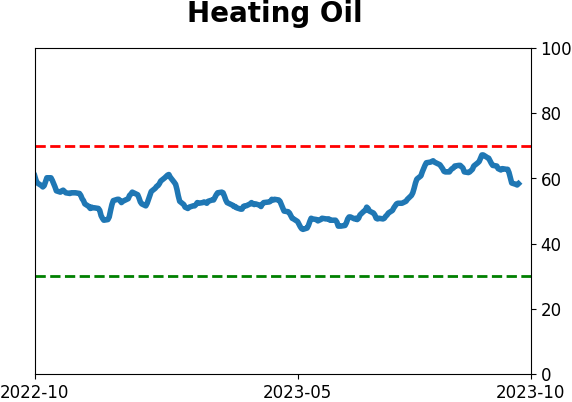
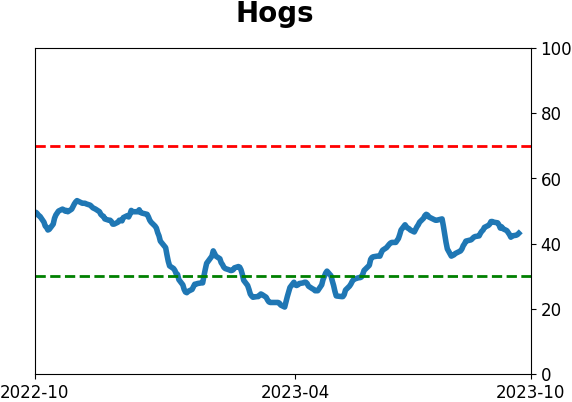
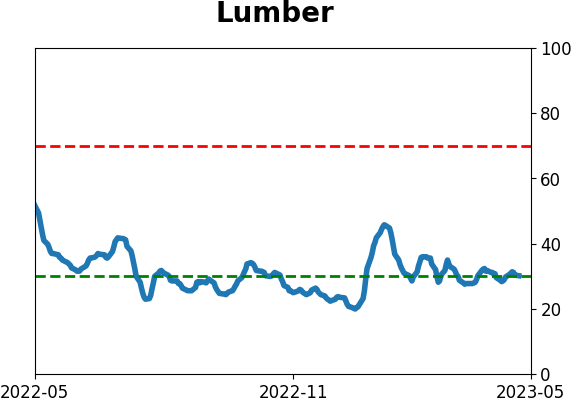
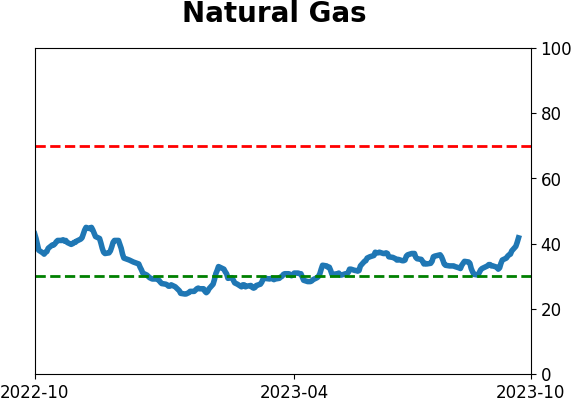
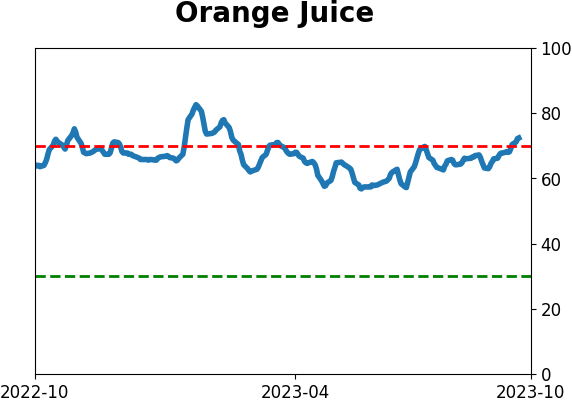
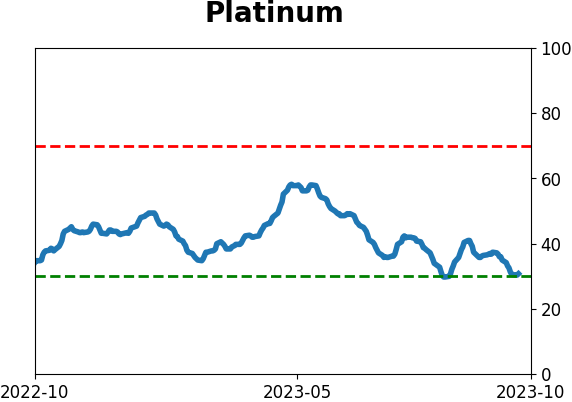
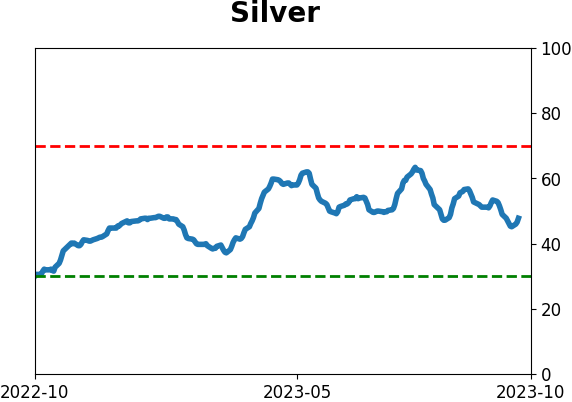
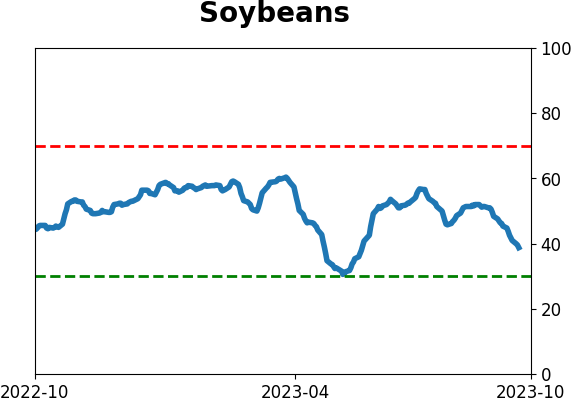
Commodity ETF's - 5-Day Moving Average
|
|