Headlines
|
|
The number of 1% swings continues to grow:
The S&P 500 has been swinging wildly lately, with 1% moves common. Over 7 time frames, the number of 1% swings in the index has exceeded anything in the past decade and is nearing the most volatile times in history. After similar periods, stocks dropped over the next couple of months but rallied long-term.
|
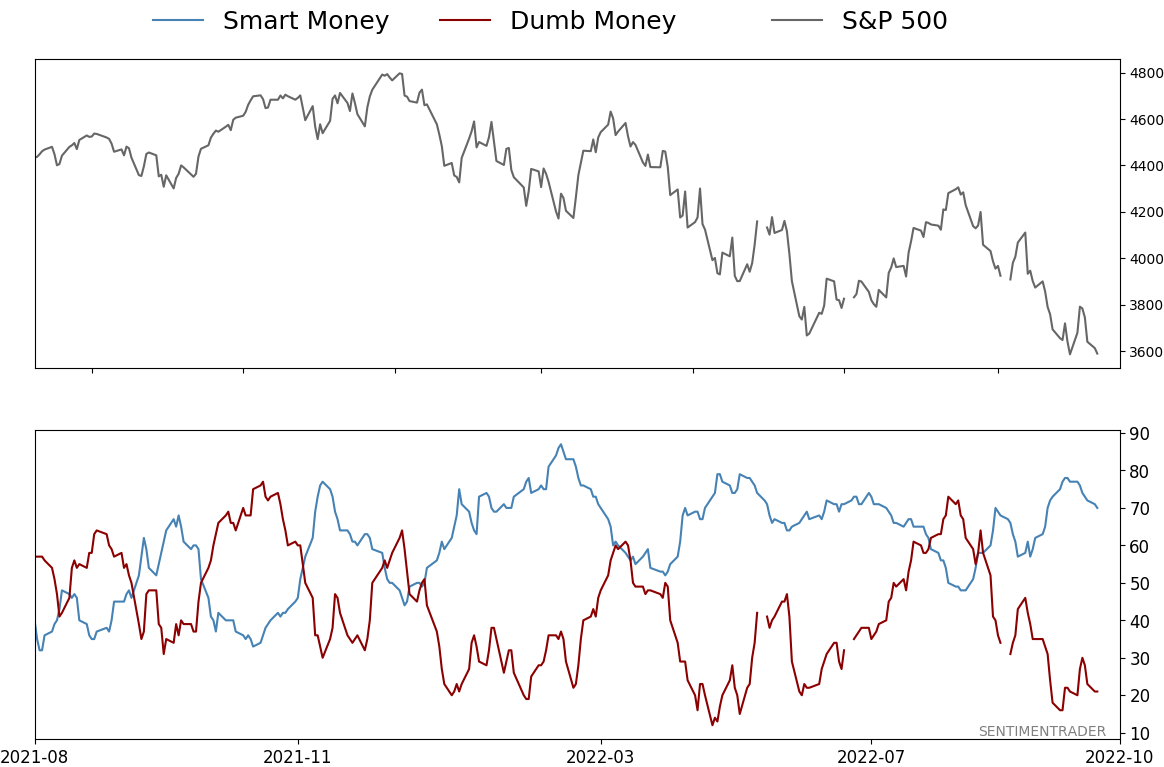
Smart / Dumb Money Confidence
|
Smart Money Confidence: 70%
Dumb Money Confidence: 21%
|
|
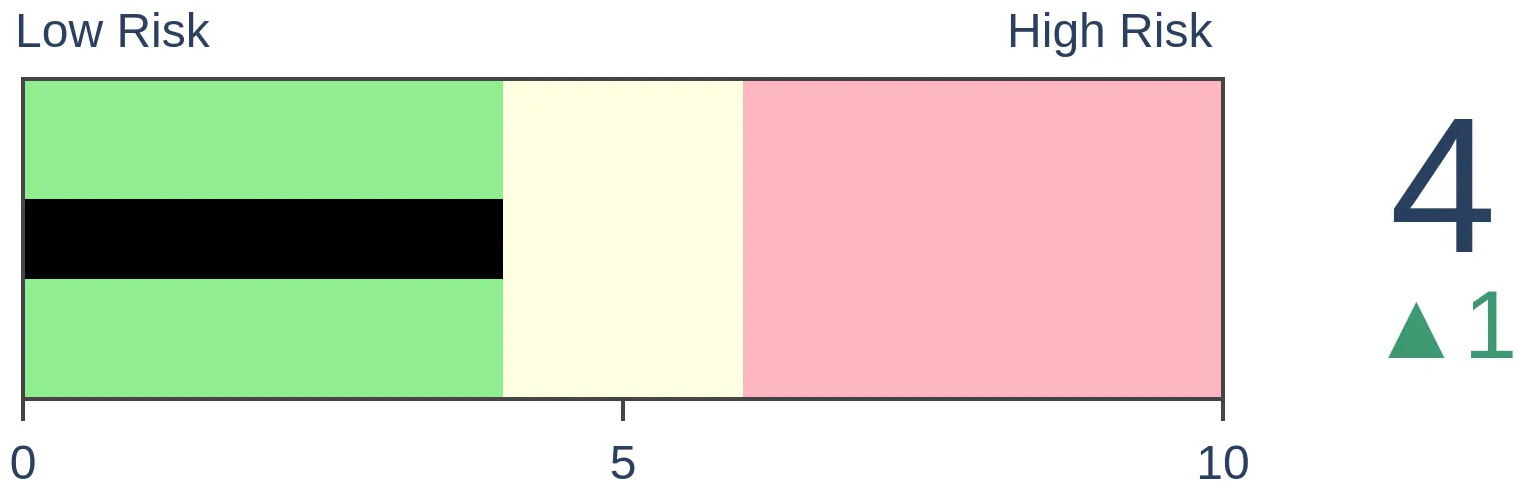
Risk Levels
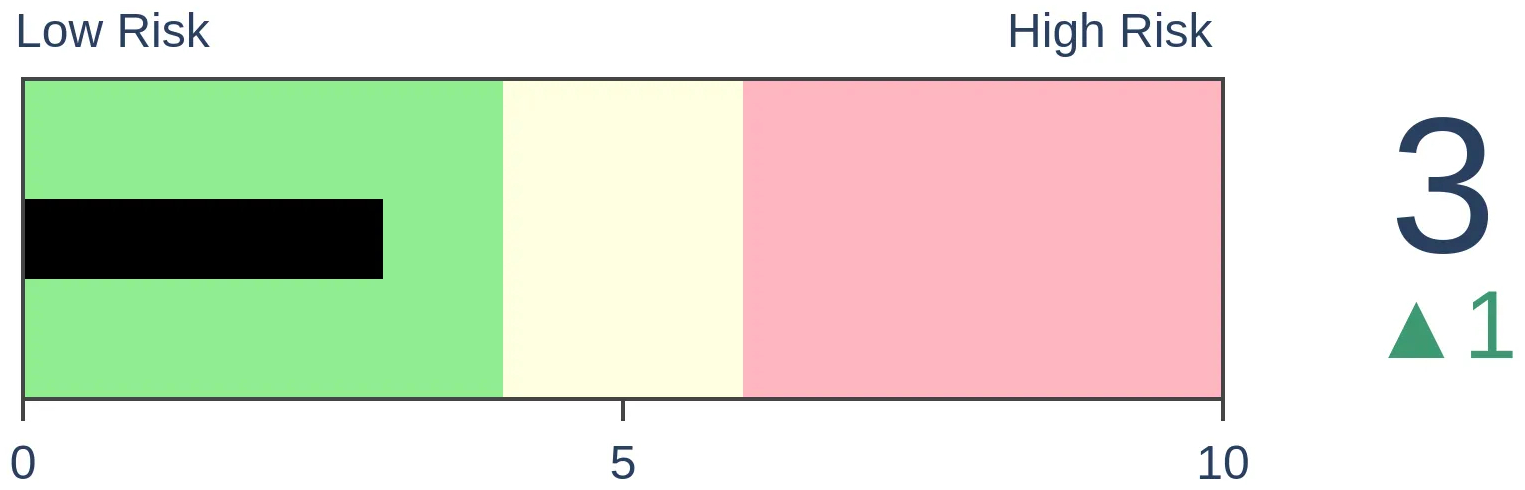
Stocks Short-Term
|
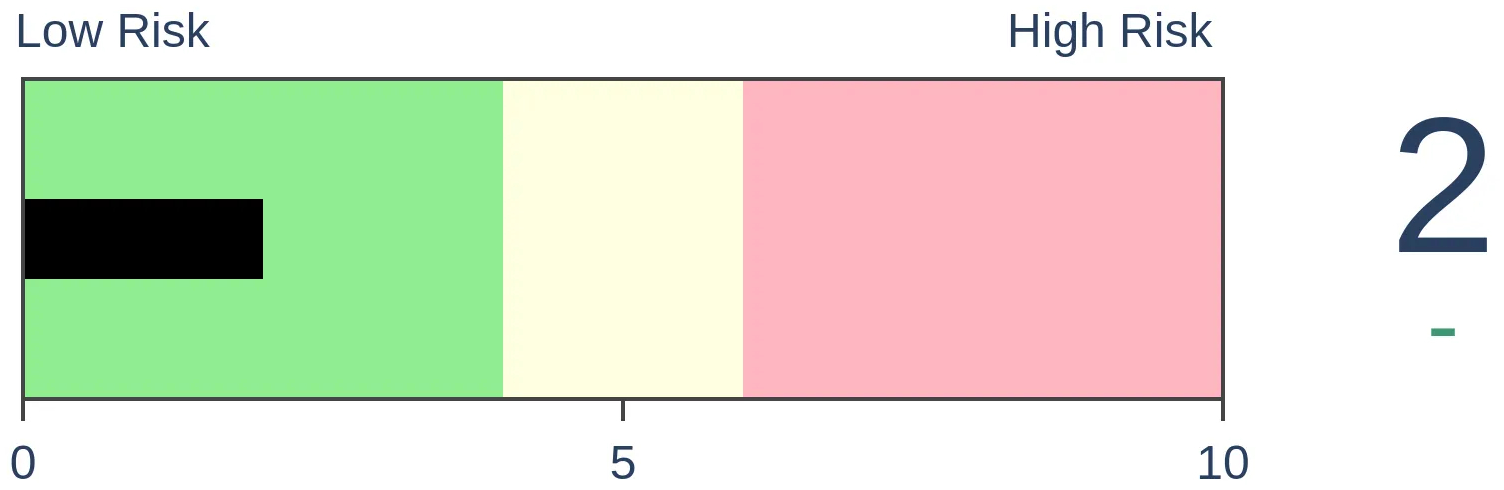
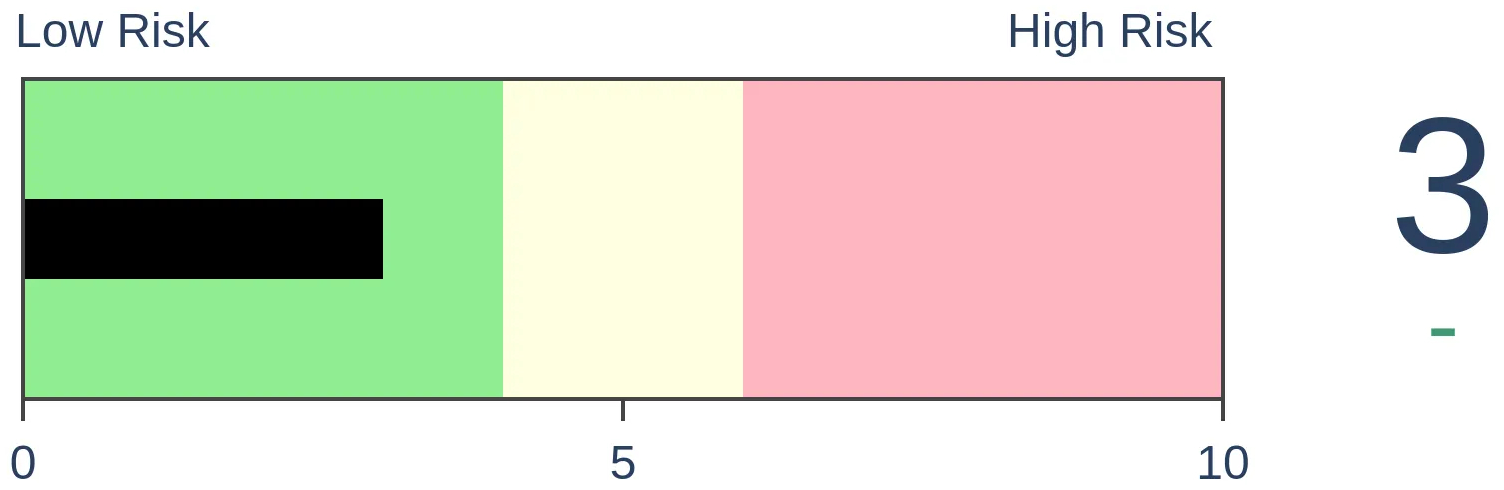
Stocks Medium-Term
|
|
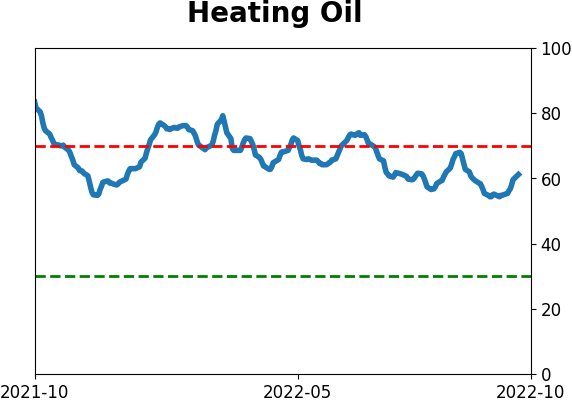
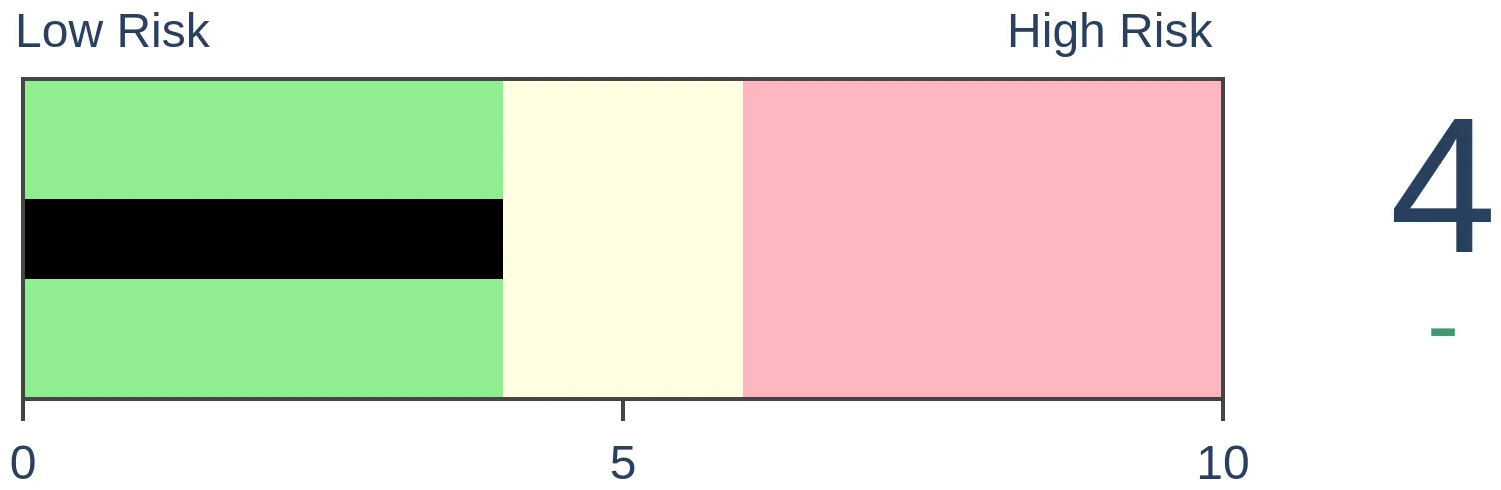
Bonds
|
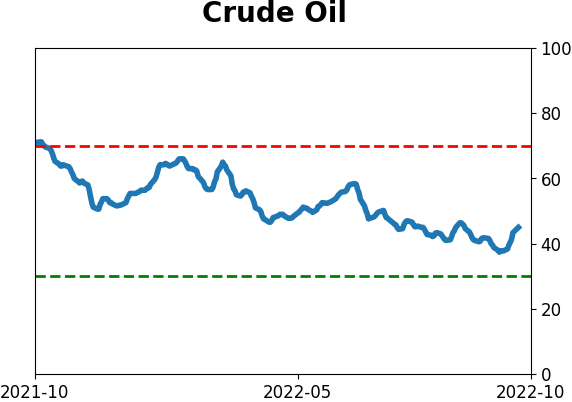
Crude Oil

|
|
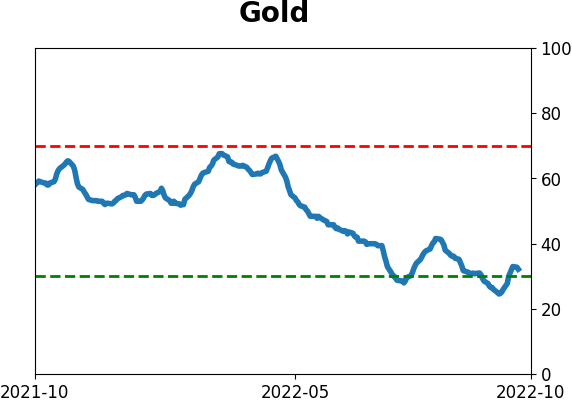
Gold
|
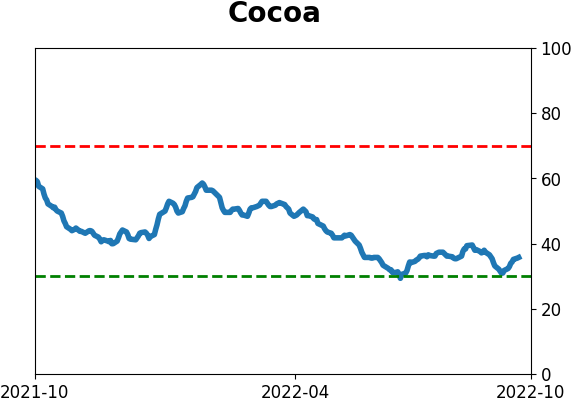
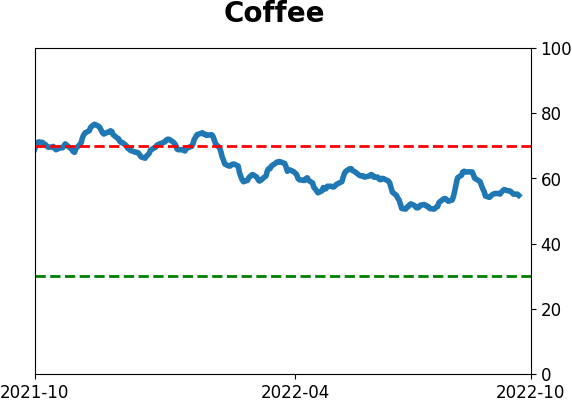
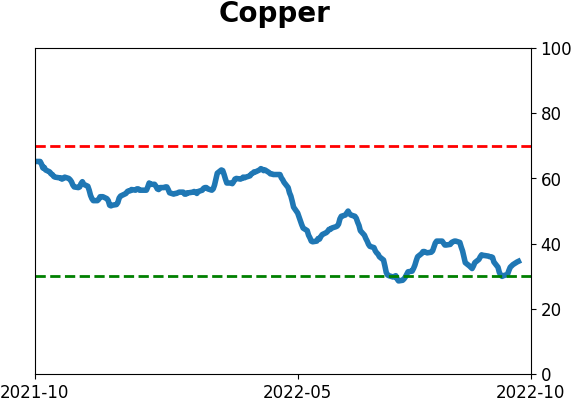
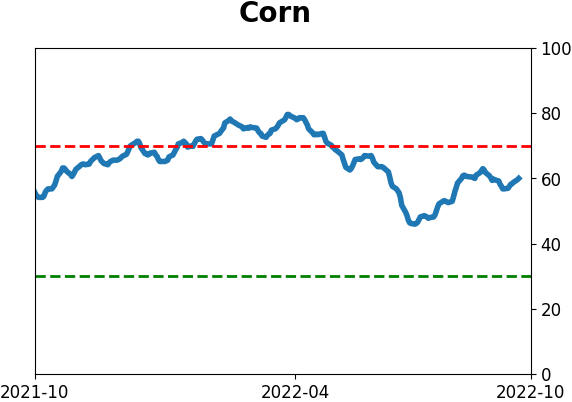
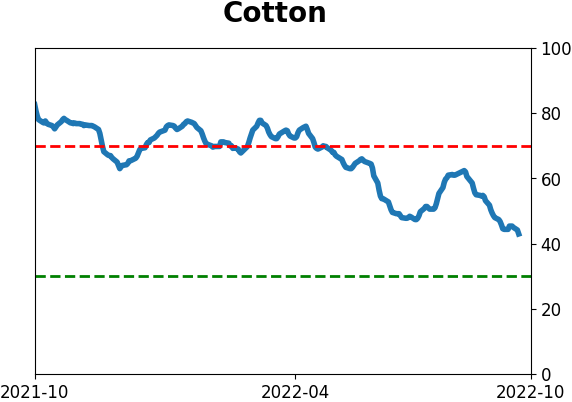
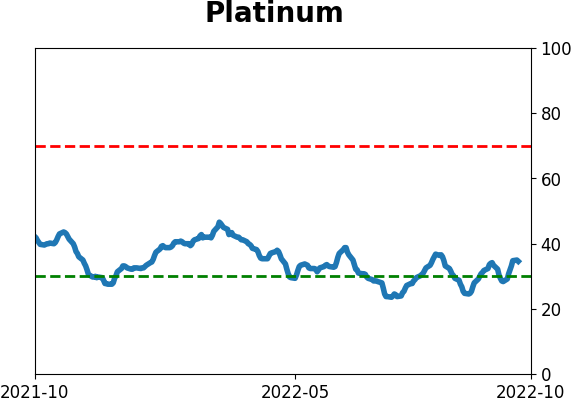
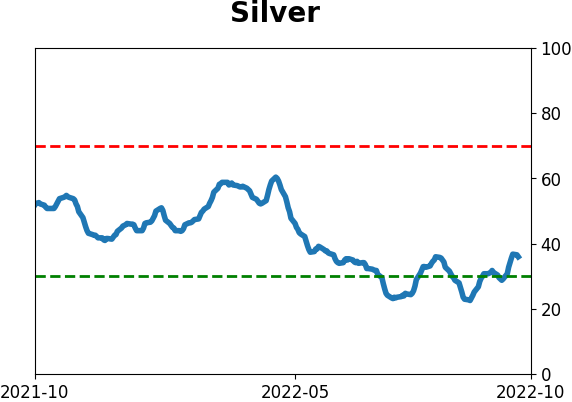
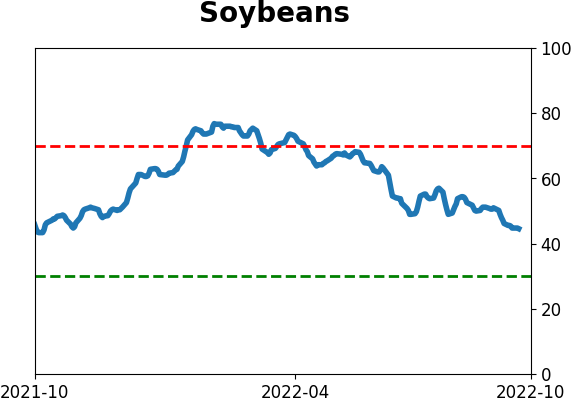
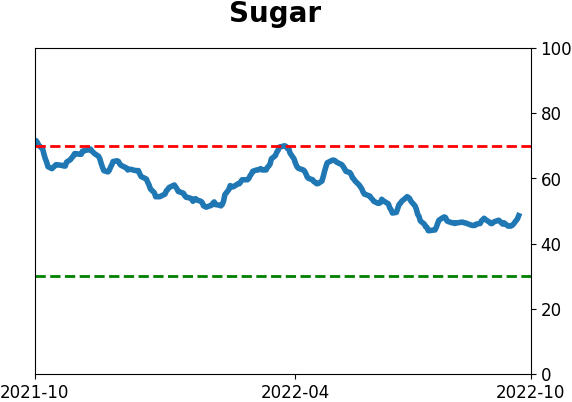
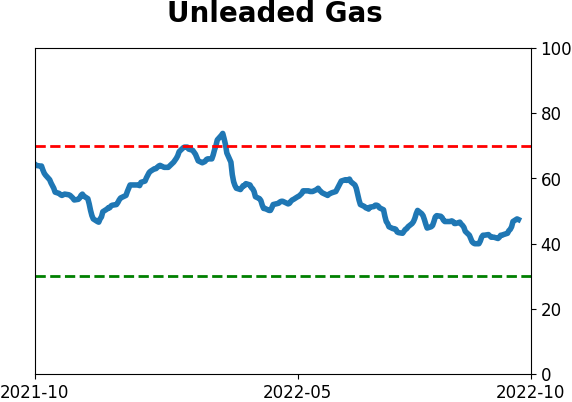
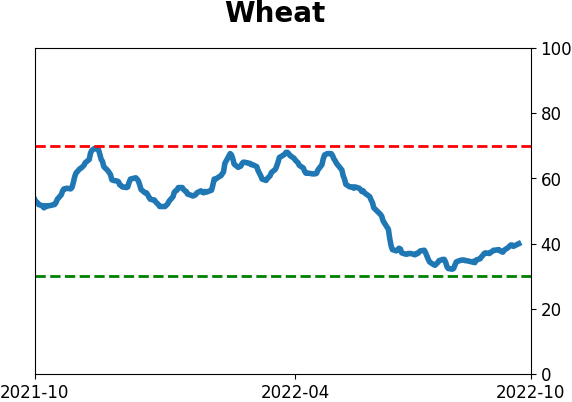
Agriculture
|
|
Research
By Jason Goepfert
BOTTOM LINE
The S&P 500 has been swinging wildly lately, with 1% moves common. Over 7 time frames, the number of 1% swings in the index has exceeded anything in the past decade and is nearing the most volatile times in history. After similar periods, stocks dropped over the next couple of months but rallied long-term.
FORECAST / TIMEFRAME
None
|
Key points:
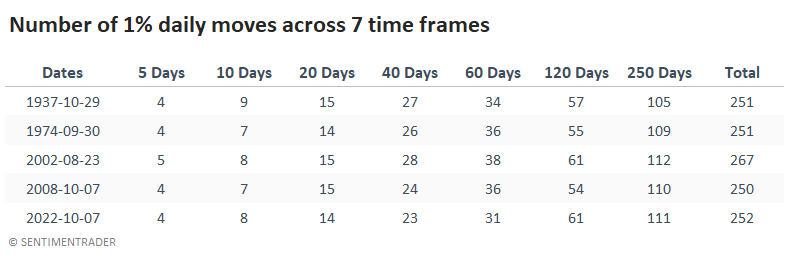
- Over 7 time frames, the S&P 500 has swung more than 1% at one of the greatest paces ever
- Such wild swings preceded further large swings, with losses two months later every time
- But the few precedents also all preceded long-term gains as they triggered near major market lows
In the midst of one of the wildest streaks in history
It's been a most violent couple of weeks. The Wall Street Journal notes:
Judging by the violent reactions to several early-reporting companies, the coming corporate results seem unlikely to calm a market that has been particularly volatile of late. The S&P 500 has notched moves of at least 1% in 11 of the past 14 trading days, the most in such a time frame since April 2020, according to Dow Jones Market Data.
It hasn't just been the past week or two when investors suffered through gut-wrenching swings. It has persisted for weeks beyond that. And months. Even a year.
Across seven time frames, the S&P 500 has closed more than 1% from its previous close more than any period in the past decade.
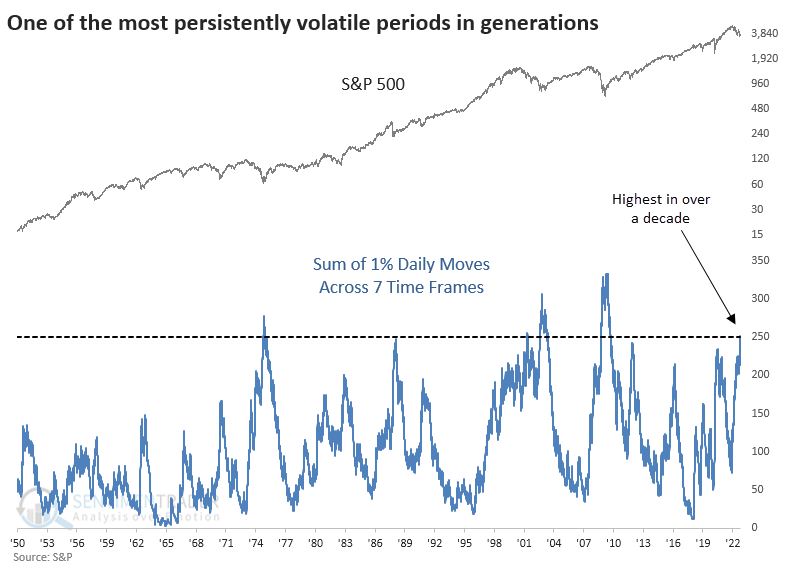
Through Friday, the S&P 500 had gyrated more than +/-1% on a closing basis 4 times during the past 5 sessions; 8 out of the last 10, and so on. Only four other periods since 1929 have witnessed this many swings across so many time frames.
Going forward, the S&P suffered further short- to medium-term losses every time. And each of them also marked major bottoms with gains over the next year; three led to substantial multi-year gains.
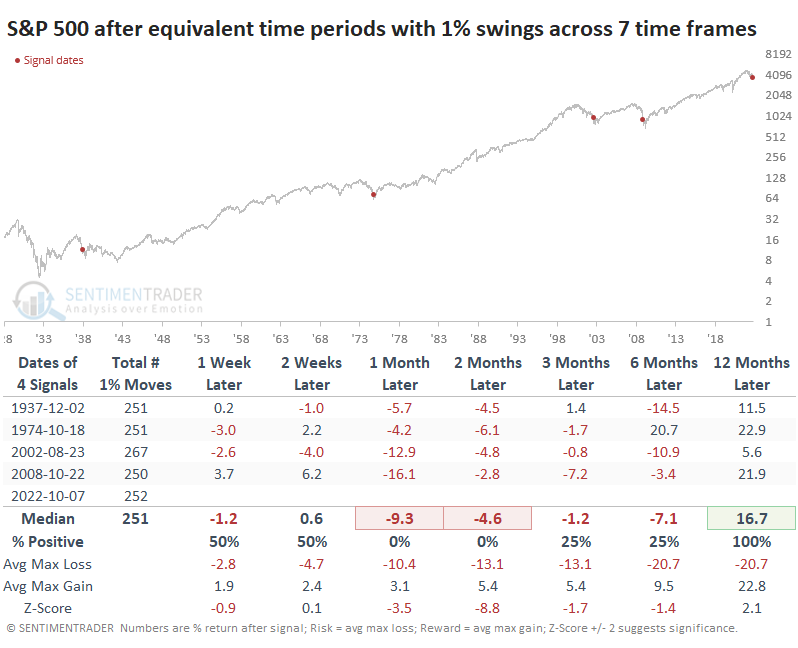
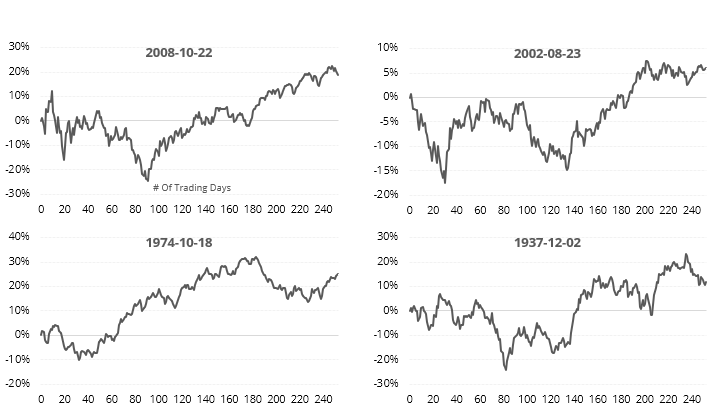
When we zoom in on the individual signals, the thumbnails show how volatile the S&P was in the months ahead. Again, they all suffered losses over the next two months, averaging double digits. As painful as that was, they reversed the losses in relatively quick order.
What the research tells us...
Anyone paying attention to their account statement or even the national news would have the impression that stock markets have been gyrating wildly. When we put numbers to the swings, we're in the midst of what has been one of the wildest markets in history. It typically makes sense to take the opposite side of that, but only for long-term investors with strong stomachs.
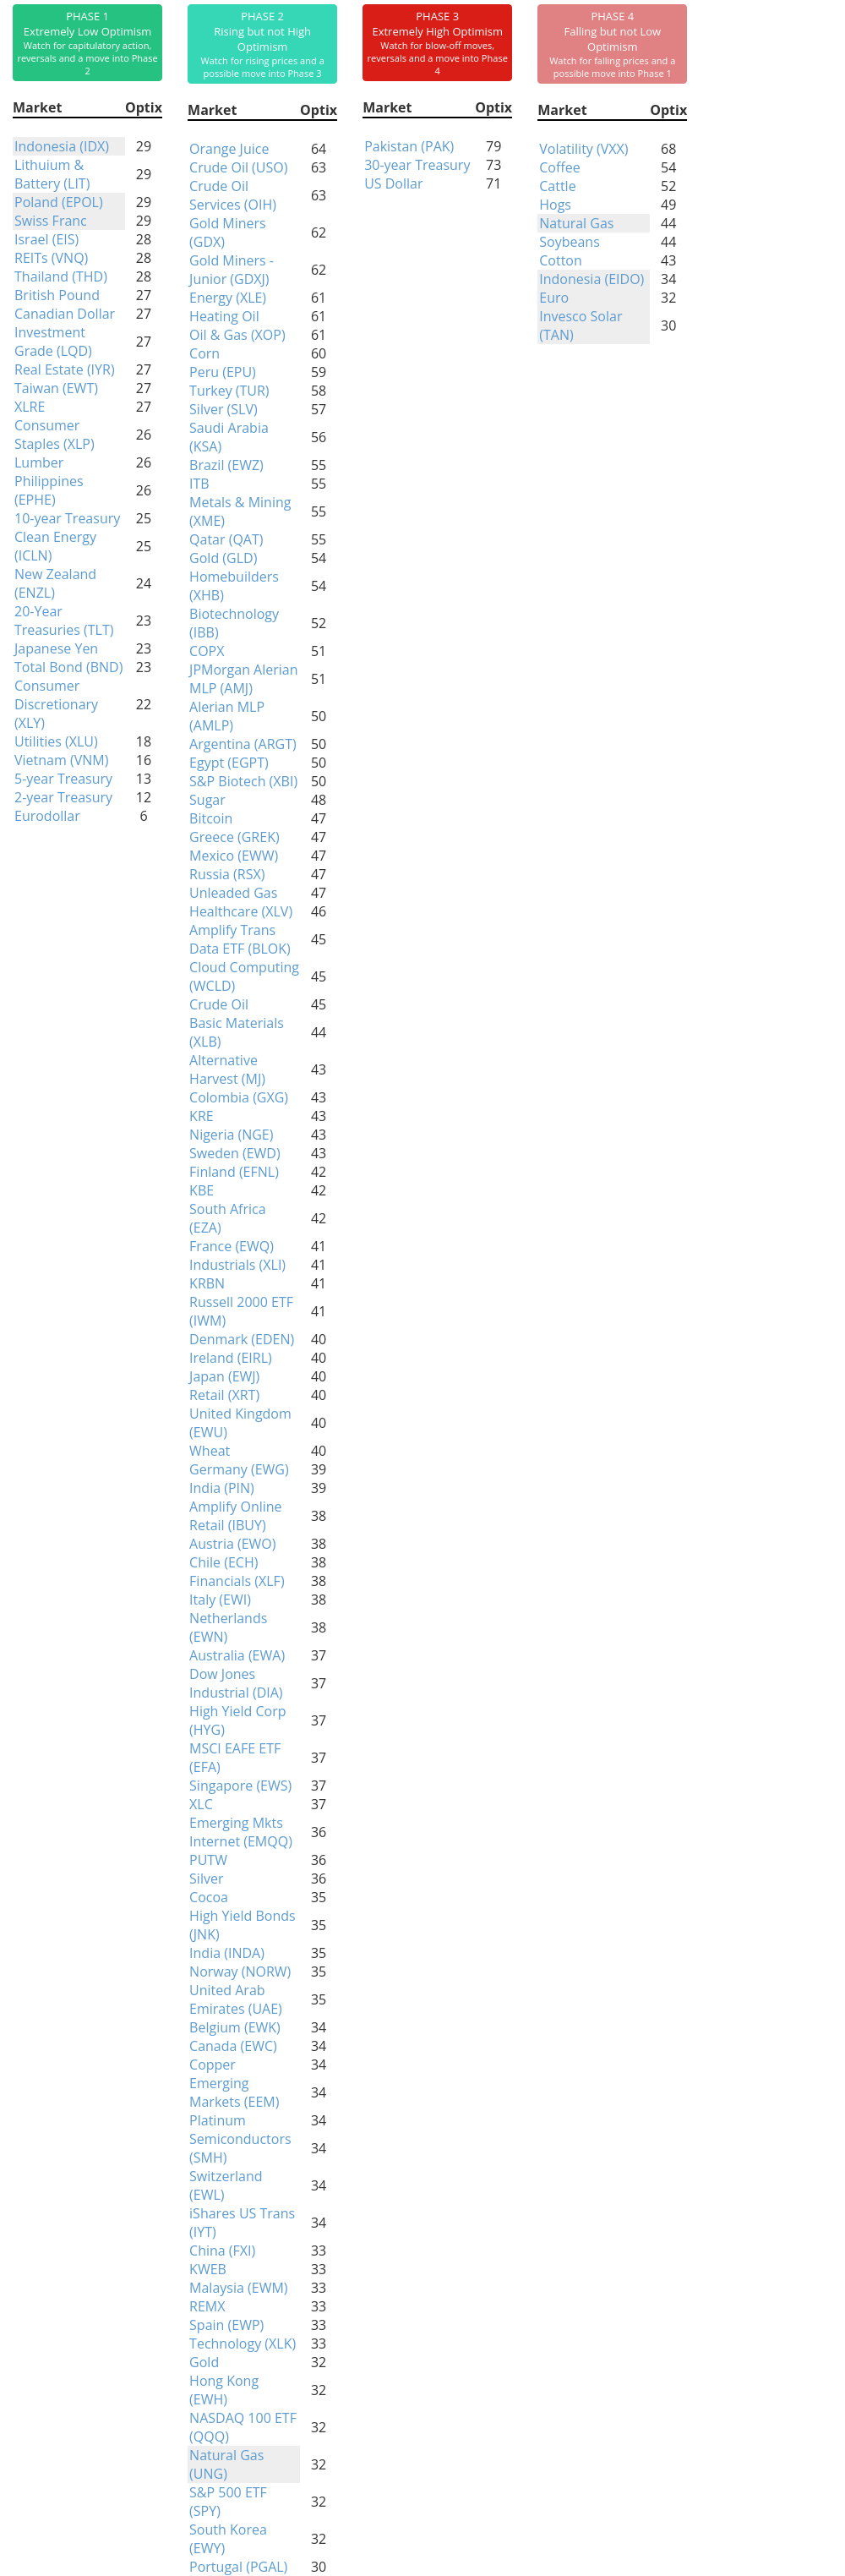
Indicators at Extremes
Phase Table
Ranks
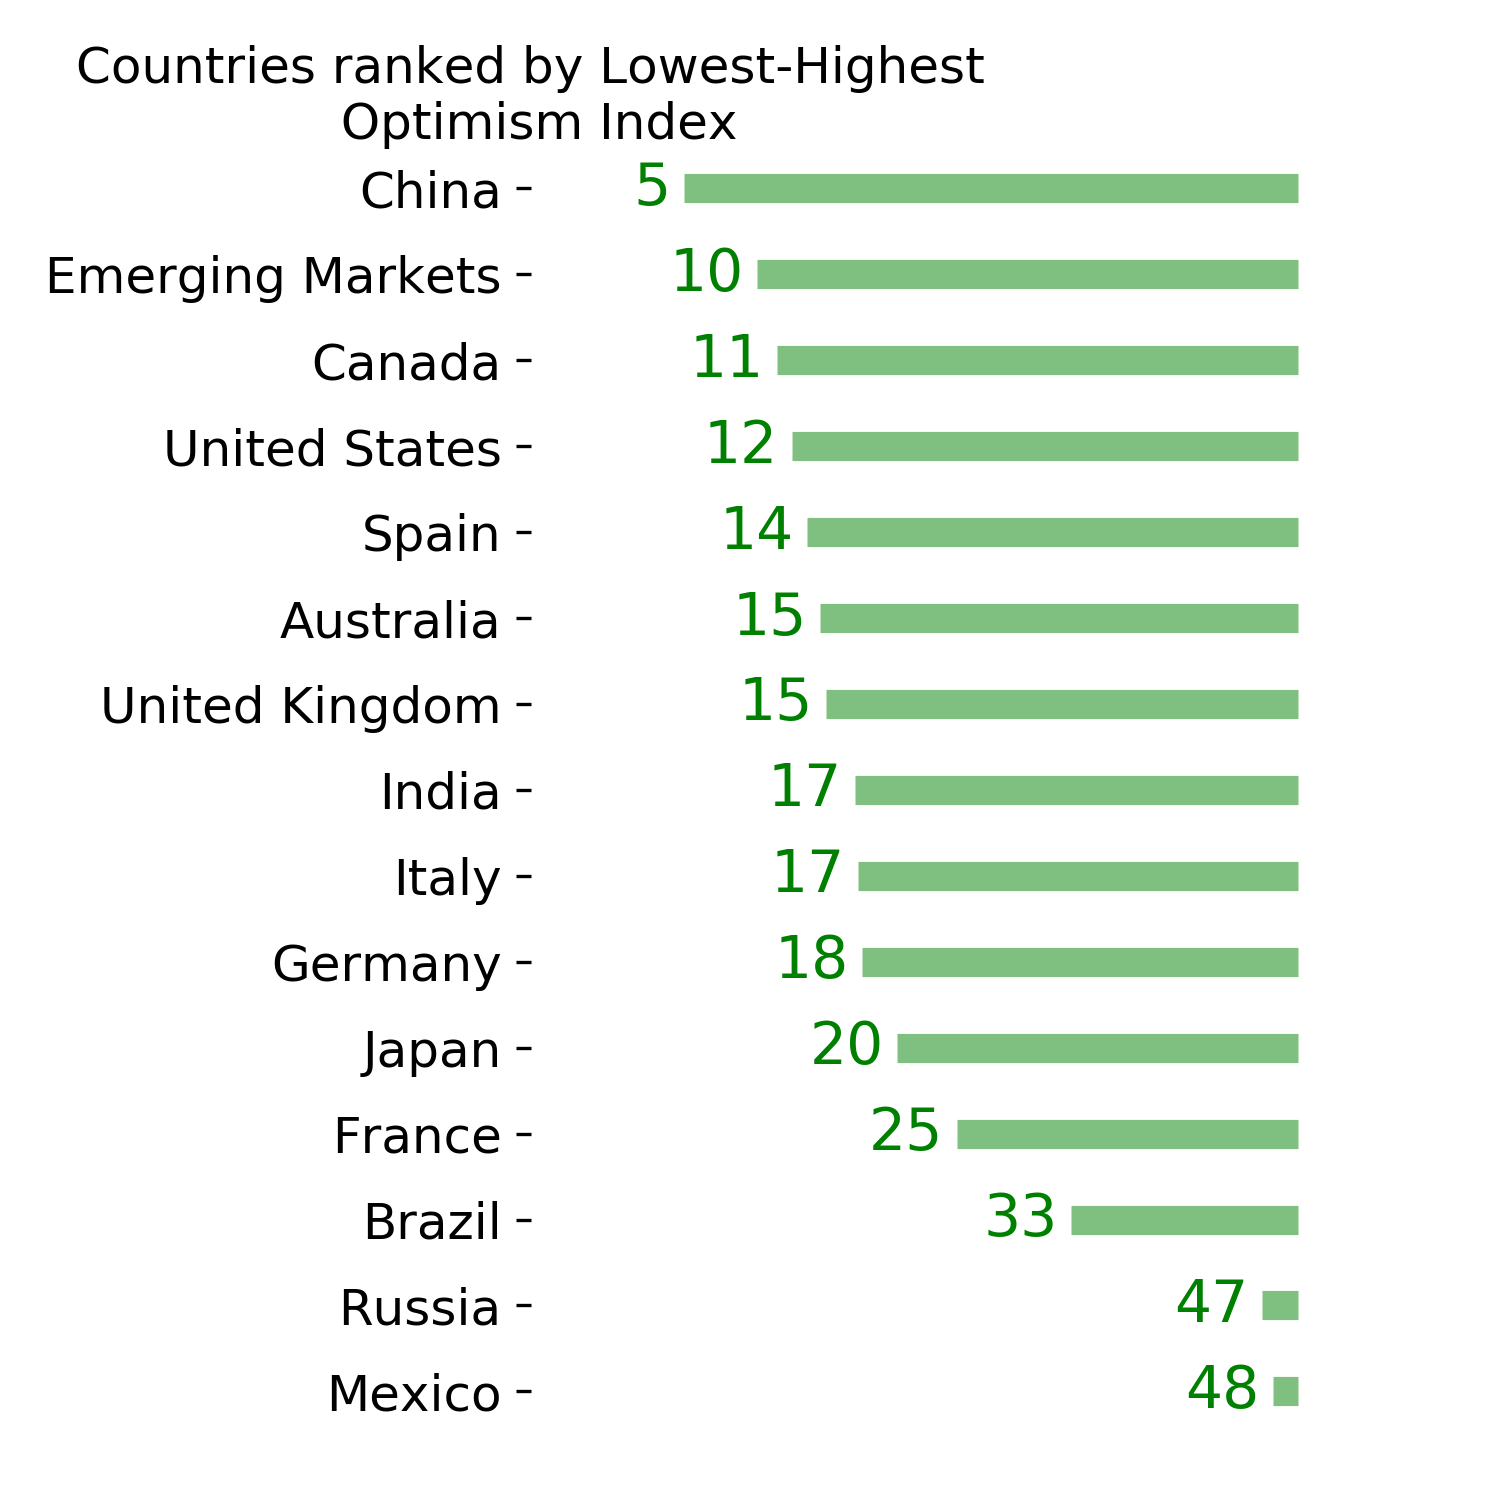
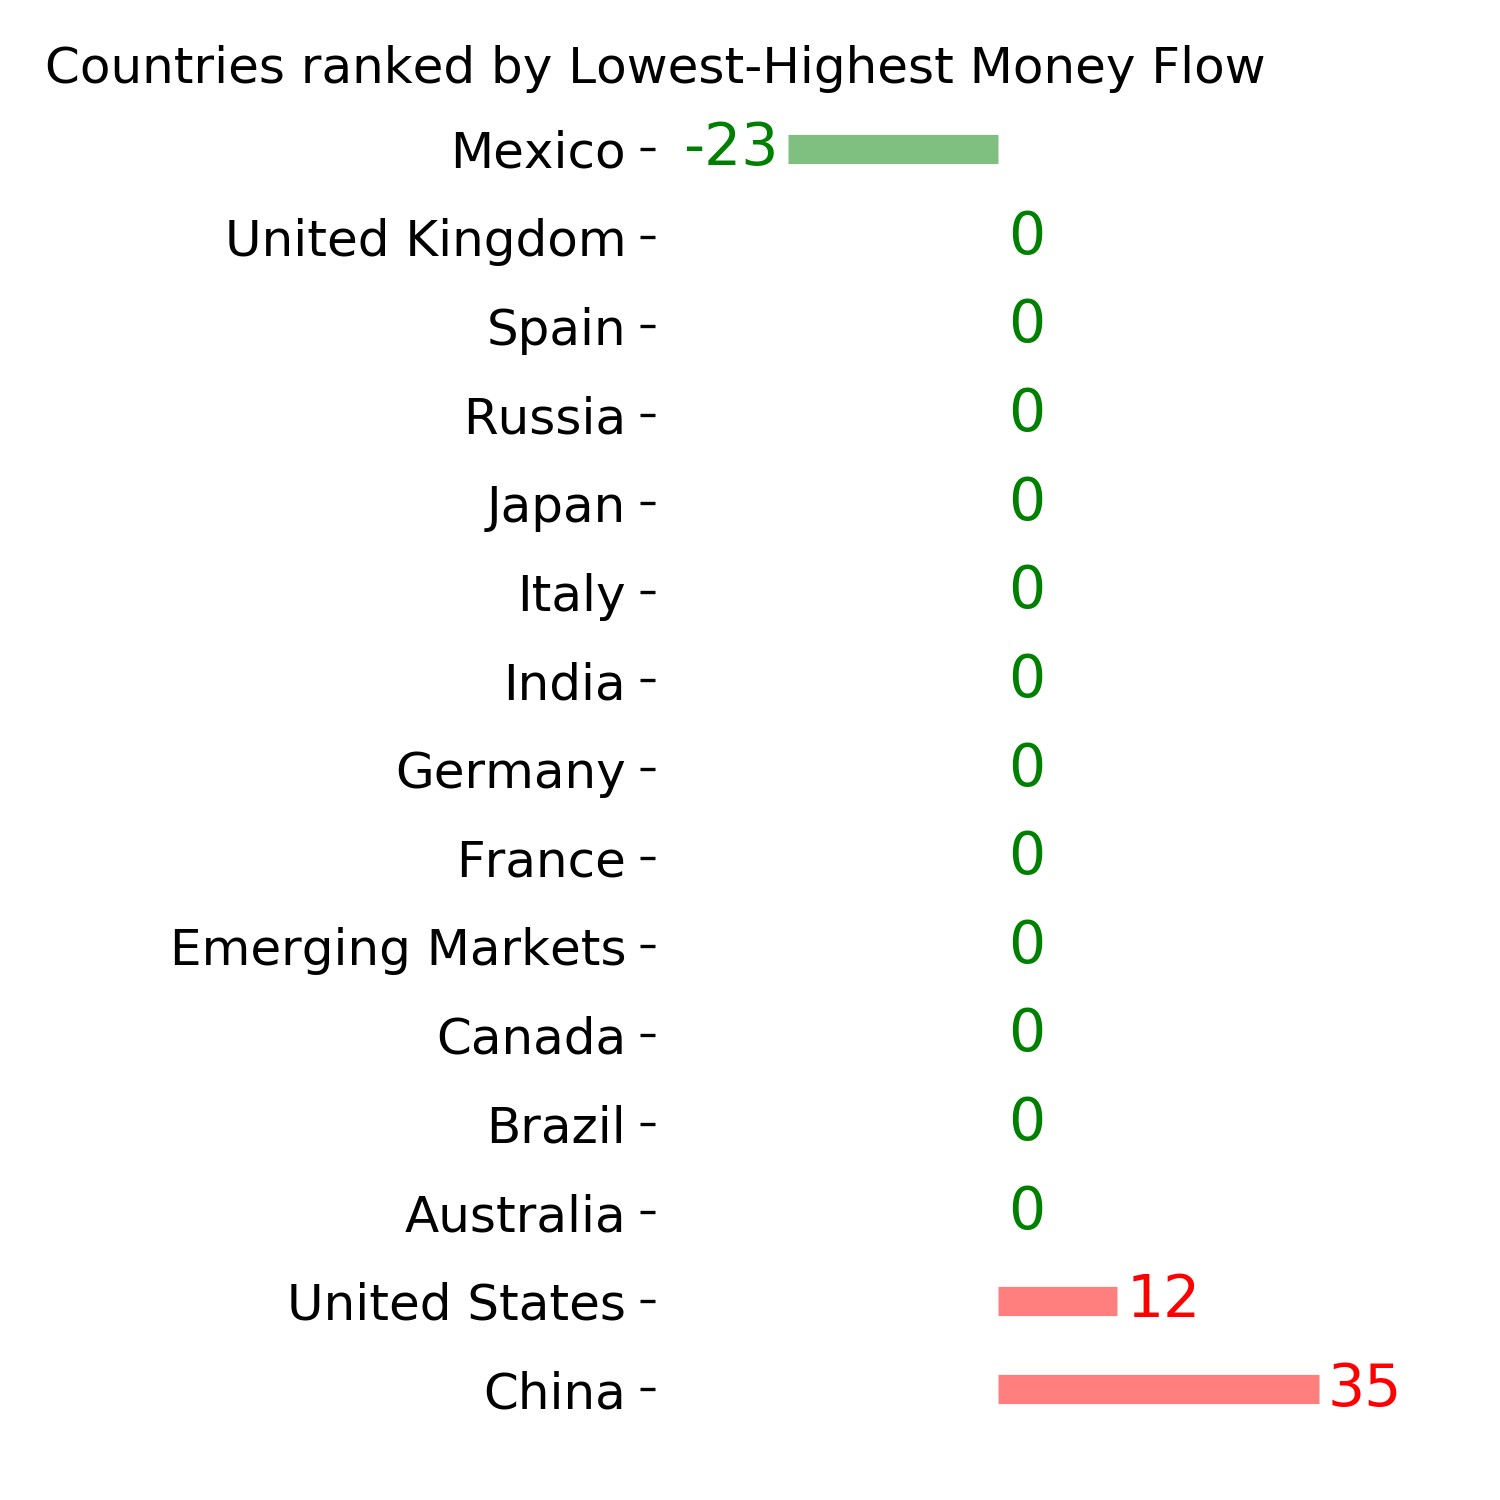
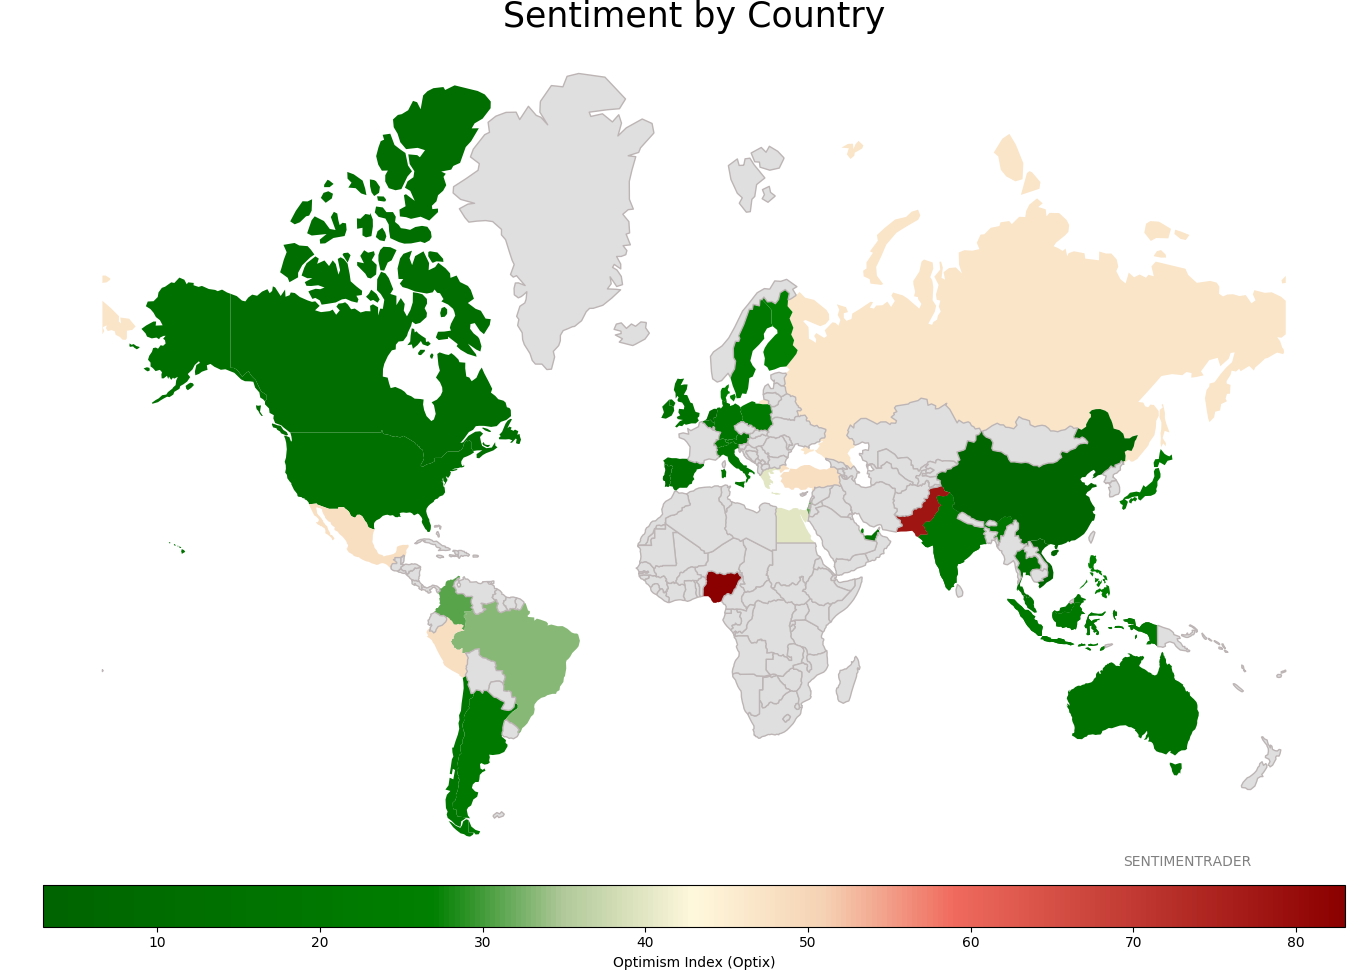
Sentiment Around The World
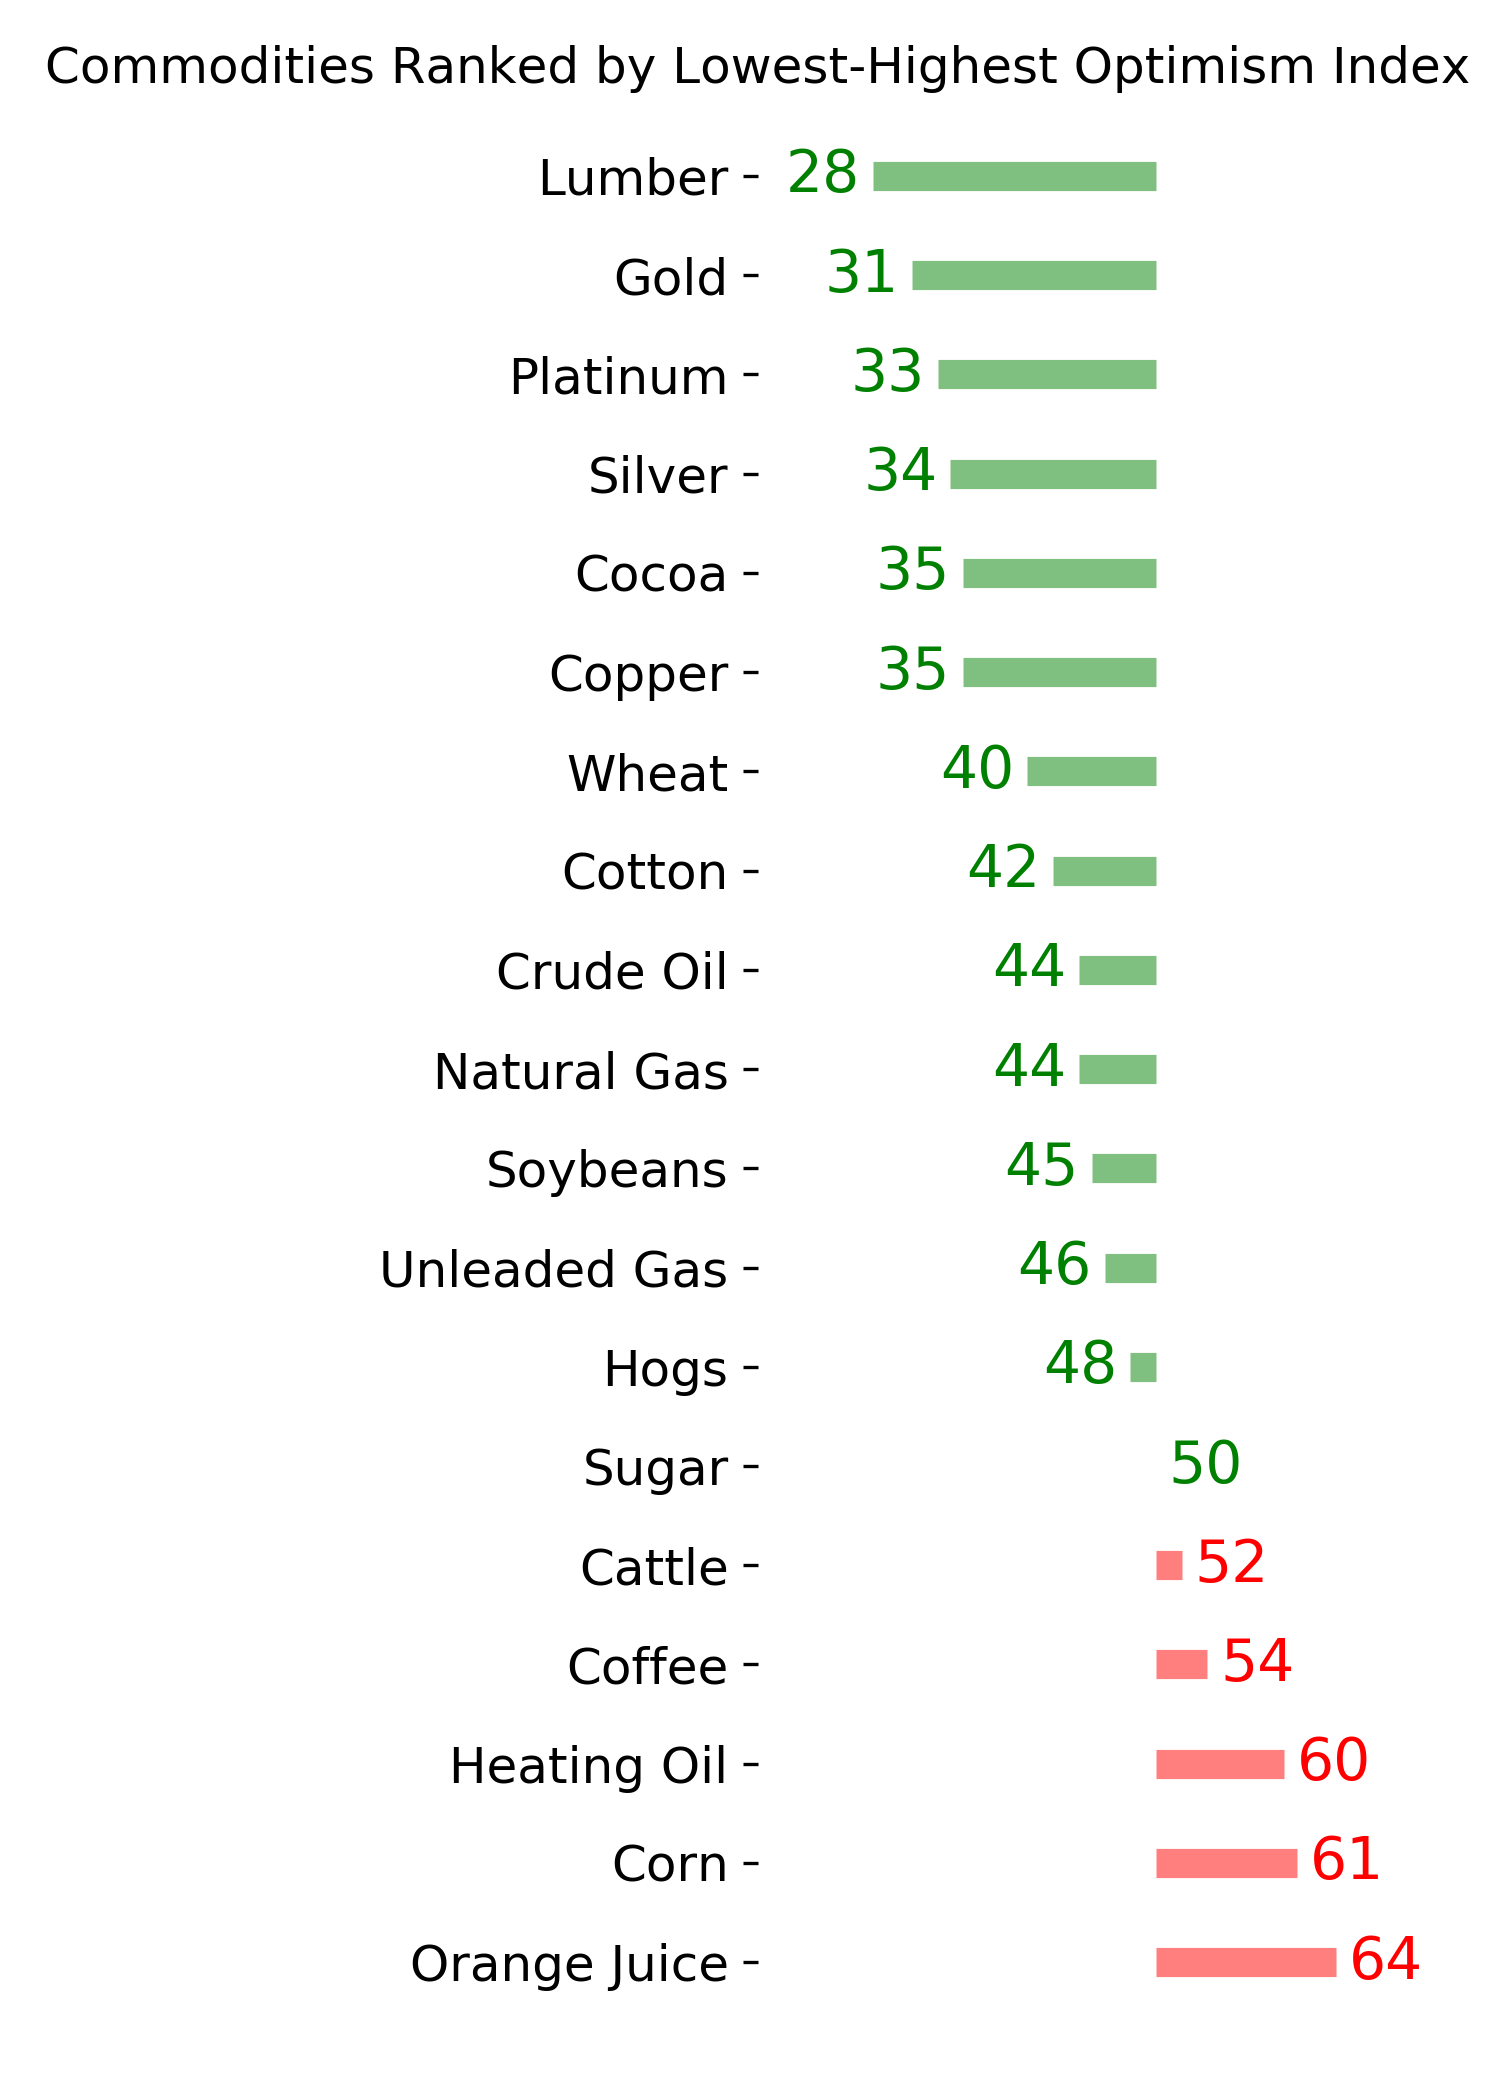
Optimism Index Thumbnails
|
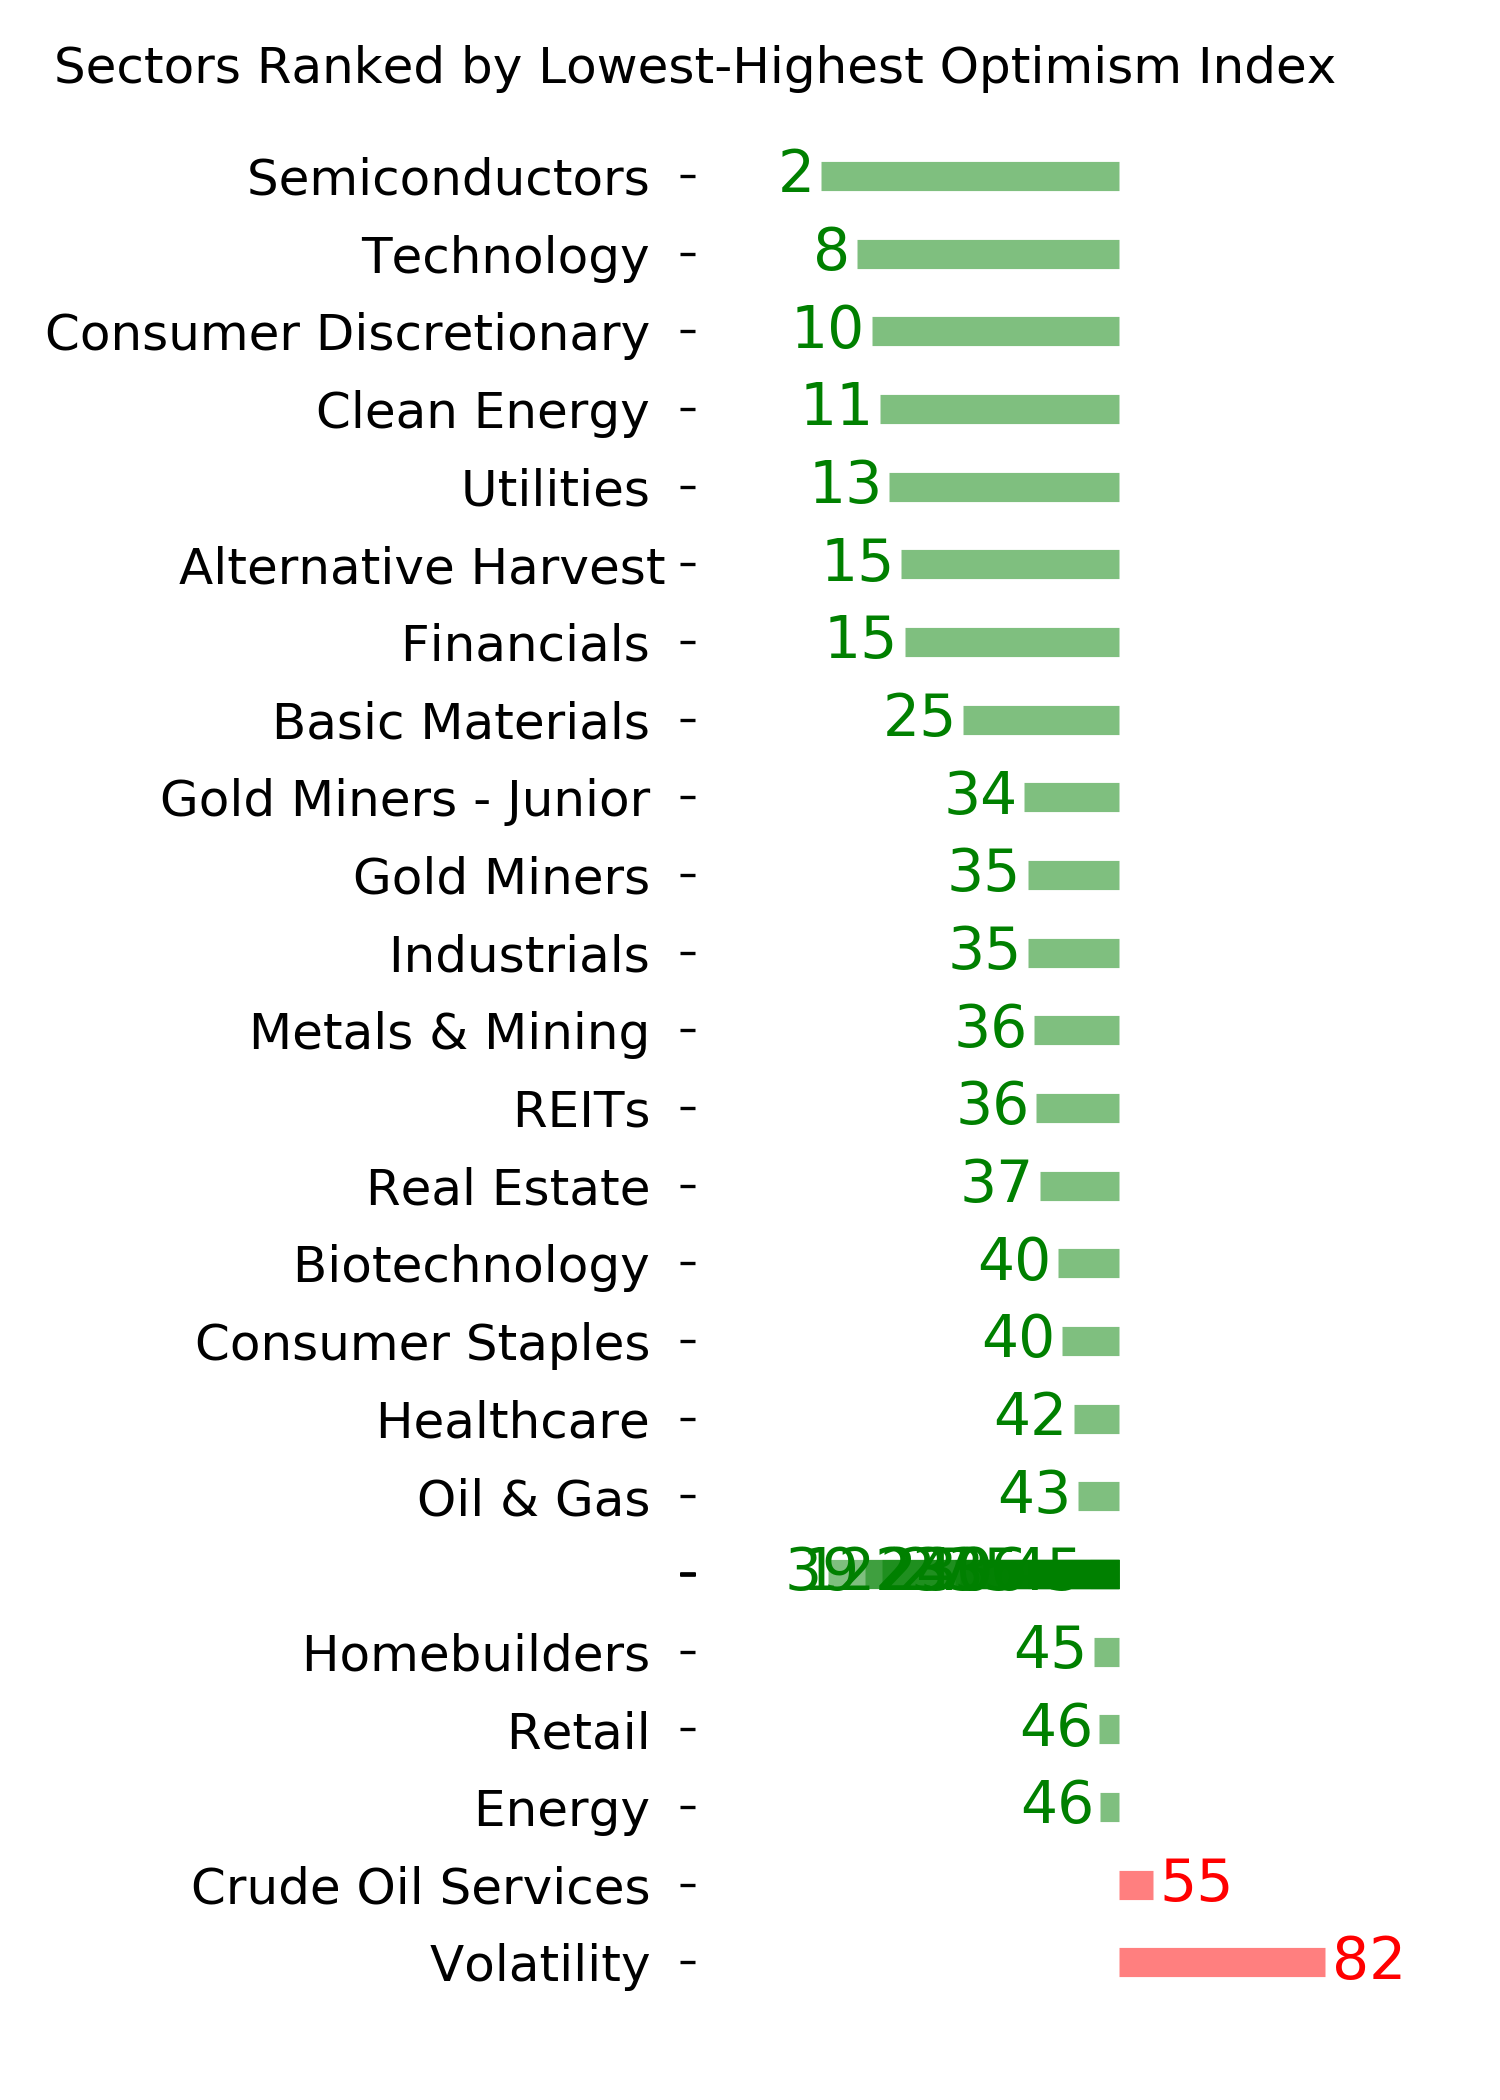
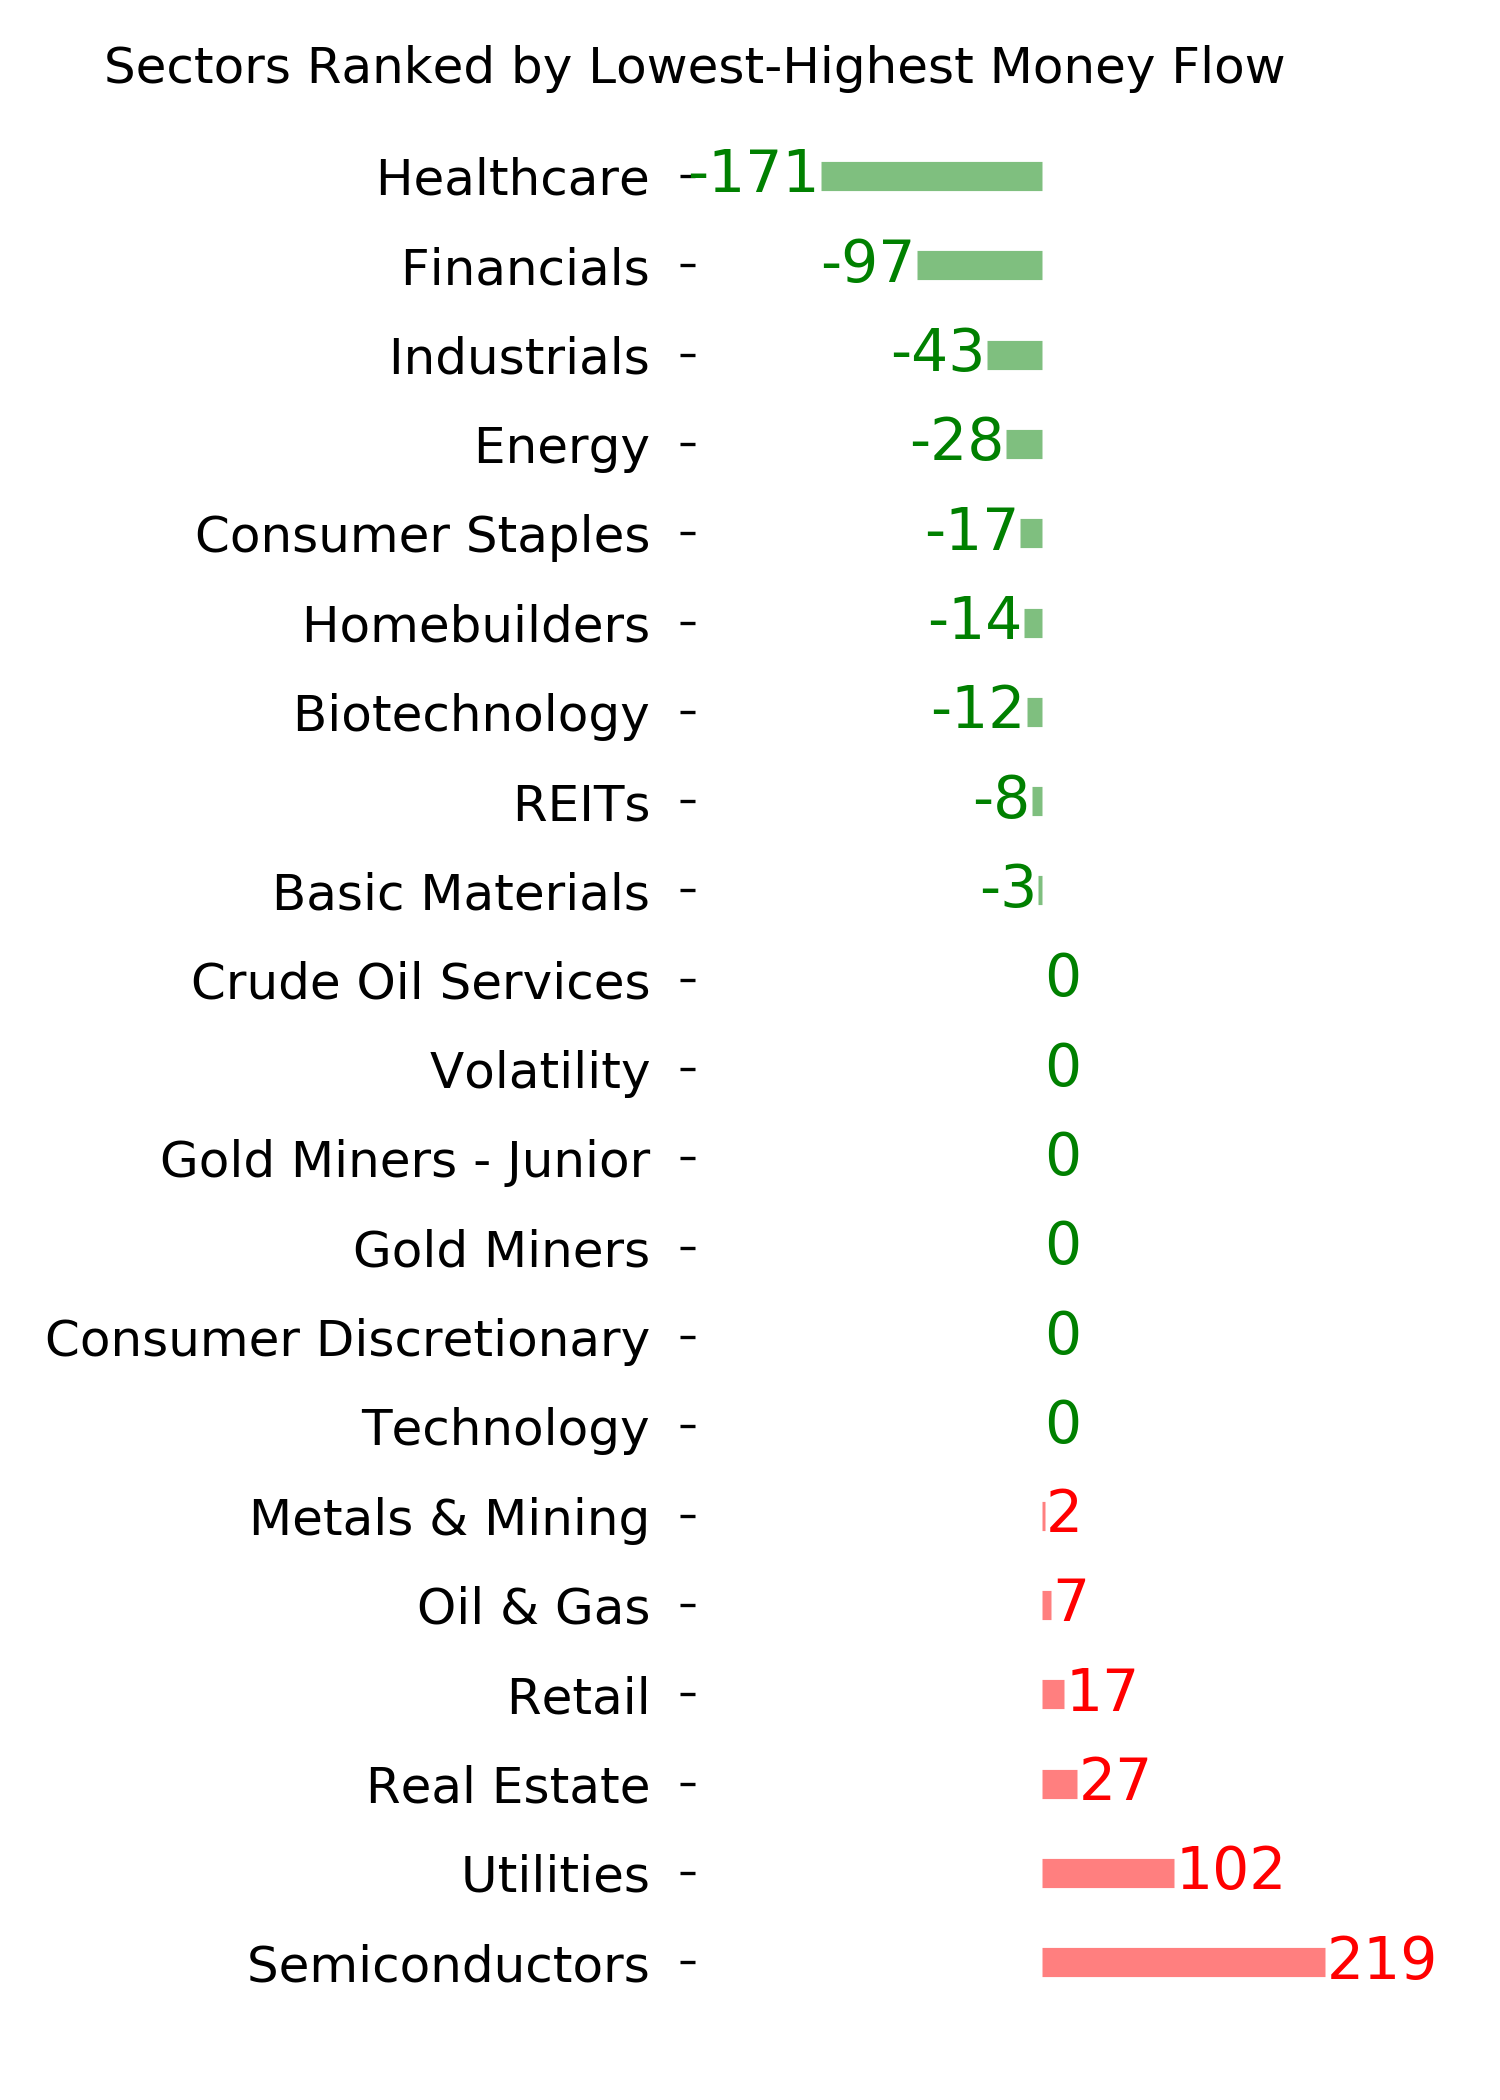
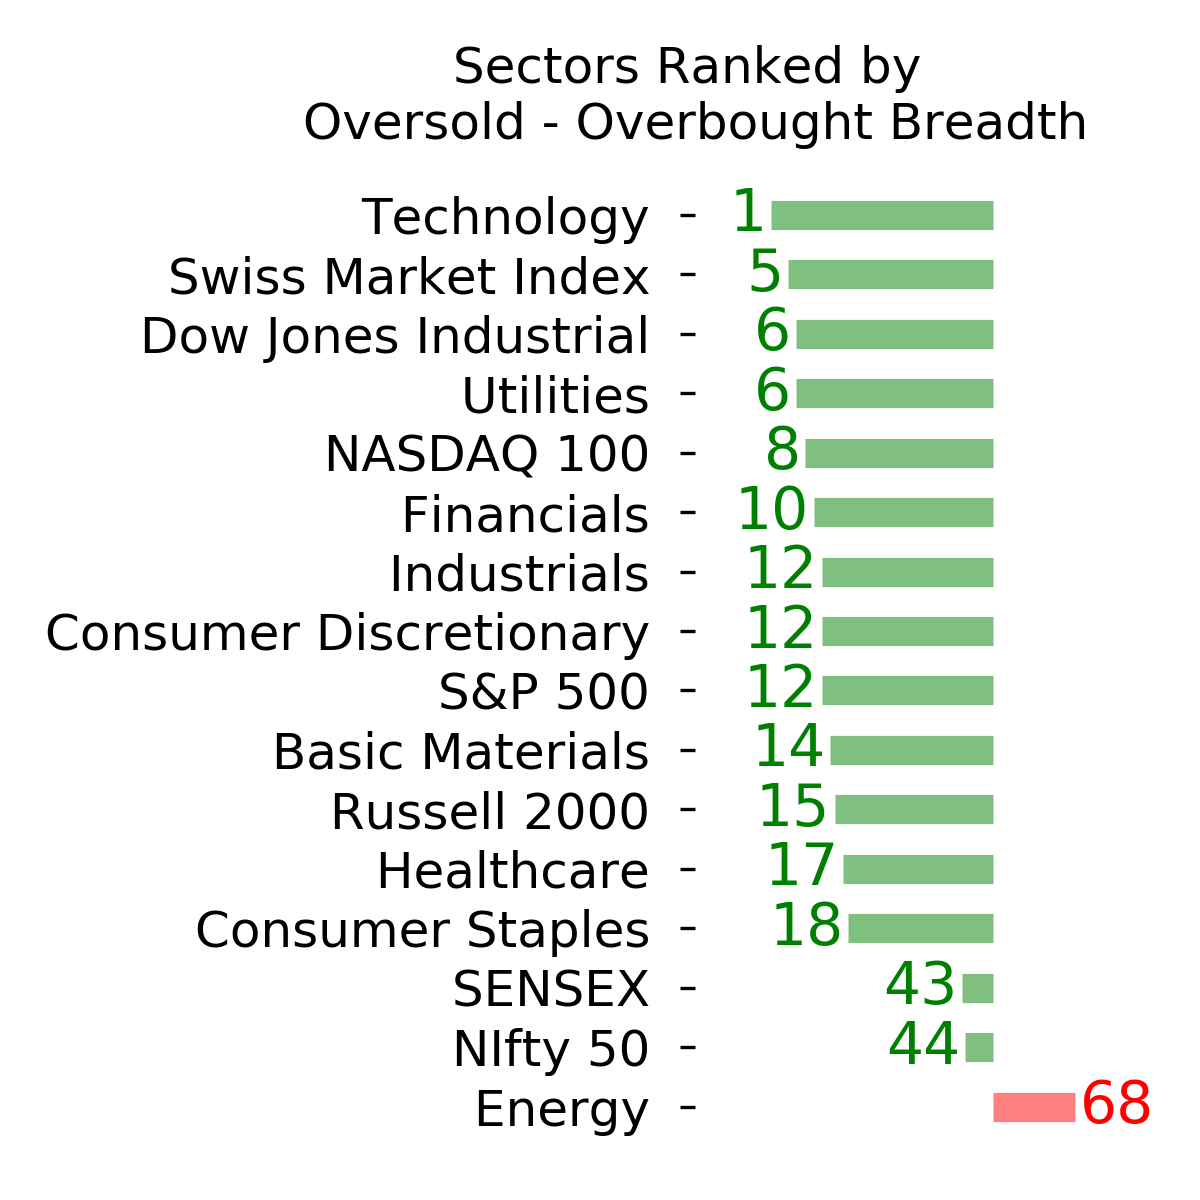
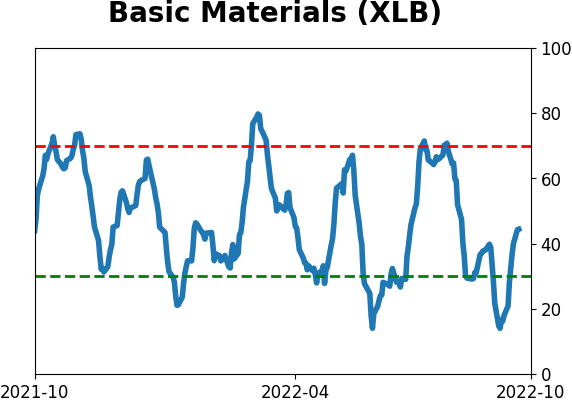
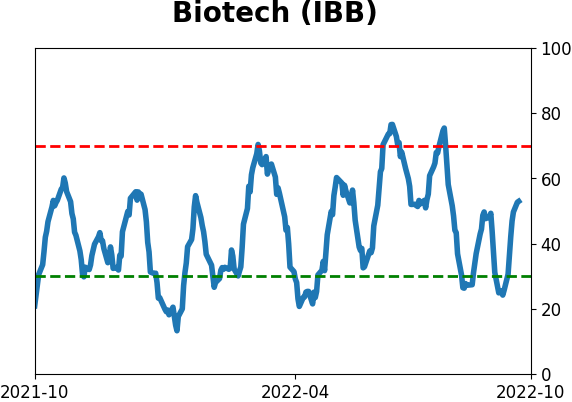
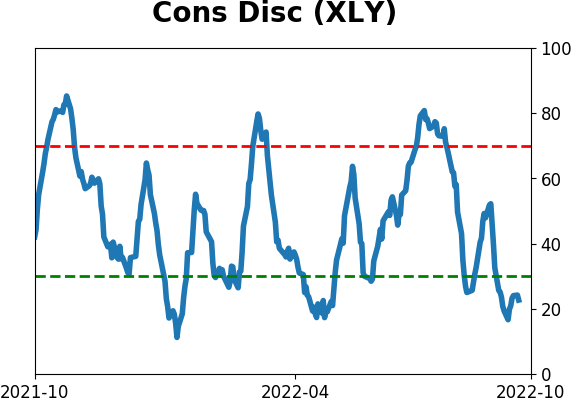
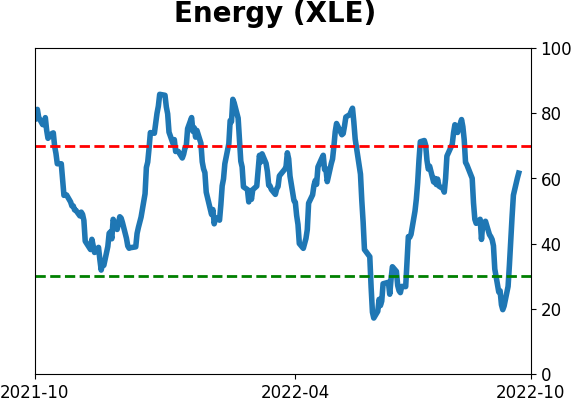
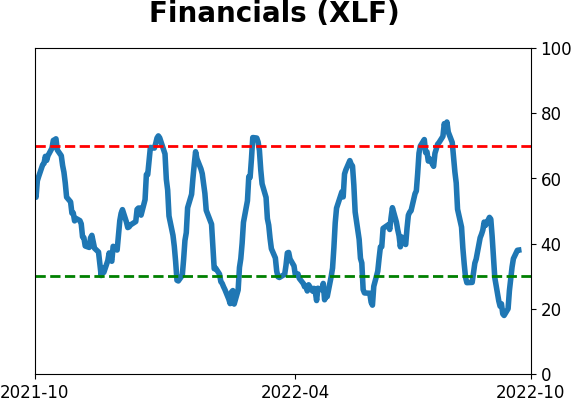
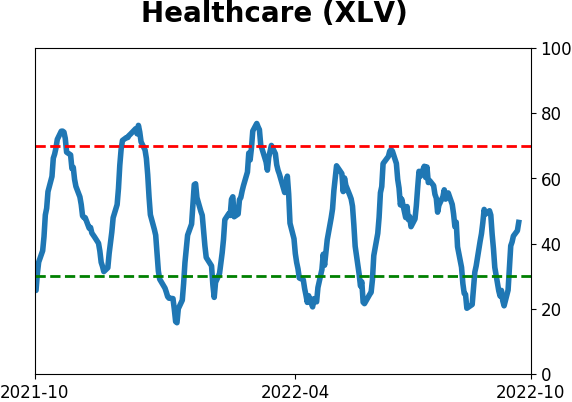
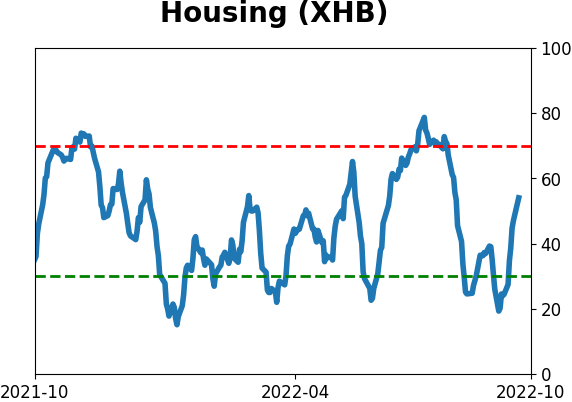
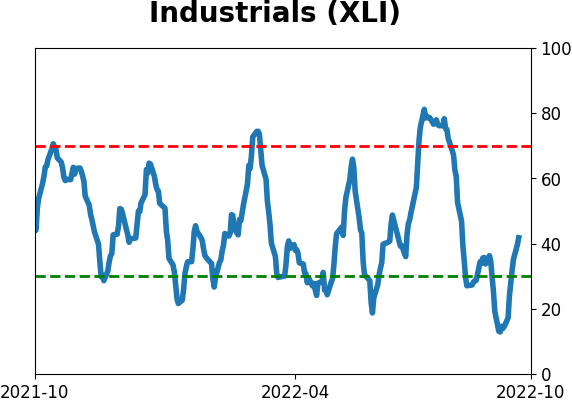
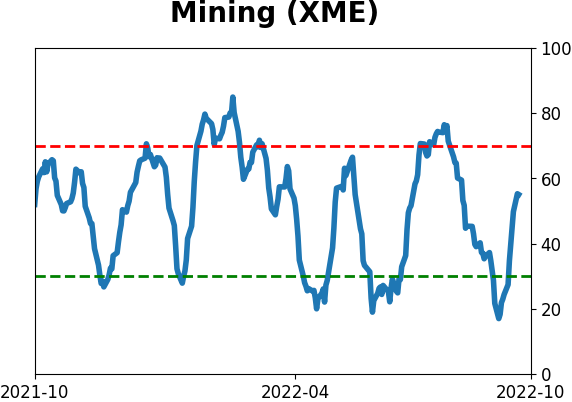
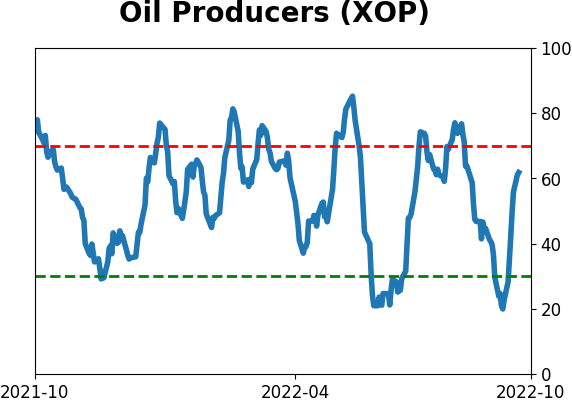
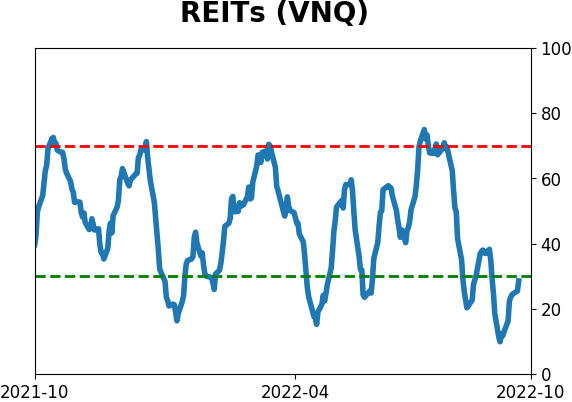
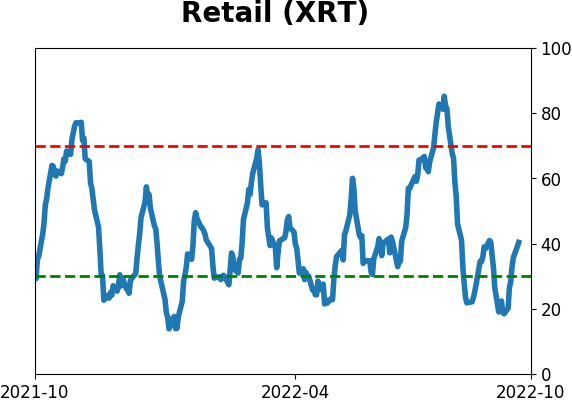
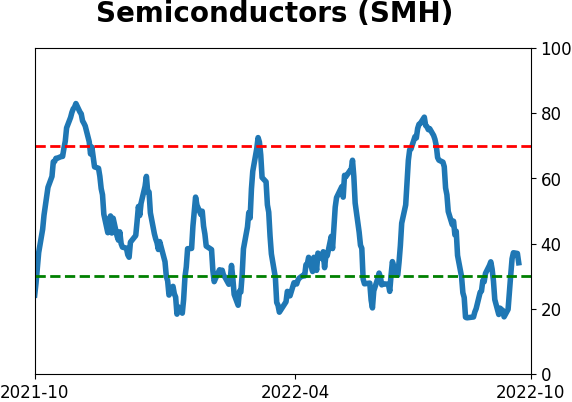
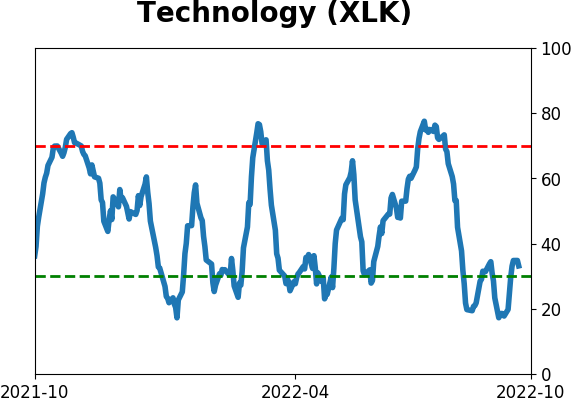
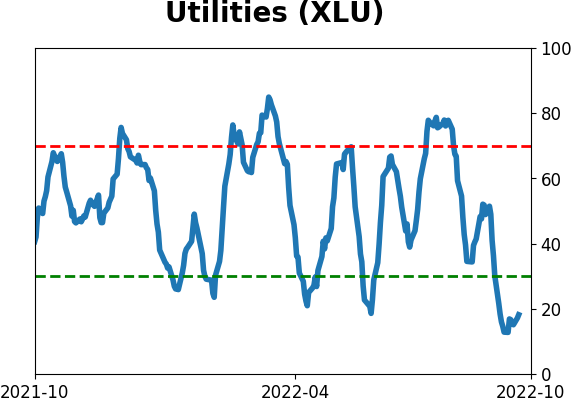
Sector ETF's - 10-Day Moving Average
|
|
|
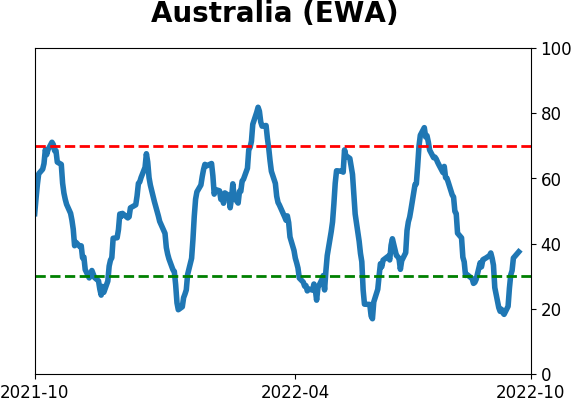
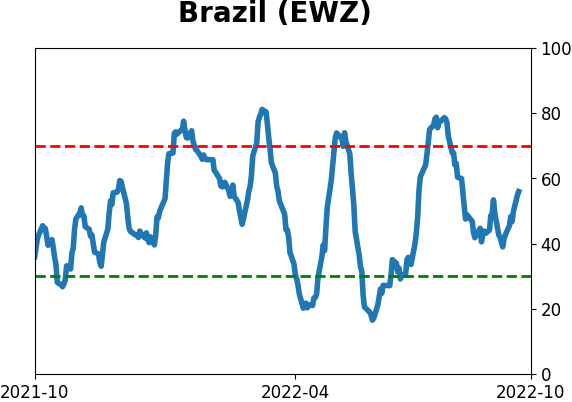
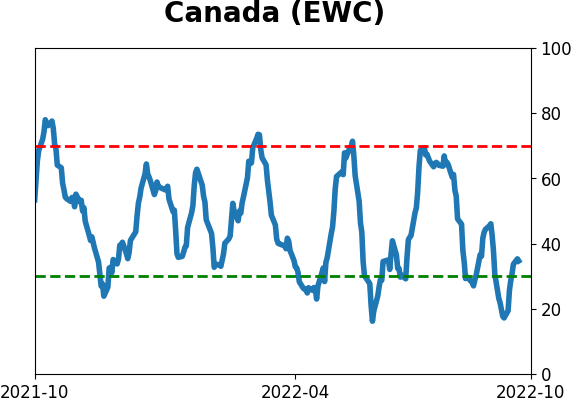
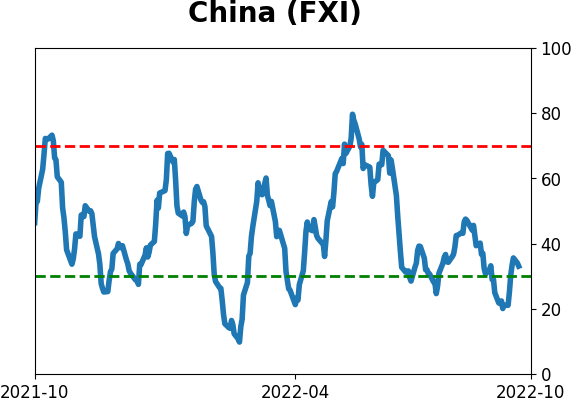
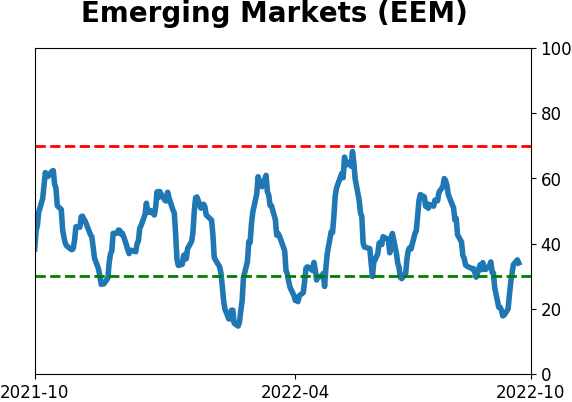
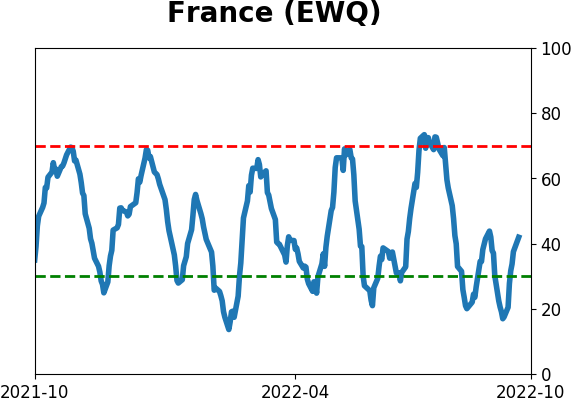
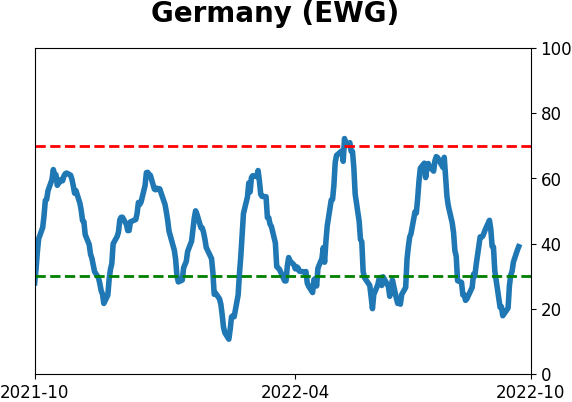
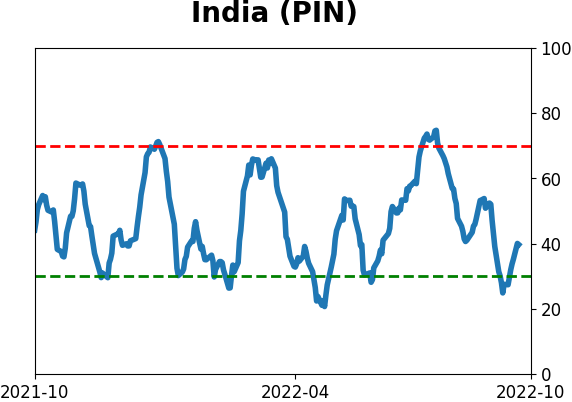
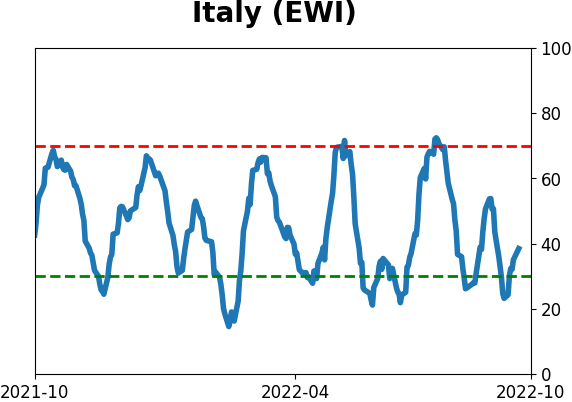
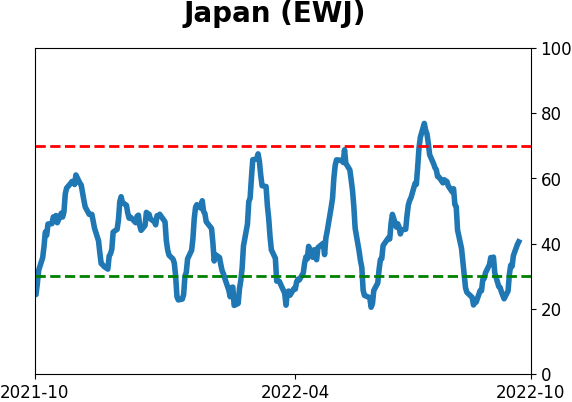
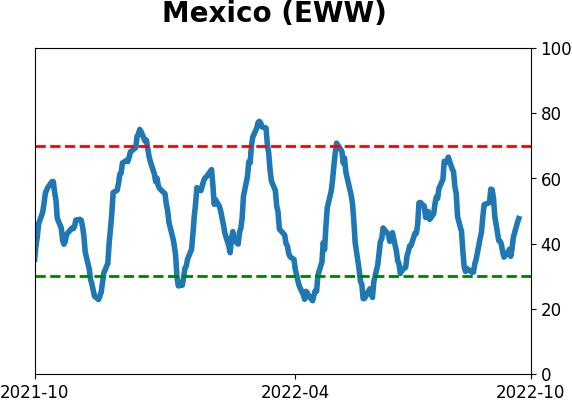
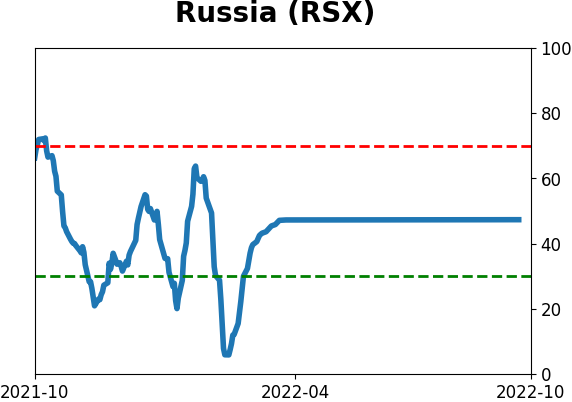
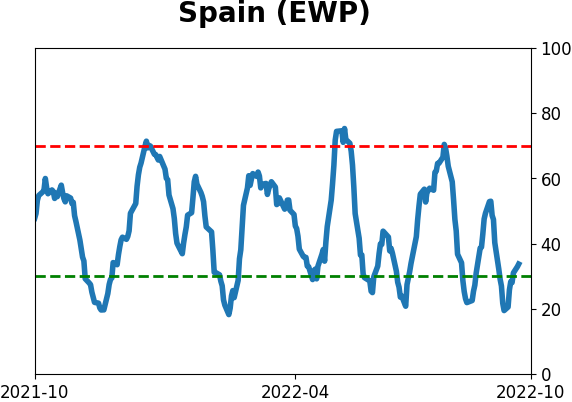
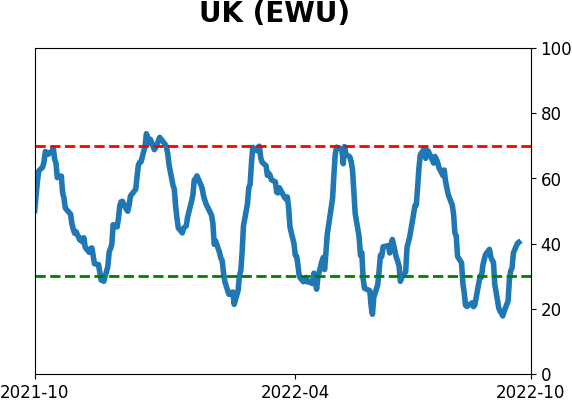
Country ETF's - 10-Day Moving Average
|
|
|
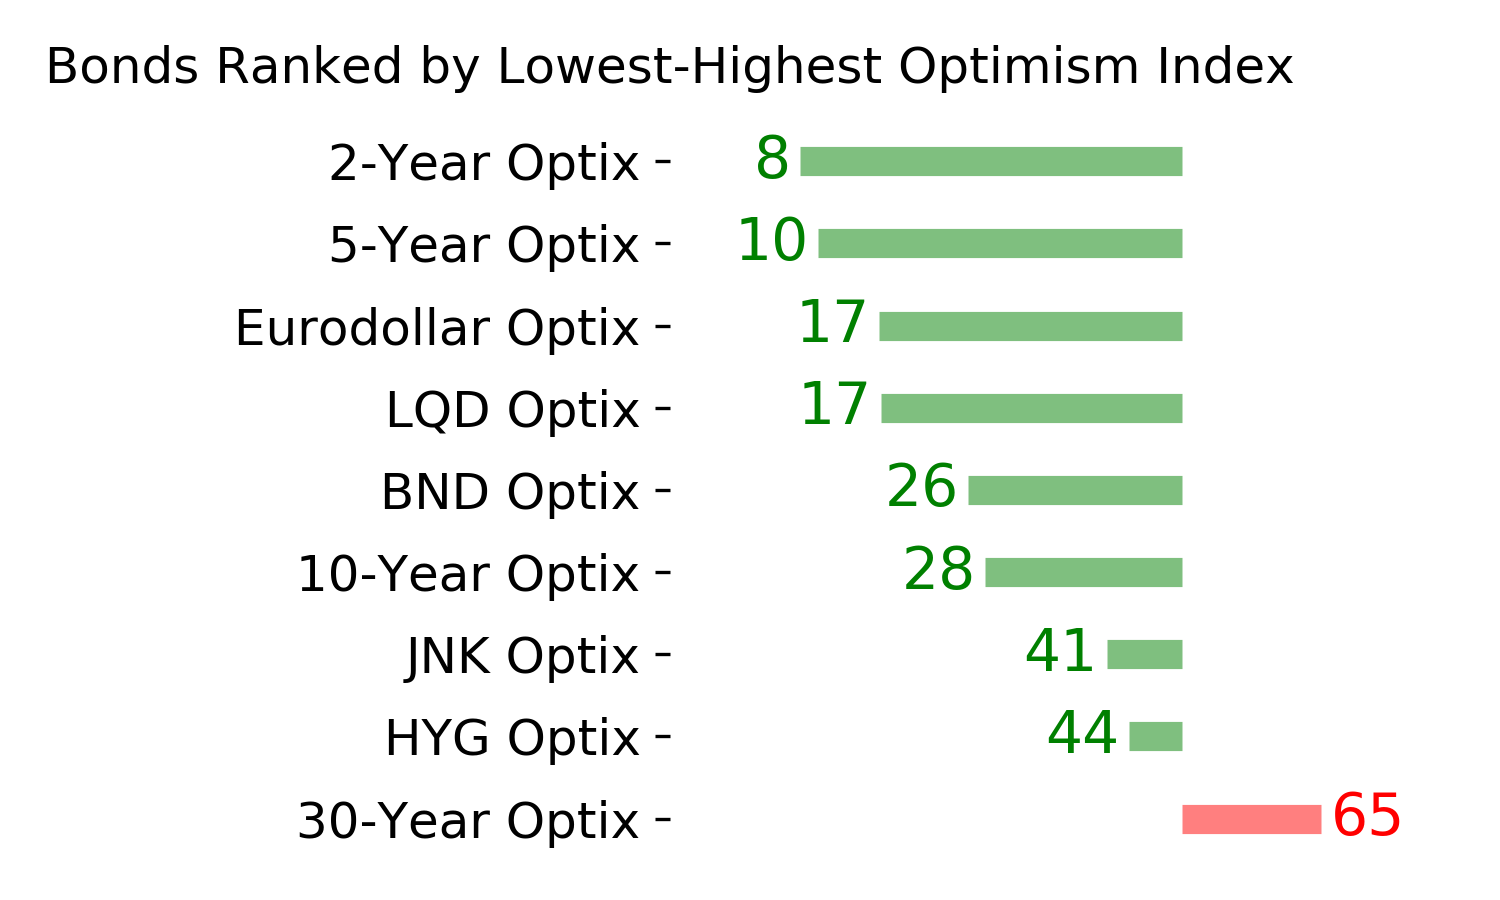
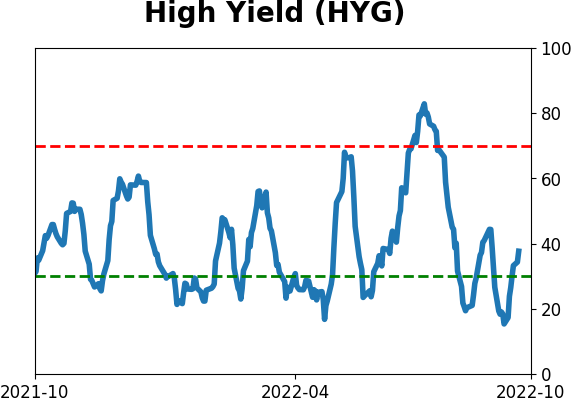
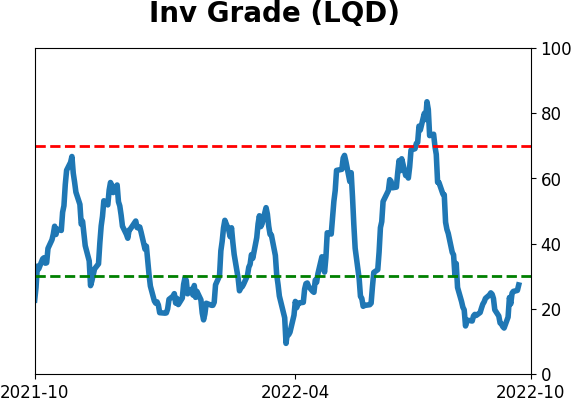
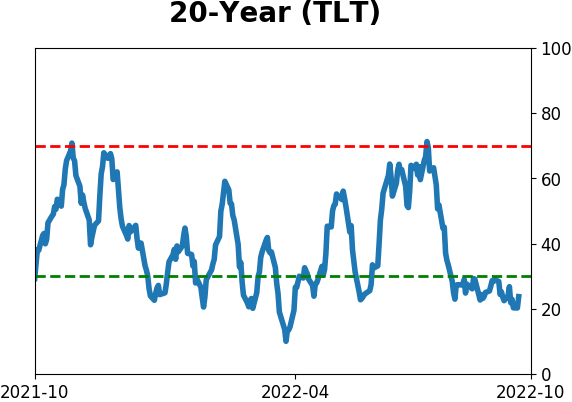
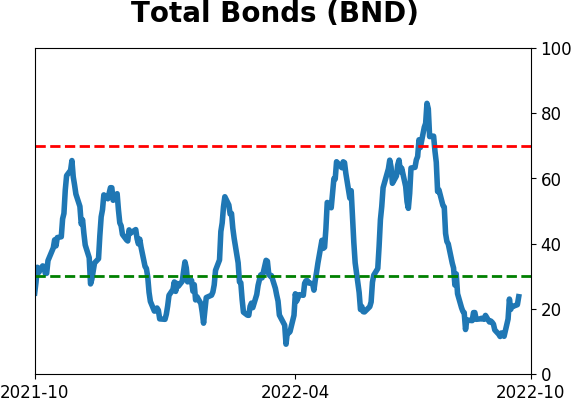
Bond ETF's - 10-Day Moving Average
|
|
|
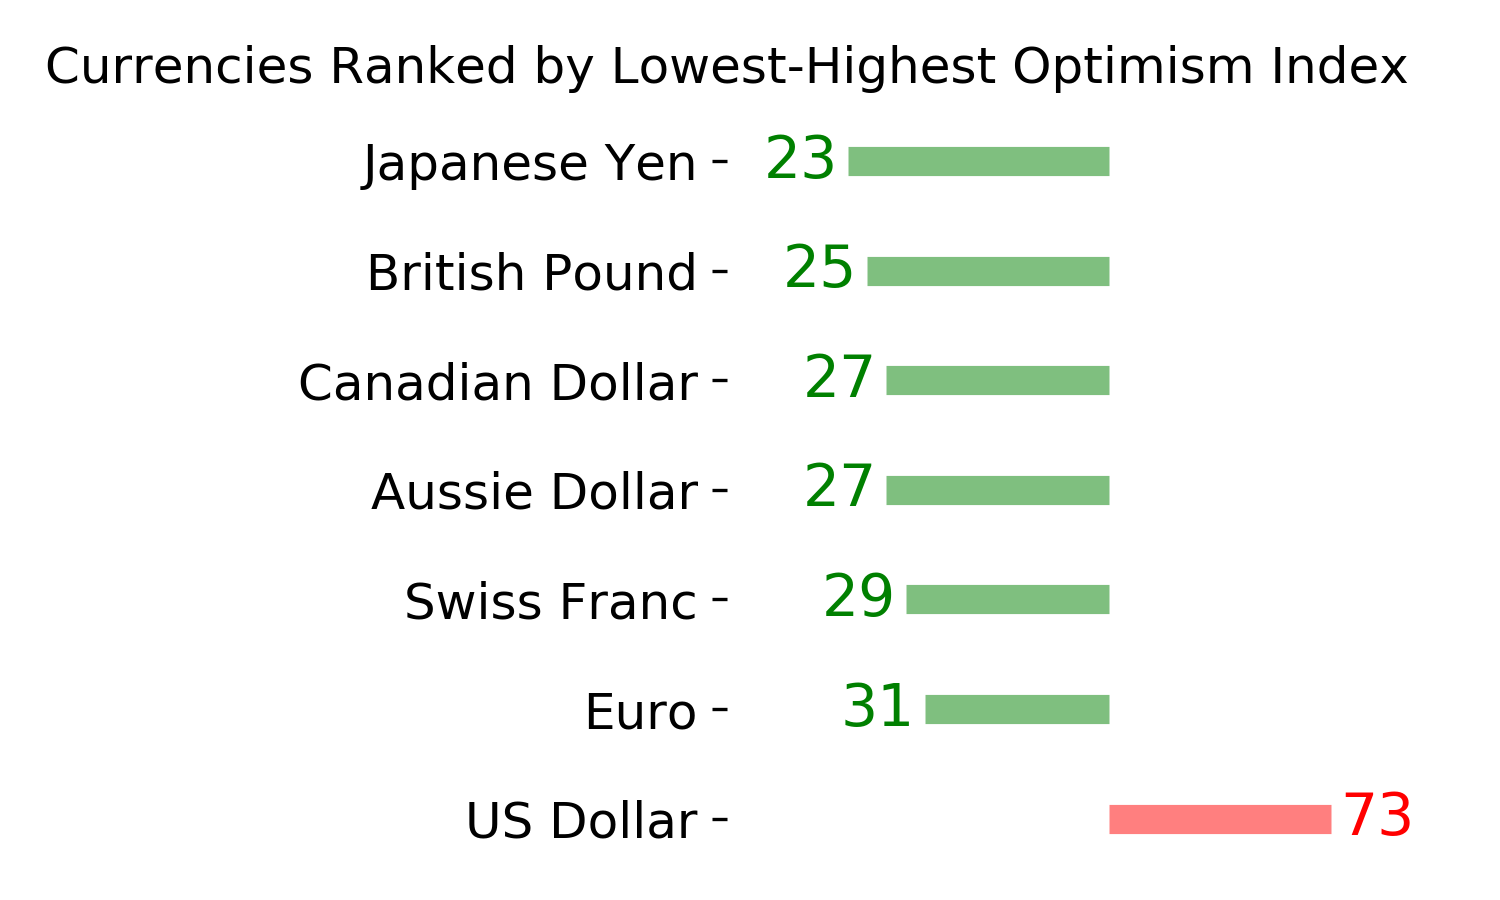
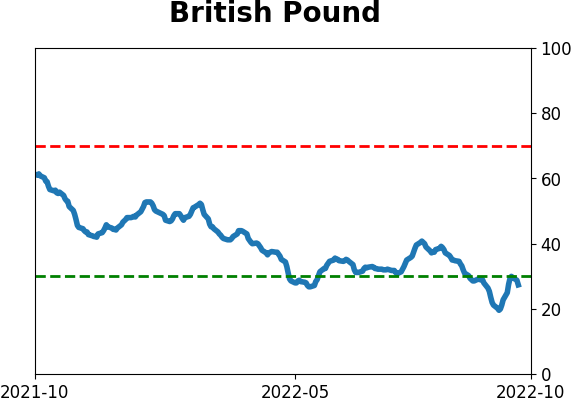
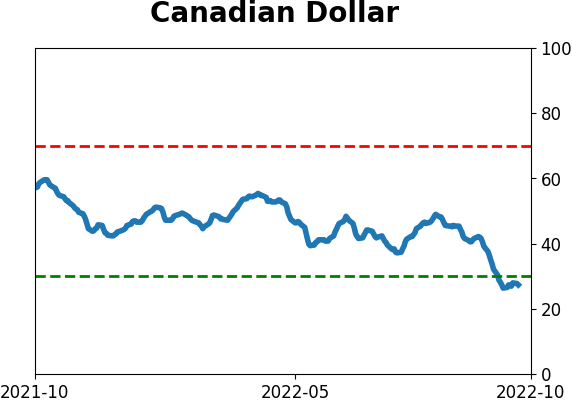
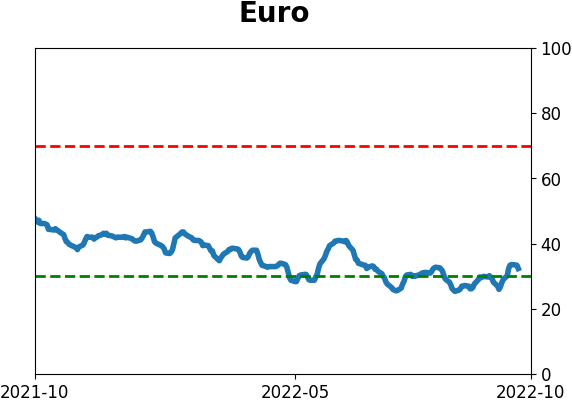
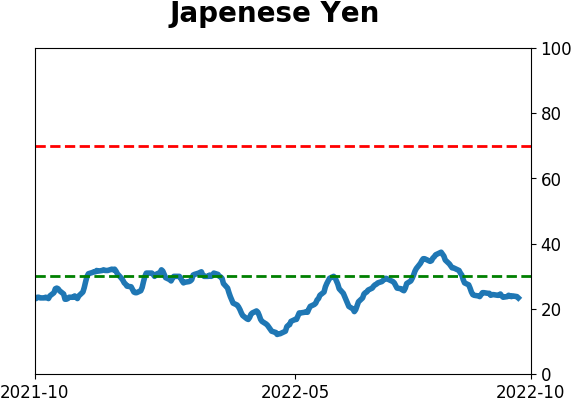
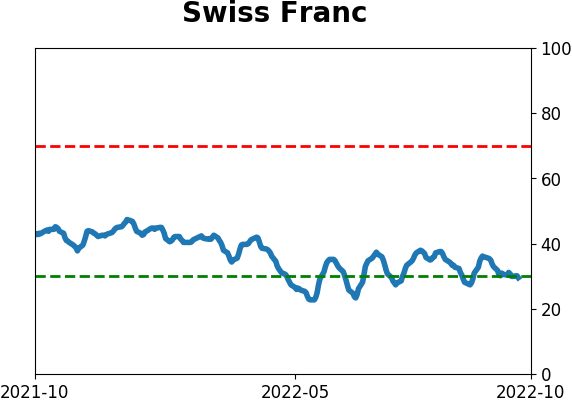
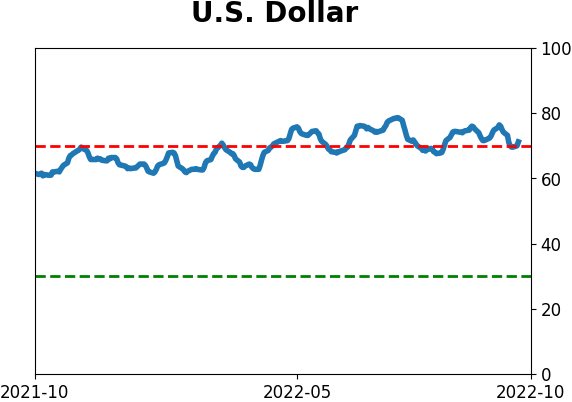
Currency ETF's - 5-Day Moving Average
|
|
|
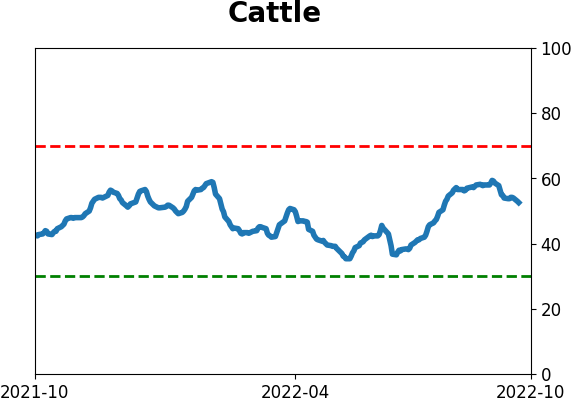
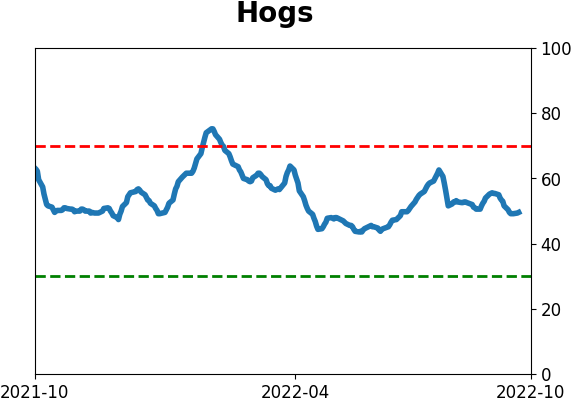
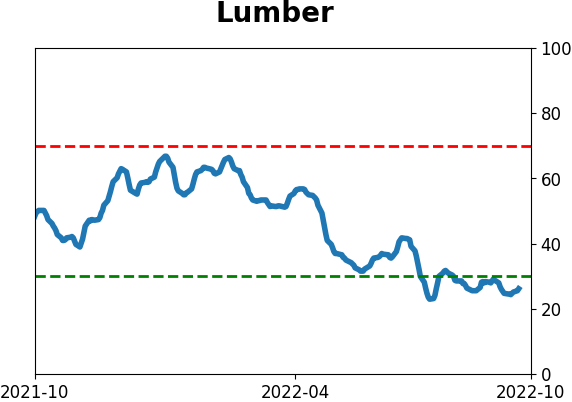
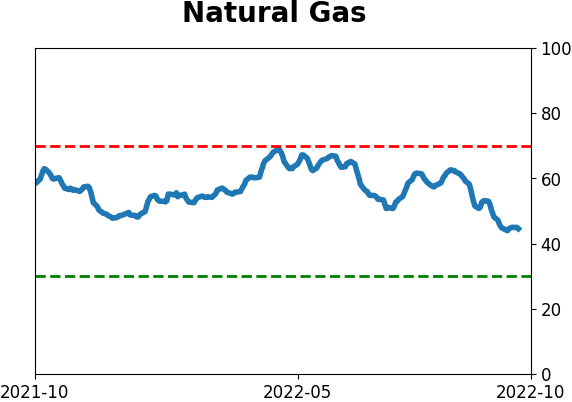
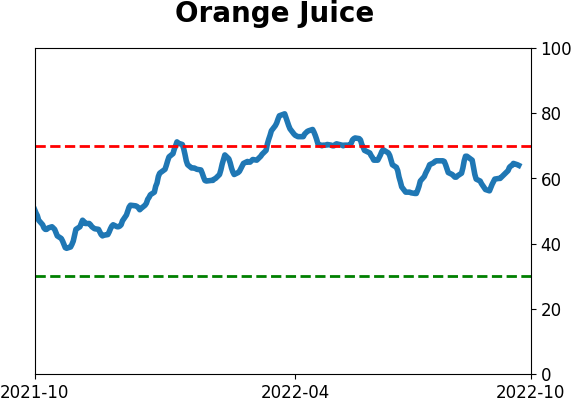
Commodity ETF's - 5-Day Moving Average
|
|