Headlines
|
|
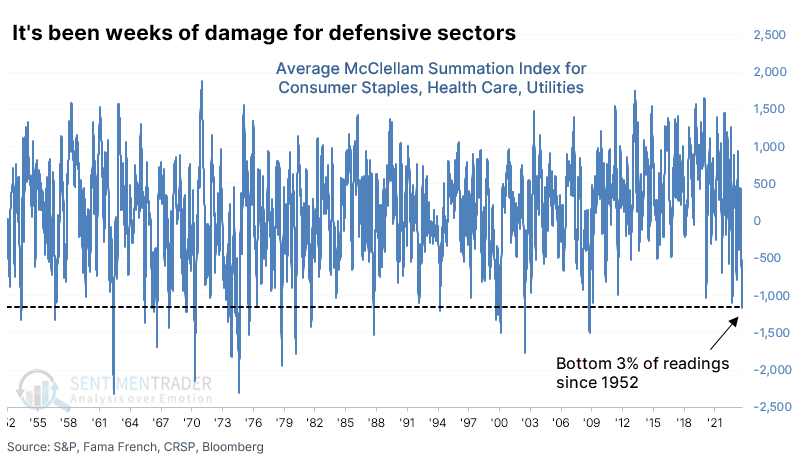
Defensive stocks witness a historic amount of damage:
Selling pressure among defensive sectors like Consumer Staples, Health Care, and Utilities has reached an extreme level according to a variety of indicators. The average McClellan Summation Index of the three sectors has dropped into the bottom 3% of all days since 1952. Similar extremes typically led to rebounds in defensive stocks.
|
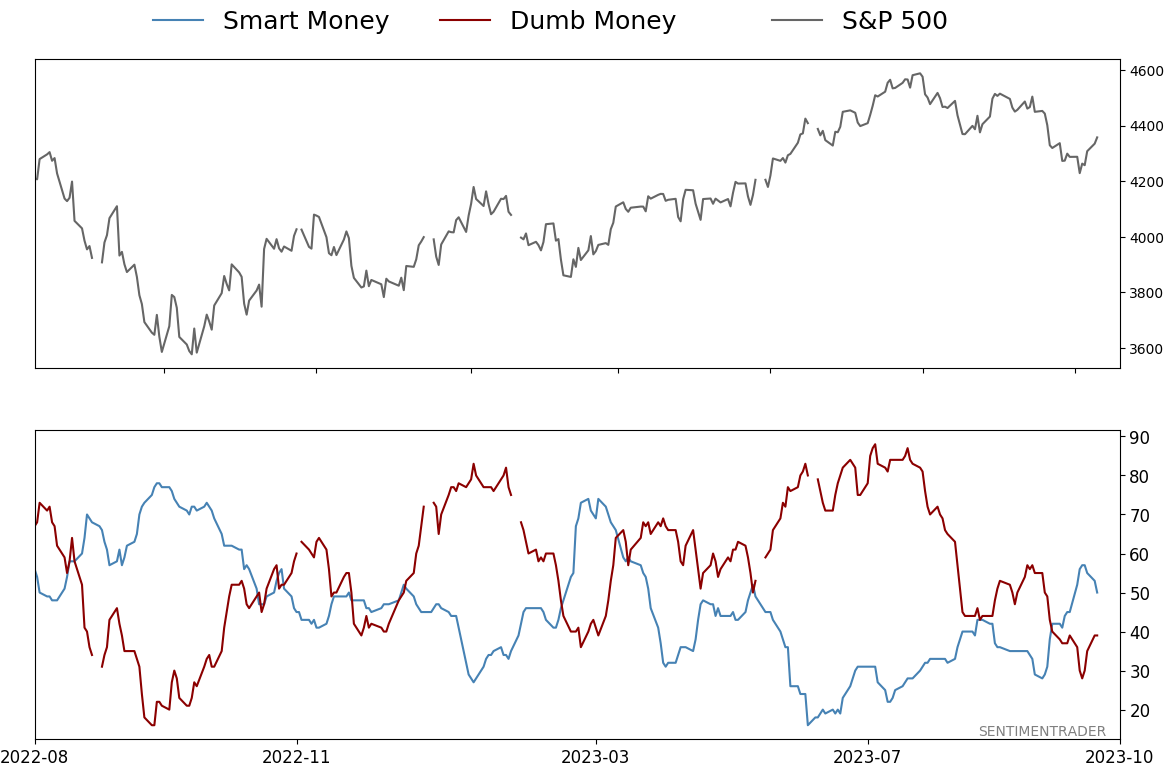
Smart / Dumb Money Confidence
|
Smart Money Confidence: 50%
Dumb Money Confidence: 39%
|
|
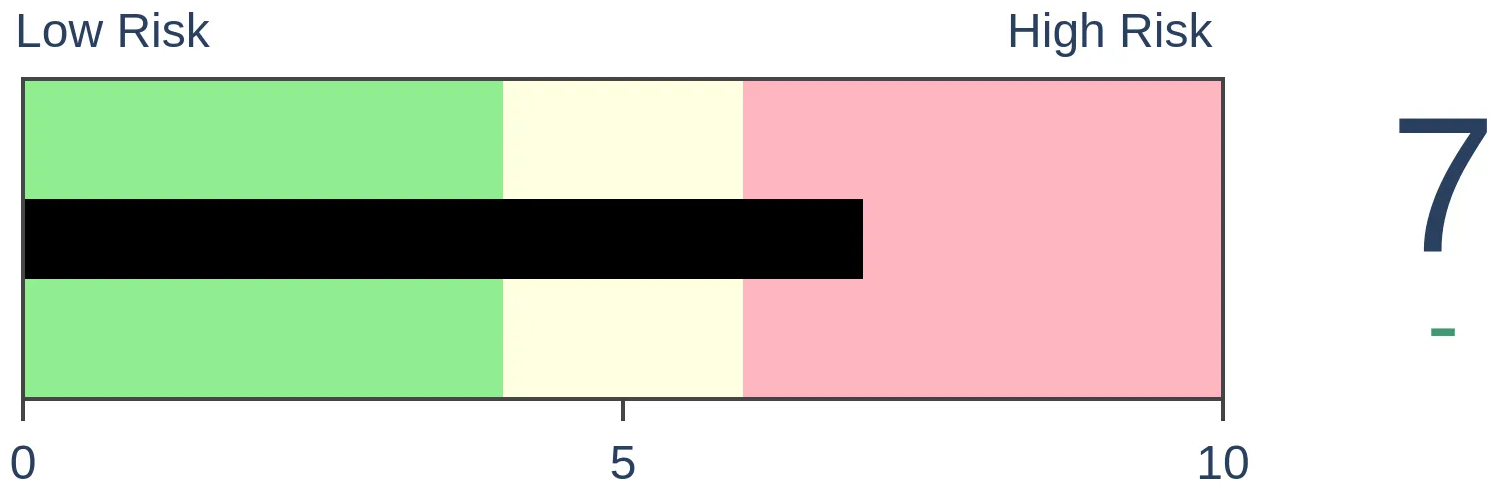
Risk Levels
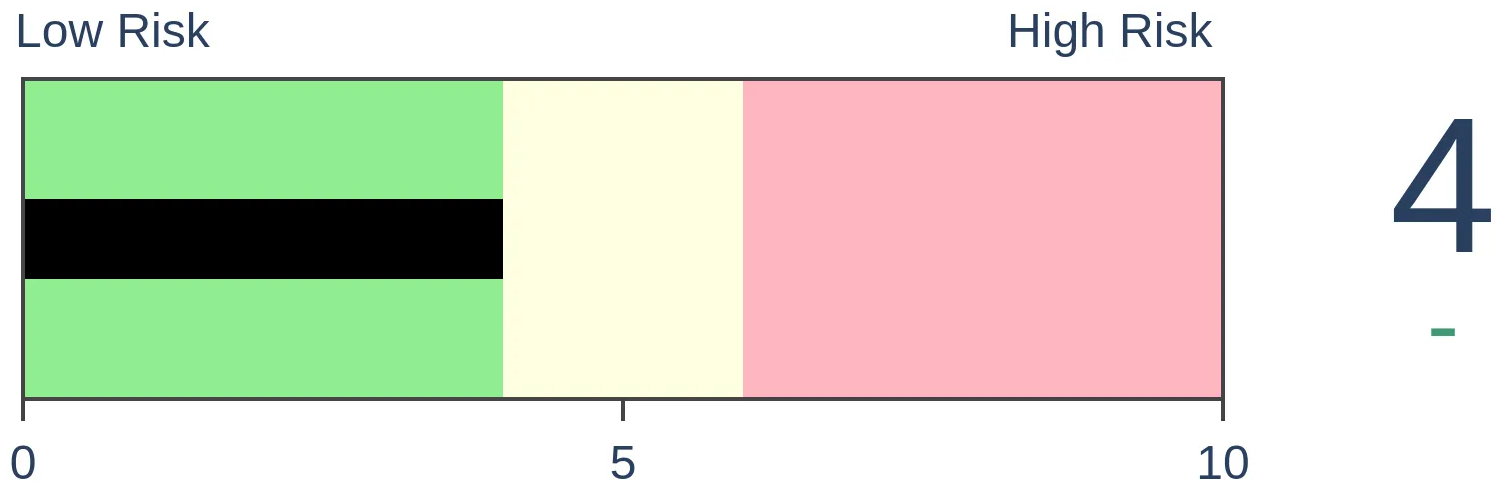
Stocks Short-Term
|
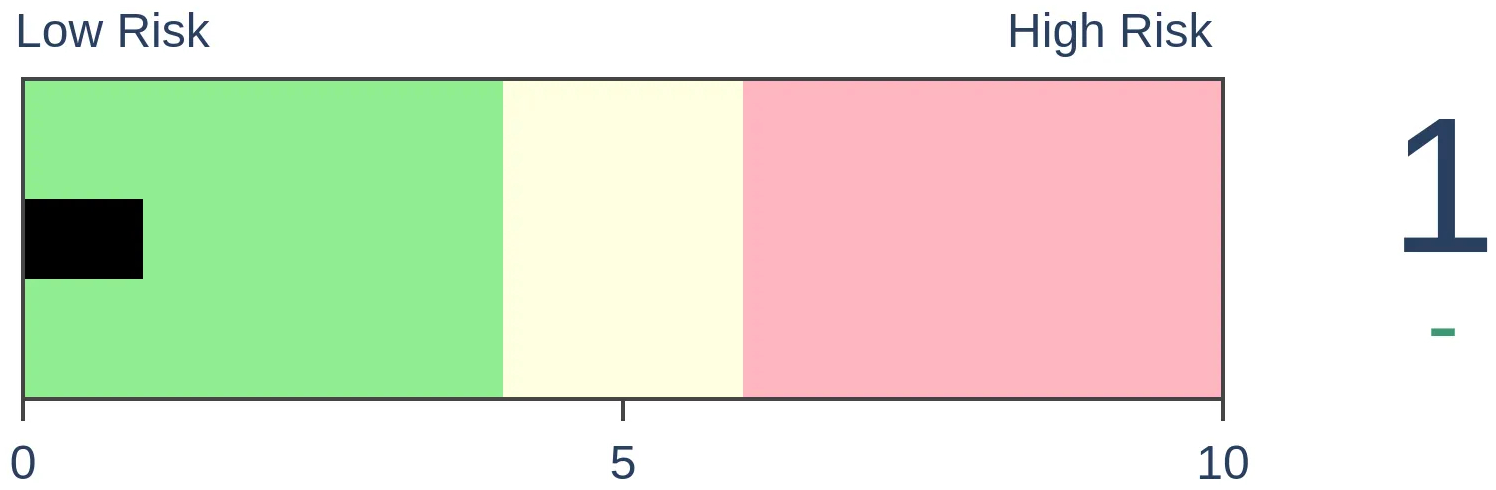
Stocks Medium-Term
|
|
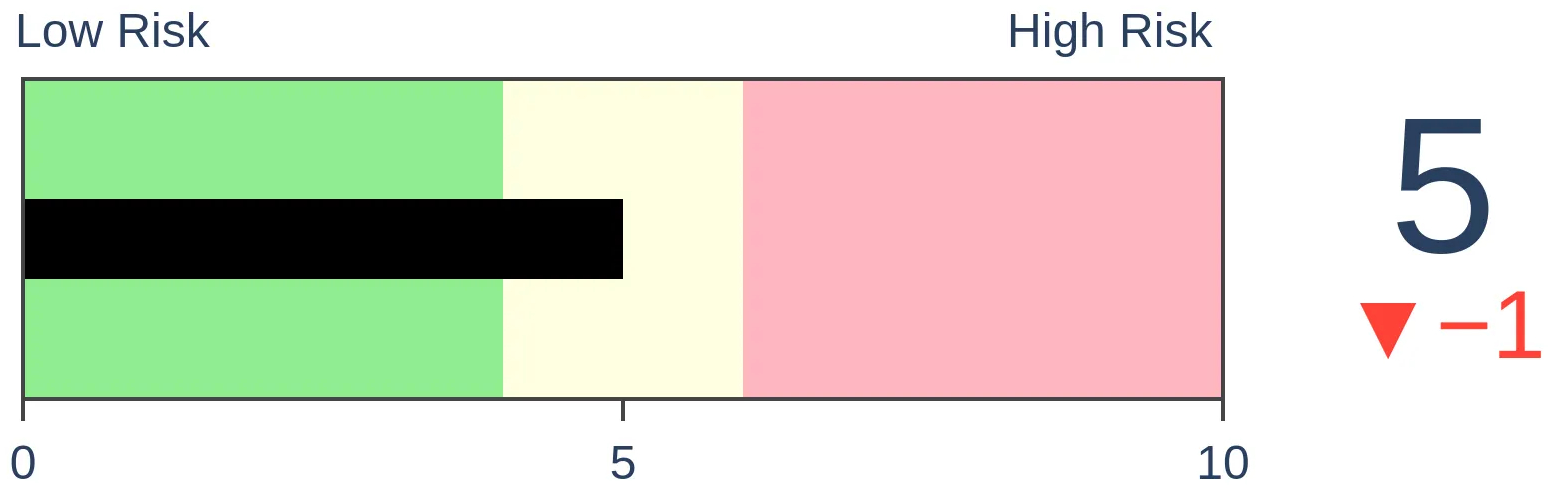
Bonds
|
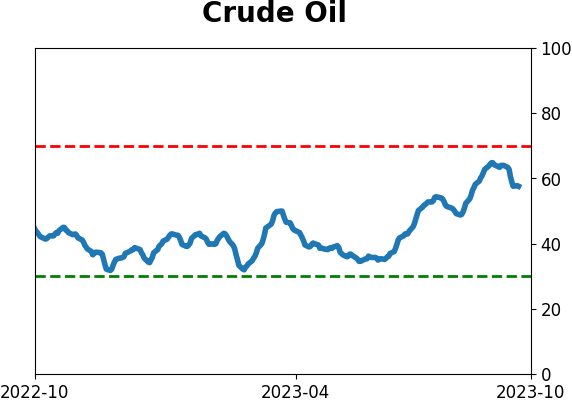
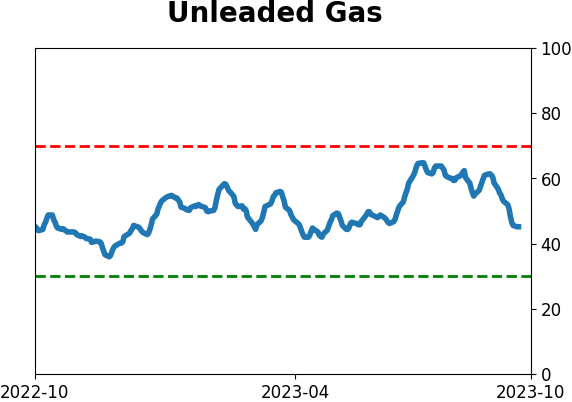
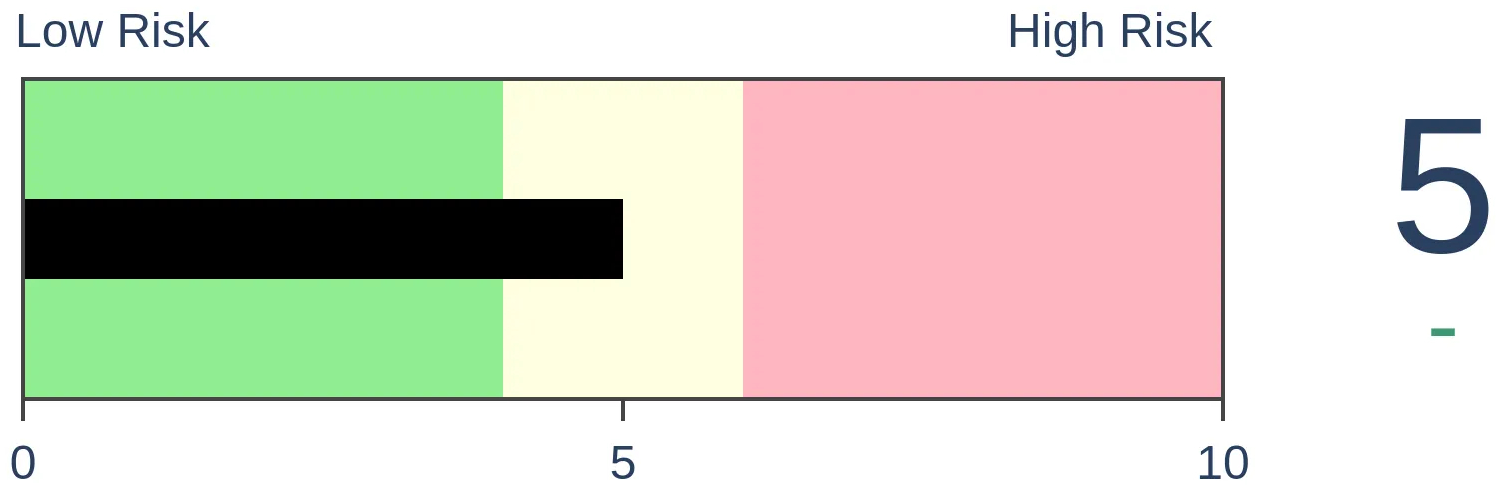
Crude Oil
|
|
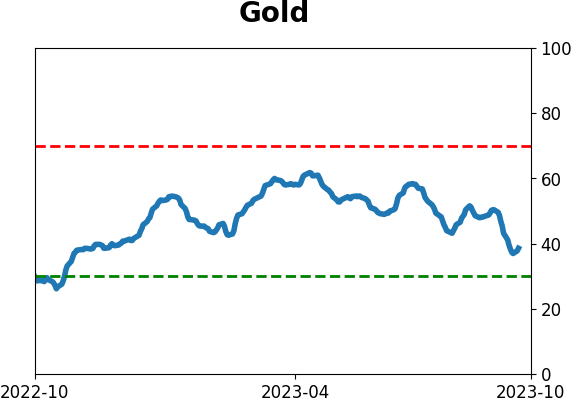
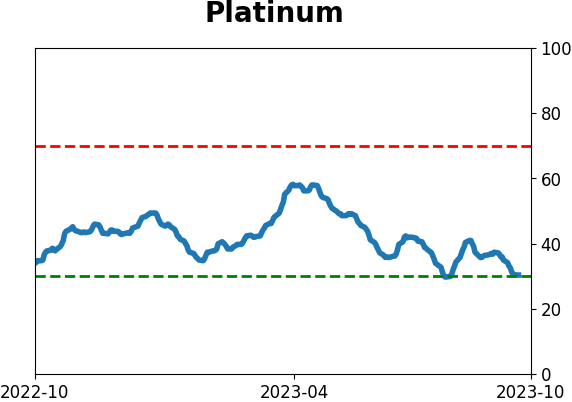
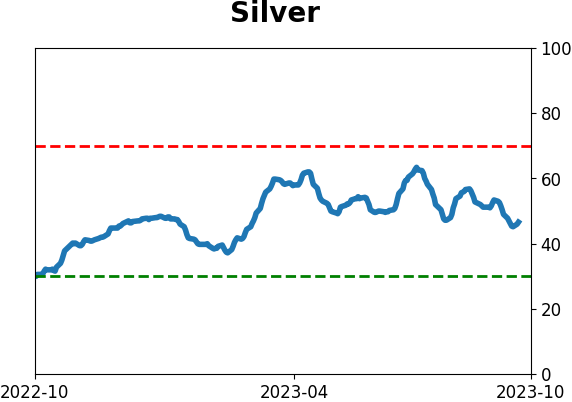
Gold

|
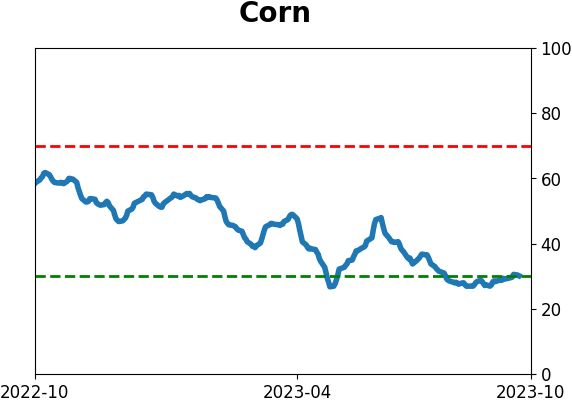
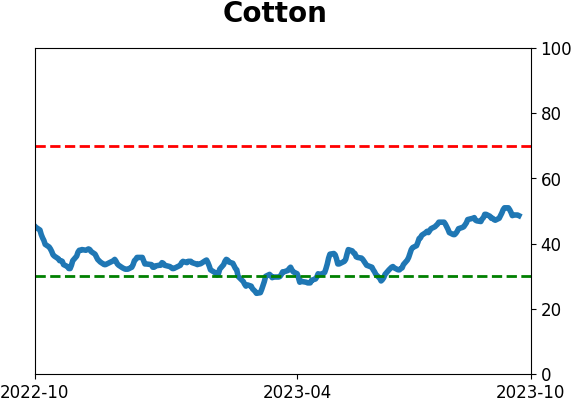
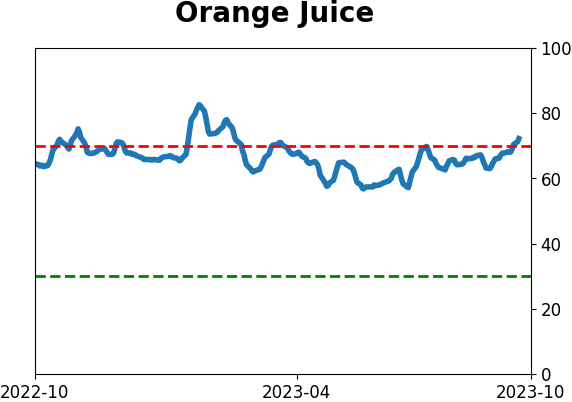
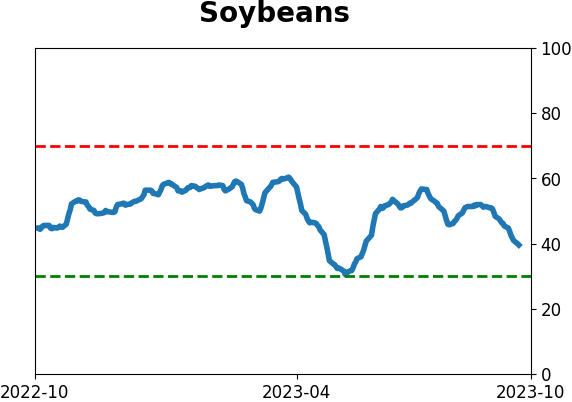
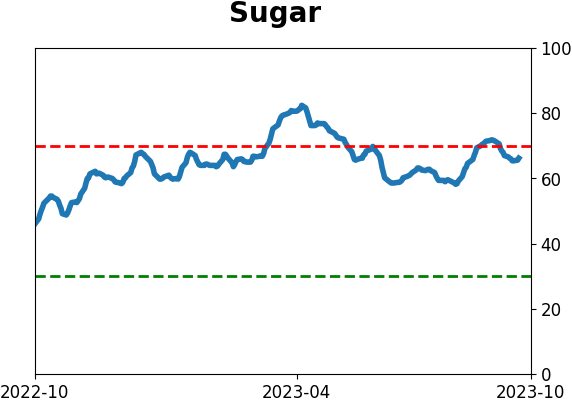
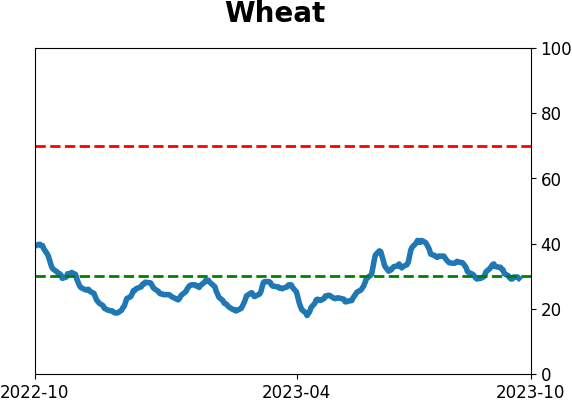
Agriculture
|
|
Research
By Jason Goepfert
BOTTOM LINE
Selling pressure among defensive sectors like Consumer Staples, Health Care, and Utilities has reached an extreme level according to a variety of indicators. The average McClellan Summation Index of the three sectors has dropped into the bottom 3% of all days since 1952. Similar extremes typically led to rebounds in defensive stocks.
FORECAST / TIMEFRAME
None
|
Key points:
- Internal selling pressure has reached extreme levels in typically defensive sectors
- In Consumer Staples, Health Care, and Utilities, indicators are reaching a historic level
- The stocks have typically generated renewed investor interest after registering similar extremes
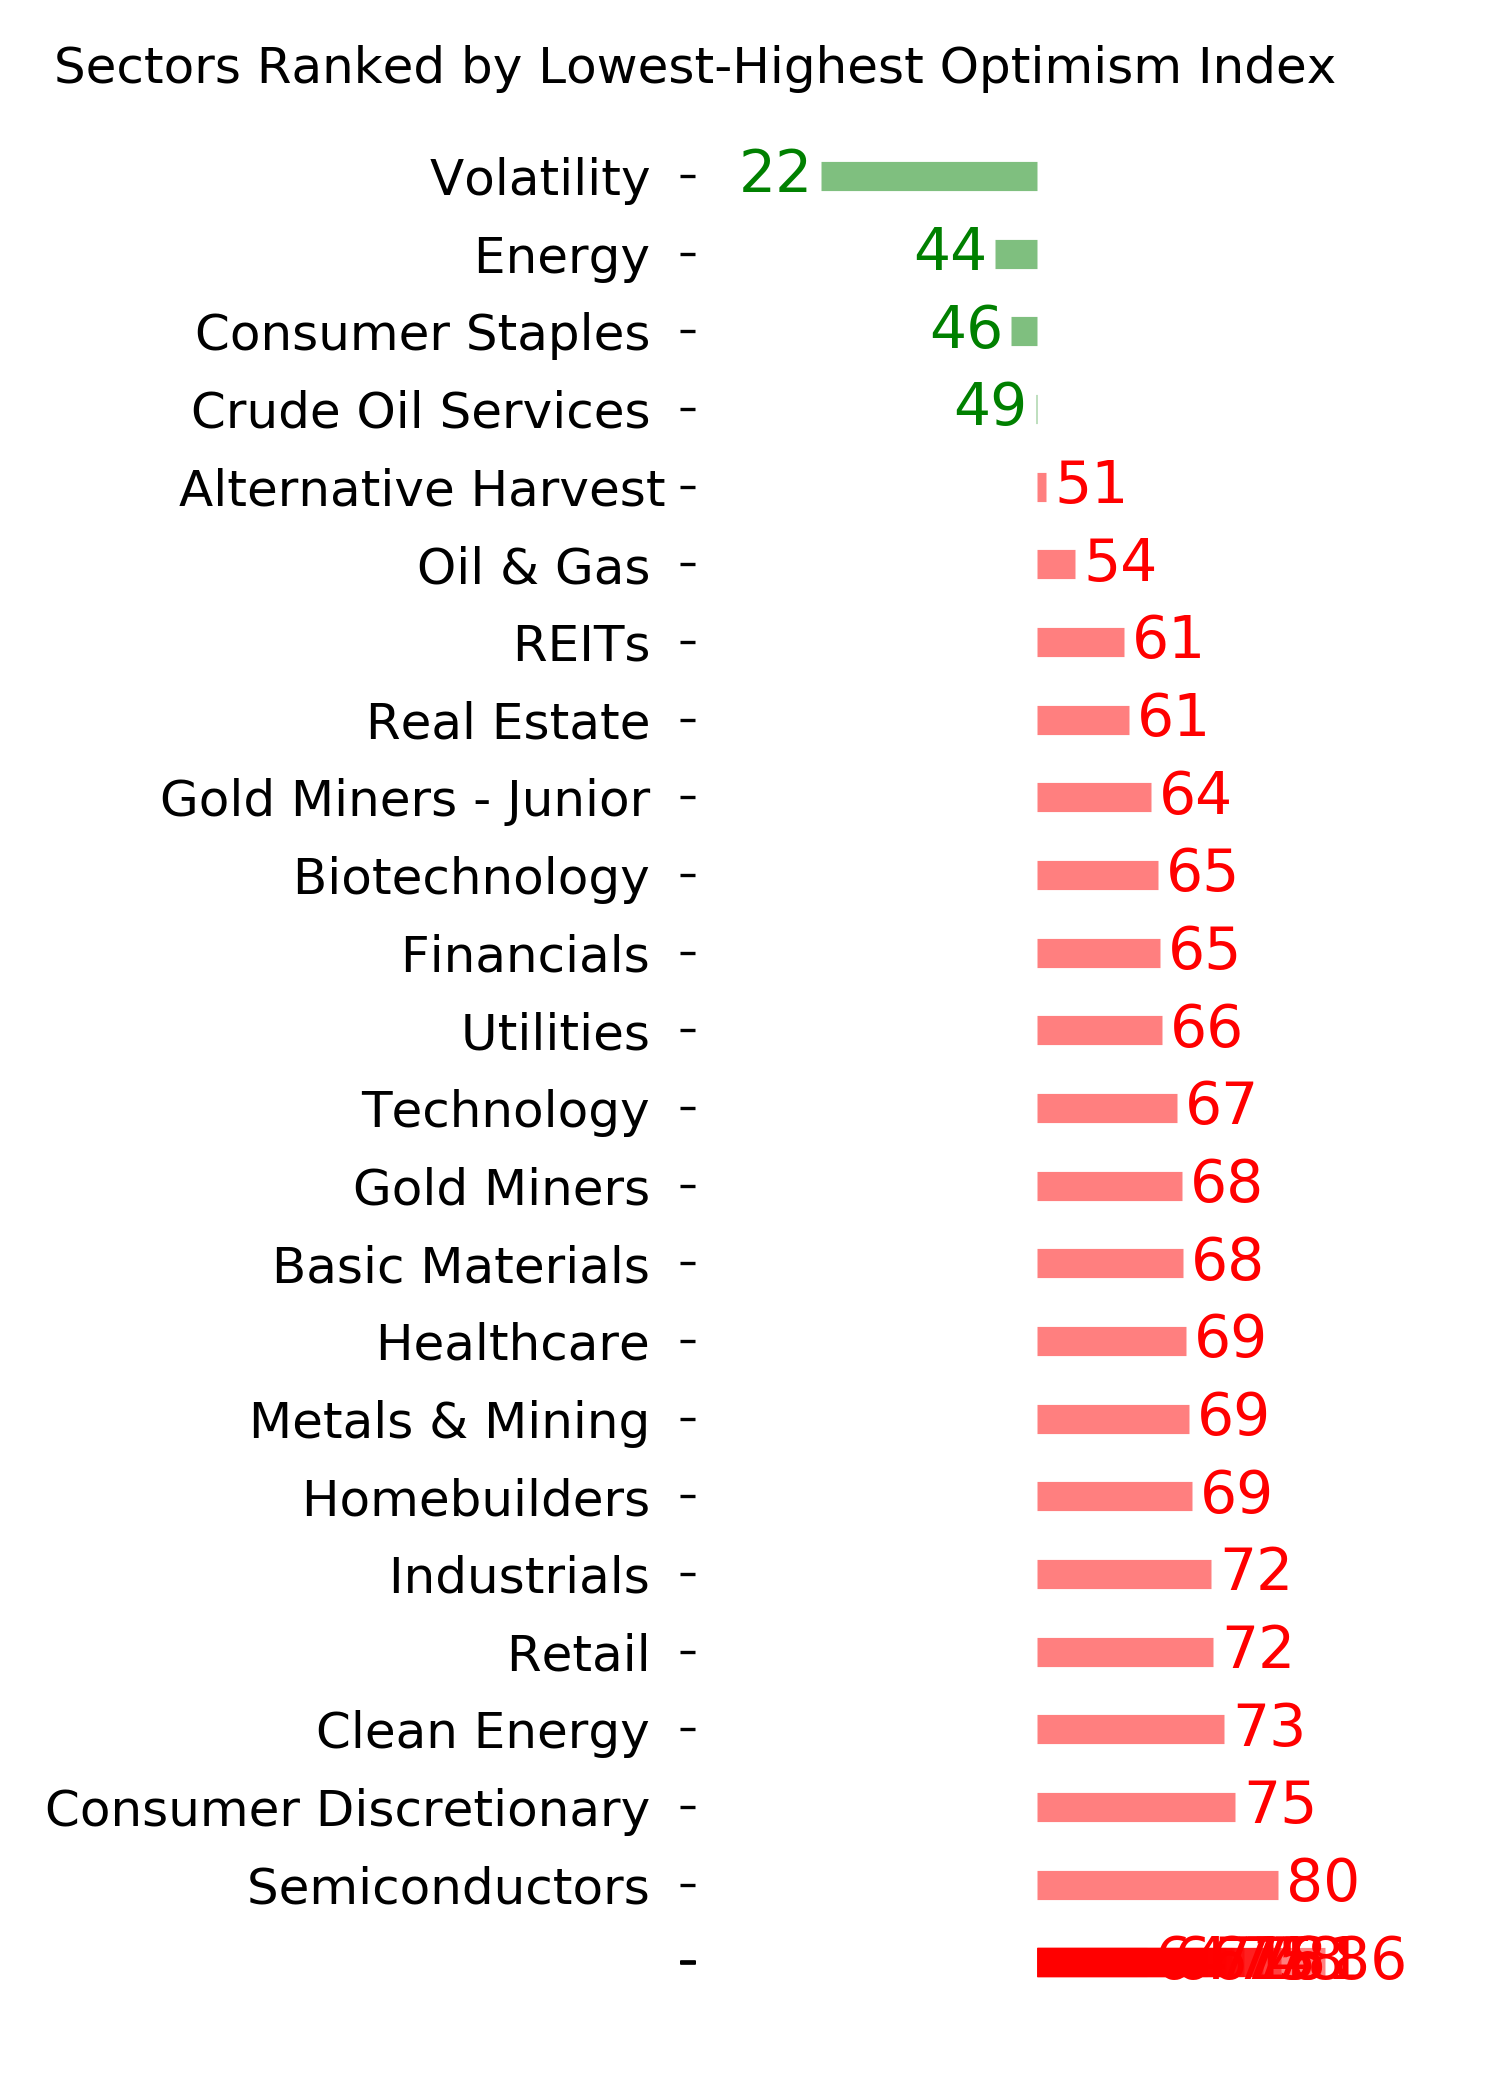
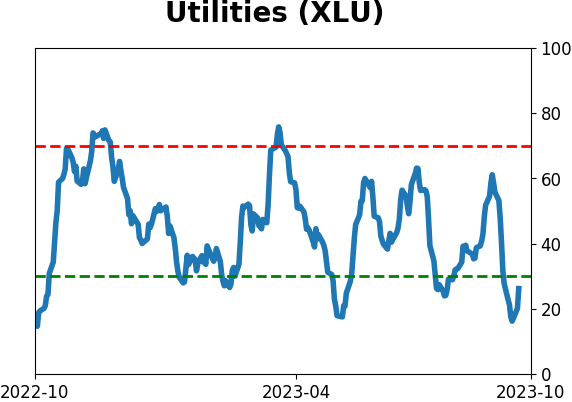
Defensive stocks haven't been so defensive
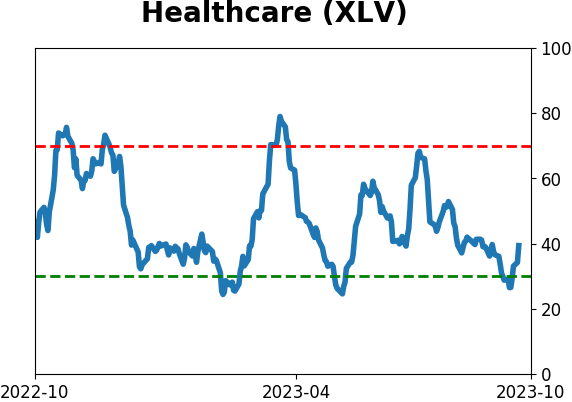
We saw on Monday that there has been significant internal damage in the Consumer Staples sector. It hasn't been limited to Staples, though - other defensive sectors like Health Care and Utilities have also been hit hard. So much for "defensive."
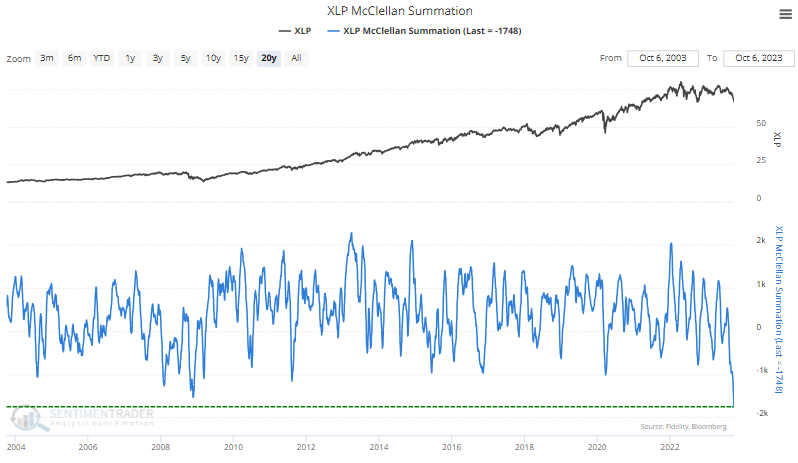
As noted yesterday, the McClellan Summation Index for Staples is at more than a 20-year low.
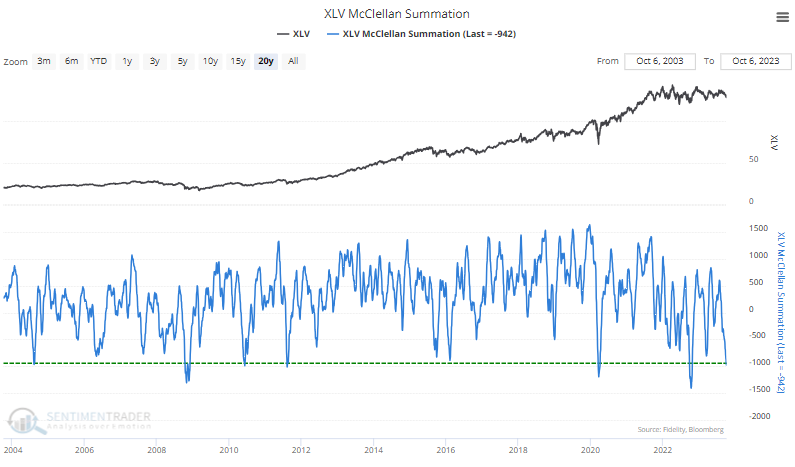
It isn't quite that extreme for Health Care, but it's getting there. The Backtest Engine shows that XLV sported a positive one-year return after all 60 days when its Summation Index got this low, averaging +22%.
Among the most defensive sectors, Utilities have the least negative Summation Index. That's partly because the decline there was more of a quick plunge, and shorter-term indicators were showing historical extremes.
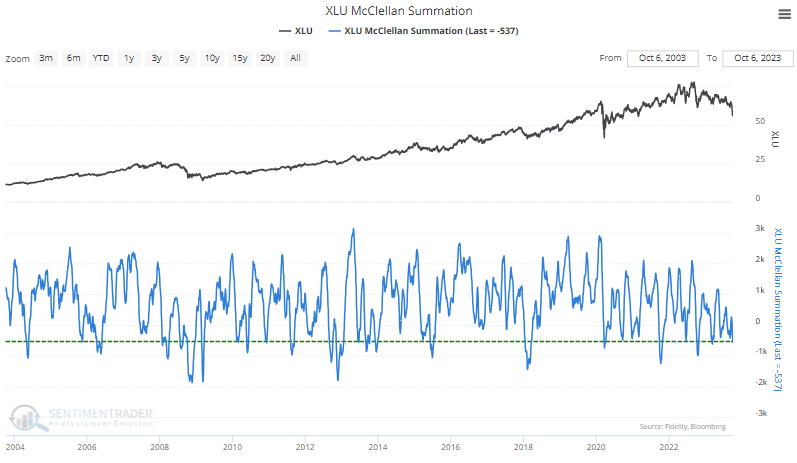
If we average the McClellan Summation Indexes for the three defensive sectors, we can see that it has declined to one of the lowest levels in 70 years. It's now in the bottom 3% of all days since 1952.
Deeply oversold readings mostly preceded mean reversion
The table below shows each time the average Summation Index declined below -1150 for the first time in at least a year and the forward total return in the Defensive factor afterward. There were a couple of double-digit declines within the first month as oversold got more oversold, but over the next 2-6 months, there were mostly gains or small losses. Signals in 1969 and 1973 led to losses over the next year, but those were the only two.
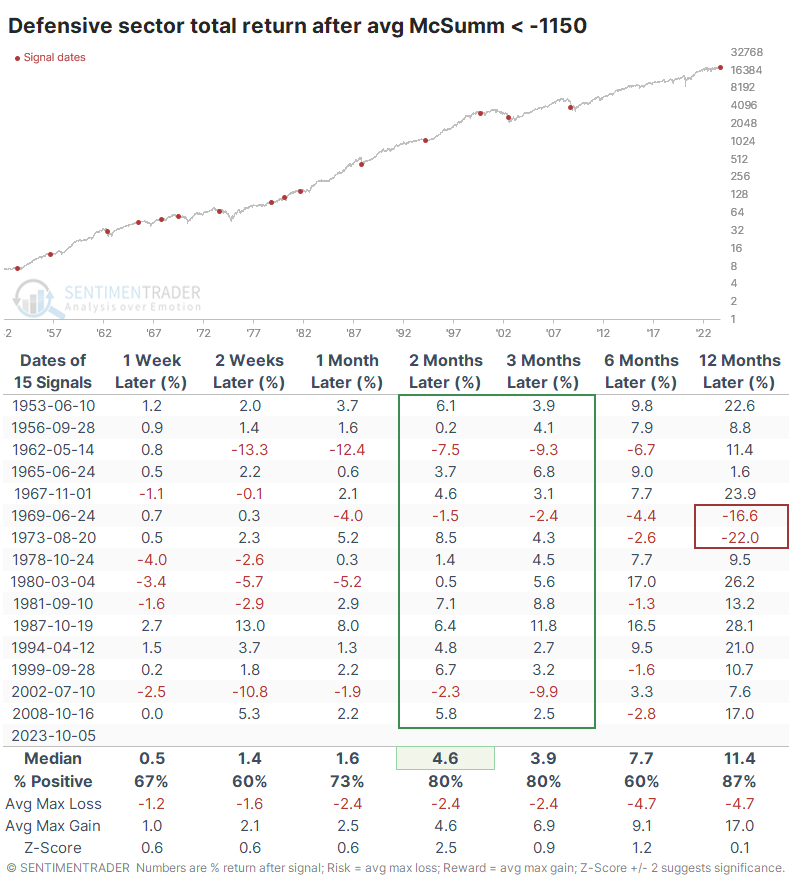
The risk/reward for Defensive stocks was mostly positive but not especially impressive. That's not unusual for a lower-volatility investment though we'd prefer to see it more skewed to the reward side. Across time frames, the return was better than random but only excessively so over the next two months.
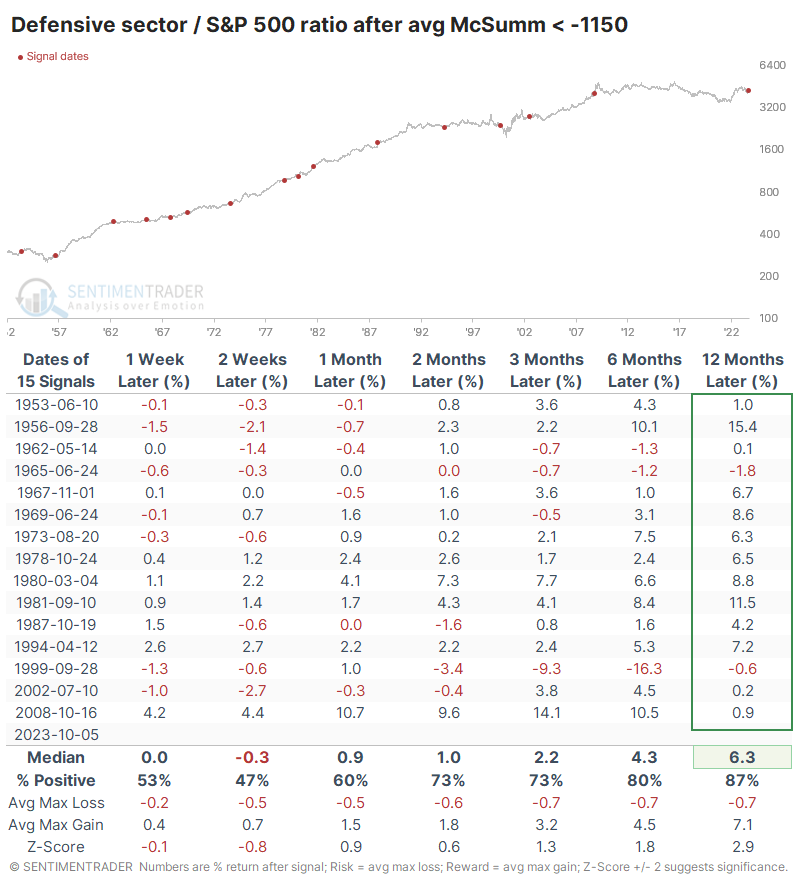
Relative to the S&P 500, it tended to outperform across medium- and long-term time frames. It got more impressive as time wore on, with only two signals failing to outperform over the next year.
What the research tells us...
A flurry of worries from the spike in interest rates to labor strikes to potentially seismic shifts in American dietary patterns thanks to new weight loss drugs have pounded stocks that had historically been looked upon as more defensive than the broader market.
The selling pressure has resulted in some compelling extremes across the three sectors and as an entire factor. The stocks have usually been able to generate renewed investor interest after getting hit like this, with a consistent pattern of positive returns from 3-12 months after signals like have been generated in recent days.
Indicators at Extremes
Phase Table
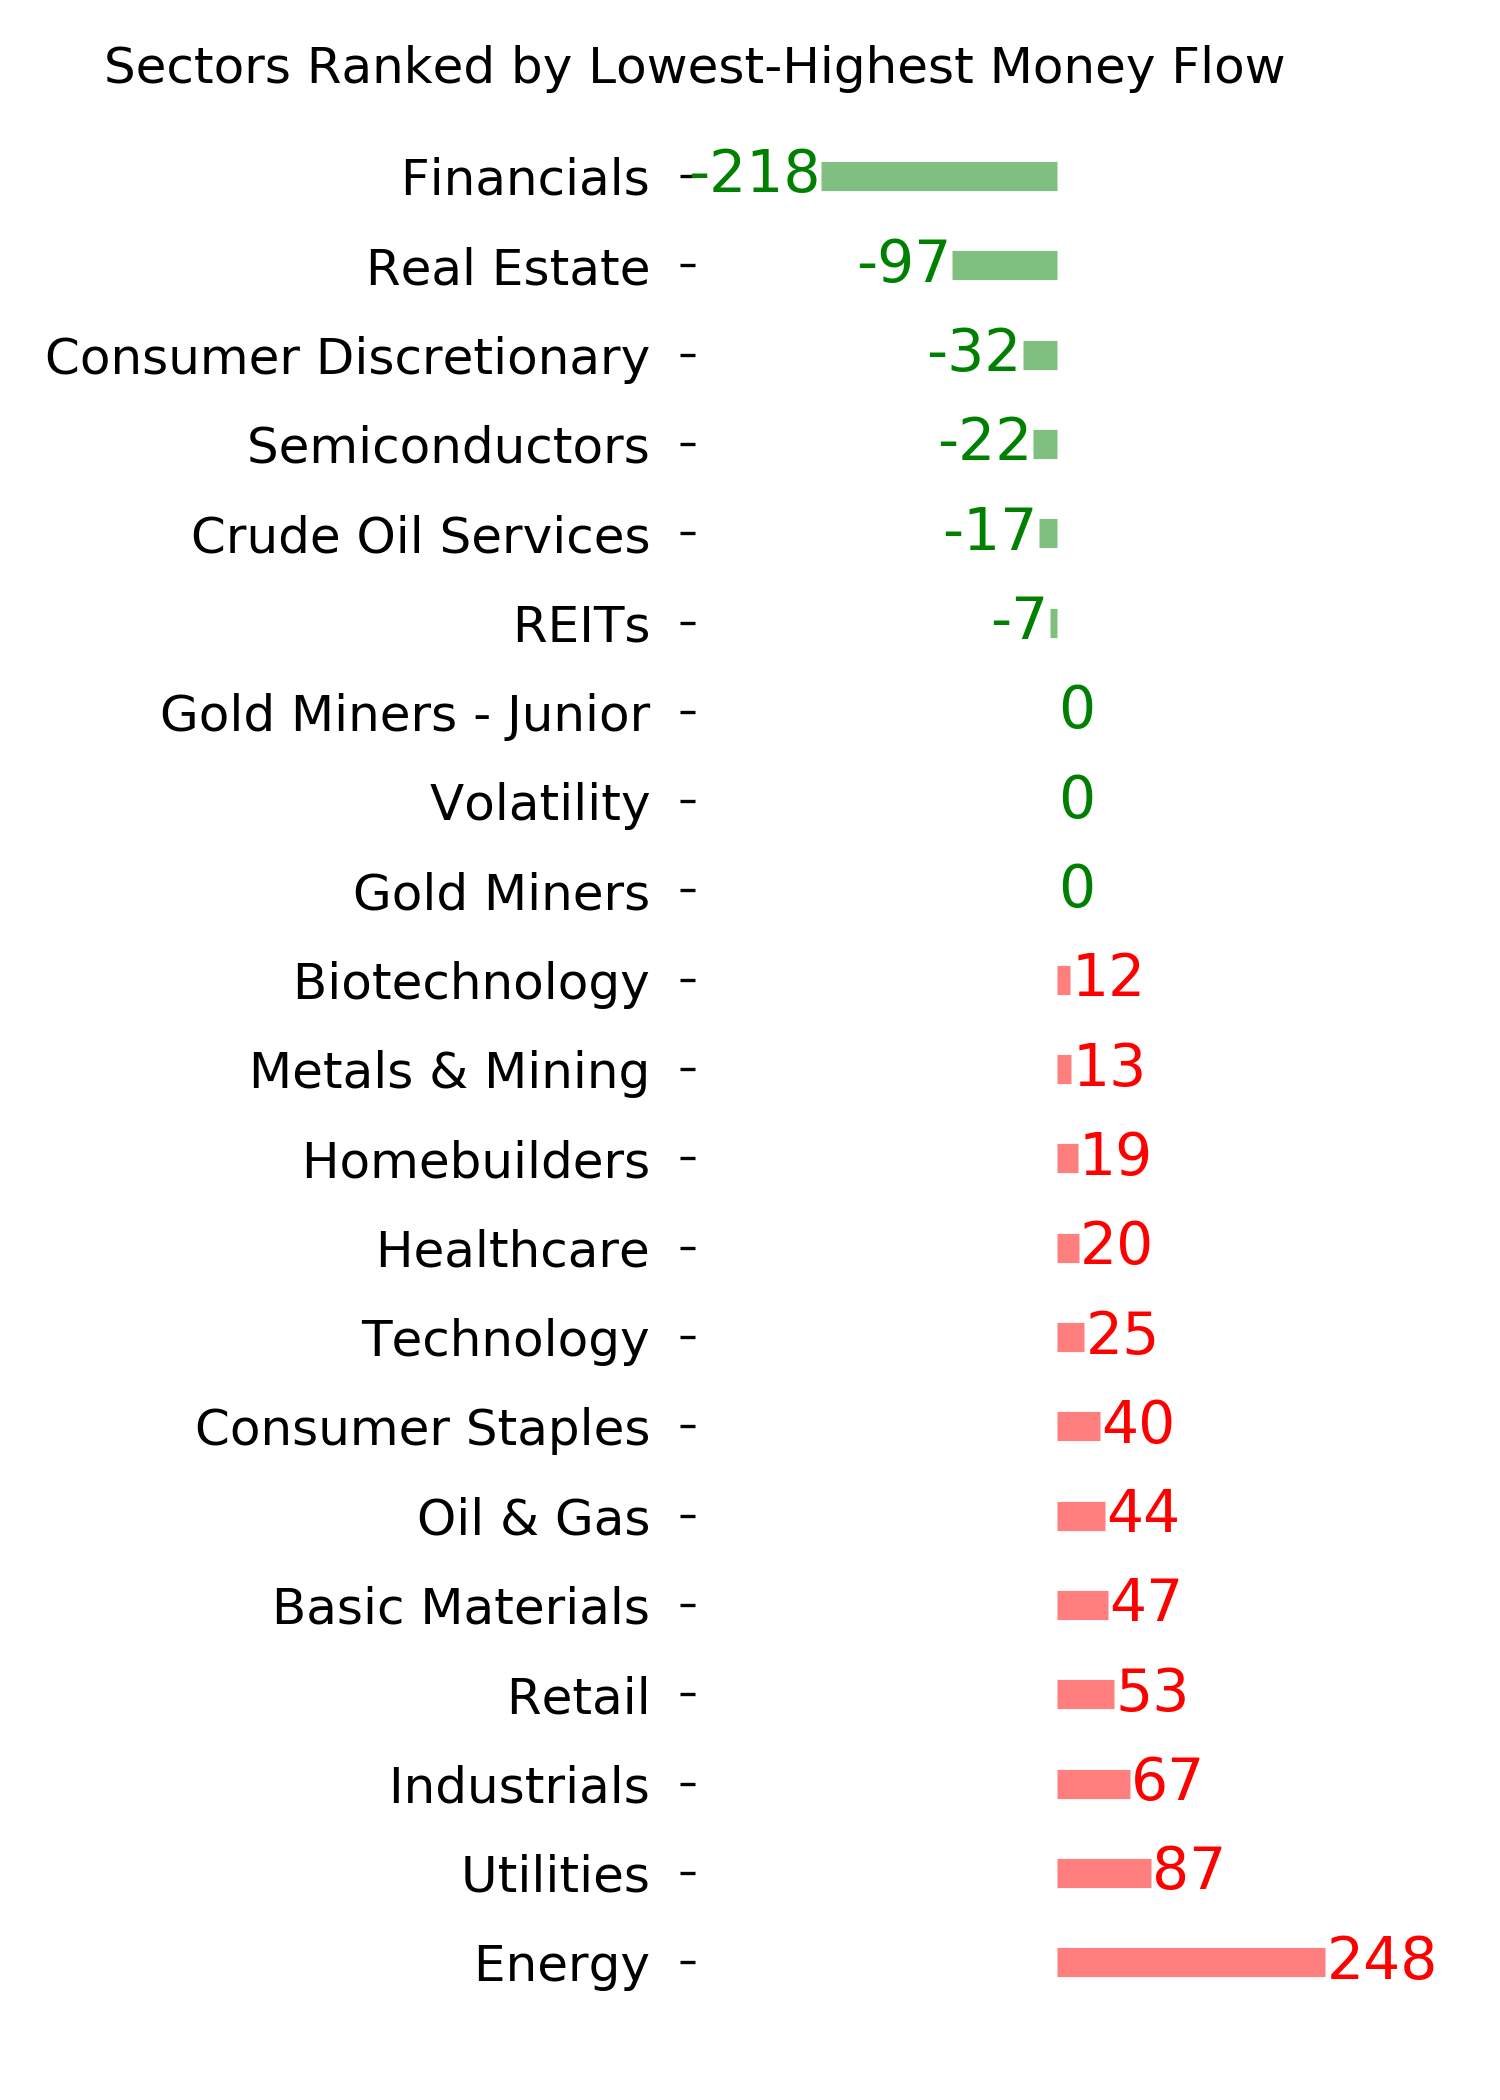
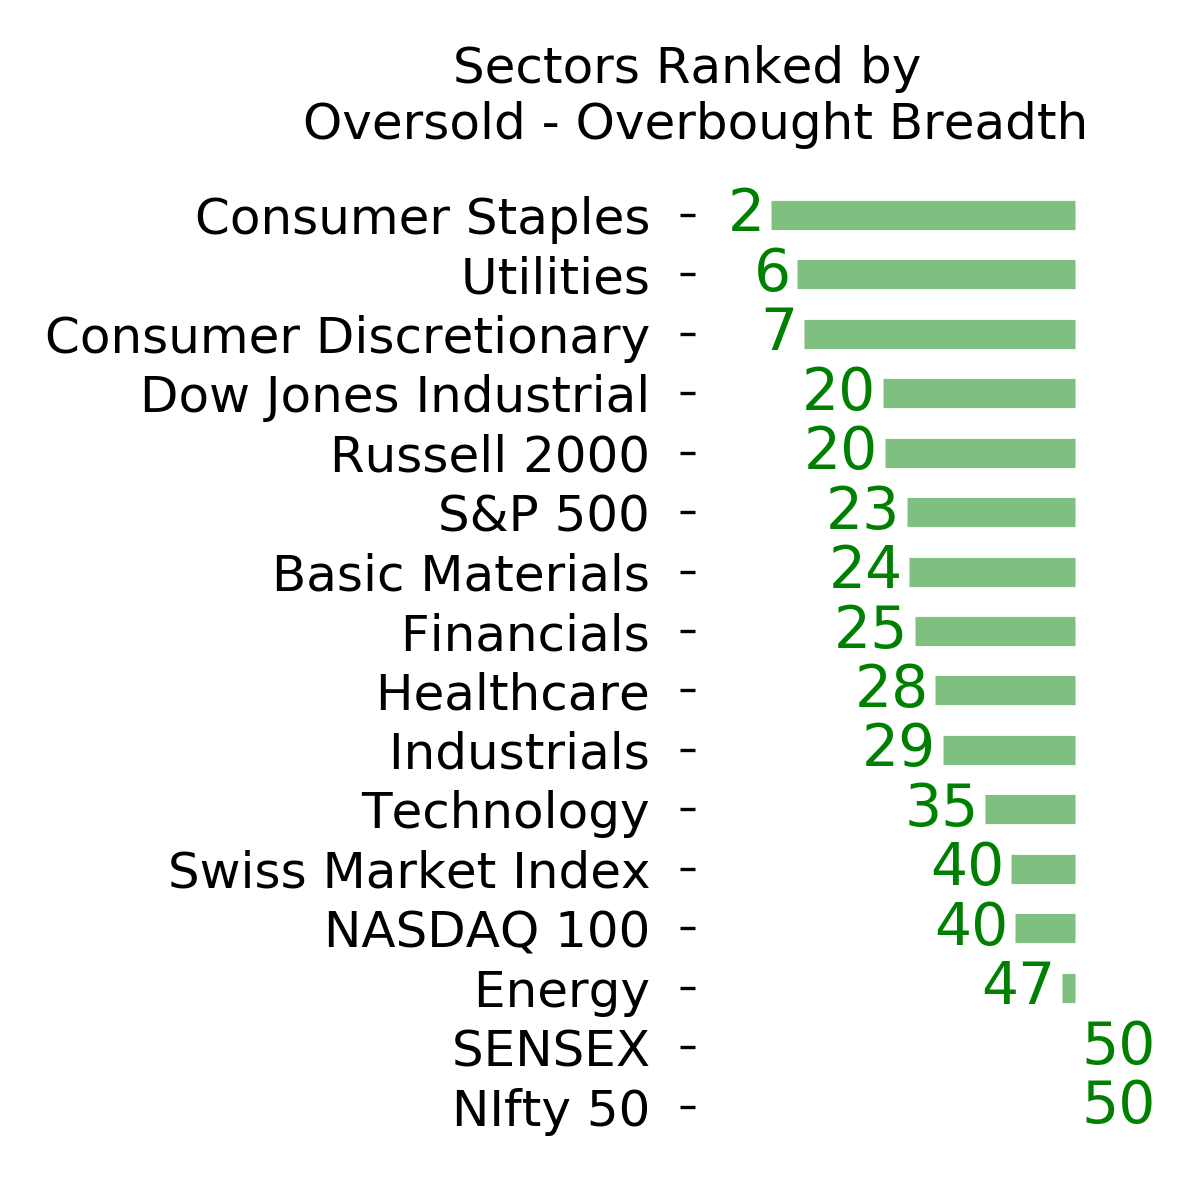
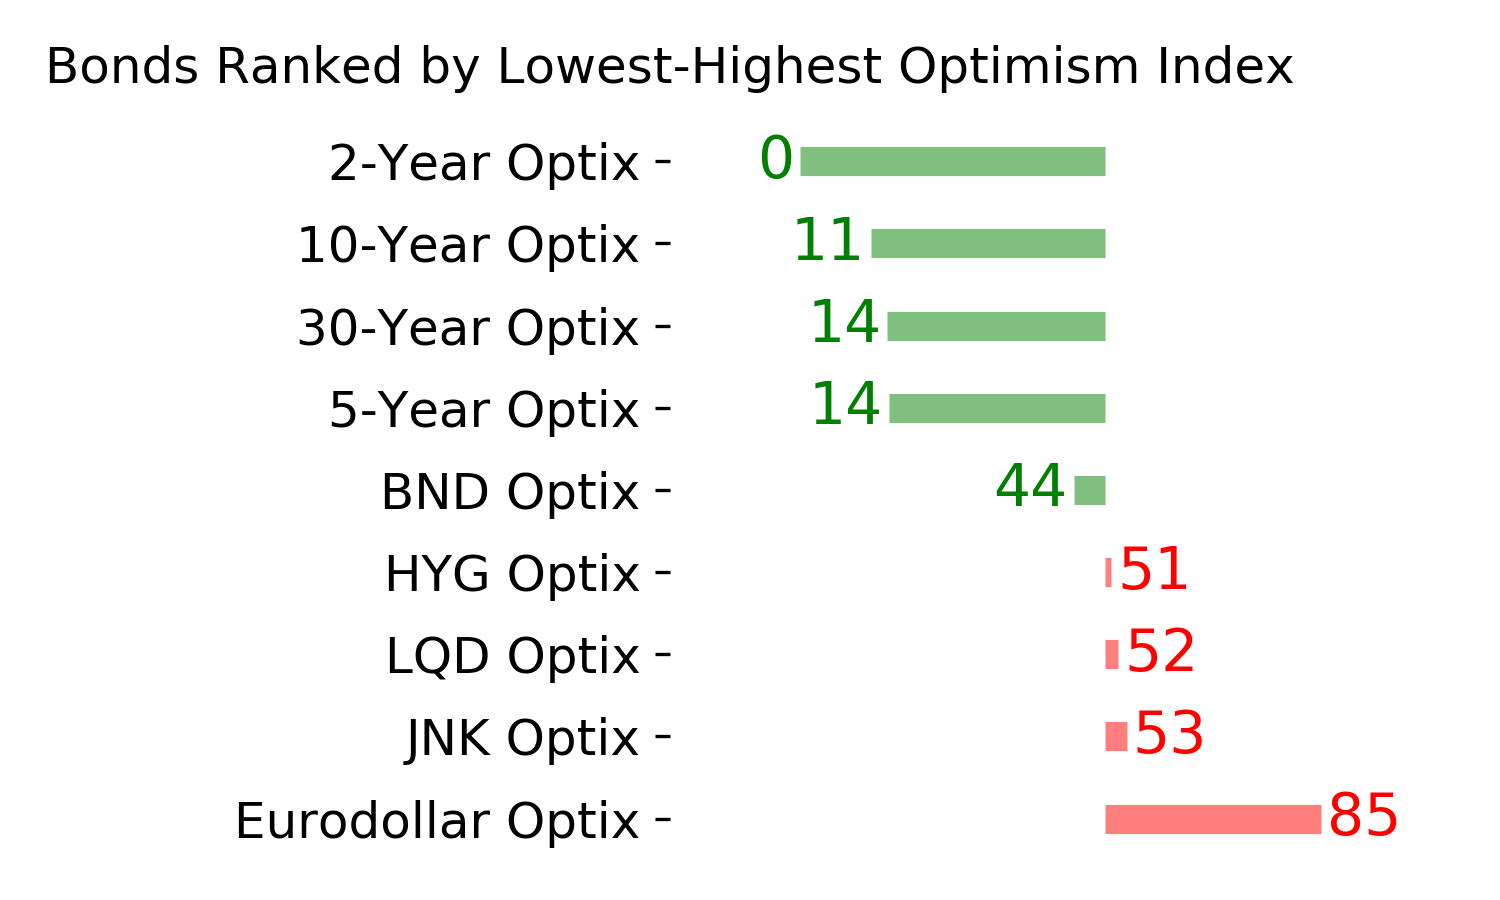
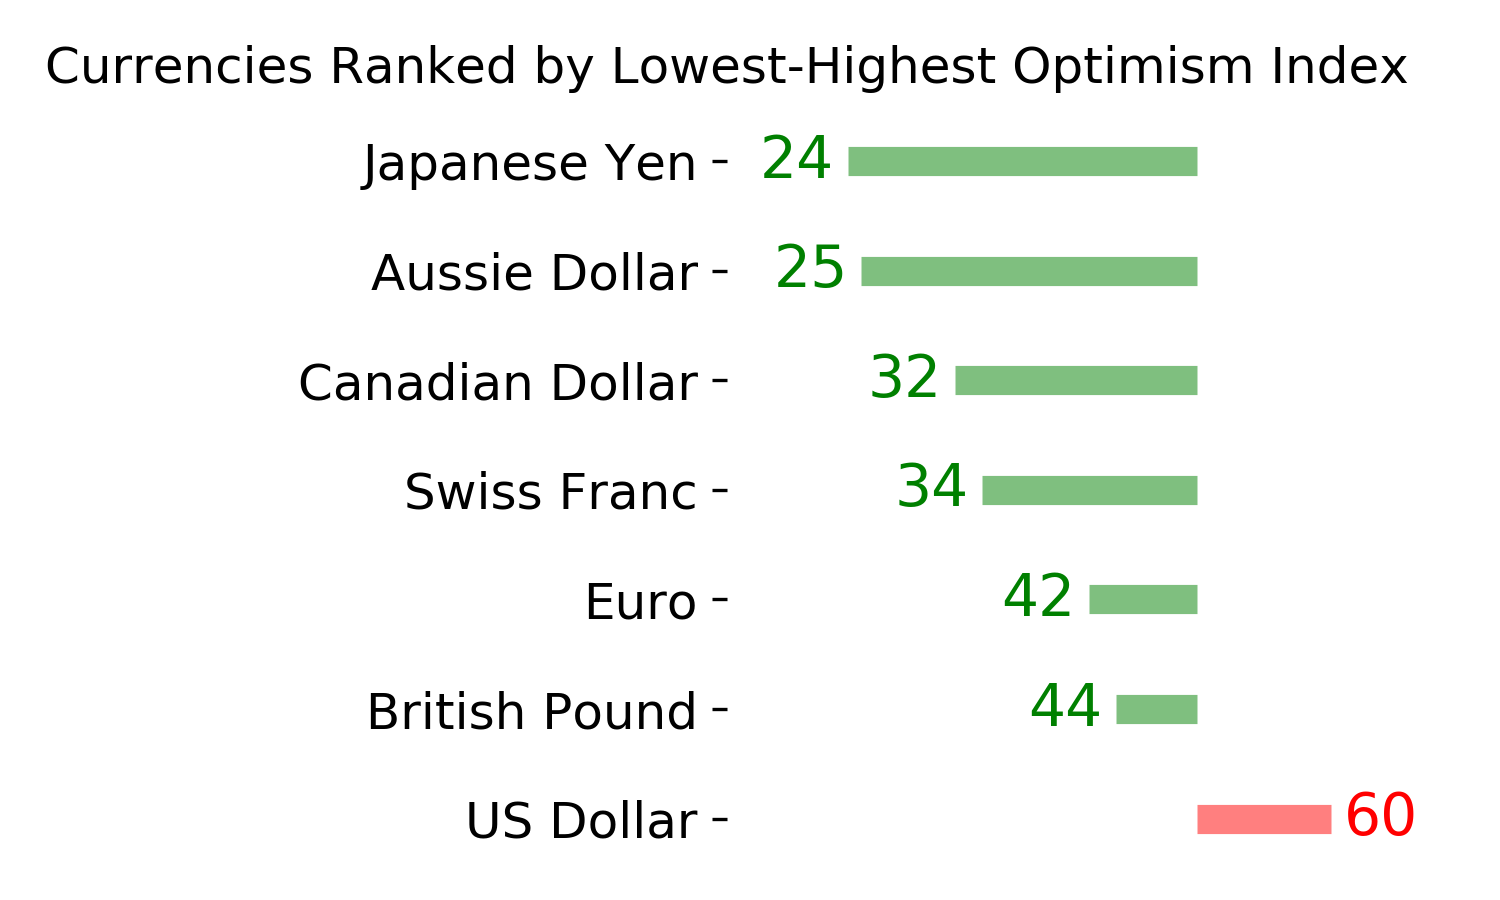
Ranks
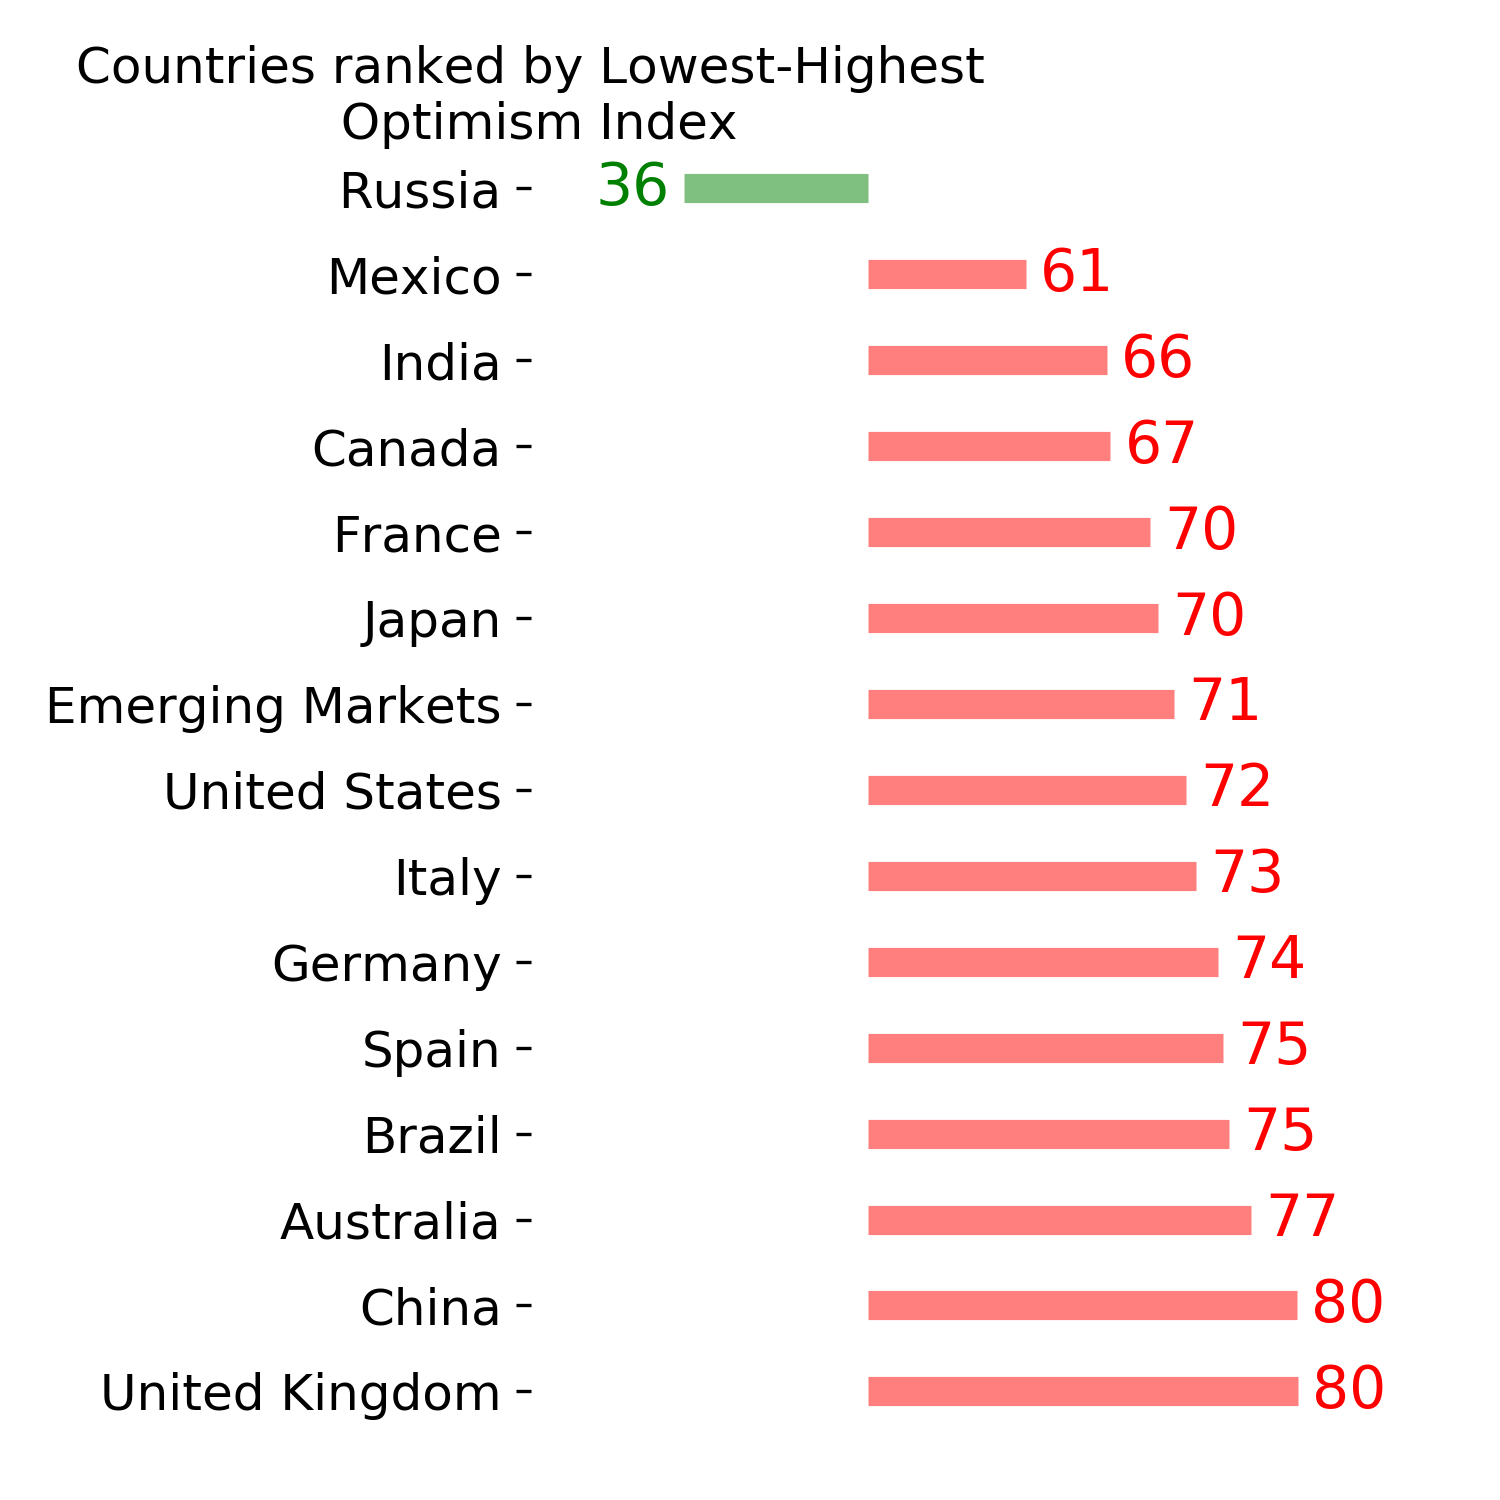
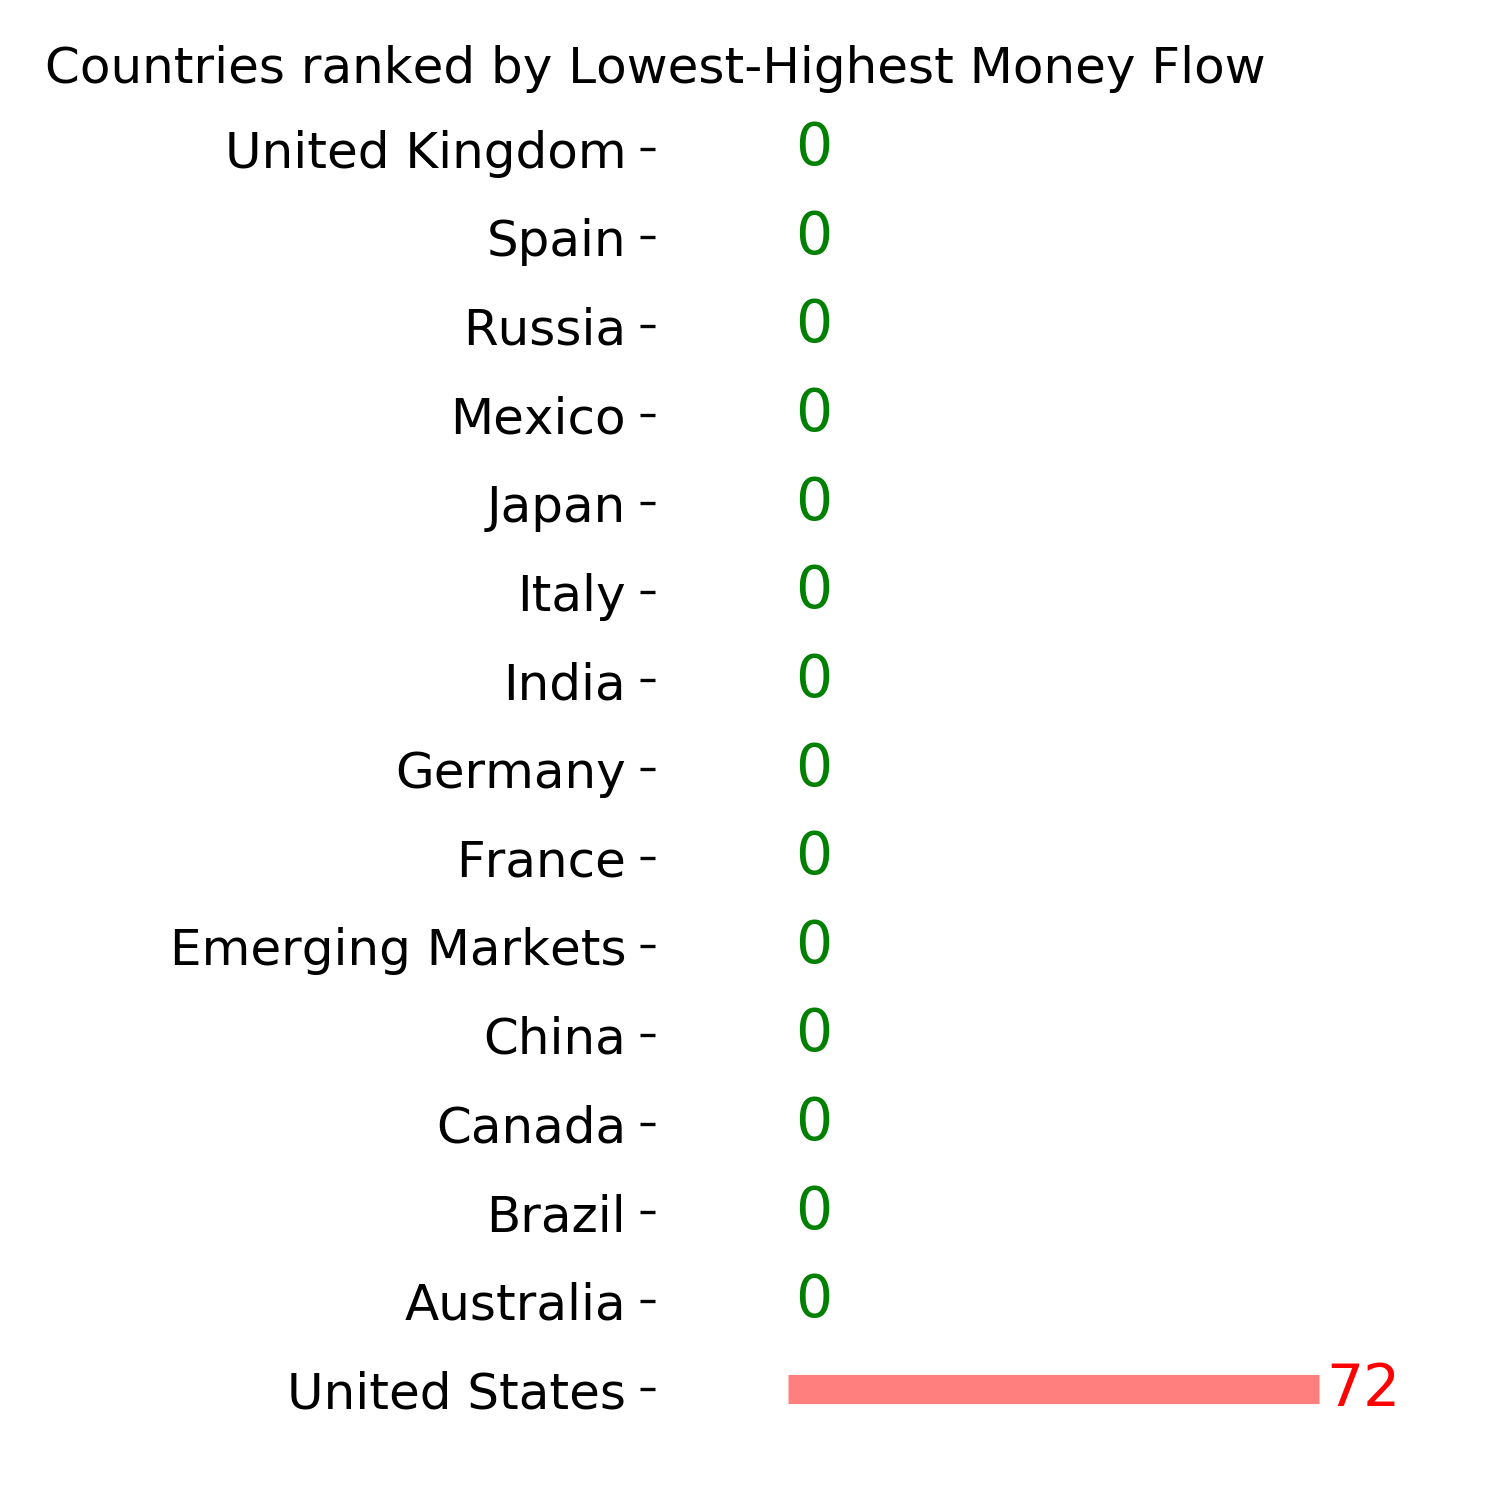
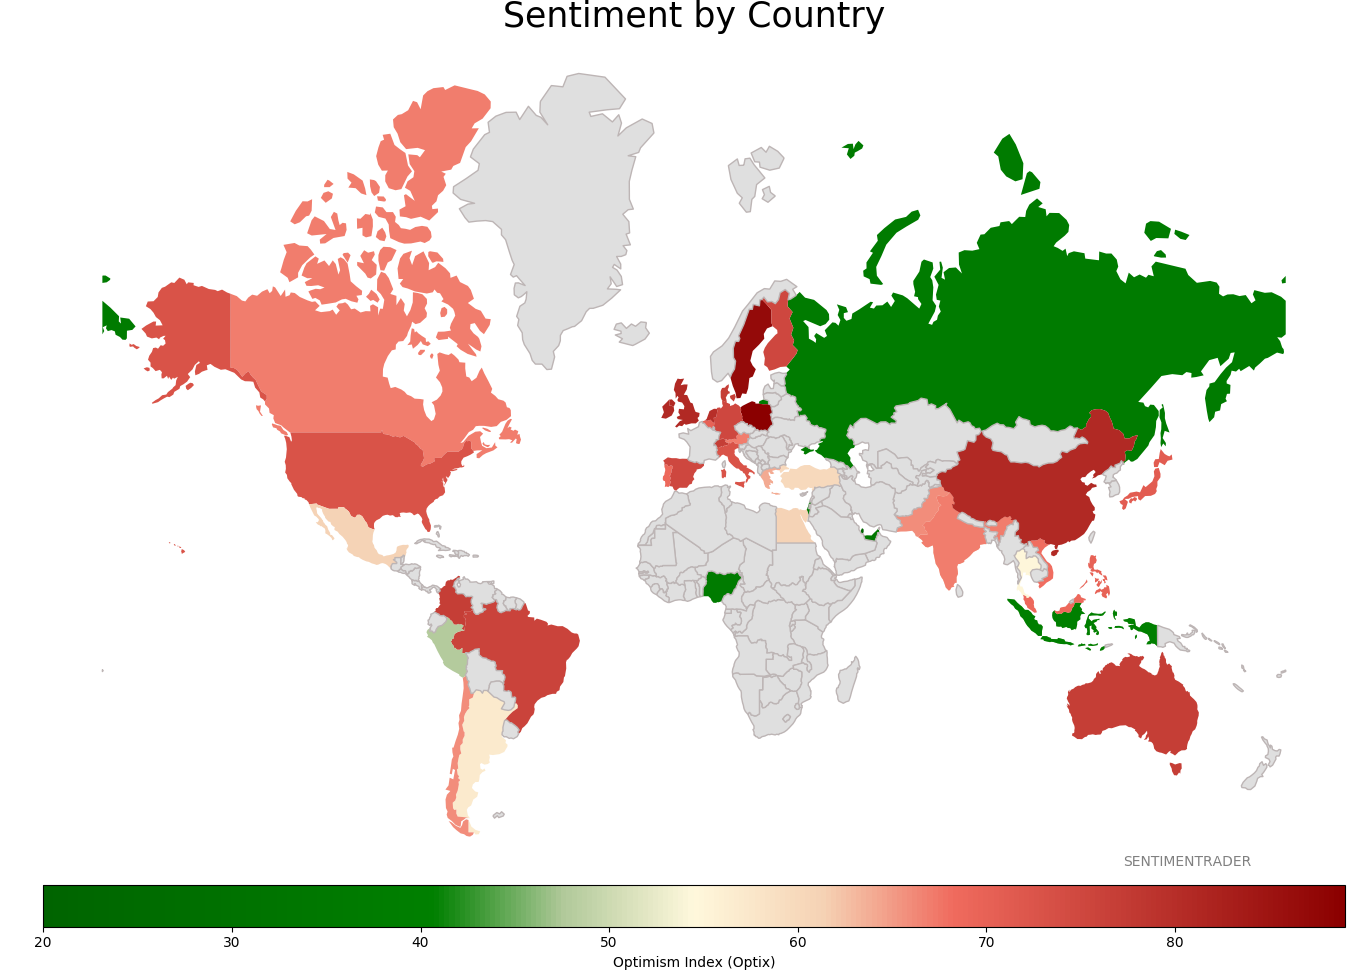
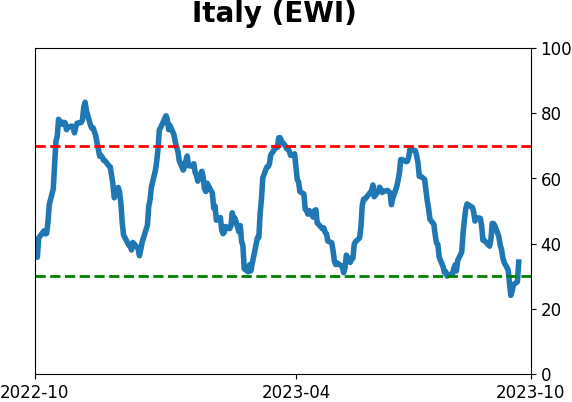
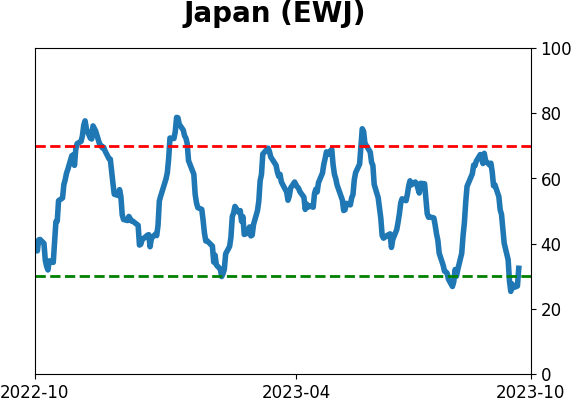
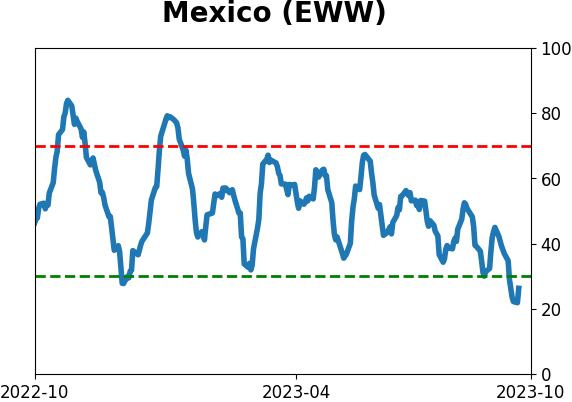
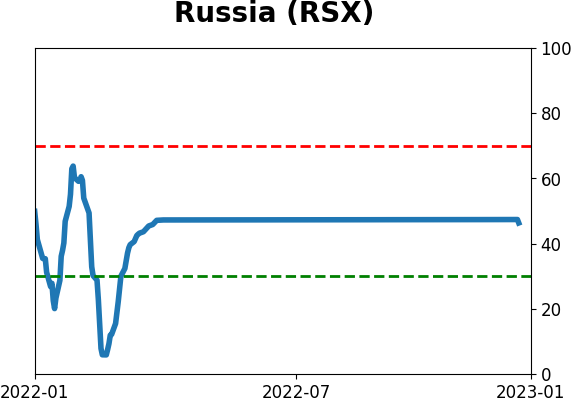
Sentiment Around The World
Optimism Index Thumbnails
|
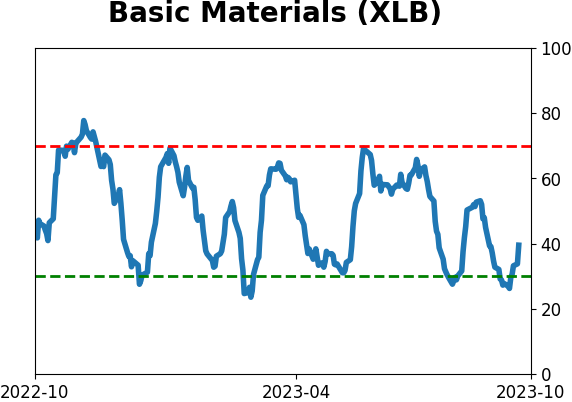
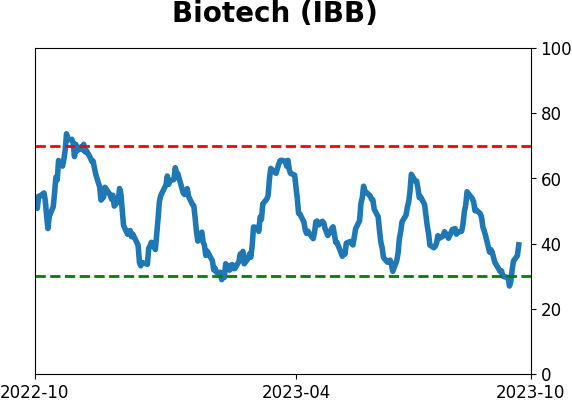
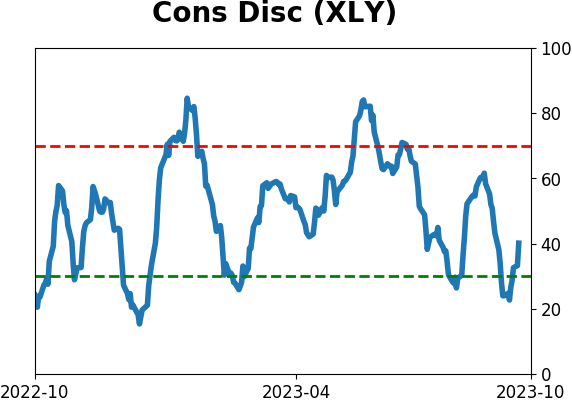
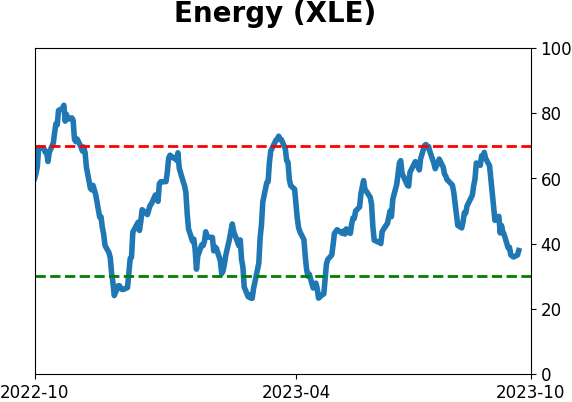
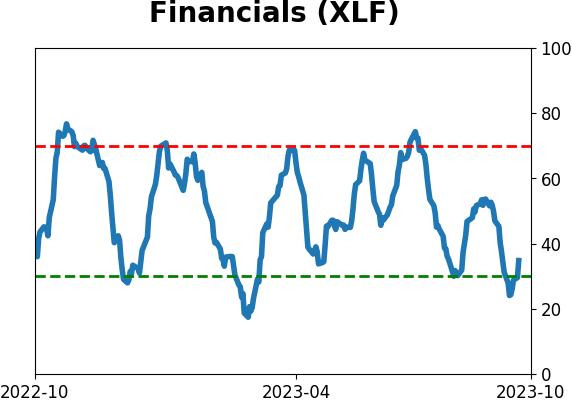
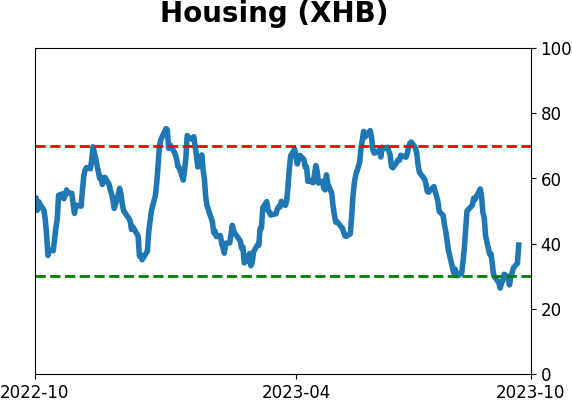
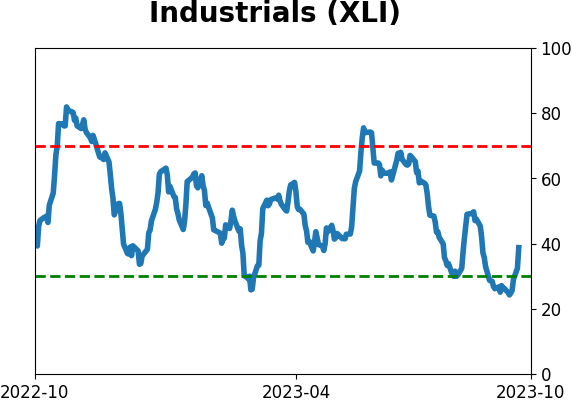
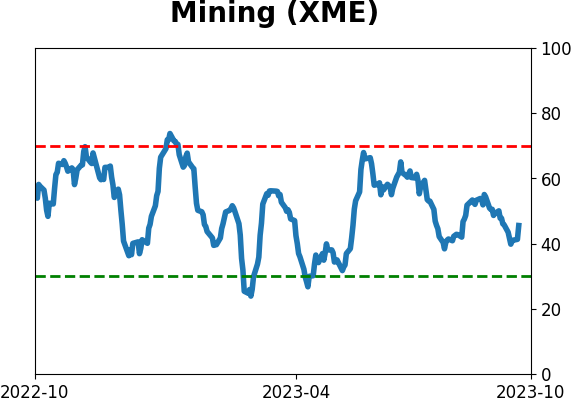
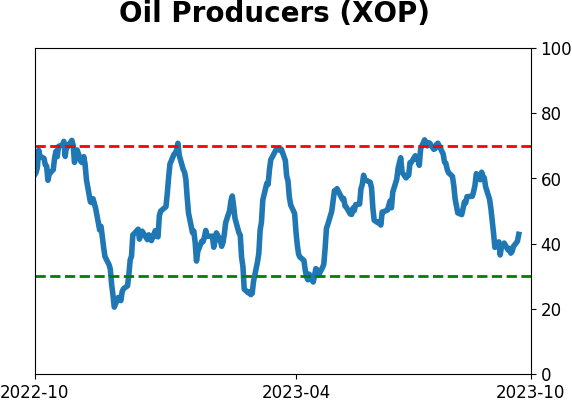
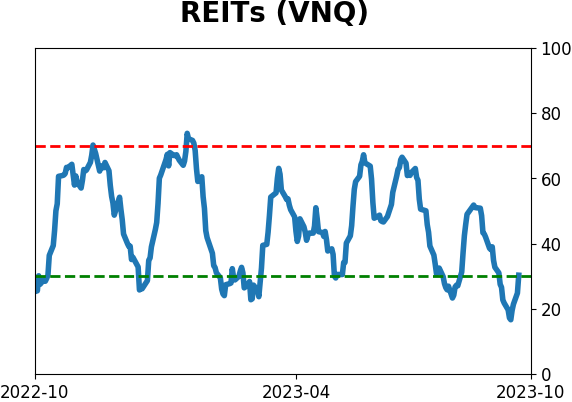
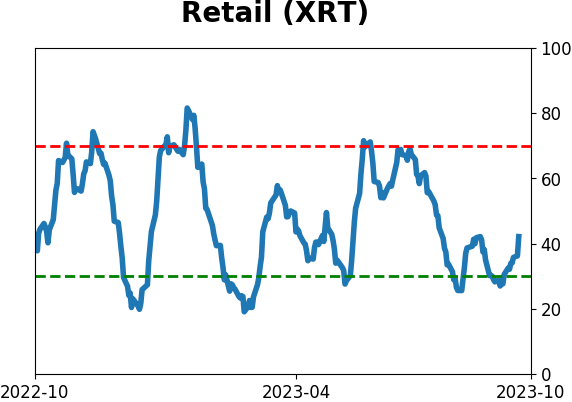
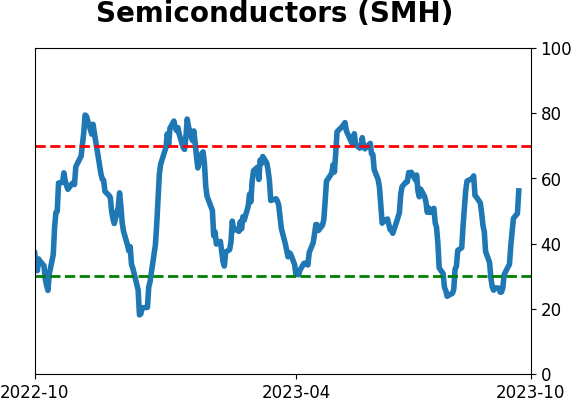
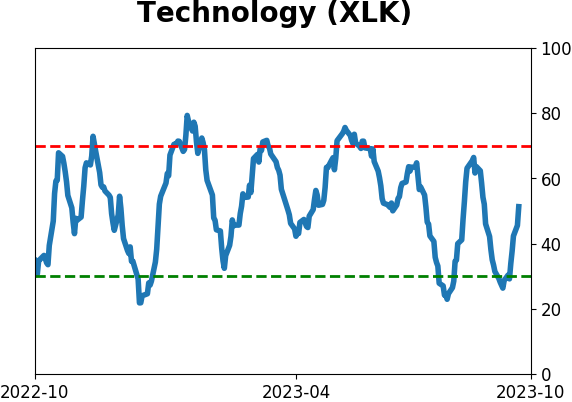
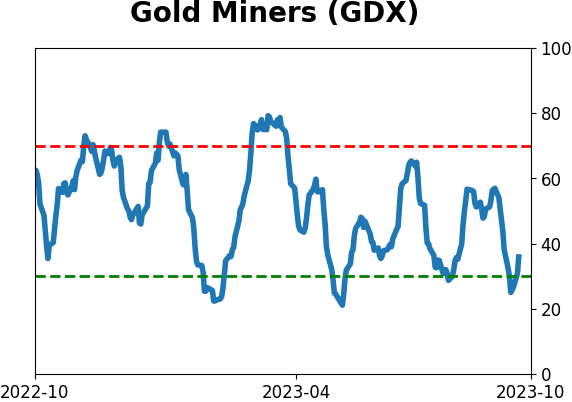
Sector ETF's - 10-Day Moving Average
|
|
|
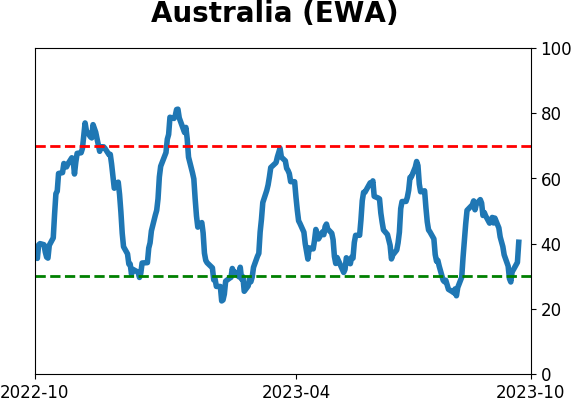
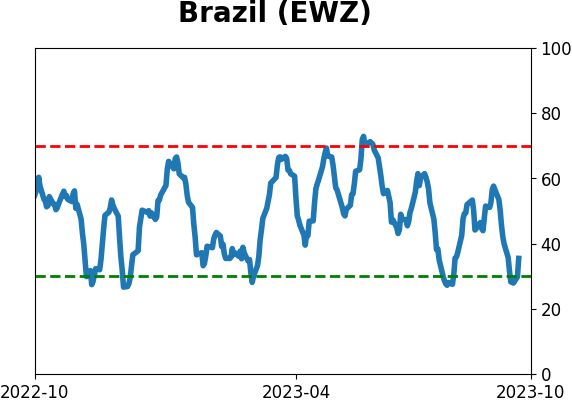
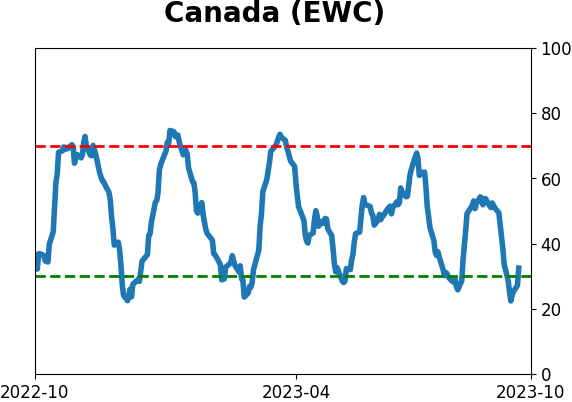
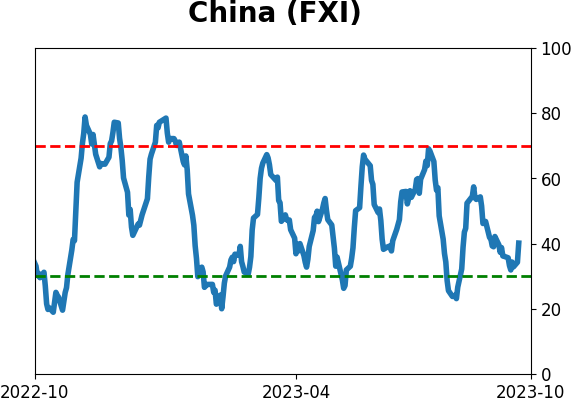
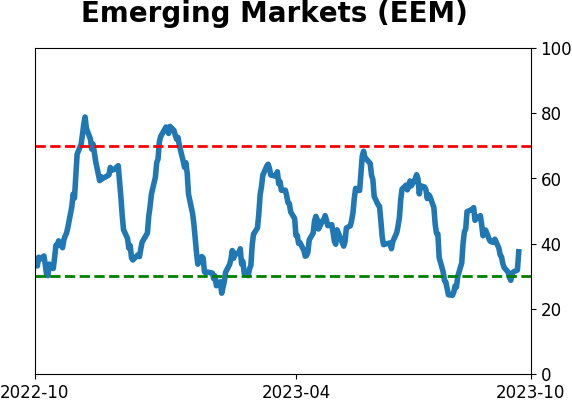
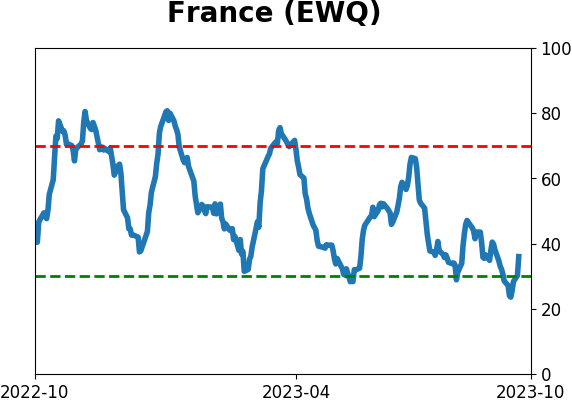
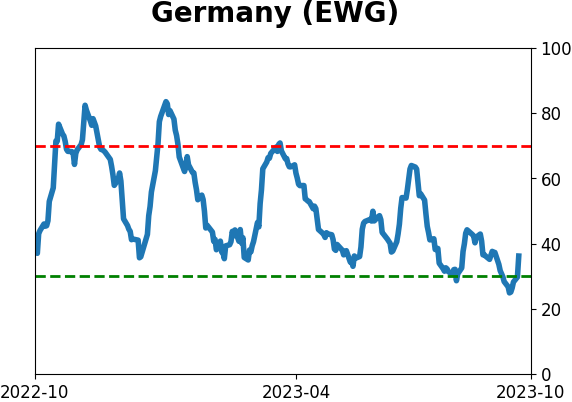
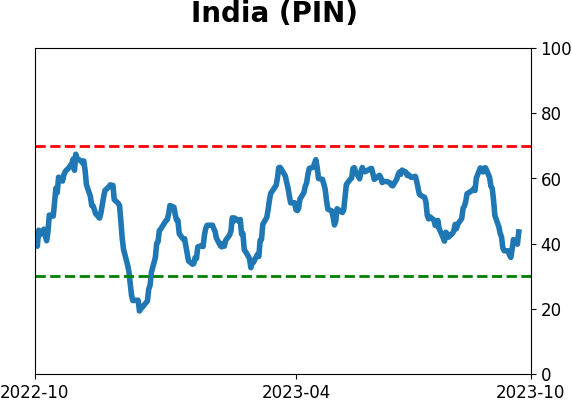
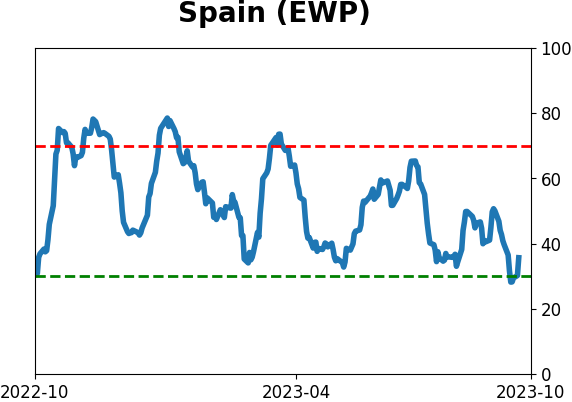
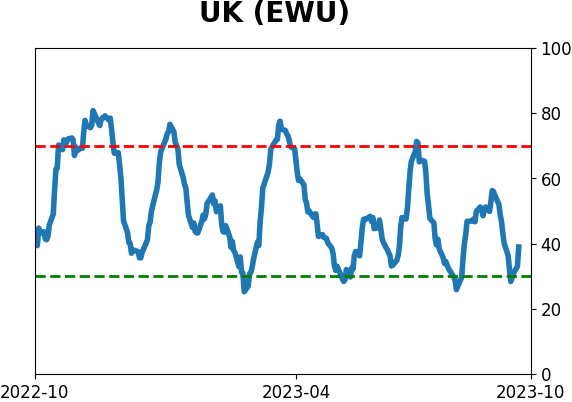
Country ETF's - 10-Day Moving Average
|
|
|
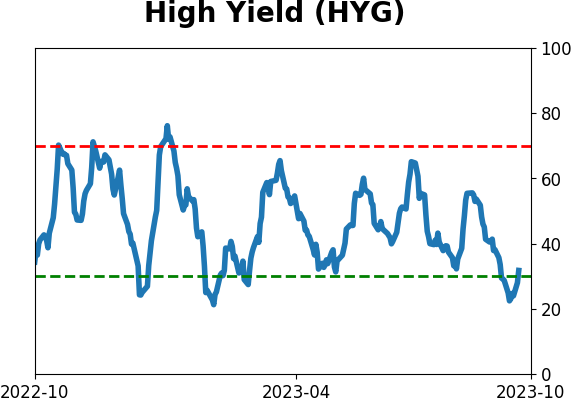
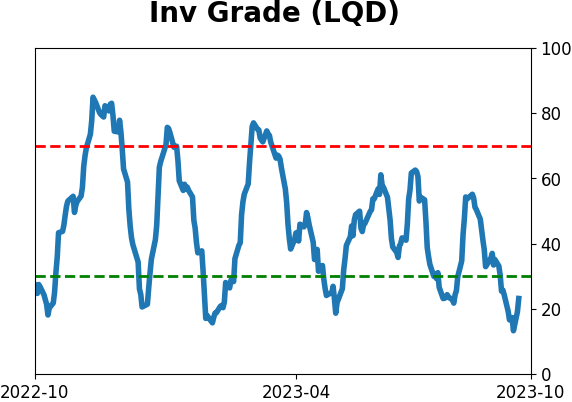
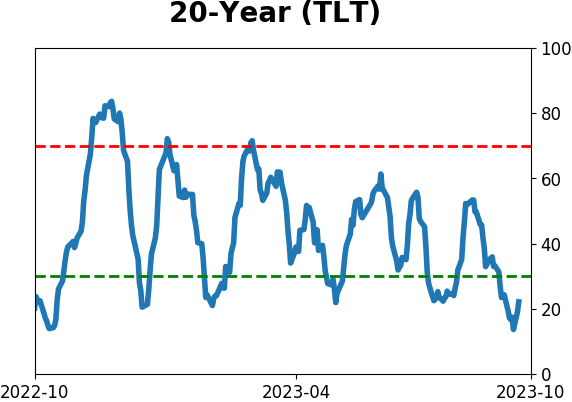
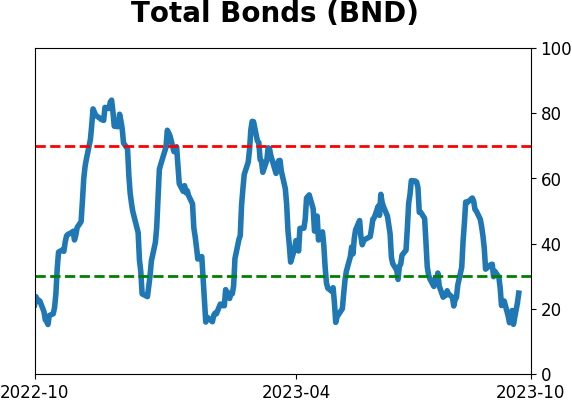
Bond ETF's - 10-Day Moving Average
|
|
|
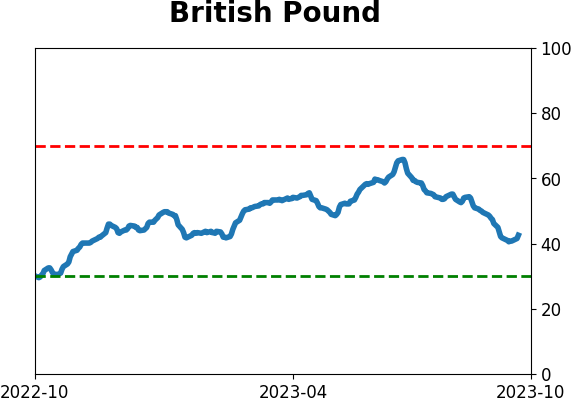
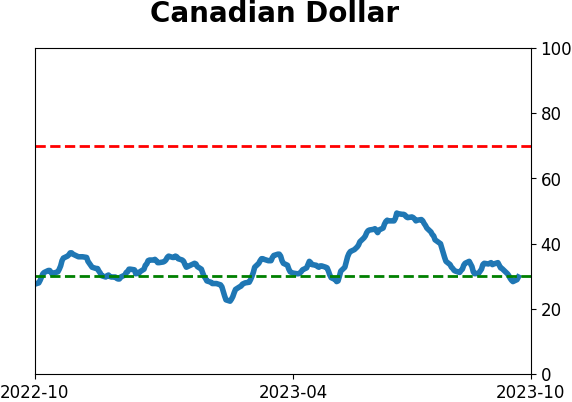
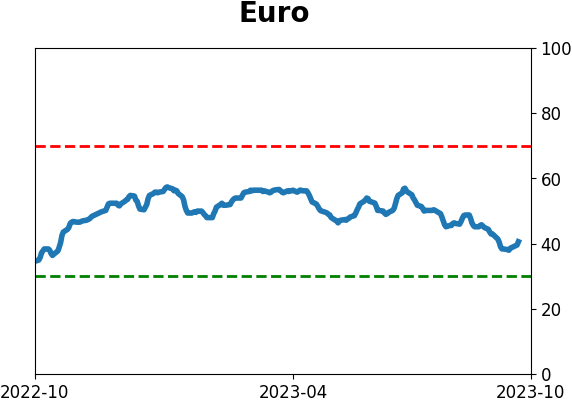
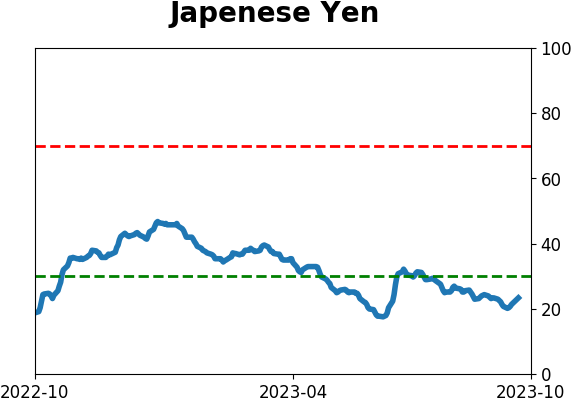
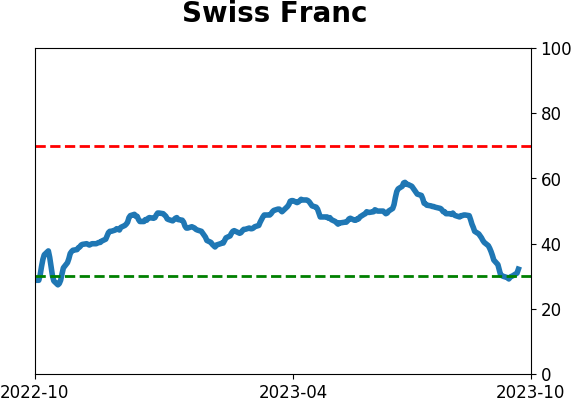
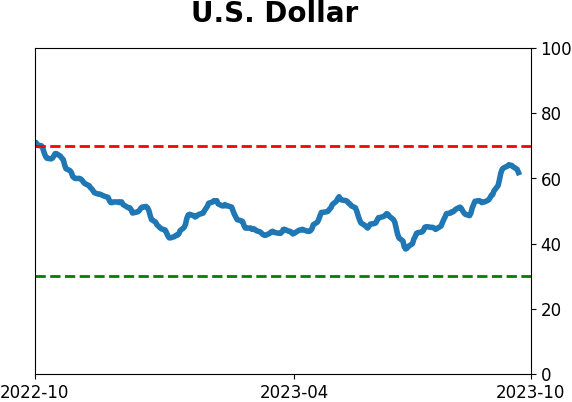
Currency ETF's - 5-Day Moving Average
|
|
|
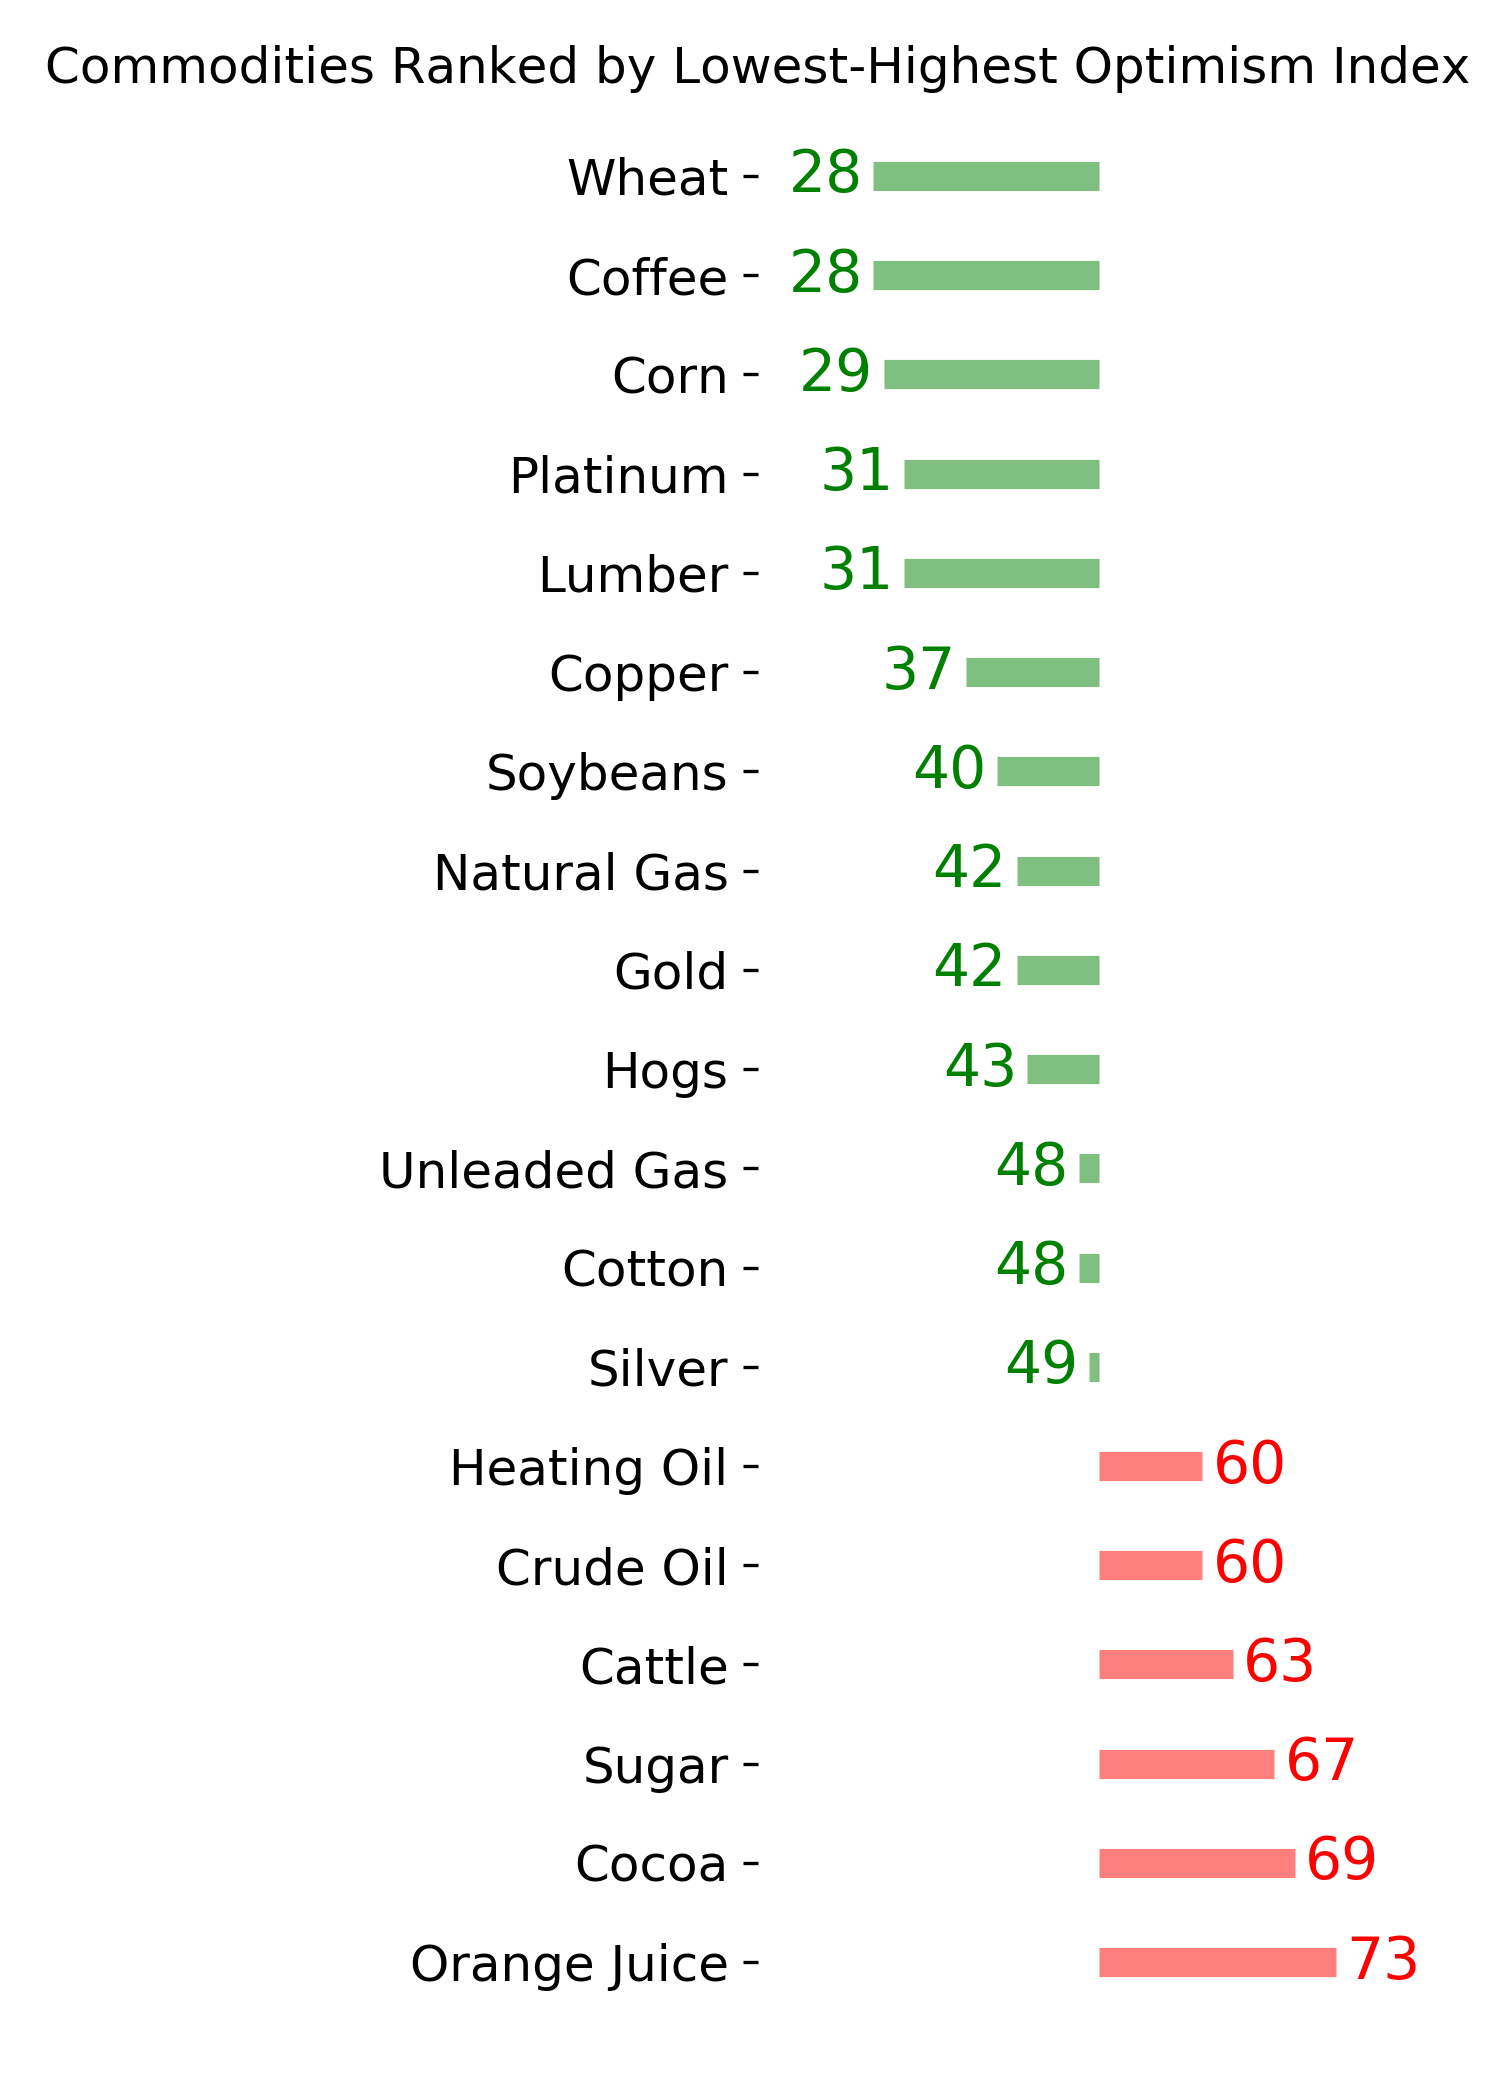
Commodity ETF's - 5-Day Moving Average
|
|