Headlines
|
|
Another round of options records:
Large, institutional options traders once again spent a record amount of premiums buying protective put options as a hedge against further stock declines. Even accounting for offsetting call buying and relative to market value, the only week with similar activity was the one ending October 10, 2008.
|
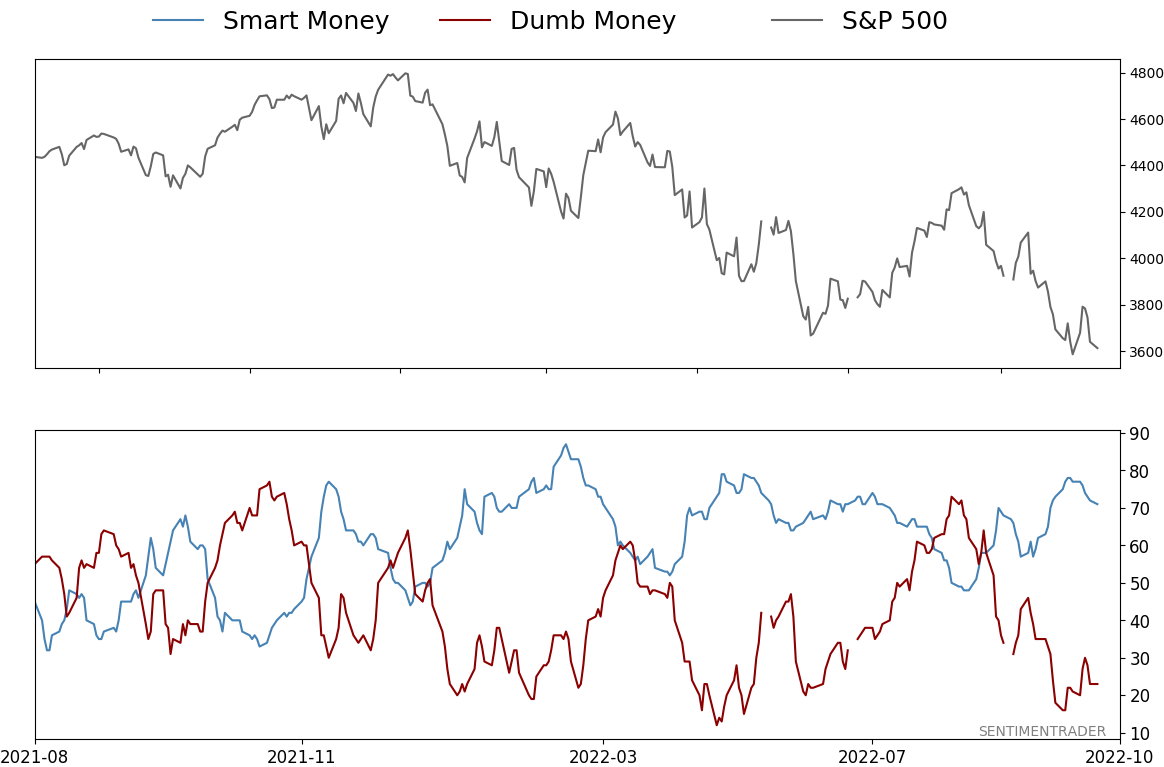
Smart / Dumb Money Confidence
|
Smart Money Confidence: 71%
Dumb Money Confidence: 23%
|
|
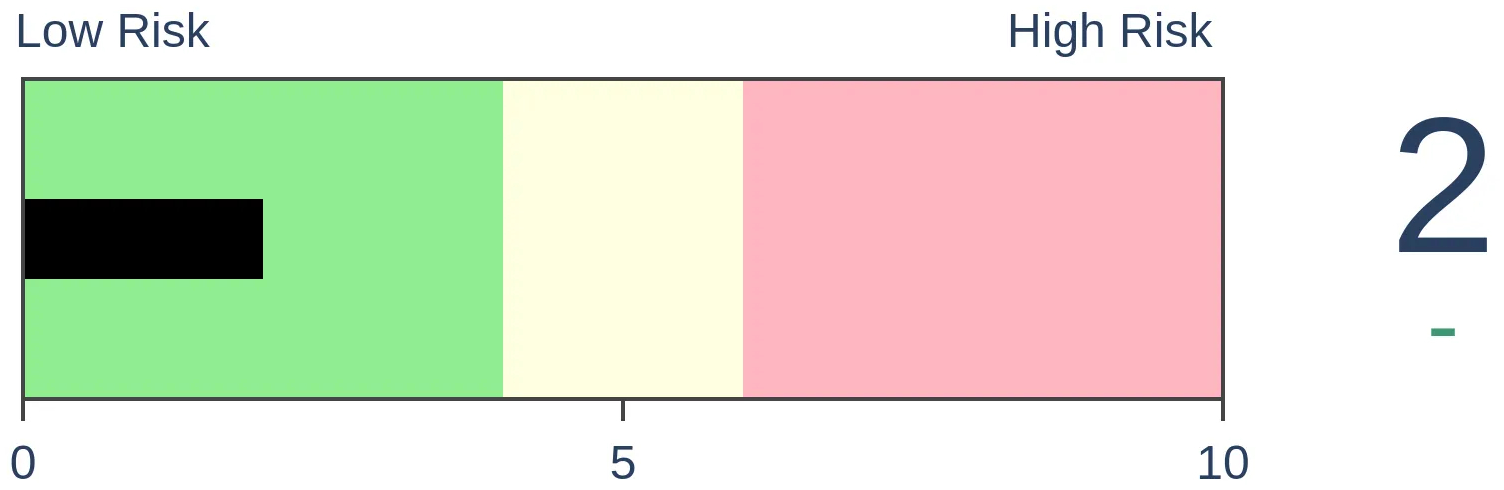
Risk Levels
Stocks Short-Term
|
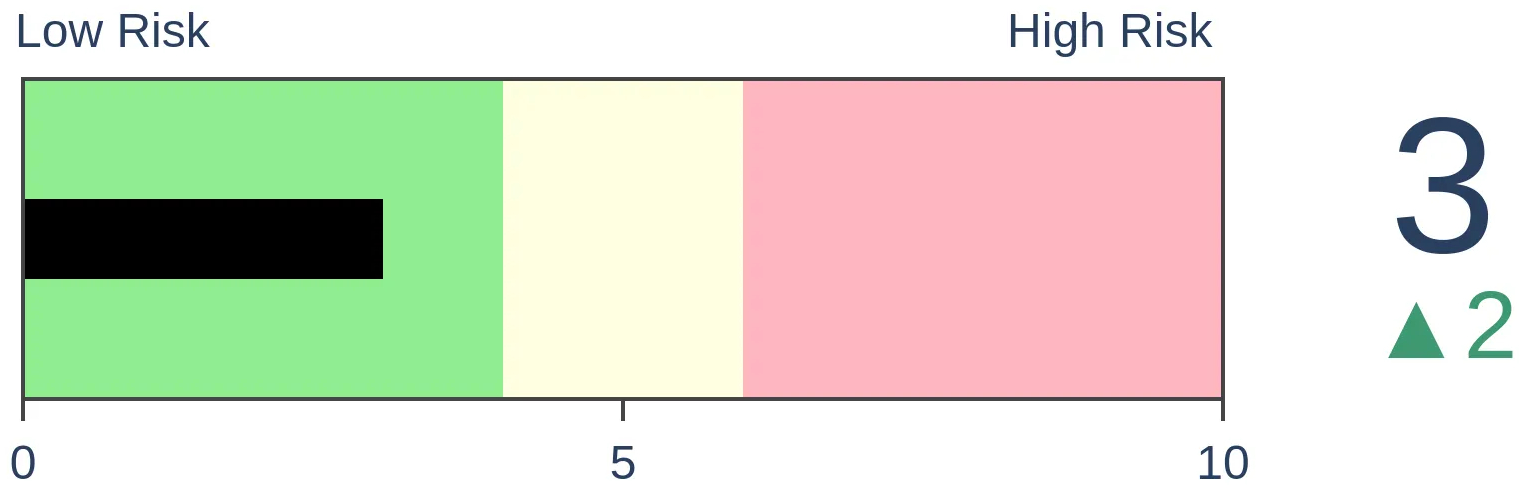
Stocks Medium-Term

|
|
Bonds
|
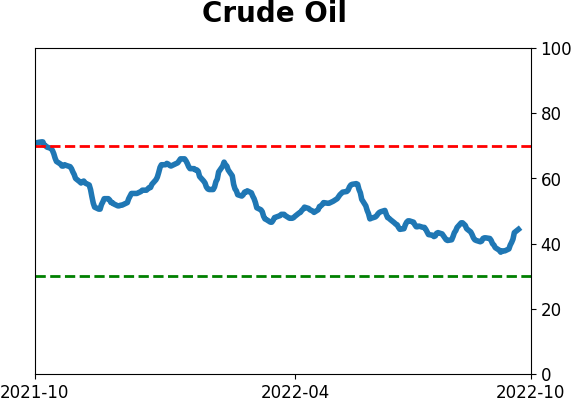
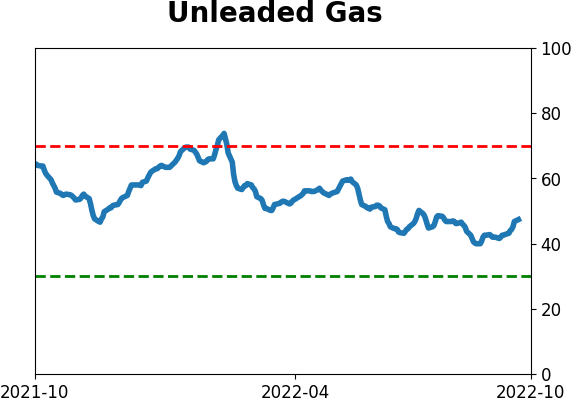
Crude Oil

|
|
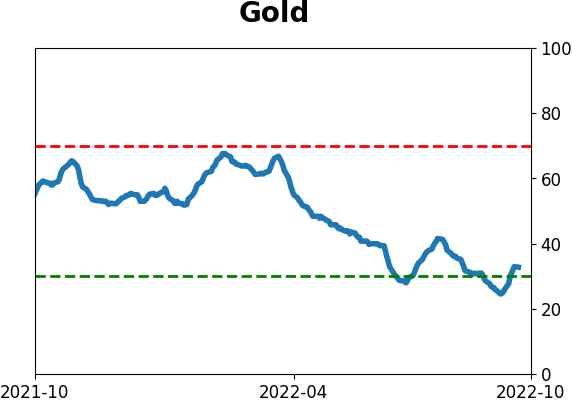
Gold
|
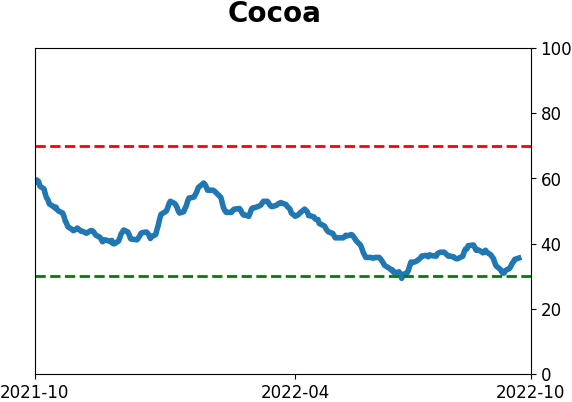
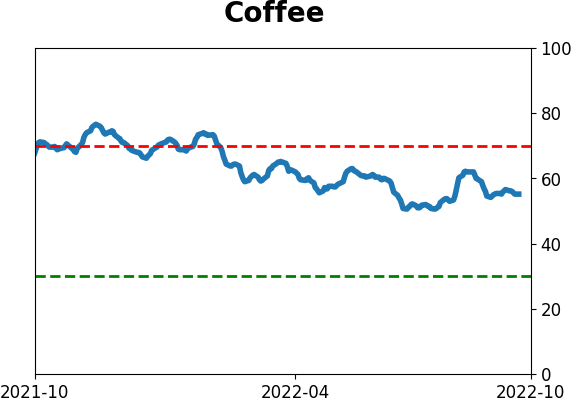
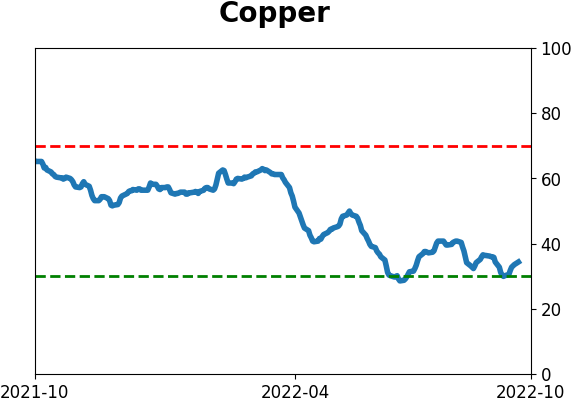
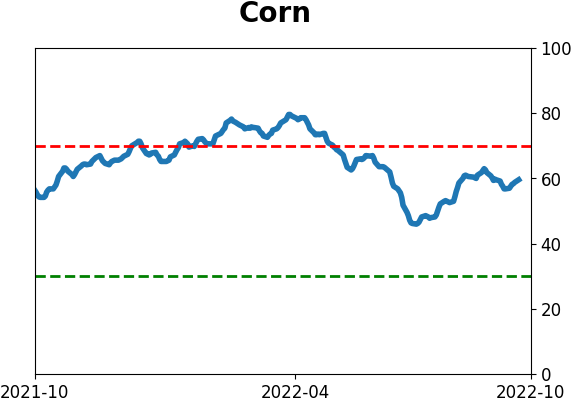
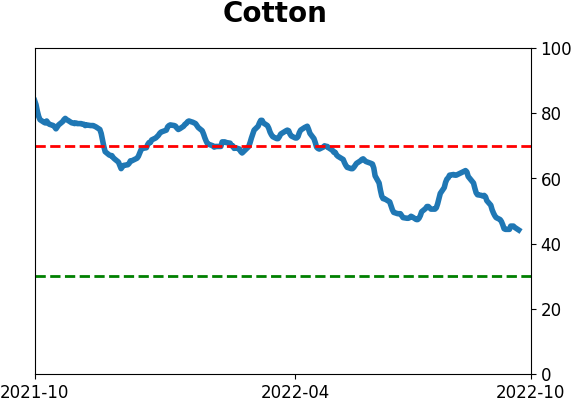
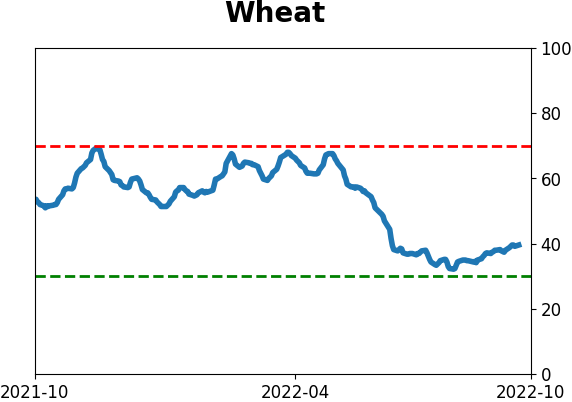
Agriculture
|
|
Research
By Jason Goepfert
BOTTOM LINE
Large, institutional options traders once again spent a record amount of premiums buying protective put options as a hedge against further stock declines. Even accounting for offsetting call buying and relative to market value, the only week with similar activity was the one ending October 10, 2008.
FORECAST / TIMEFRAME
None
|
Key points:
- Once again last week, institutional options traders placed record bets against individual stocks
- Even accounting for offsetting trades and market size, last week's bets have only one precedent
- That other week of panic, in October 2008, preceded a 20% rally that ultimately failed
Large traders once again buy record bets against stocks
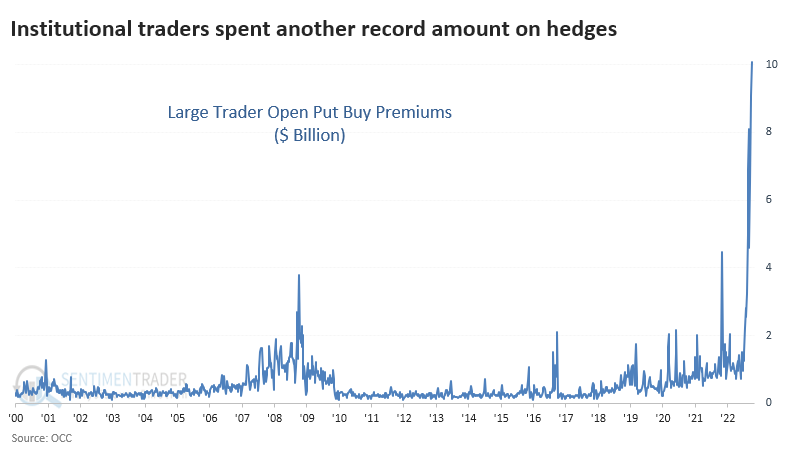
Institutional traders have not given up betting on a crash. So far, it seems to be working for them.
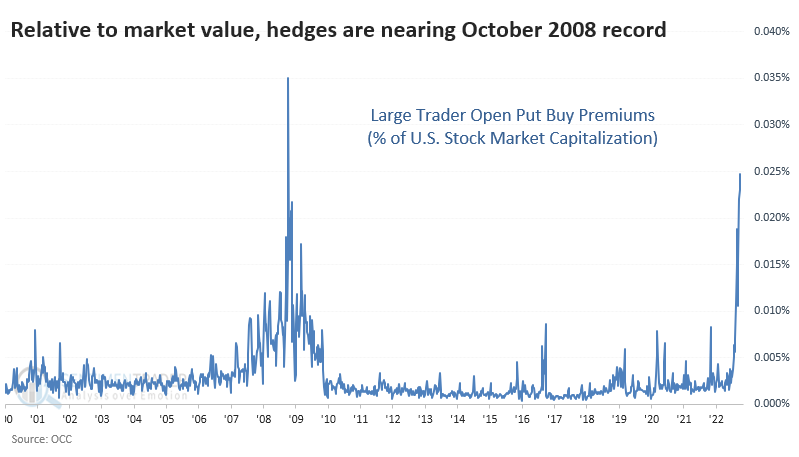
Last week, the largest options traders in the market spent more than $10 billion on buying put options to open on individual equities. That is, by far, a record high and is nearing an all-time record spent by any group of traders on any options strategy ever.
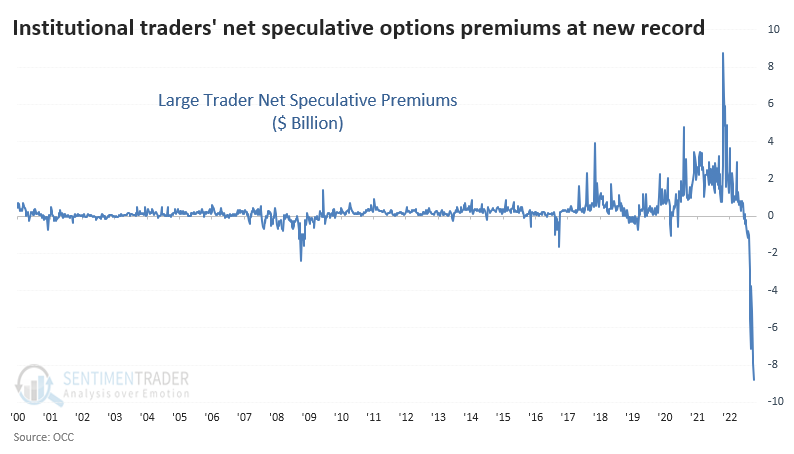
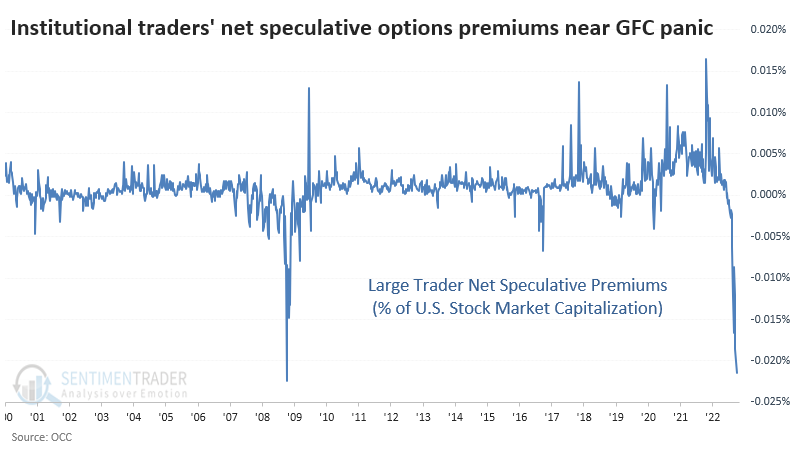
We often criticize those who only look at one side of the ledger and who don't take context into account. So let's incorporate the other side, which is the amount these traders spent buying call options to open. If we net those two out, last week's activity is still far beyond anything seen before. It's a mirror image of the end of October 2021, when speculative excess was in full force.
Now, for context. As a percentage of the total market capitalization of U.S. stocks, last week's put buying was still quite a bit below October 2008.
But when we net out the speculative activity and express it relative to market capitalization - the most honest, objective way to view this data - it's on par with the week ending October 10, 2008.
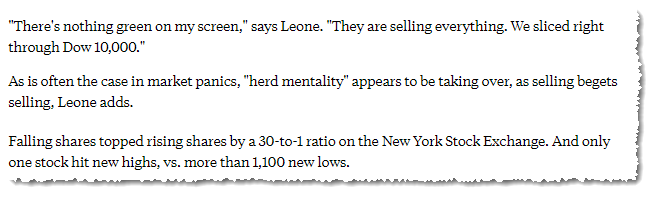
For some context, here are a few quotes in the mainstream media from that week:
From CNN Money:
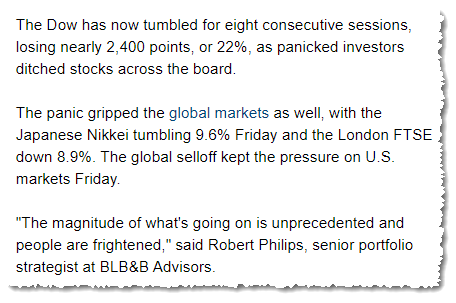
And NBC:
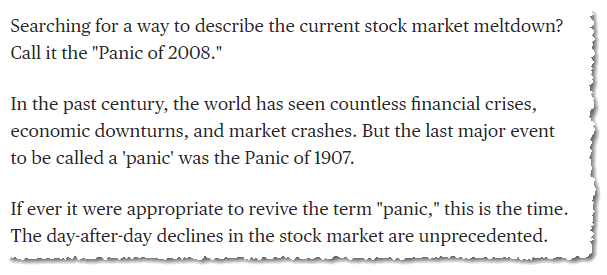
And ABC:
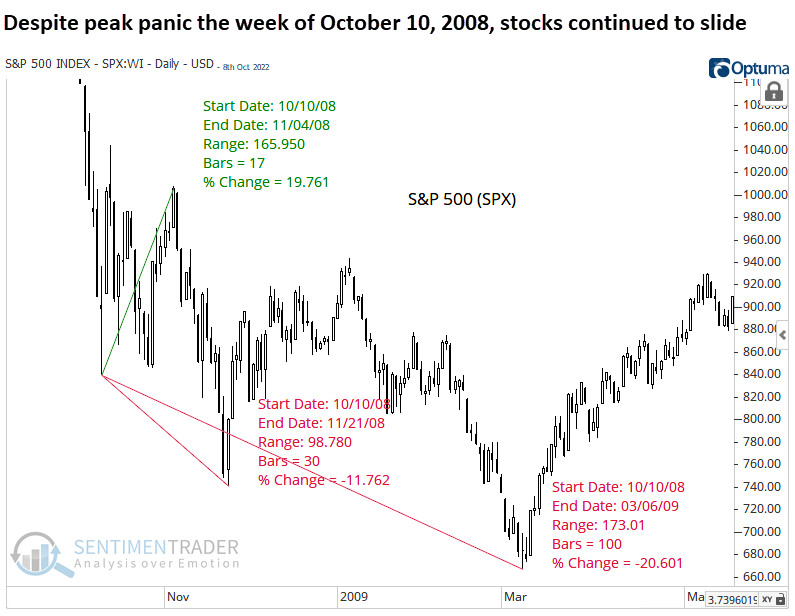
If we zoom in on that week, it wasn't the exact low for stocks. From the low of that week, the S&P 500 jumped nearly 20% over the next 17 trading days. But then panic resumed anew, and the index fell nearly 12% from its October low into late November, and its ultimate low didn't occur for 100 days, and another 20% loss.
There is some evidence that the activity we're seeing now is even more speculative (on the downside) than that from 2008. As the Wall Street Journal noted recently:
Options contracts that expire in less than a week make up about half of all activity in the U.S.-listed options market, according to the derivatives-analytics firm SpotGamma. That is up from around 45% last year and roughly a third of all activity in 2019.
"Speculators love them," said Steve Sosnick, chief market strategist at the electronic brokerage Interactive Brokers, on options with the shortest expiries. "If you're speculating, you don't necessarily want to think about the move in three months-you want to think of the move tomorrow."
When we see heavy activity in highly leveraged, extremely short-term instruments, it signifies excessive confidence among the traders. One thing that markets will teach all of us is that excessive confidence is a recipe for humility.
What the research tells us...
Not all indicators agree, ever. I distinctly remember March 2009, when analysts said that stocks couldn't possibly bottom because put/call ratios were showing too many bets on a rebound. That's why we prefer to use weight-of-the-evidence and rely more on composite models and objective testing. We saw last week that sentiment conditions are ripe for a counter-trend move, and then there was a historic thrust that strongly tends to lead to higher prices. All of those are over a medium- to long-term time frame, and short-term volatility is expected. A sustained decline from these conditions would most assuredly not be.
Indicators at Extremes
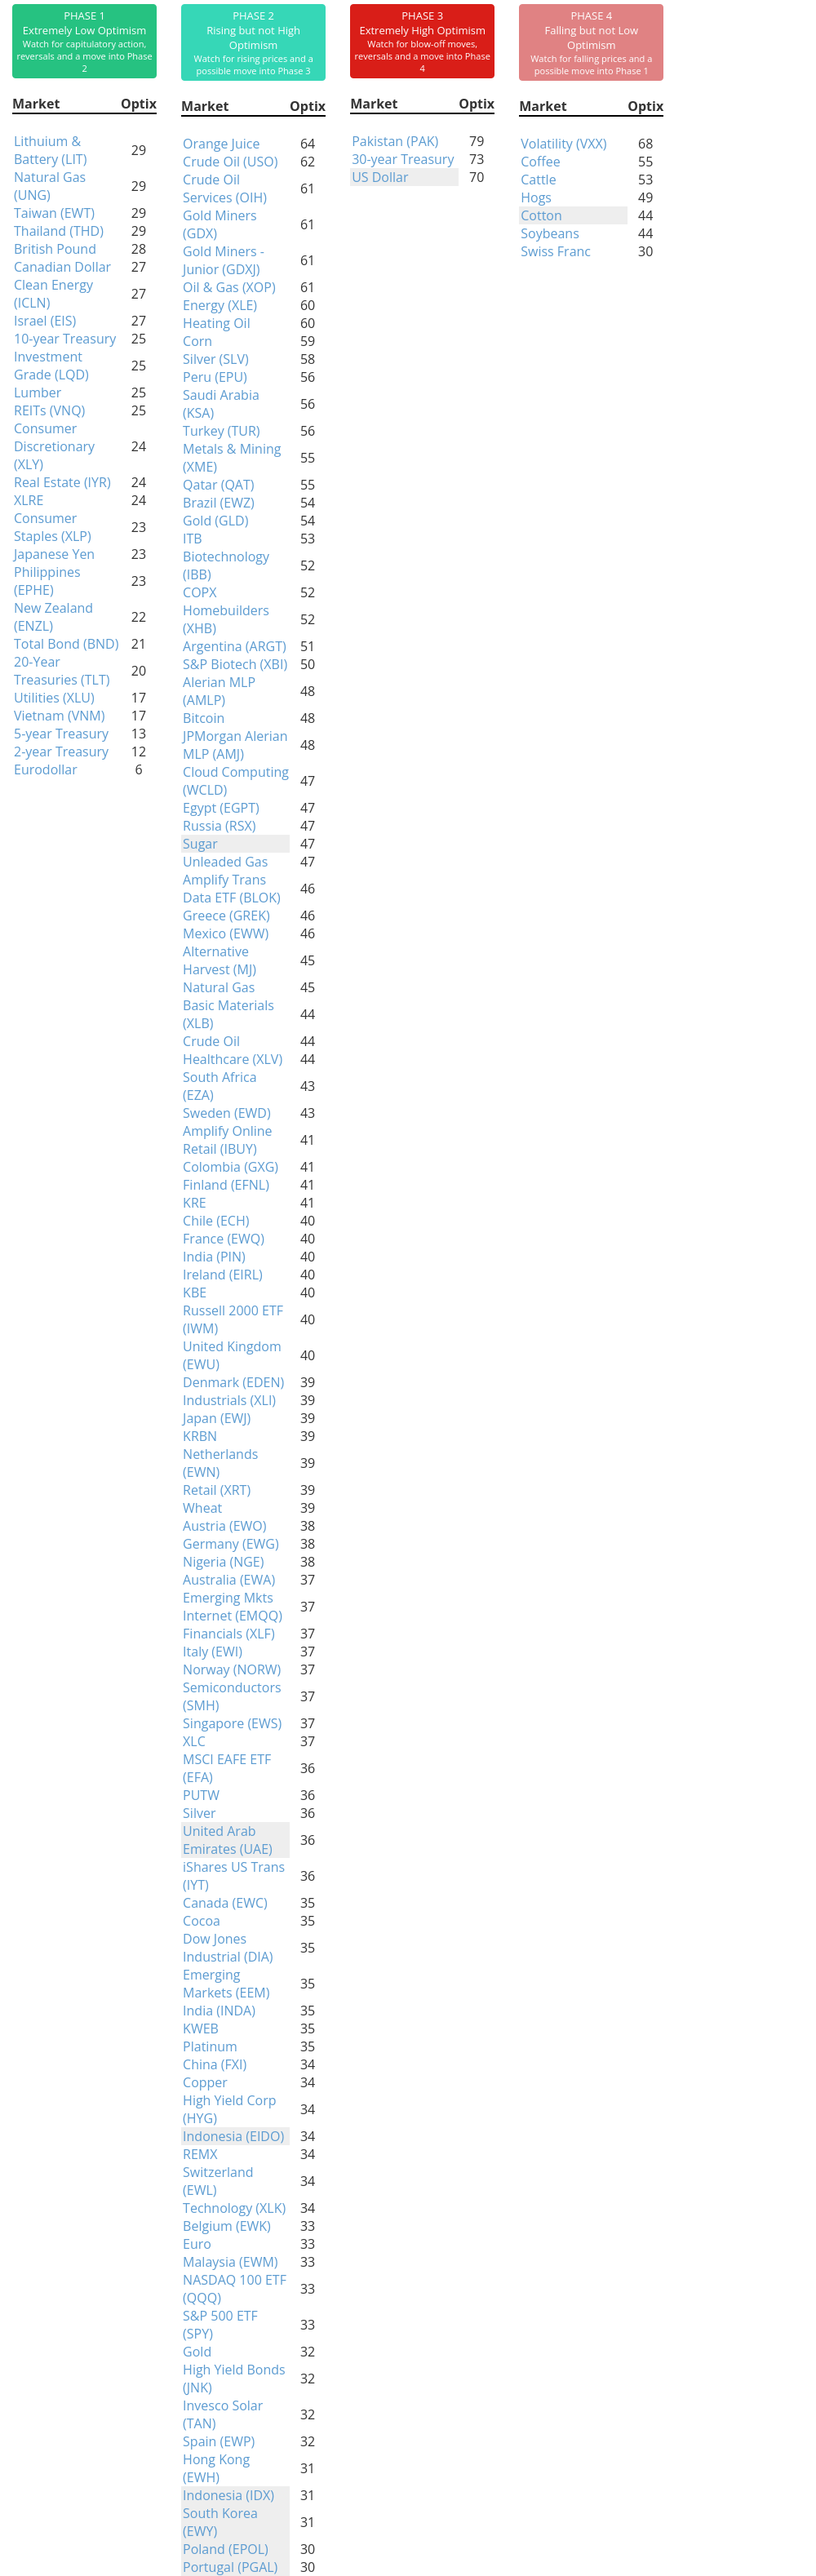
Phase Table
Ranks
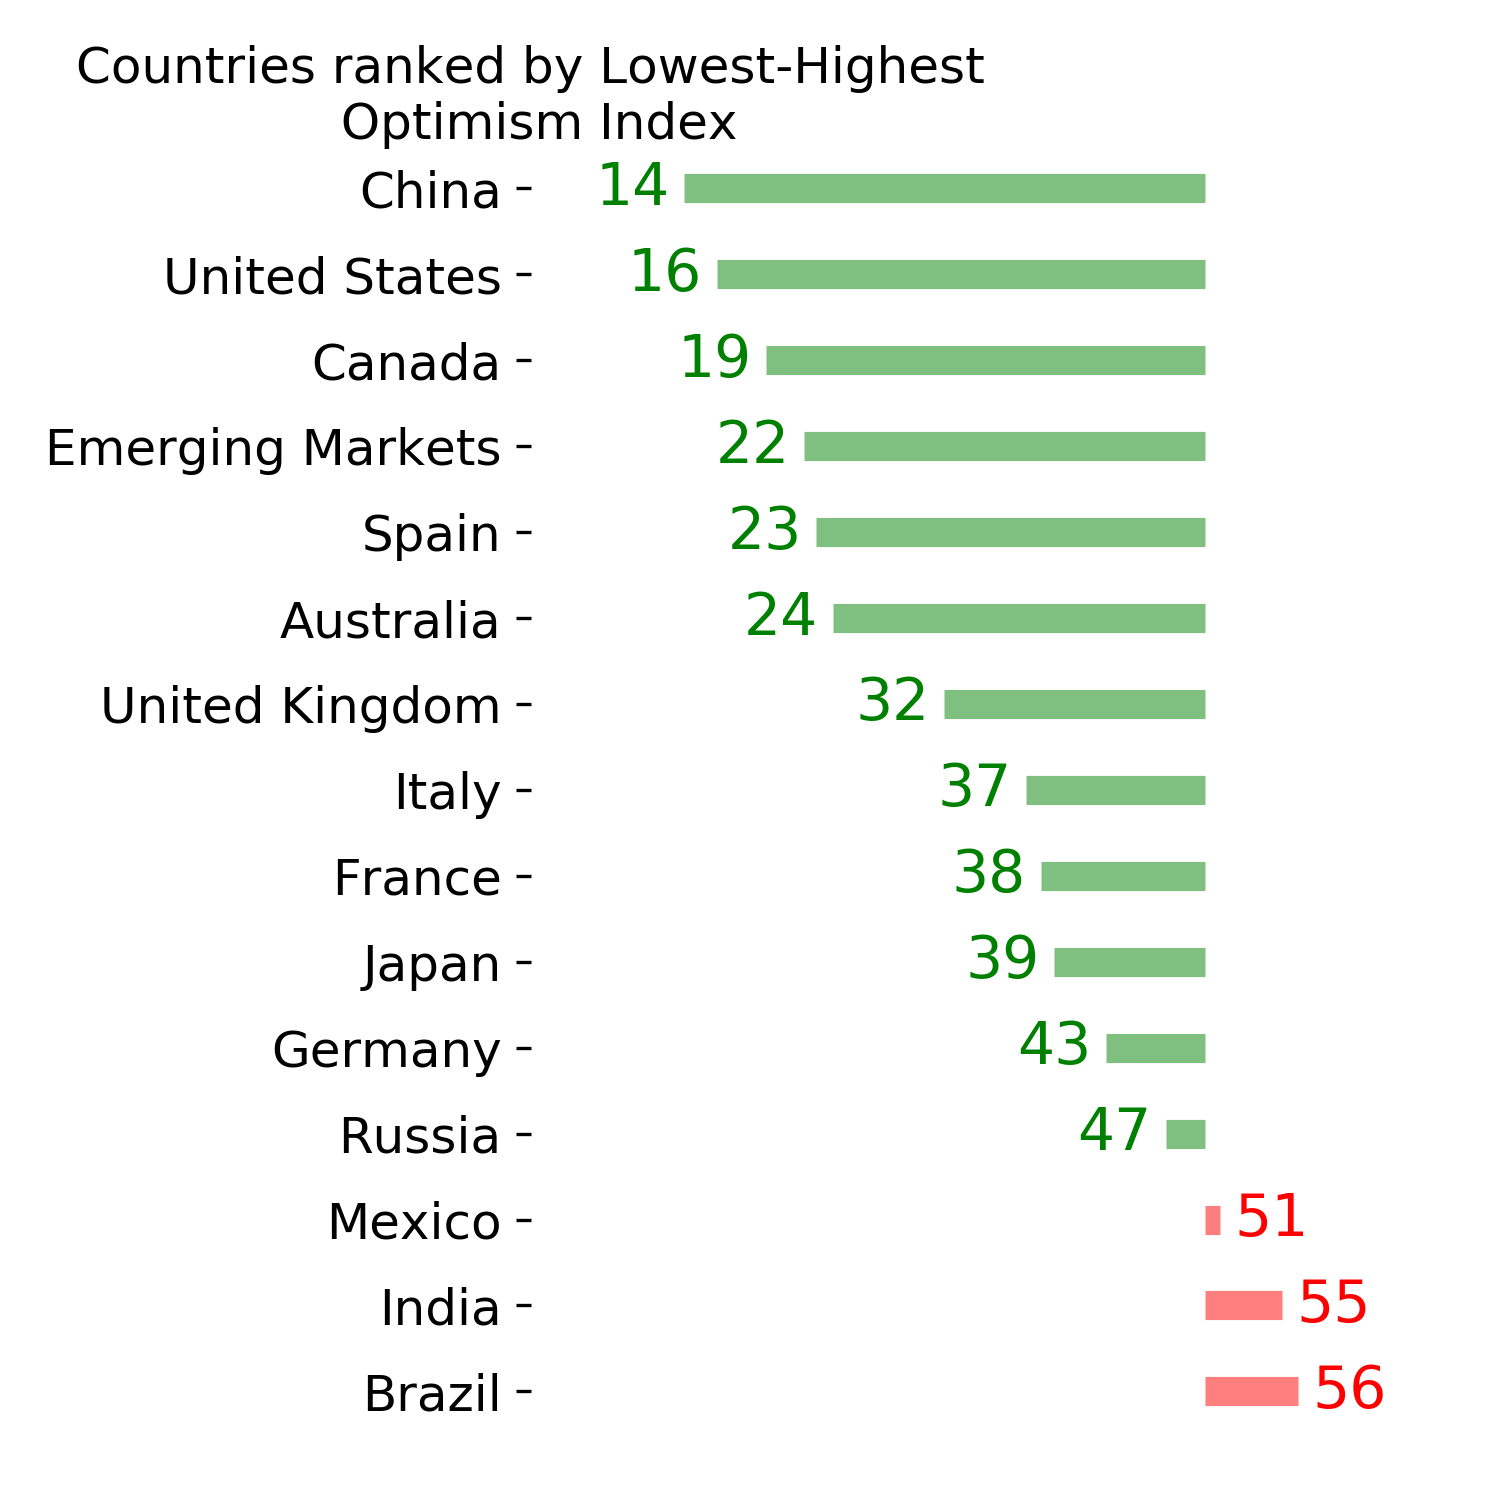
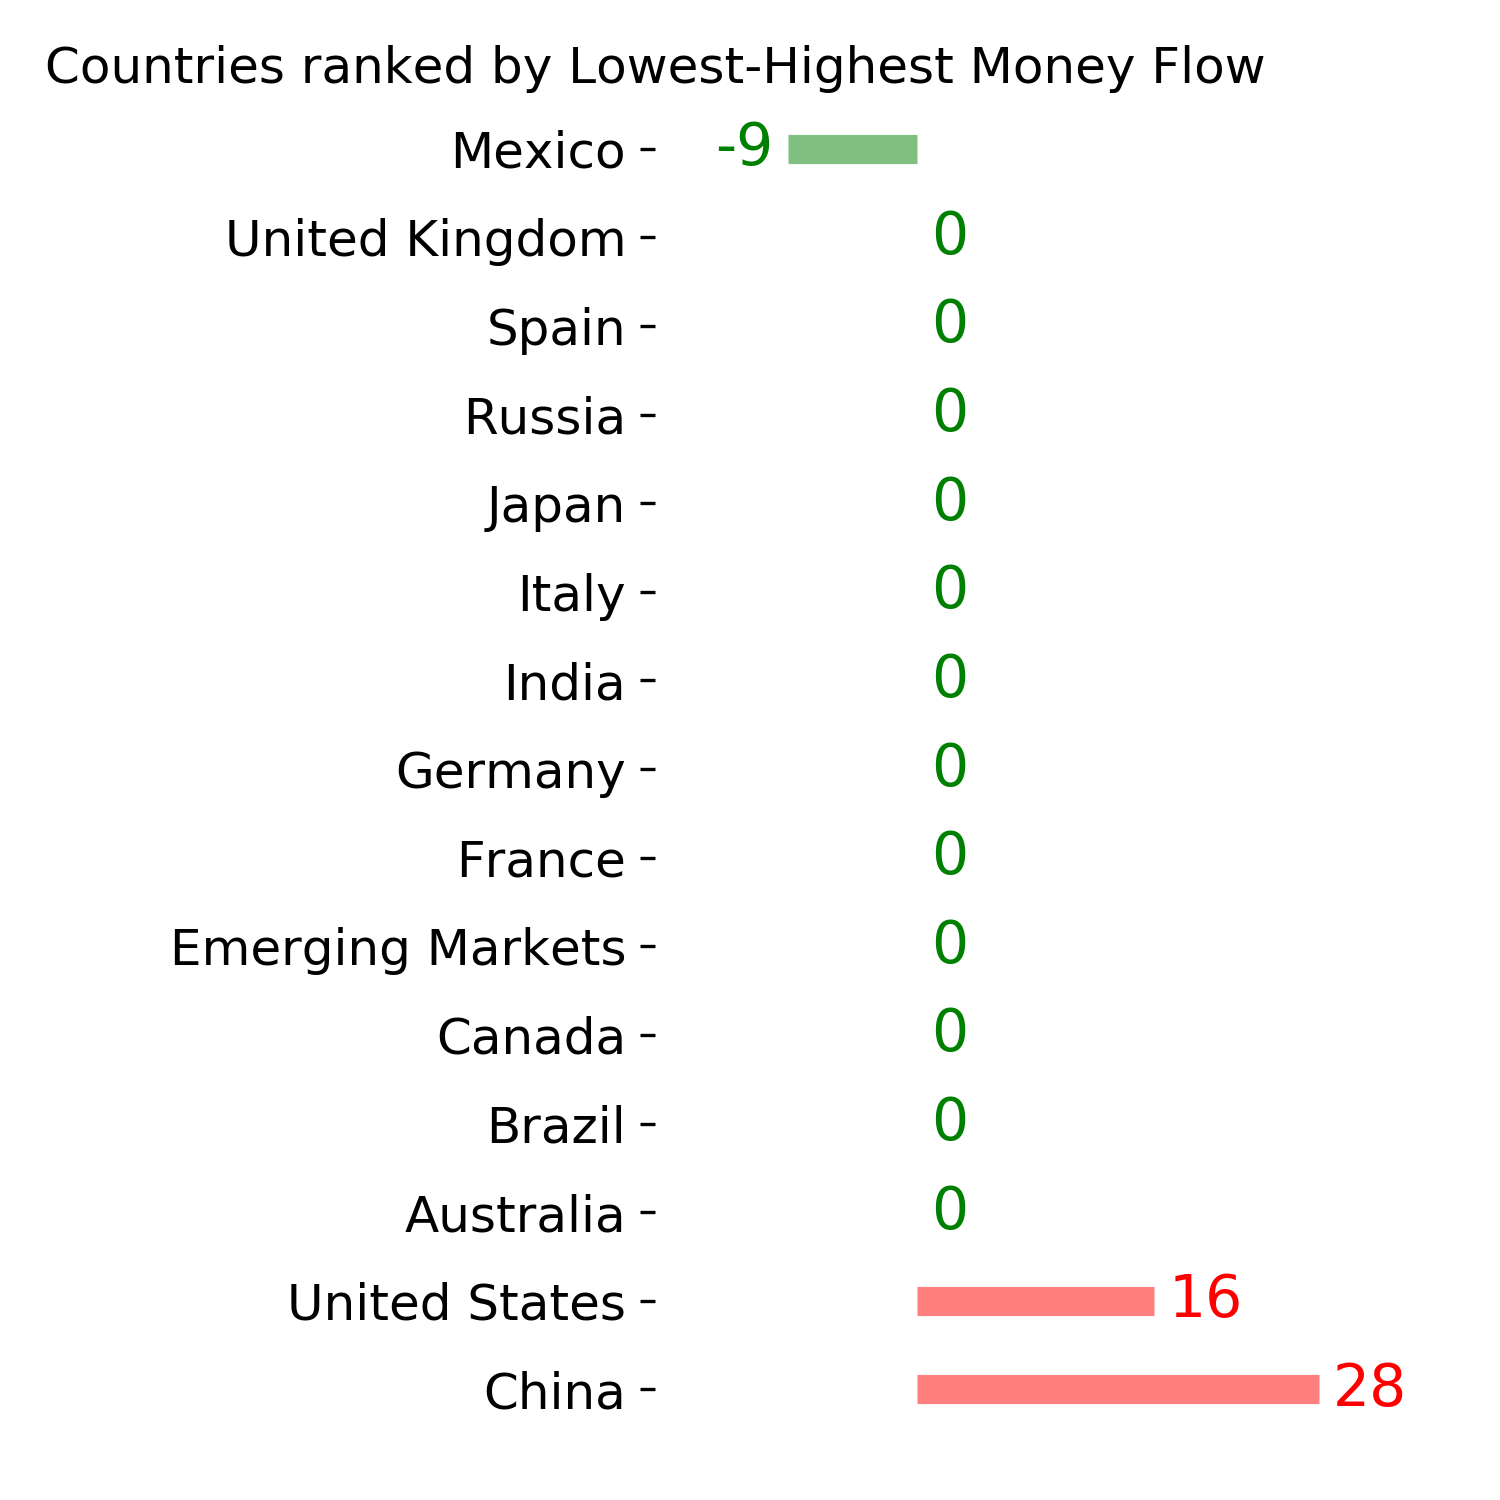
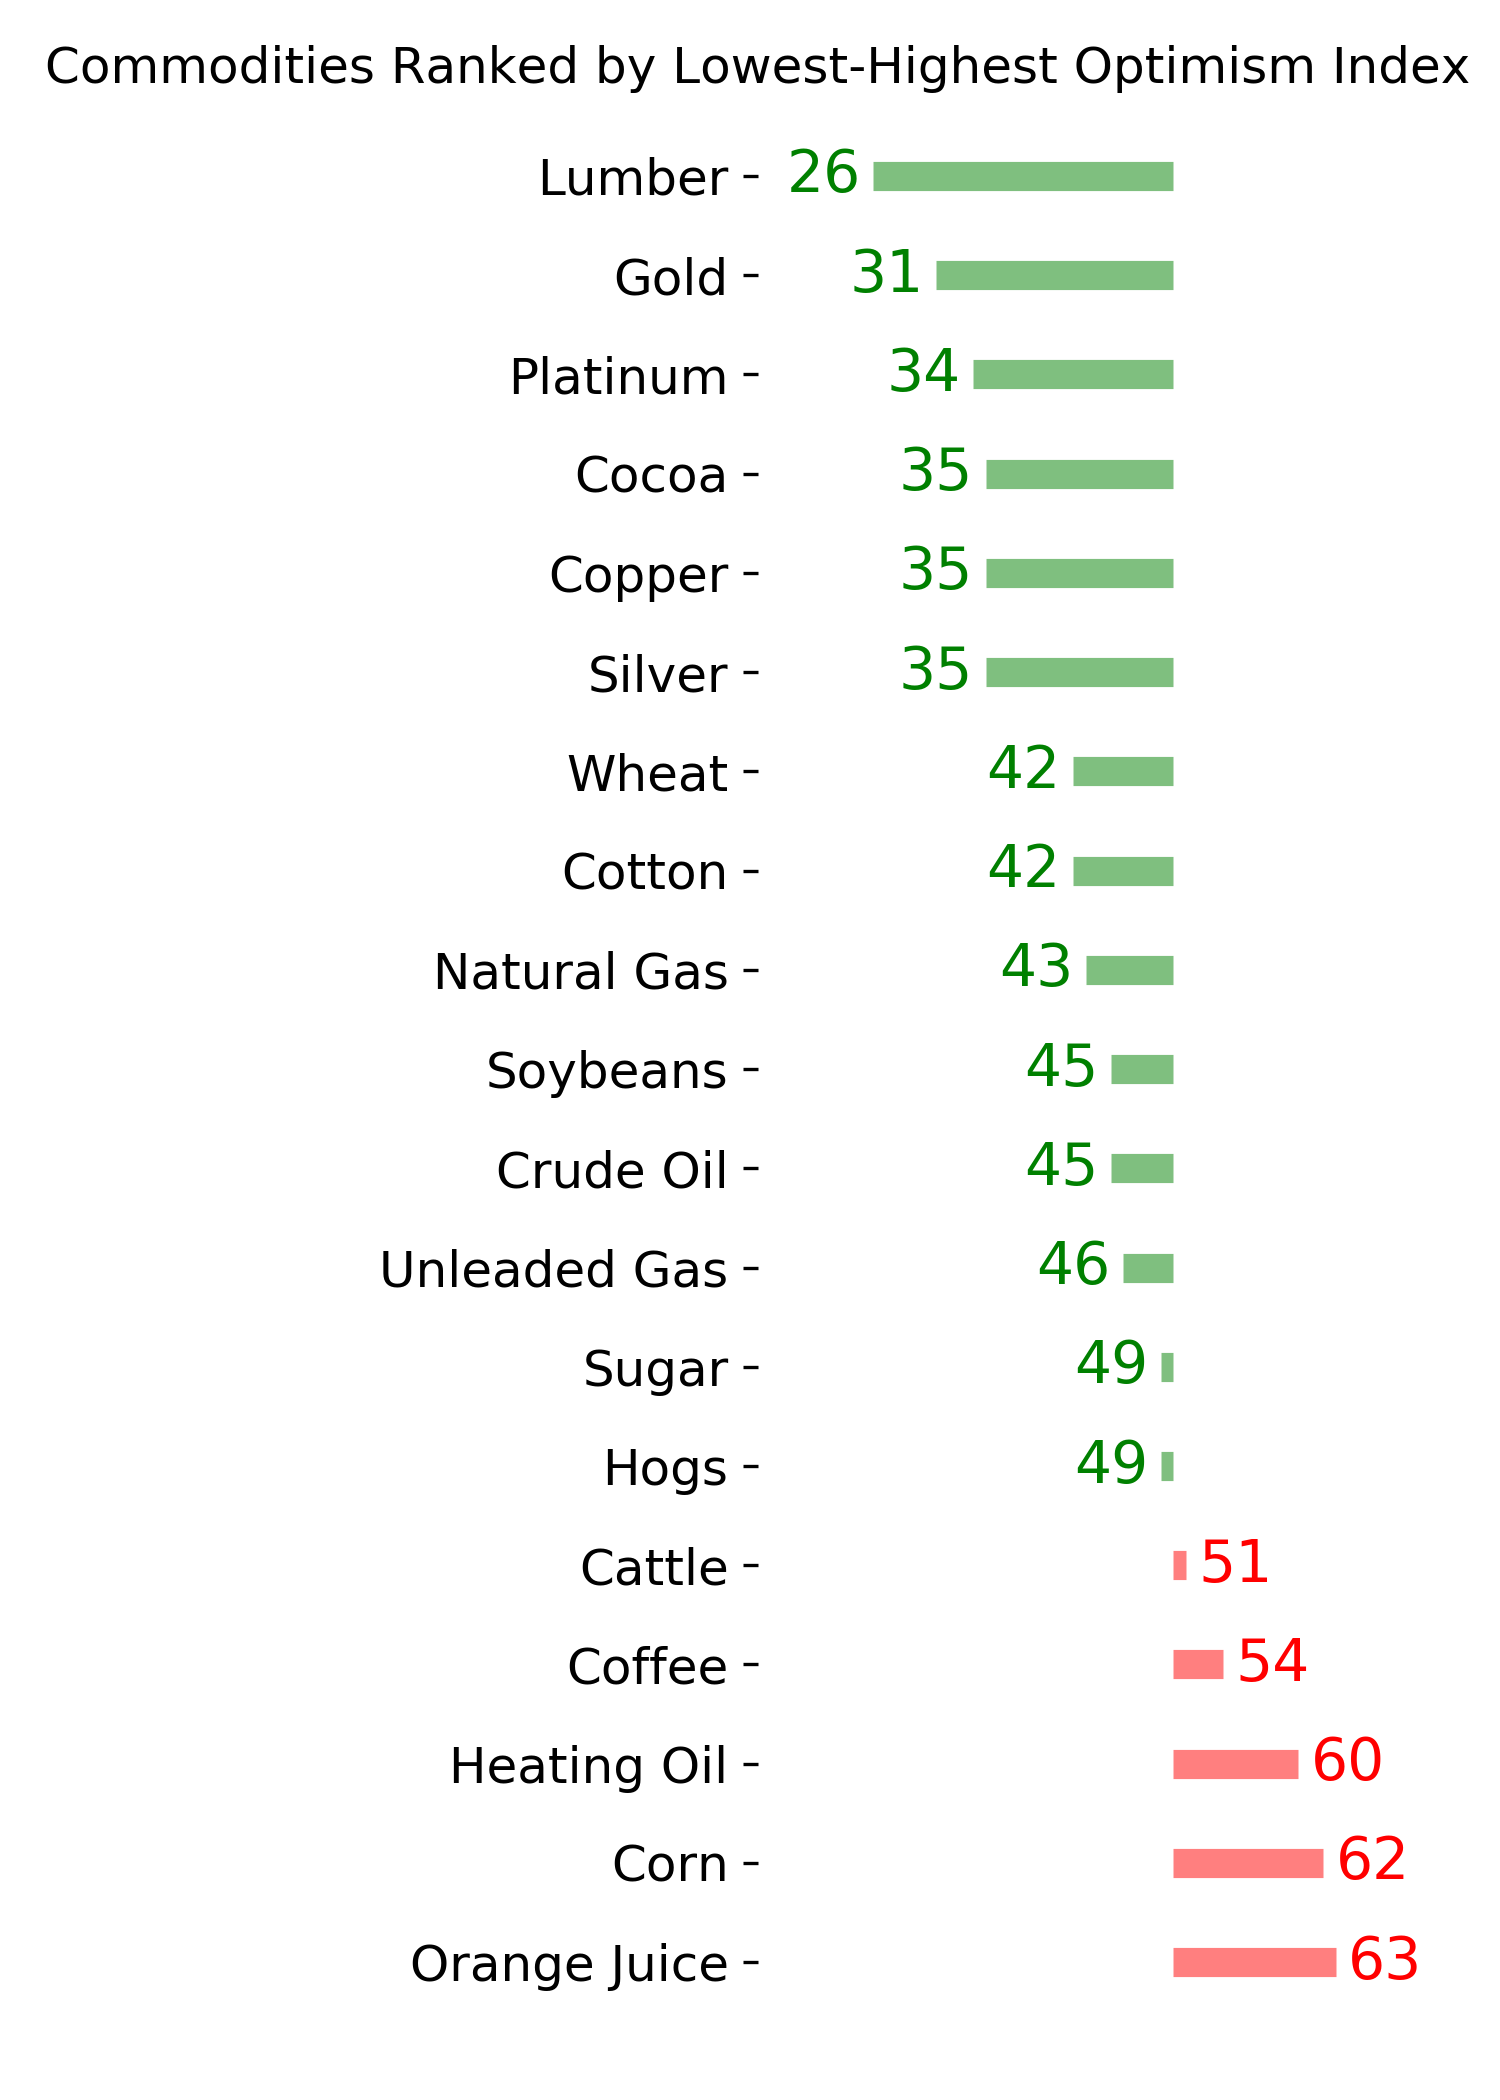
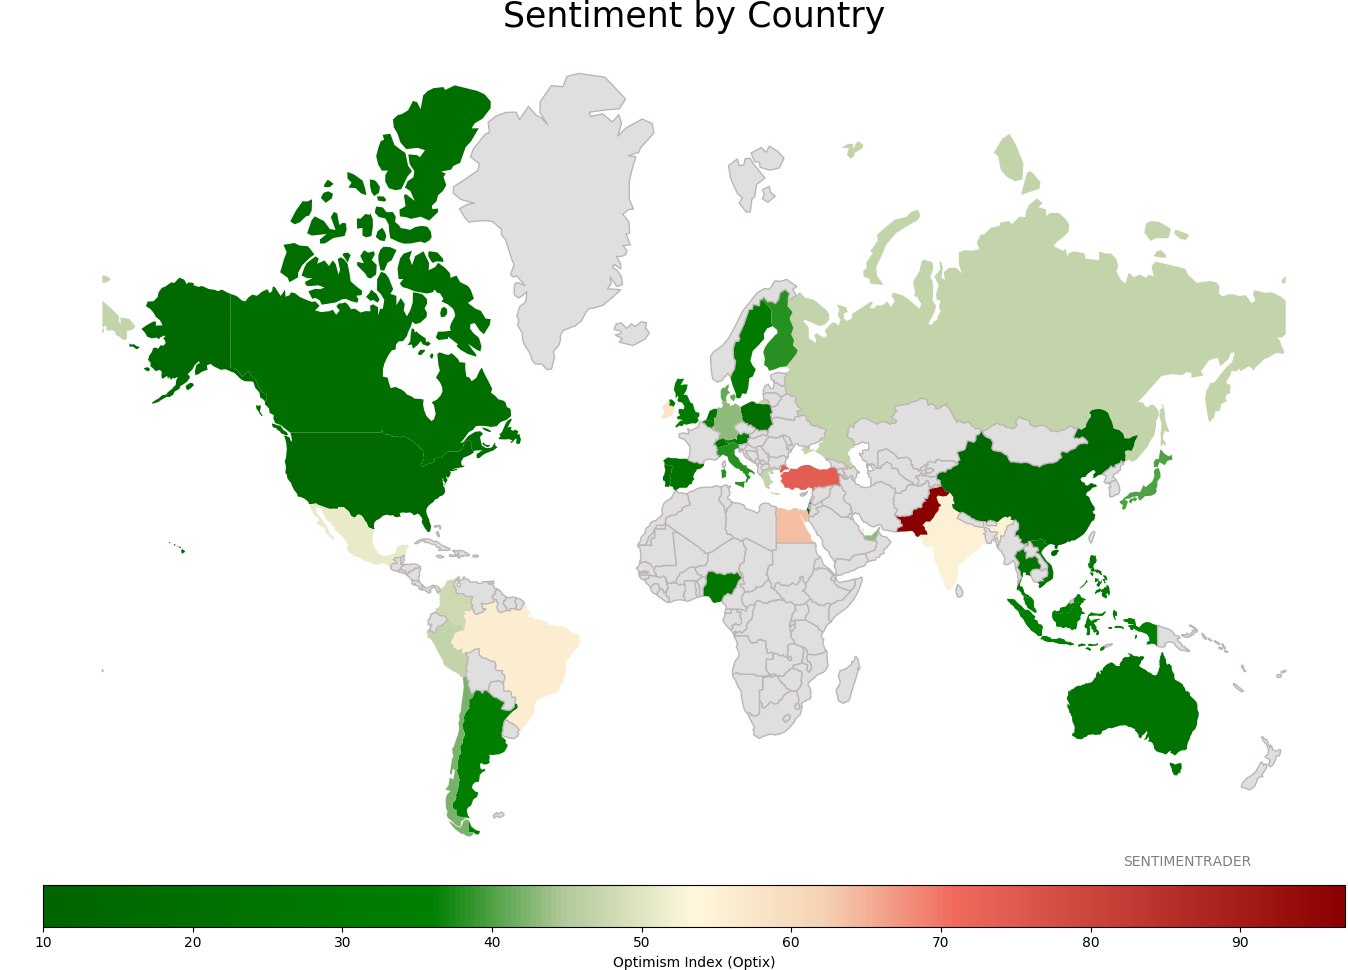
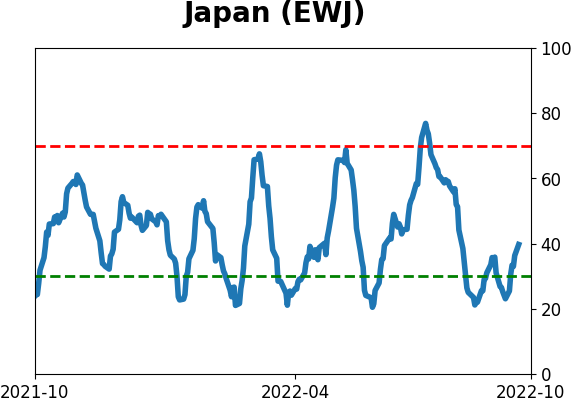
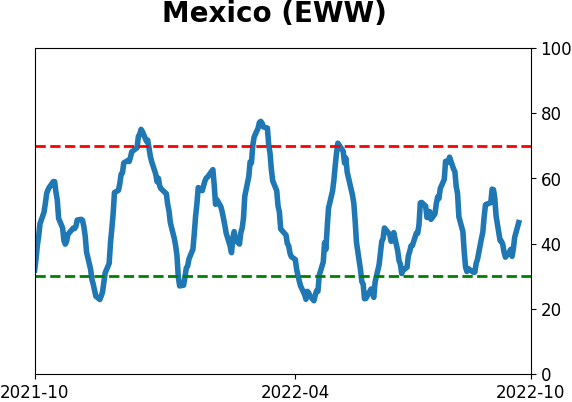
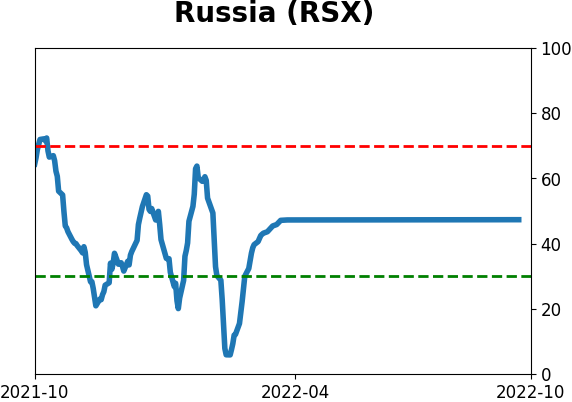
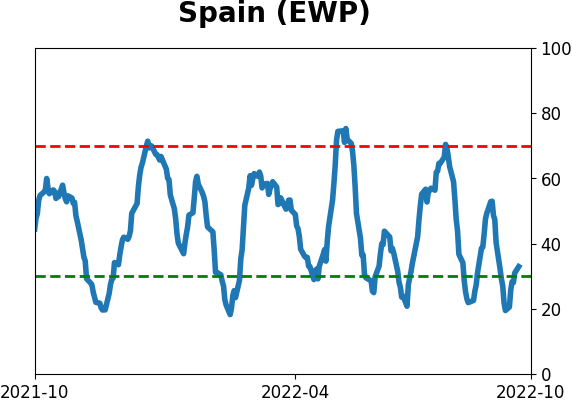
Sentiment Around The World
Optimism Index Thumbnails
|
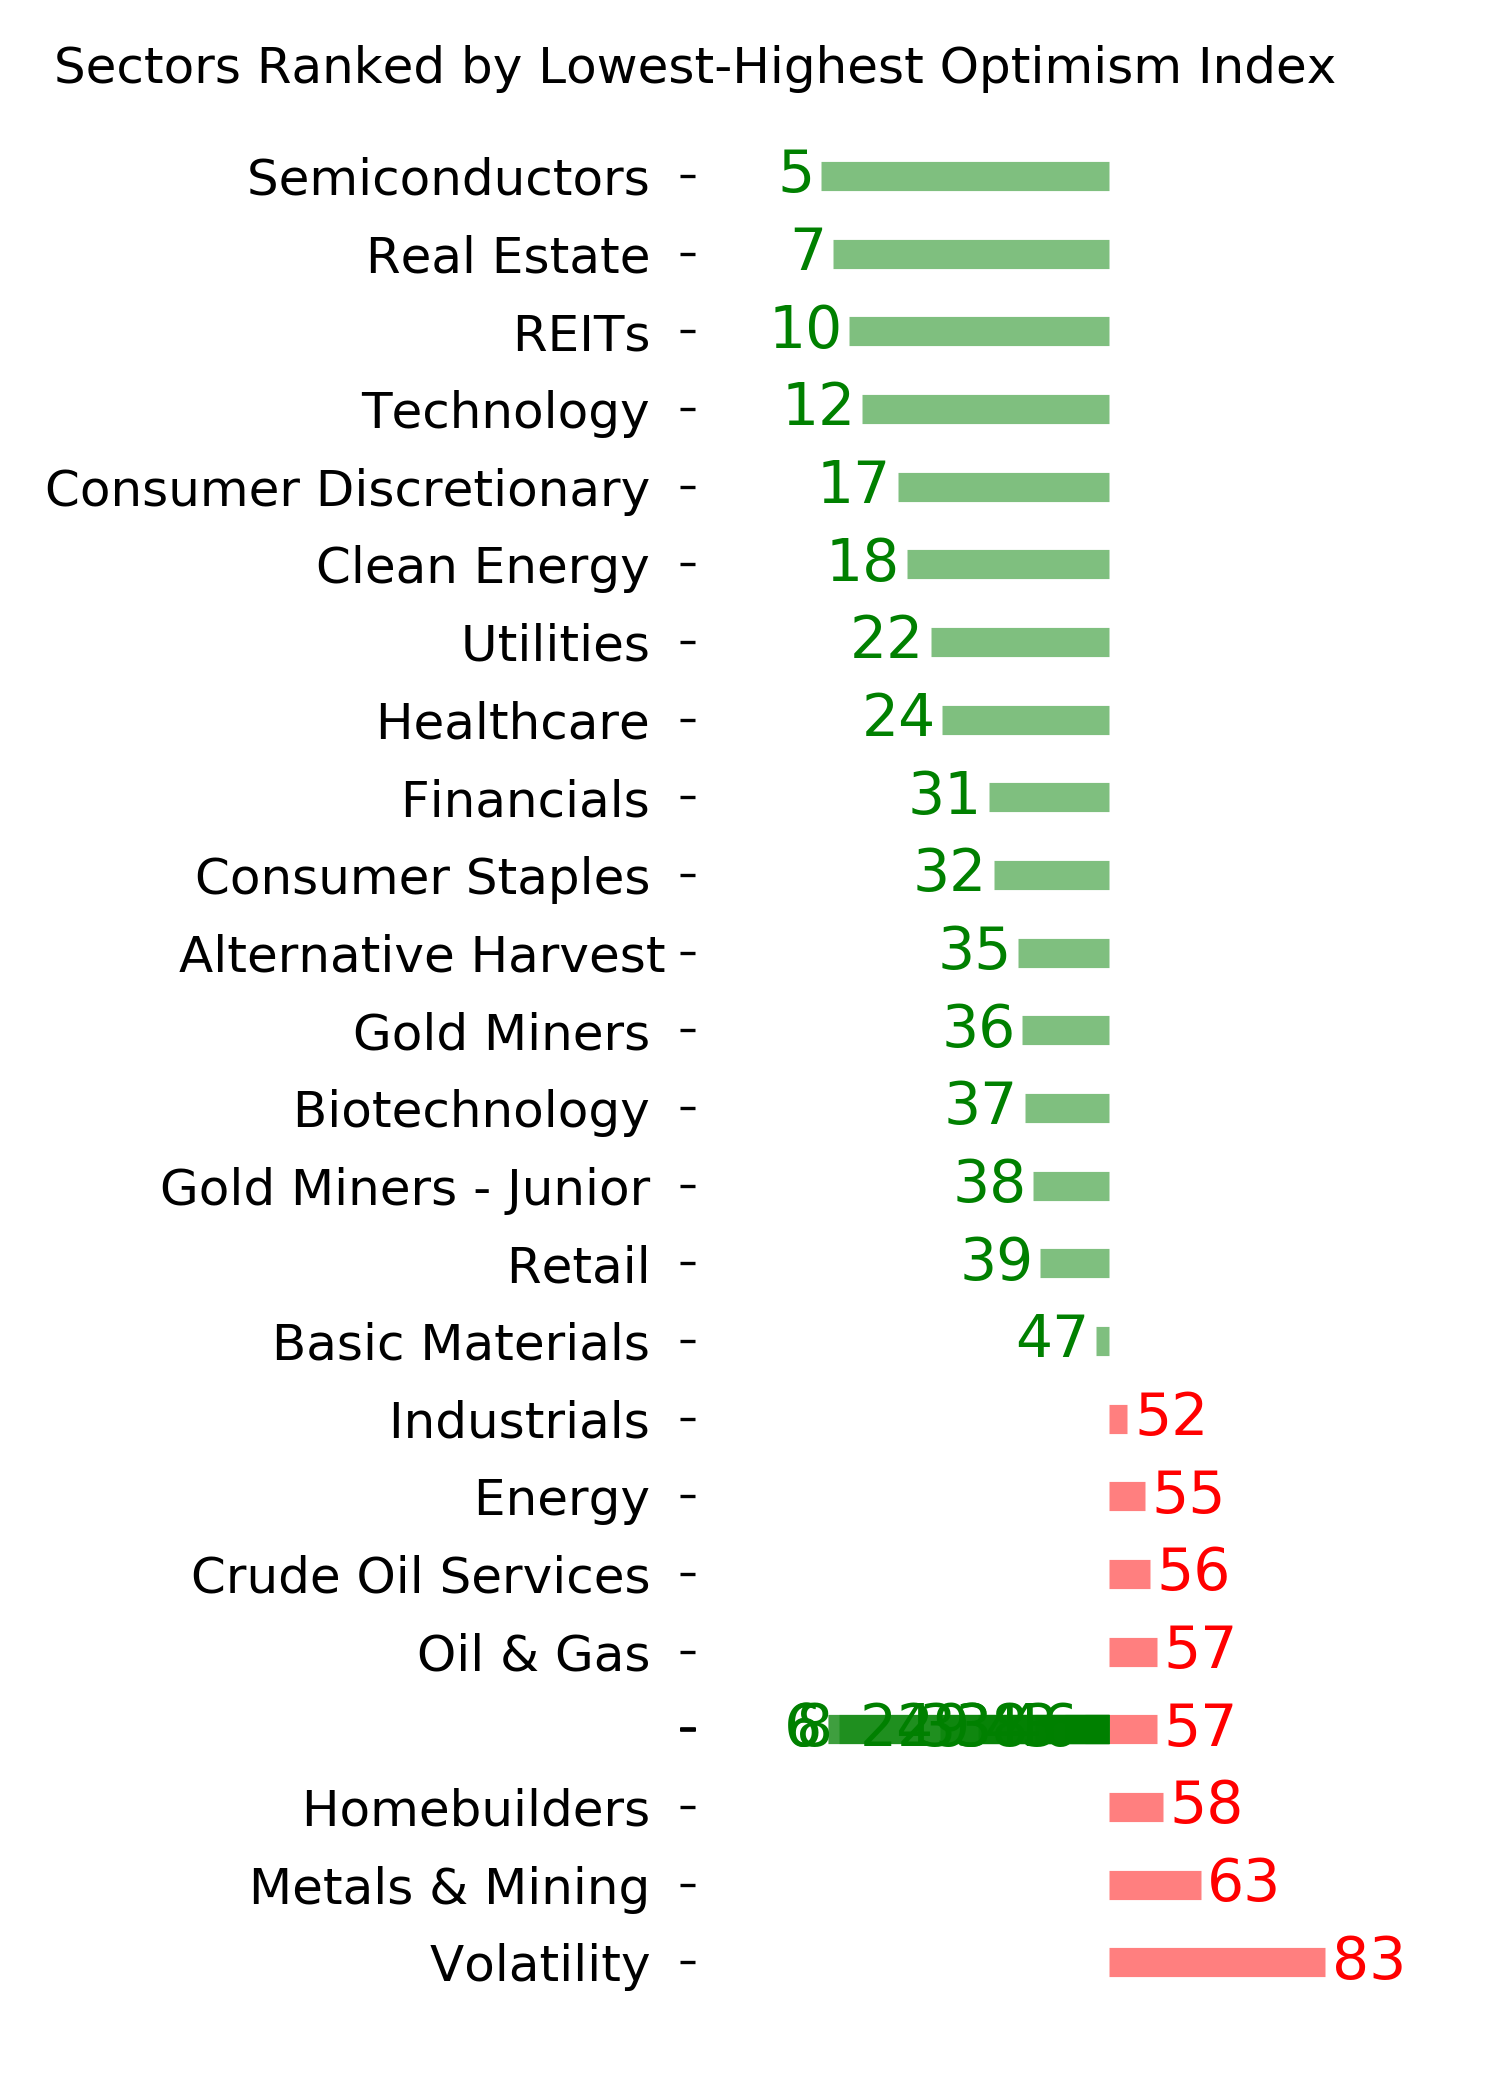
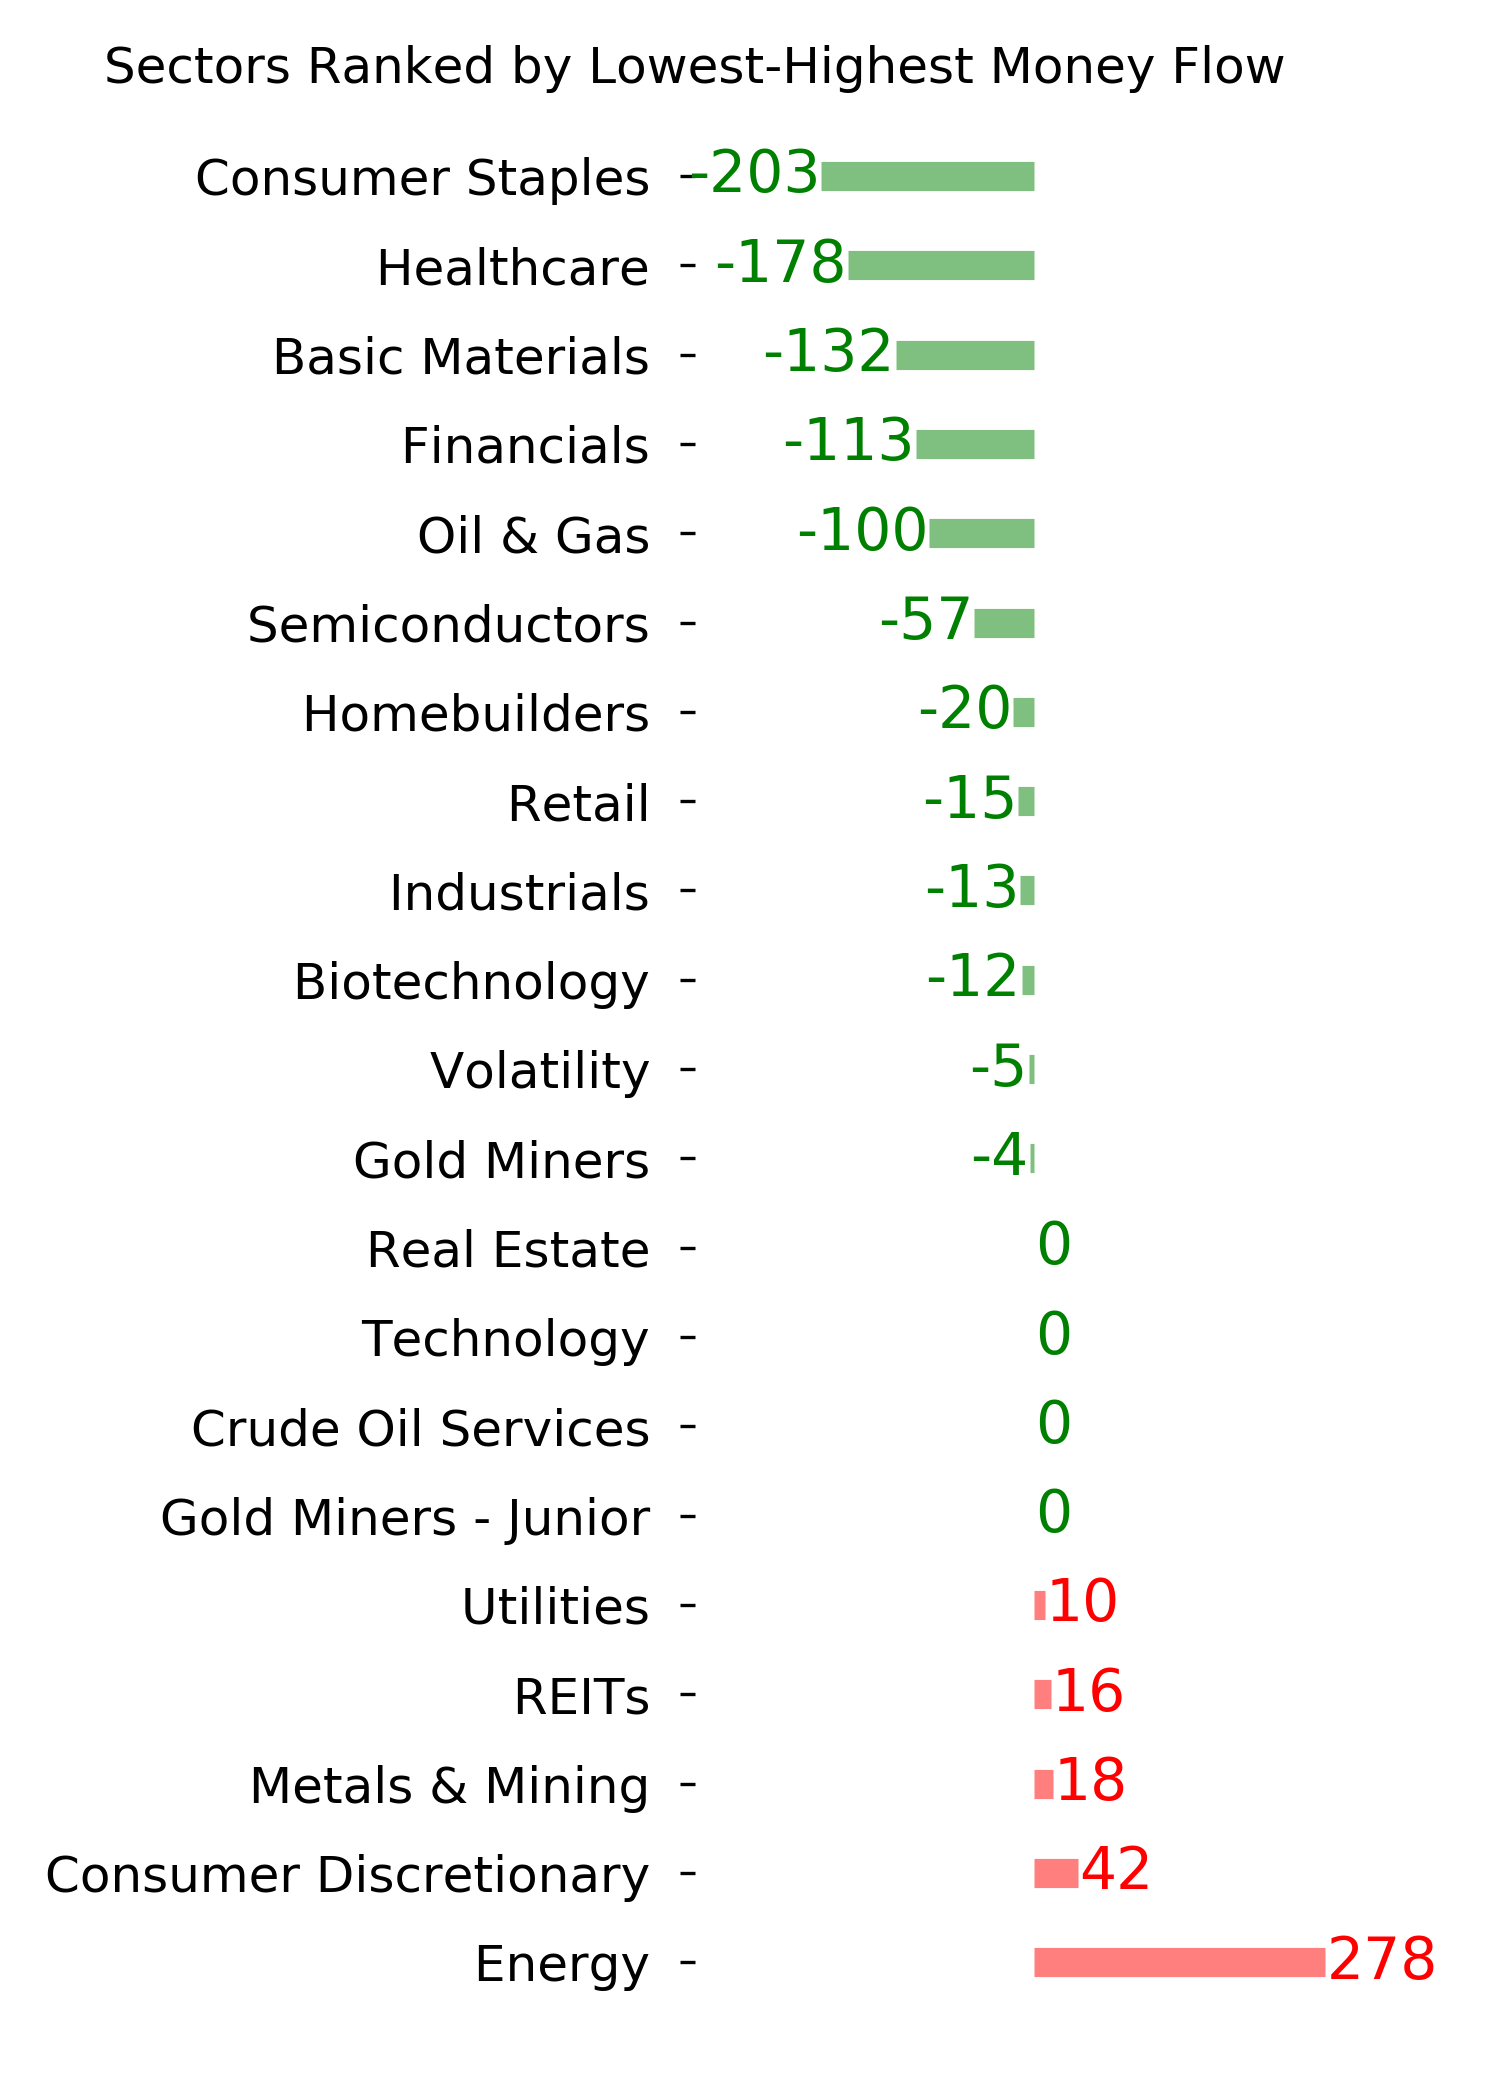
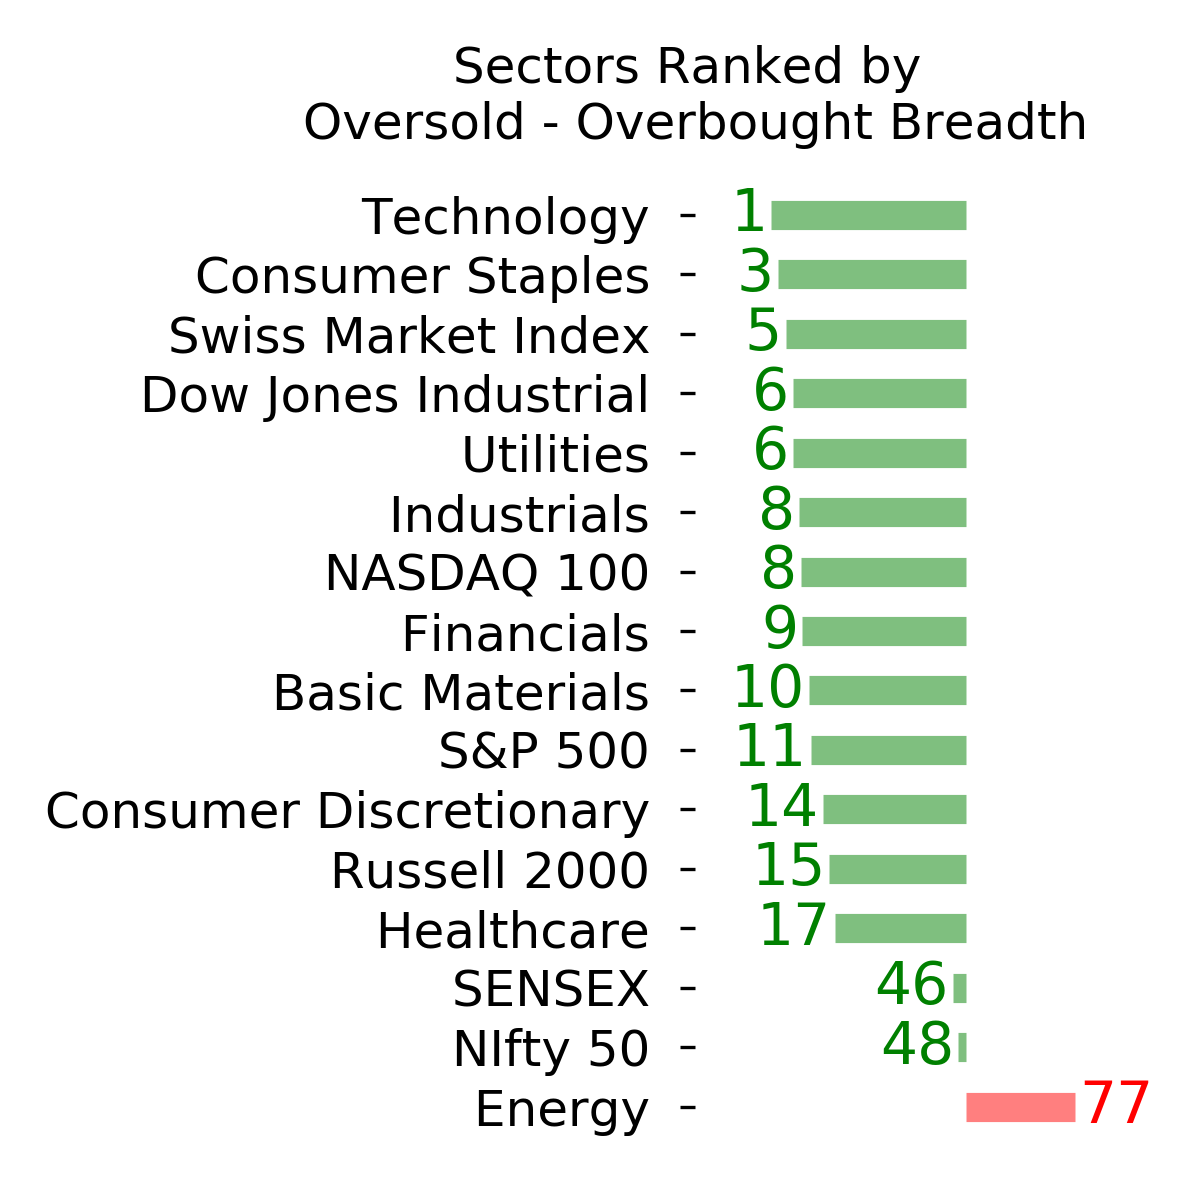
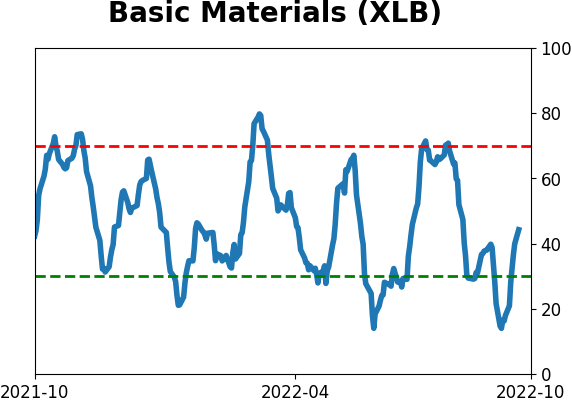
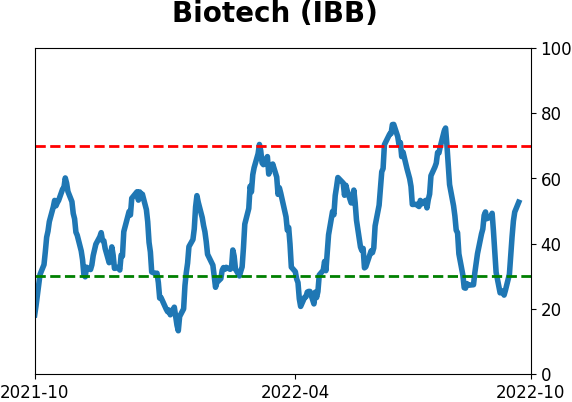
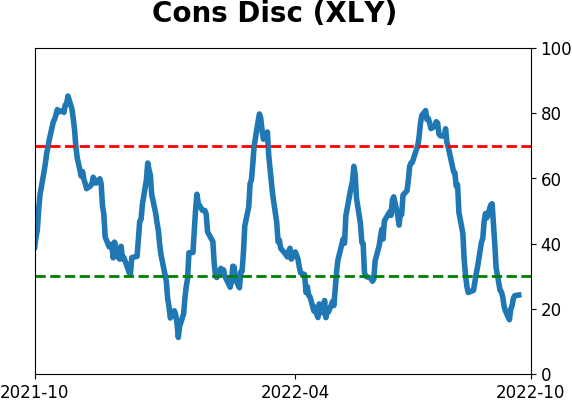
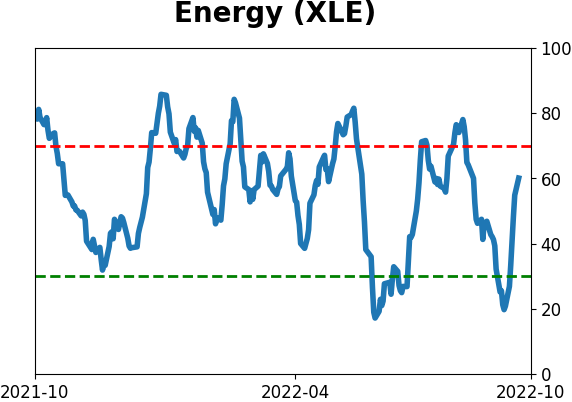
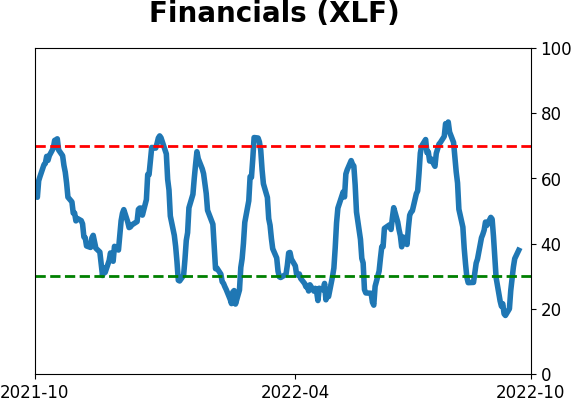
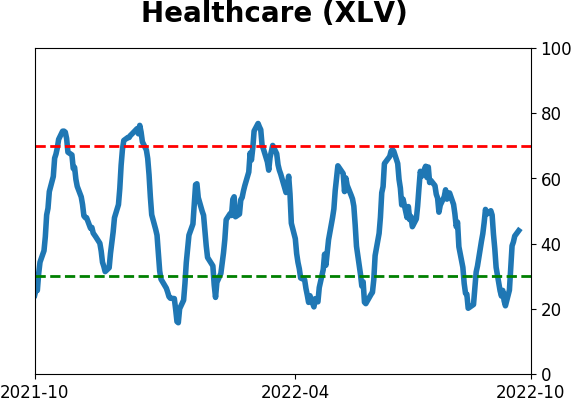
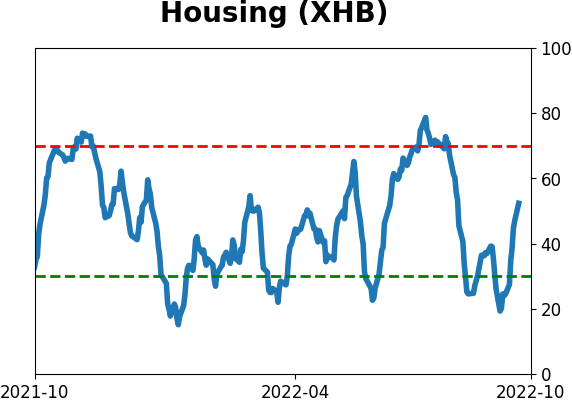
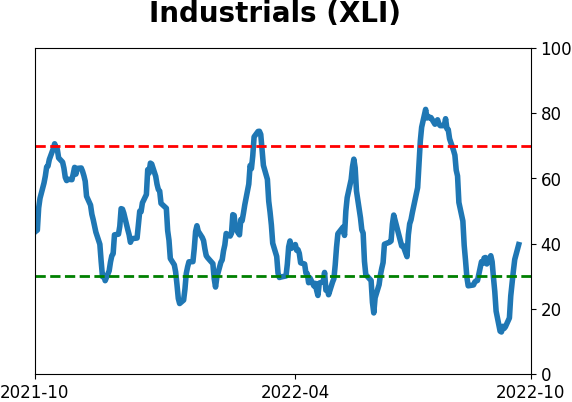
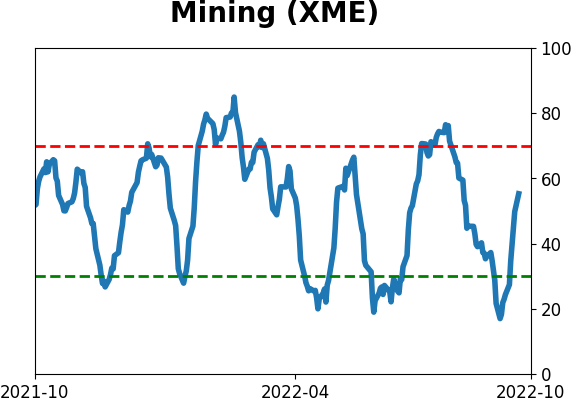
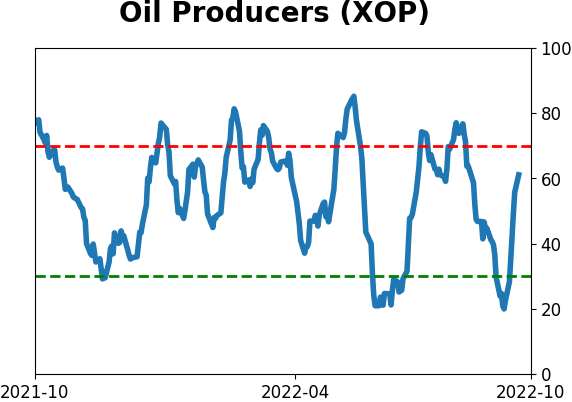
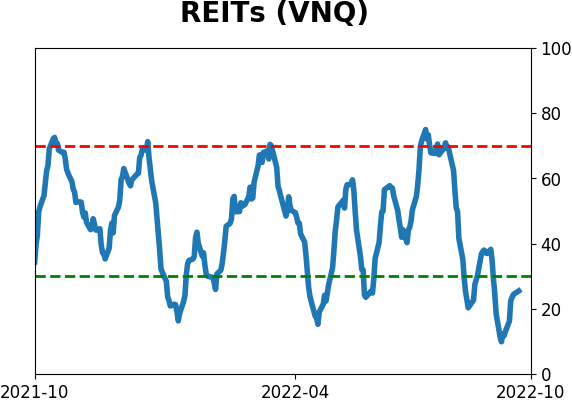
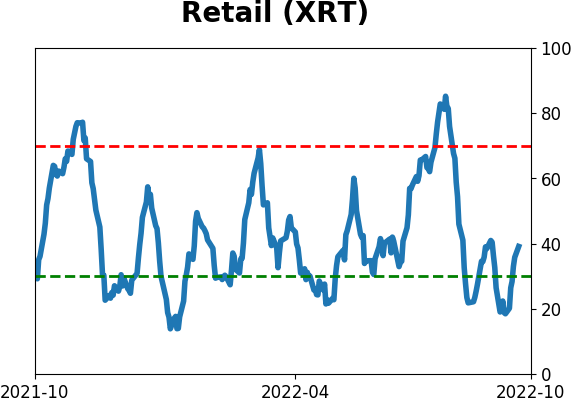
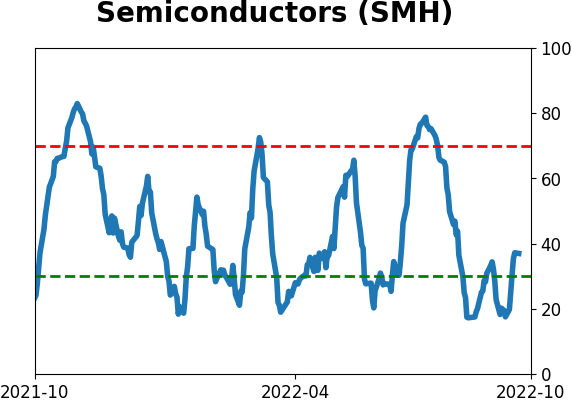
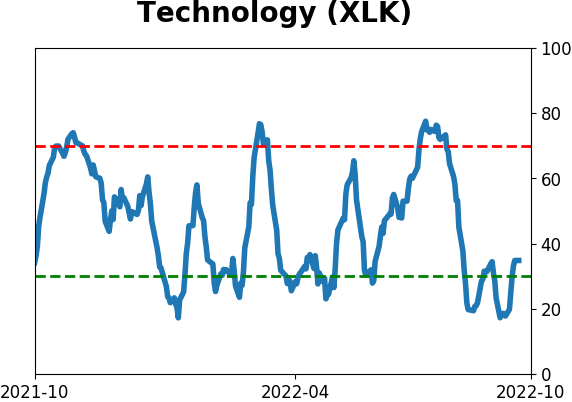
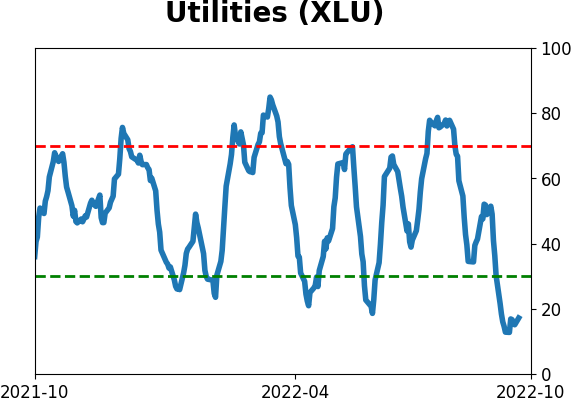
Sector ETF's - 10-Day Moving Average
|
|
|
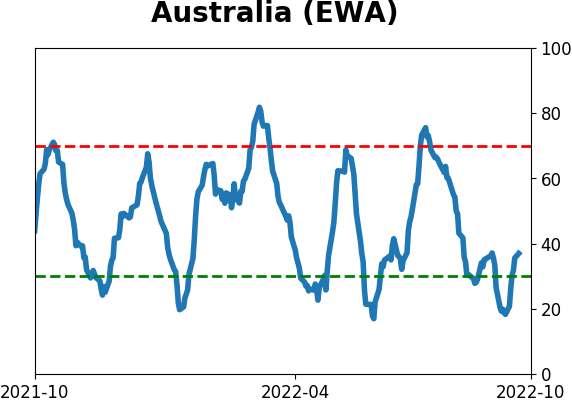
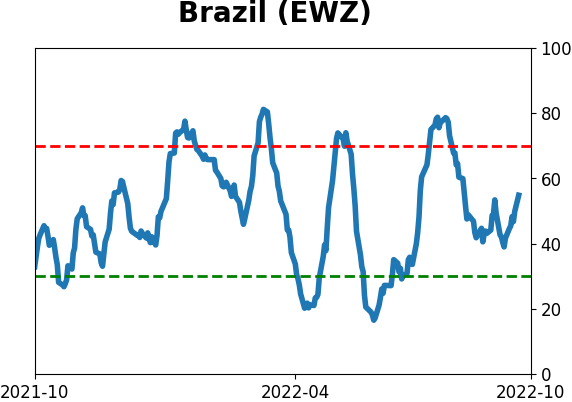
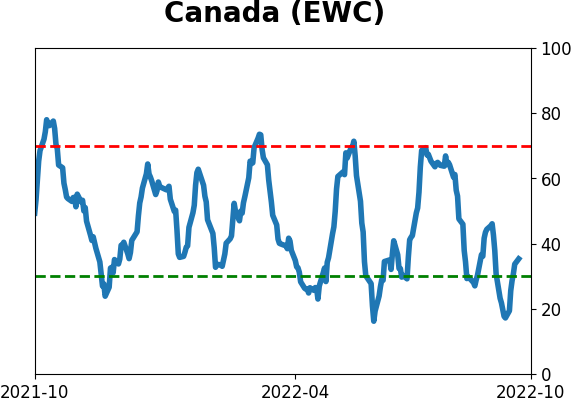
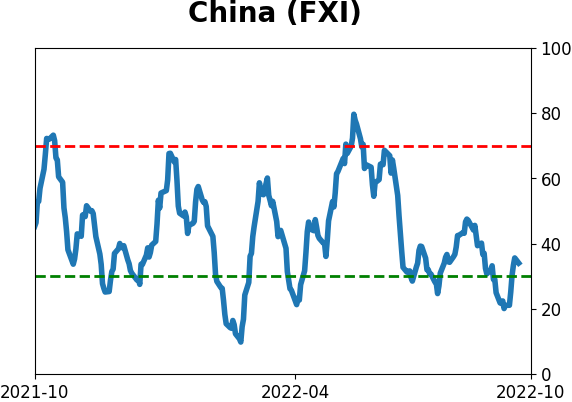
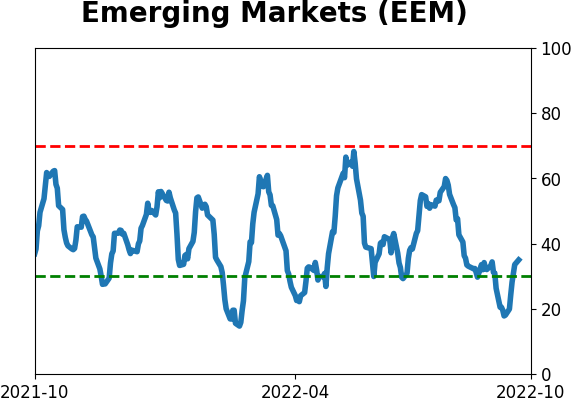
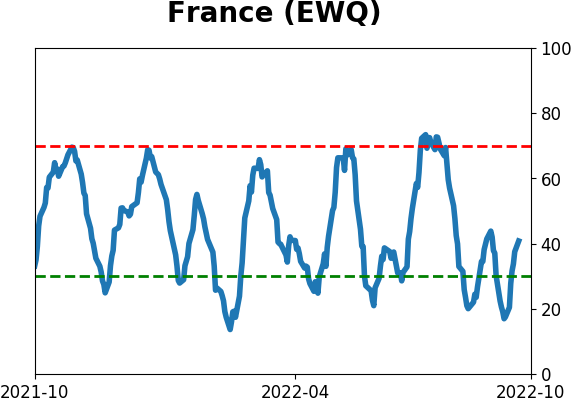
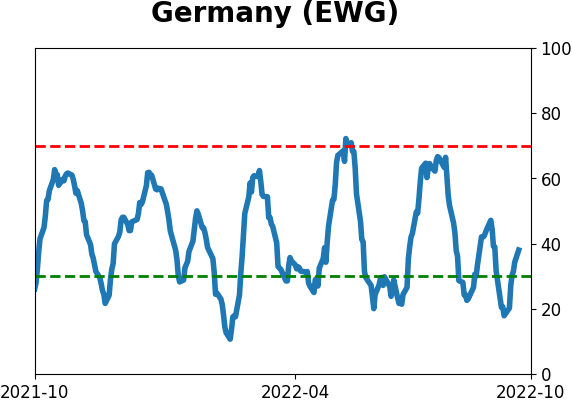
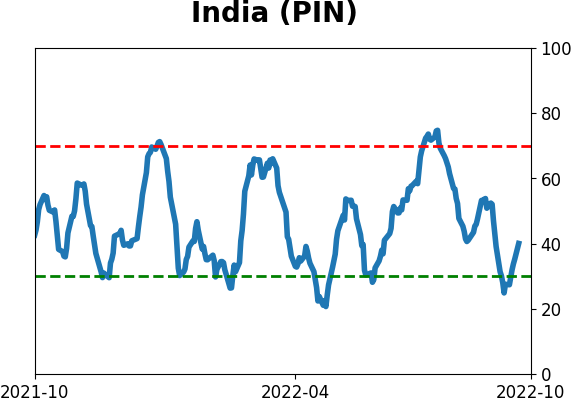
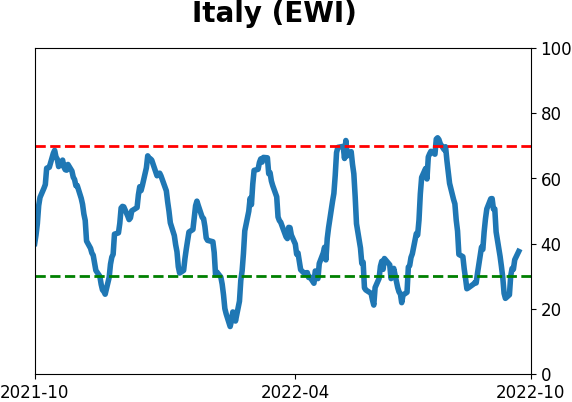
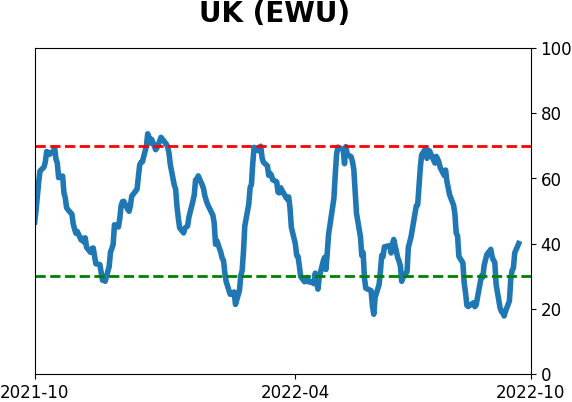
Country ETF's - 10-Day Moving Average
|
|
|
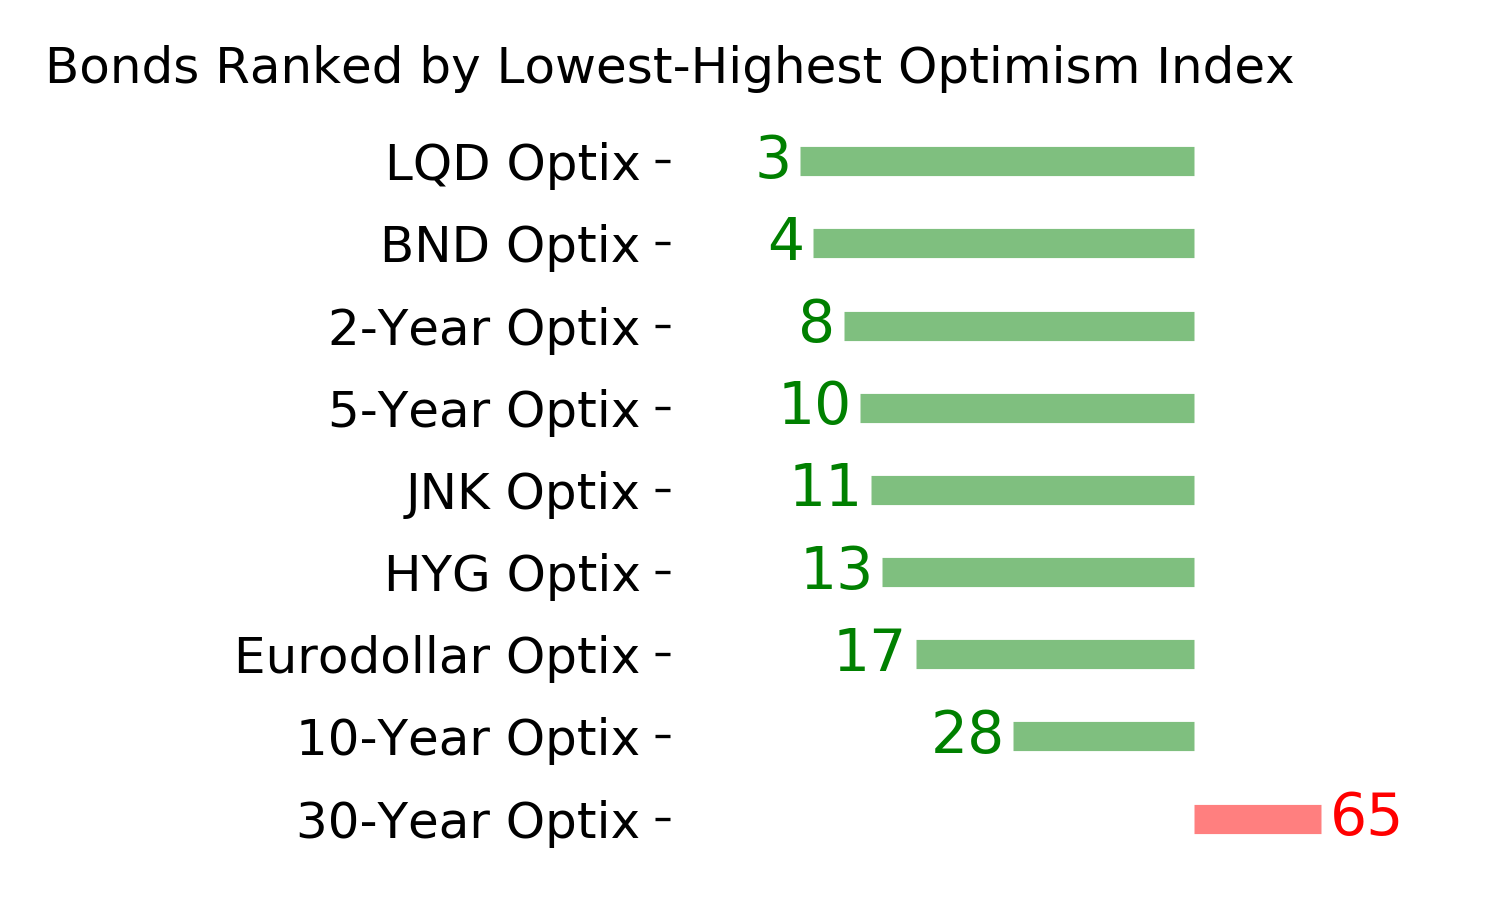
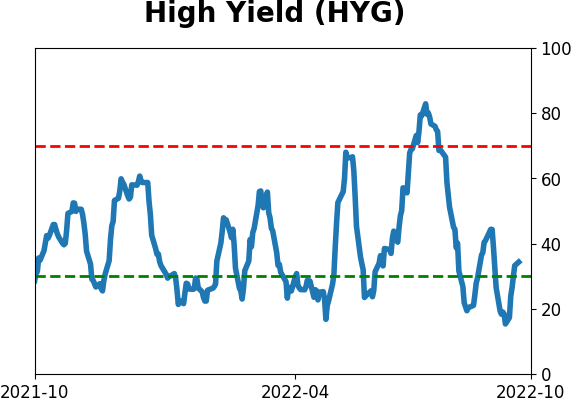
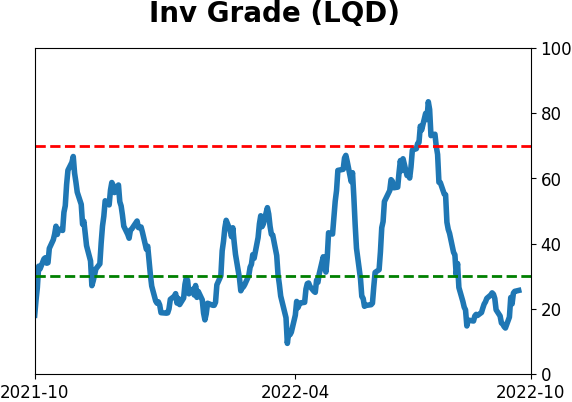
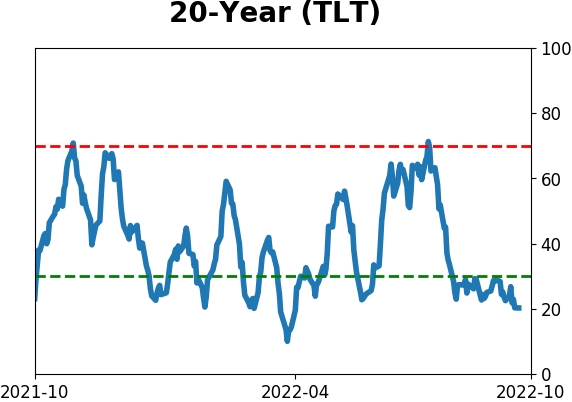
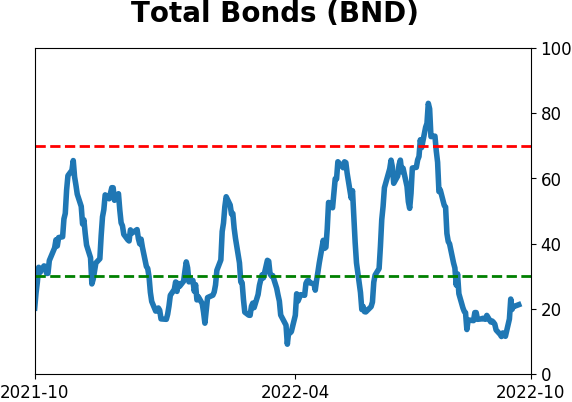
Bond ETF's - 10-Day Moving Average
|
|
|
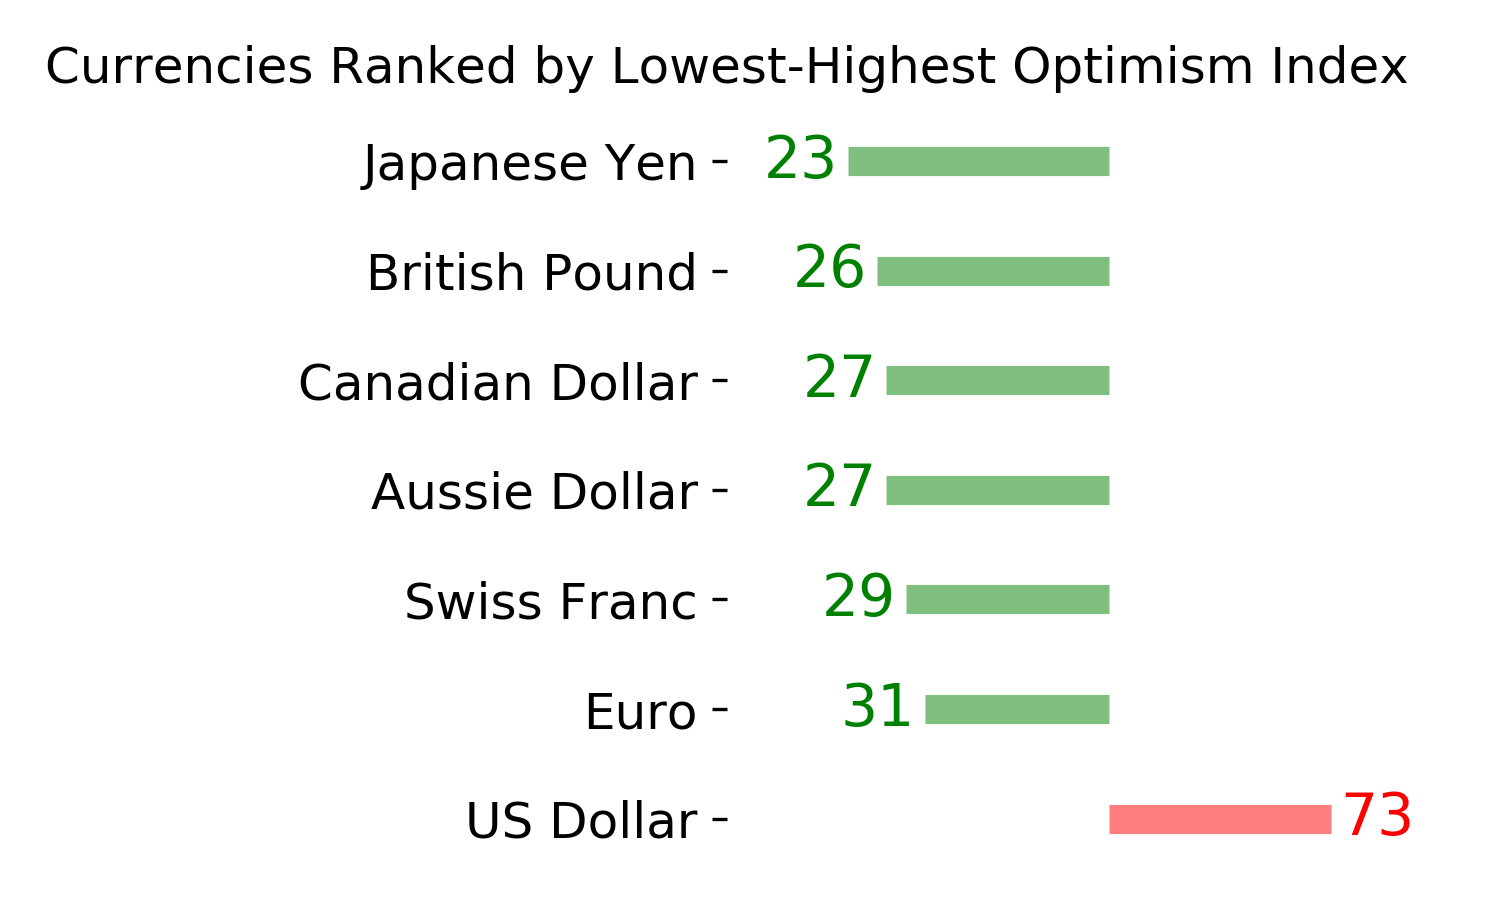
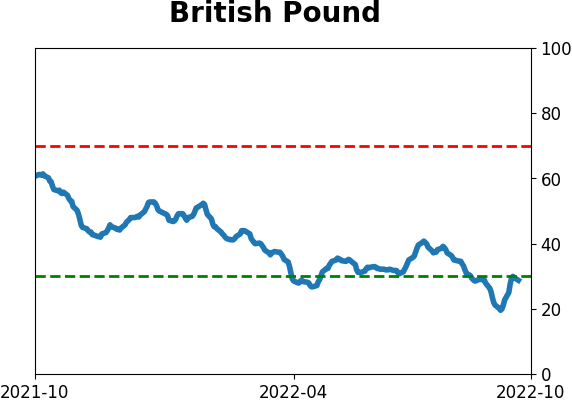
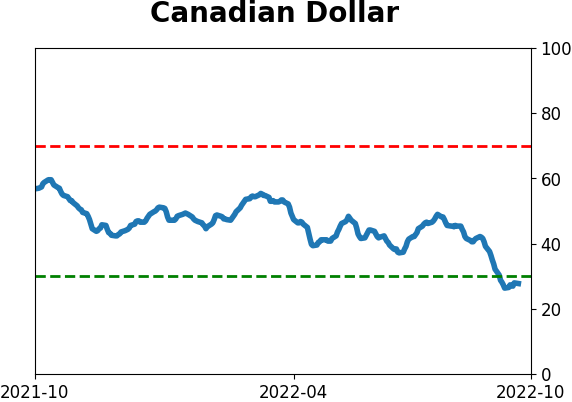
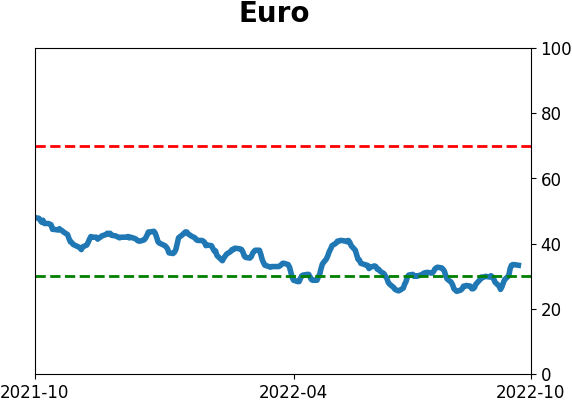
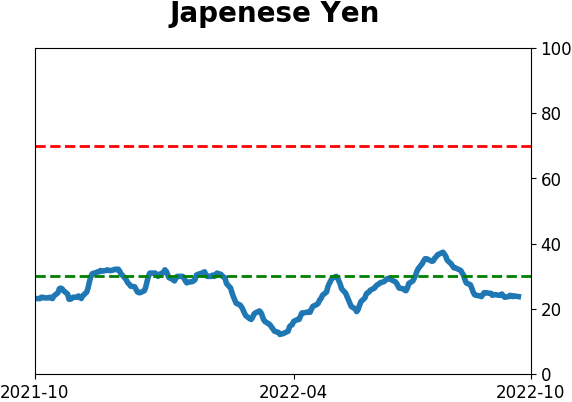
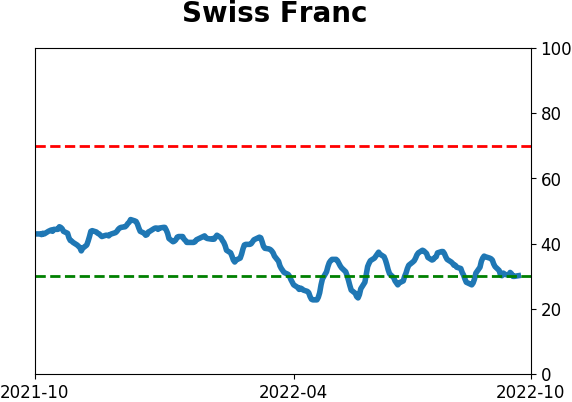
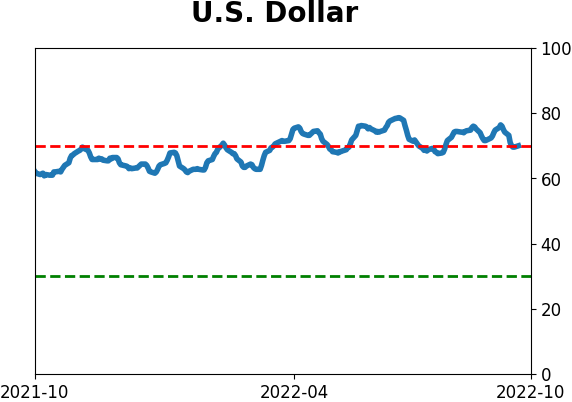
Currency ETF's - 5-Day Moving Average
|
|
|
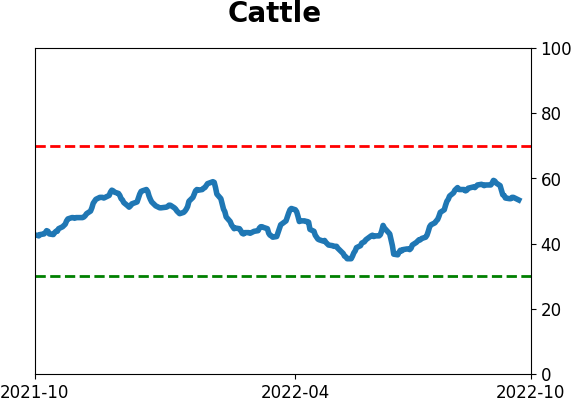
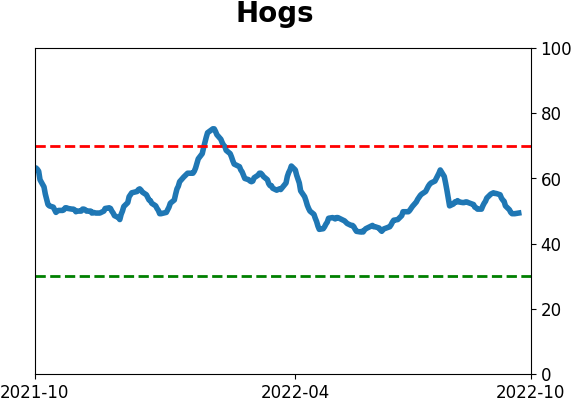
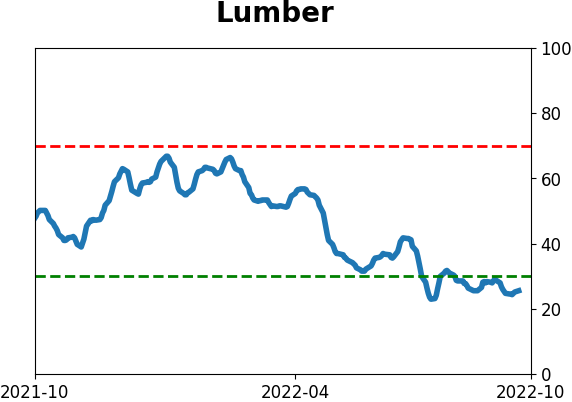
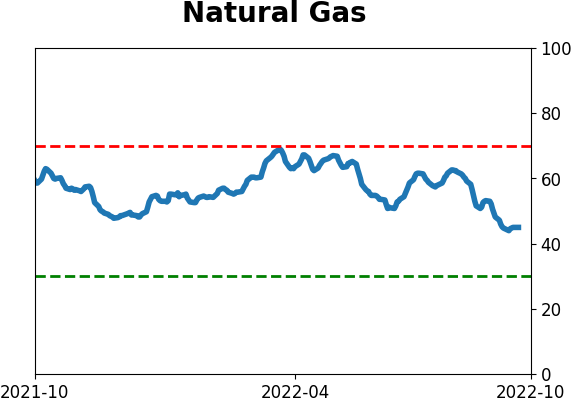
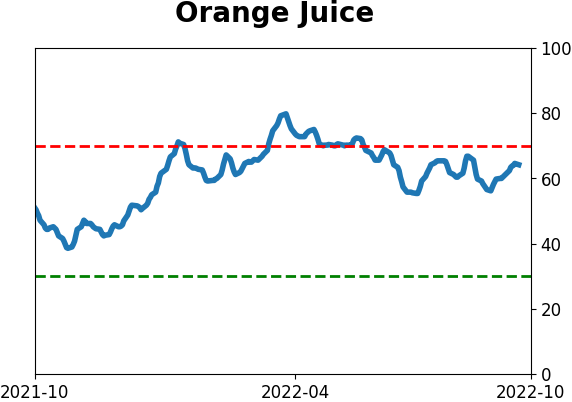
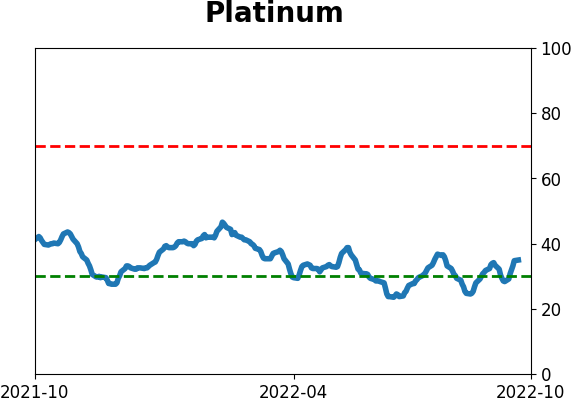
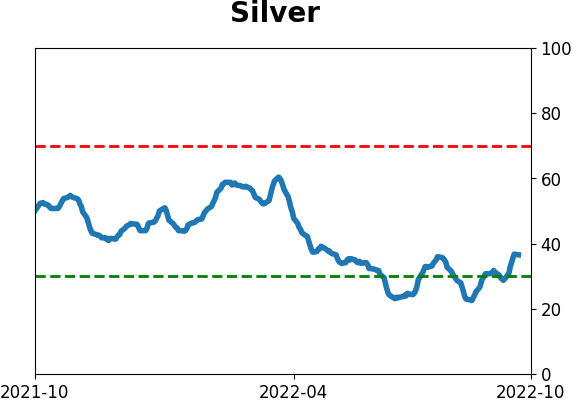
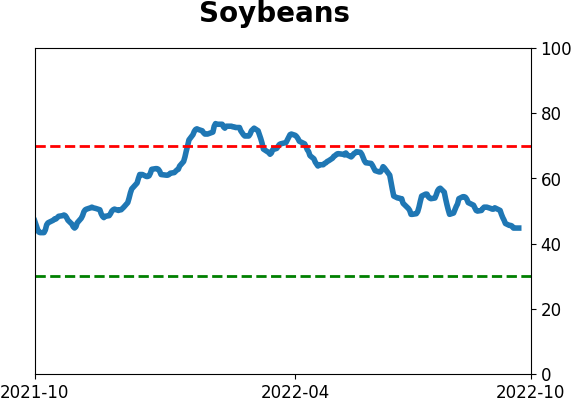
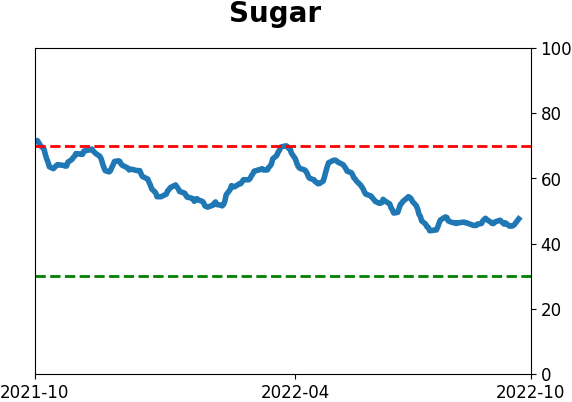
Commodity ETF's - 5-Day Moving Average
|
|