Headlines
|
|
Historic selling pressure in Consumer Staples:
Consumer Staples stocks have gotten hit hard lately, and extremes are piling up. The McClellan Summation Index for the sector is near the worst levels in history. Options traders are betting on more losses, while corporate insiders have been buying.
|
Smart / Dumb Money Confidence
|
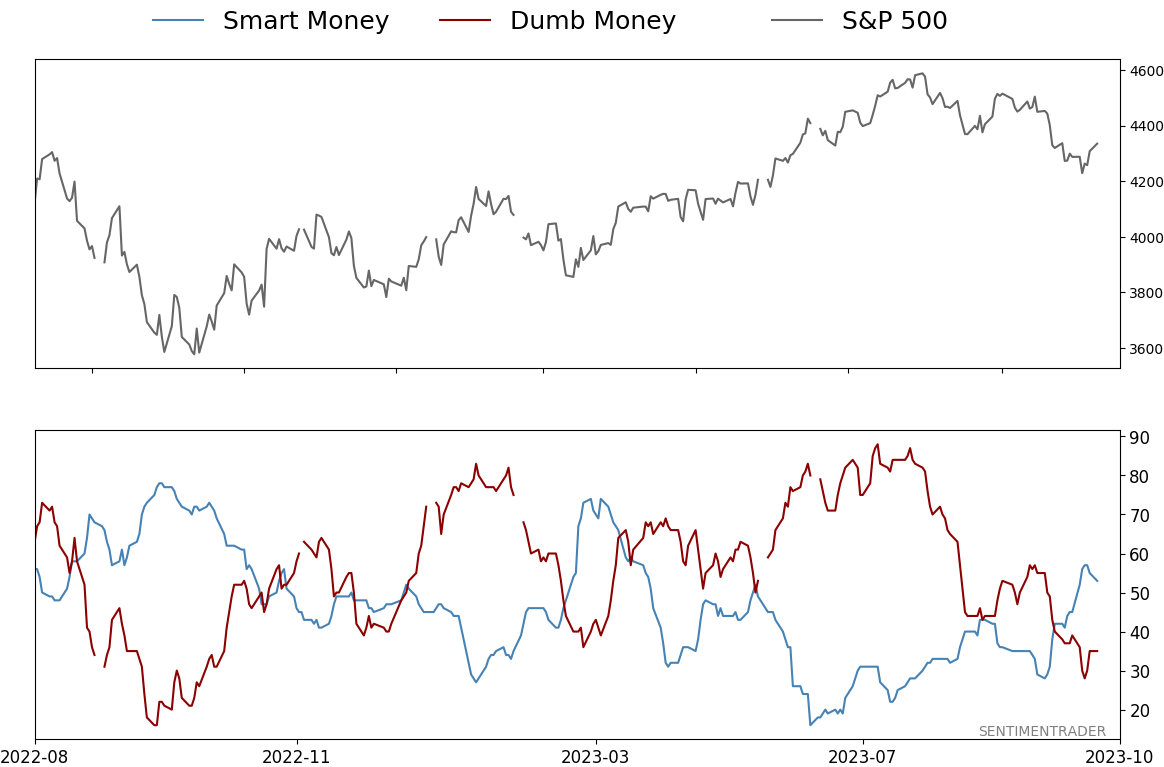
Smart Money Confidence: 53%
Dumb Money Confidence: 35%
|
|
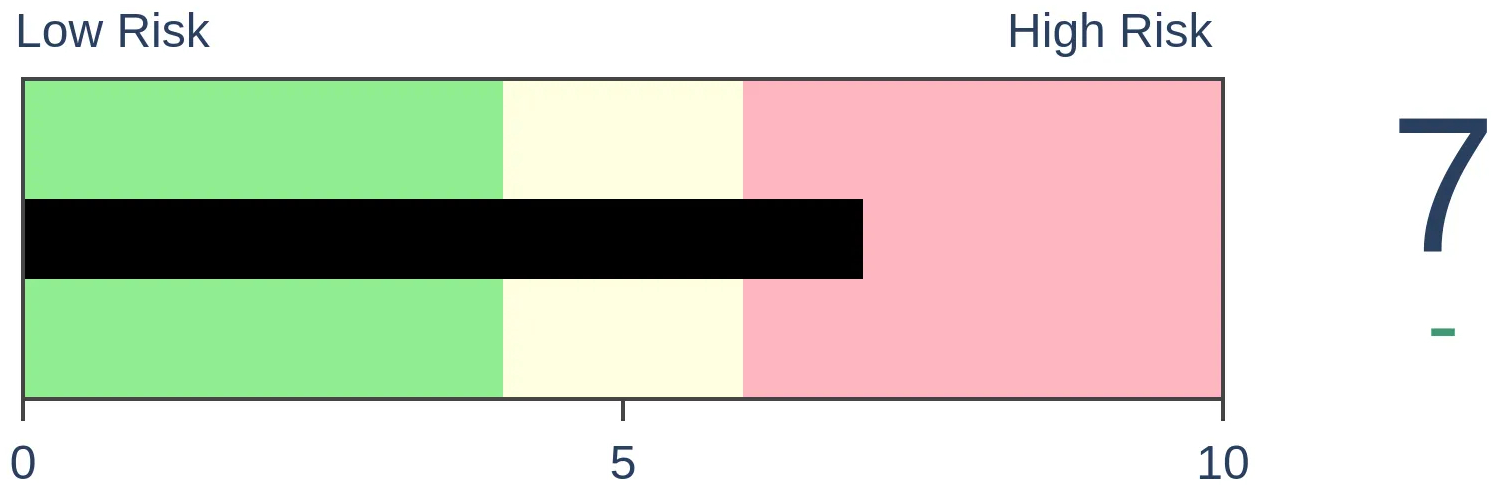
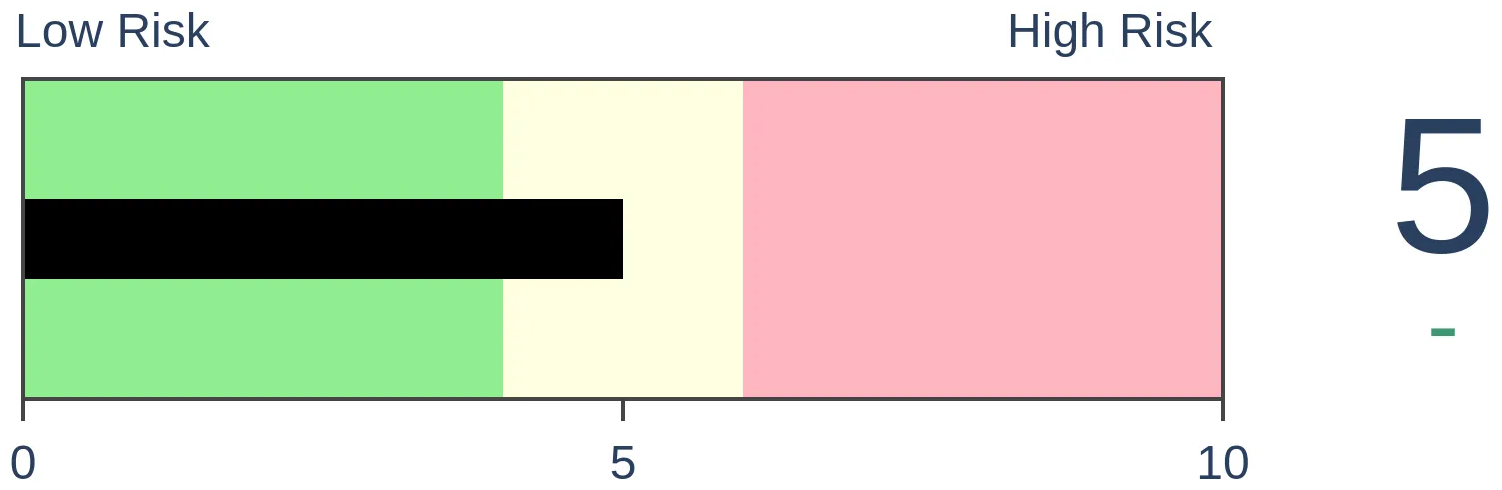
Risk Levels
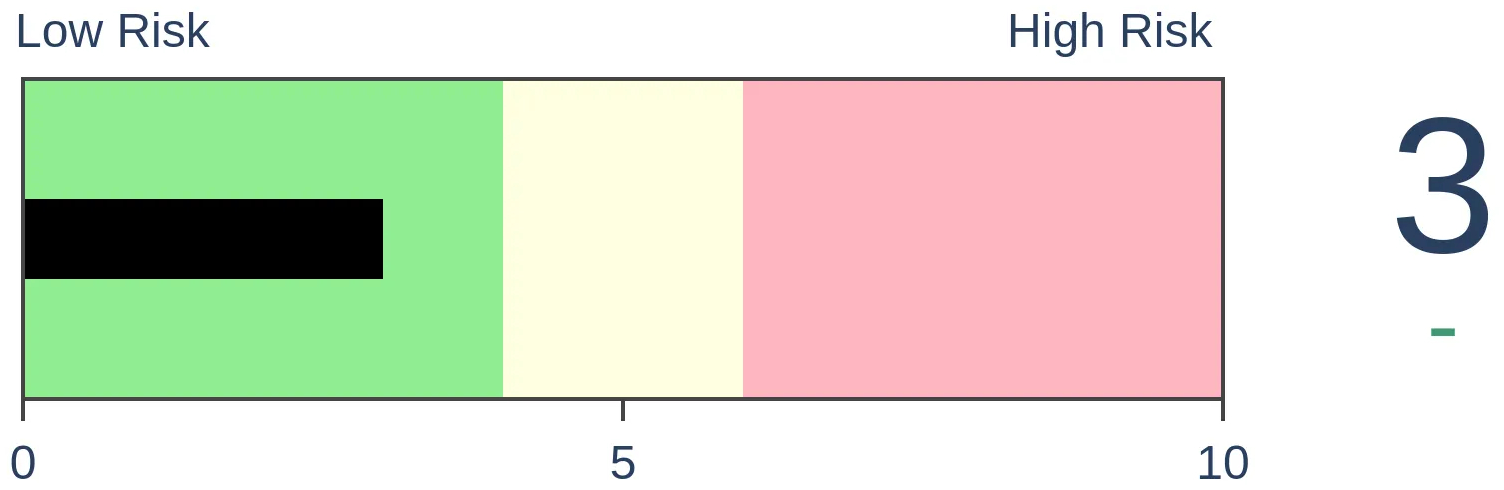
Stocks Short-Term
|
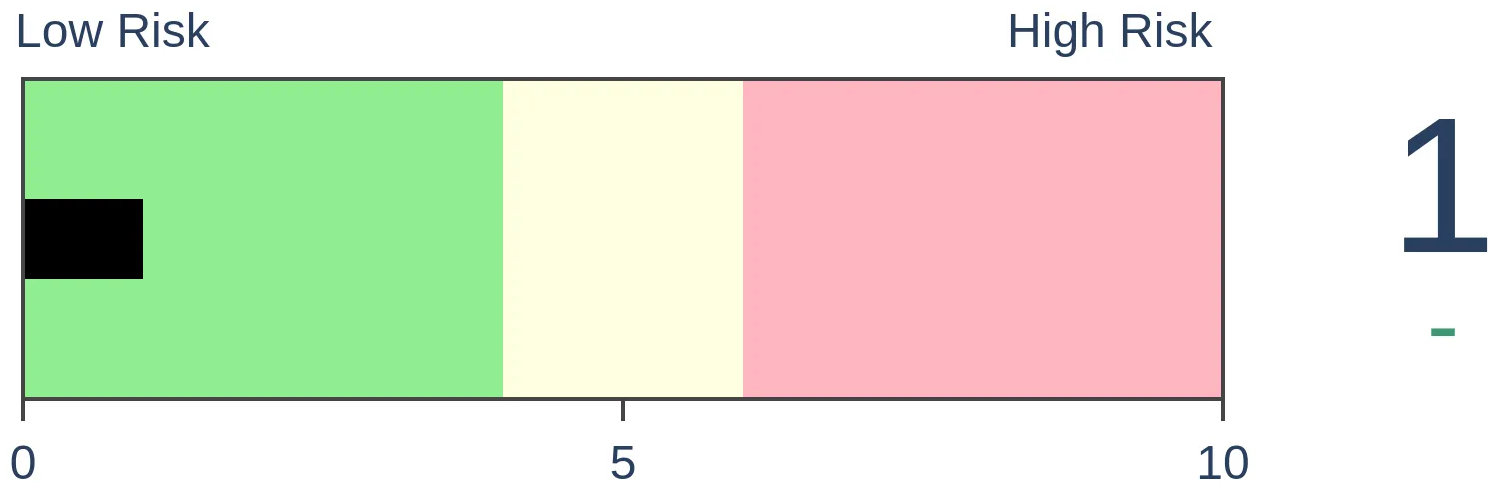
Stocks Medium-Term
|
|
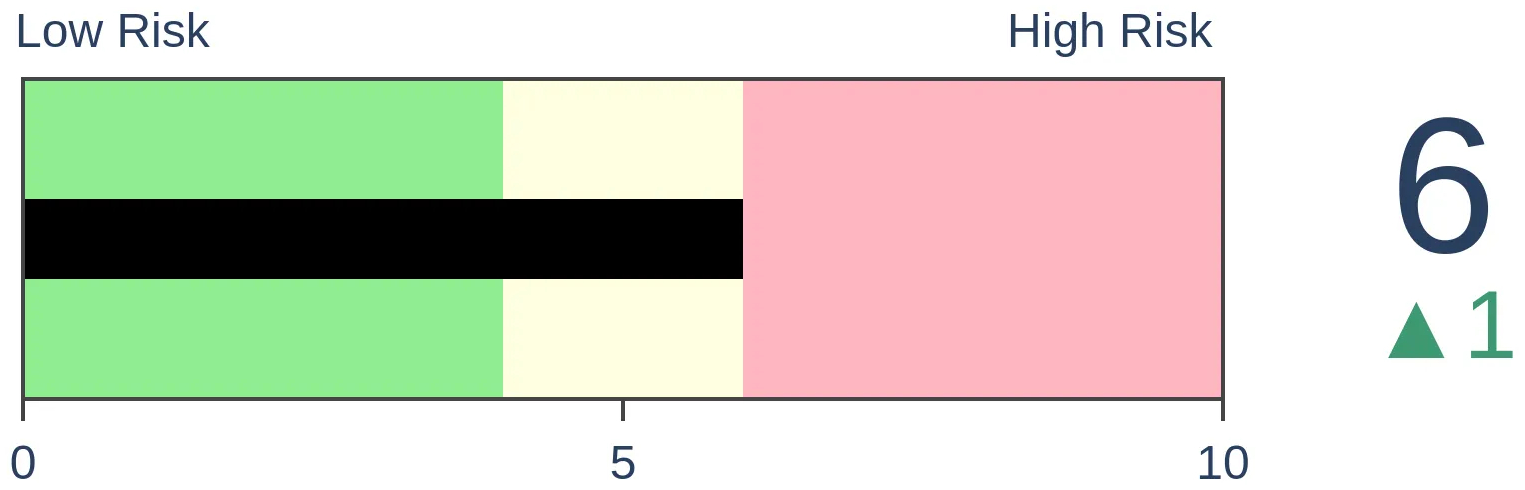
Bonds
|
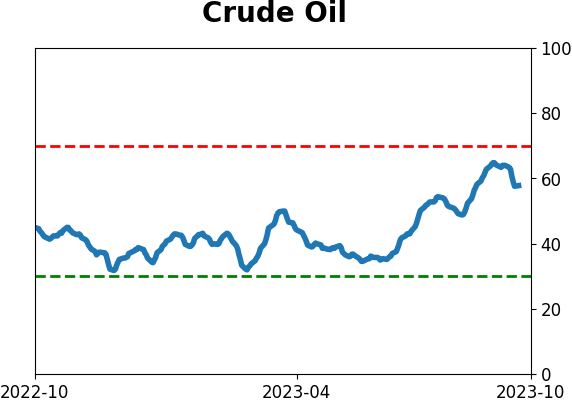
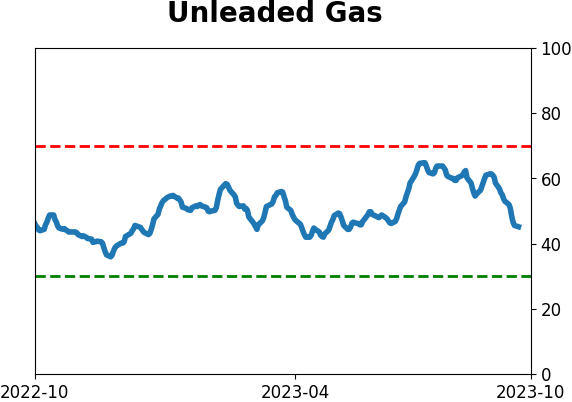
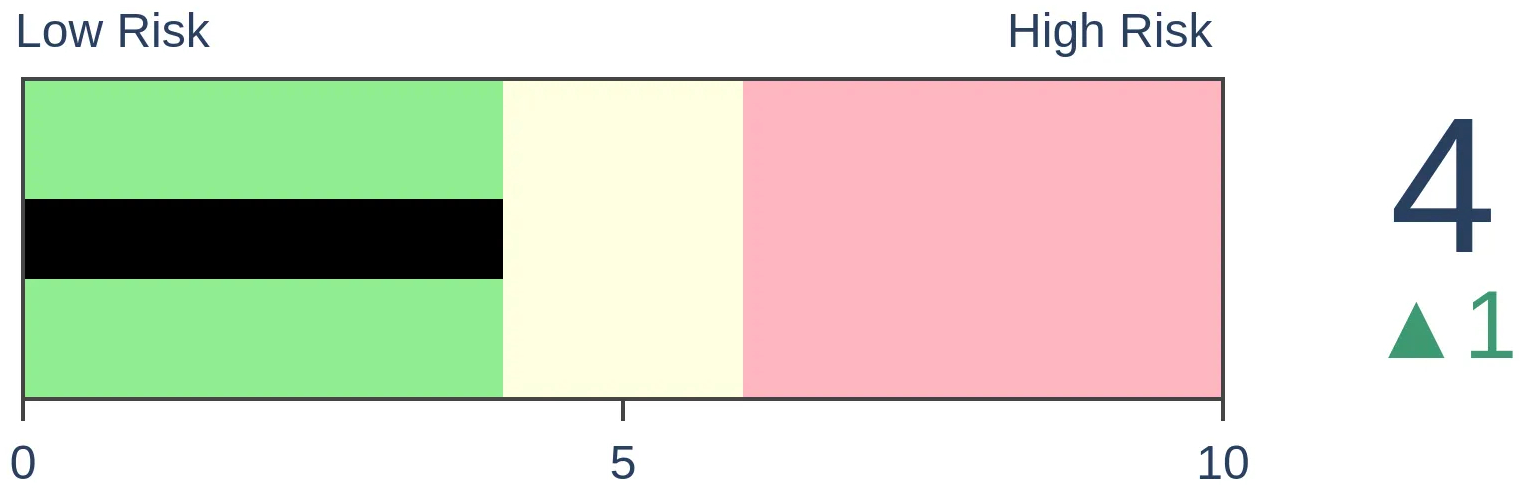
Crude Oil
|
|
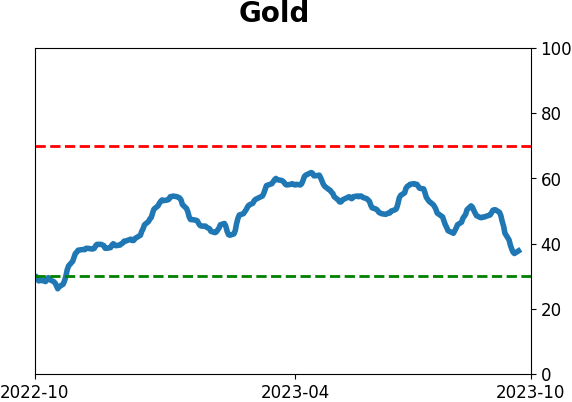
Gold
|
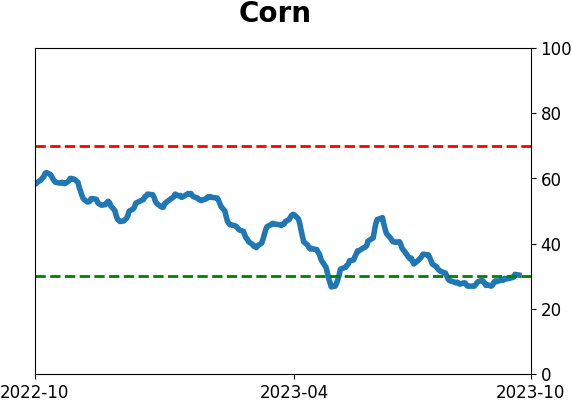
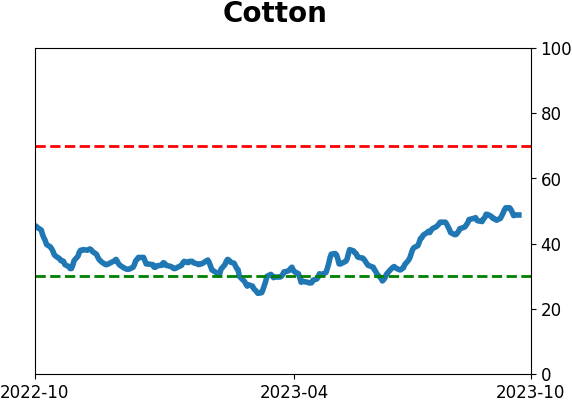
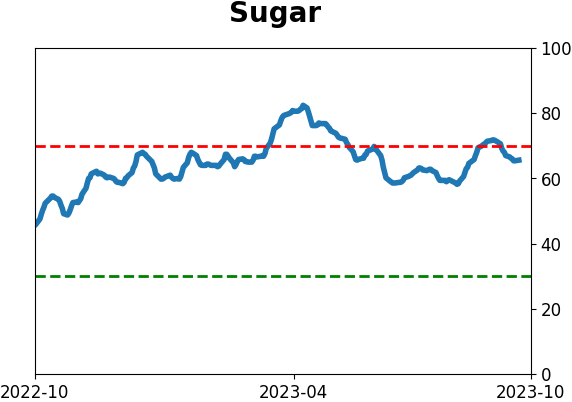
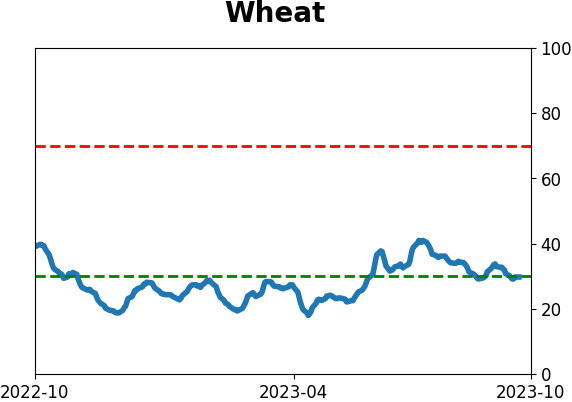
Agriculture
|
|
Research
By Jason Goepfert
BOTTOM LINE
Consumer Staples stocks have gotten hit hard lately, and extremes are piling up. The McClellan Summation Index for the sector is near the worst levels in history. Options traders are betting on more losses, while corporate insiders have been buying.
FORECAST / TIMEFRAME
None
|
Key points:
- The McClellan Summation Index in Consumer Staples is near the worst levels in history
- The sector has a strong tendency to rebound after such extreme internal selling pressure
- At the same time, options traders are betting on more losses while corporate insiders are buying
Long-term internal momentum in Staples is among the worst ever
We looked at the decline in some defensive sectors a couple of times last week. Well..."defensive" should be in quotes because they didn't prove to be all that much of a hideout for equity investors.
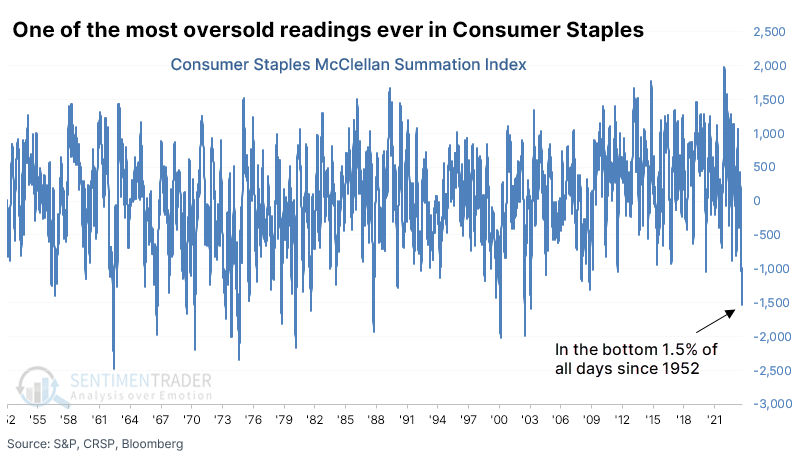
Selling pressure in some of the stocks has been curiously strong not only in Utilities but also in Consumer Staples. The McClellan Summation Index for Staples neared -1700 for one of the few times in 25 years.
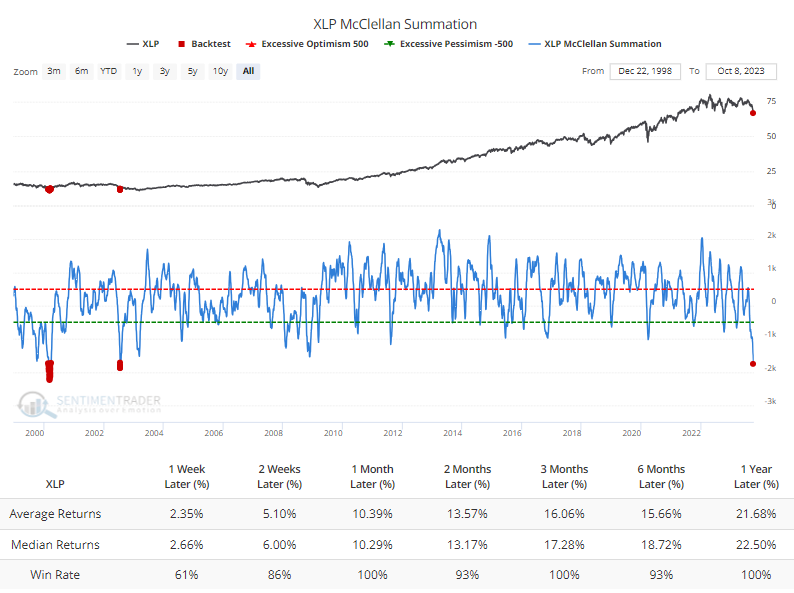
The only two distinct occurrences were during the last two significant bear markets.
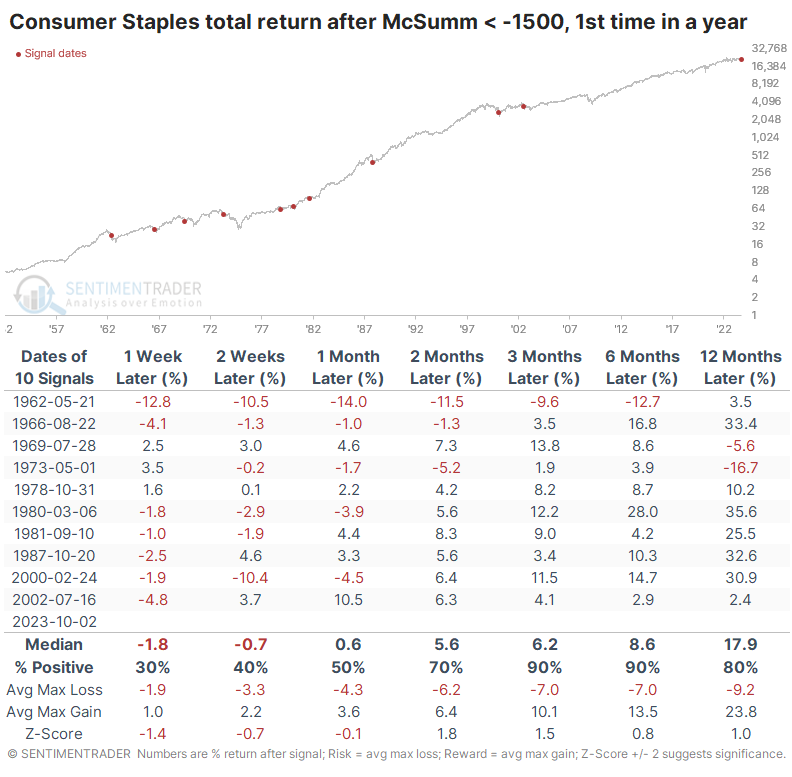
The Backtest Engine shows impressive returns after even lesser extremes. The sector gained every time over the next two months, averaging about 7%. A year later, those gains averaged more than 20%.
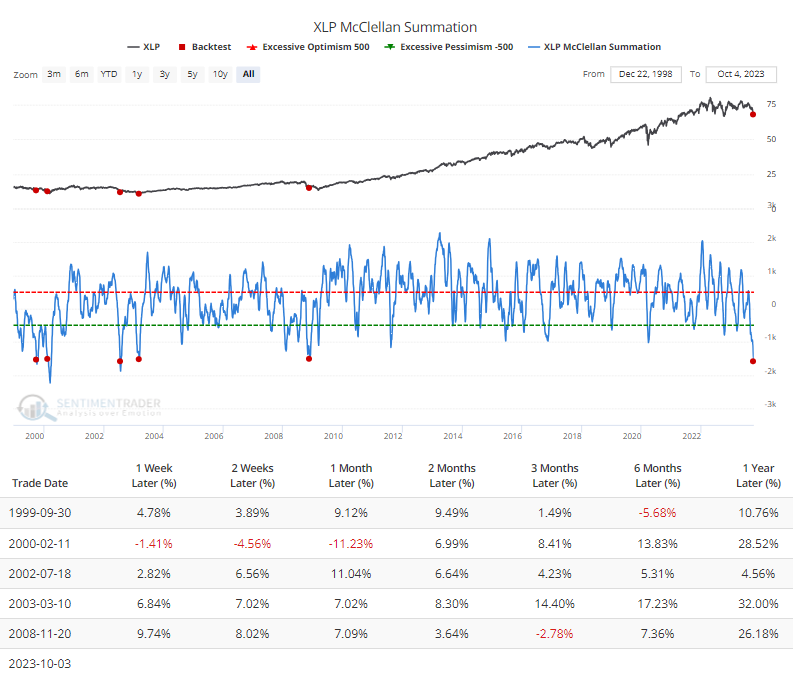
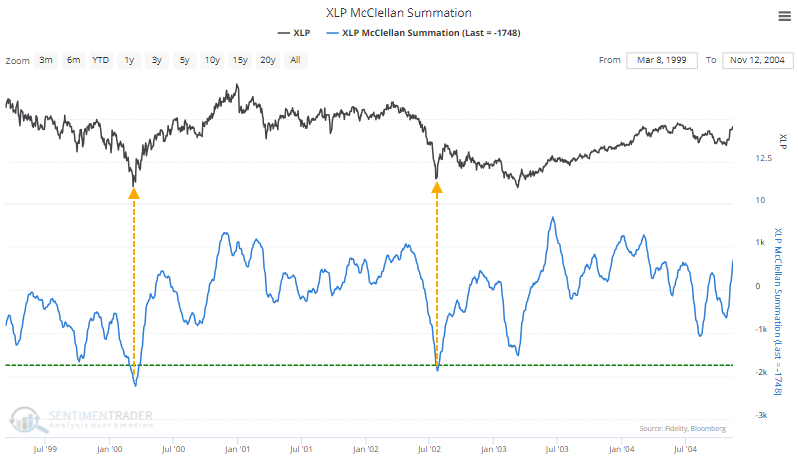
We get slightly different results if we use a different data source. This source shows that a reading below -1500 ranks in the bottom 1.5% of all days in the past 70 years.
The difference in data sets is primarily due to a slight difference in the number of stocks in the sector that advanced or declined daily. Minor differences in daily figures can have an outsized impact on longer-term cumulative indicators like the Summation Index. Regardless, even lesser extremes than we see now have preceded some further short-term weakness but medium- to long-term strength in the sector.
Dumb money is selling; smart money is buying
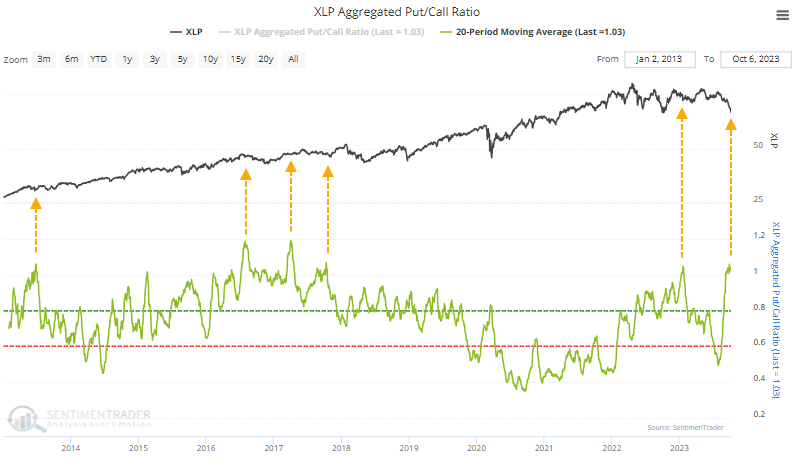
Options traders tend to be trend-followers, buying protective puts after an investment declines and buying speculative calls after it has rallied. We're seeing that behavior lately in Consumer Staples stocks, with one of the highest ratios of puts traded to calls in a decade.
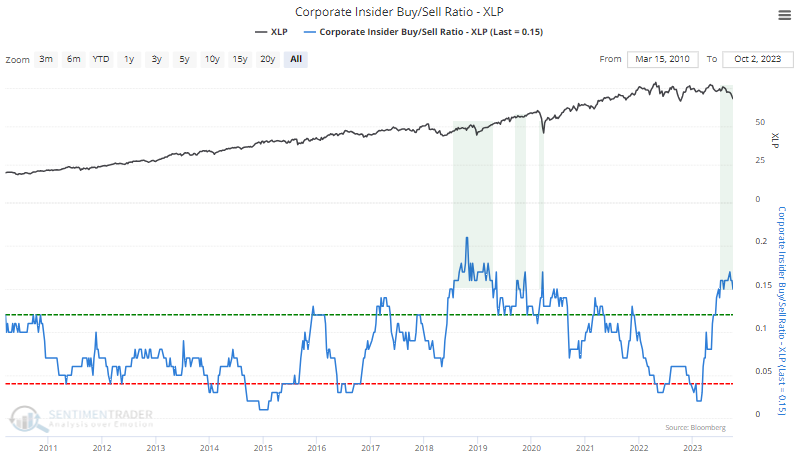
At the opposite end of the spectrum, corporate insiders at Staples companies have been busy buying shares while pulling back on selling. That has pushed the Insider Buy/Sell Ratio to one of the highest levels in over a decade.
Bulls don't want to see extreme selling pressure among insiders, but it's relatively inconsistent as a predictor (insiders sell for all kinds of reasons). Insider buying, however, tends to be one of the more consistent bullish indicators among all that we follow (insiders mostly buy for only one reason).
 What the research tells us...
With markets getting rocked over the last couple of months, one might reasonably expect defensive stocks to be something of a safe haven. It has most assuredly not worked out that way, likely due to the double-whammy of a horrible bond market. Defensive stocks have been directly in the cross-hairs of that tsunami, and many are showing signs of being washed out. That was the case in Utilities and increasingly in Consumer Staples.
Every moment in history is unique, but investors mostly behave more or less consistently at extremes. Currently, they're starting to panic in many formerly defensive stocks. Historically, that has resulted in positive returns for the sectors over the medium- to long-term of 3-12 months.
Indicators at Extremes
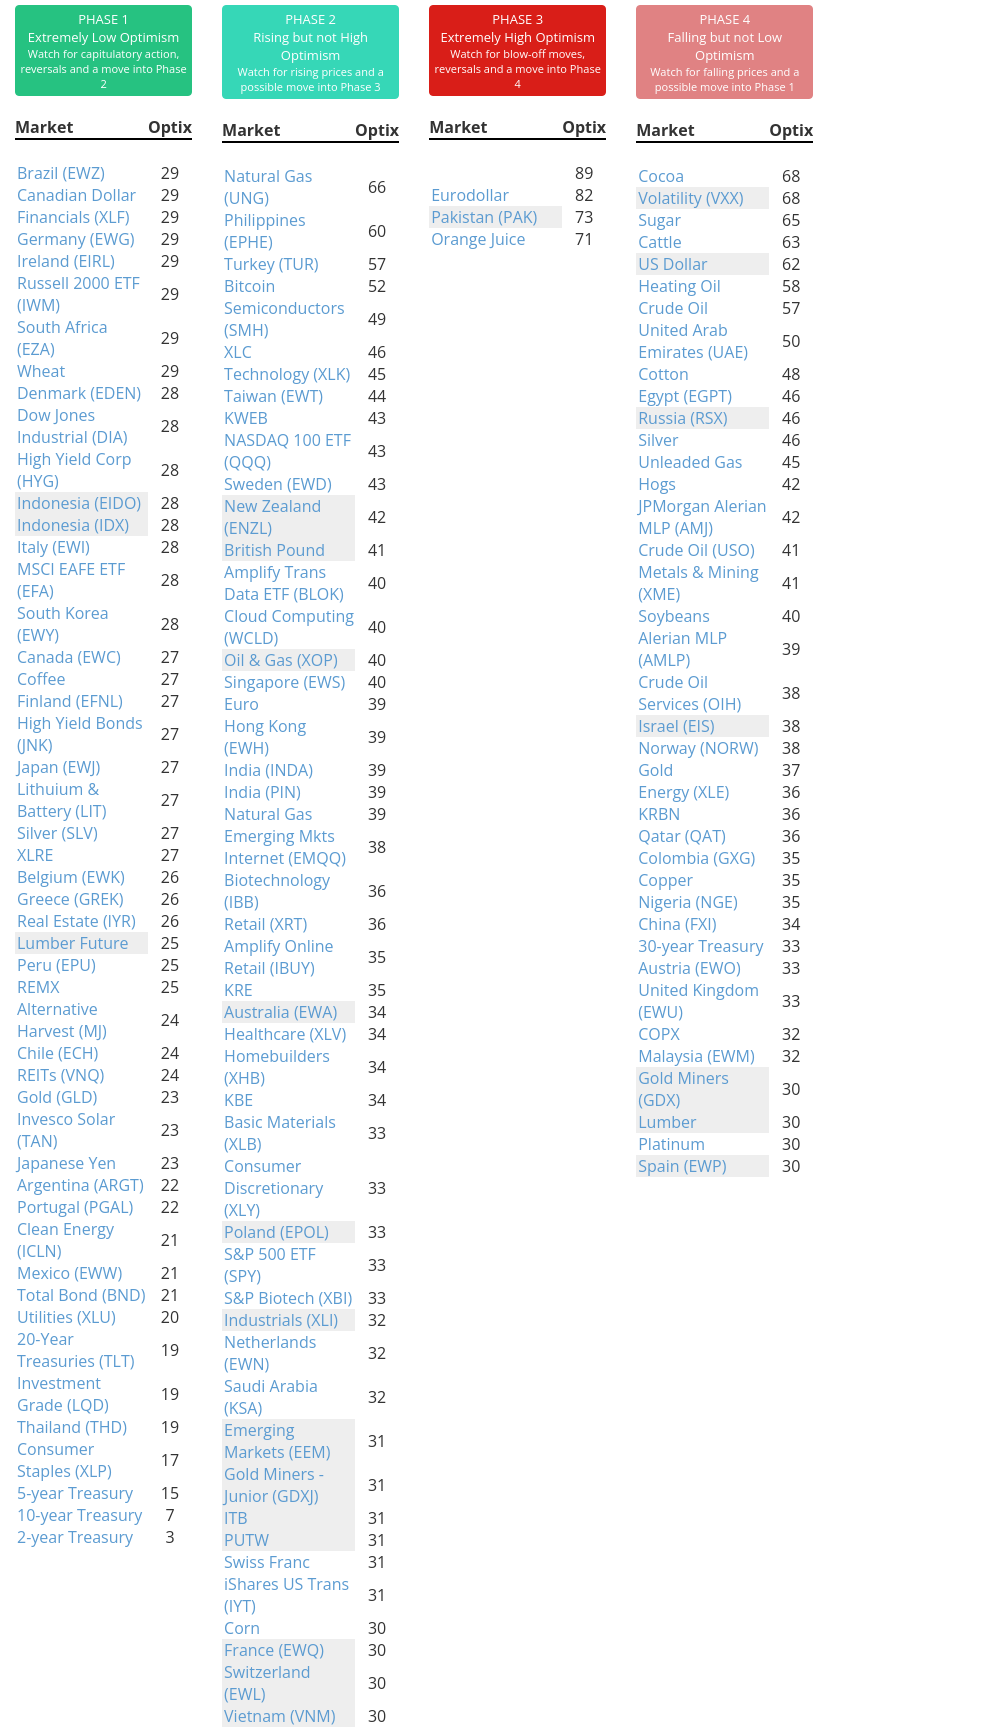
Phase Table
Ranks
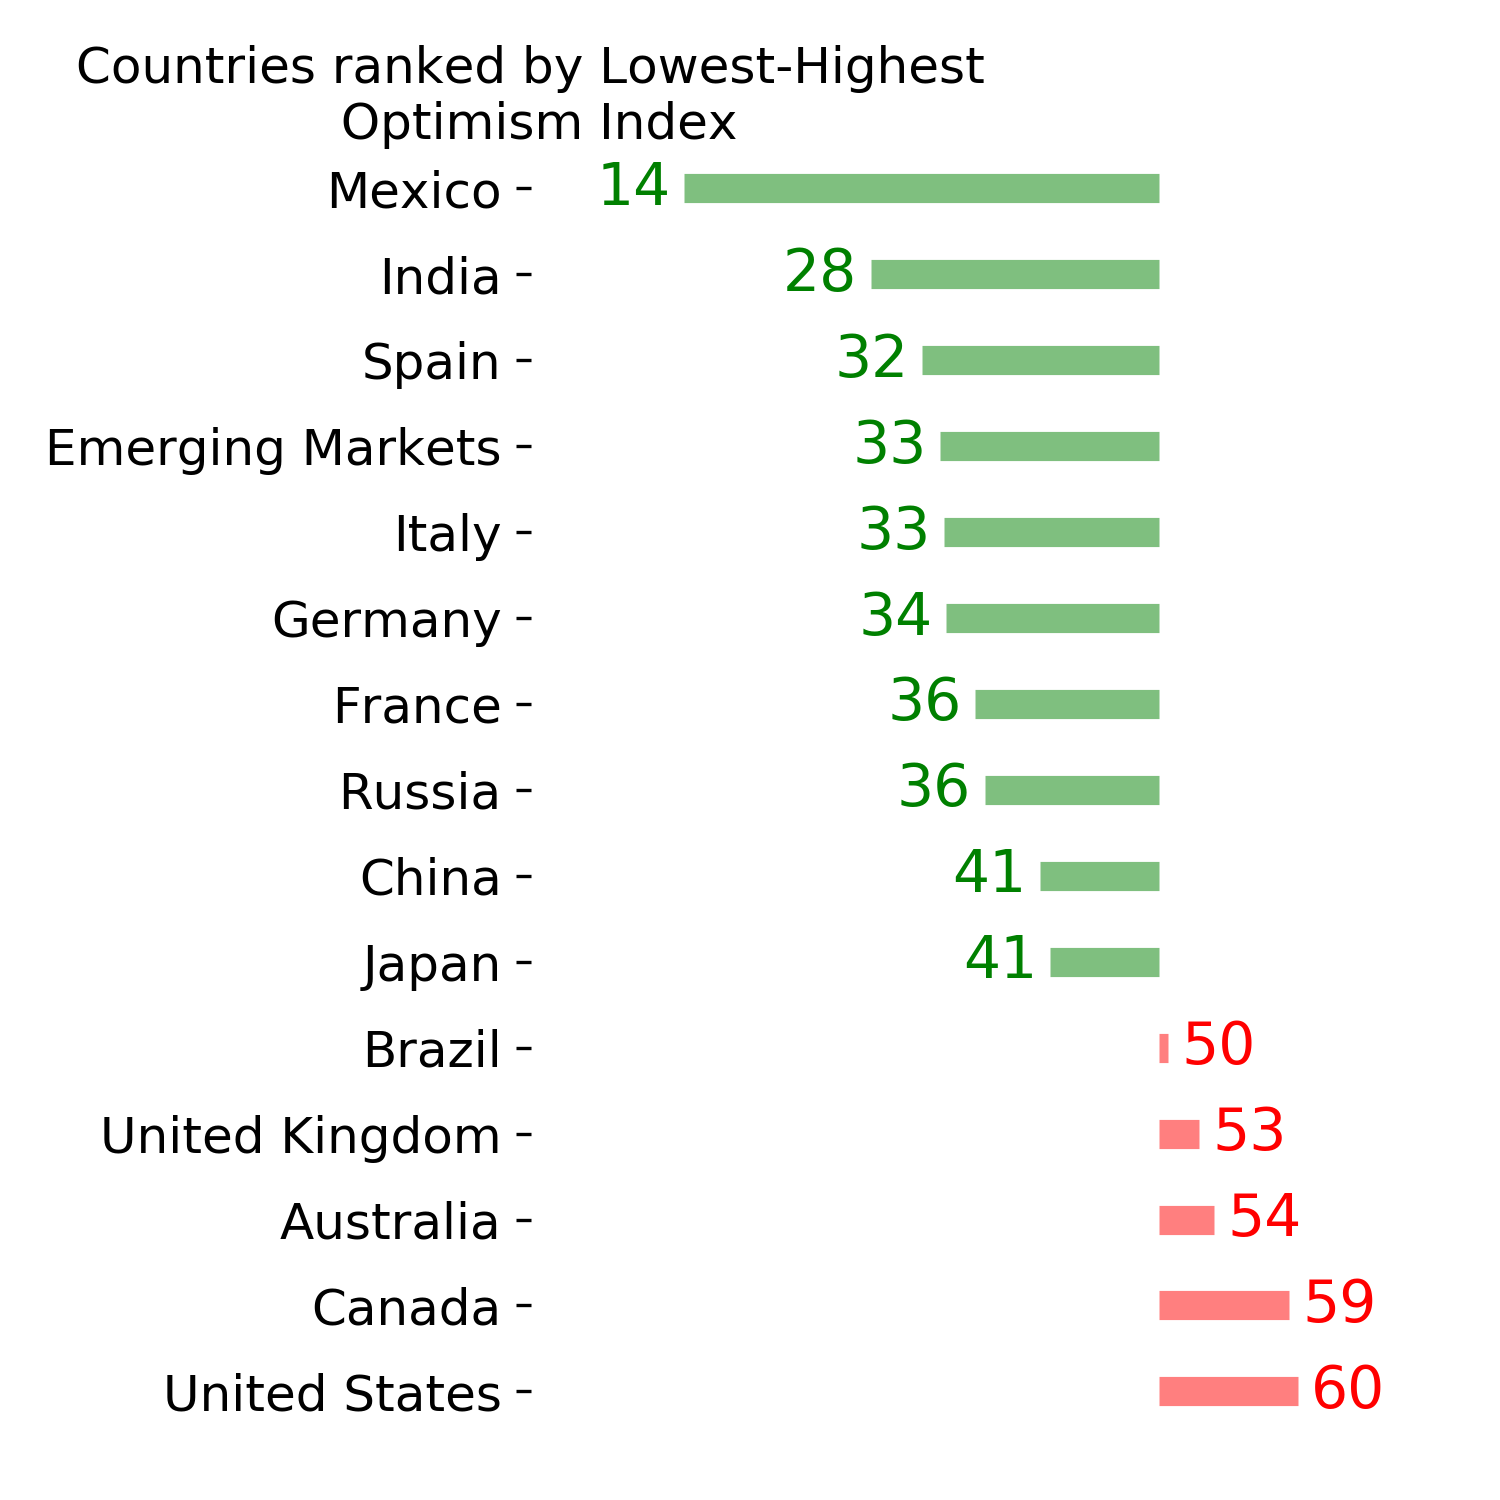
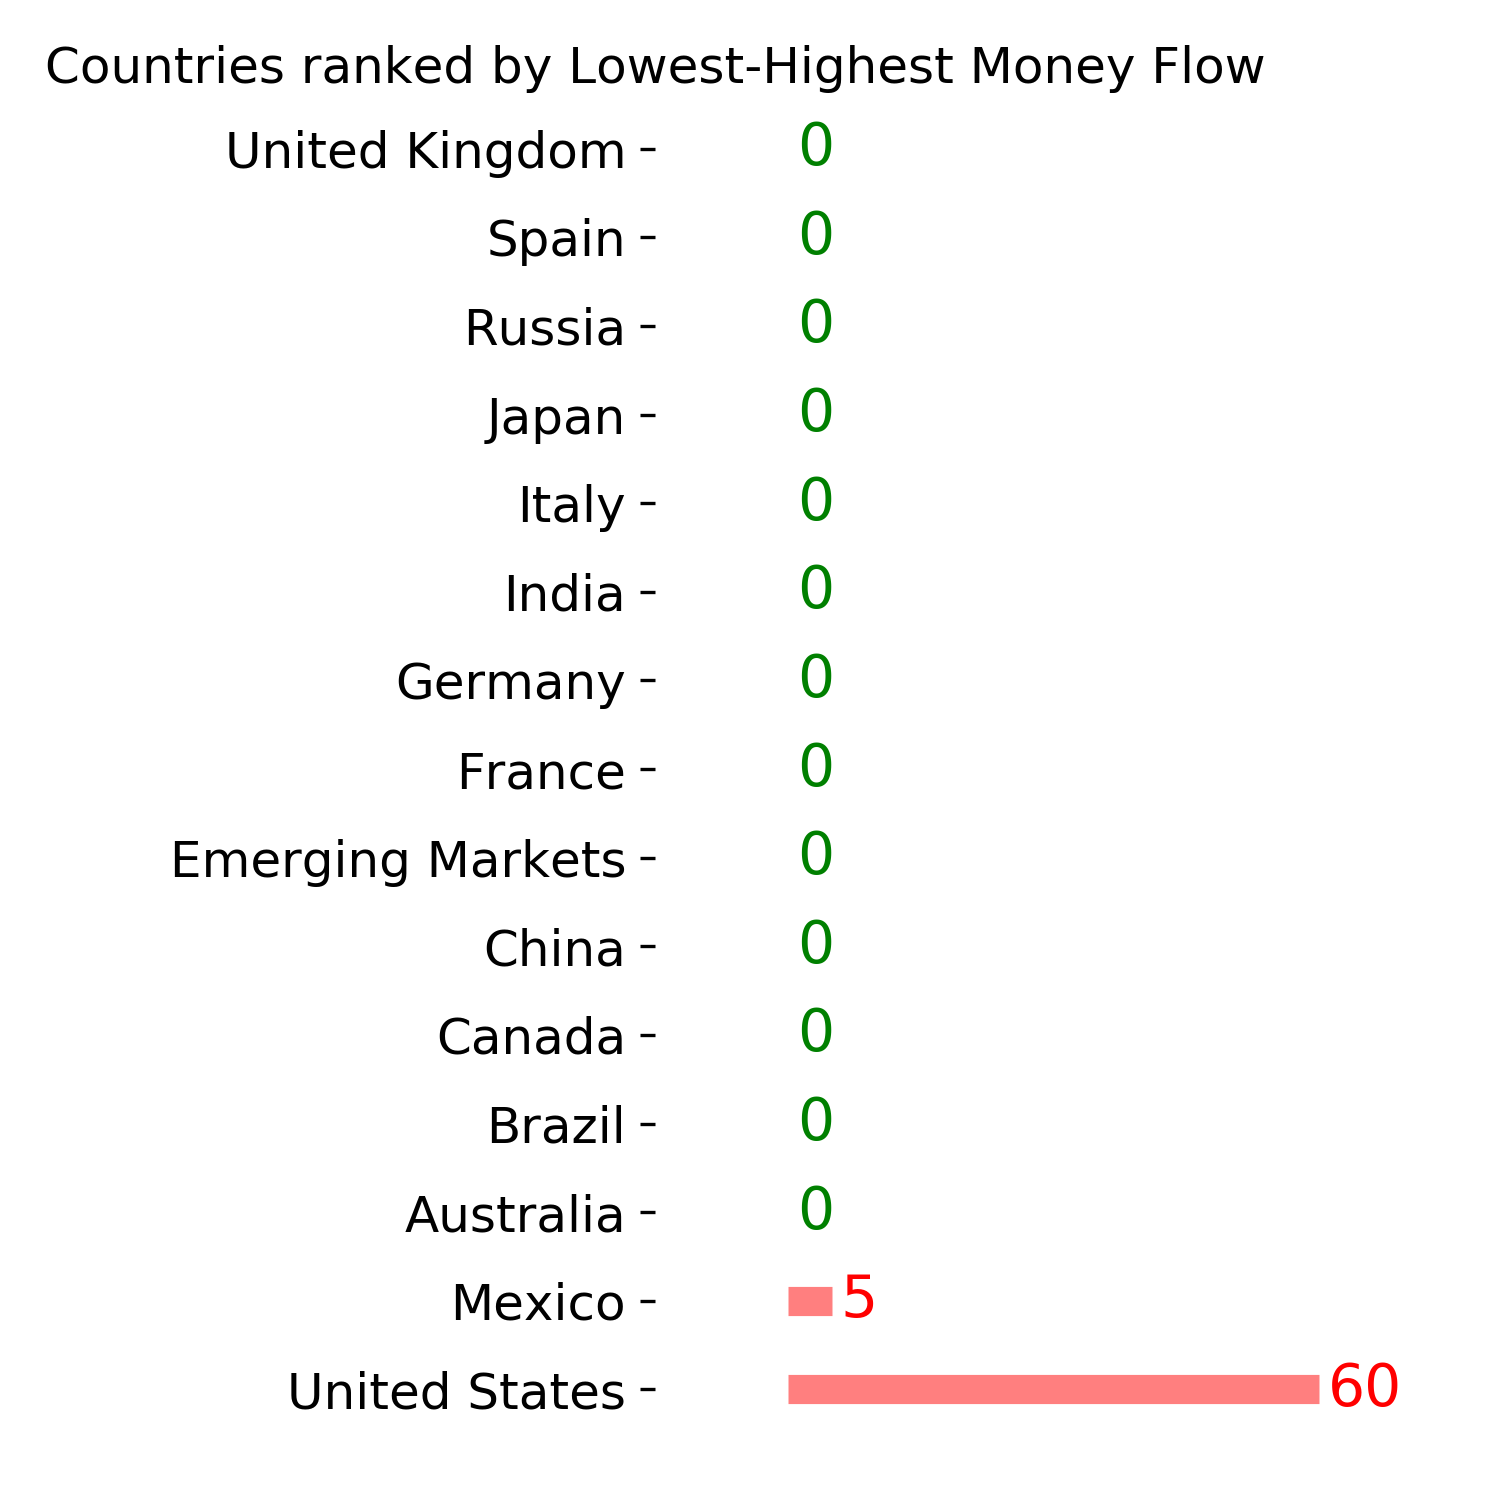
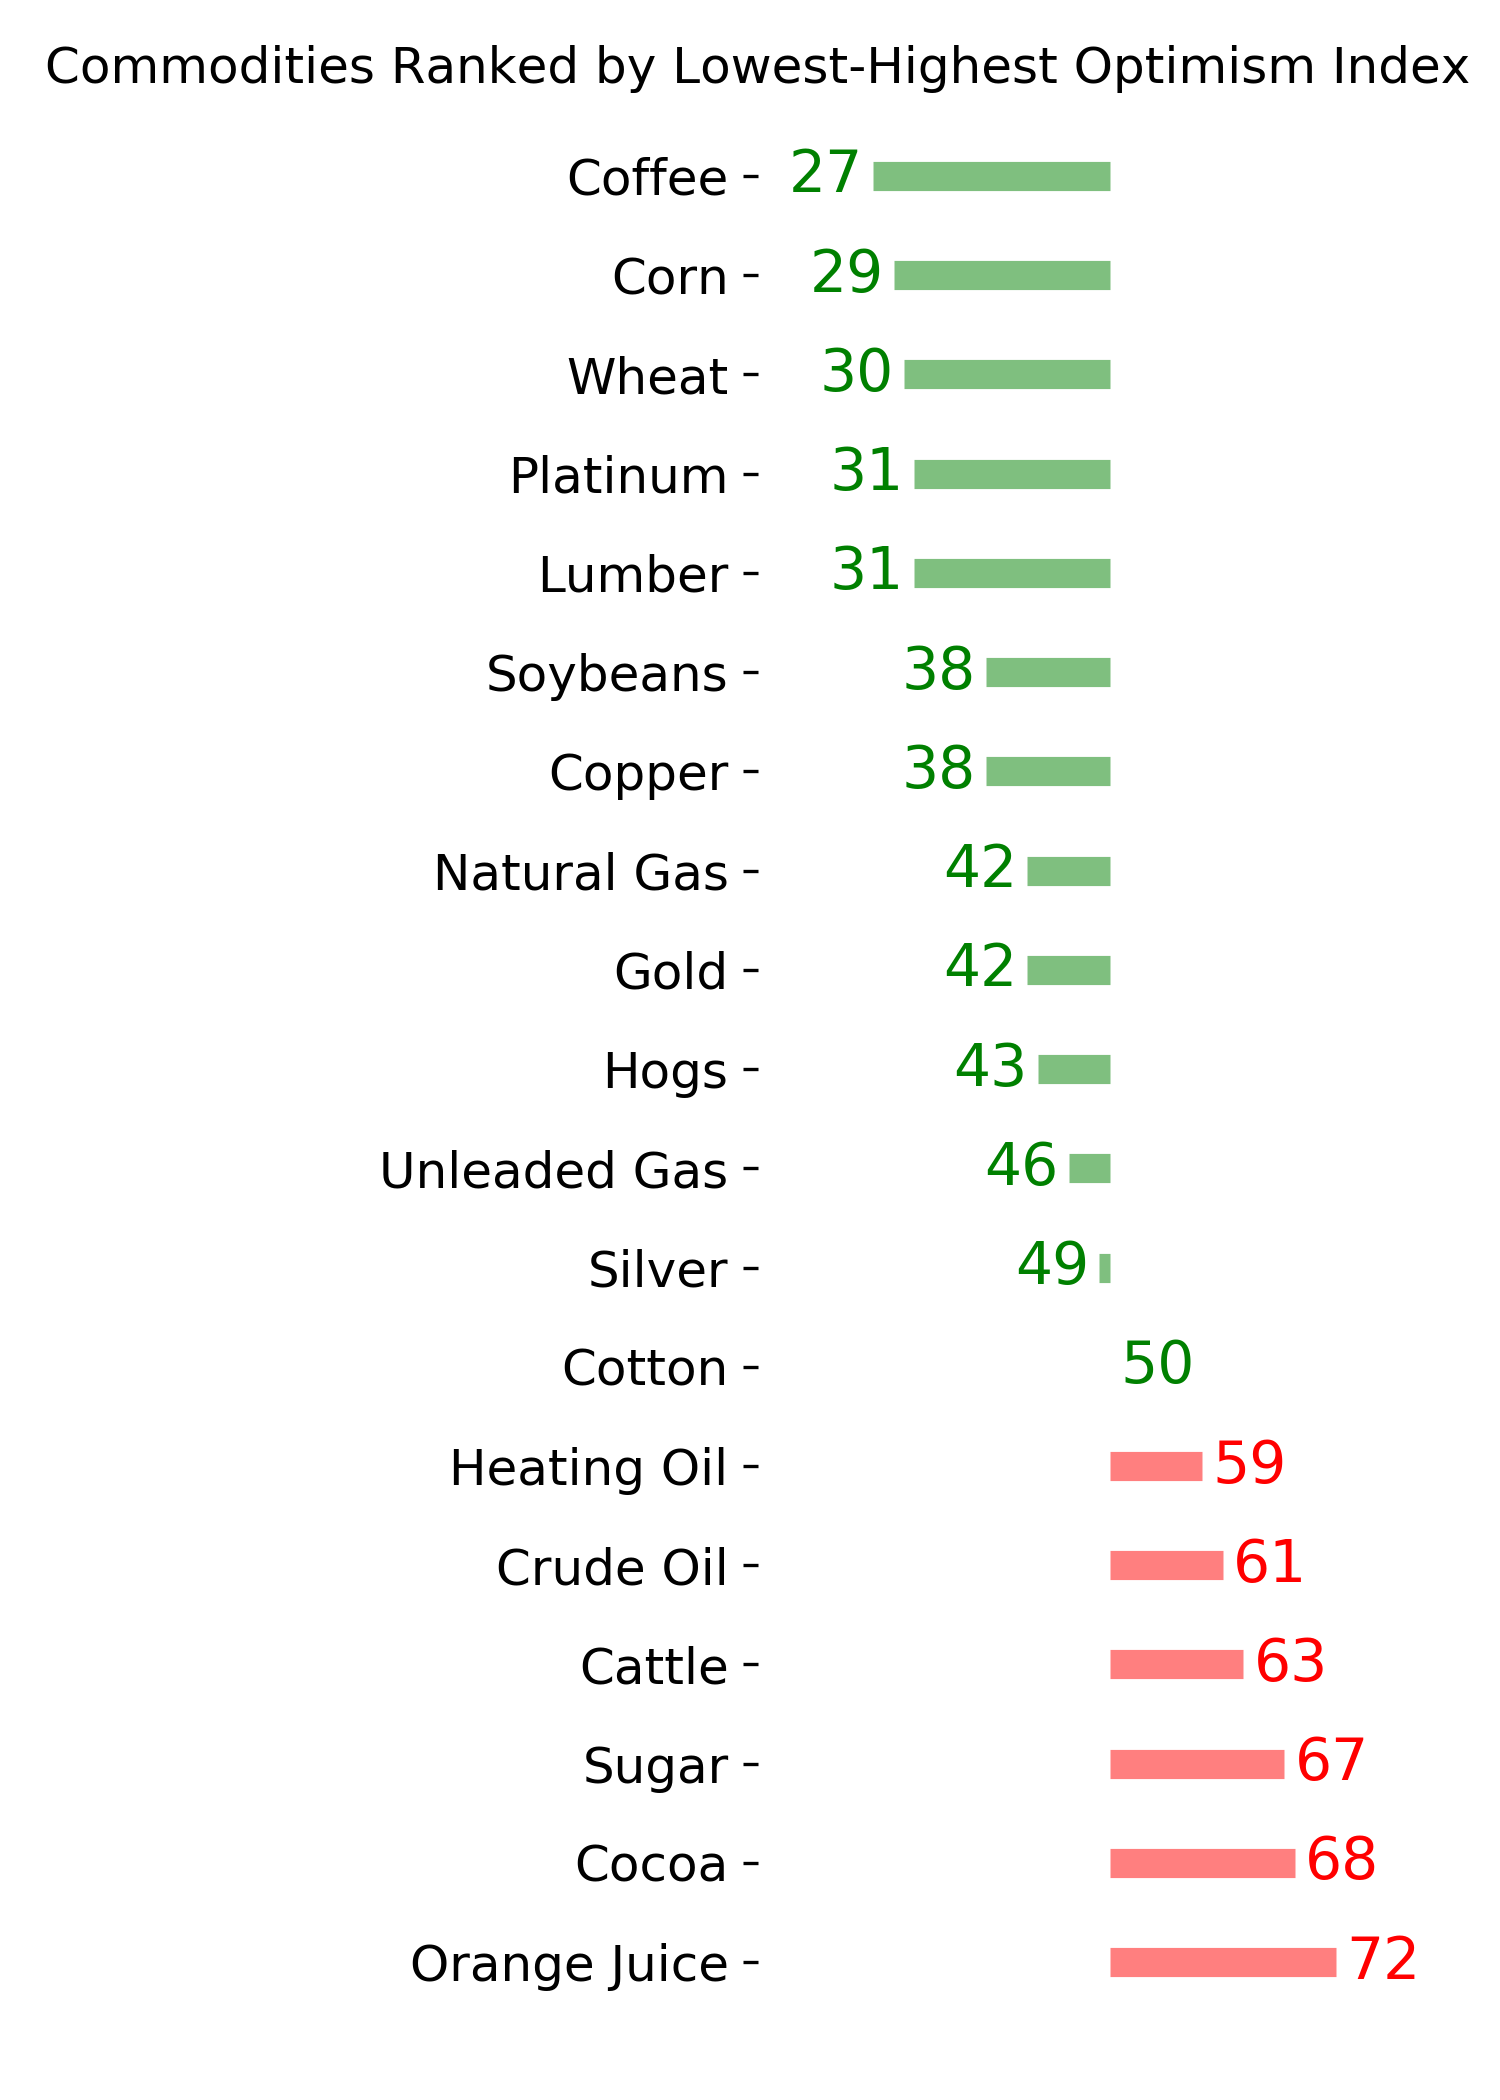
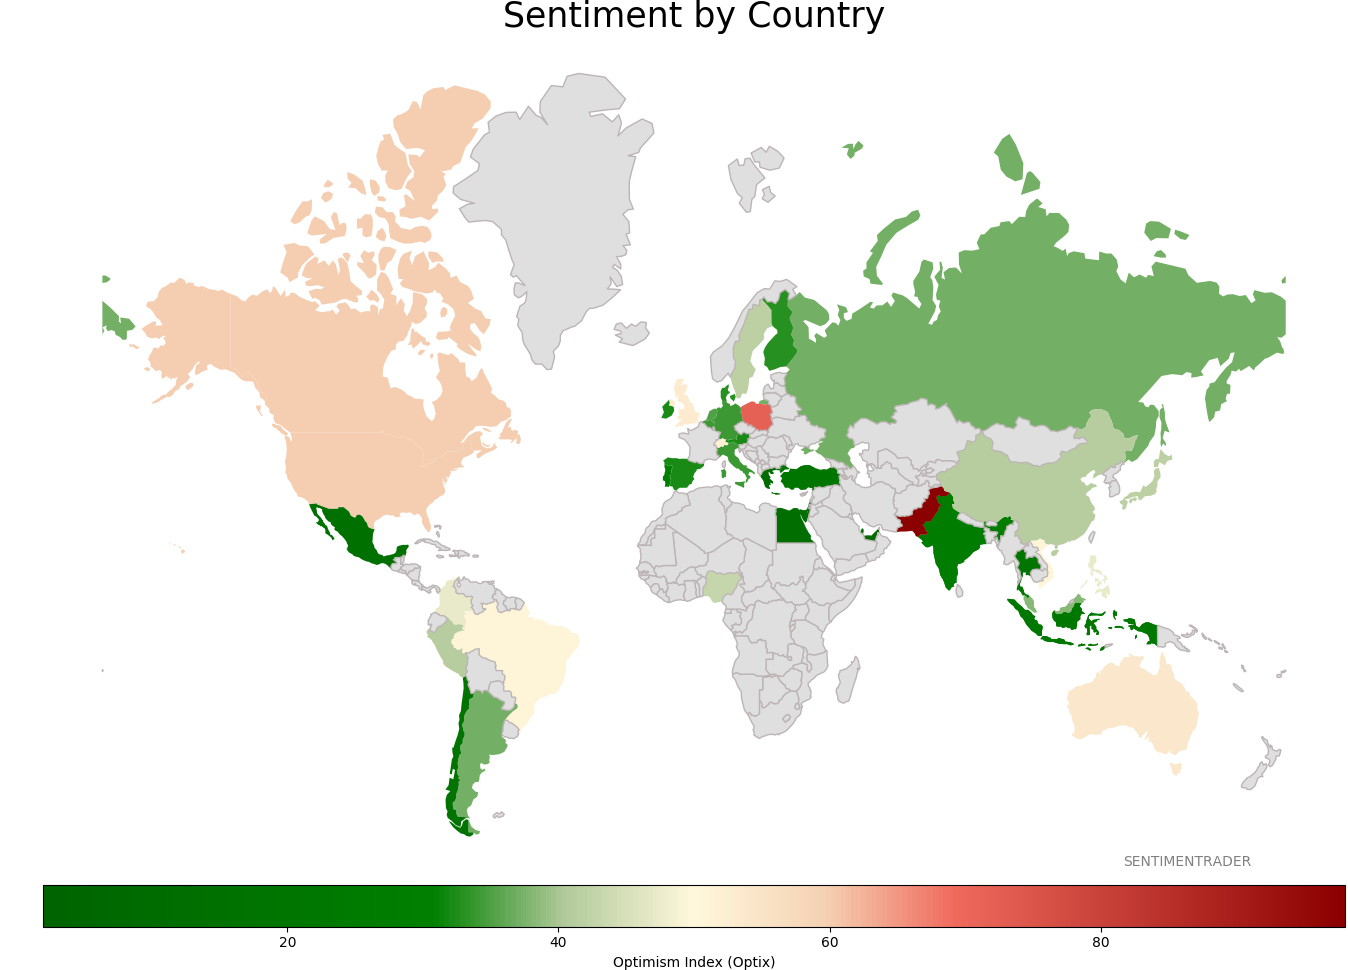
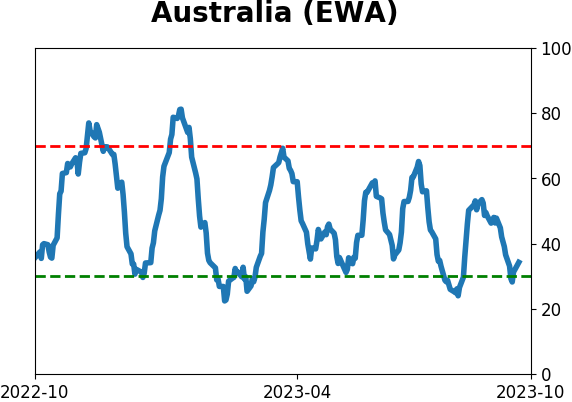
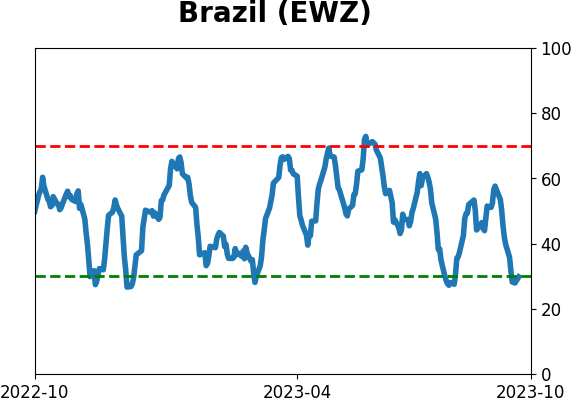
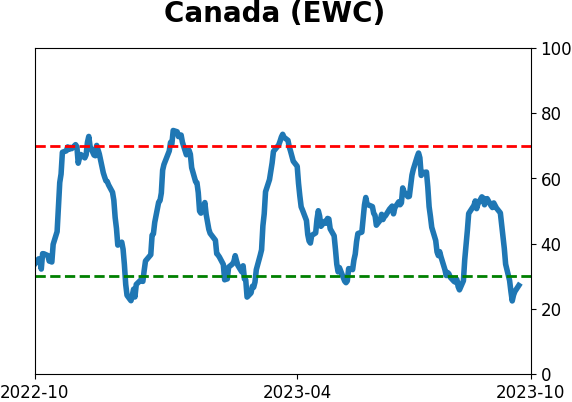
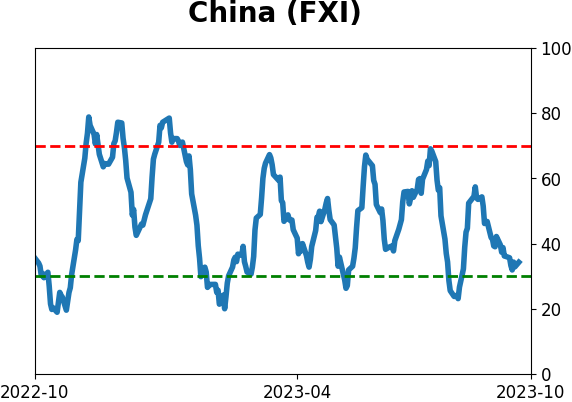
Sentiment Around The World
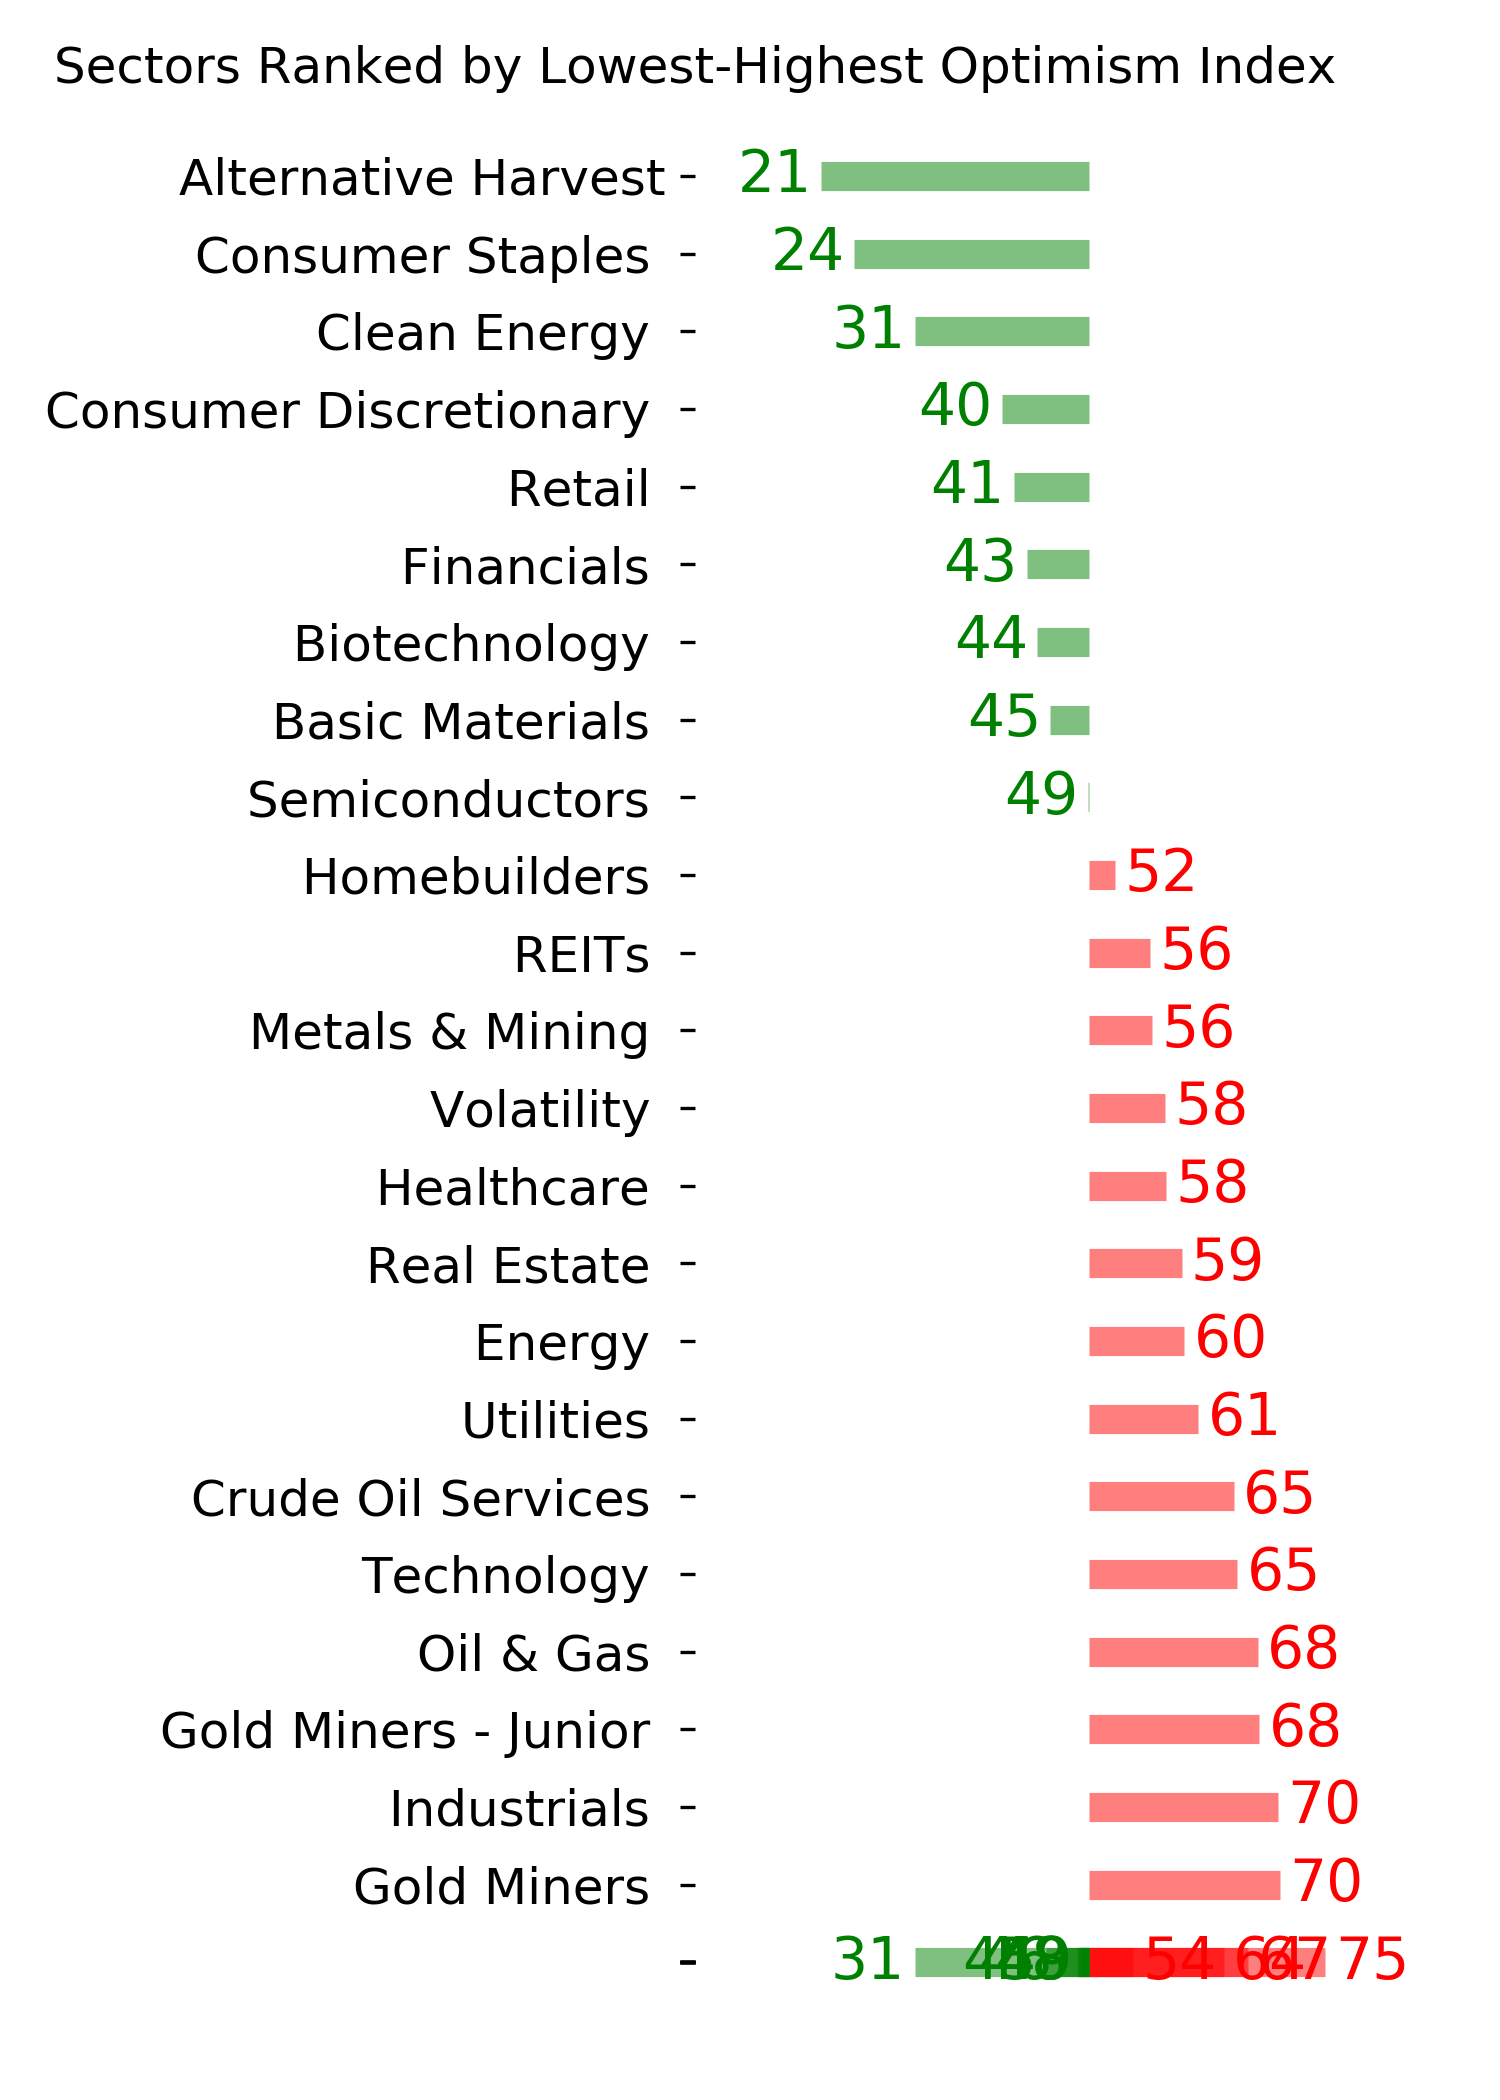
Optimism Index Thumbnails
|
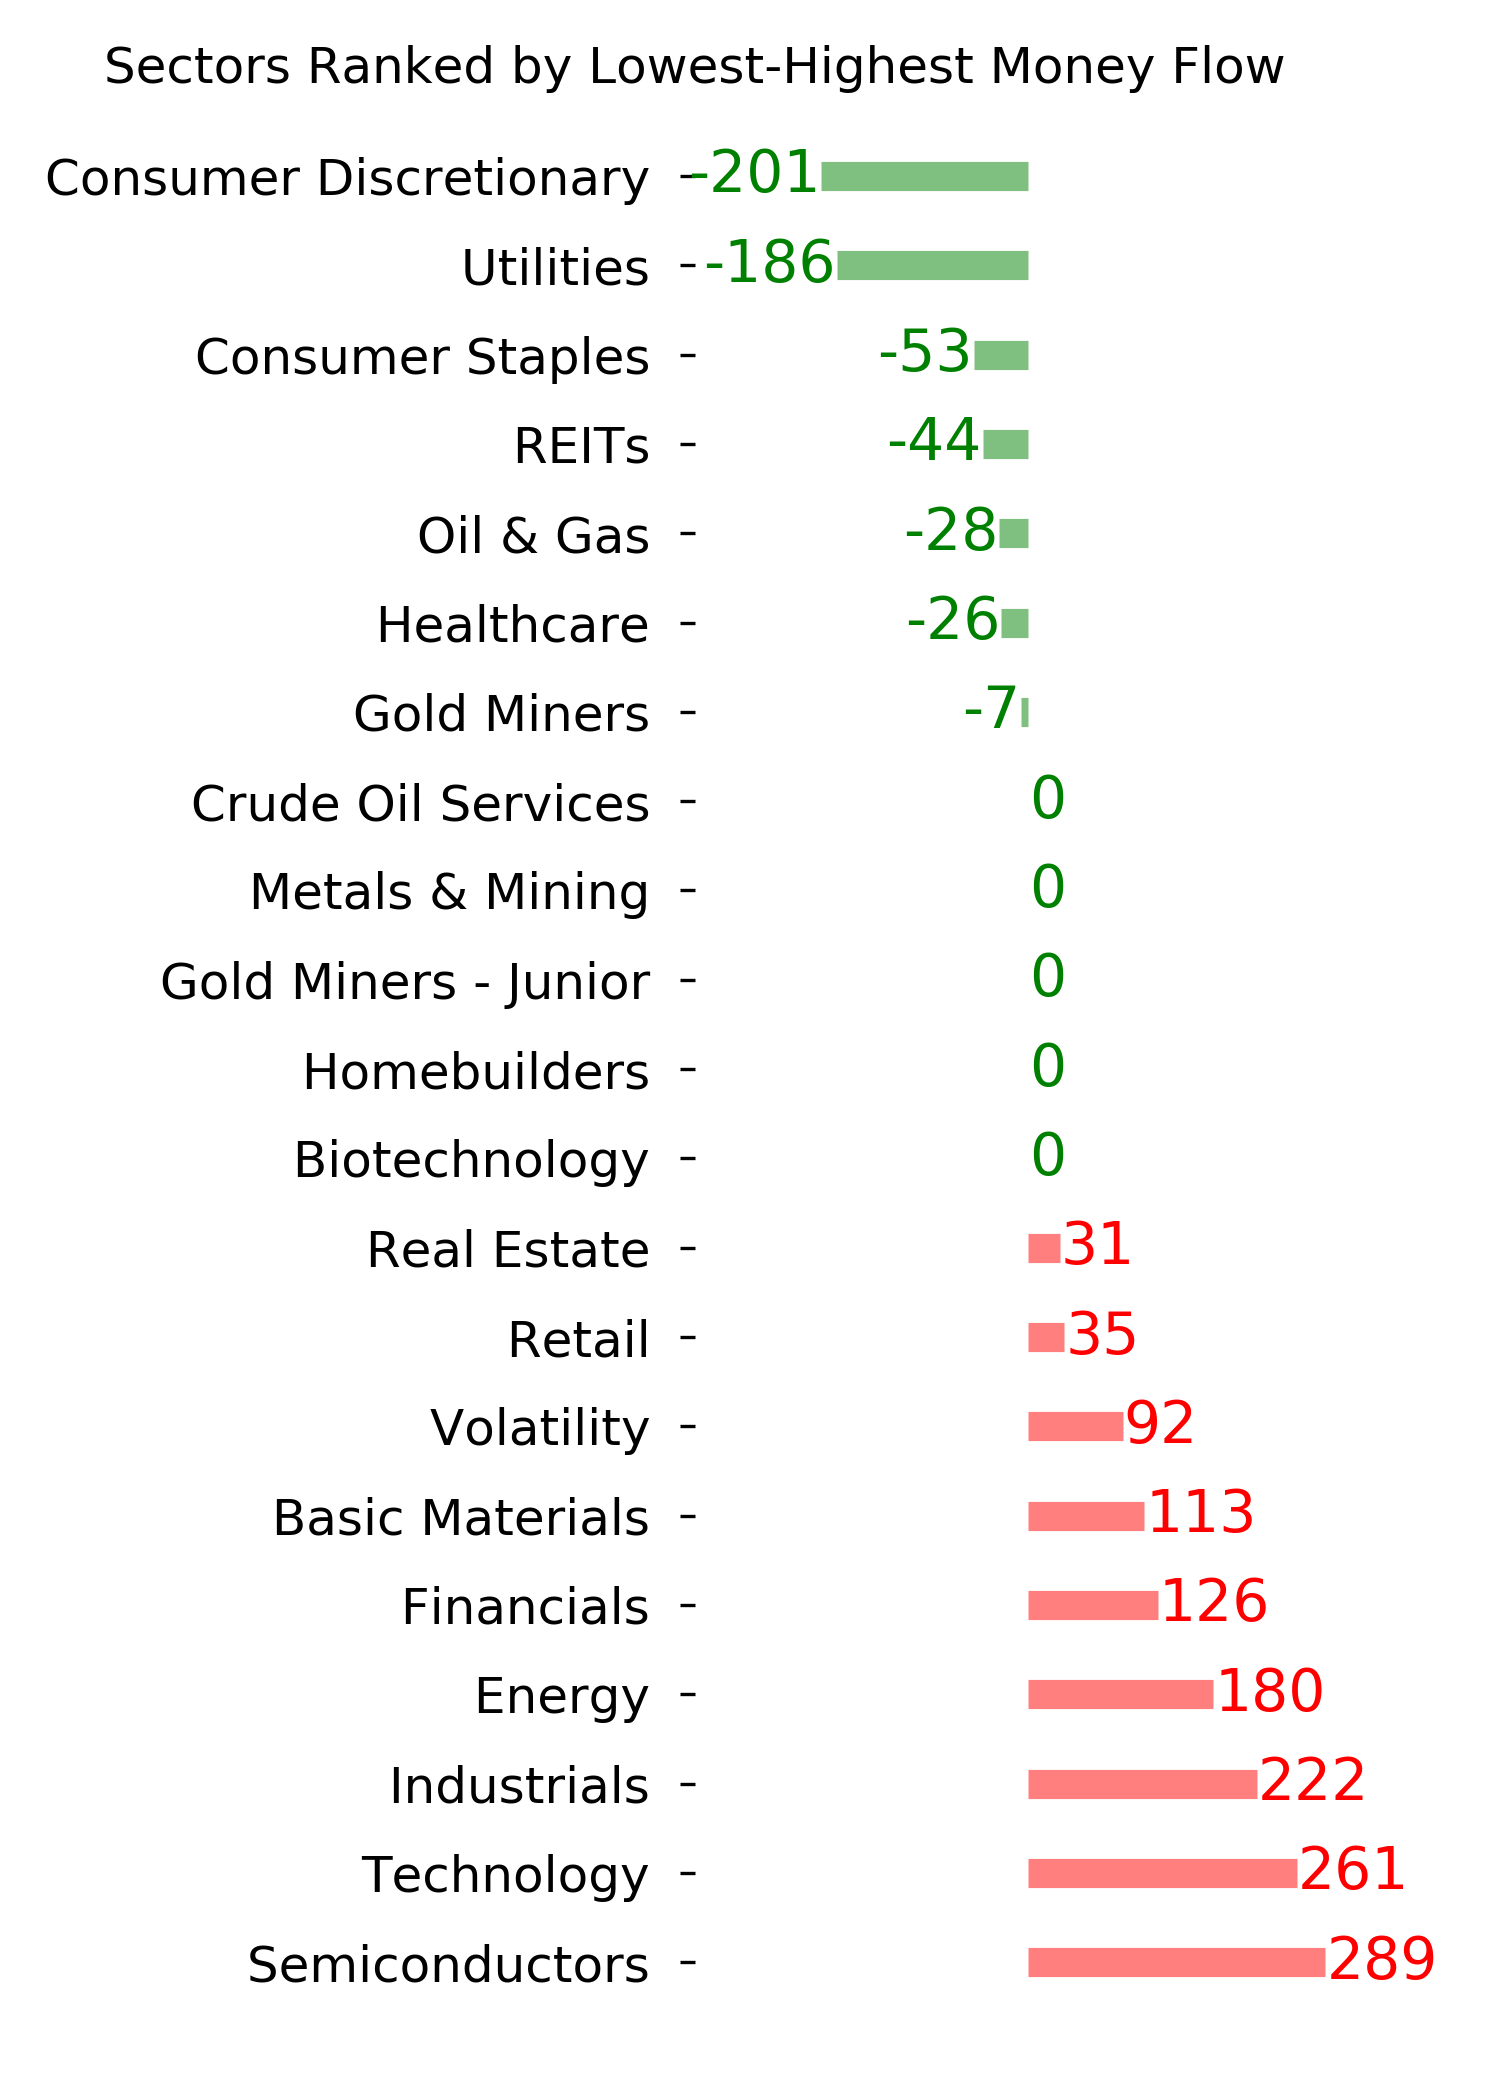
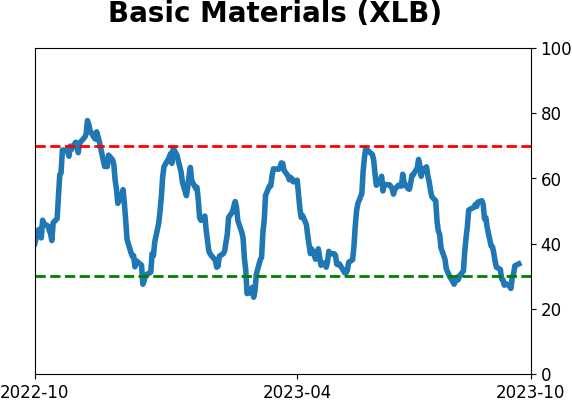
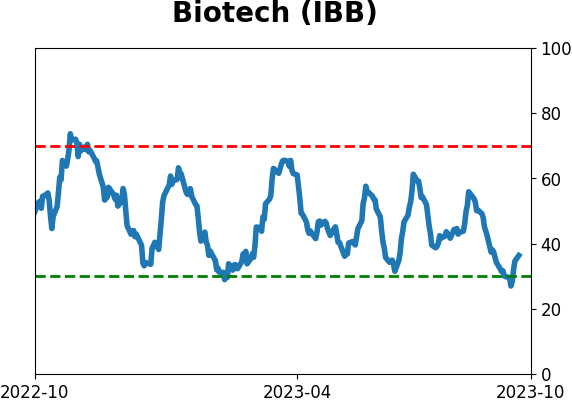
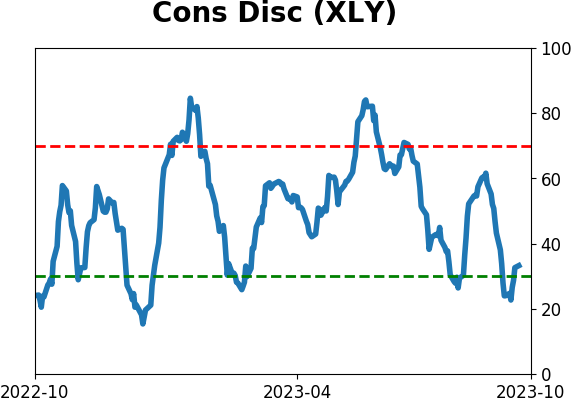
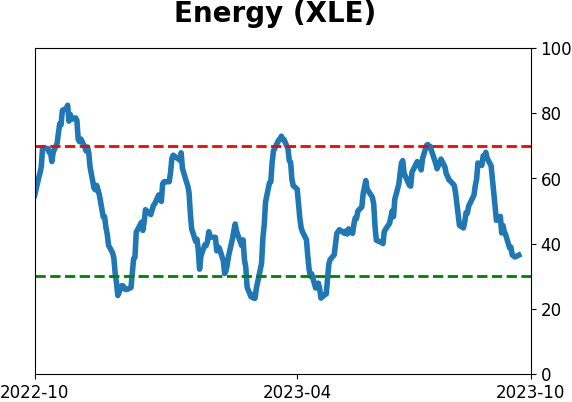
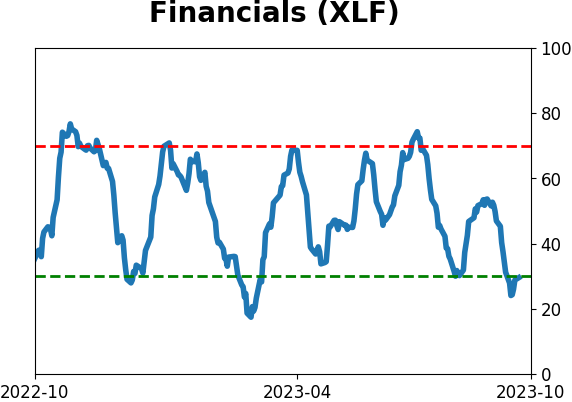
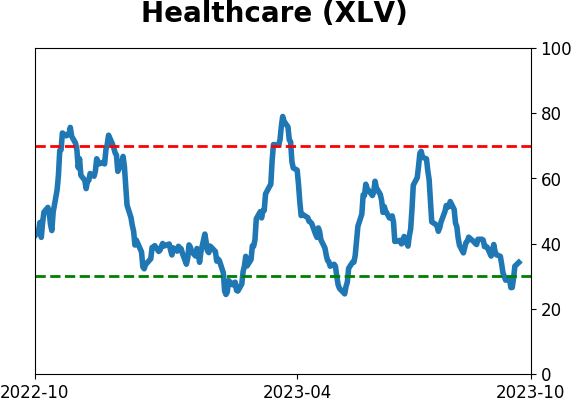
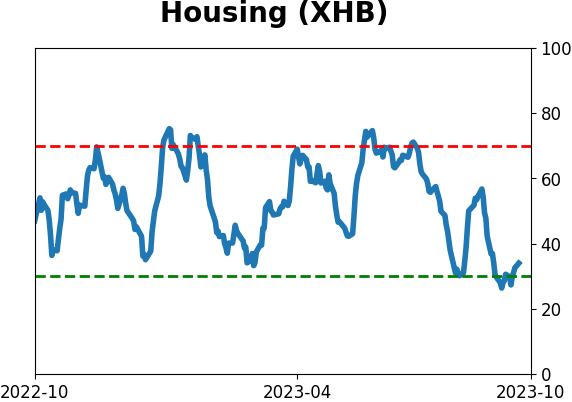
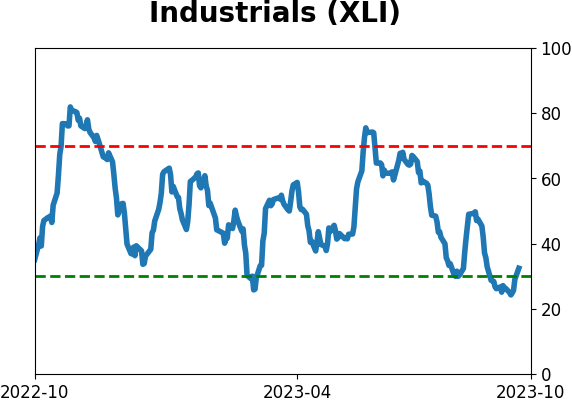
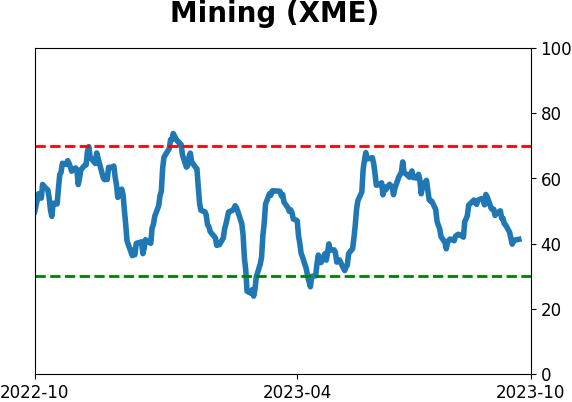
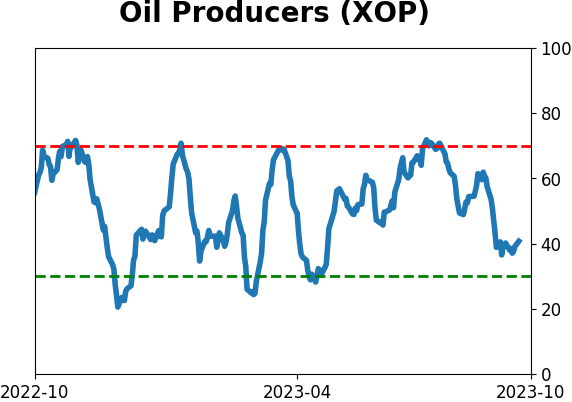
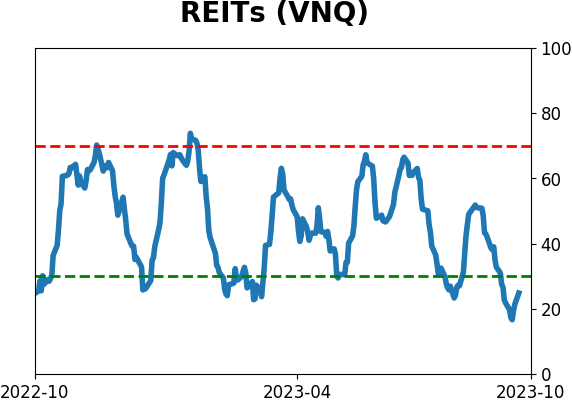
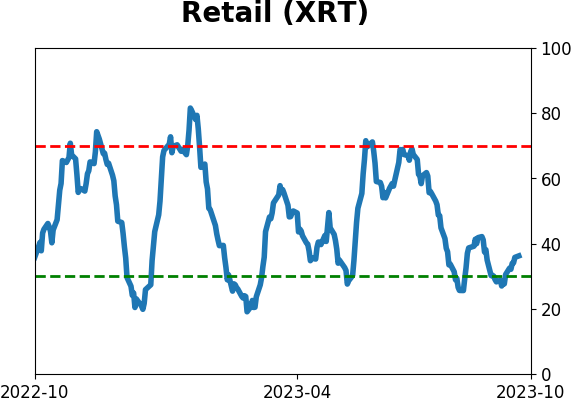
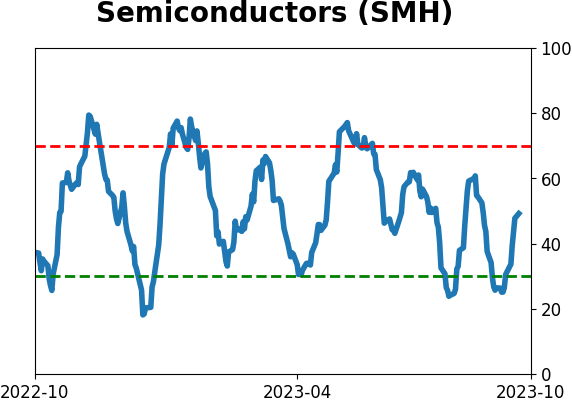
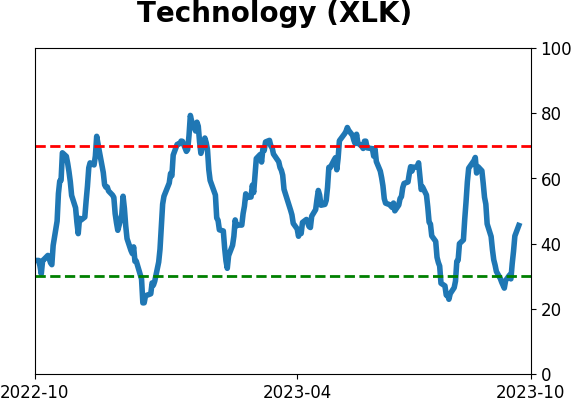
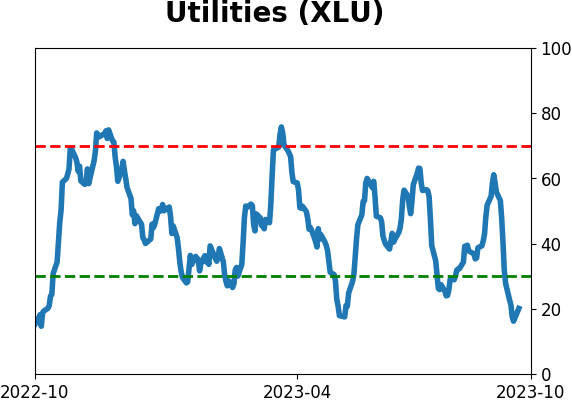
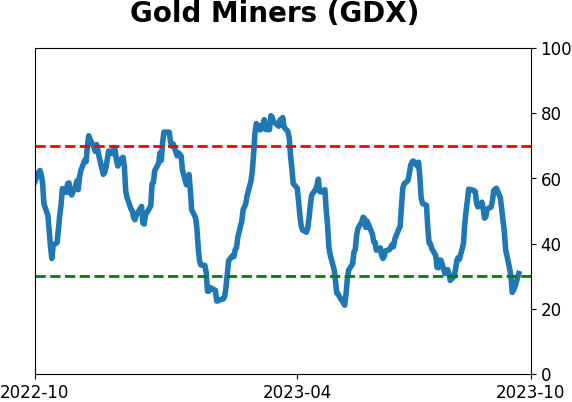
Sector ETF's - 10-Day Moving Average
|
|
|
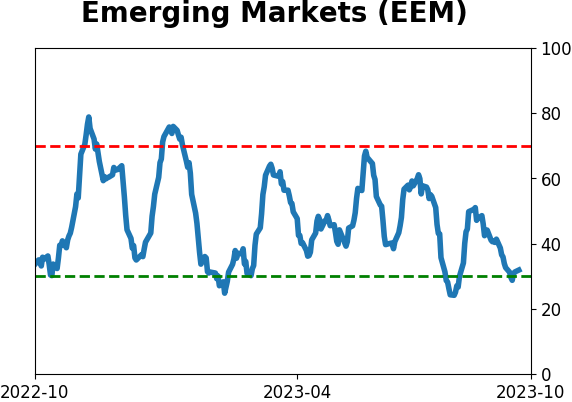
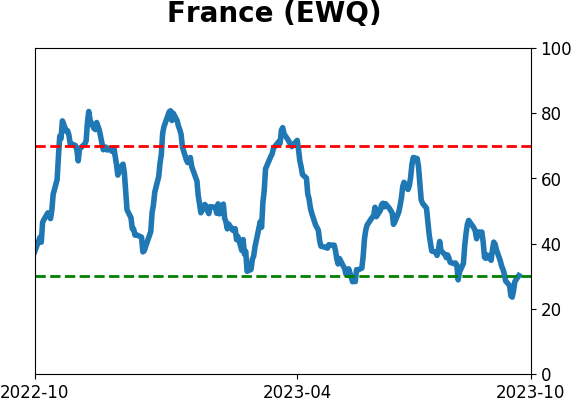
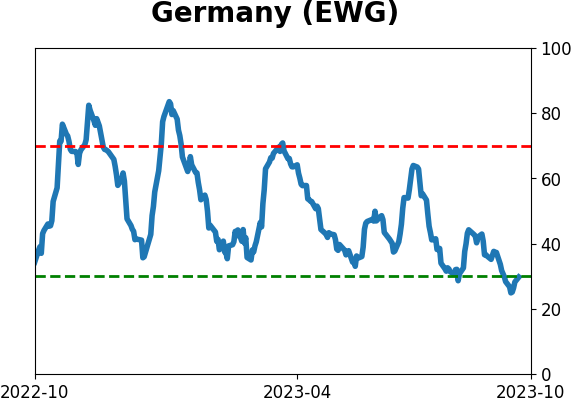
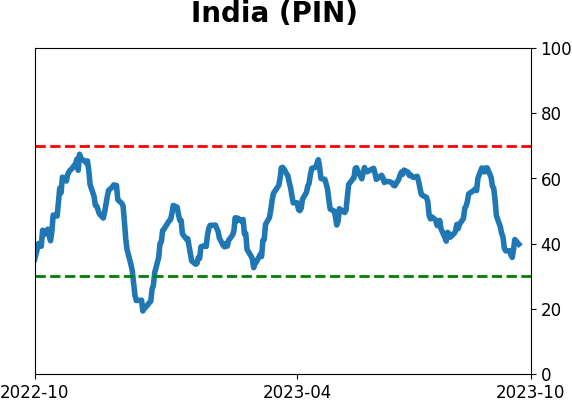
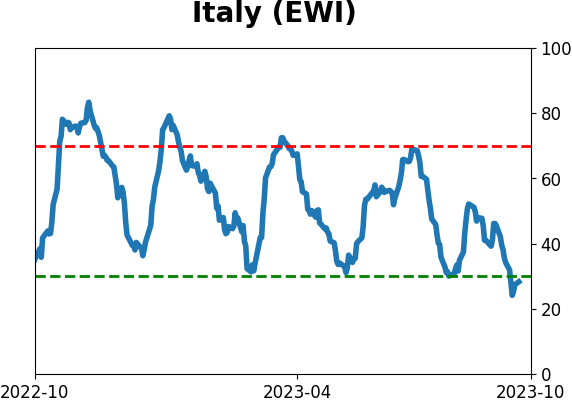
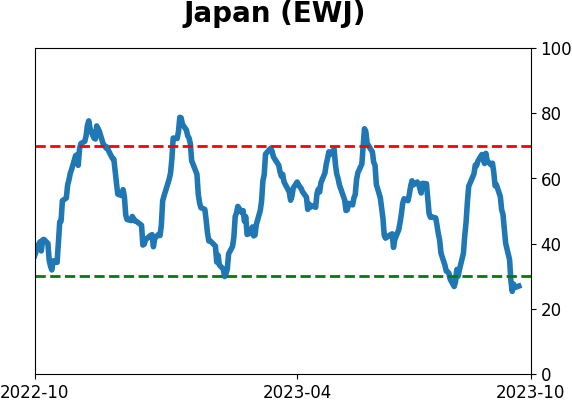
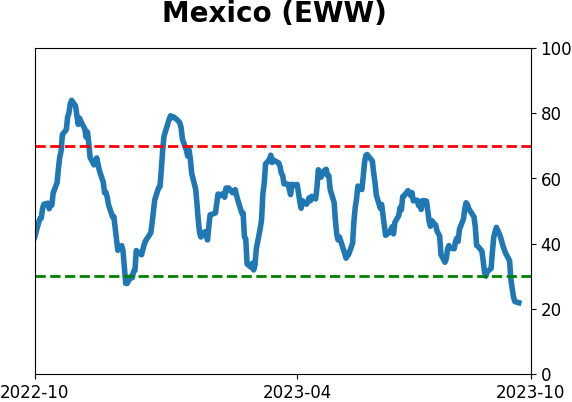
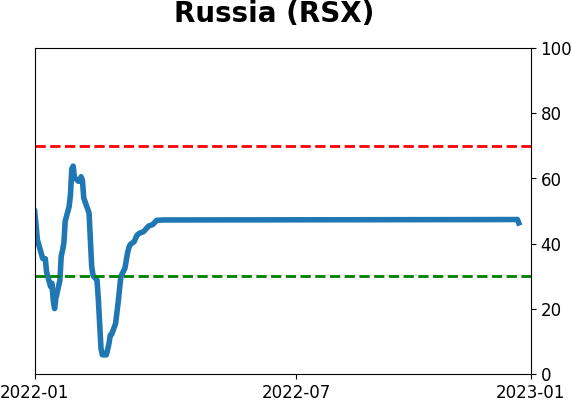
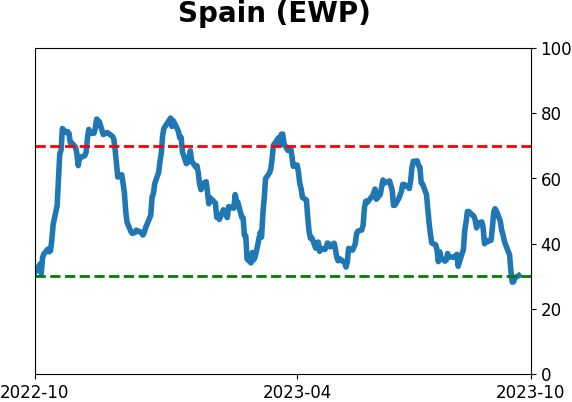
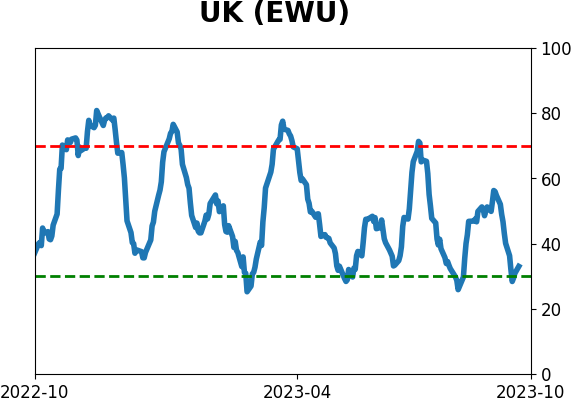
Country ETF's - 10-Day Moving Average
|
|
|
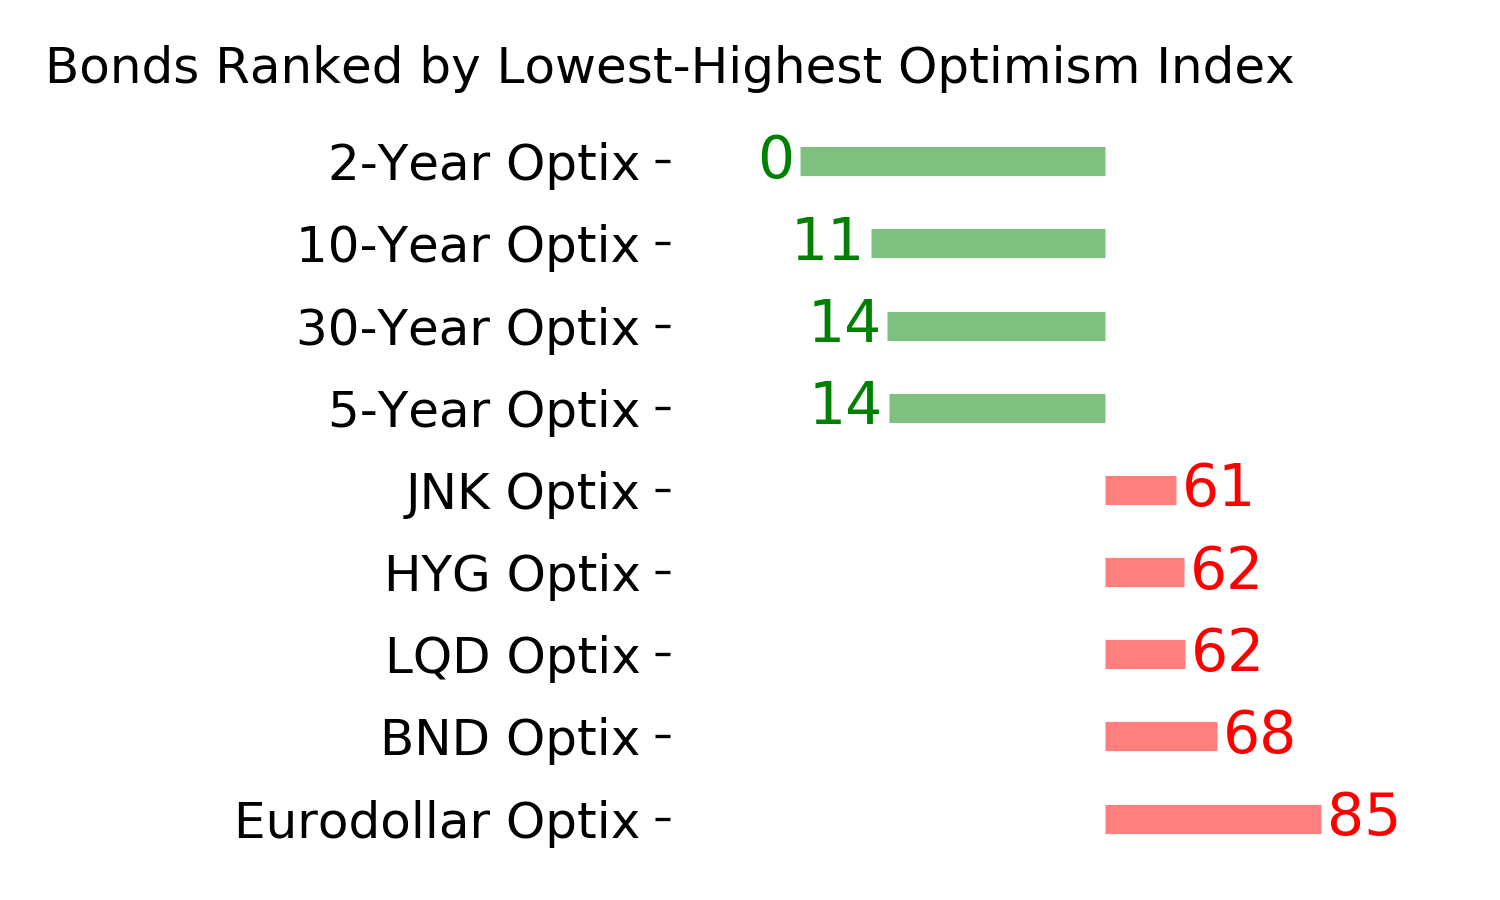
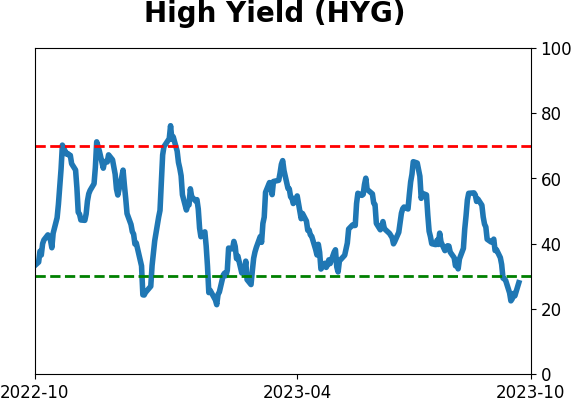
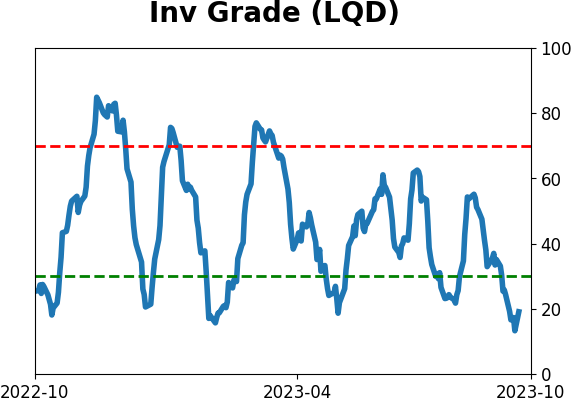
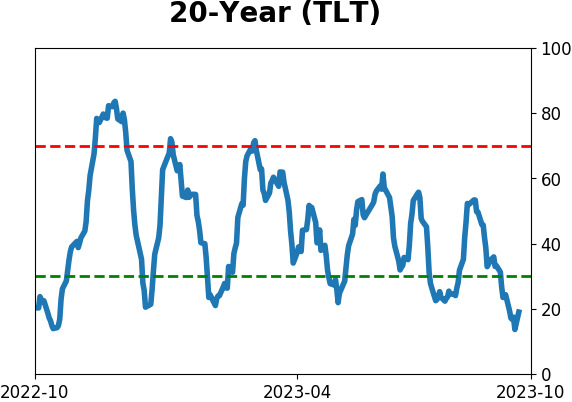
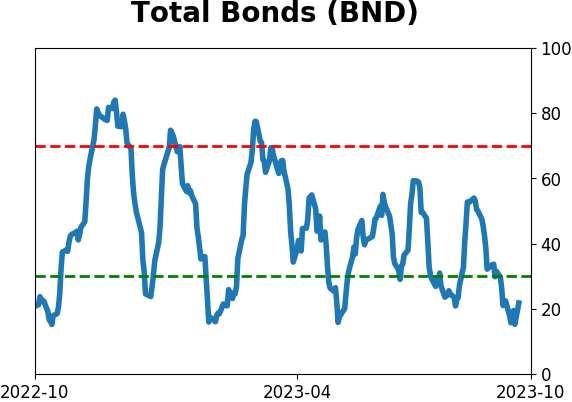
Bond ETF's - 10-Day Moving Average
|
|
|
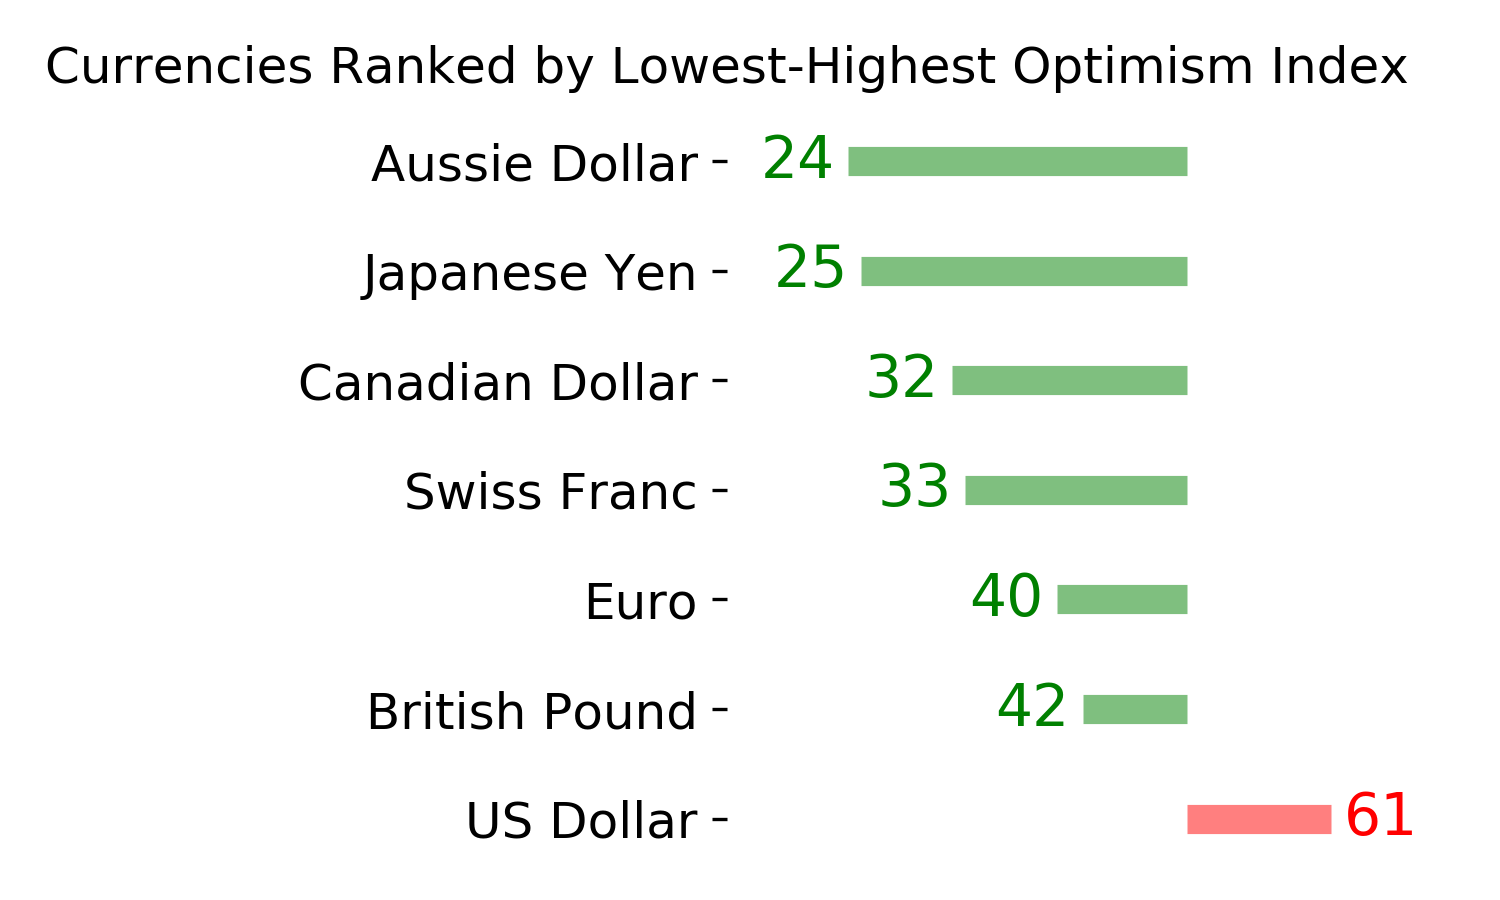
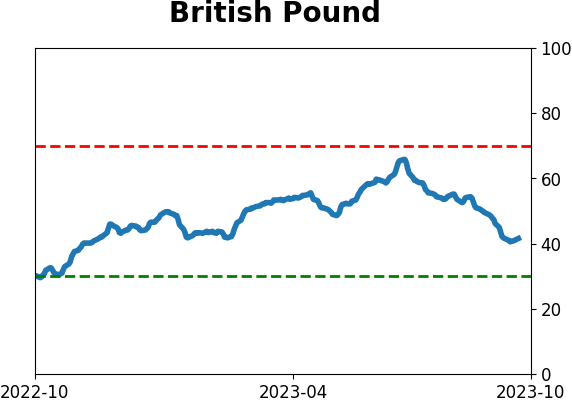
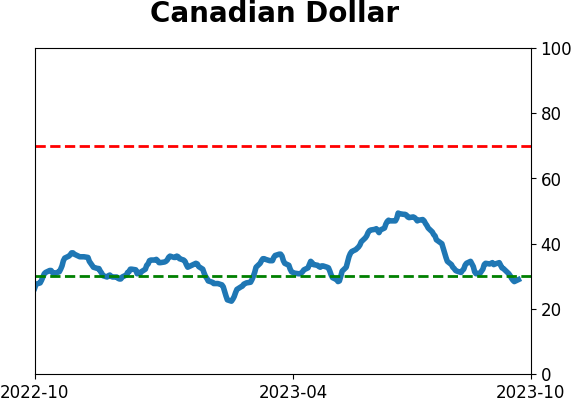
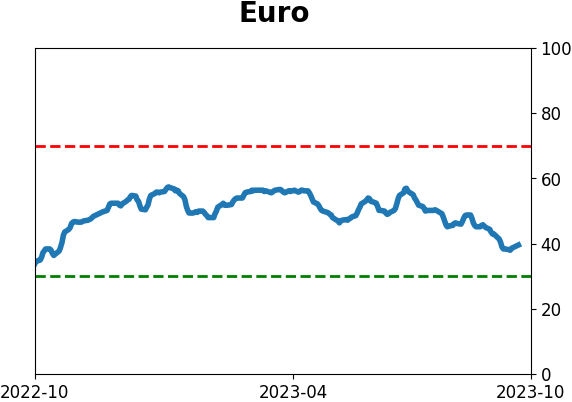
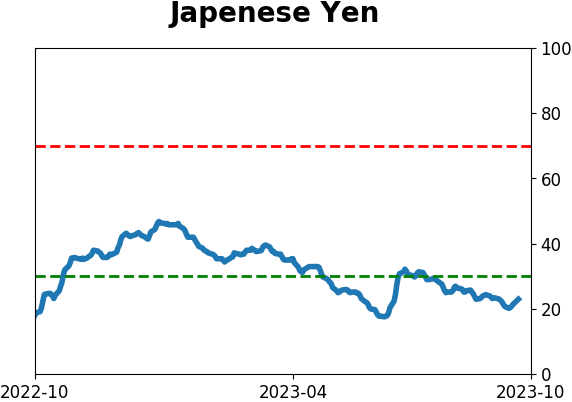
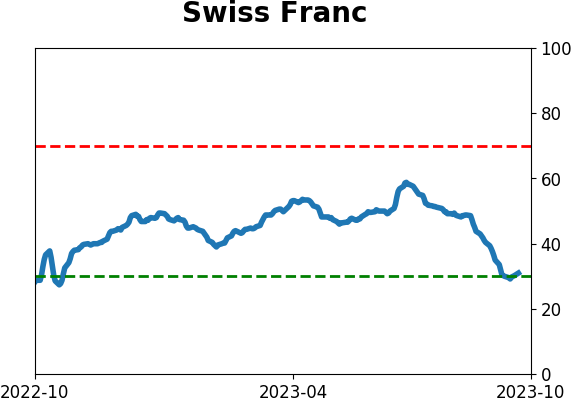
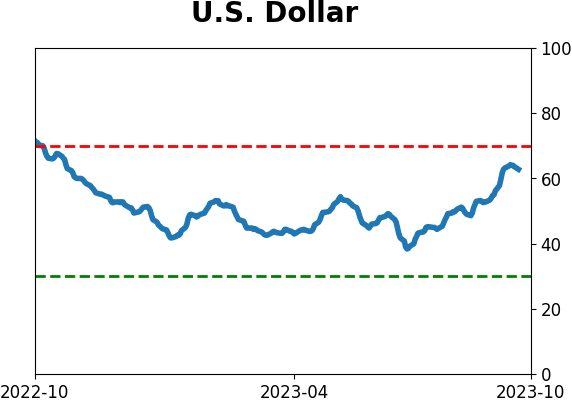
Currency ETF's - 5-Day Moving Average
|
|
|
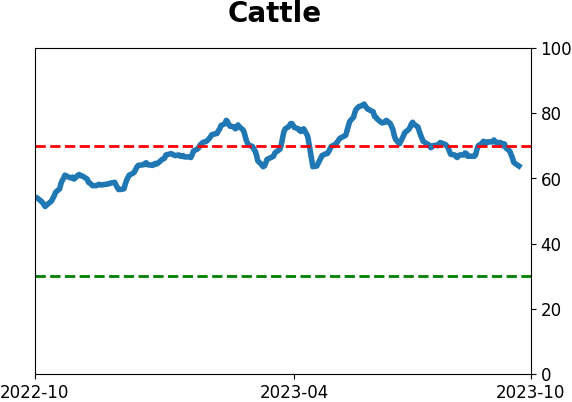
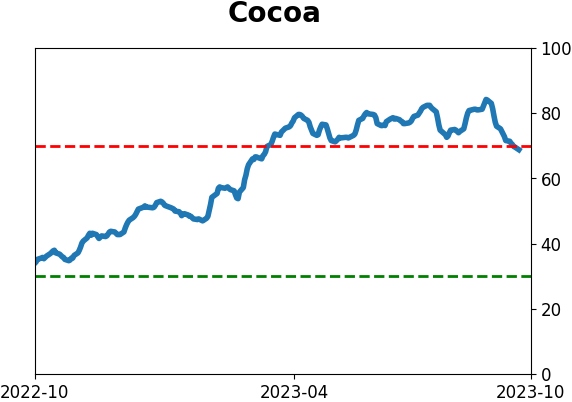
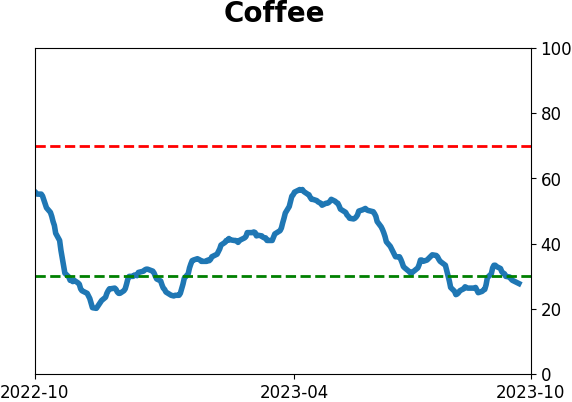
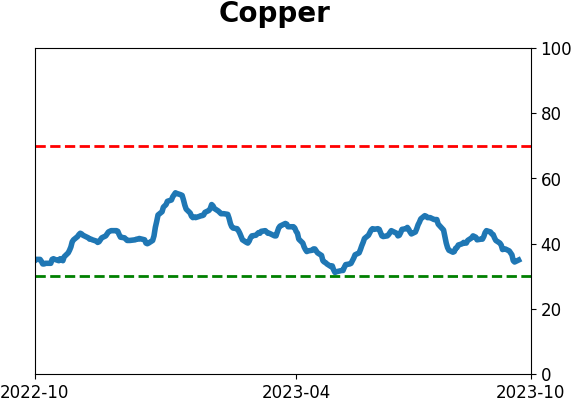
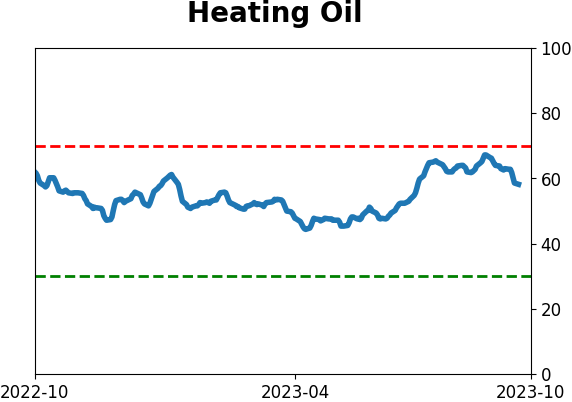
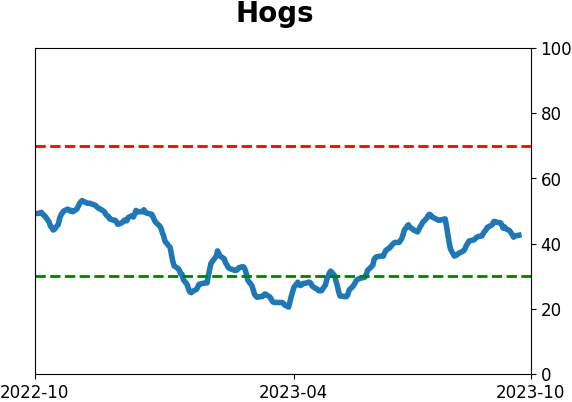
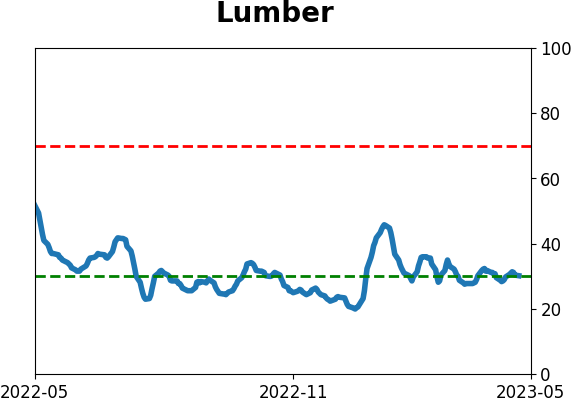
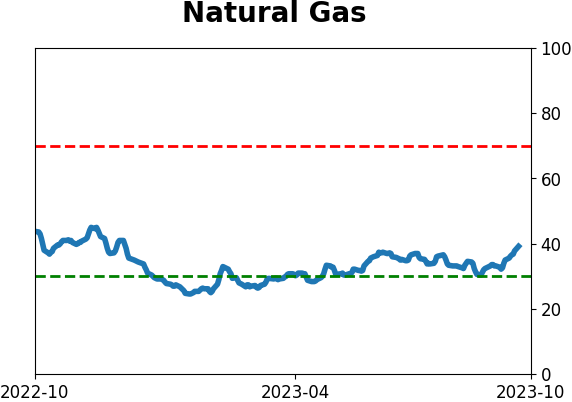
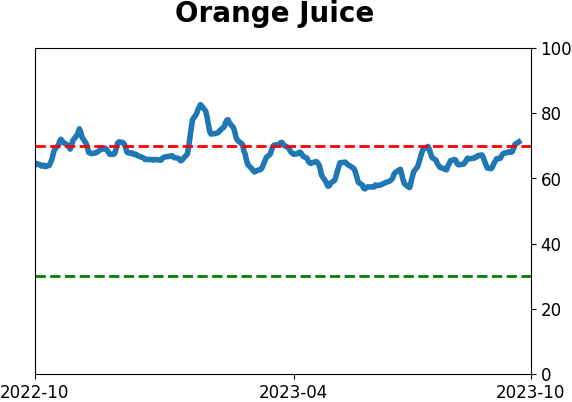
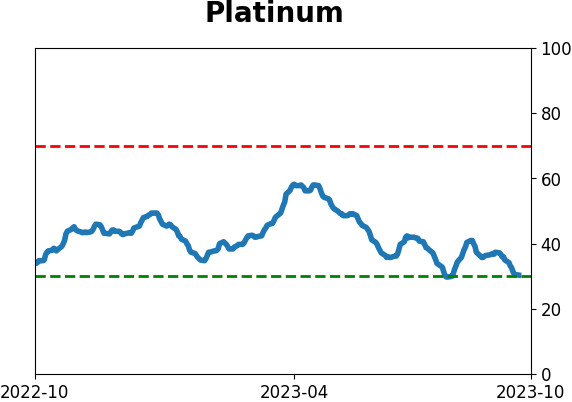
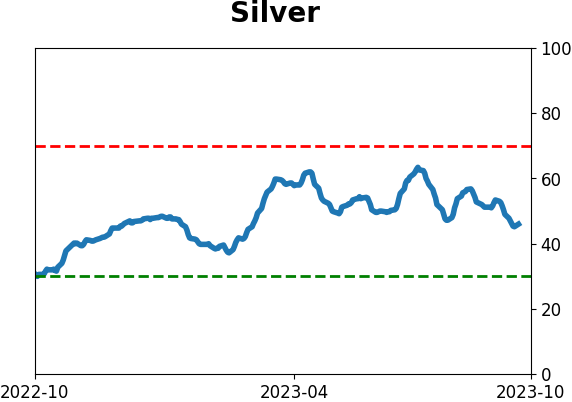
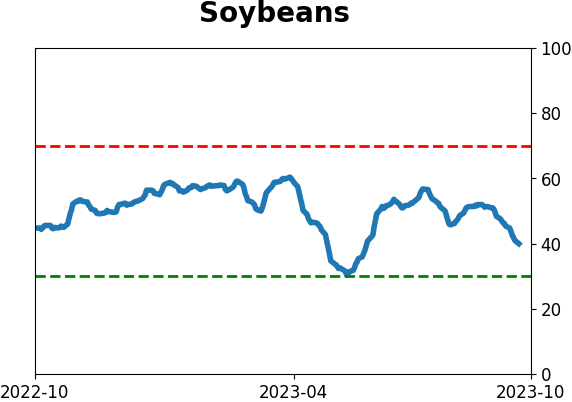
Commodity ETF's - 5-Day Moving Average
|
|