Daily Report : TradingEdge Weekly for Oct 7 - More extremes, another historic thrust, seasonal biases

| View/Print a PDF version of this Report |
Headlines
|
TradingEdge Weekly for Oct 7 - More extremes, another historic thrust, seasonal biases: This week, we saw a massive breadth surge across securities trading on the NYSE. That triggered on the heels of what had been an extremely wide spread between Smart and Dumb Money Confidence. Fundamentals remain a headwind, though. Keep an eye on Brazil as stocks surge. Gold has some headwinds, but other indicators are lining up. |
Smart / Dumb Money Confidence
|
|
Risk Levels
|
|
|

Research
TradingEdge Weekly for Oct 7 - More extremes, another historic thrust, seasonal biasesBy Jason GoepfertBOTTOM LINEThis week, we saw a massive breadth surge across securities trading on the NYSE. That triggered on the heels of what had been an extremely wide spread between Smart and Dumb Money Confidence. Fundamentals remain a headwind, though. Keep an eye on Brazil as stocks surge. Gold has some headwinds, but other indicators are lining up. FORECAST / TIMEFRAME |
Key points:
- Heading into this week, there was an extreme spread between Smart and Dumb Money Confidence
- Several other indicators are showing extremes as well
- The extreme led to a massive breadth thrust on the NYSE, a rare feat across so many securities
- Fundamentals remain a headwind for stocks, though
- The sectors with the best upcoming seasonality are showing some positive indicators
- Keeping an eye on Brazil as stocks surge
- Utility stocks are crashing
- Seasonality and rates argue for a lower gold price, but other indicators are countering the negatives
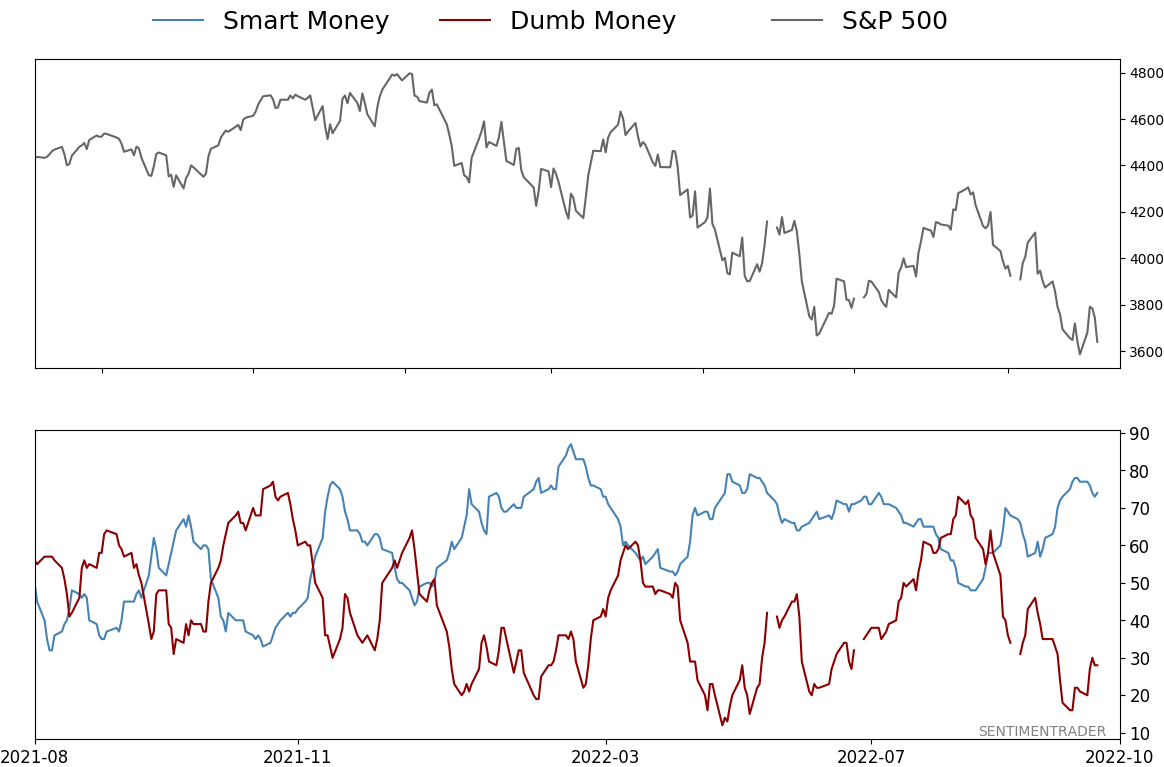
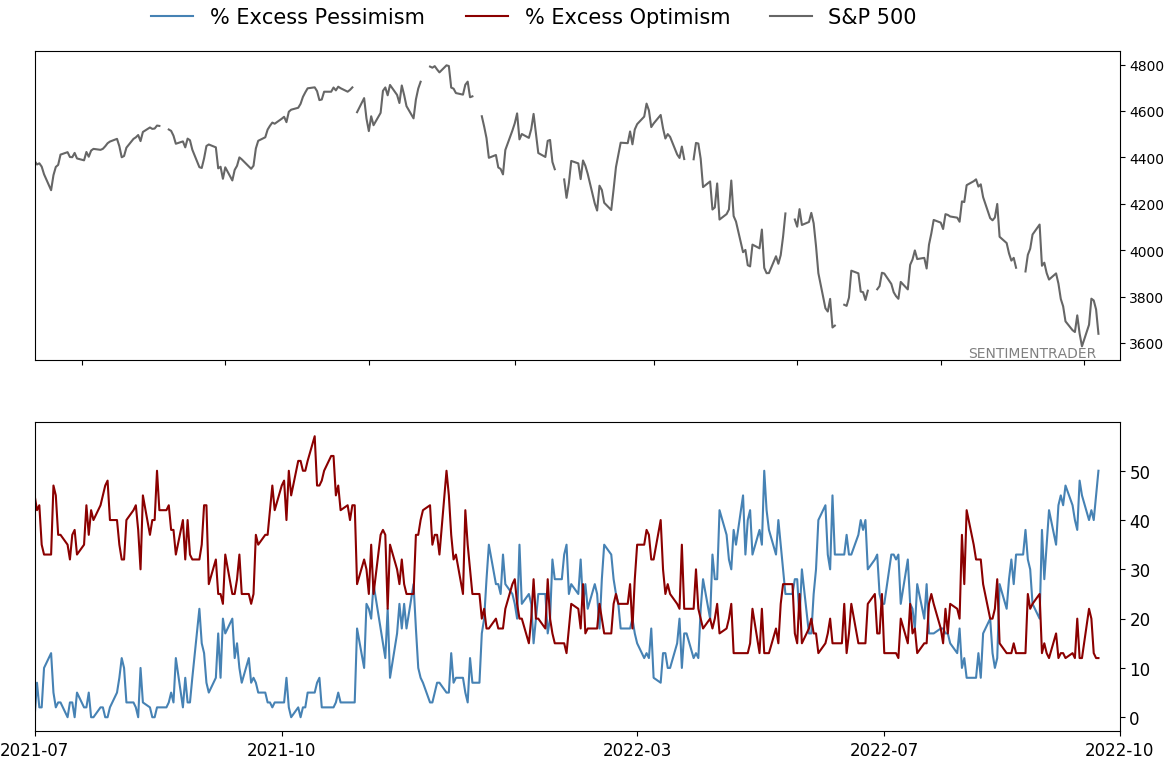
An extreme spread between Smart and Dumb Money
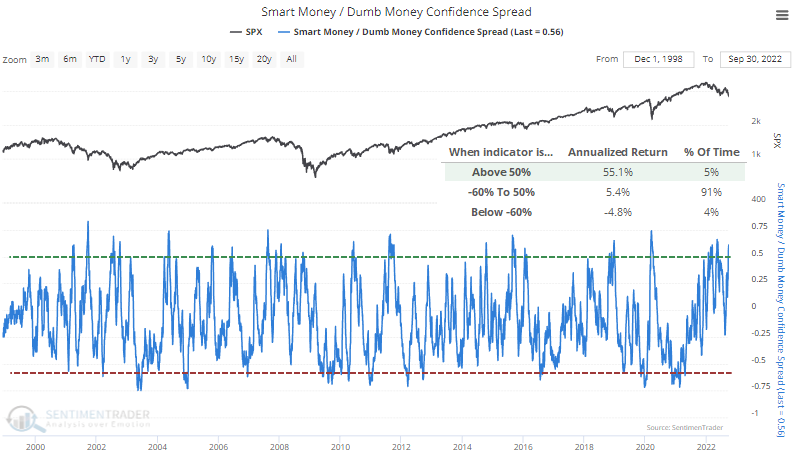
Entering this week, investors had given up.
Dumb Money Confidence in a future rally plunged anew, hanging around 20%. Smart Money Confidence often rises while Dumb Money declines, and this model had climbed to near 80%.
The spread between the Confidence indexes therefore widened to another extreme, holding above 55%. The S&P 500's annualized return went the spread was above that threshold has been +55.1%.
Another notable aspect of the models is that the spread not only popped above 55%, it held at that level or above for six consecutive sessions. We haven't seen that too many times over the past 24 years.
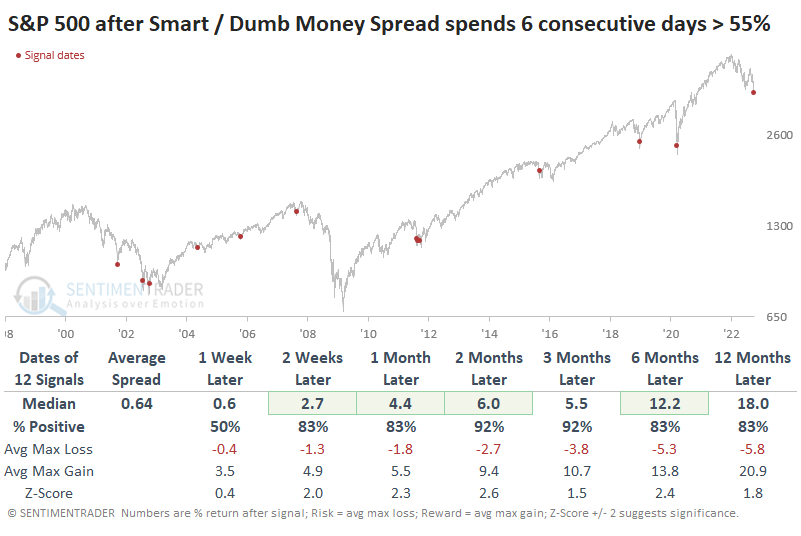
During the next three months, every signal had a max gain larger than the max loss. It was still uncomfortable after several of them, with more than a -5% drawdown, but ultimately, the gains outpaced the losses.
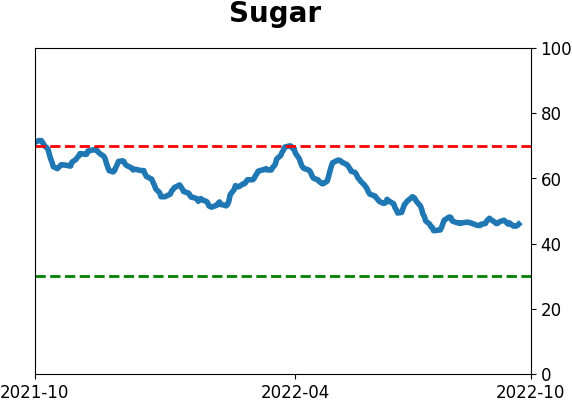
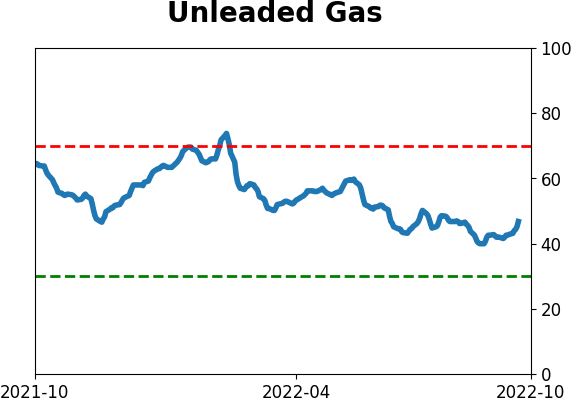
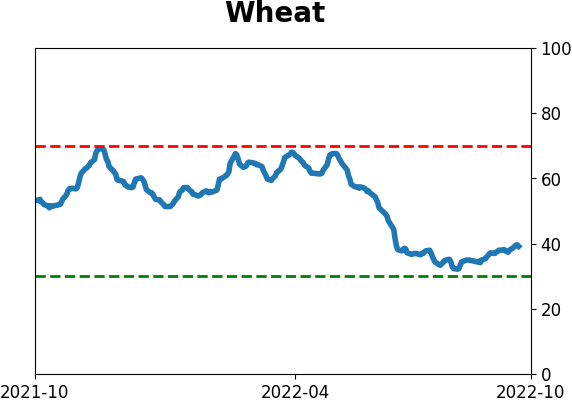
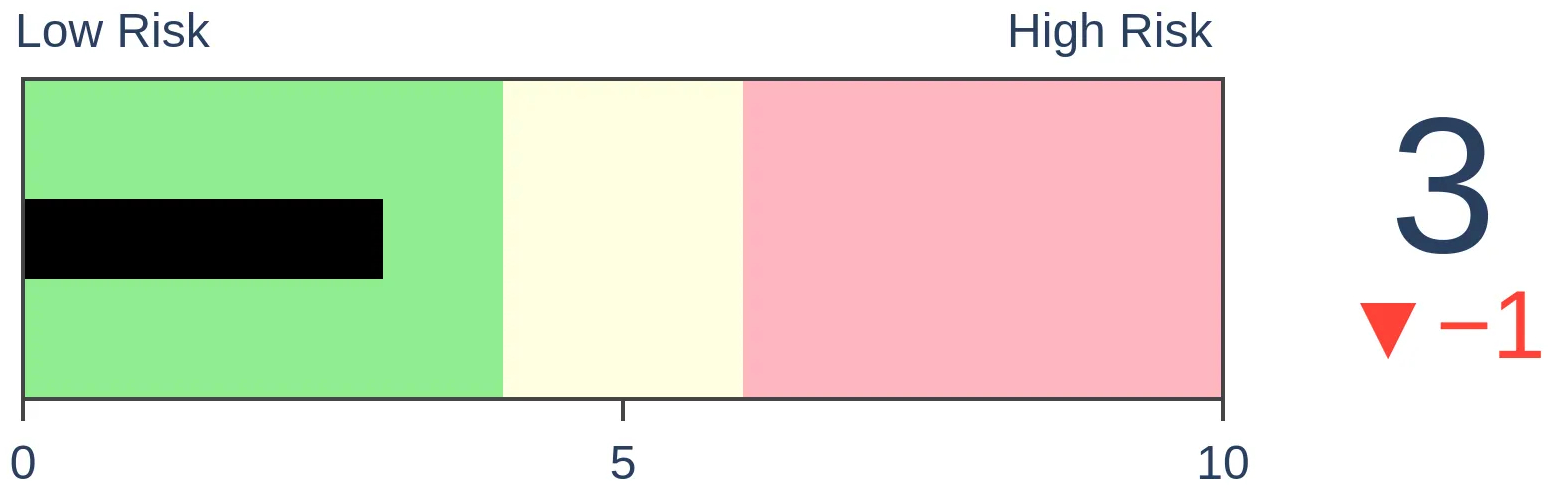
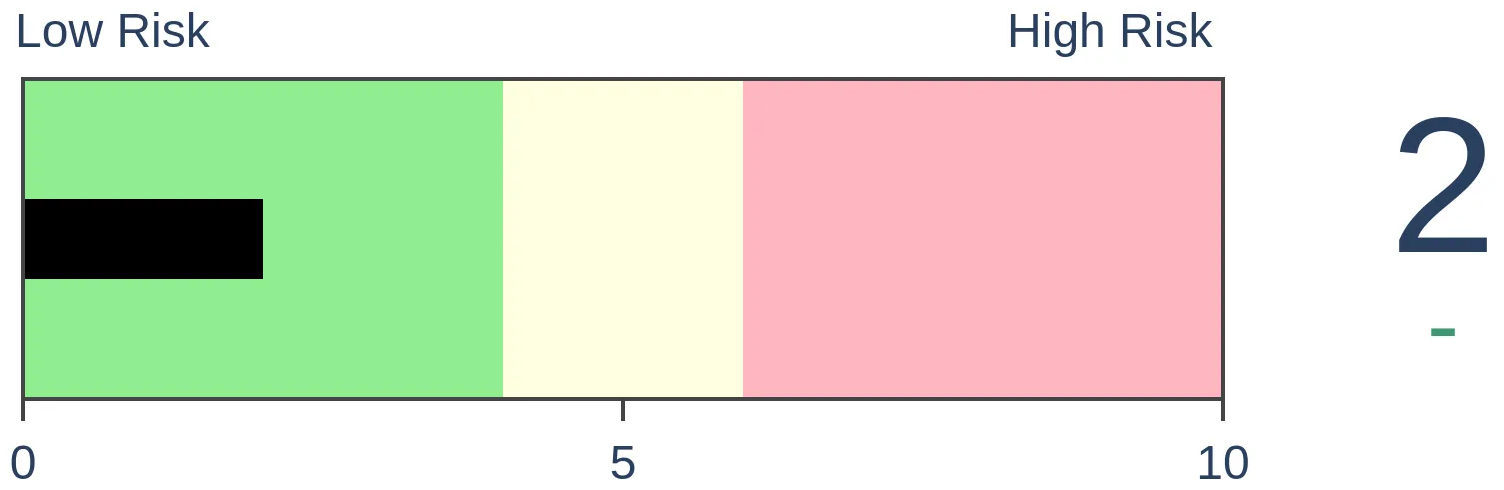
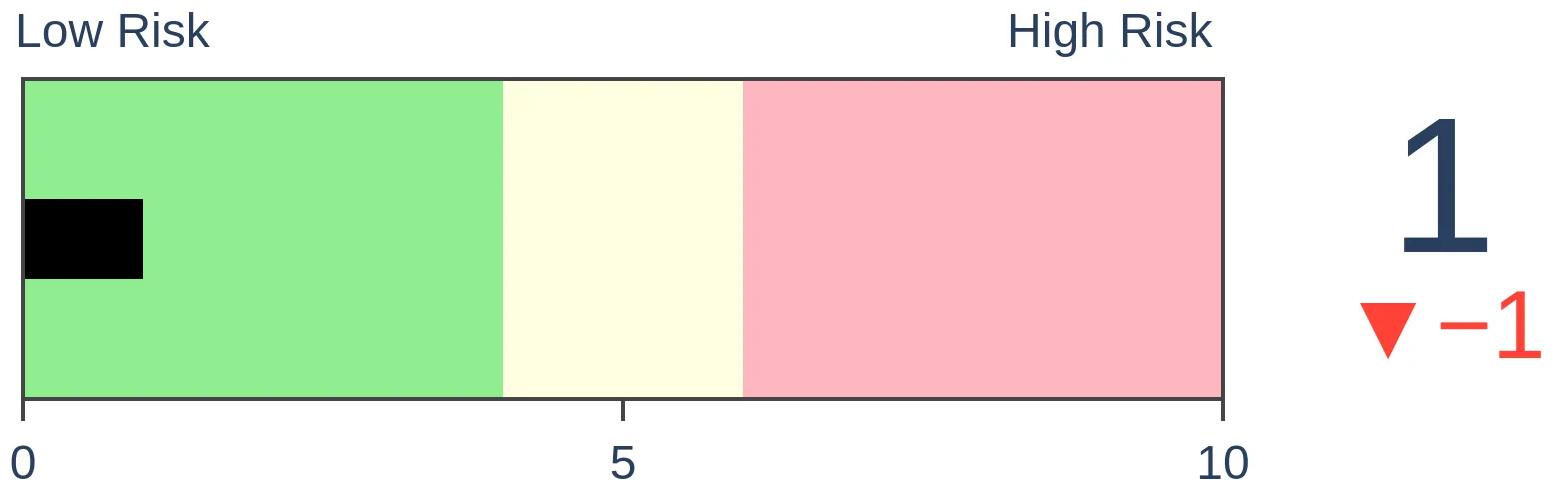
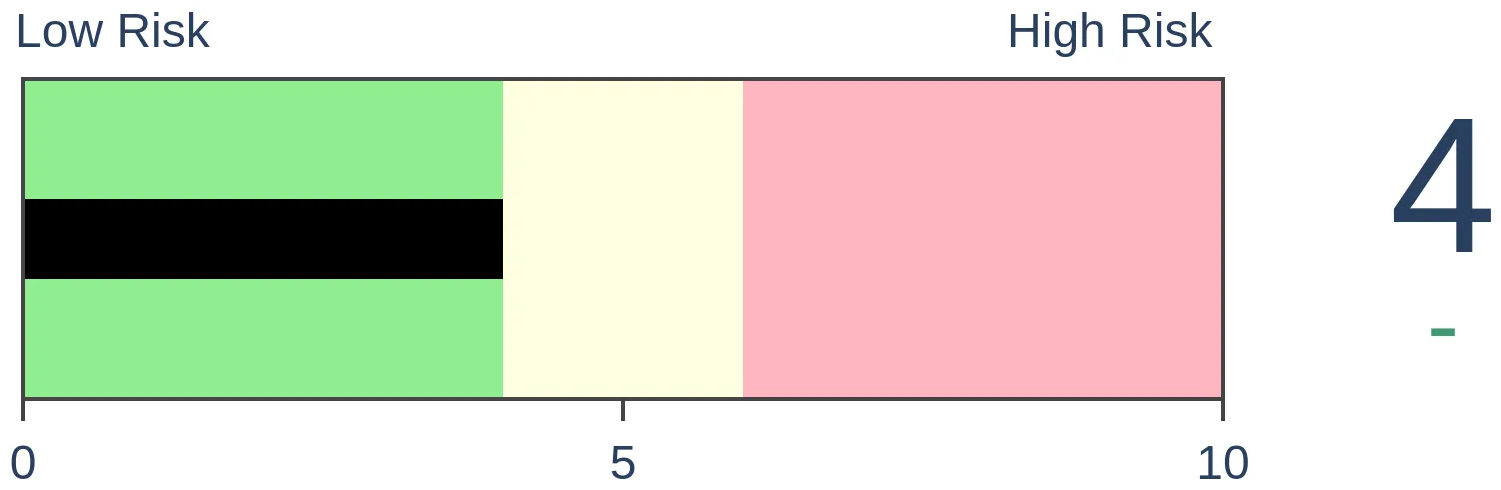
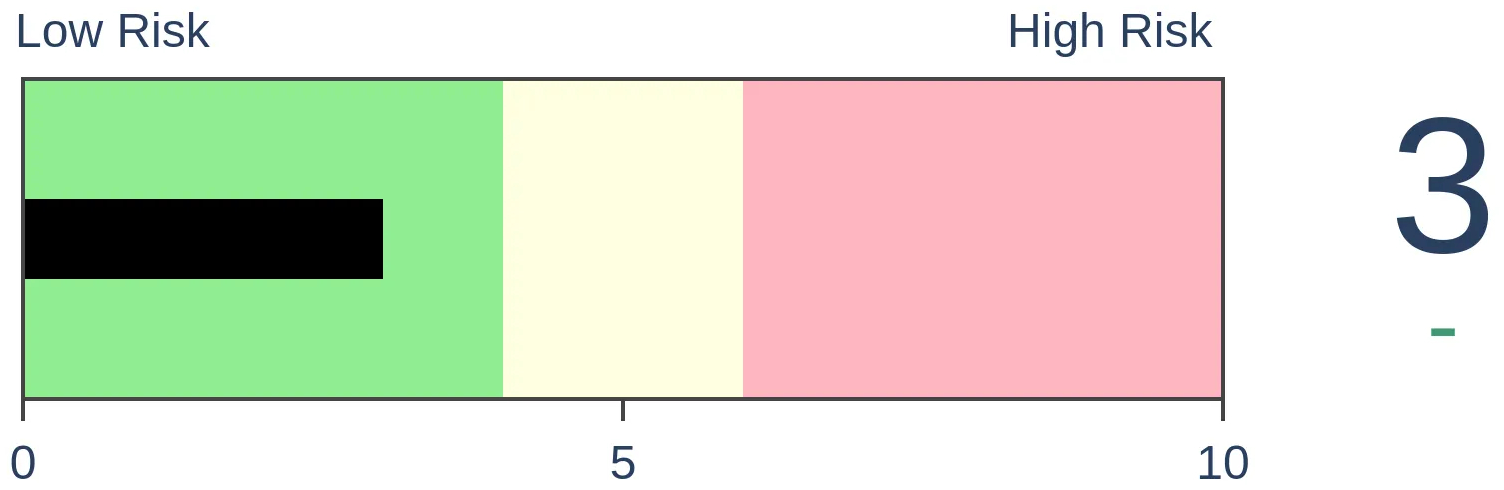
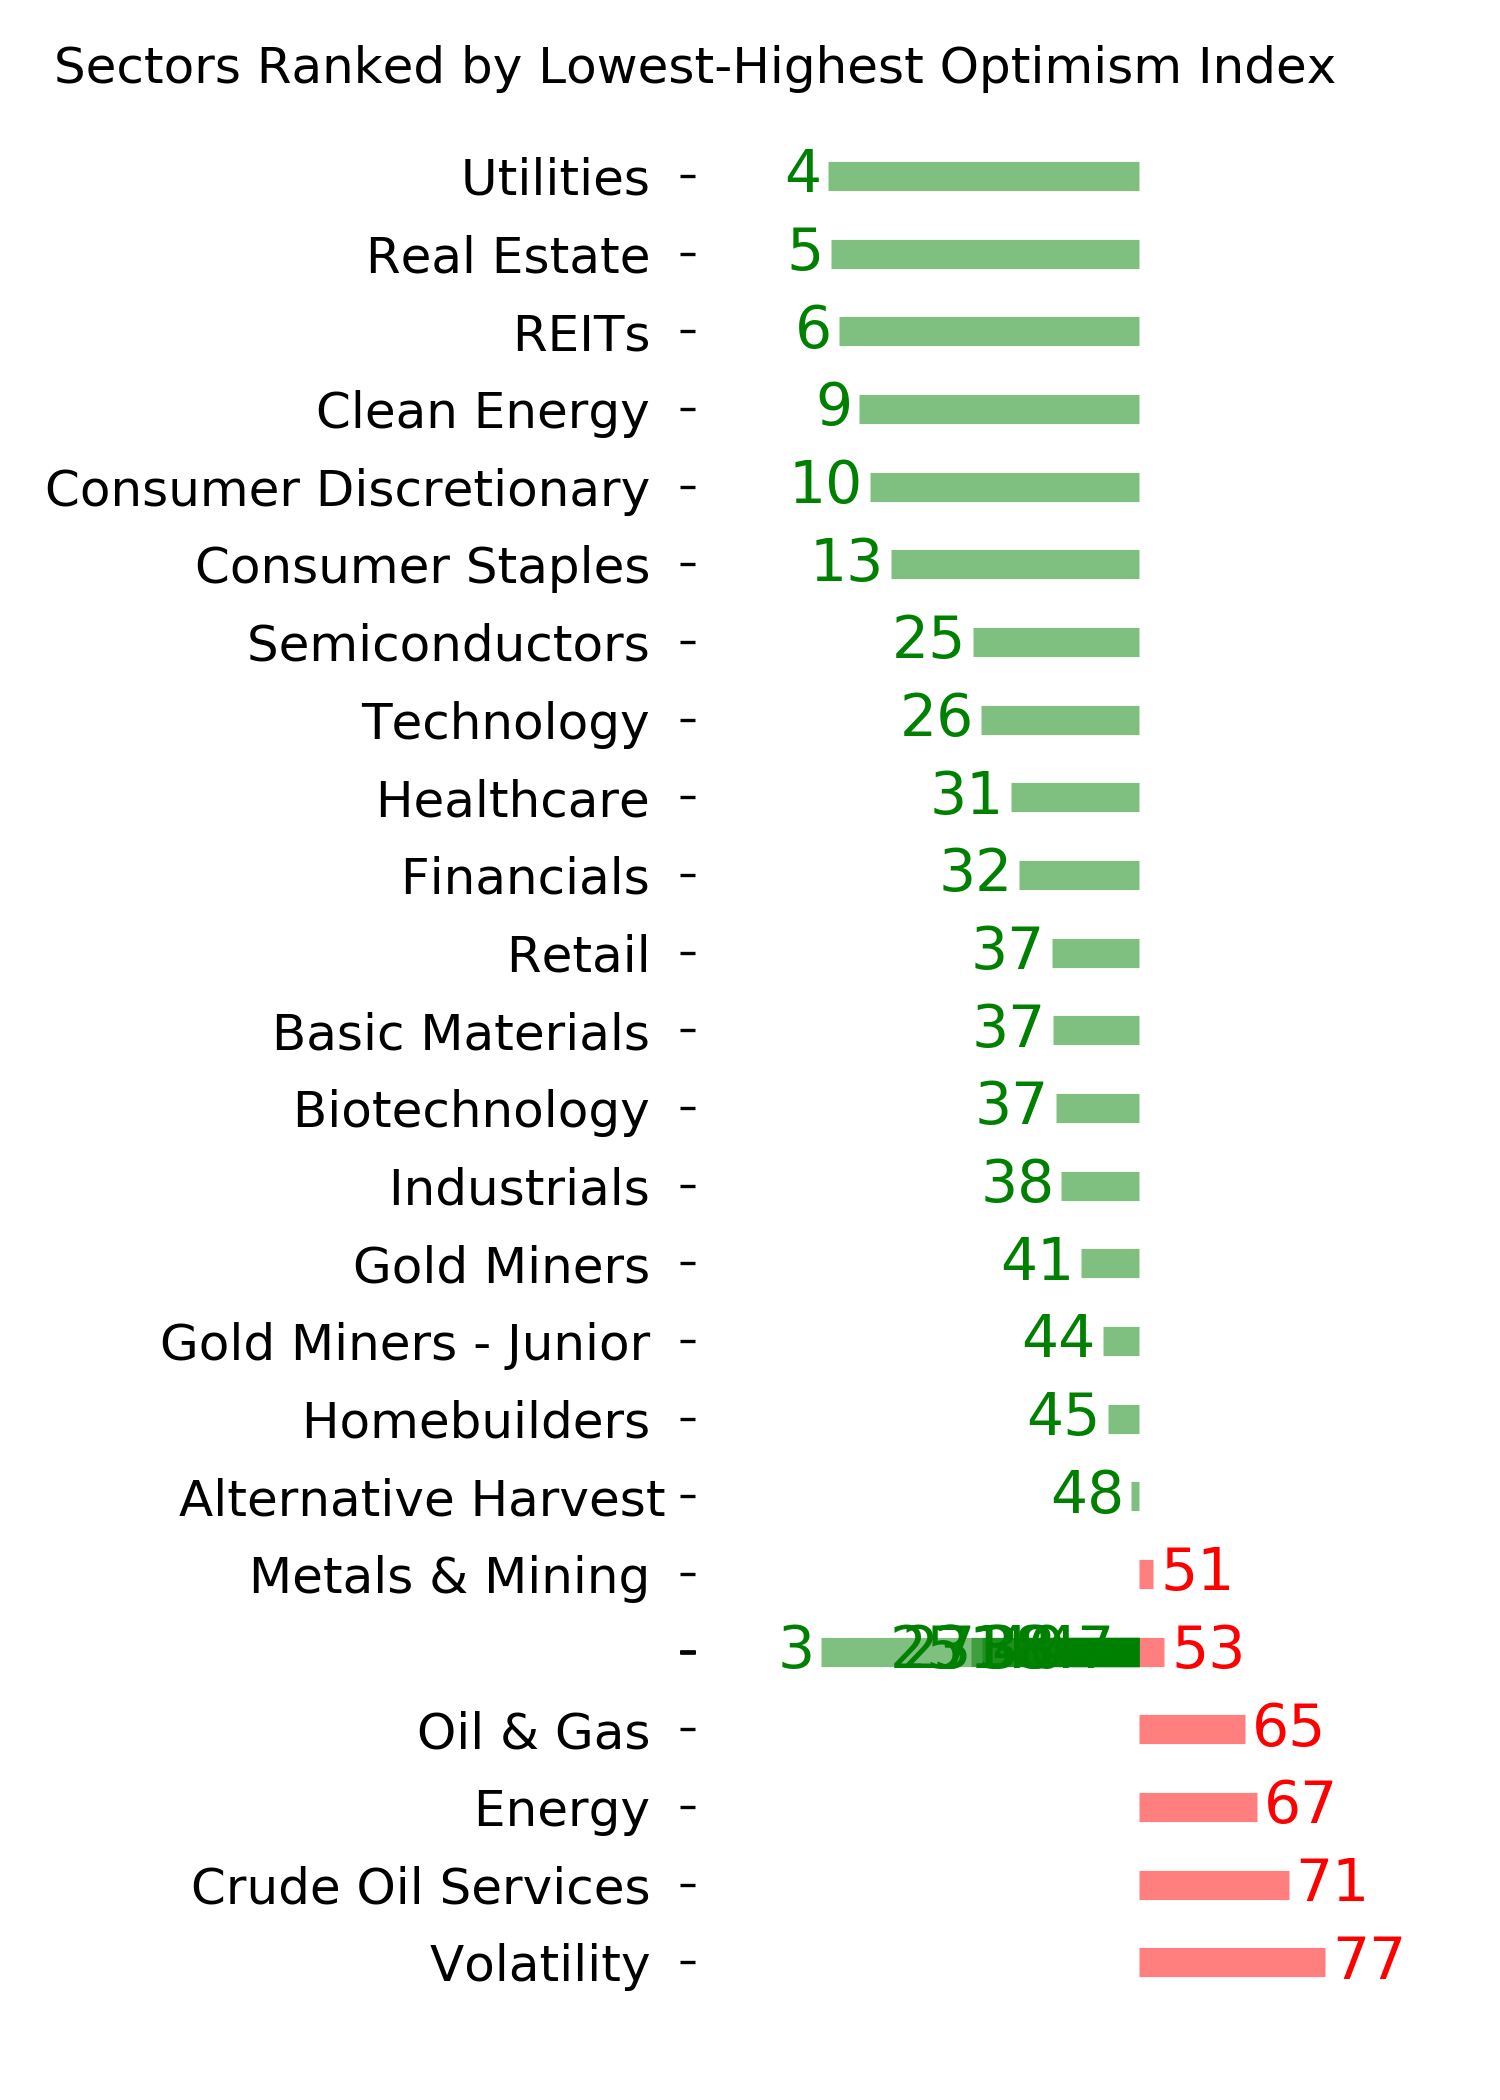
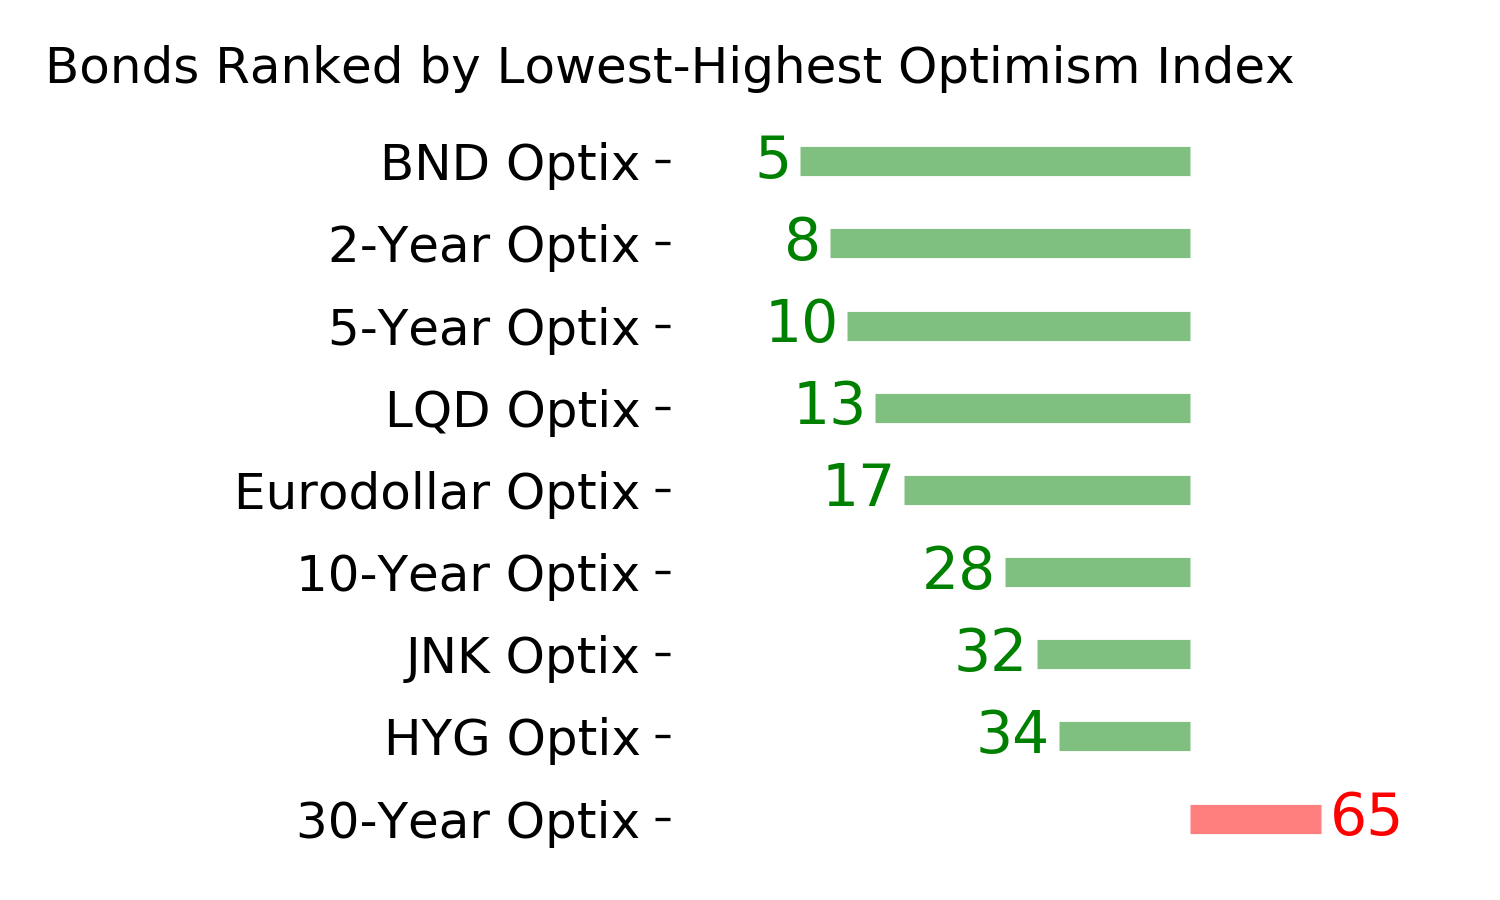
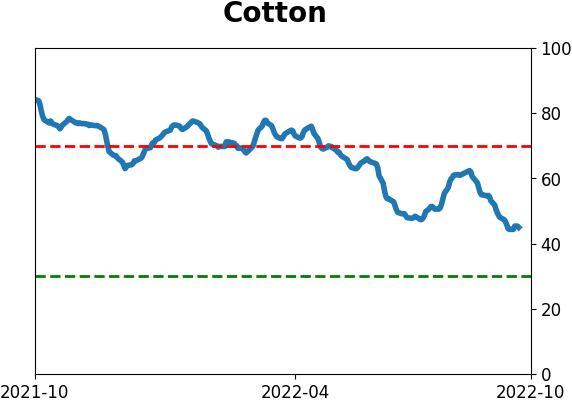
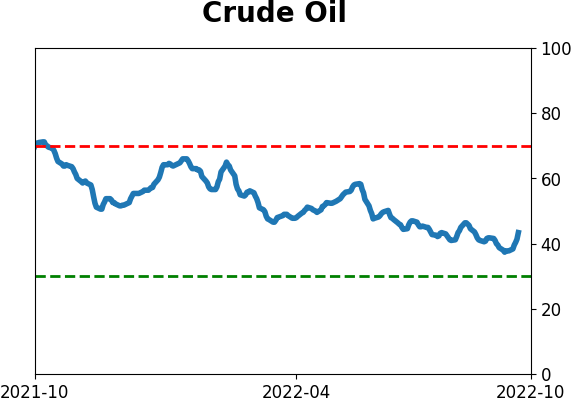
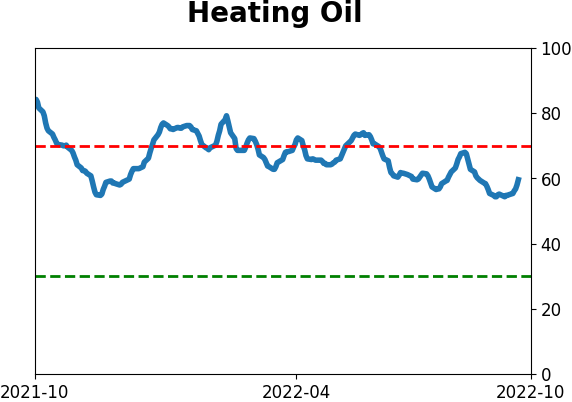
Because of the volatility across assets, the Risk Levels for most assets have been low. The Risk Levels are automatically calculated based on the Optimism Index for markets including stocks (short-term and intermediate-term), bonds, gold, oil, and agriculture.
It's extremely rare to see the Risk Levels across all of those so low at the same time. In fact, since we began calculating these in 2004, they have never been lower.
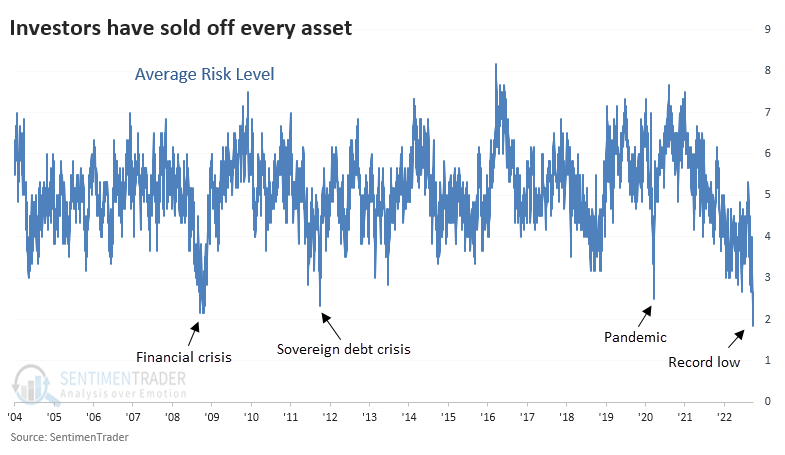
Because markets never rise and fall at the same pace at the same time, future returns weren't necessarily consistent when the average Risk Level got so low. The sample size is only three, so this should be taken with a hefty grain of salt, but gold and oil did best short-term, bonds did best in the medium-term, and stocks did best long-term.
More indicators are triggering extremes
Jay highlighted a few more indicators that recently triggered notable extremes.
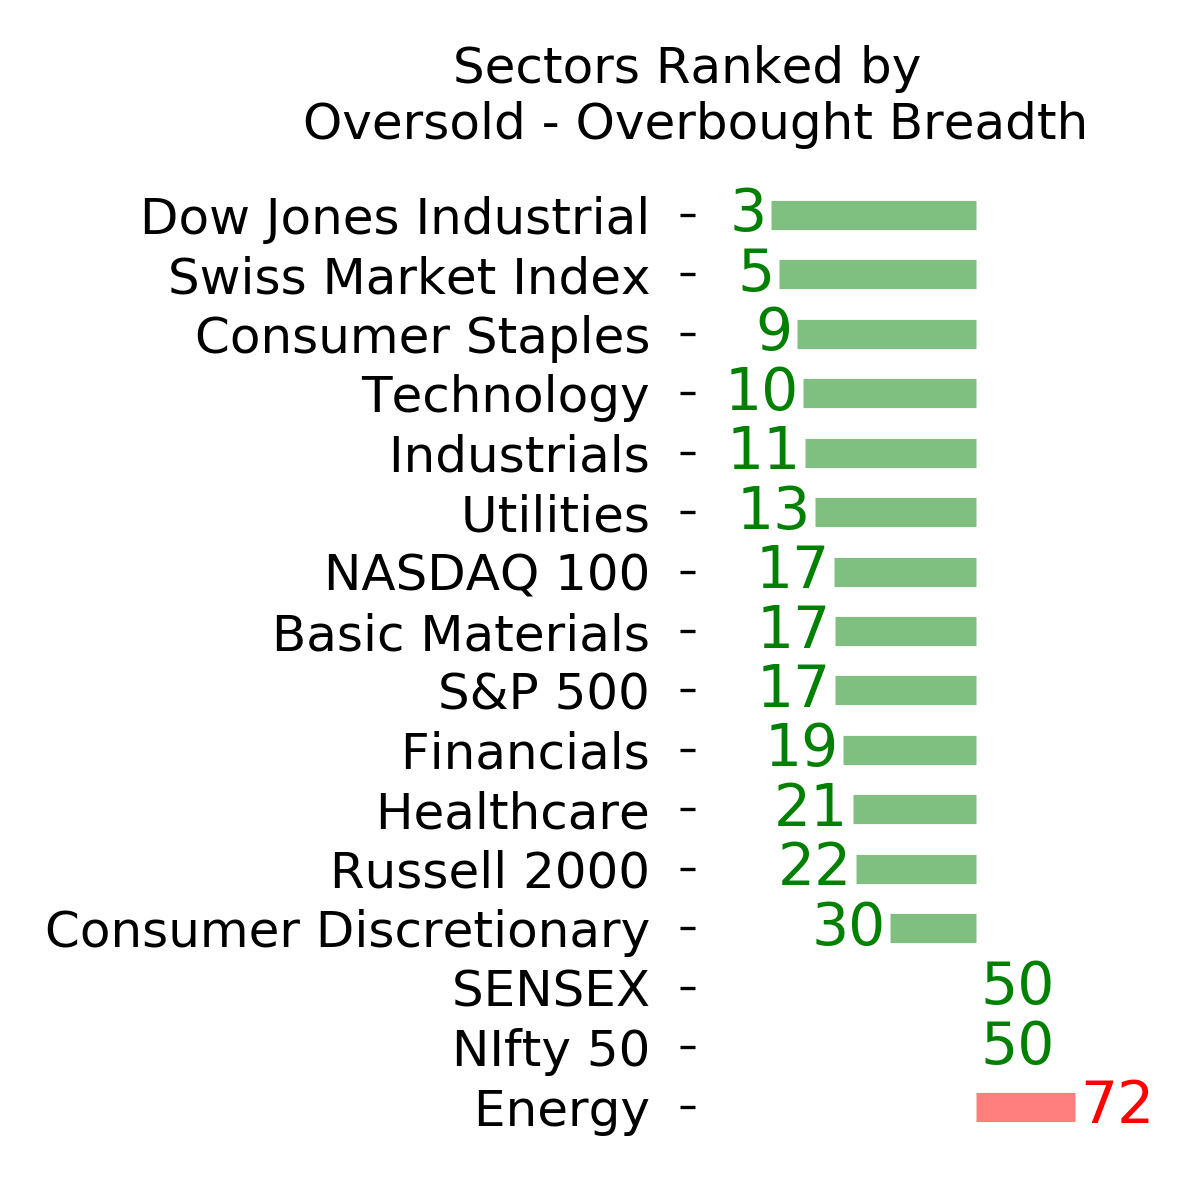
Selling pressure has been widespread, and it's been enough to push every industry into a correction. This breadth indicator shows the percentage of 23 industries that are trading more than 10% below their 52-week highs. Extreme readings often mark exhaustion.
The chart below displays those times when every industry was in a correction for at least three days, per the Backtest Engine. The table shows that the S&P 500's returns were excellent going forward, as this only triggered near major lows.
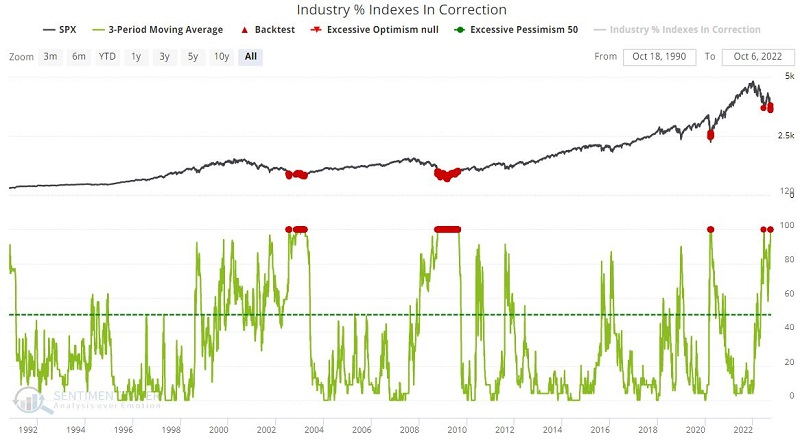
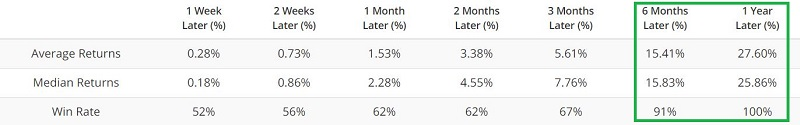
This particular indicator signal tends to give signals in clusters, and an actual price bottom typically takes some time to form - accompanied by some not-insignificant volatility. Nevertheless, 6-month and 12-month results are pretty compelling.
Among other indicators, the OEX Open Interest Ratio takes the total put open interest and divides it by the total call open interest. And the SPX Aggregated Put/Call Ratio analyzes the aggregated option data for constituents' stocks comprising the S&P 500 Index. Both indicators have given off readings that compare favorably to the table above.
After the pessimistic extreme, another massive breadth thrust
To start the week, there was a massive thrust over a couple of days. Similar setups never erred in preceding higher returns.
As we saw in March 2020, consecutive days witnessed overwhelming buying interest. On the NYSE, five times more securities advanced than declined, and ten times more volume flowed into advancing than declining securities.
Even going back to 1928, this is a rare occurrence. We have less confidence in breadth metrics before 1962, especially before 1950, so we'll limit the lookback to then.
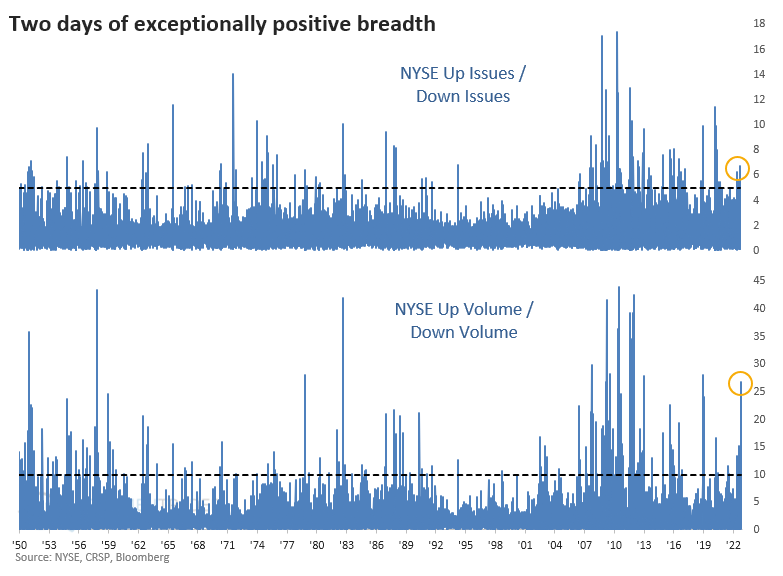
When five times as many securities rose as declined on consecutive sessions, the S&P 500 never suffered a negative one-year return. Even over the next six months, there was only a single small loss.
When more than ten times as much volume flowed into advancing versus declining securities, returns were even more consistently positive.
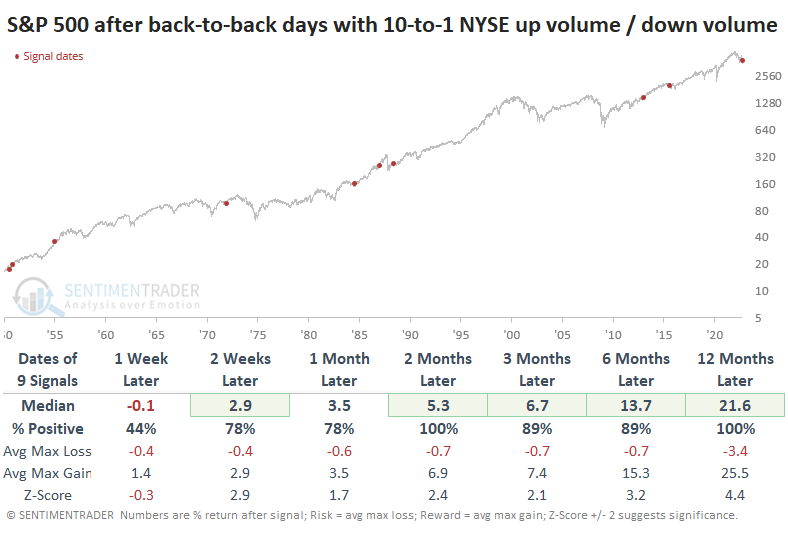
Breadth thrusts have been one of the most consistently reliable market developments for decades. Unfortunately, in 2022, we've seen several of them fail when they haven't really before. That's enough to be a bit suspect of ones triggering now. It would be typical for stocks to back off over the next week, but we should not see materially lower prices if this thrust is going to hold.
Fundamentals remain challenging
Dean noted that the latest survey from manufacturing executives does not bode well for a potential turn in the business cycle.
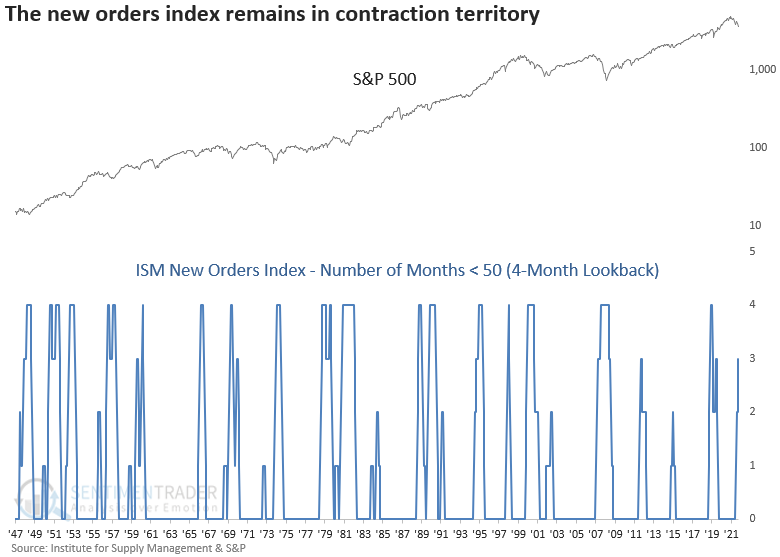
The Institute for Supply Management released the latest manufacturing data last week. While the overall survey remains slightly above 50 - suggesting expansion - two key sub-components have continued to hover below the critical level.
For the first time since March 2008, the new orders index closed in contraction territory in 3 of 4 months, with the S&P 500 trading below its 12-month average.
When the new orders index is in contraction mode and the S&P 500 is below its 12-month average, stocks tend to struggle up to 6 months later. The signal shows a negative return at some point in every case in the first six months. A year later, the results look solid except for 2000 and 2008.
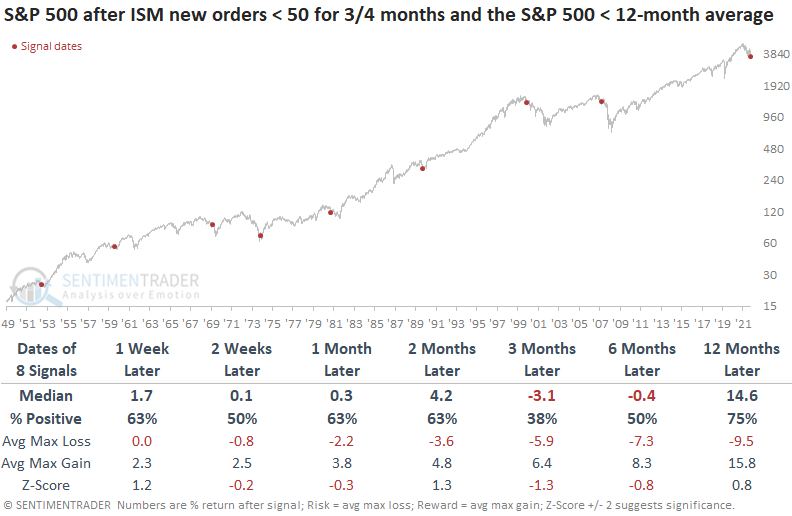
While the overall ISM survey remains in expansion territory, the new orders signal suggests it will likely fall below 50. Most of the ISM values were well below the contraction level at the time of an alert, with March 2008 being the most similar.
The ISM employment index looks slightly worse than the new orders index, with a contraction in 4 of 5 months. After a persistent contraction in the employment index, stocks struggled, especially up to 3 months later. Once again, a year later looks constructive except for the dot-com bust and the global financial crisis.
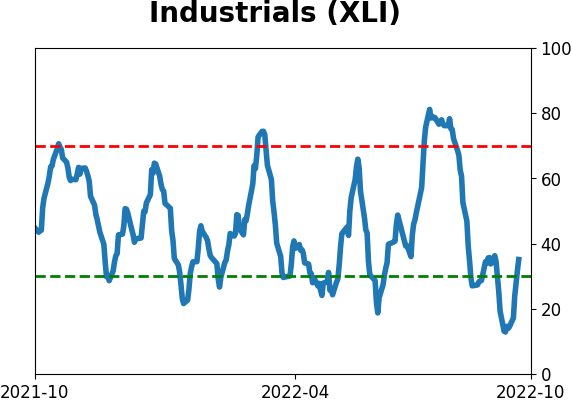
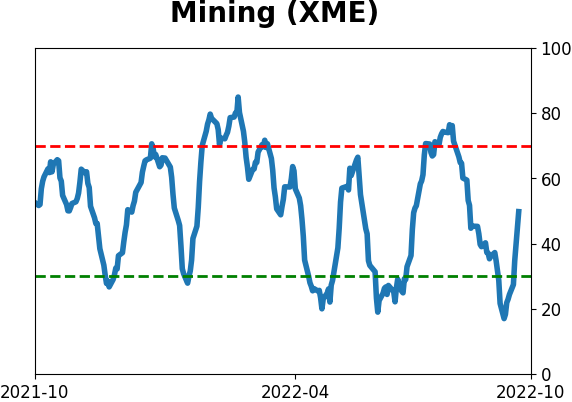
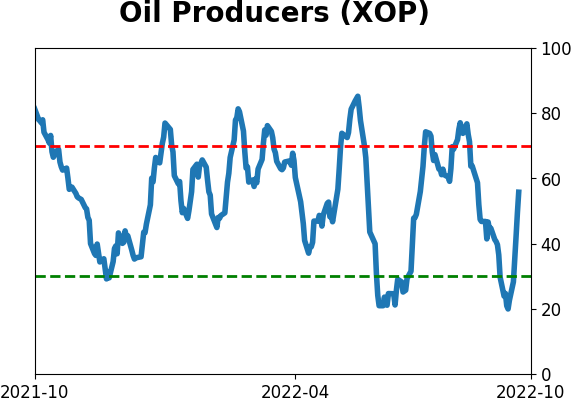
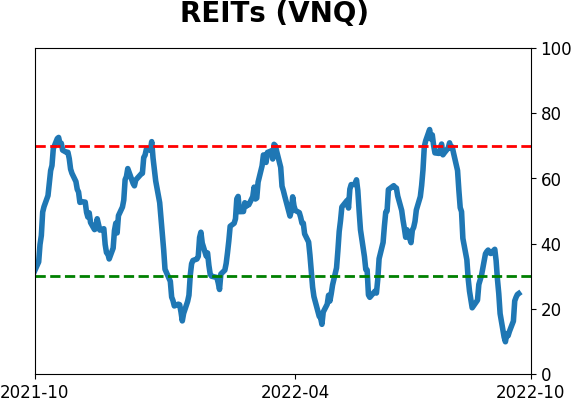
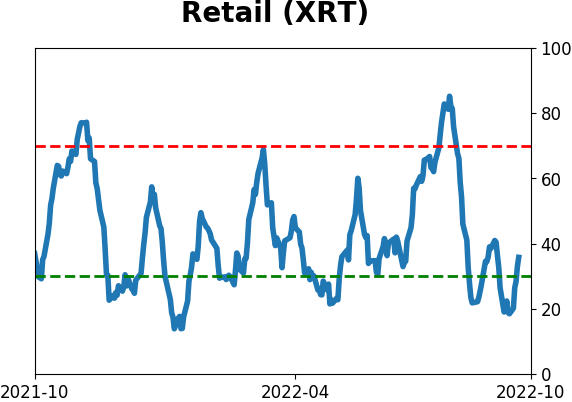
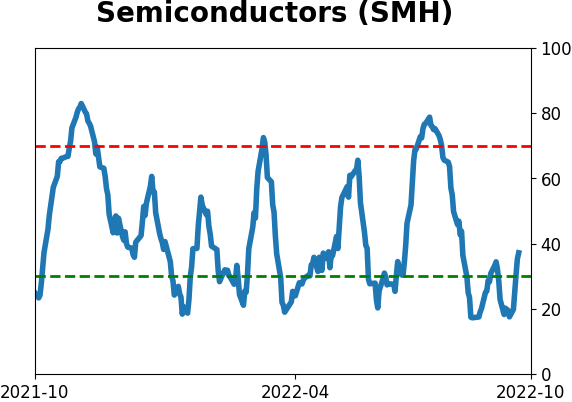
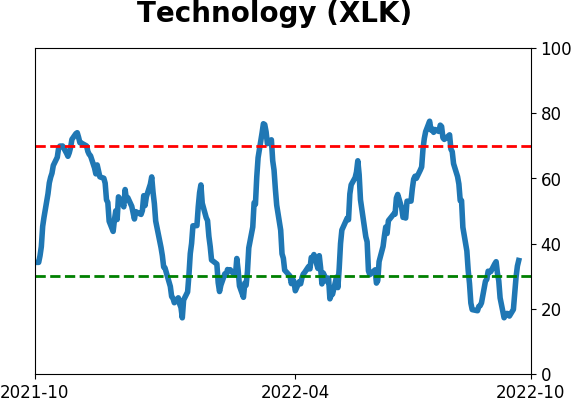
Some sectors show surprising strength
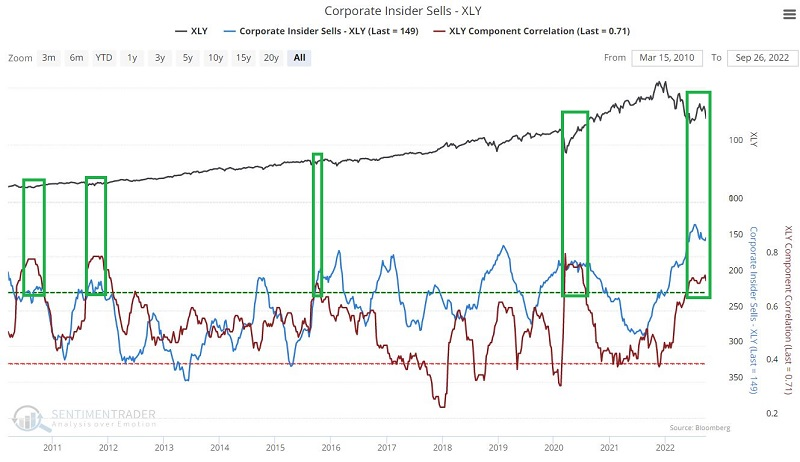
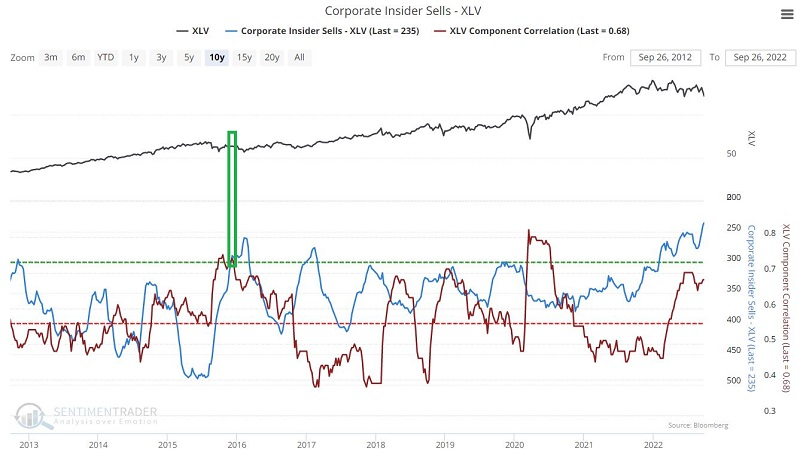
Jay showed that for the sectors entering a seasonal sweet spot, investors have been panicking while insiders are buying.
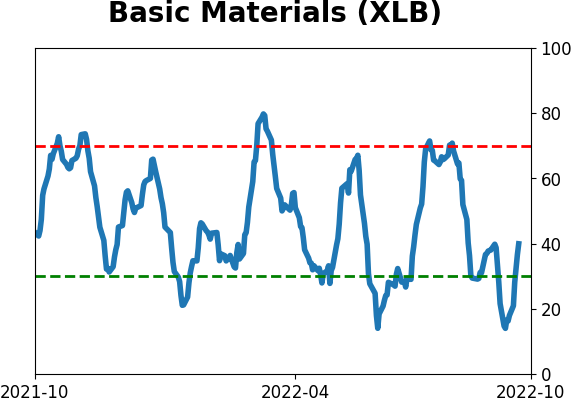
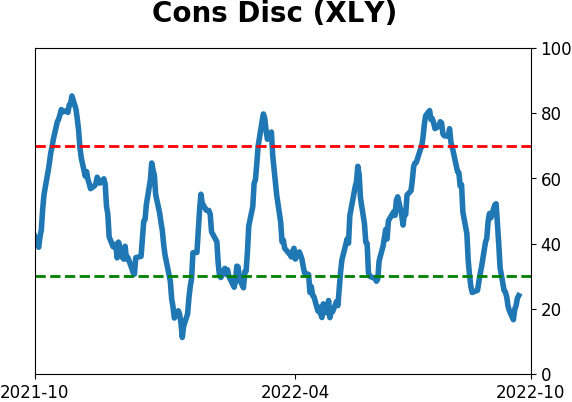
The most favorable ten-month period within the 48-month election cycle includes October of the mid-term year through July of the pre-election year. As shown last week, the top five sectors for the best ten-month election cycle period are:
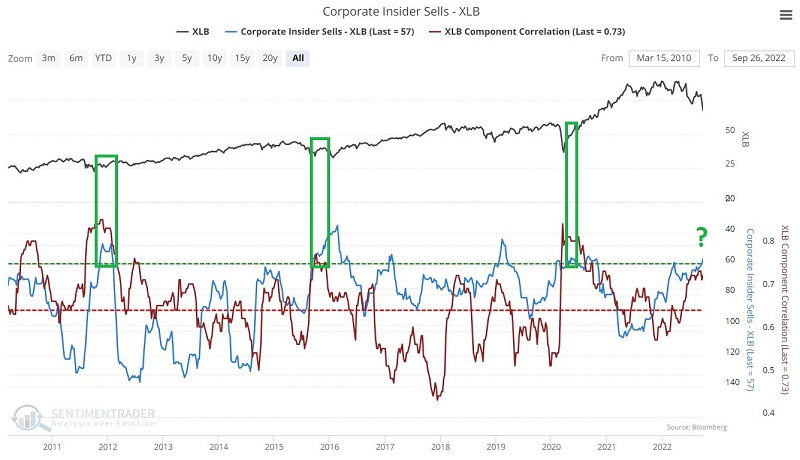
- Materials (XLB)
- Technology (XLK)
- Industrials (XLI)
- Consumer Discretionary (XLY)
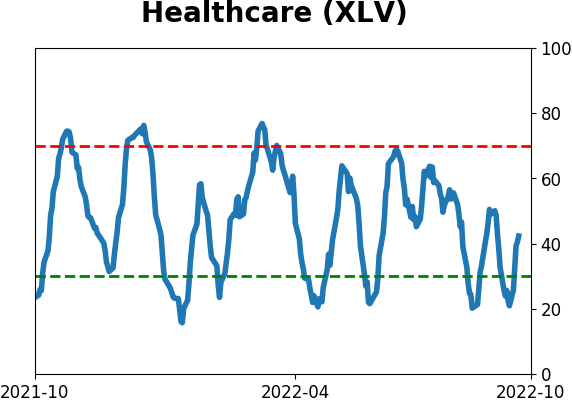
- Health Care (XLV)
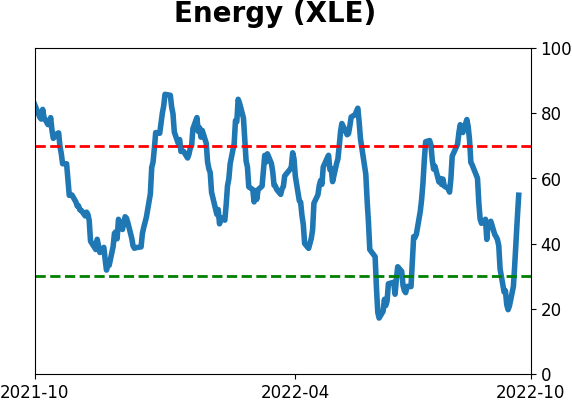
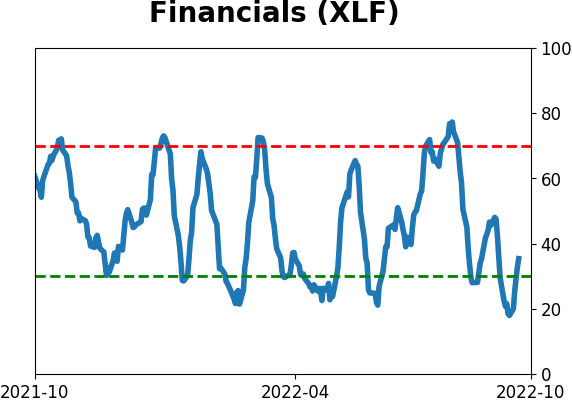
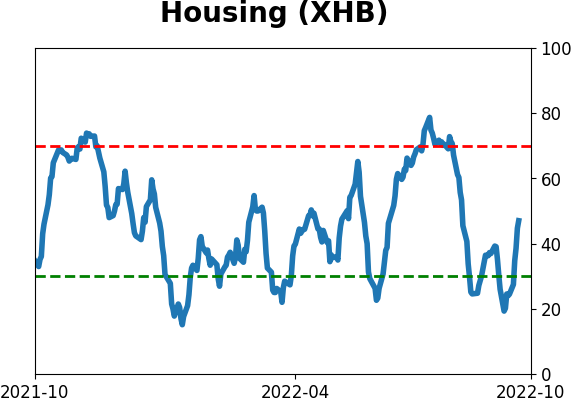
In these sectors, most of them are showing low selling pressure among corporate insiders at the same time that investors are panicking, as defined by a high correlation among stocks in the sectors.
In the charts below, we invert the scale for Corporate Insider Sells, so that bullish readings for both indicators appear at the high end of the indicator charts. The green boxes in each chart note those rare occasions when both corporate Insider Sells were low and component correlation was high.
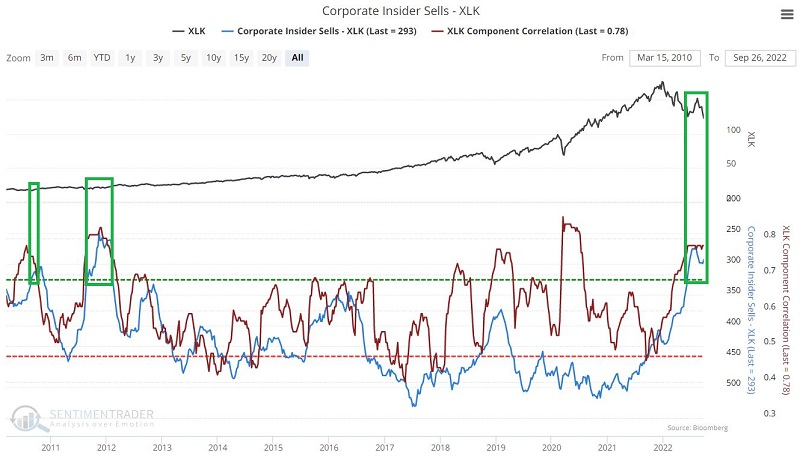
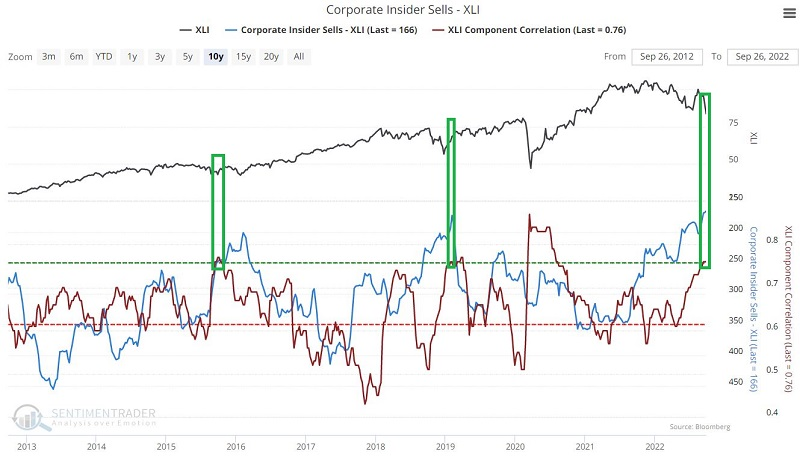
Jay went on to test similar readings for each of the indicators in each sector, and they showed promising results for bulls.
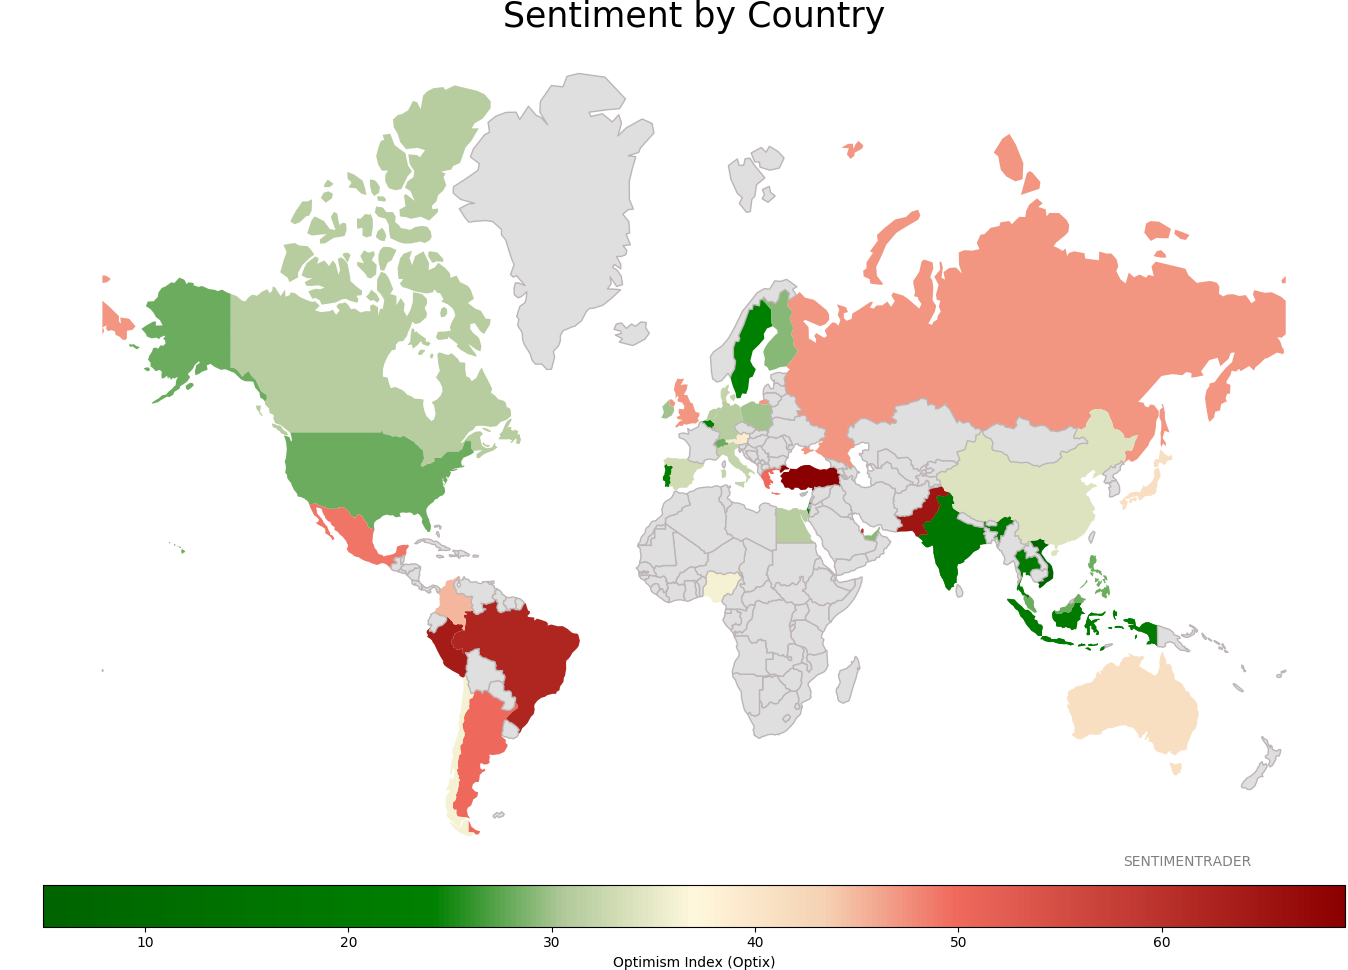
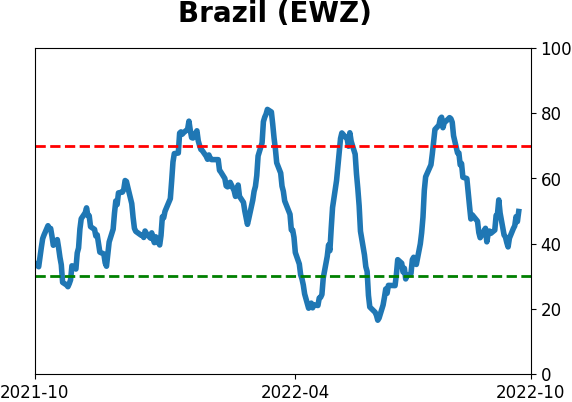
Keeping an eye on Brazil
Brazil is a market Dean is keeping an eye on for trade ideas as the central bank stayed put at its most recent policy meeting in September. While they could undoubtedly press the hike button again, a further pause or even pivot to an easing cycle would be a welcome development.
On Monday, the Brazilian Ibovespa index surged over 7% in two sessions and closed at a 30-day high but not a 126-day. The momentum breakout triggered a buy signal for Brazilian stocks.
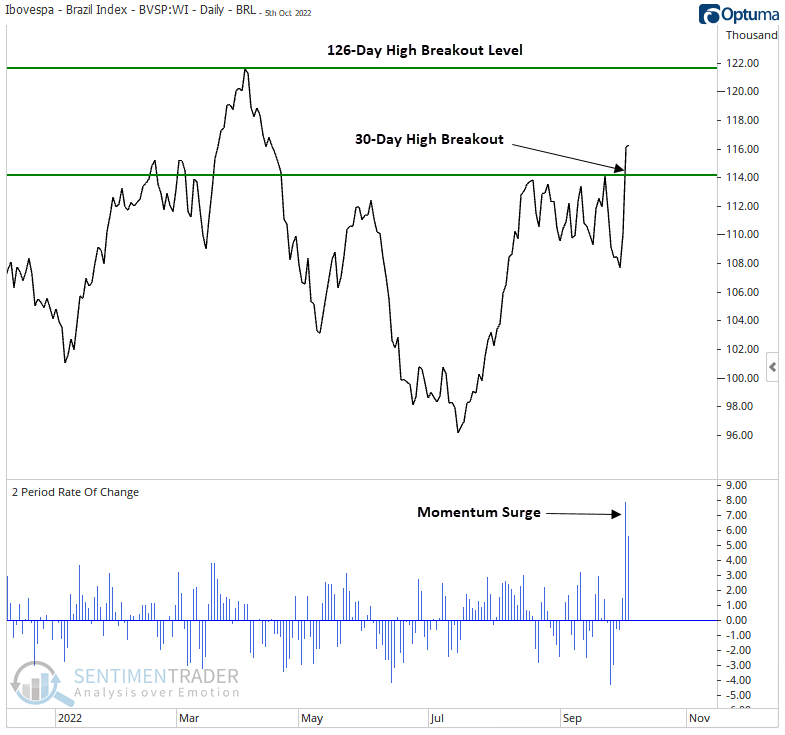
The Ibovespa index performed well after momentum breakouts, especially a month later. The signal shows a positive return in all but two instances at some point in the first month. U.S. dollar-based traders can use the iShares ETF (EWZ) as a proxy for the Ibovespa index.
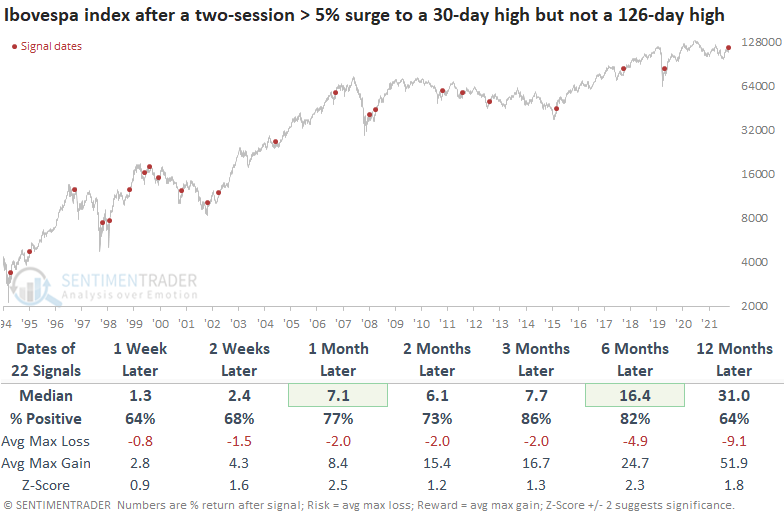
The Brazilian central bank has been on an aggressive tightening cycle, hiking the target rate 12 times since March 2021. However, at the September meeting, the central bank paused. Since the meeting, the Ibovespa index is up 3.84% versus a flat return for the S&P 500.
Even if isolating the momentum breakout signals based on when the Brazil central bank was either tightening or had paused after a tightening cycle, the model performed well across all time frames, especially three months later.
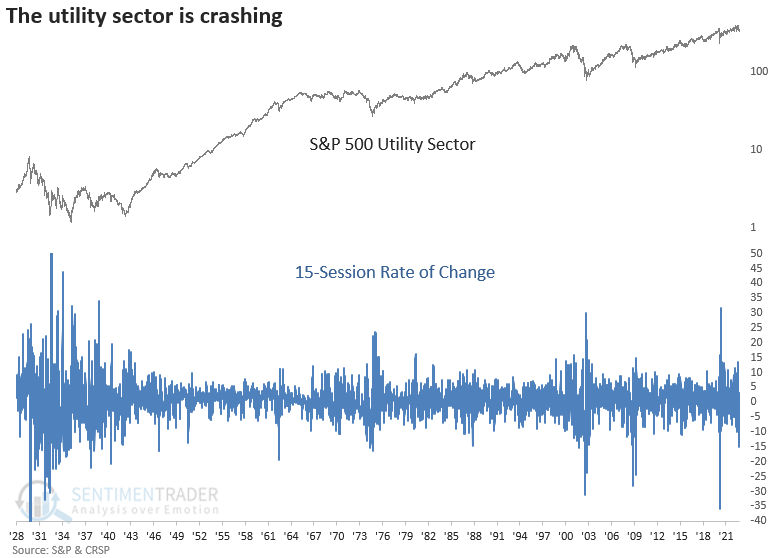
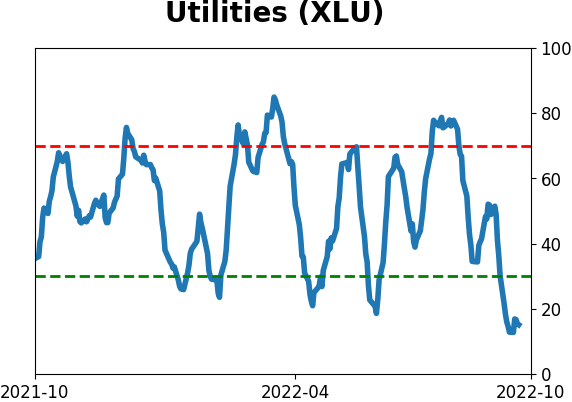
Utility stocks are crashing
Dean noted that the S&P 500 utility sector decided to join the bear market party, crashing 15% over the past 21 sessions.
Historically, when investors panic and push the sell button on traditionally defensive groups, the broad market is one step closer to a potential bottom. However, the sector is less than 20 sessions from an all-time high. So, it's more likely that the momentum signal could be the start of something rather than the end.
The utility sector tends to decline further over the next few months after rapid contractions over a 21-session period. While the 1929-42 secular bear market dominates the signal count, 7 out of 9 alerts since 1962 were negative at some point in the first two weeks.
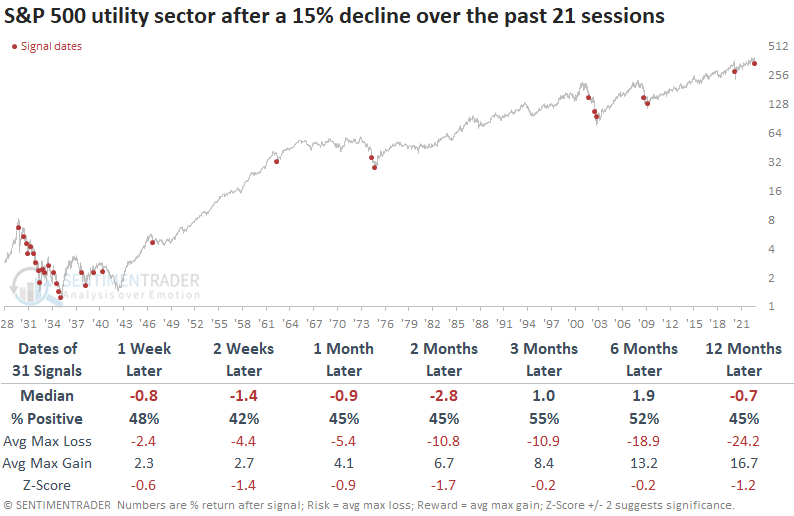
The S&P 500 fared even worse in the first few weeks, with weaker returns and win rates than utilities.
The swift decline in utility stocks resulted in a surge in 252-day lows, which increased to the highest level since the pandemic crash. The expansion in new lows for utility stocks also does not bode well for the sector over the next month. Returns and win rates were unfavorable, especially during the inflationary 1970s period when bond yields marched higher.
Gold good, gold bad
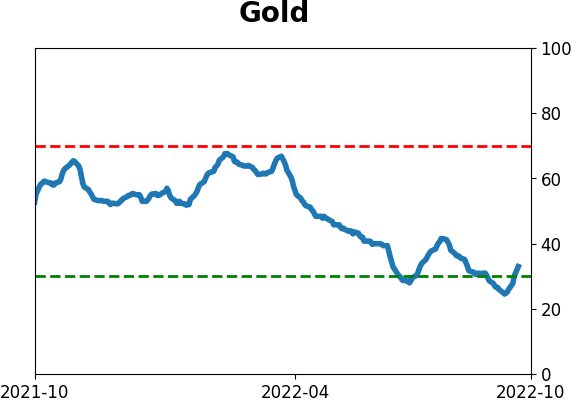
Jay noted that rates and the calendar argue for lower gold prices in the weeks ahead, but several other indicators counter those potential negatives.
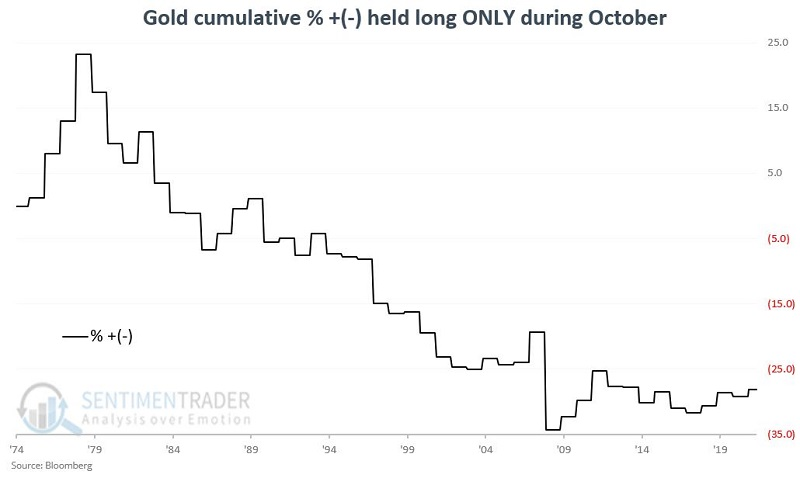
Gold is about to enter a period of general price weakness. For 2022, this period extends from 2022-10-20 through 2022-11-03. The chart below displays the cumulative return for gold if held only during October from 1975 through 2021. Sometimes up, sometimes down, but overall, generally not the ideal time to commit money to gold.
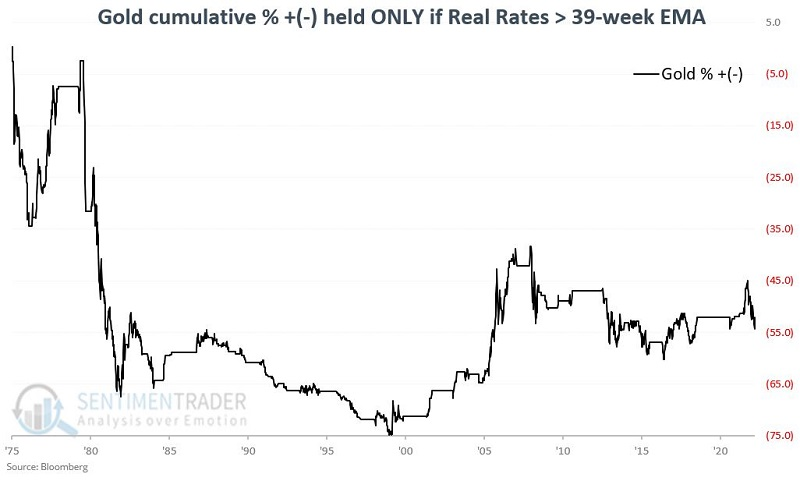
The chart below displays the cumulative return for gold when real rates are above their 39-week exponential average, which is currently the case. Gold did just fine in this environment during the mid-2000s, so it's not like the metal can't rally when real rates are rising, but once again, overall, generally not the ideal time to commit money to gold.
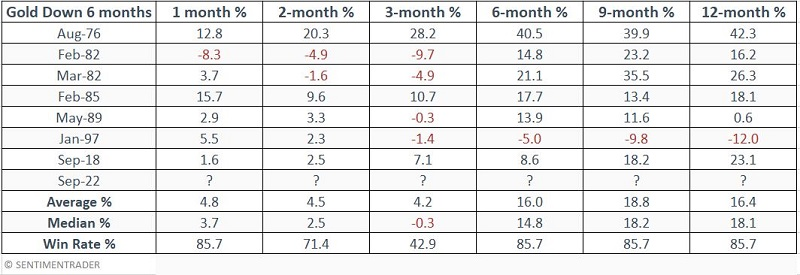
On the positive side of the ledger, gold has declined each of the past six months, which has only happened a handful of times since 1975. Higher gold prices typically followed. The table below shows the other times this happened, including one overlapping signal when gold declined for a seventh month in 1982. Gold's returns in the months ahead were mainly excellent.
Other indicators, like the Risk Level, Optimism Index, Copper/Gold Ratio, and bond volatility, have reached levels that consistently preceded higher prices in gold.
October has a long history of being a volatile and often negative month for gold. History suggests it may be prudent to wait a bit longer before committing to the yellow metal. Nevertheless, several favorable factors are flashing green for a trader looking for a reason to buy gold.
About TradingEdge Weekly...
The goal of TradingEdge Weekly is to summarize some of the research published to SentimenTrader over the past week. Sometimes there is a lot to digest and this summary is meant to highlight the highest conviction or most compelling ideas we discussed. This is NOT the full research that's published, rather it pulls out some of the most relevant parts. It includes links to the published research for convenience; if you don't subscribe to those products it will present the options for access.
Indicators at Extremes
|
|
|
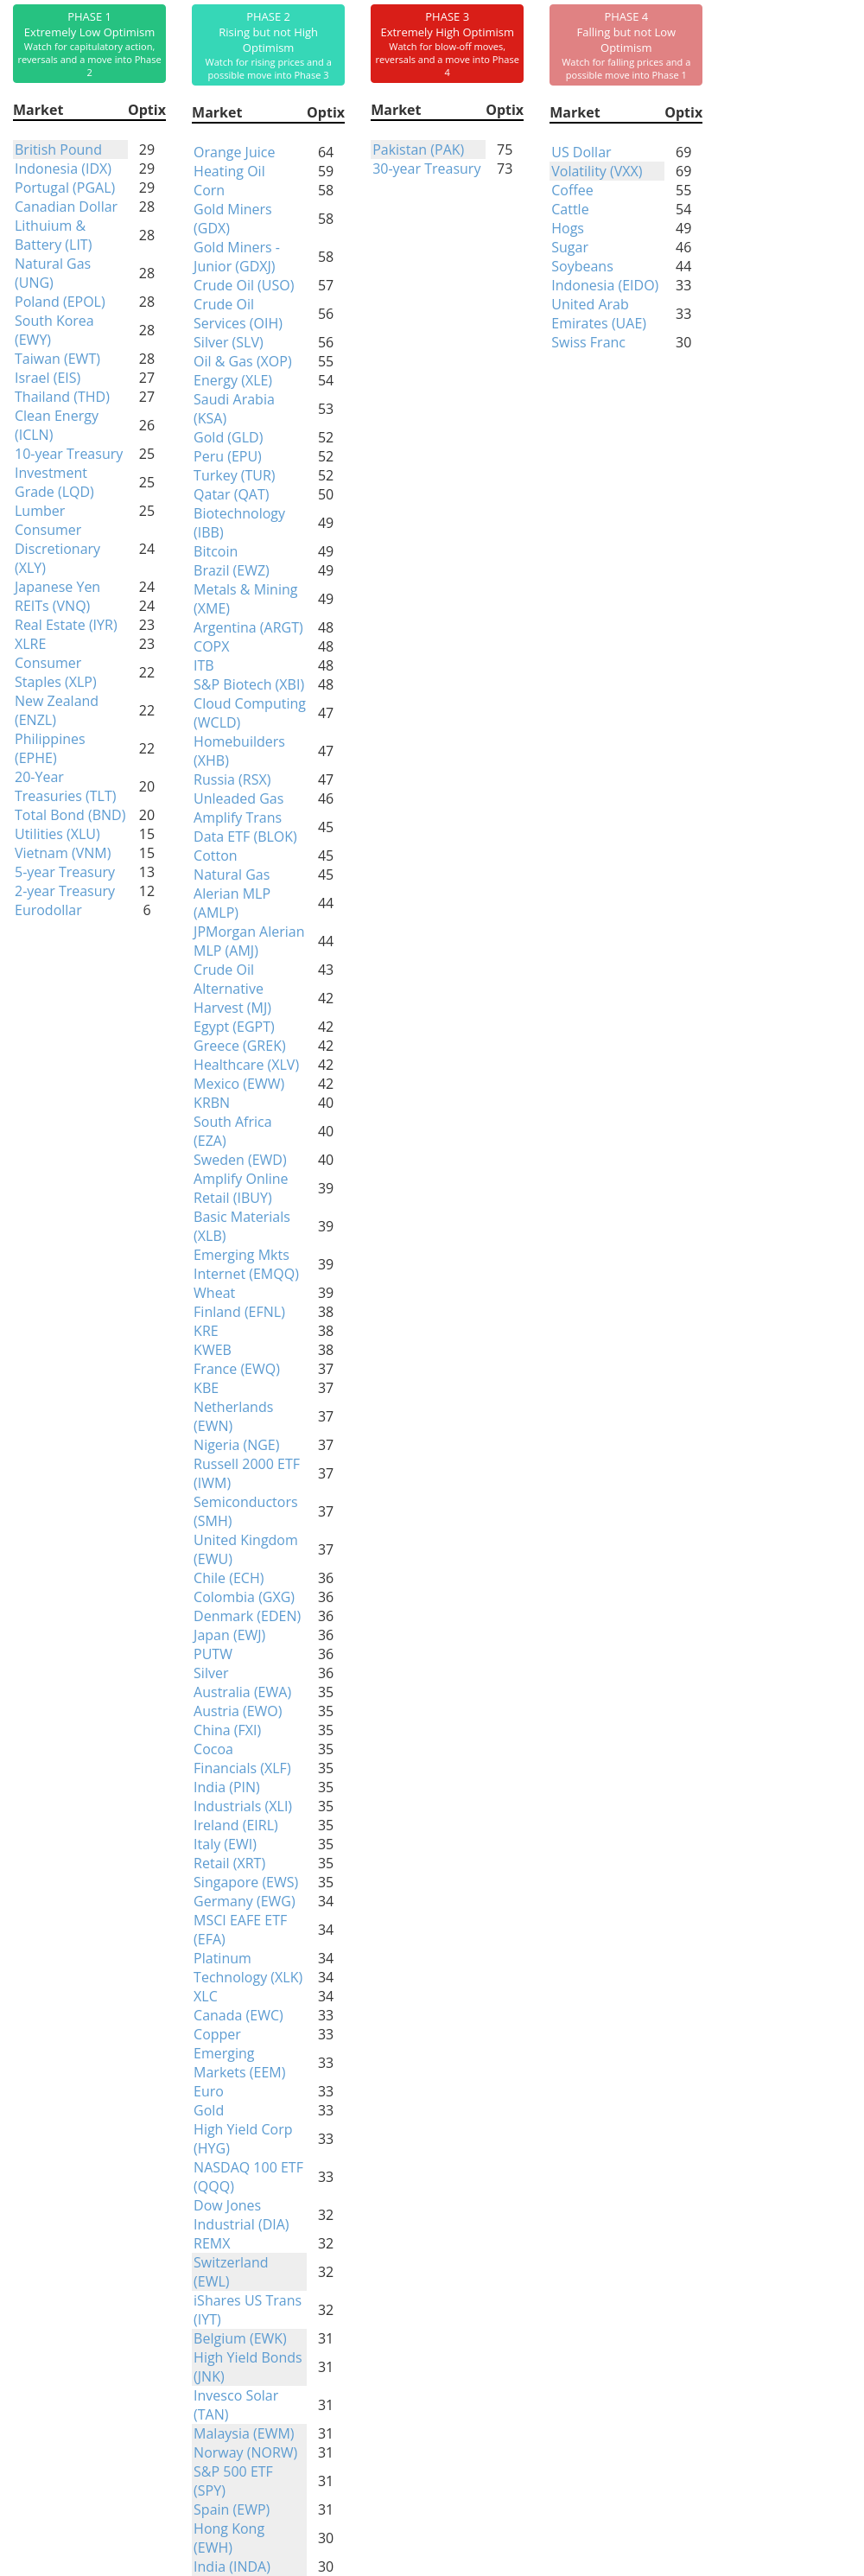
Phase Table
|
|
|
Ranks
|
|
|
|
|
|
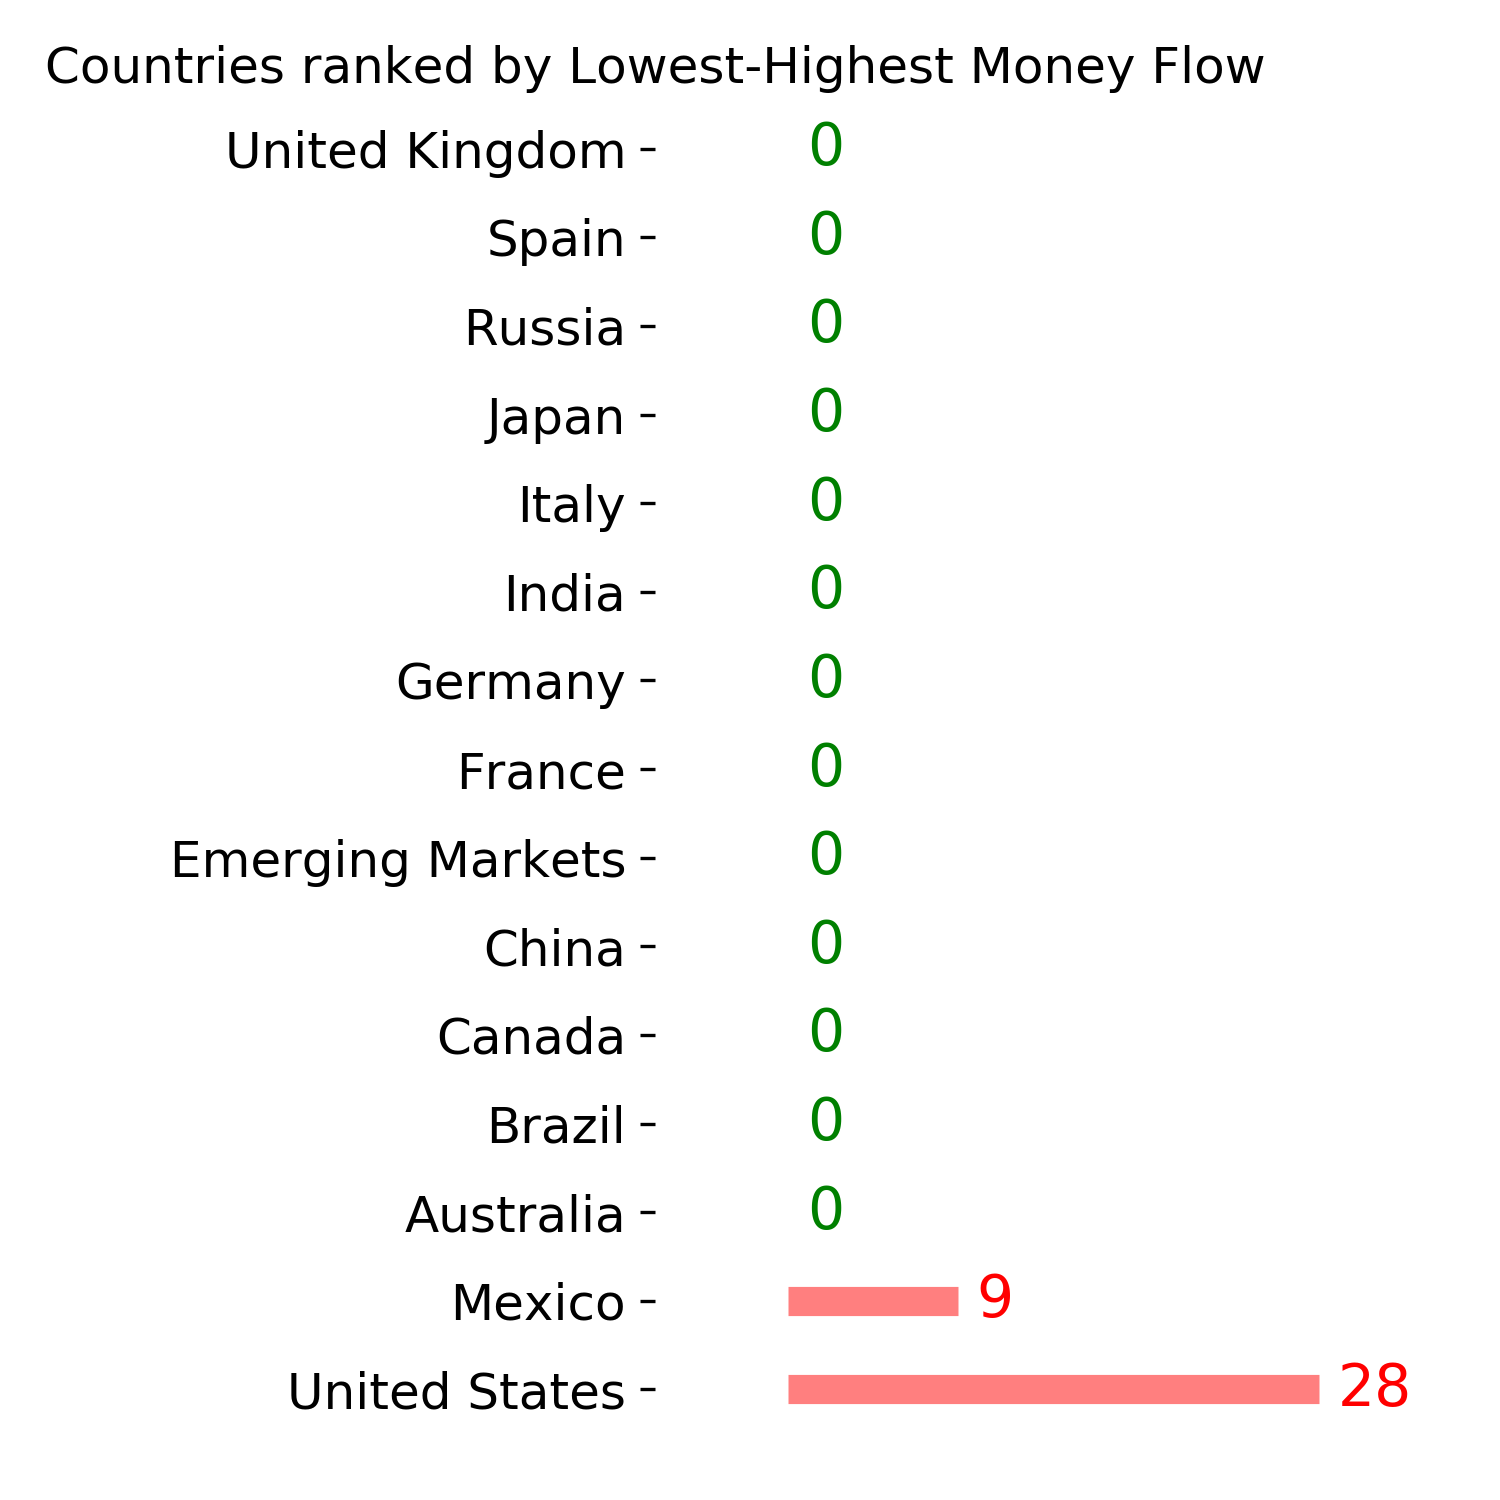
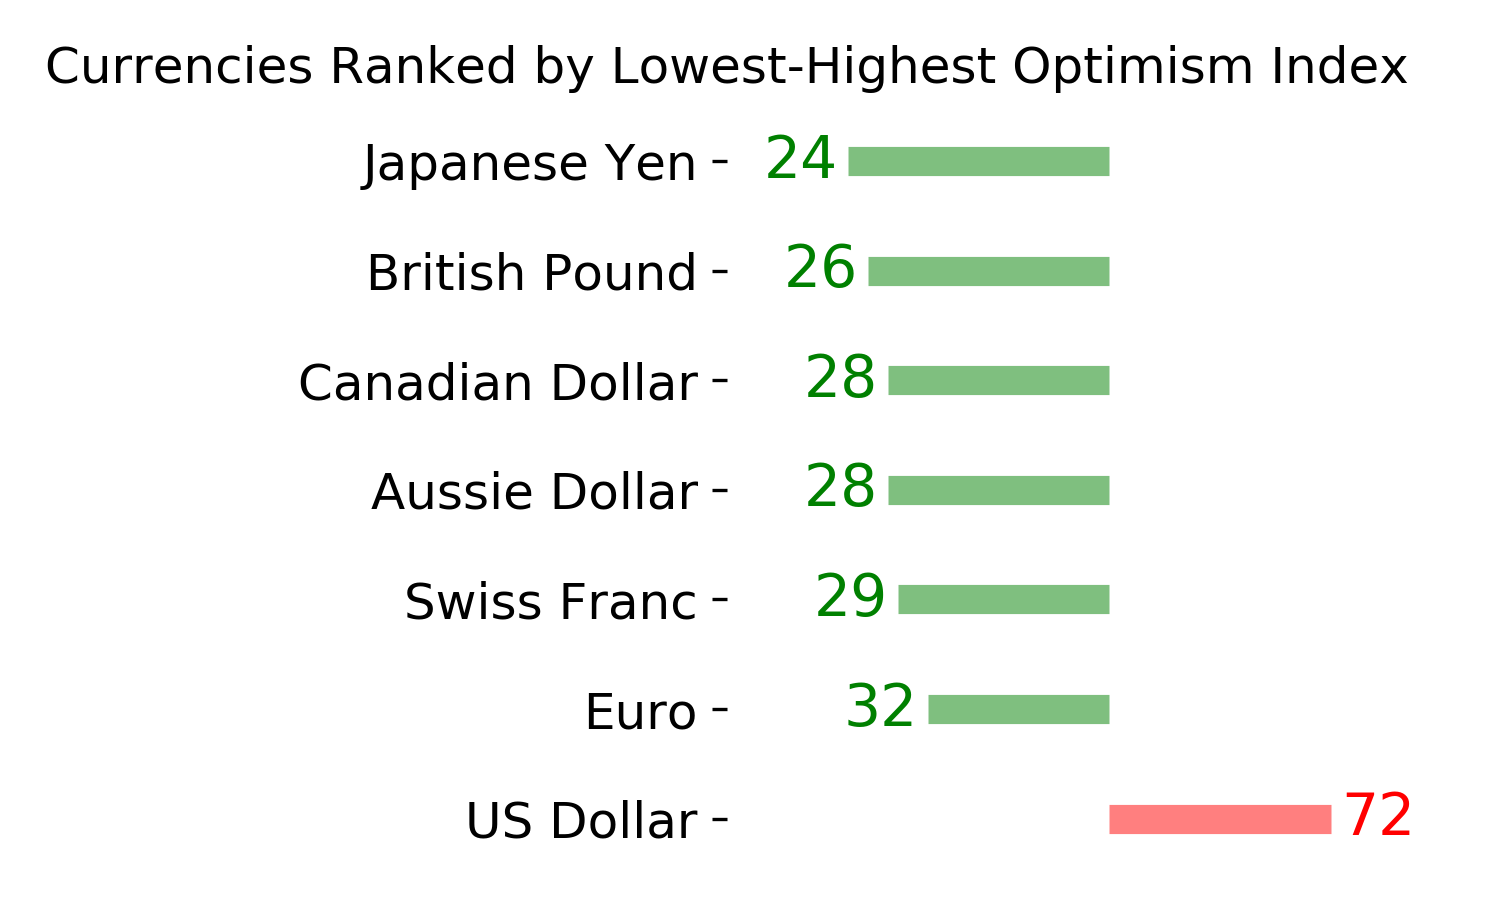
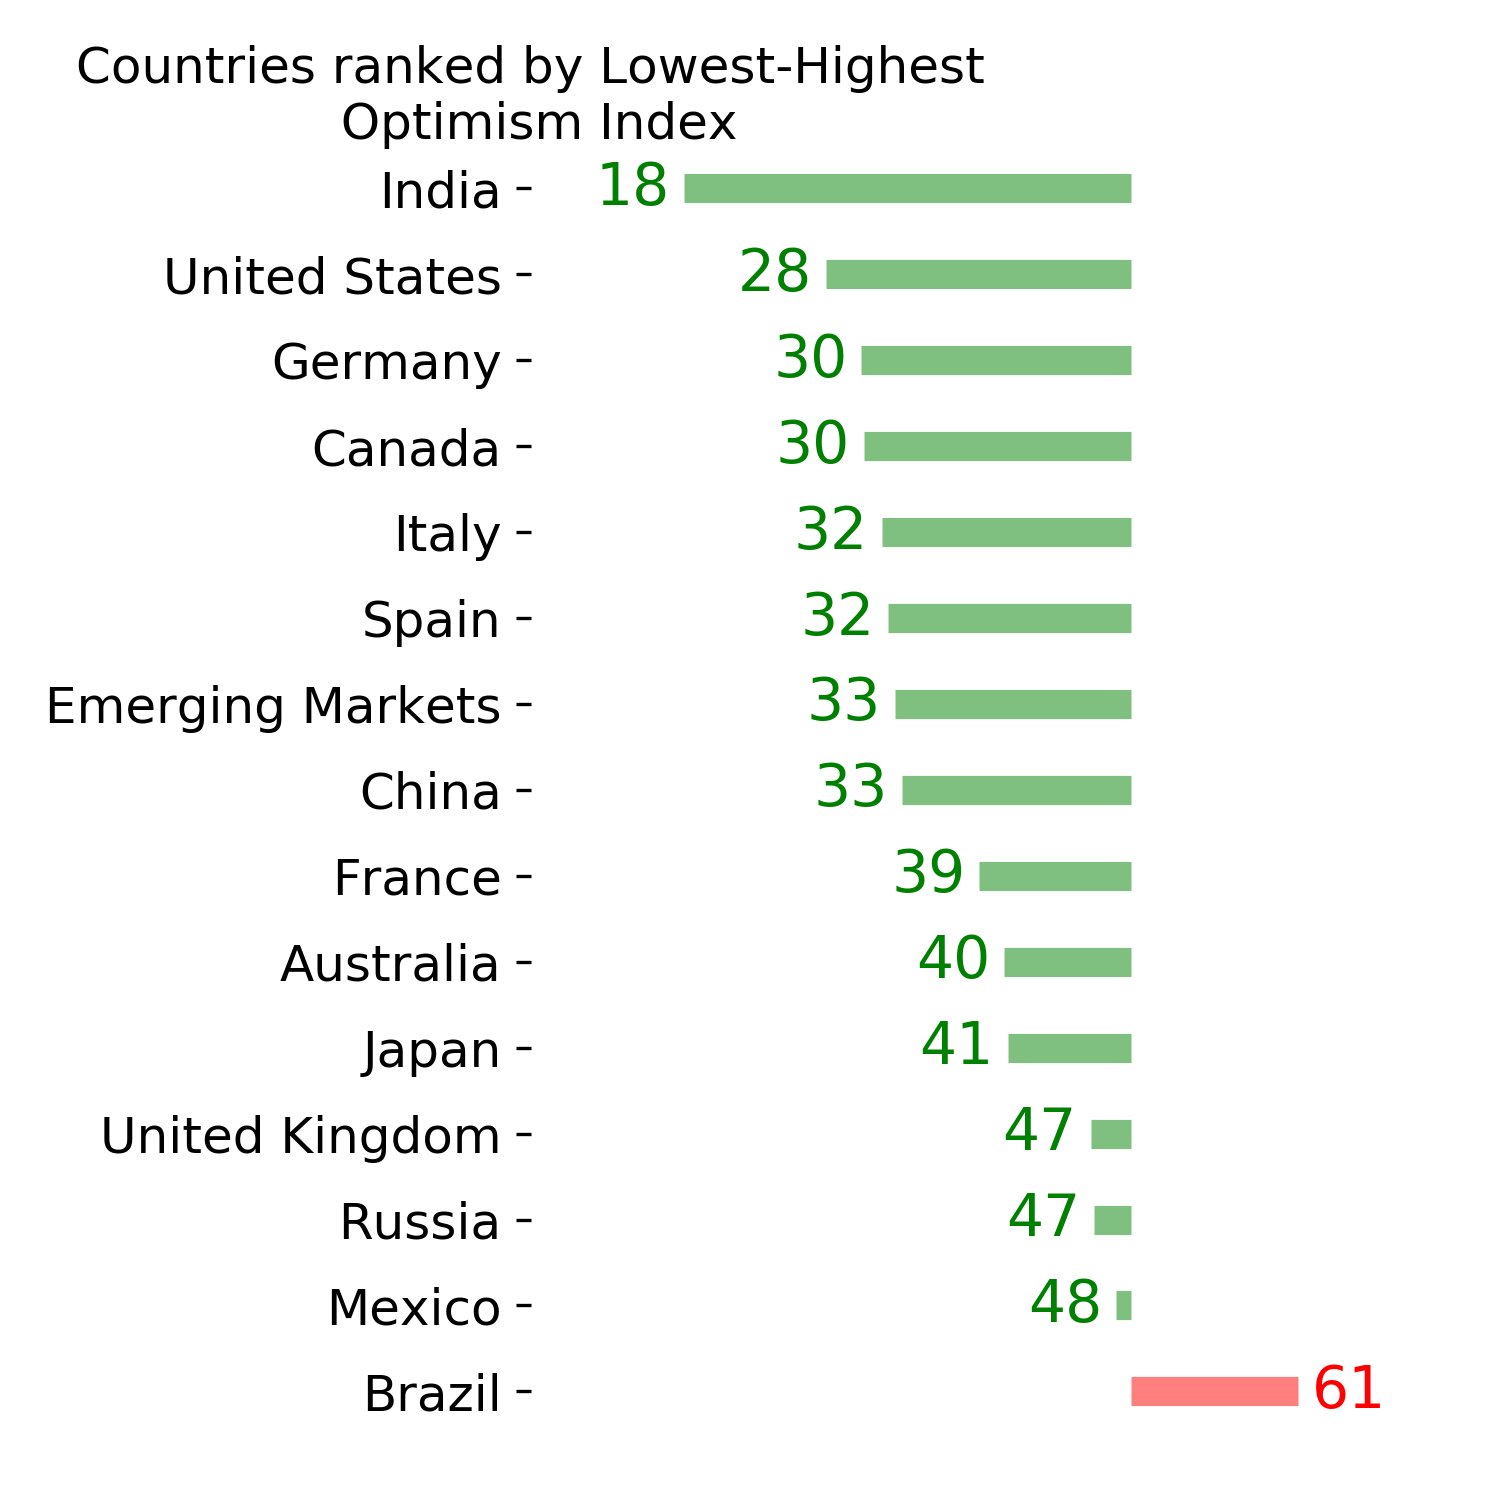
Sentiment Around The World
|
|
|
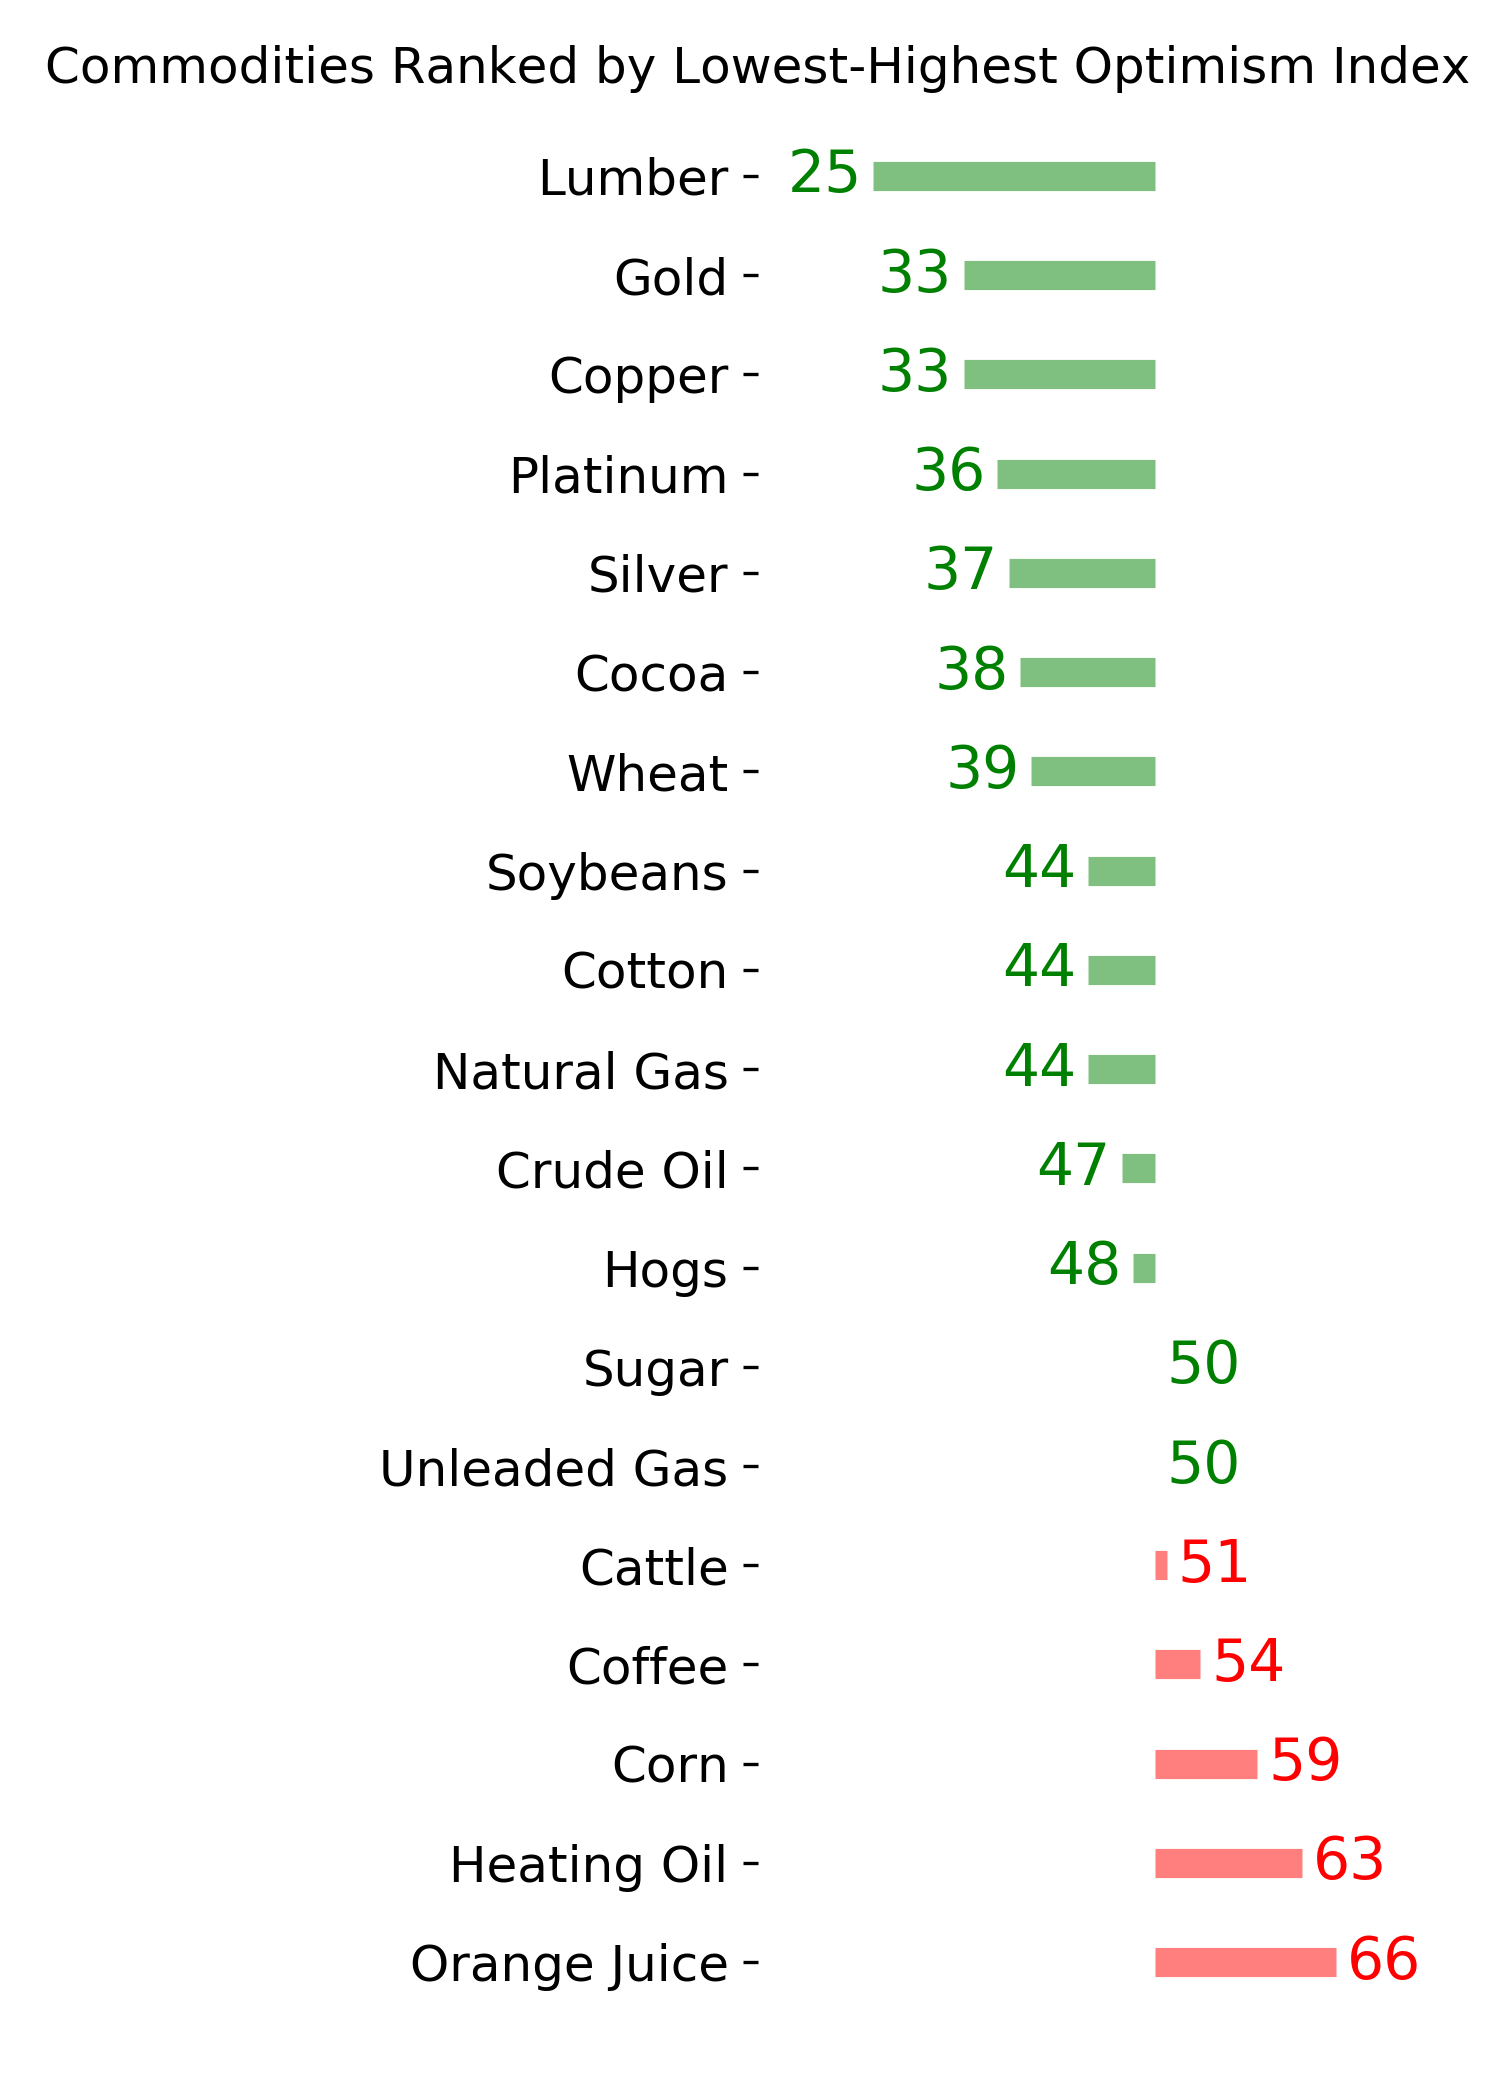
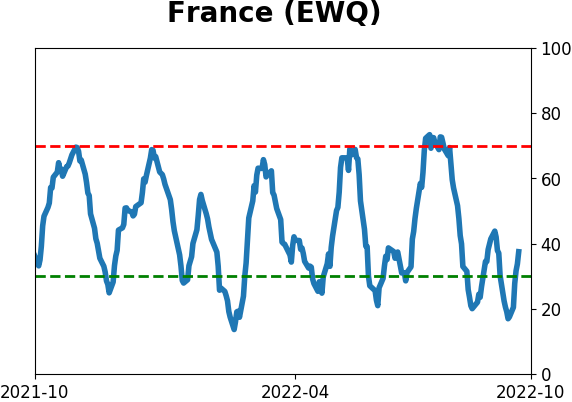
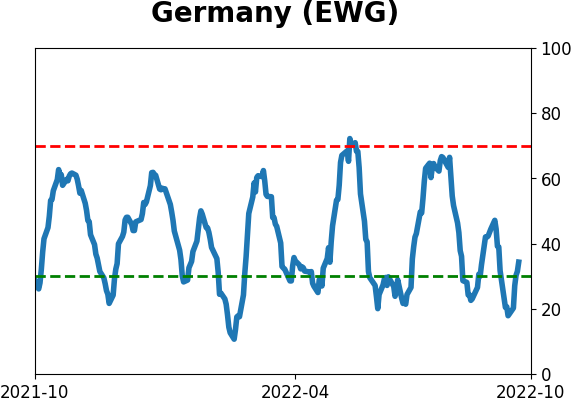
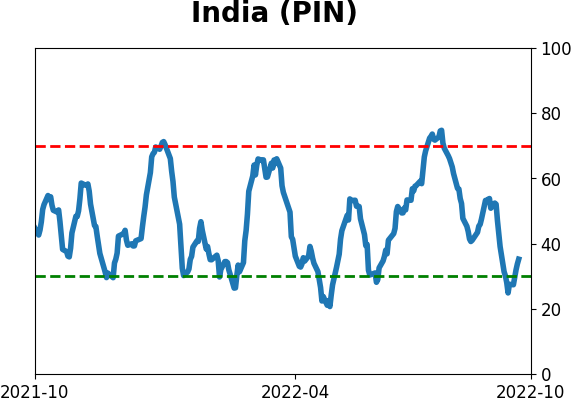
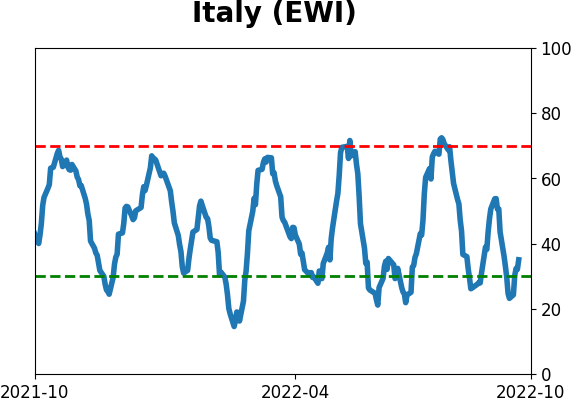
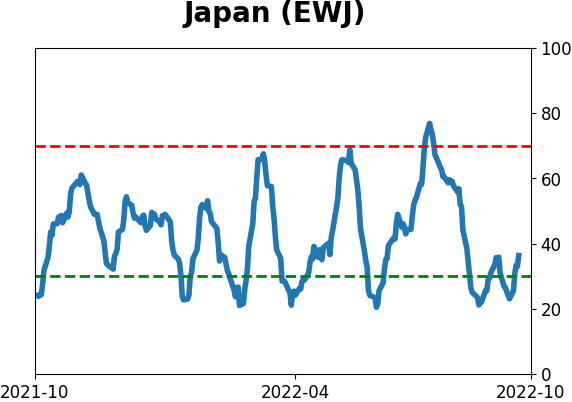
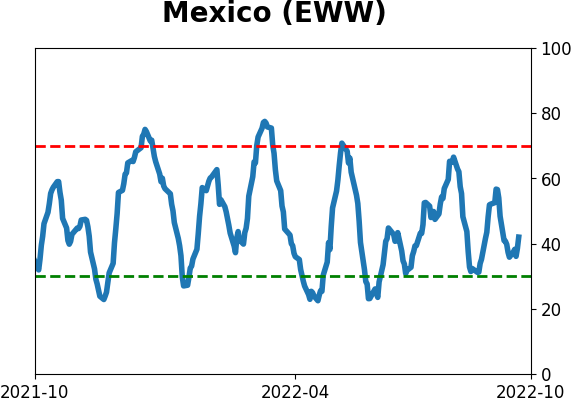
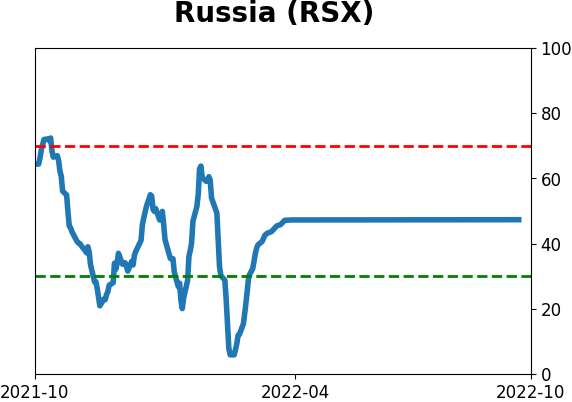
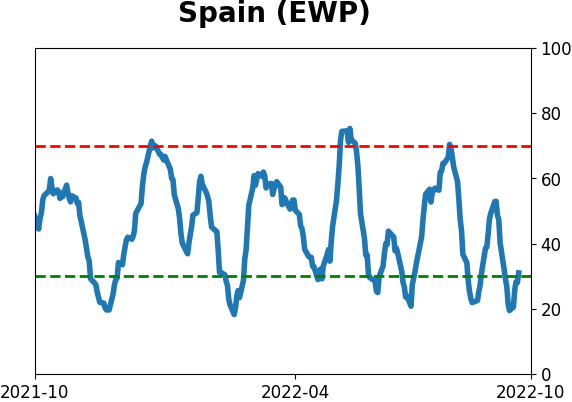
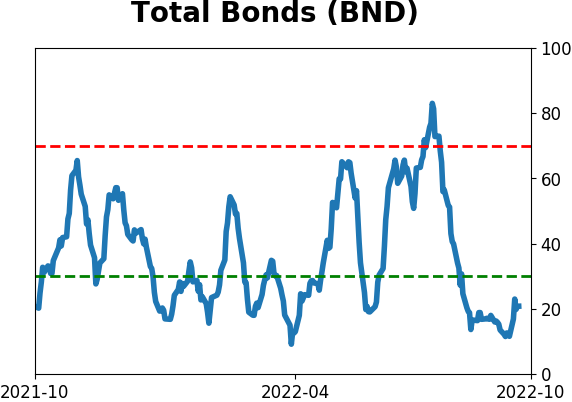
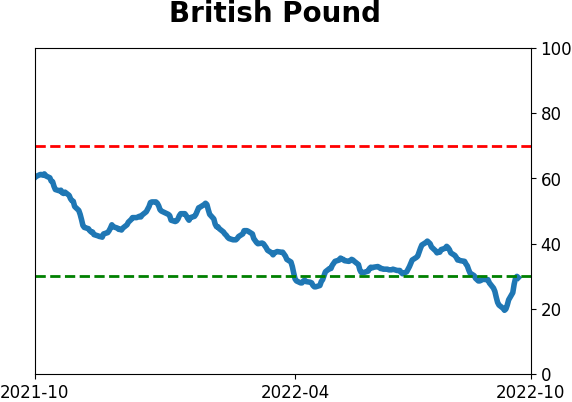
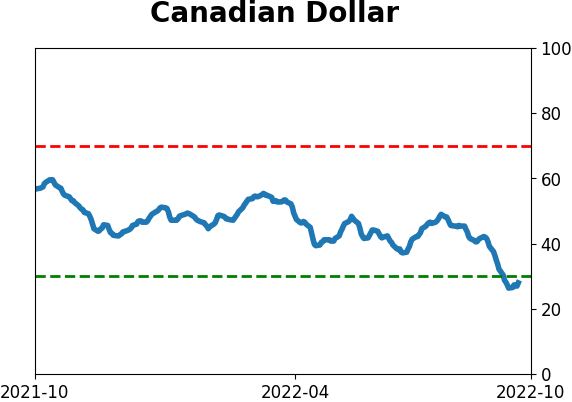
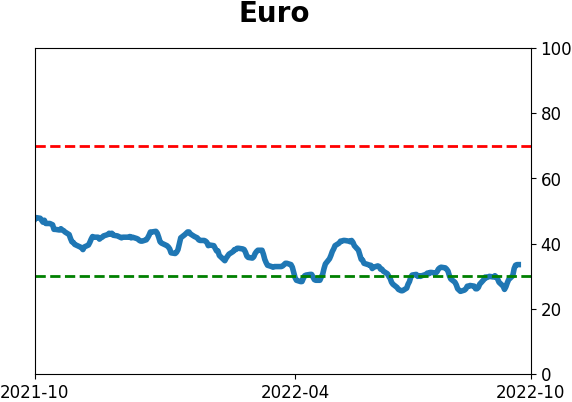
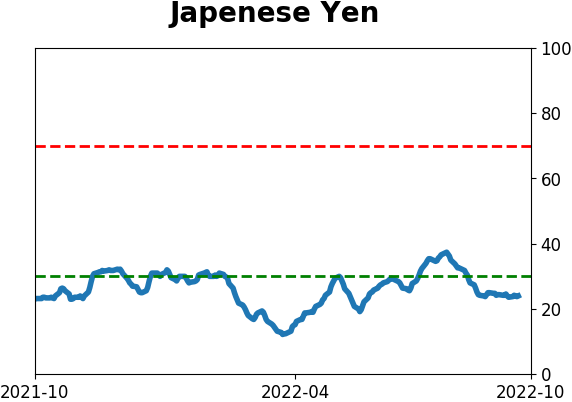
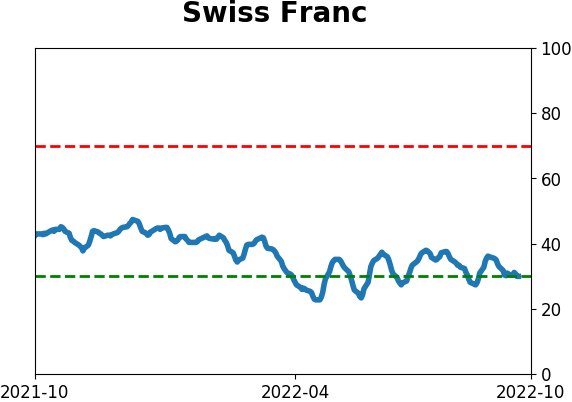
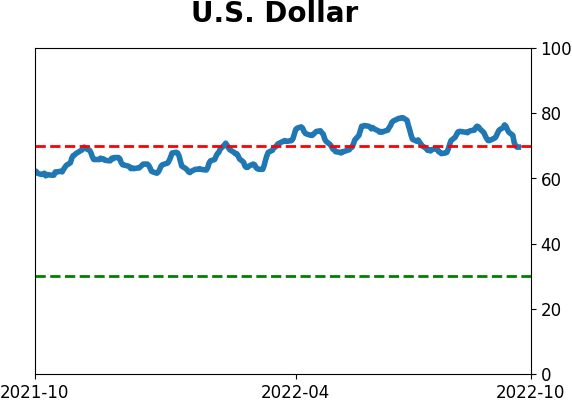
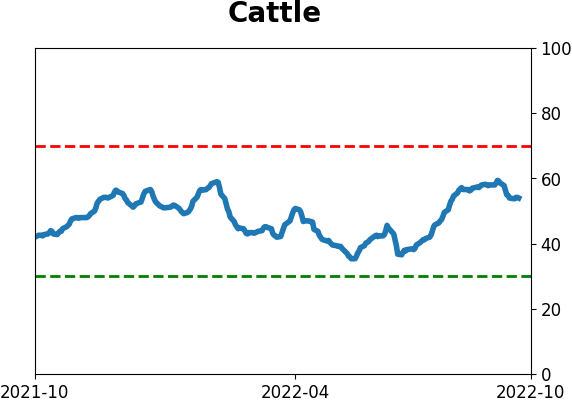
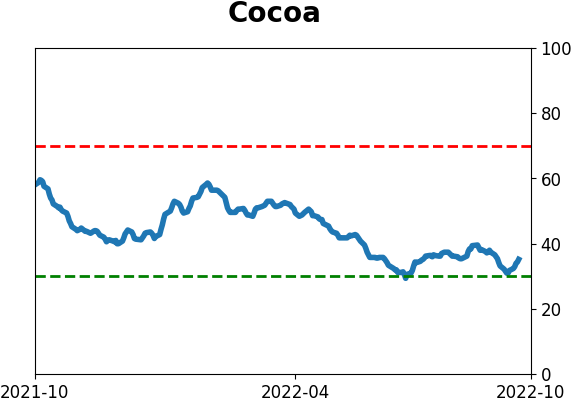
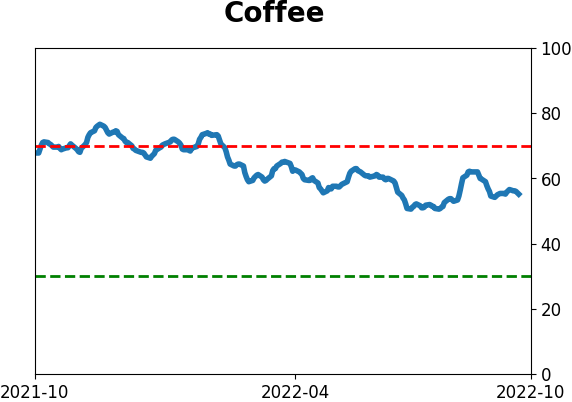
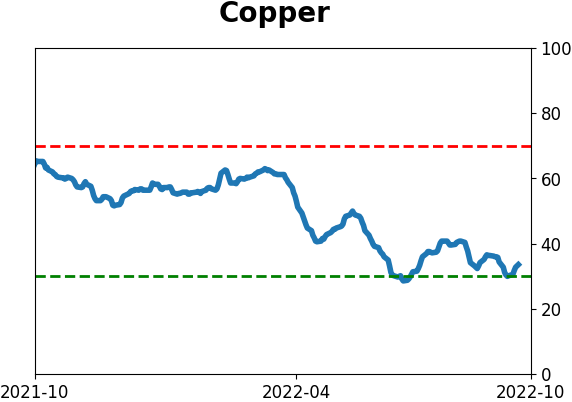
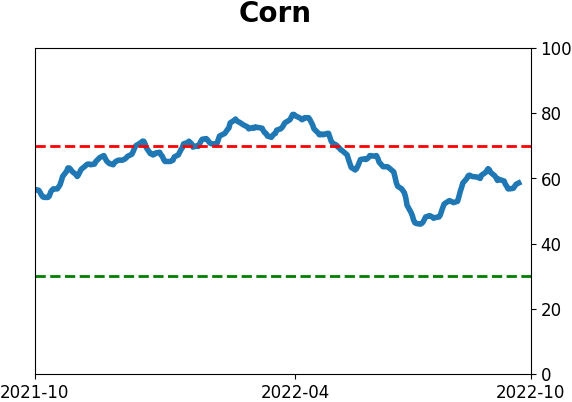
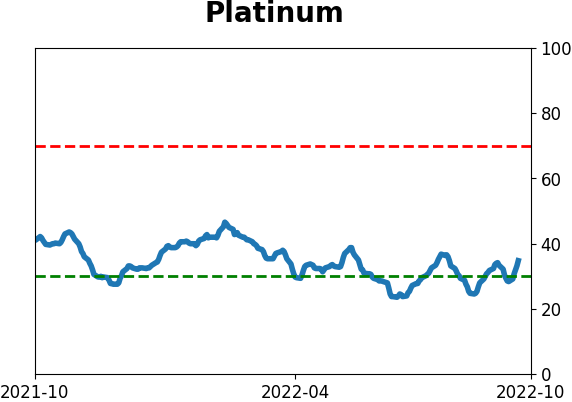
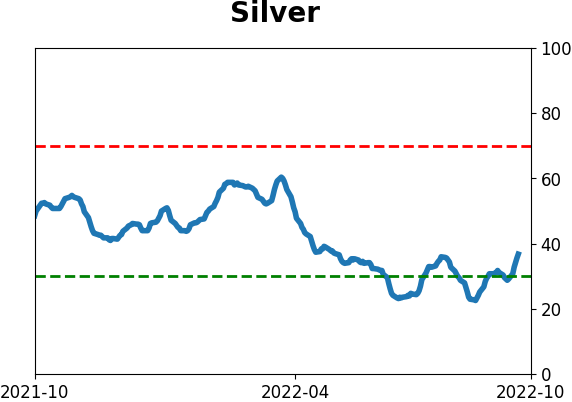
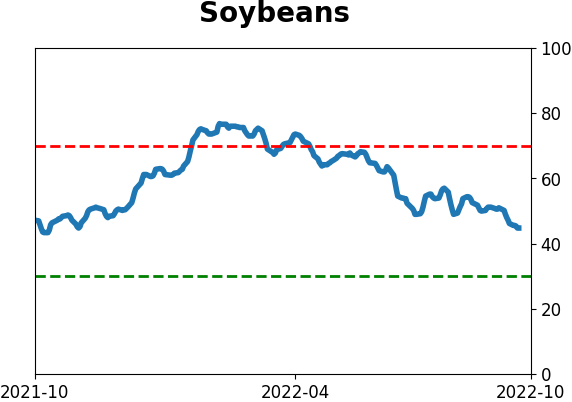
Optimism Index Thumbnails
|
|
|
|
|
|
|

|
|
|
|
|
|
|
|
|
|
|
|
|
|