Daily Report : Chasing Rumble's (RUM) Breakout? Here's What the Historical Data Shows

| View/Print a PDF version of this Report |
Headlines
|
Chasing Rumble's (RUM) Breakout? Here's What the Historical Data Shows: Rumble (RUM) gapped up 11.23%, but is it a buy? A historical backtest of this pattern reveals extreme volatility. Data shows a brief two-day rally is typically followed by negative weekly returns and a high long-term drawdown risk. See the objective analysis. |
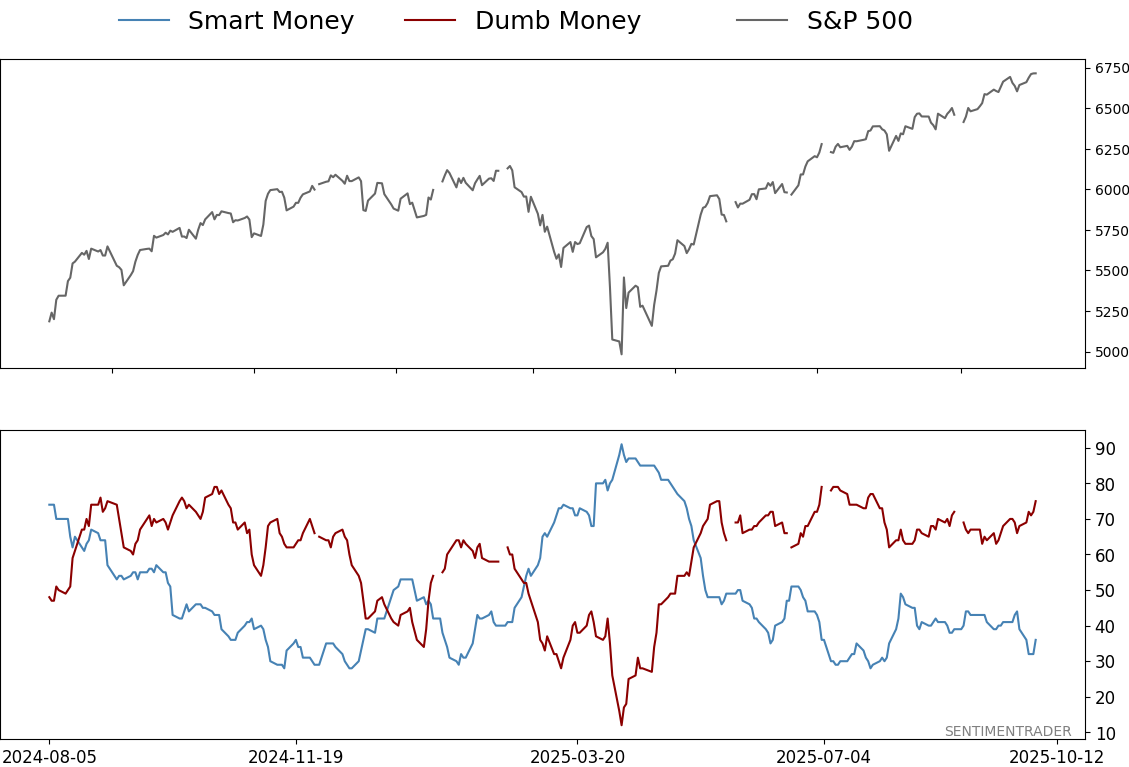
Smart / Dumb Money Confidence
|
|
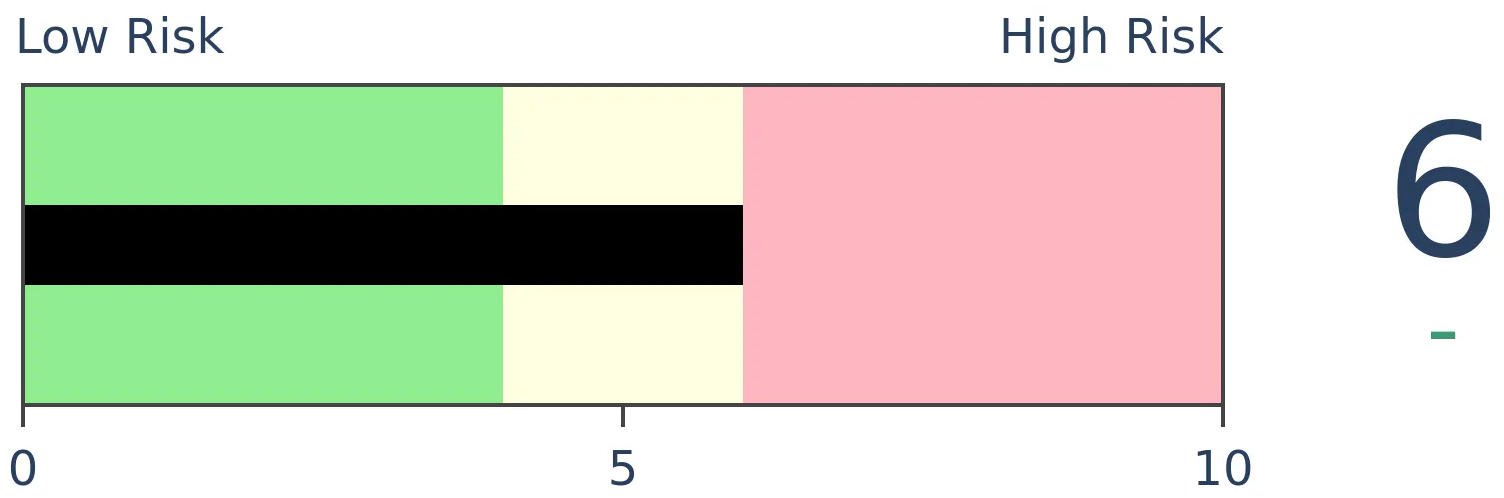
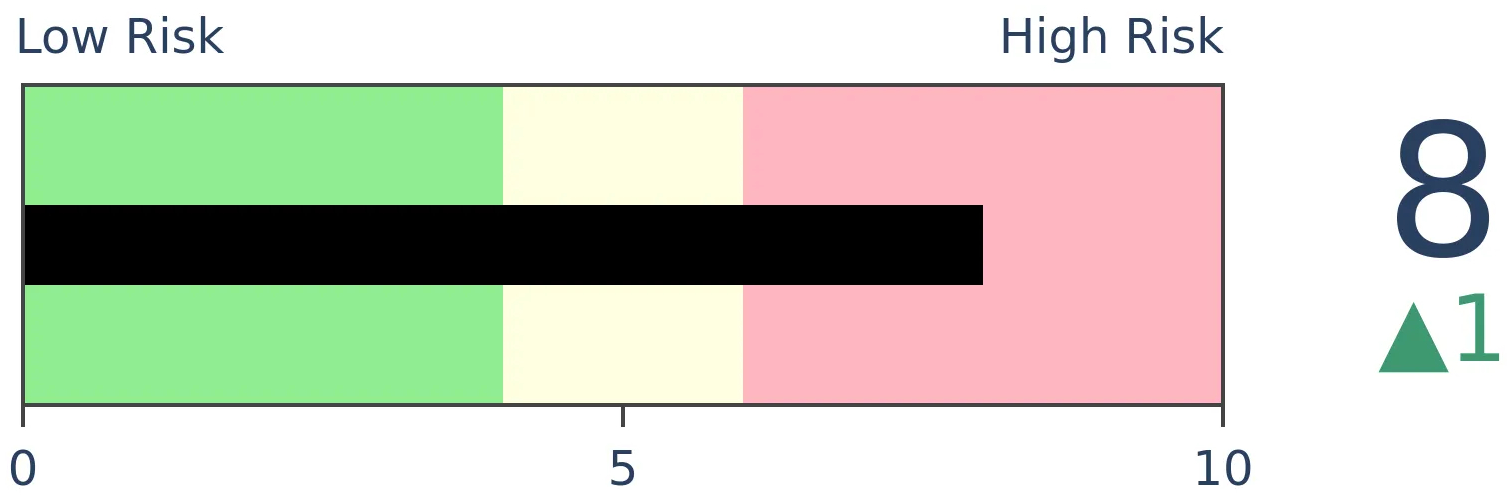
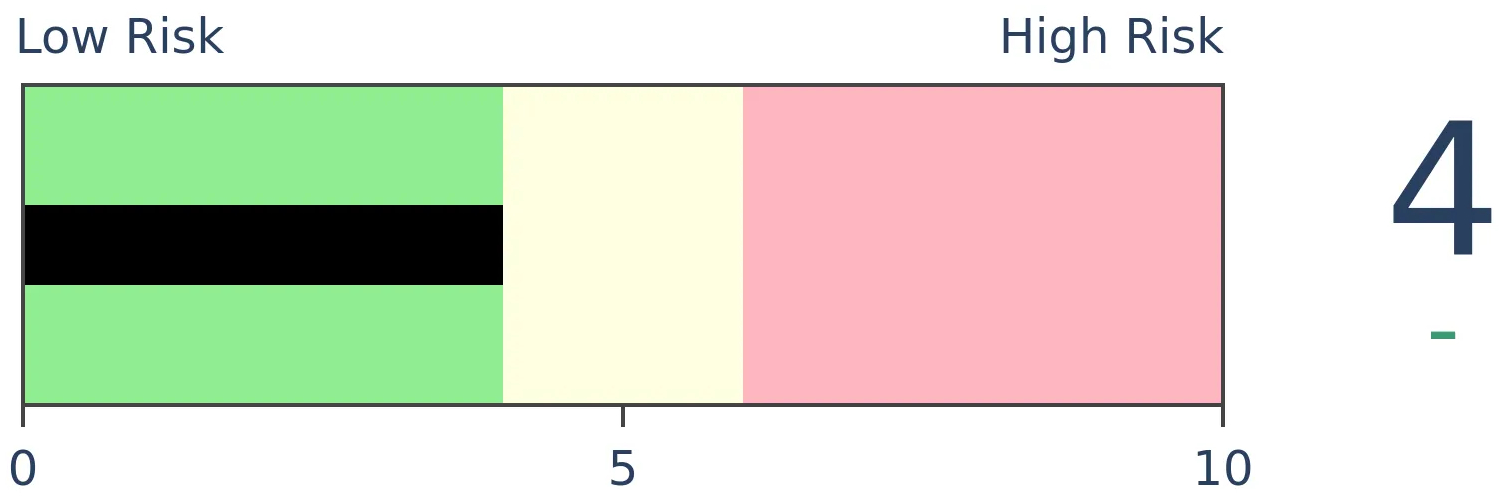
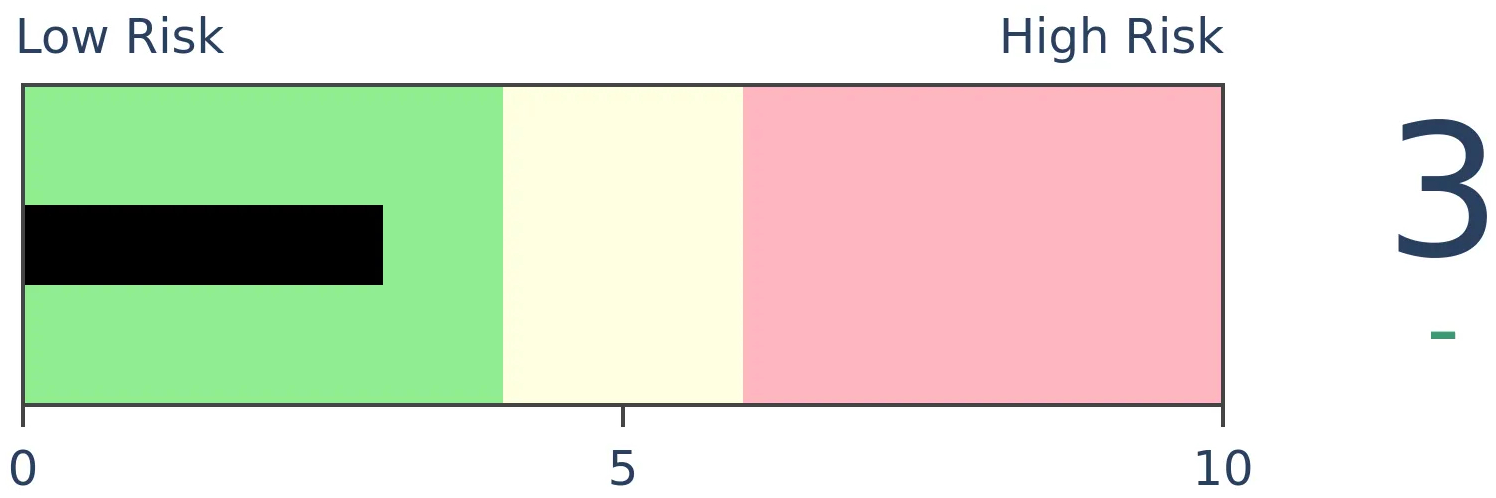
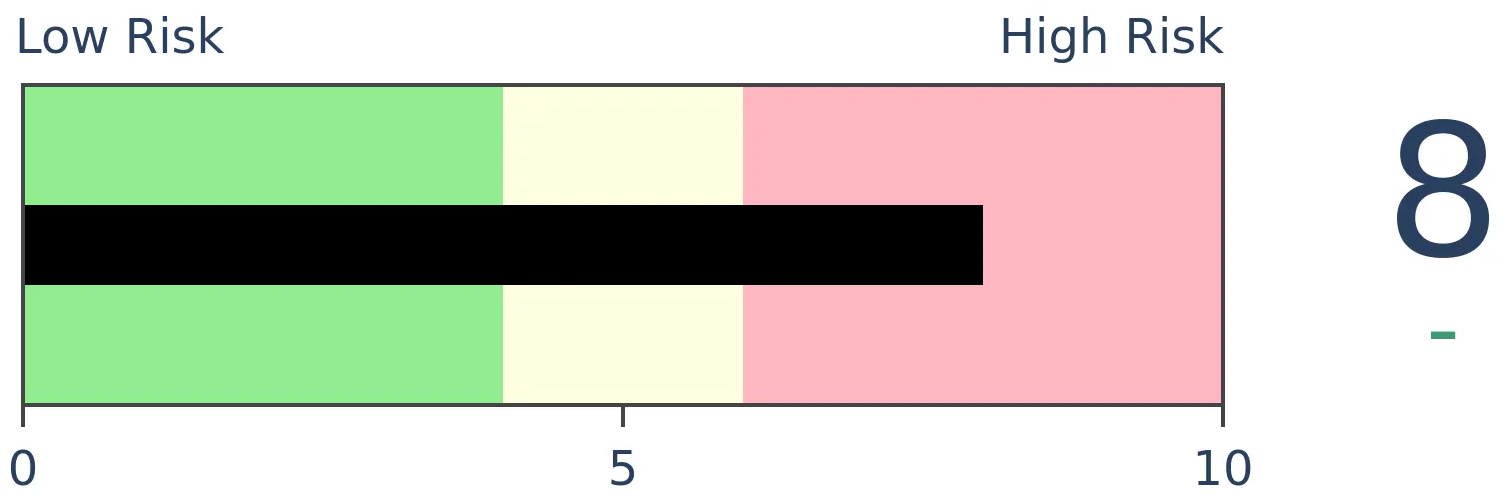
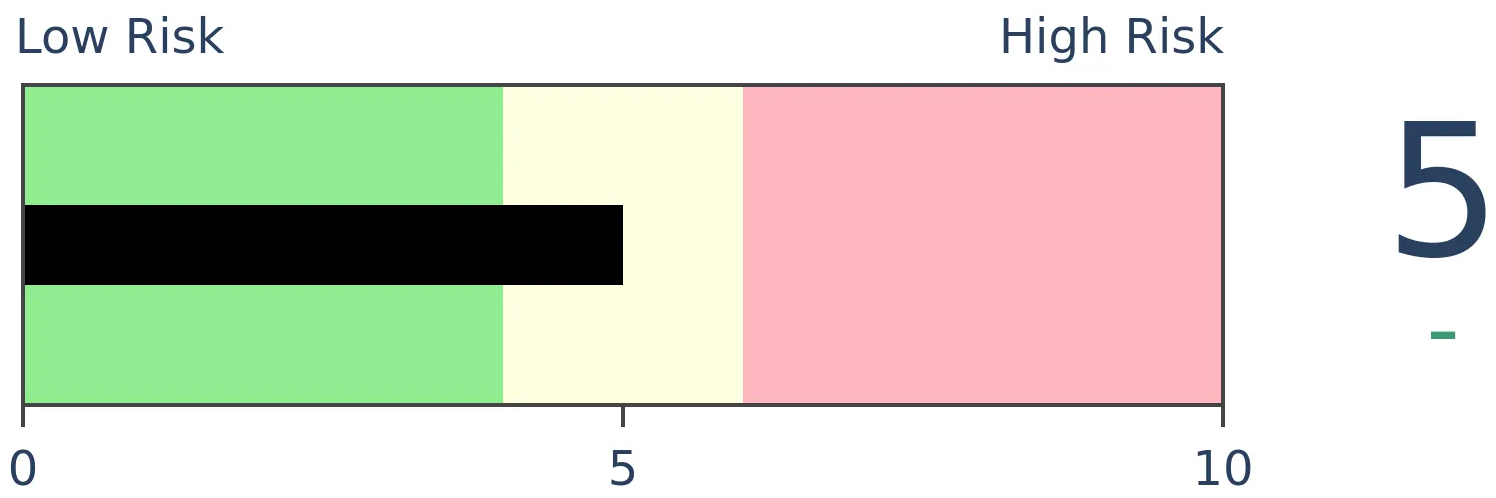
Risk Levels
|
|
|
Research
Chasing Rumble's (RUM) Breakout? Here's What the Historical Data ShowsBy by SentimentraderBOTTOM LINERumble (RUM) gapped up 11.23%, but is it a buy? A historical backtest of this pattern reveals extreme volatility. Data shows a brief two-day rally is typically followed by negative weekly returns and a high long-term drawdown risk. See the objective analysis. FORECAST / TIMEFRAME |
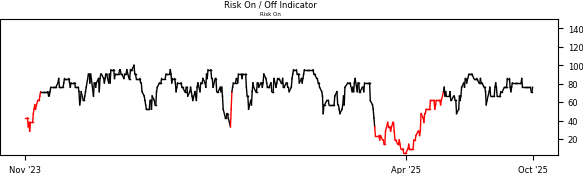
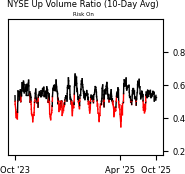
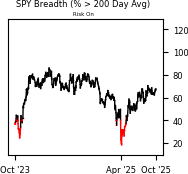
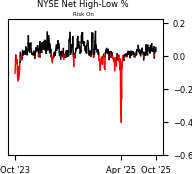
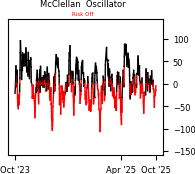
Sentiment Risk On / Risk Off Overview
| ||
|
|
|
|
|
|
|
|
|
|
|
|
Indicators at Extremes
|
|
|
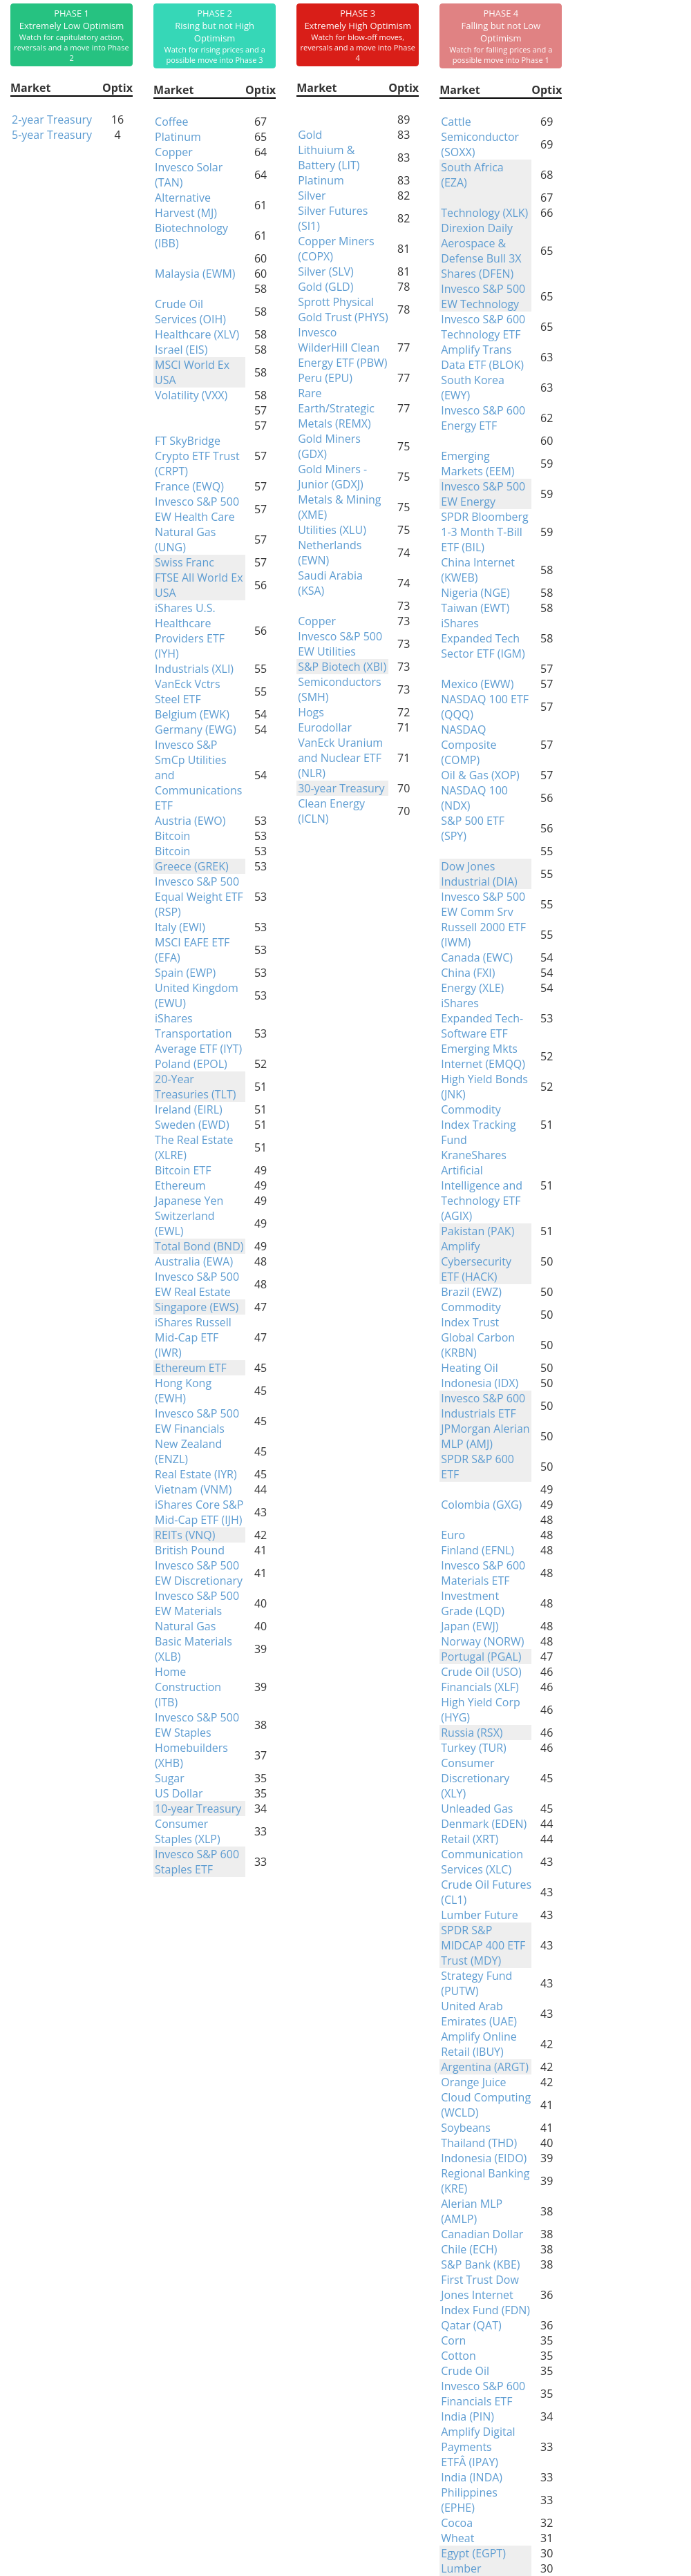
Phase Table
|
|
|
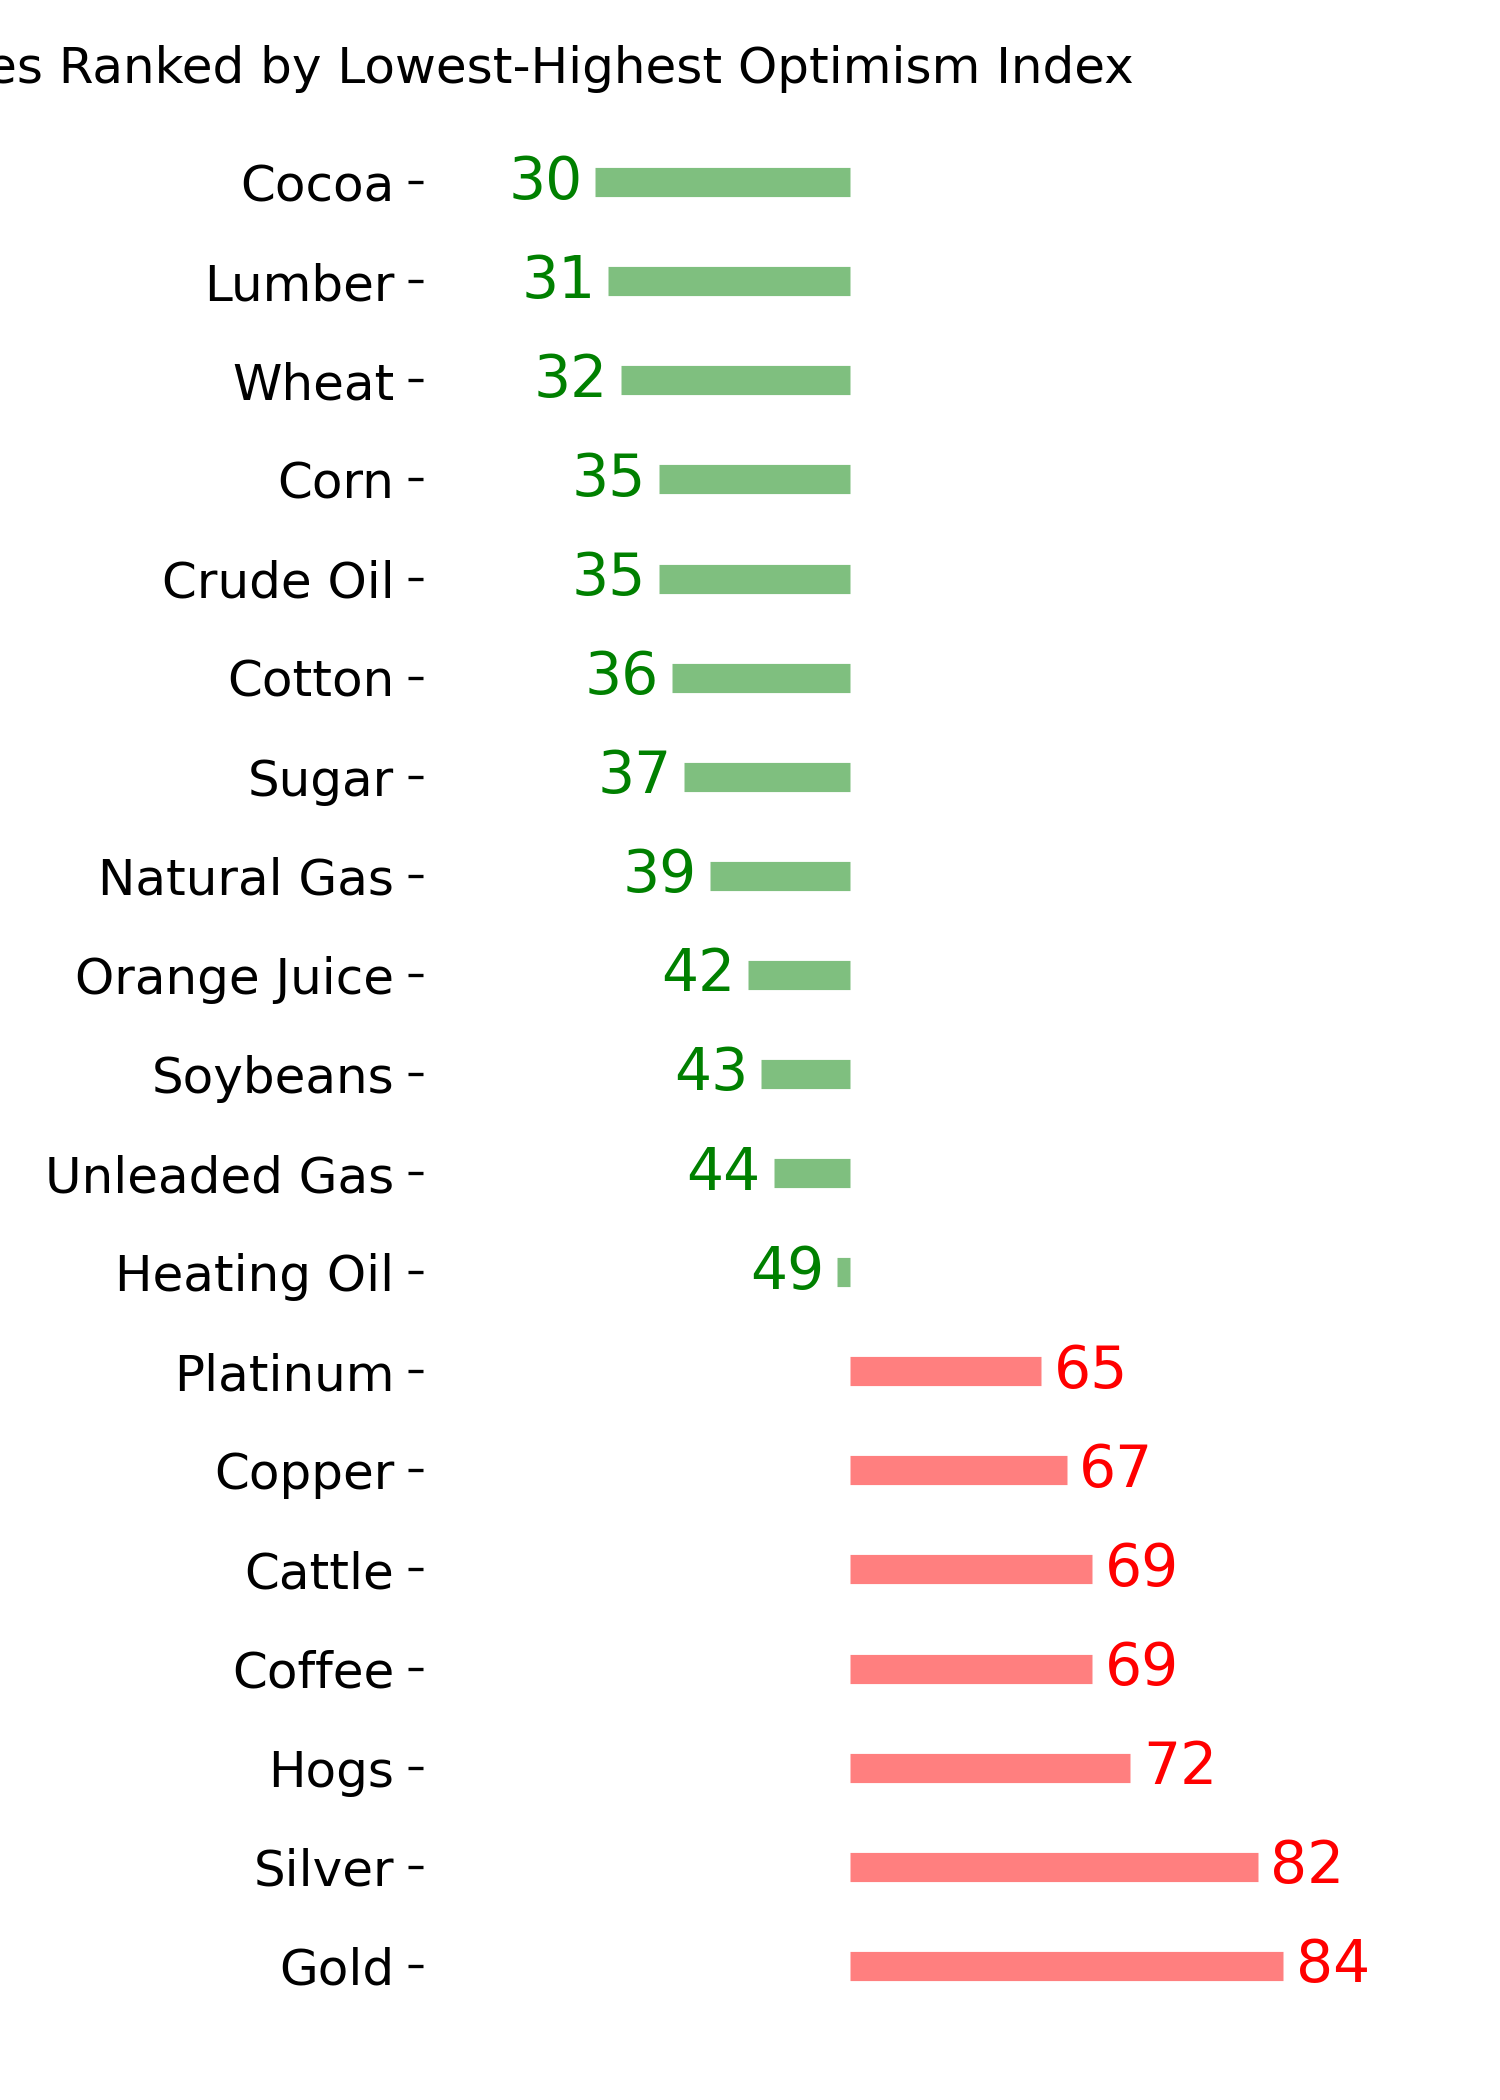
Ranks
|
|
|
|
|
|
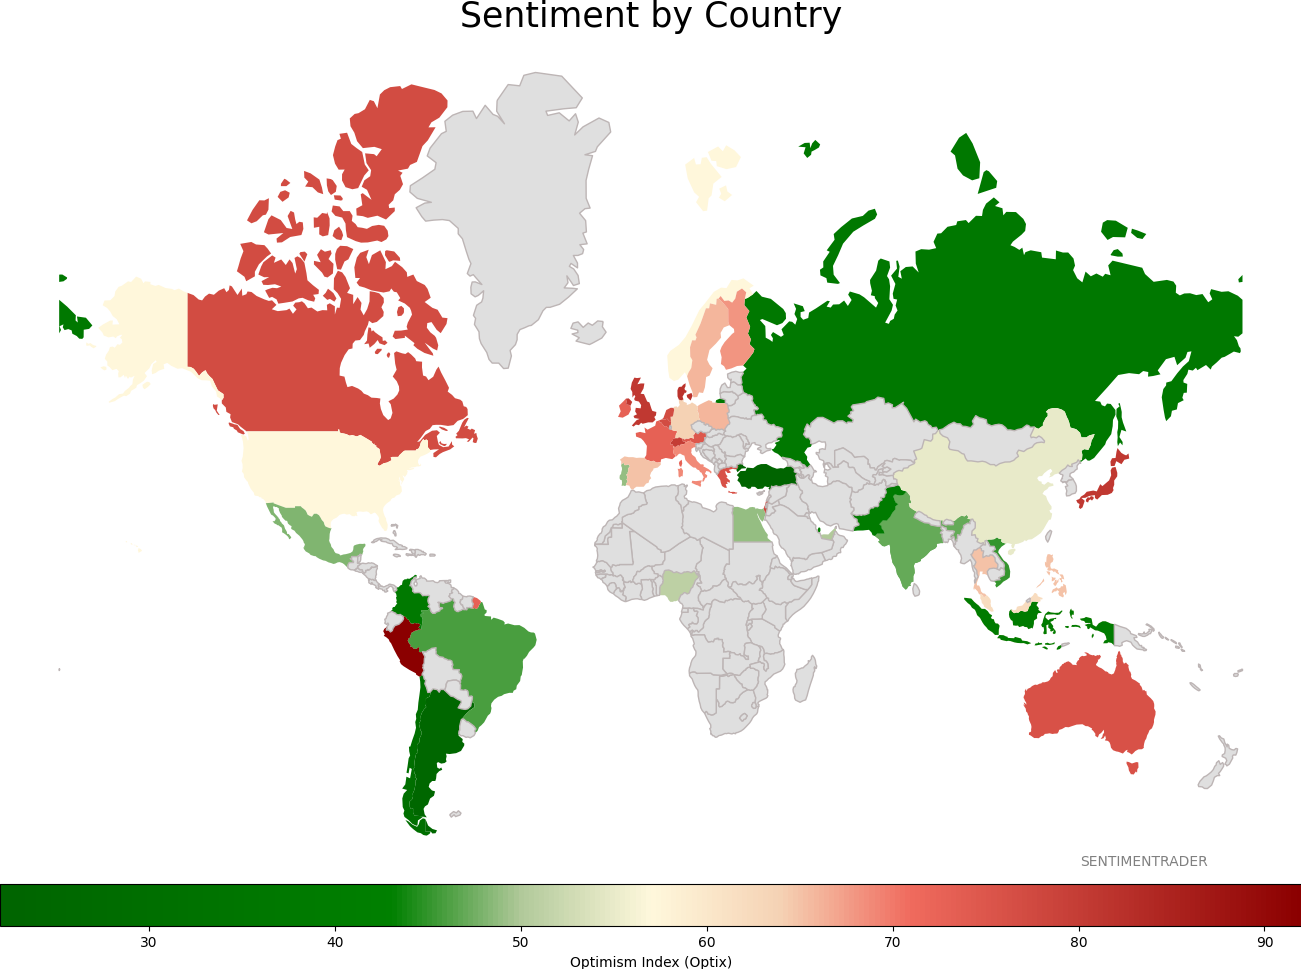
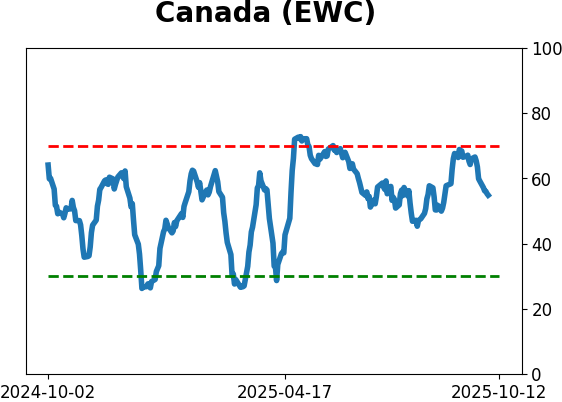
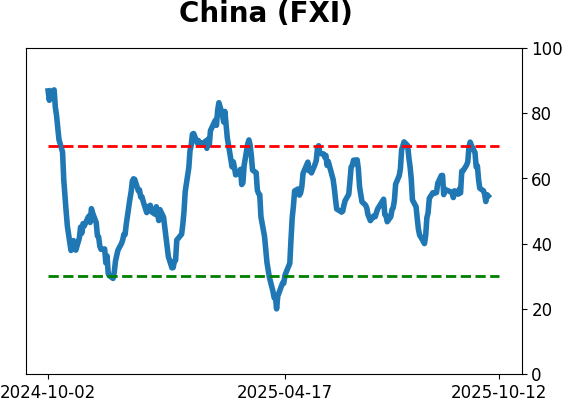
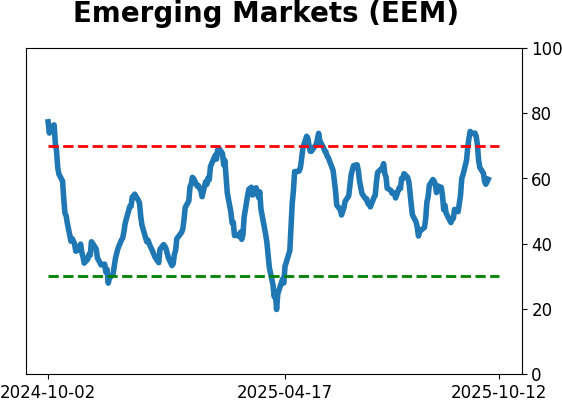
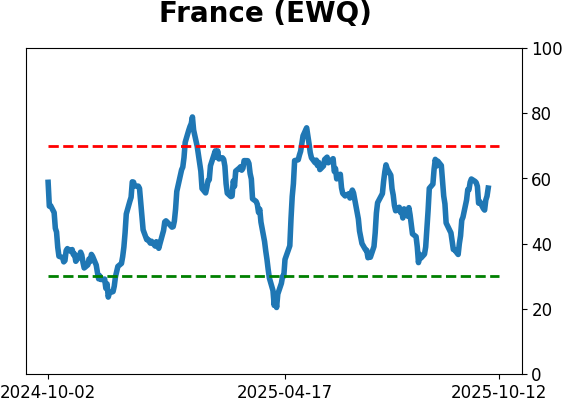
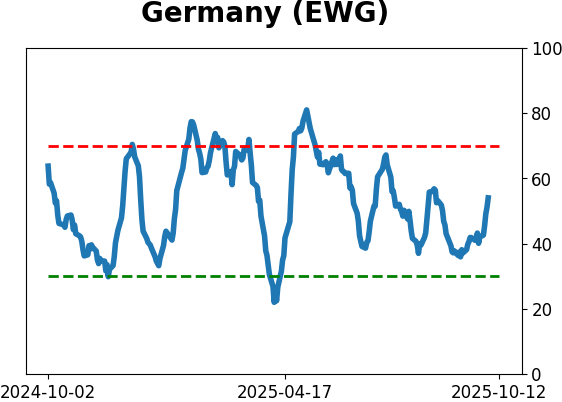
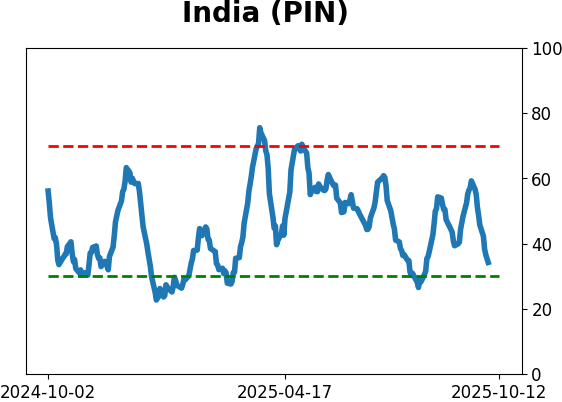
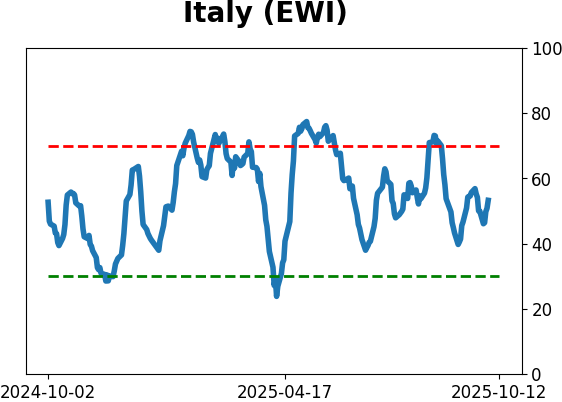
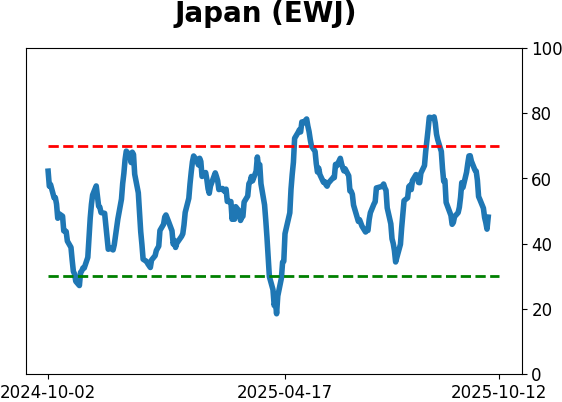
Sentiment Around The World
|
|
|
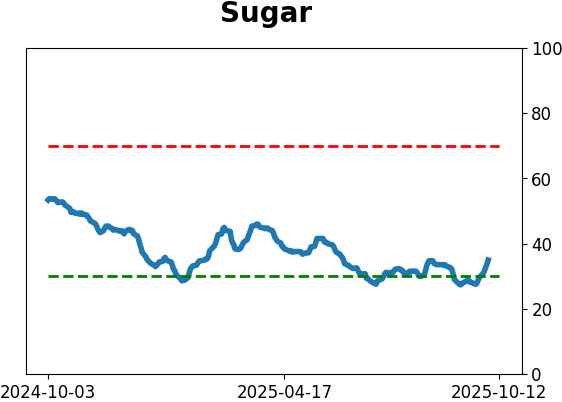
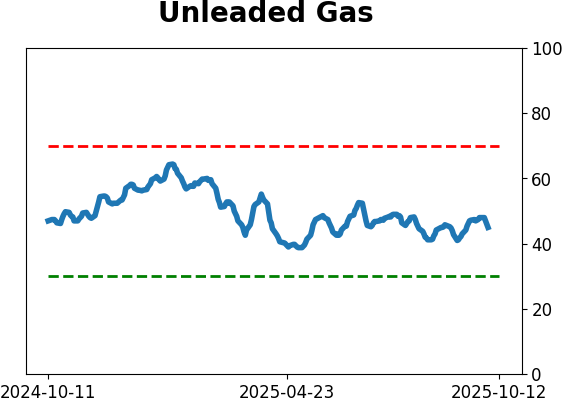
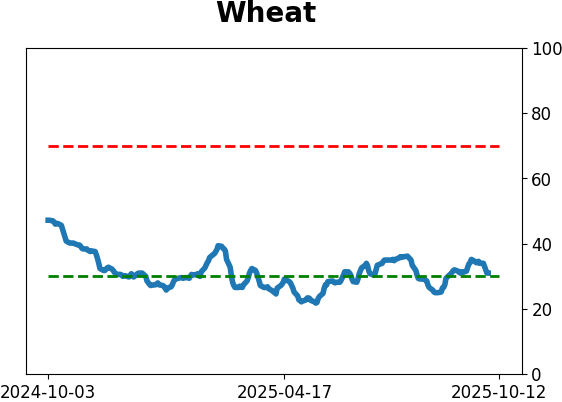
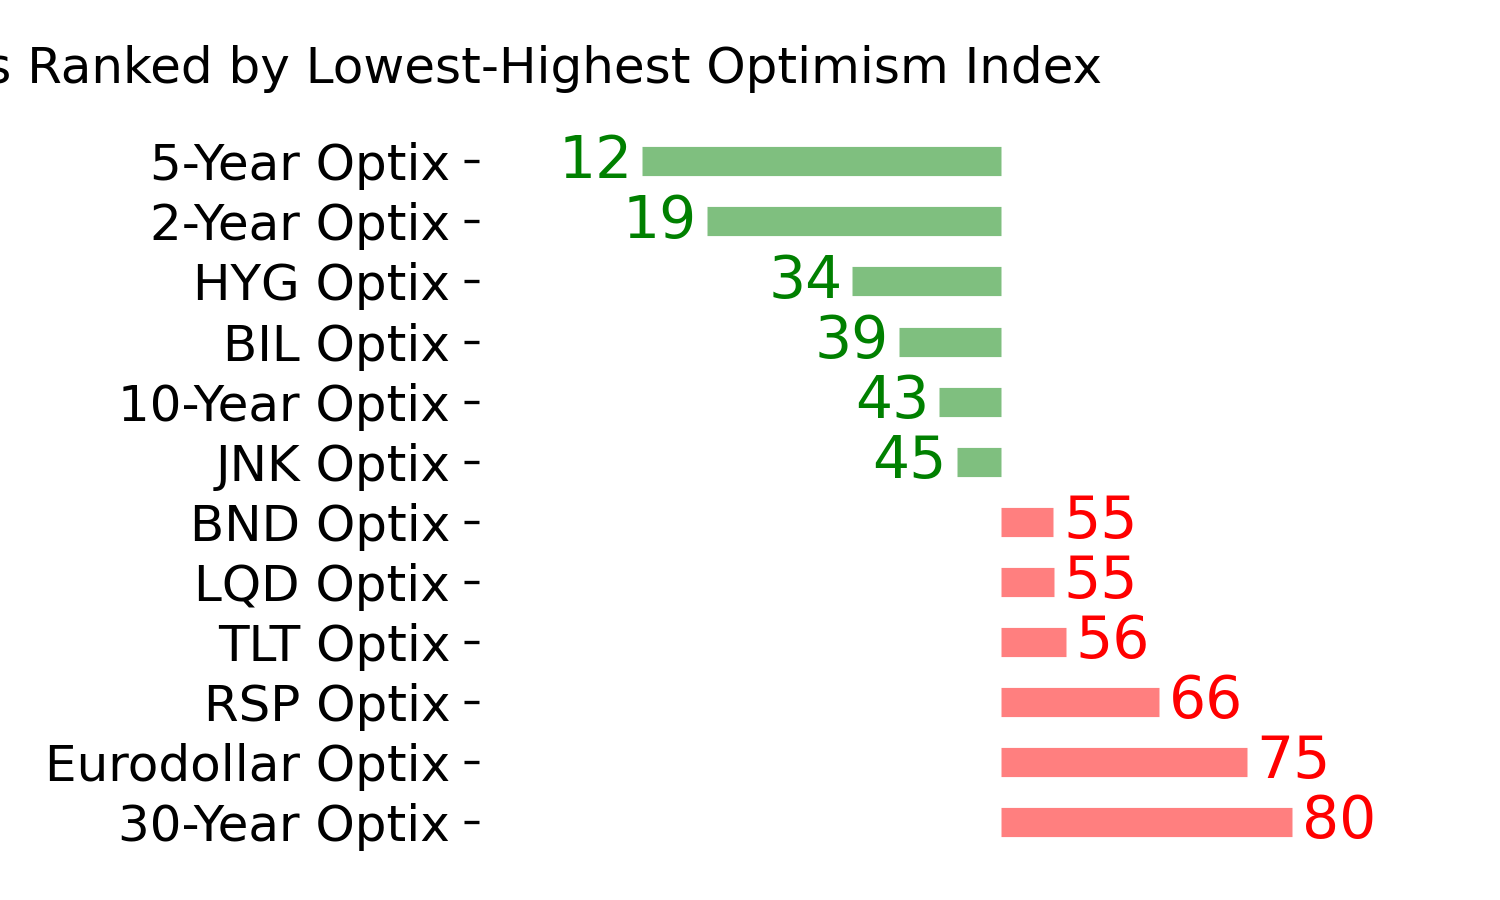
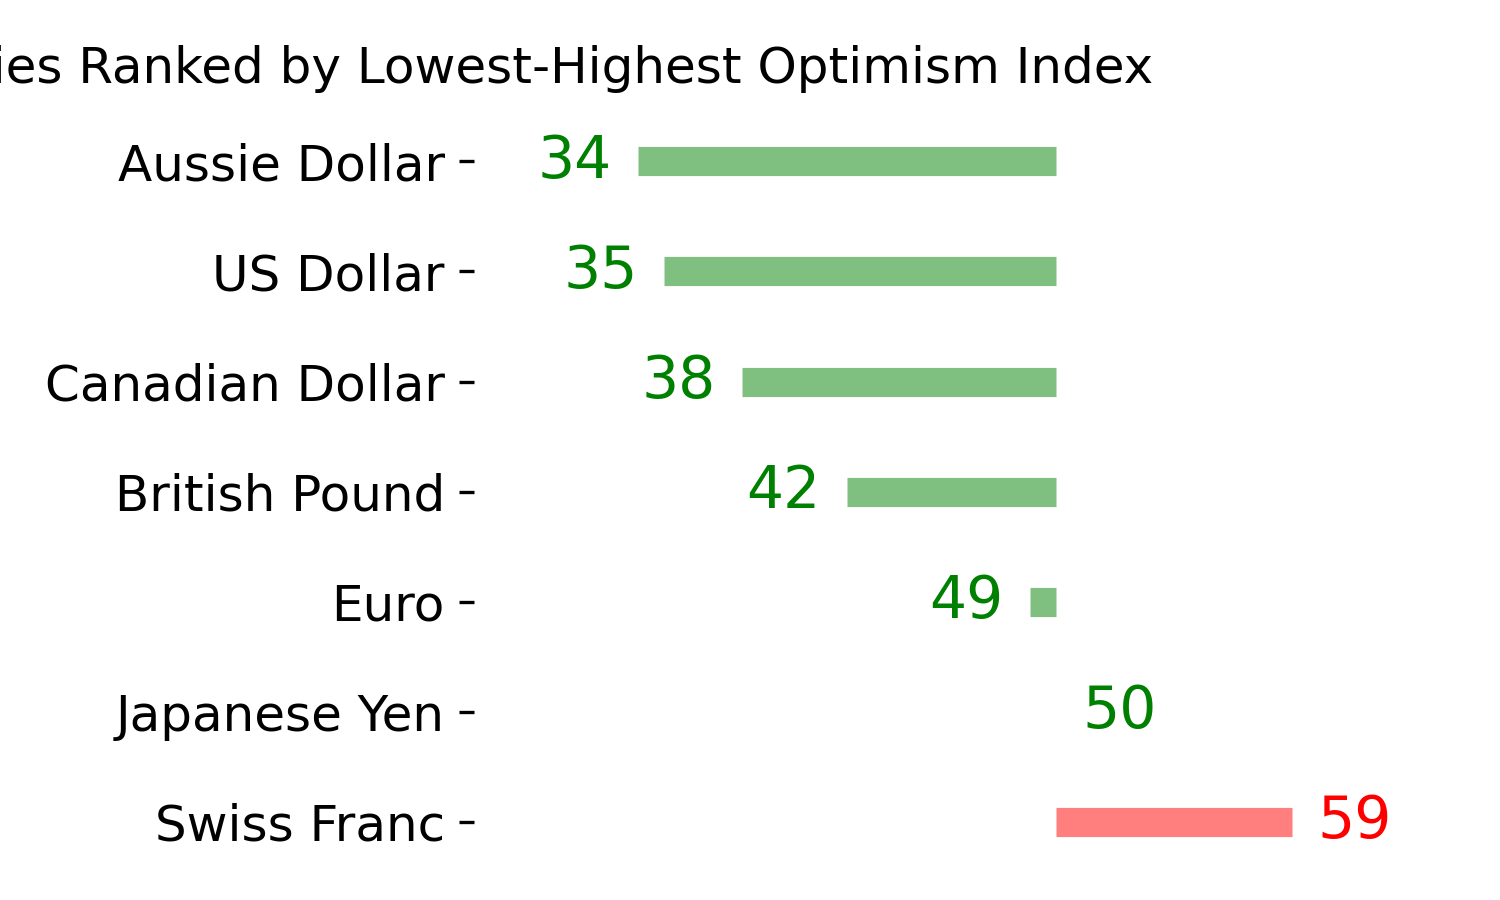
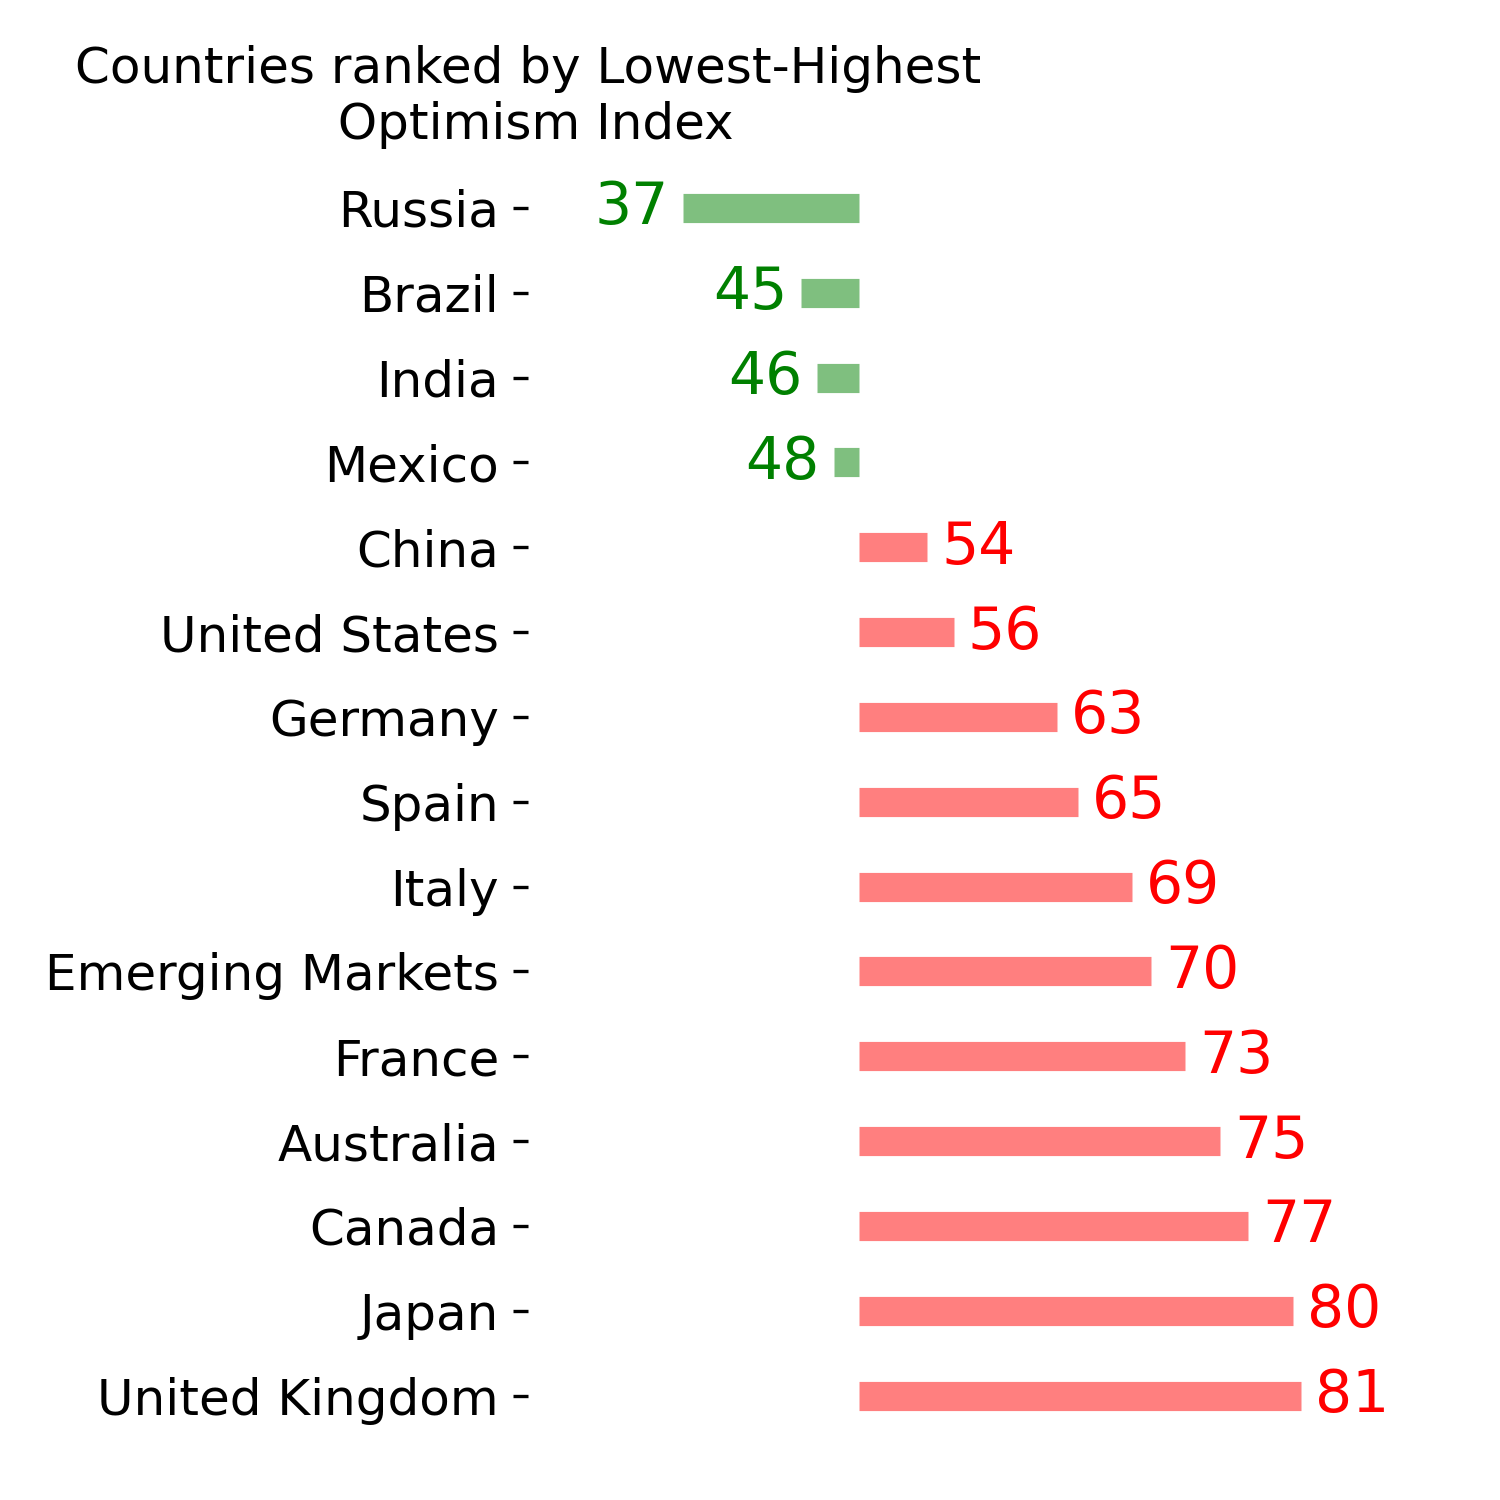
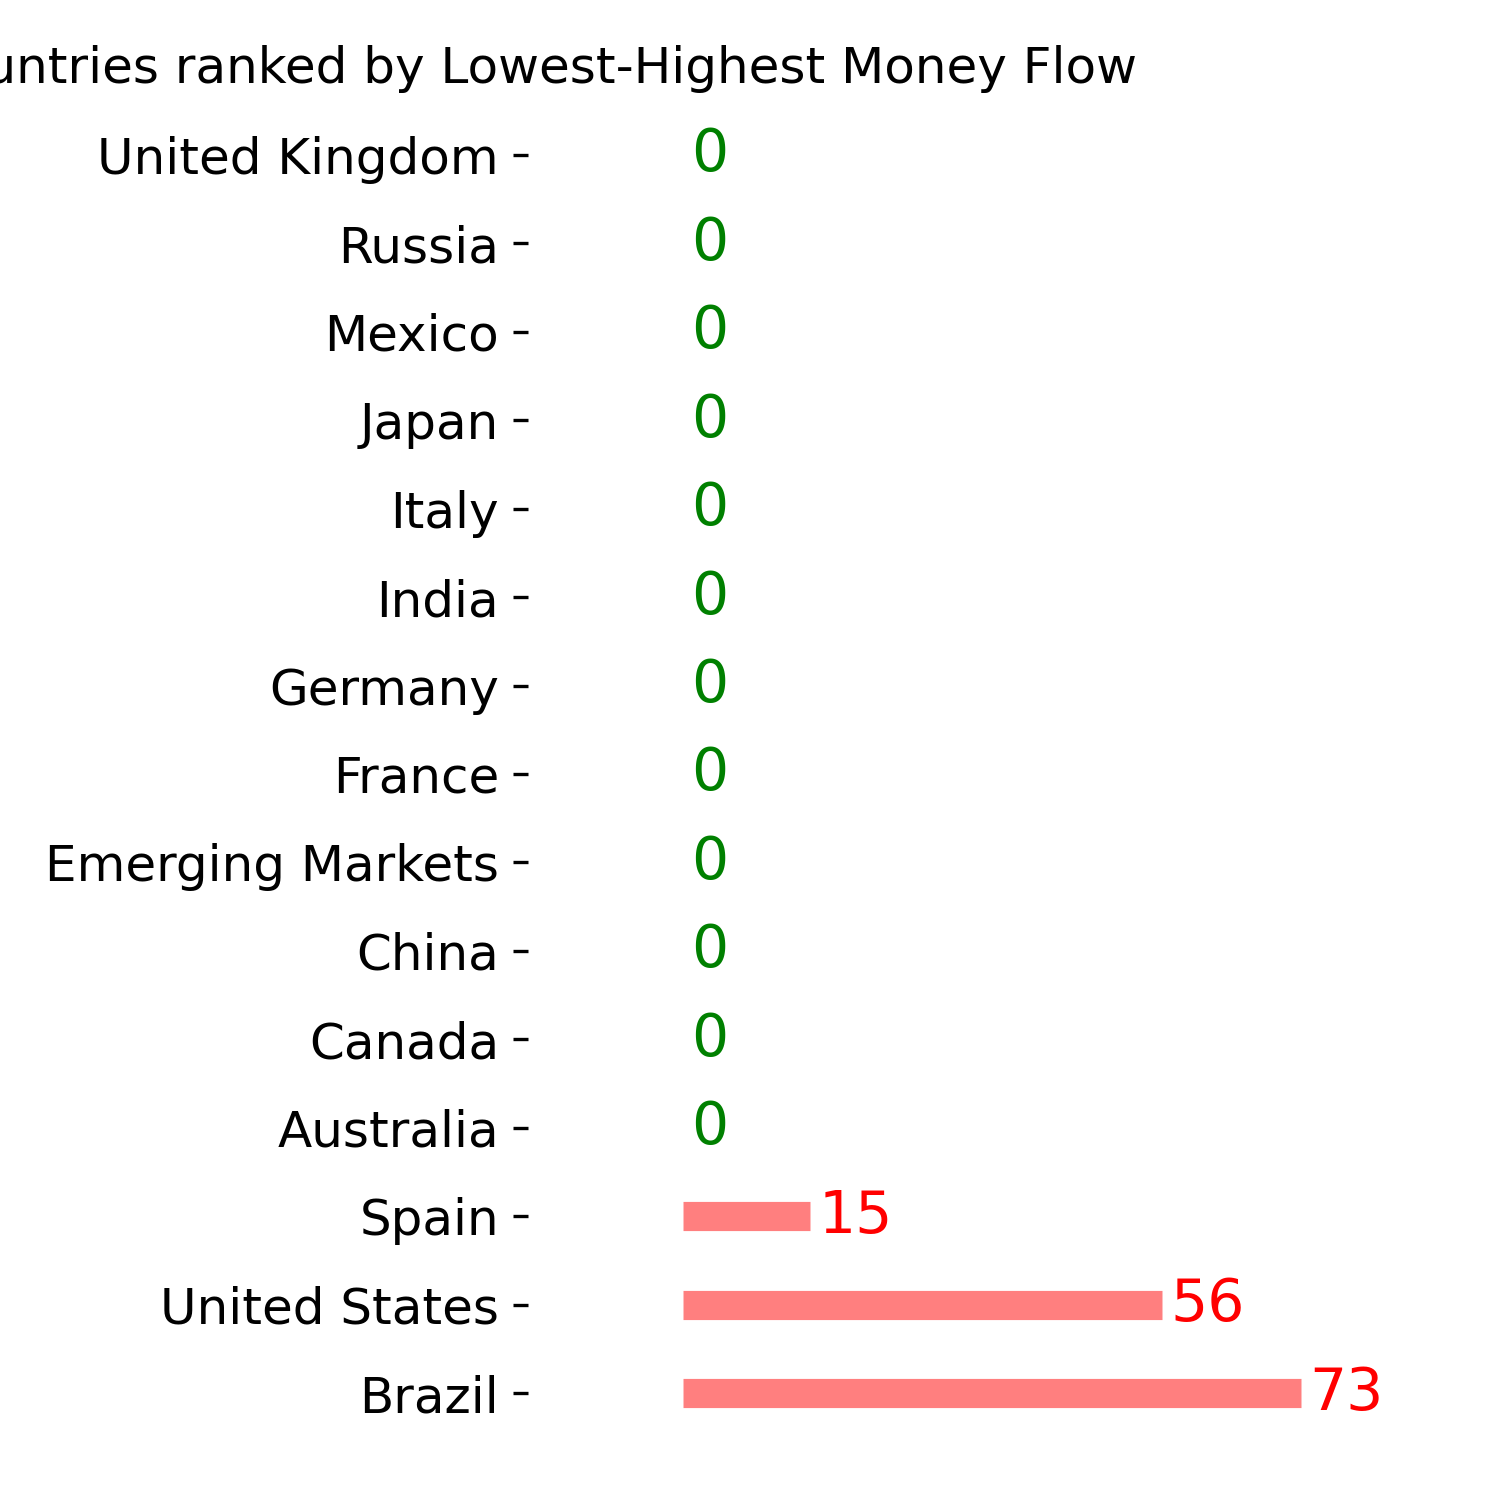
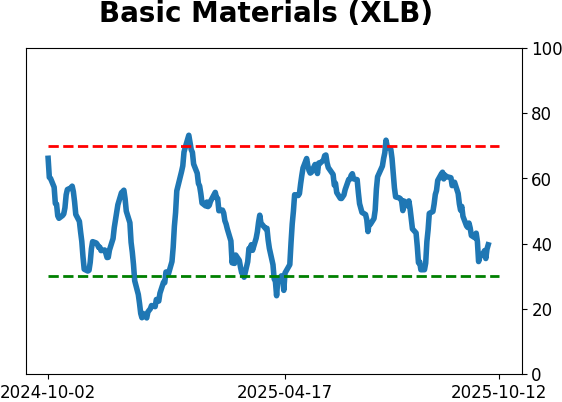
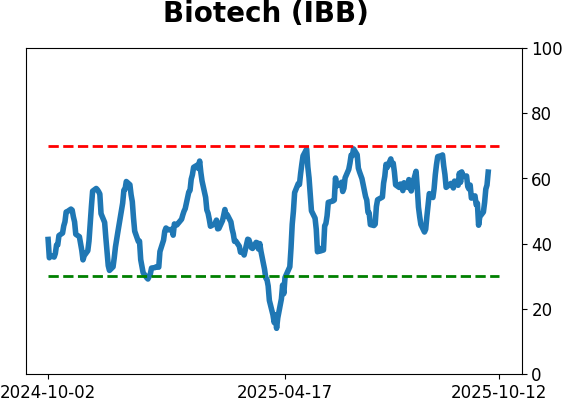
Optimism Index Thumbnails
|
|
|
|
|
|
|
|
|

|
|
|
|
|
|
|
|
|
|

|
|