Headlines
|
|
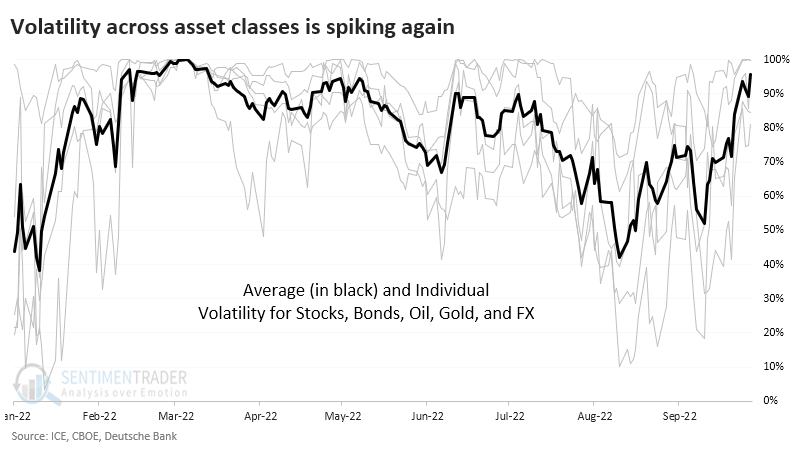
Volatility is spiking everywhere:
Volatility across asset classes has been spiking. An average of volatility among five different asset classes is now higher than 95% of all other days over the past year.
|
Smart / Dumb Money Confidence
|
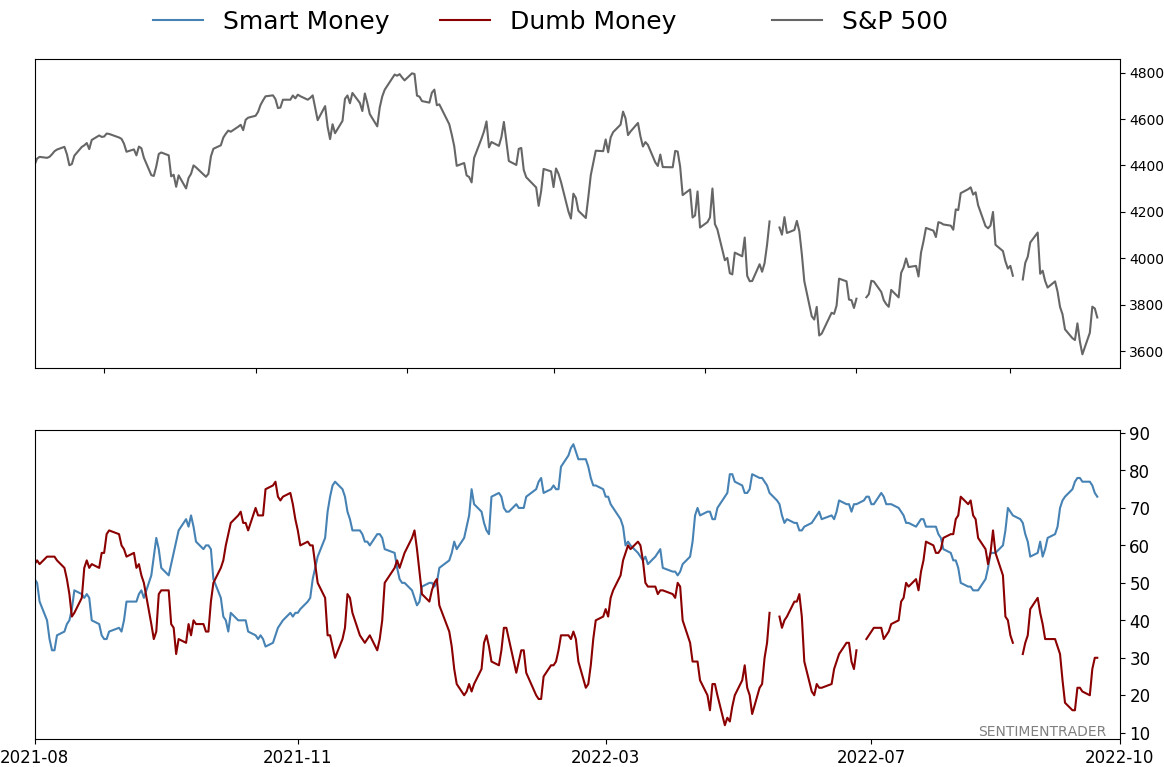
Smart Money Confidence: 73%
Dumb Money Confidence: 30%
|
|
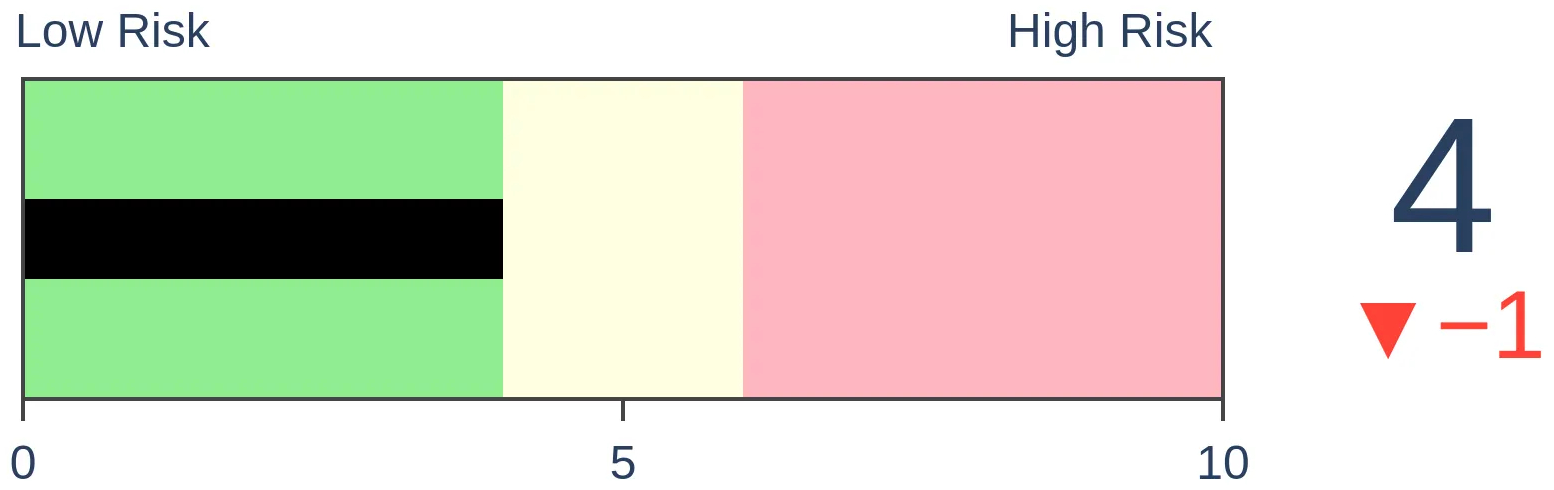
Risk Levels
Stocks Short-Term
|
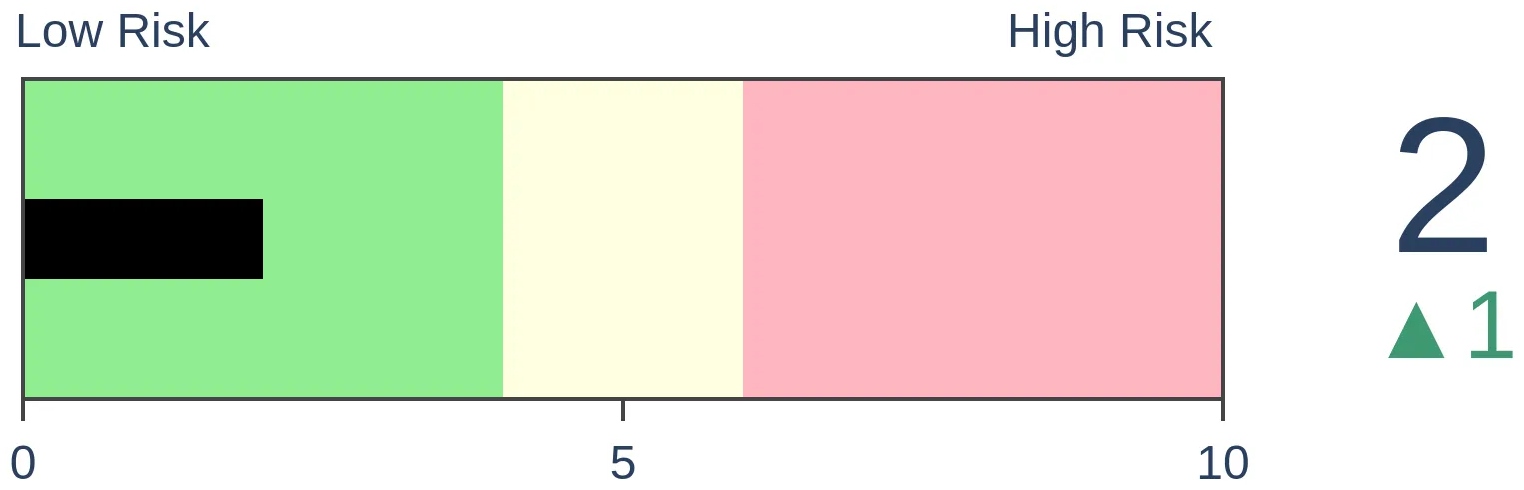
Stocks Medium-Term

|
|
Bonds
|
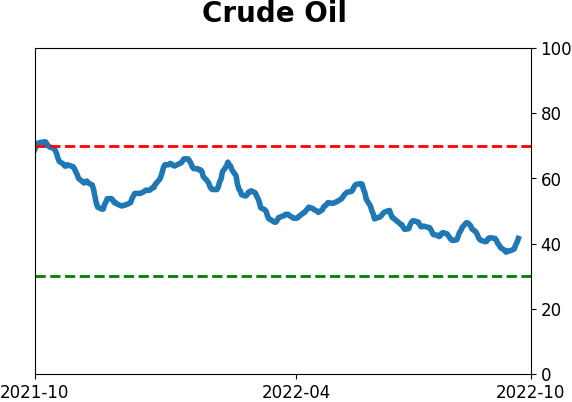
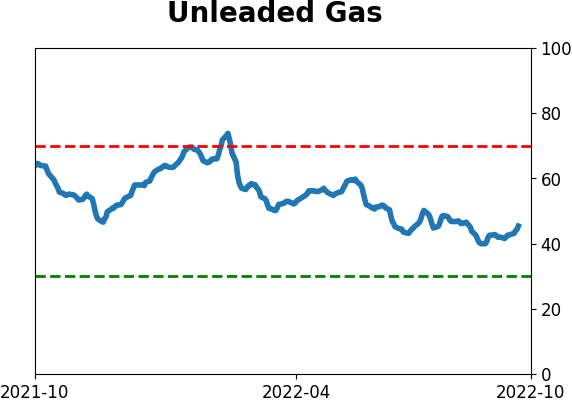
Crude Oil
|
|
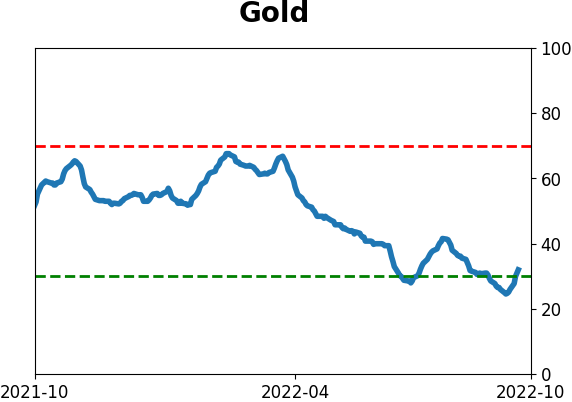
Gold
|
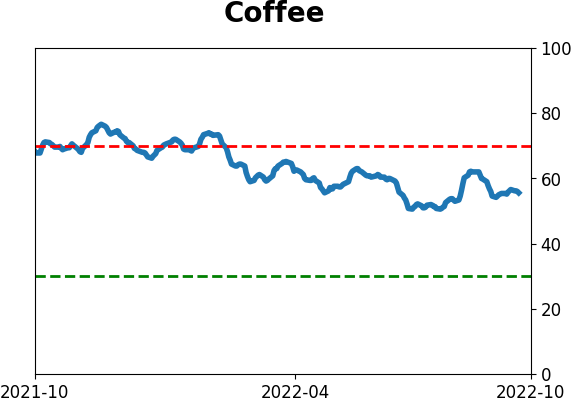
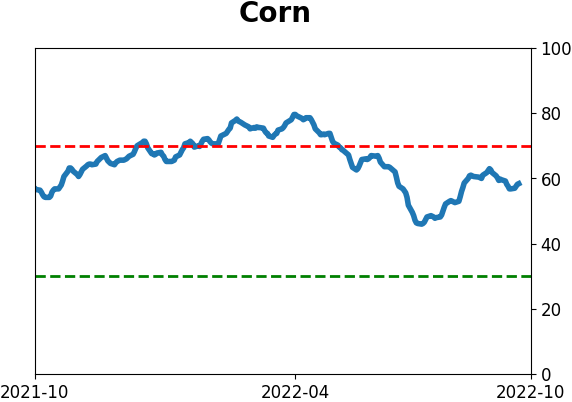
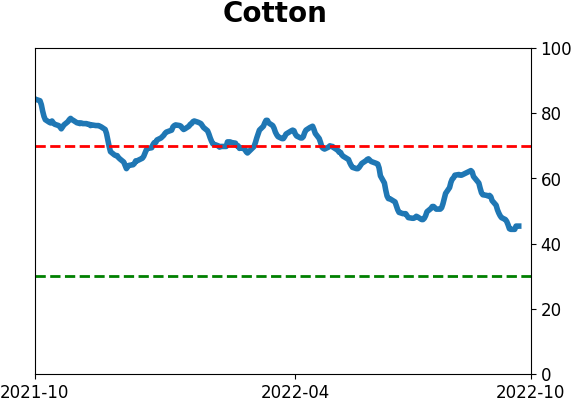
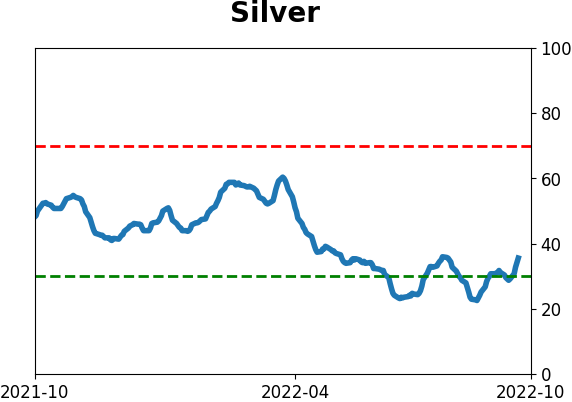
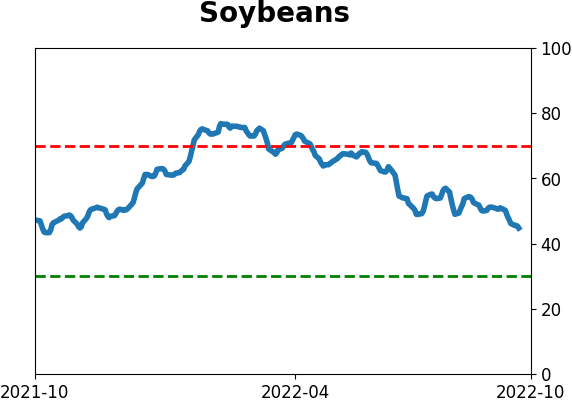
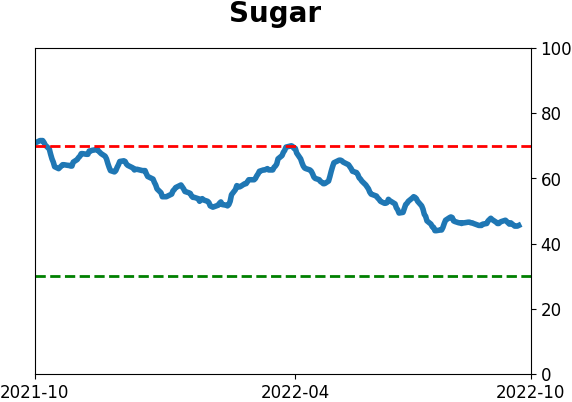
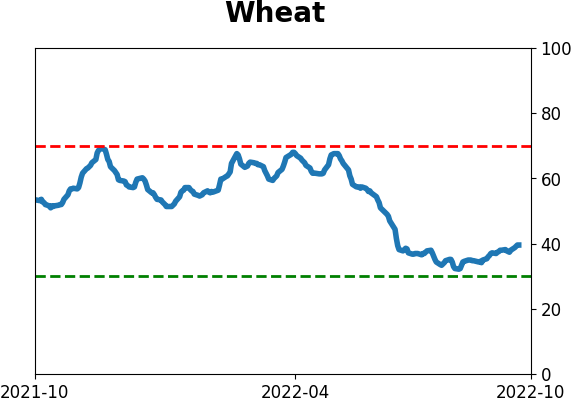
Agriculture

|
|
Research
By Jason Goepfert
BOTTOM LINE
Volatility across asset classes has been spiking. An average of volatility among five different asset classes is now higher than 95% of all other days over the past year.
FORECAST / TIMEFRAME
None
|
Key points:
- Volatility in stocks has spiked in recent weeks. Same with bonds, oil, gold, and currencies
- The average volatility level among broad assets is in the top 5% of its range over the past year
- An extremely high level of cross-asset volatility tends to occur at times of crisis but has been a mediocre buy signal
Volatility is spiking everywhere
When investors become anxious, they sell. When they panic, they sell indiscriminately. That's why correlations among stocks tend to rise rapidly during waterfall declines.
It's not just within stocks; it happens across assets, too. Last week, stocks wobbled, and implied volatility for the S&P 500 jumped. It did so for bonds, too. And oil. And gold. And foreign exchange.
This hasn't been a consistent sign of armageddon, though it did happen early in the bear markets of 2000, 2008, and 2020. It also triggered in February of this year, which preceded losses as well.

Returns improved when these cross-asset volatility spikes triggered after stocks had already declined significantly. If the S&P 500 was down 10% or more from a 52-week high at the time of the signal, it rallied over the next month five out of six times (September 2008 was the exception).
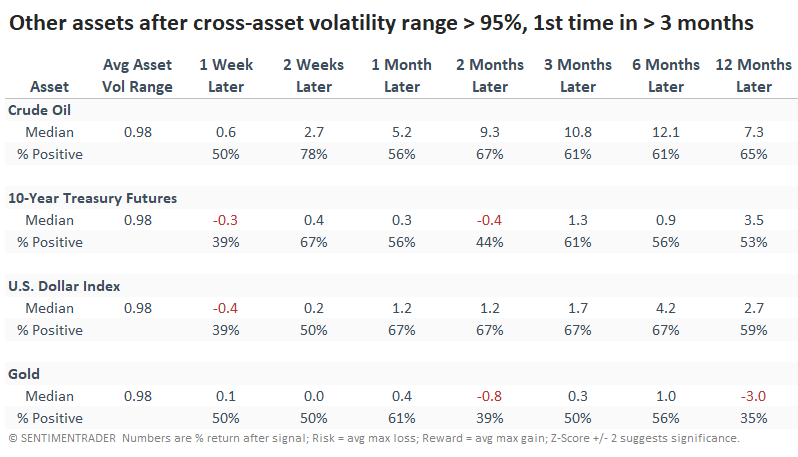
Among other assets, crude oil tended to have the best reaction, rising most of the time across time frames. Ironically, the "safe haven" of gold tended to serve as the least safe haven-y, though it still rose most of the time across most time frames.
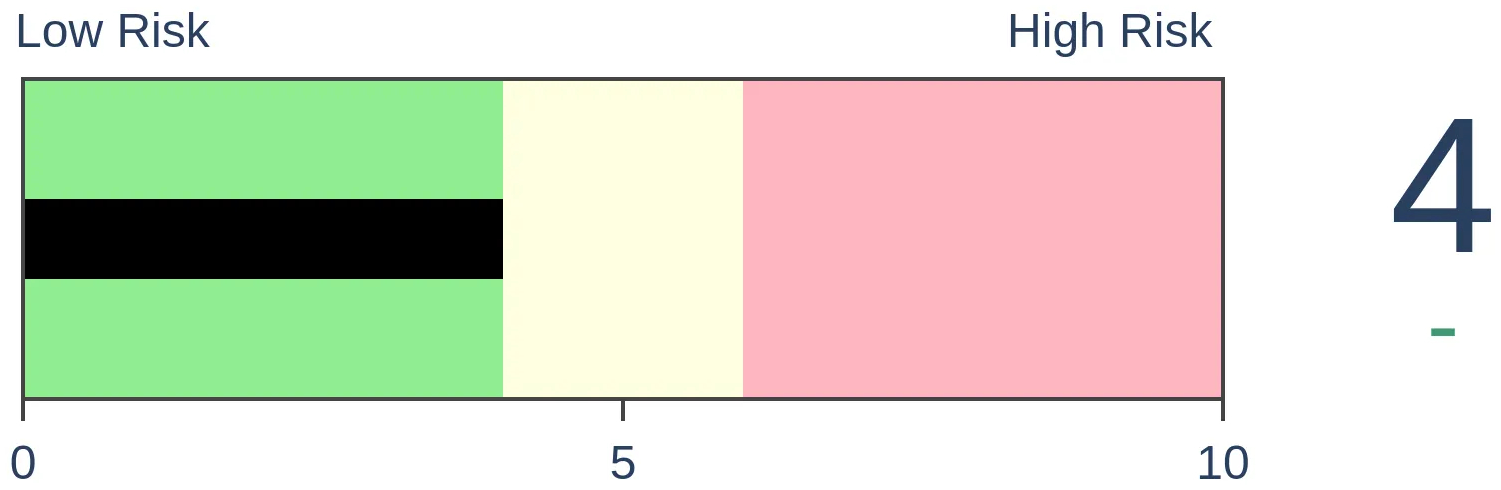
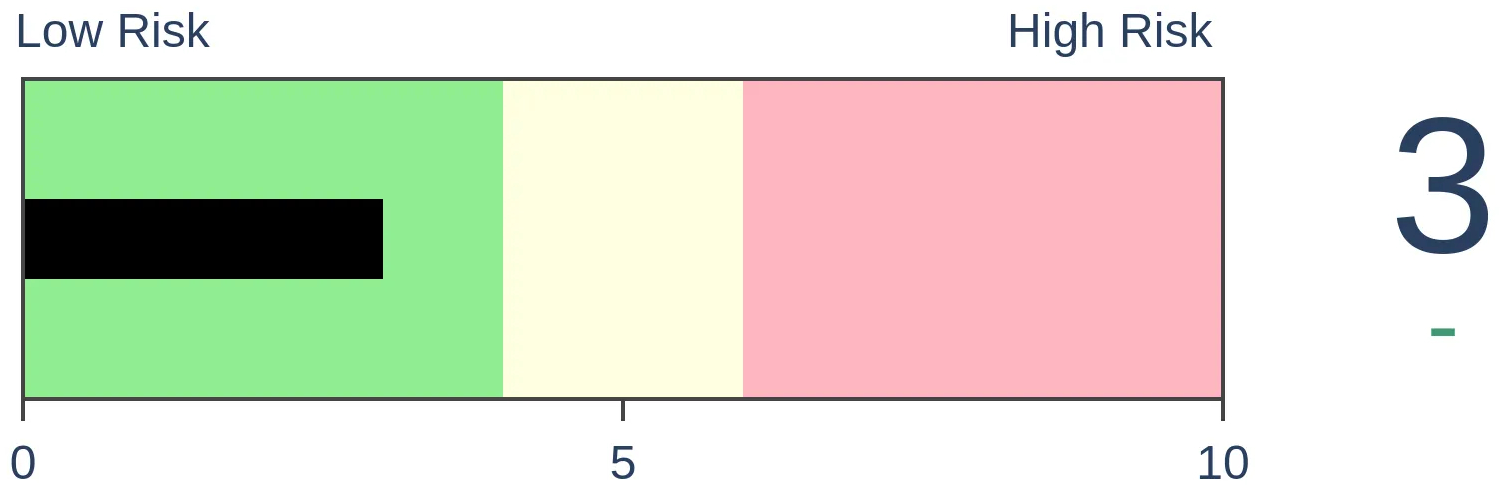
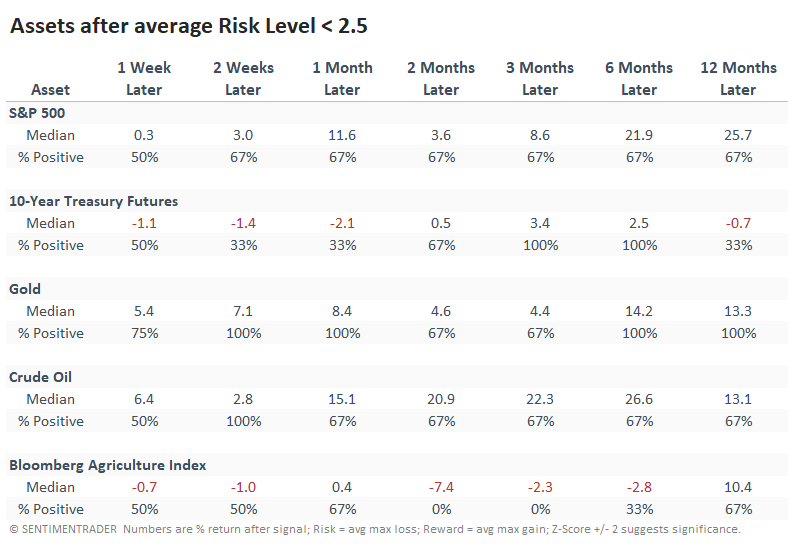
Risk Levels have been historically depressed
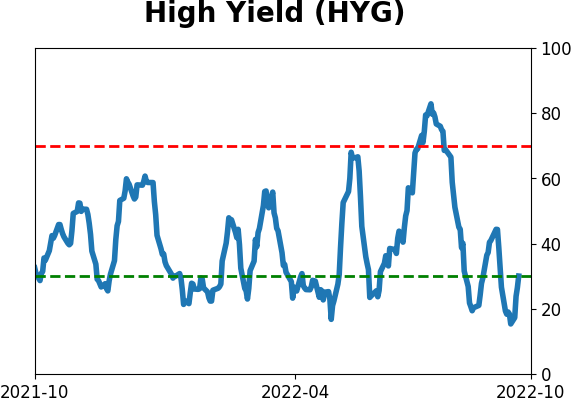
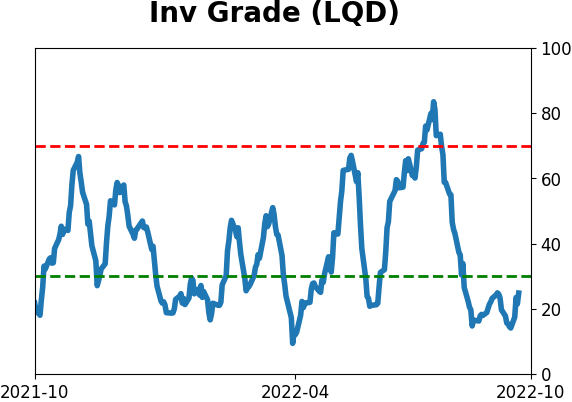
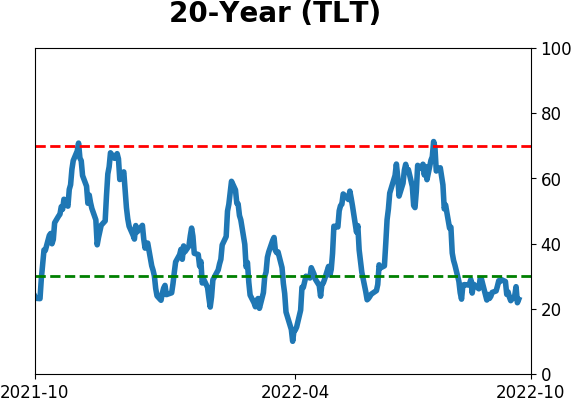
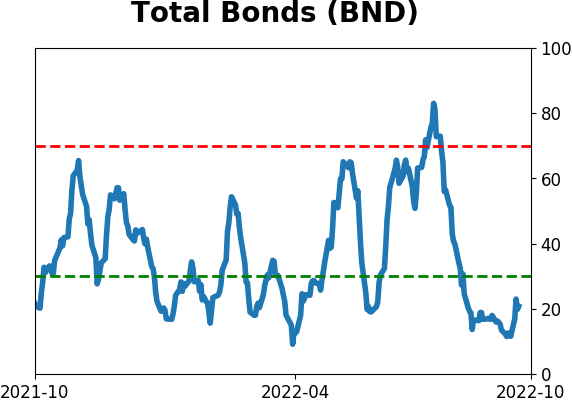
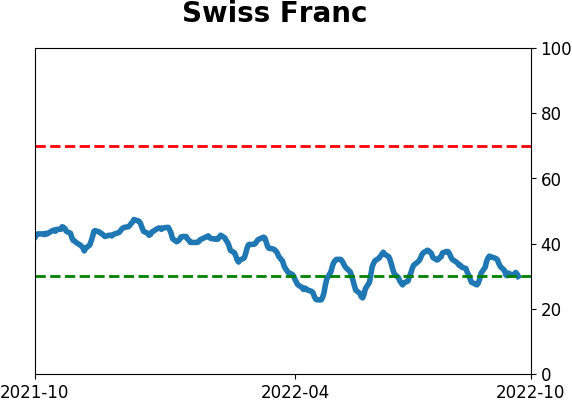
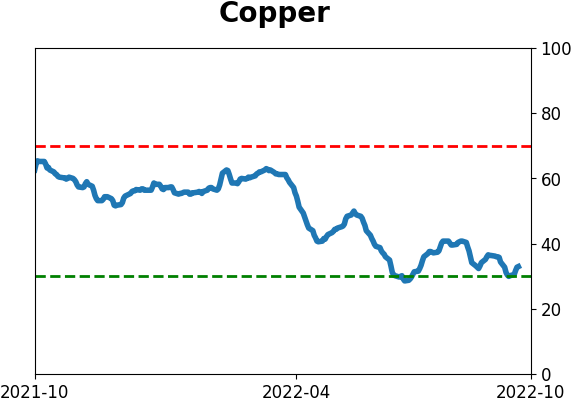
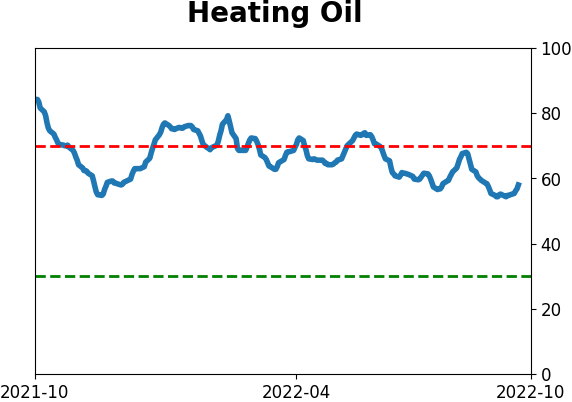
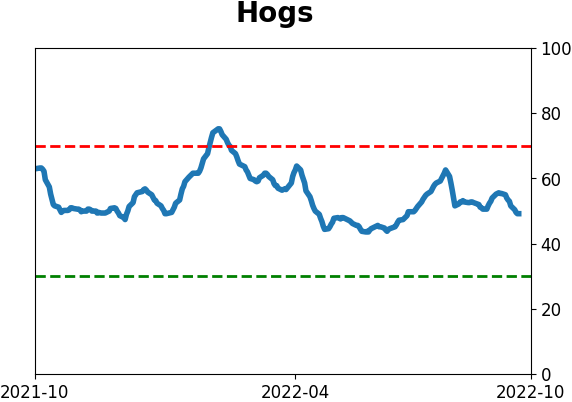
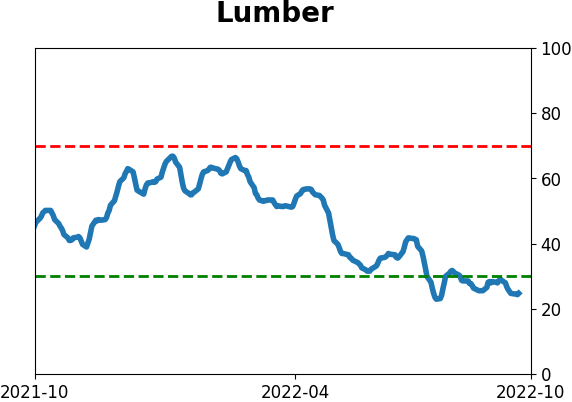
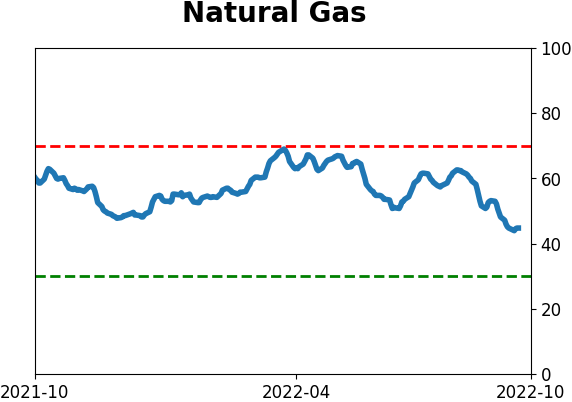
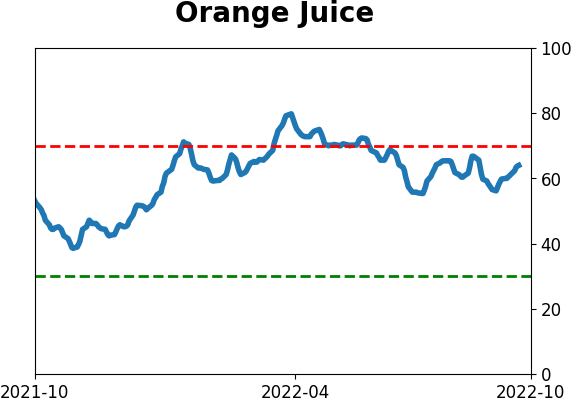
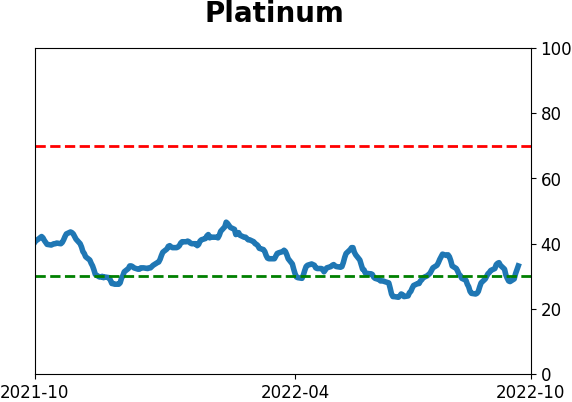
Because of the volatility across assets, the Risk Levels for most assets have been low. The Risk Levels are automatically calculated based on the Optimism Index for markets including stocks (short-term and intermediate-term), bonds, gold, oil, and agriculture.
It's extremely rare to see the Risk Levels across all of those so low at the same time. In fact, since we began calculating these in 2004, they have never been lower.
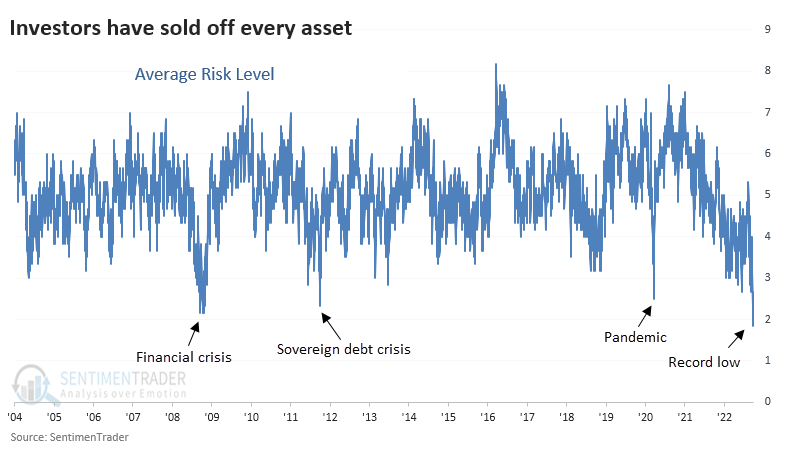
Because markets never rise and fall at the same pace at the same time, future returns weren't necessarily consistent when the average Risk Level got so low. The sample size is only three, so this should be taken with a hefty grain of salt, but gold and oil did best short-term, bonds did best in the medium-term, and stocks did best long-term.
What the research tells us...
This year has been among the worst, if not the worst, in several generations for diversified investors. The last month only served to make things worse, and correlations among most assets have spiked to crisis levels. Generally, this is a contrary sign, with the caveat that it has also triggered relatively early in 2008, which is the worst-case scenario that investors like to glom onto.
Indicators at Extremes
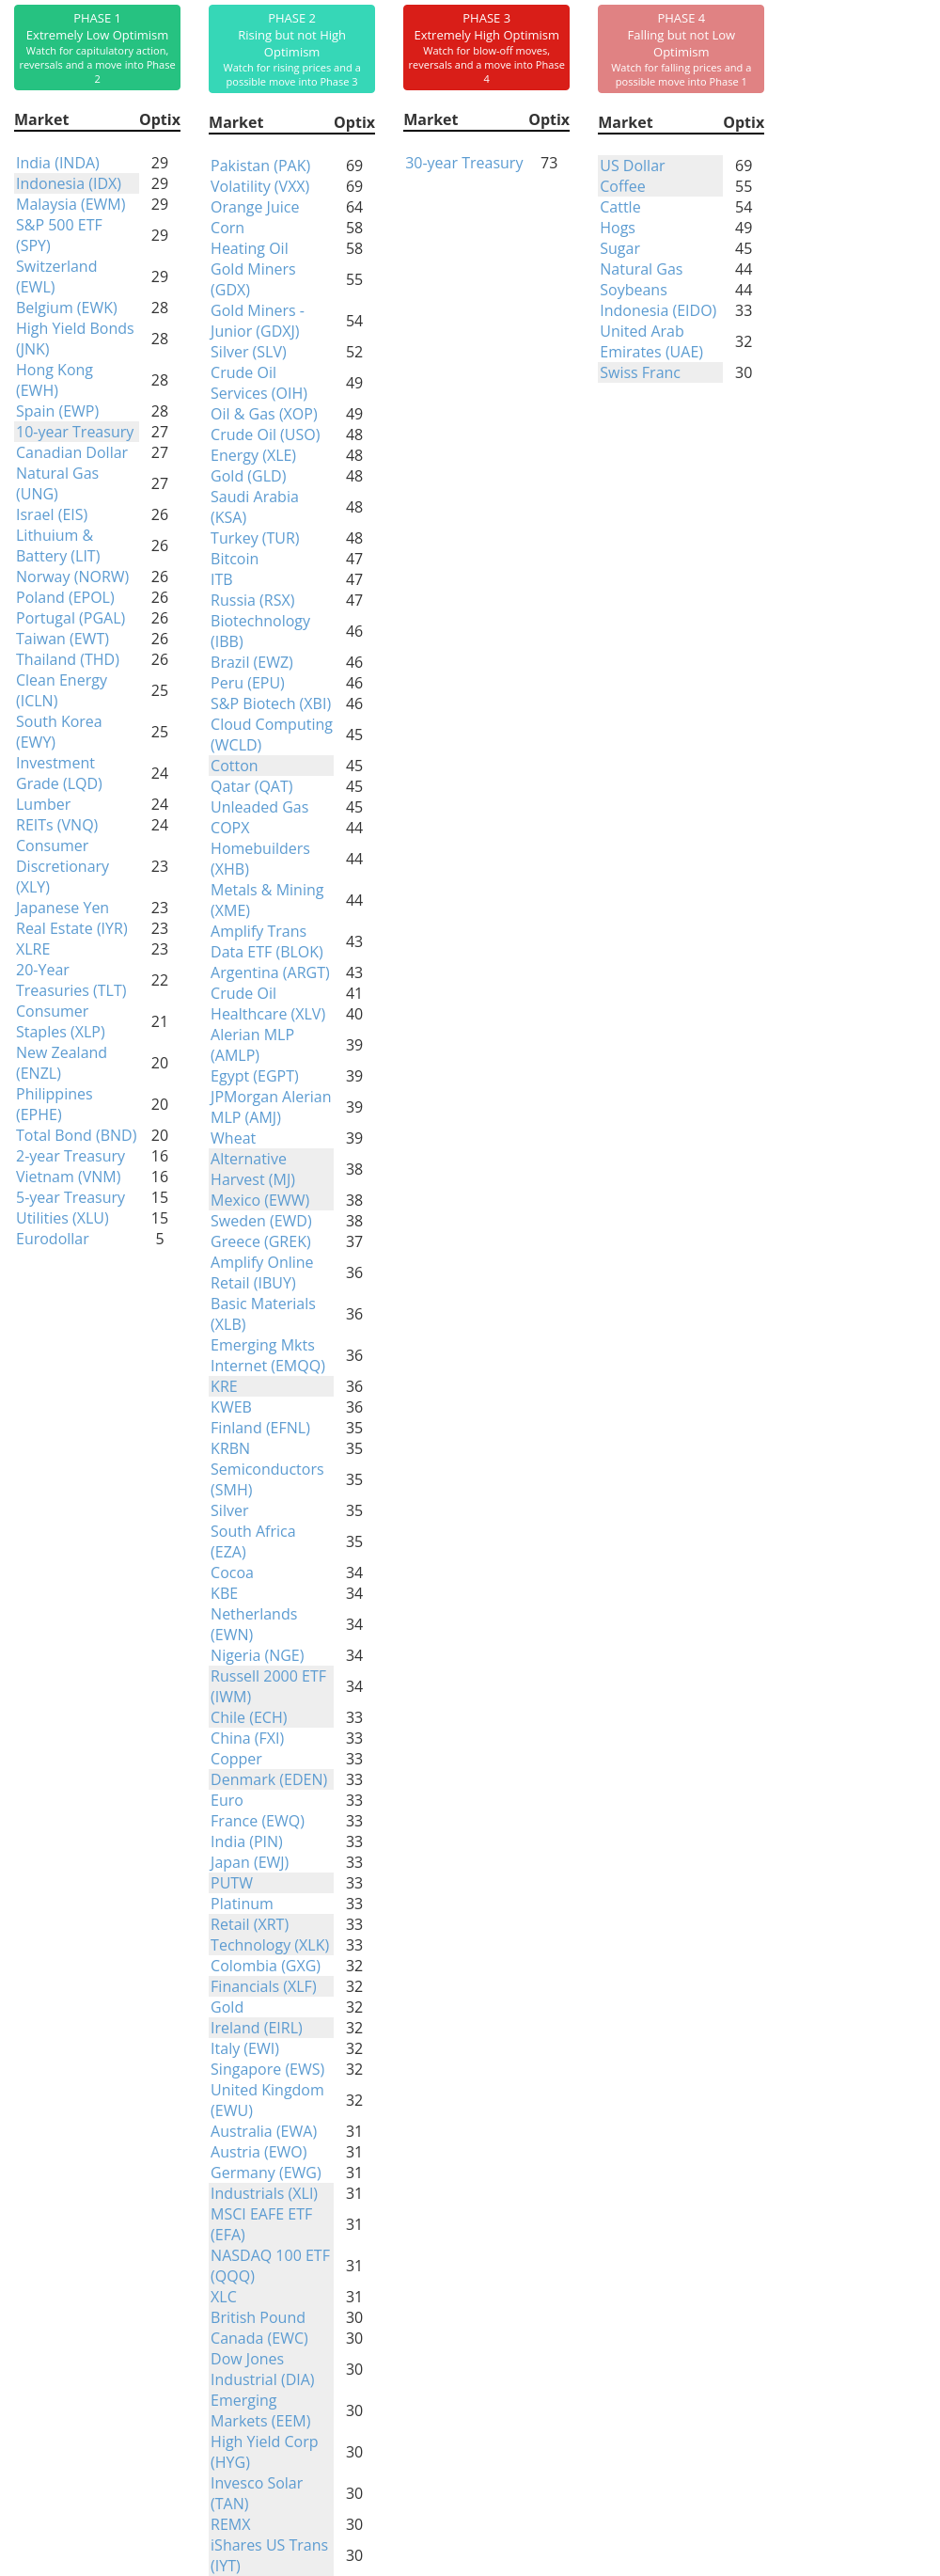
Phase Table
Ranks
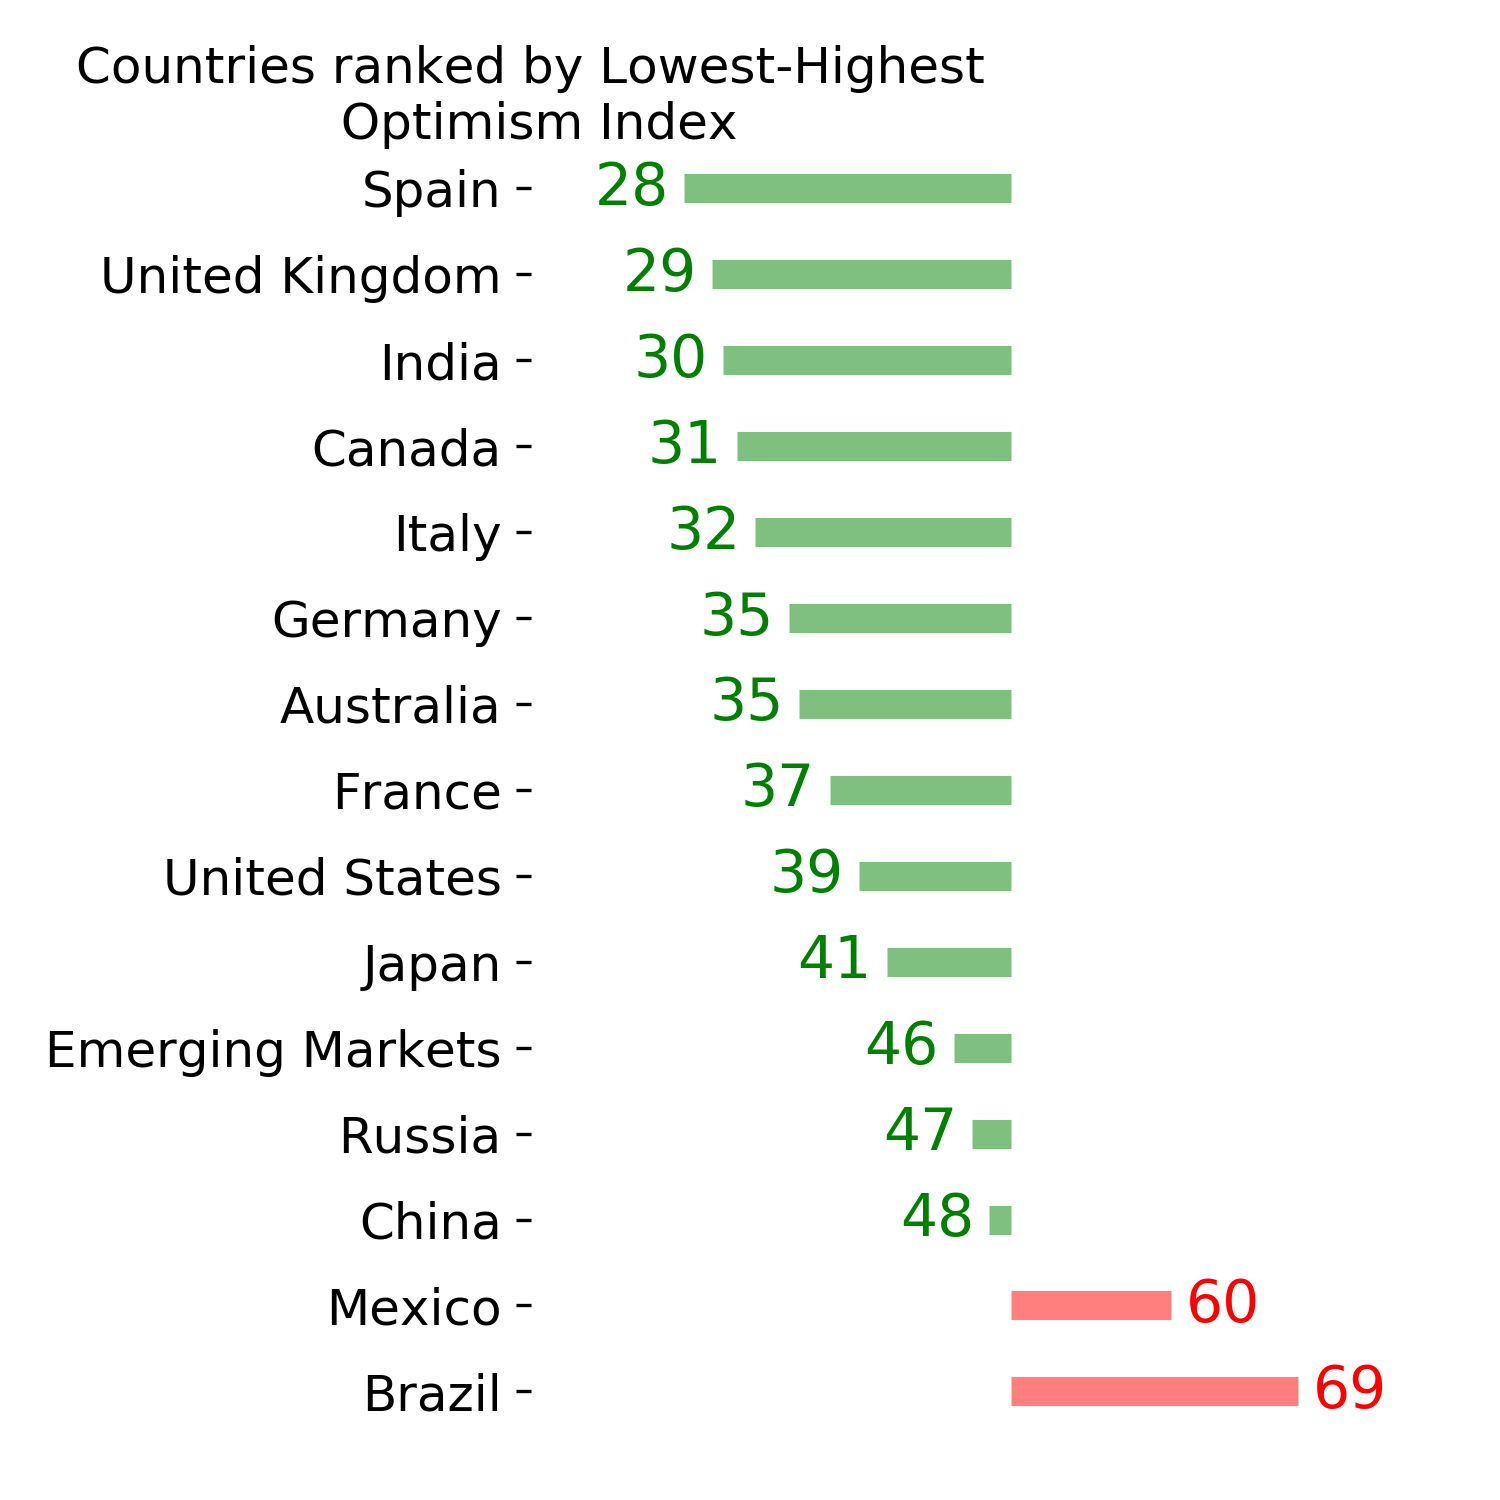
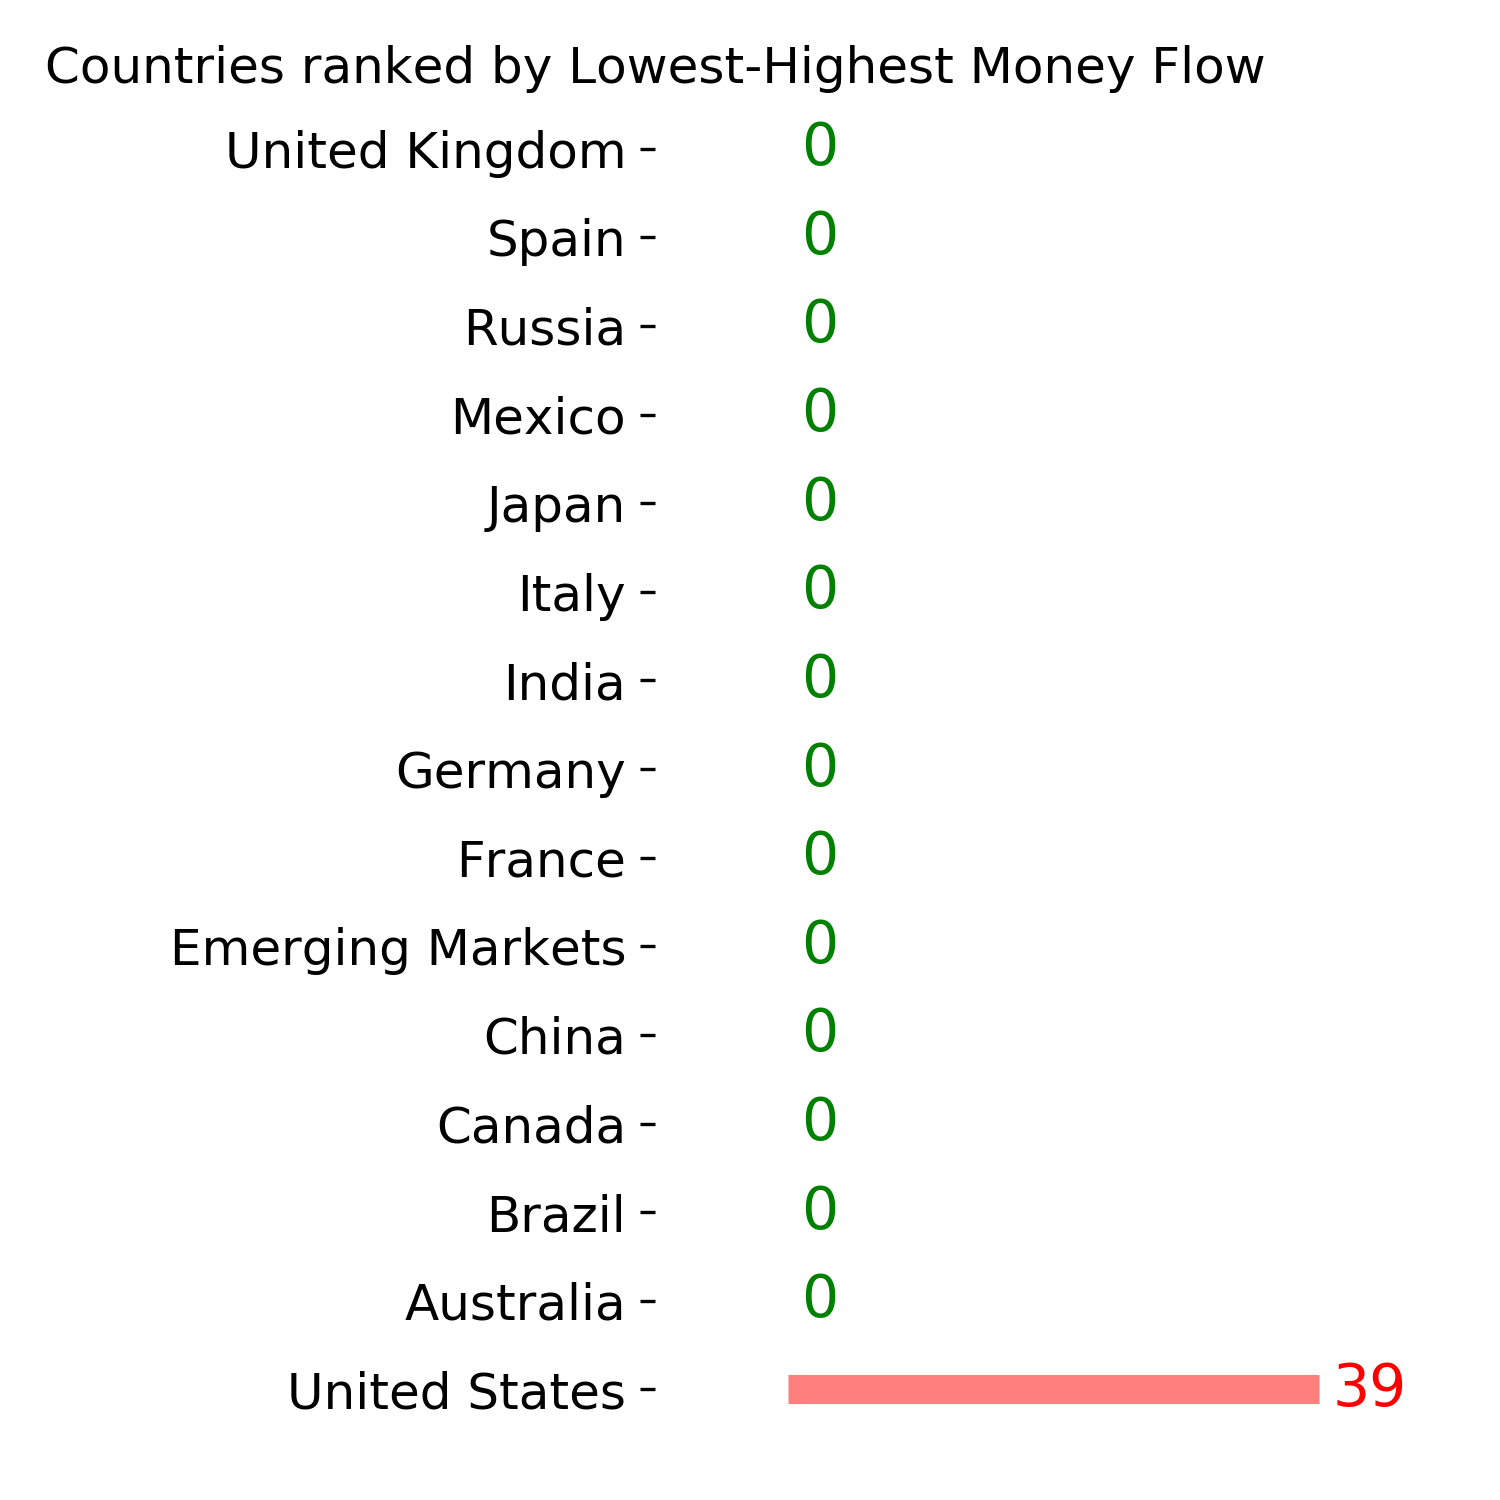
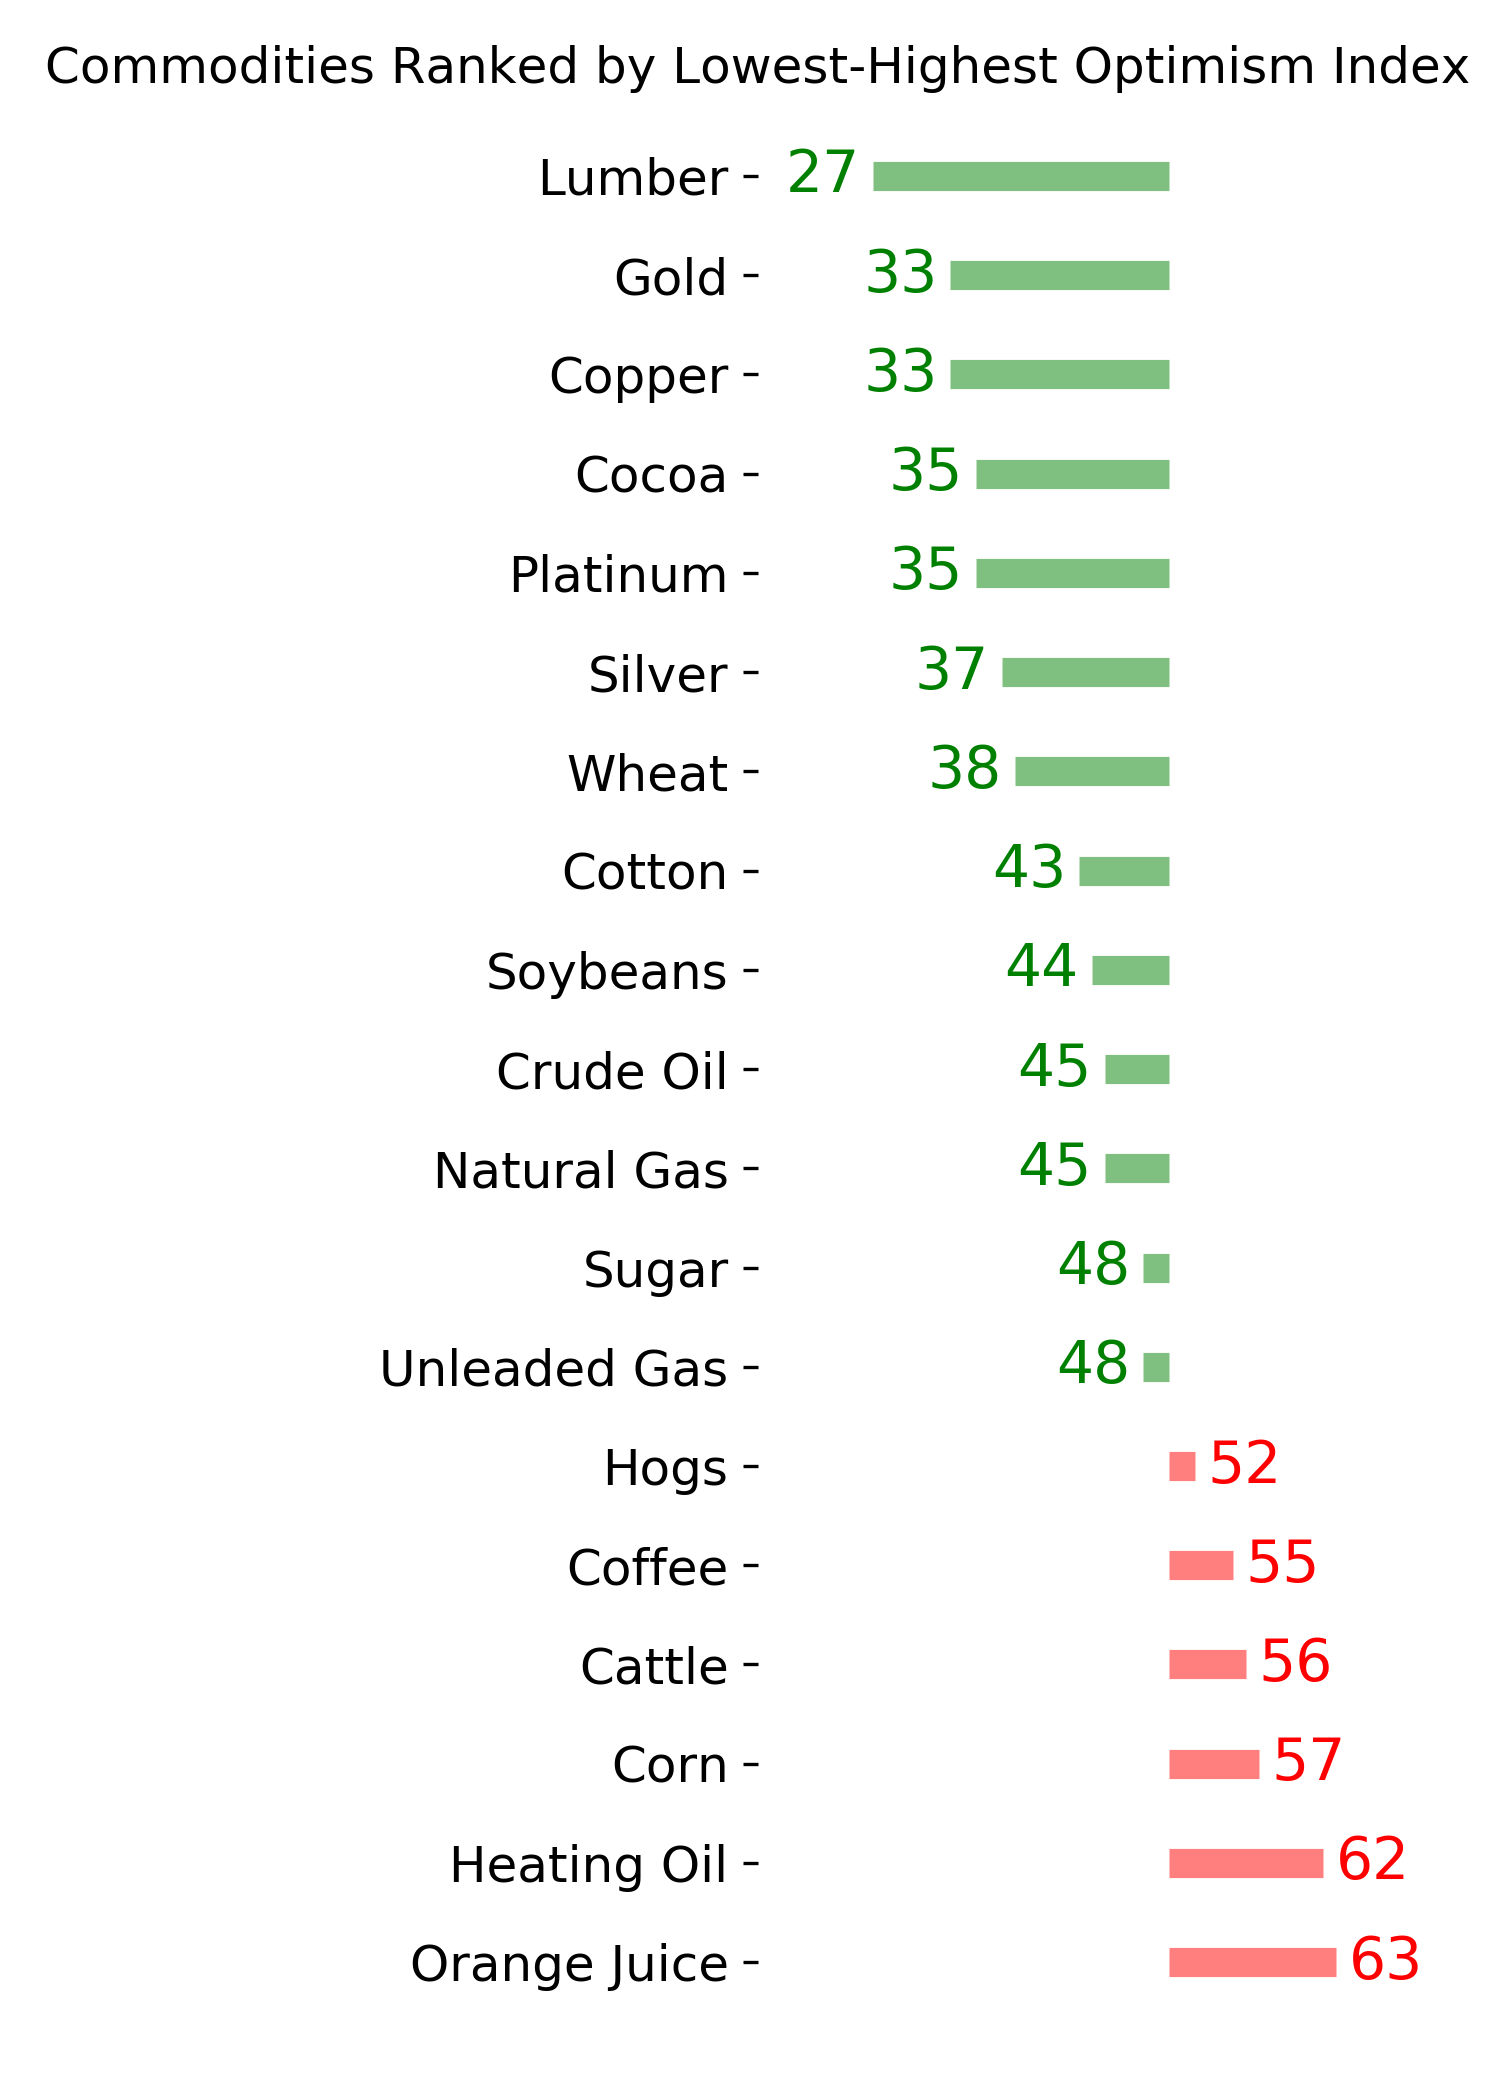
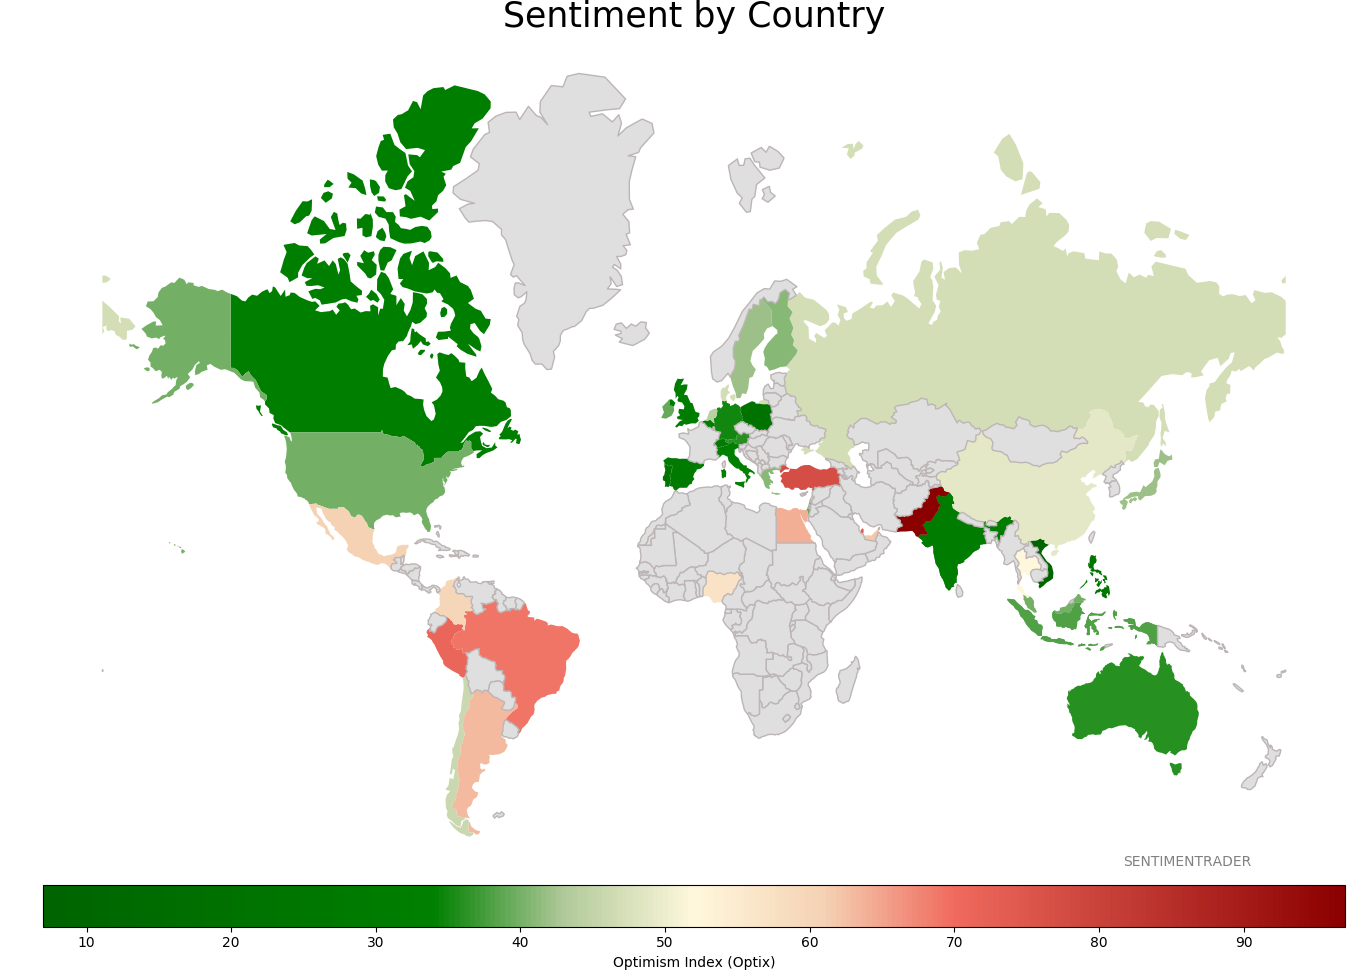
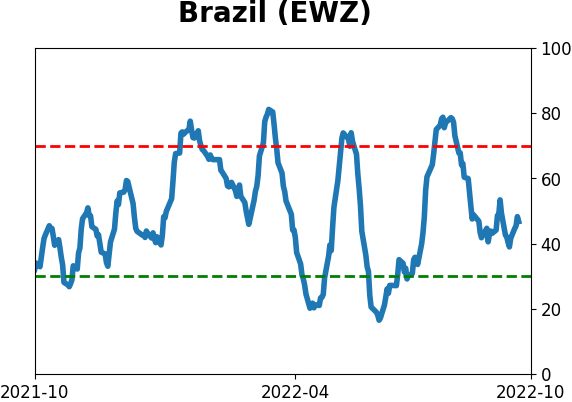
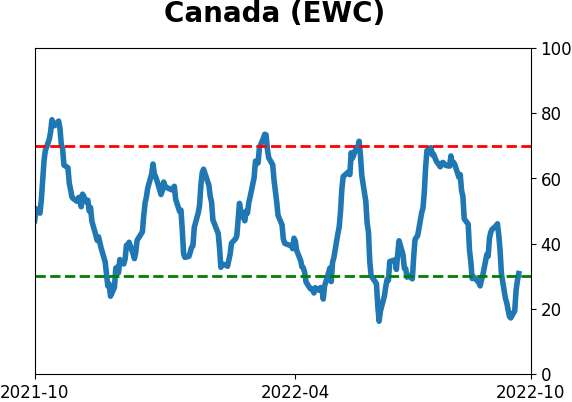
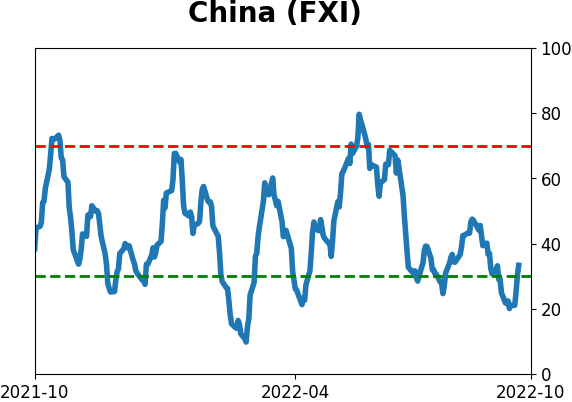
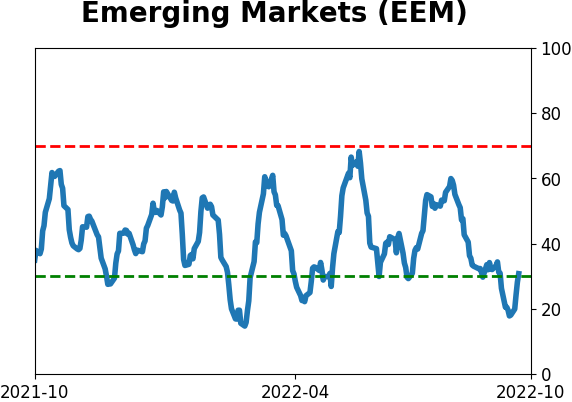
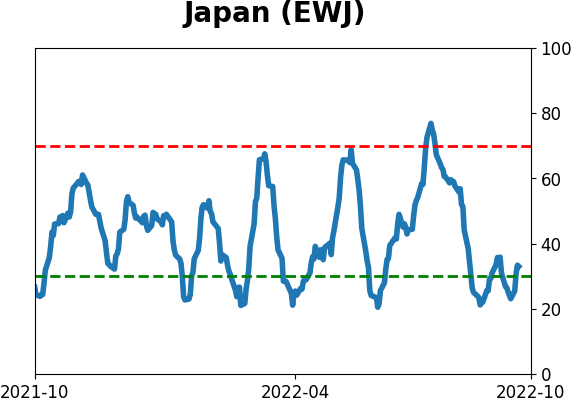
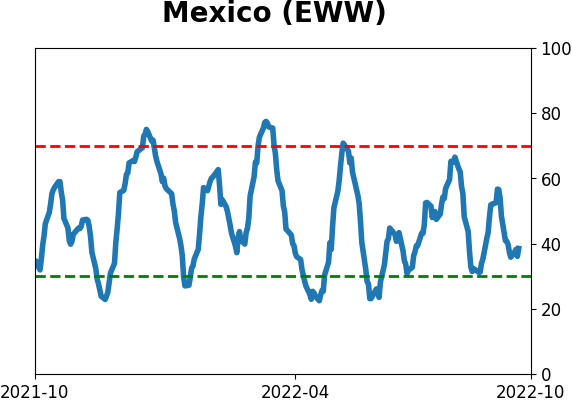
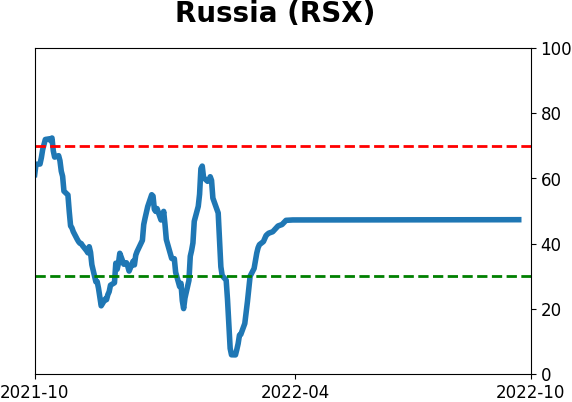
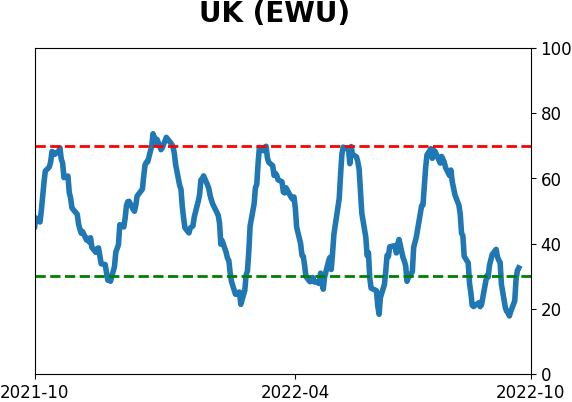
Sentiment Around The World
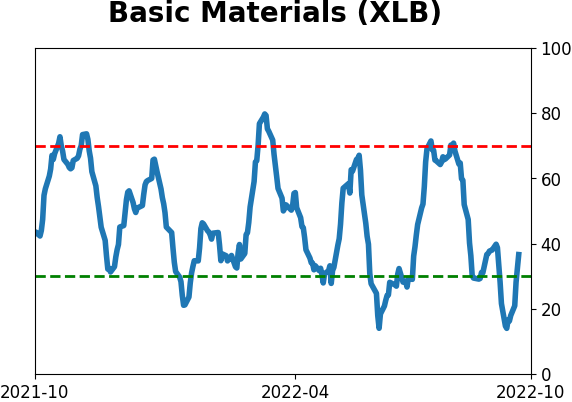
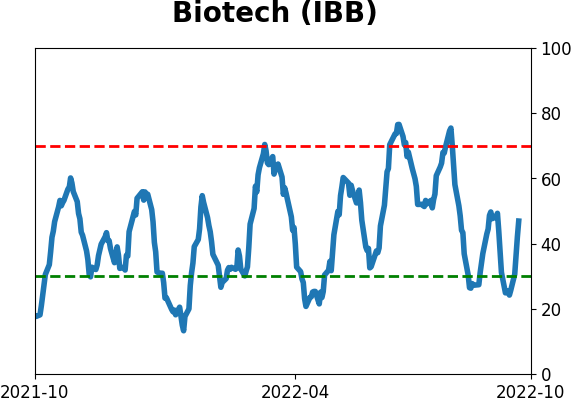
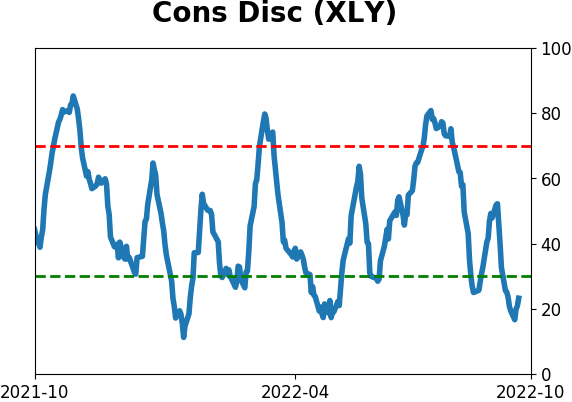
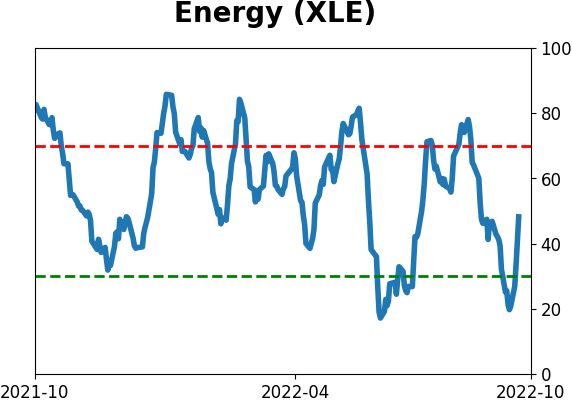
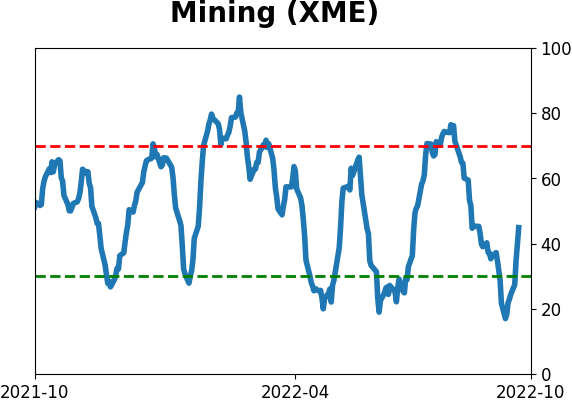
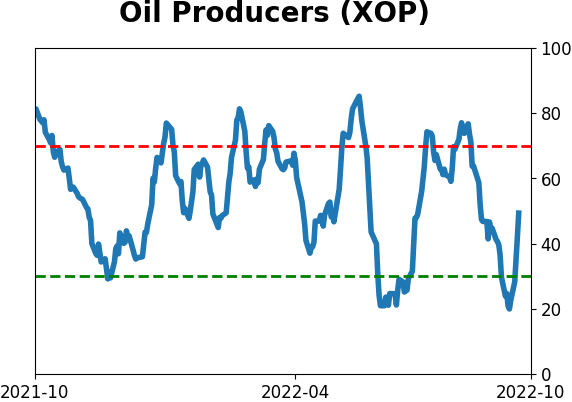
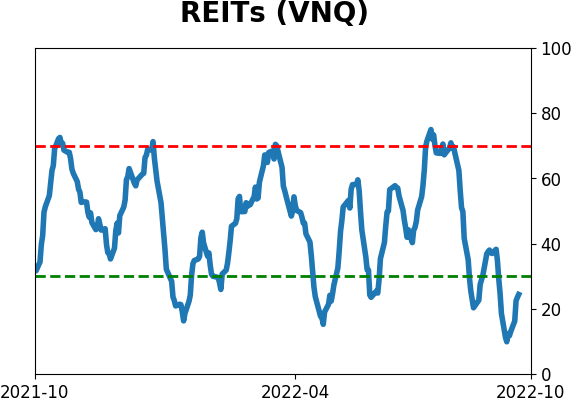
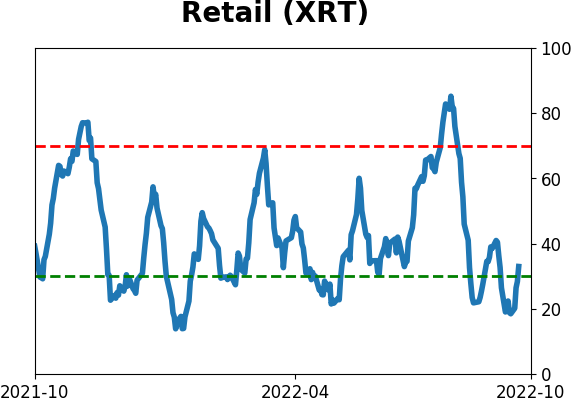
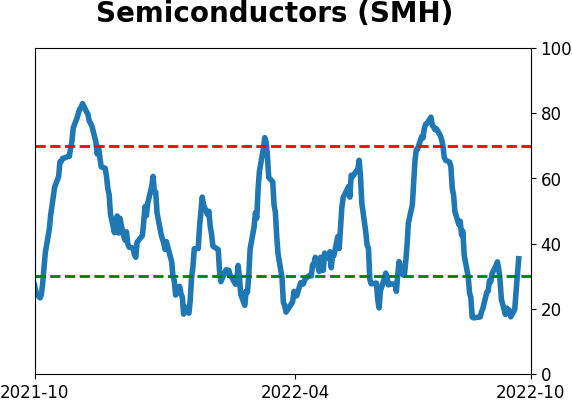
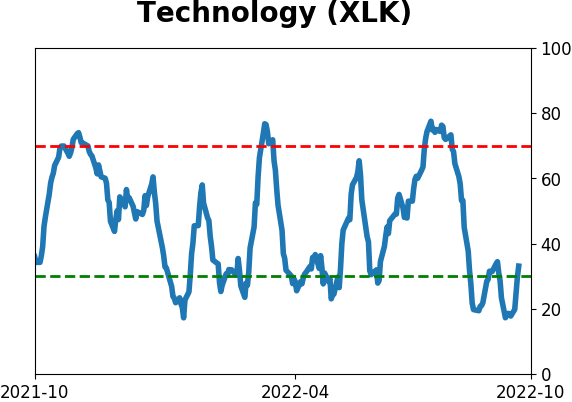
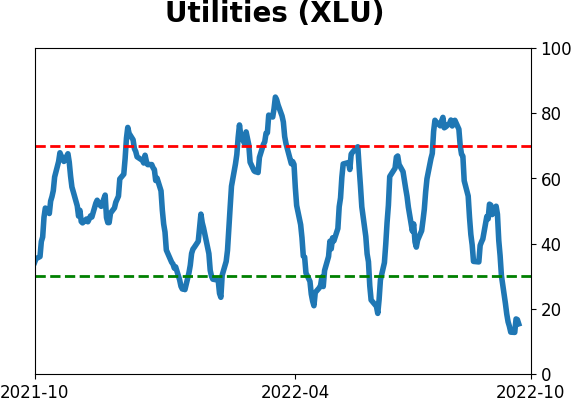
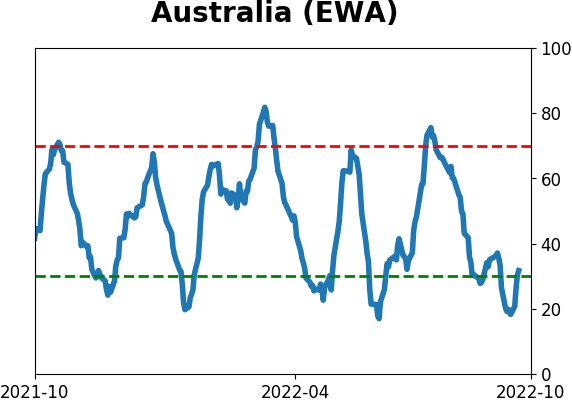
Optimism Index Thumbnails
|
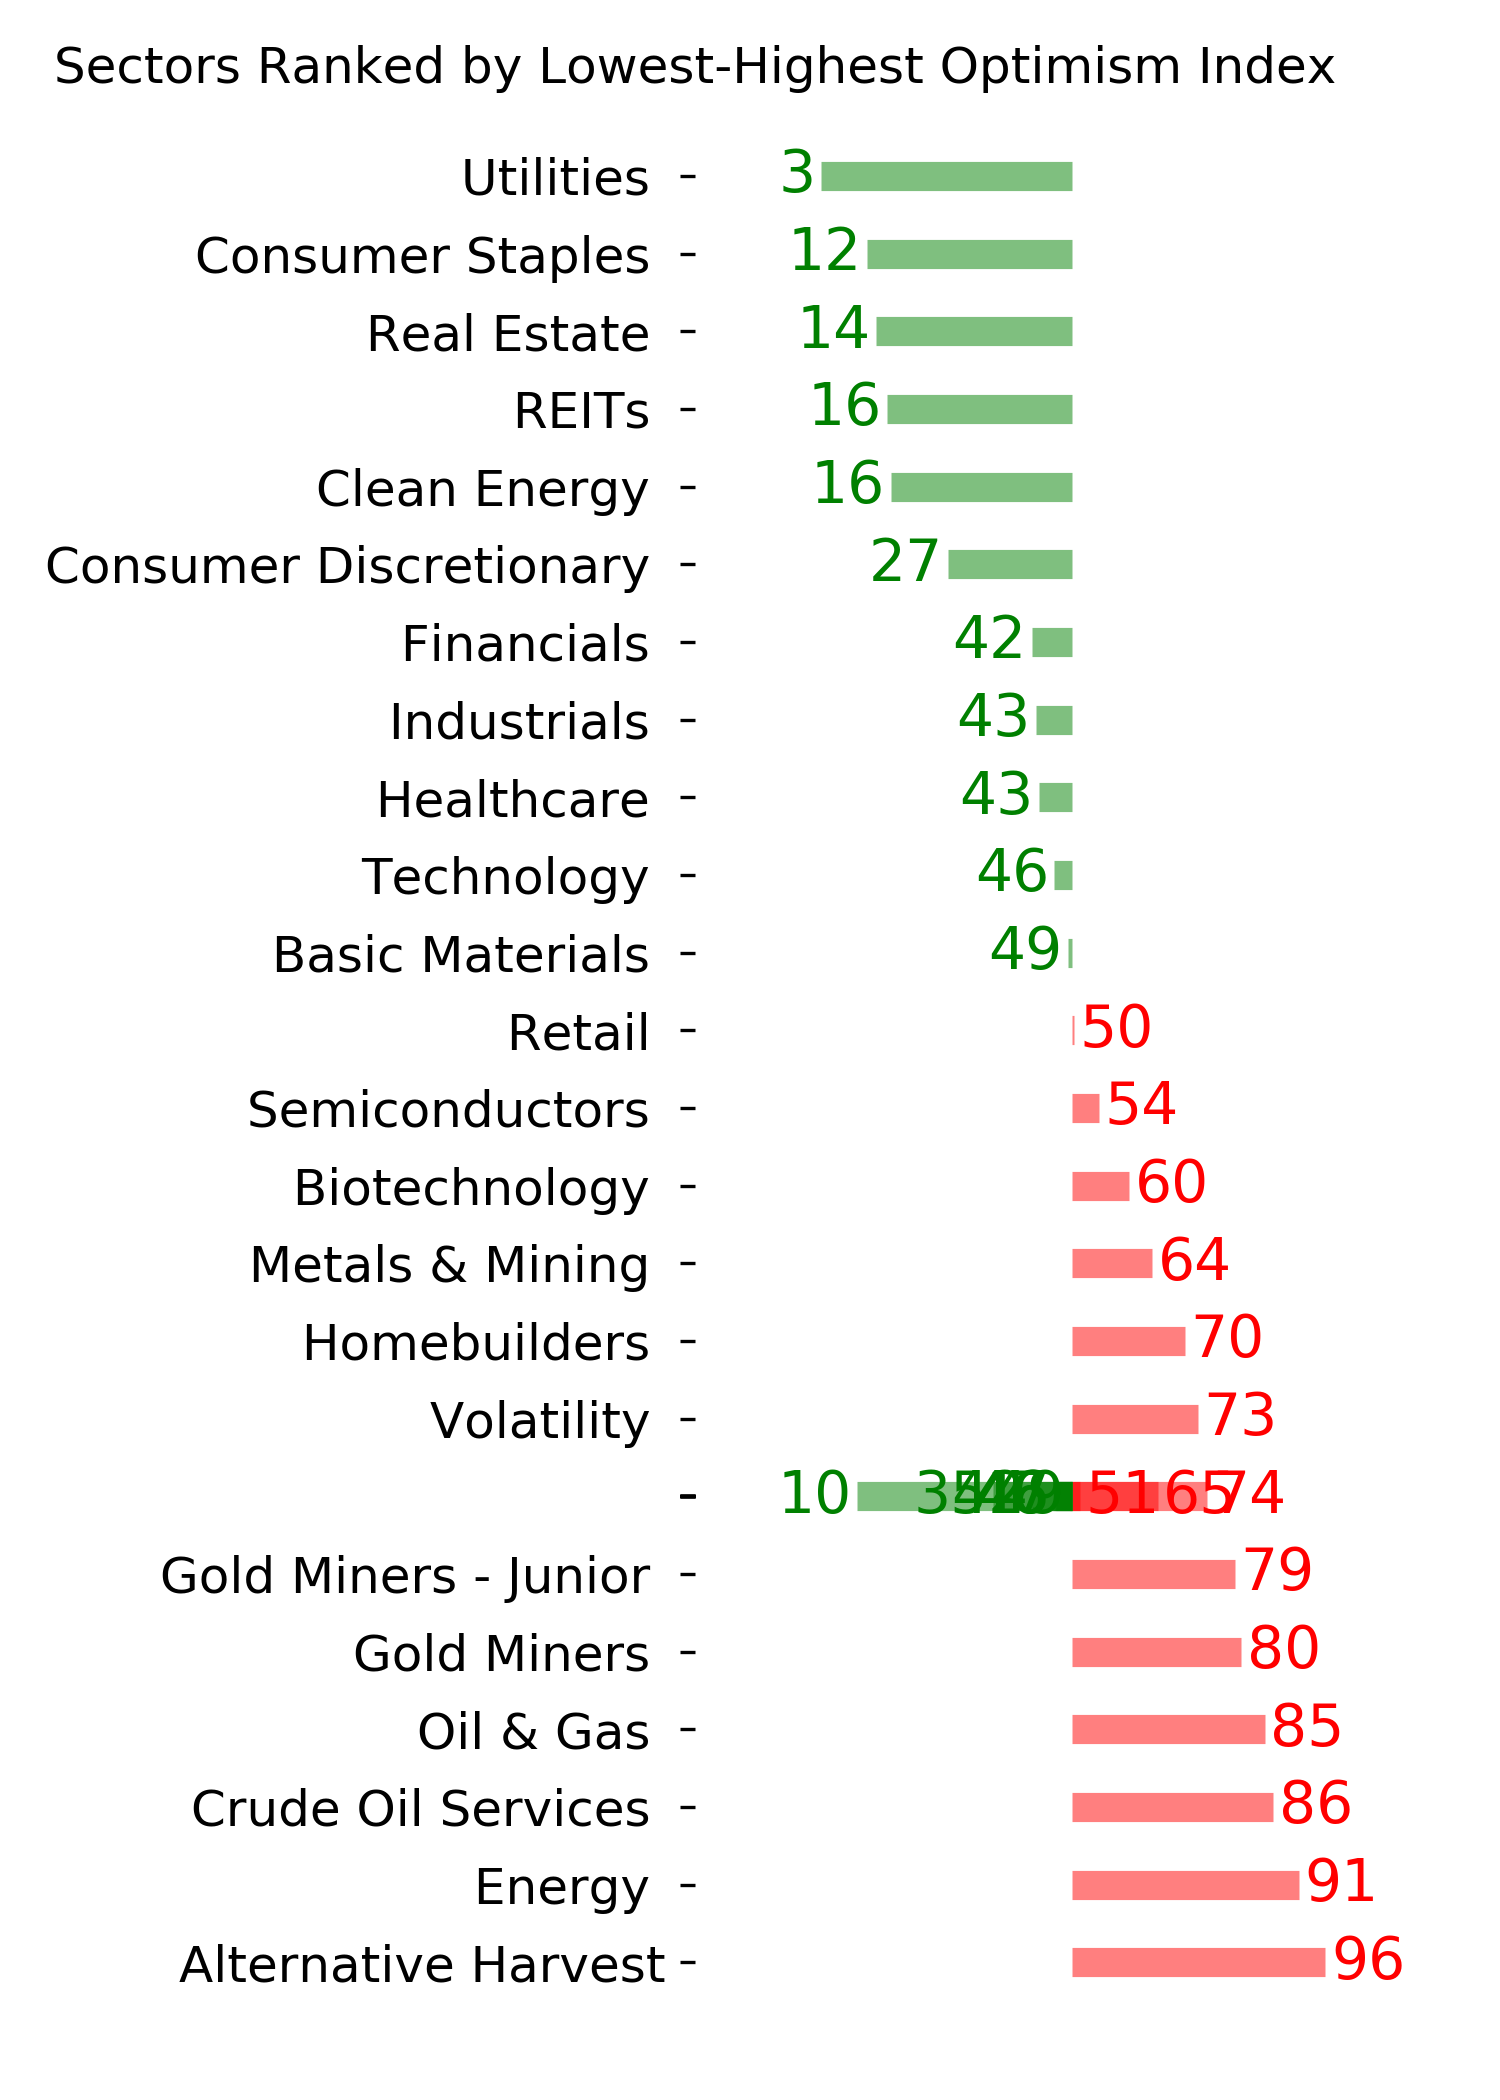
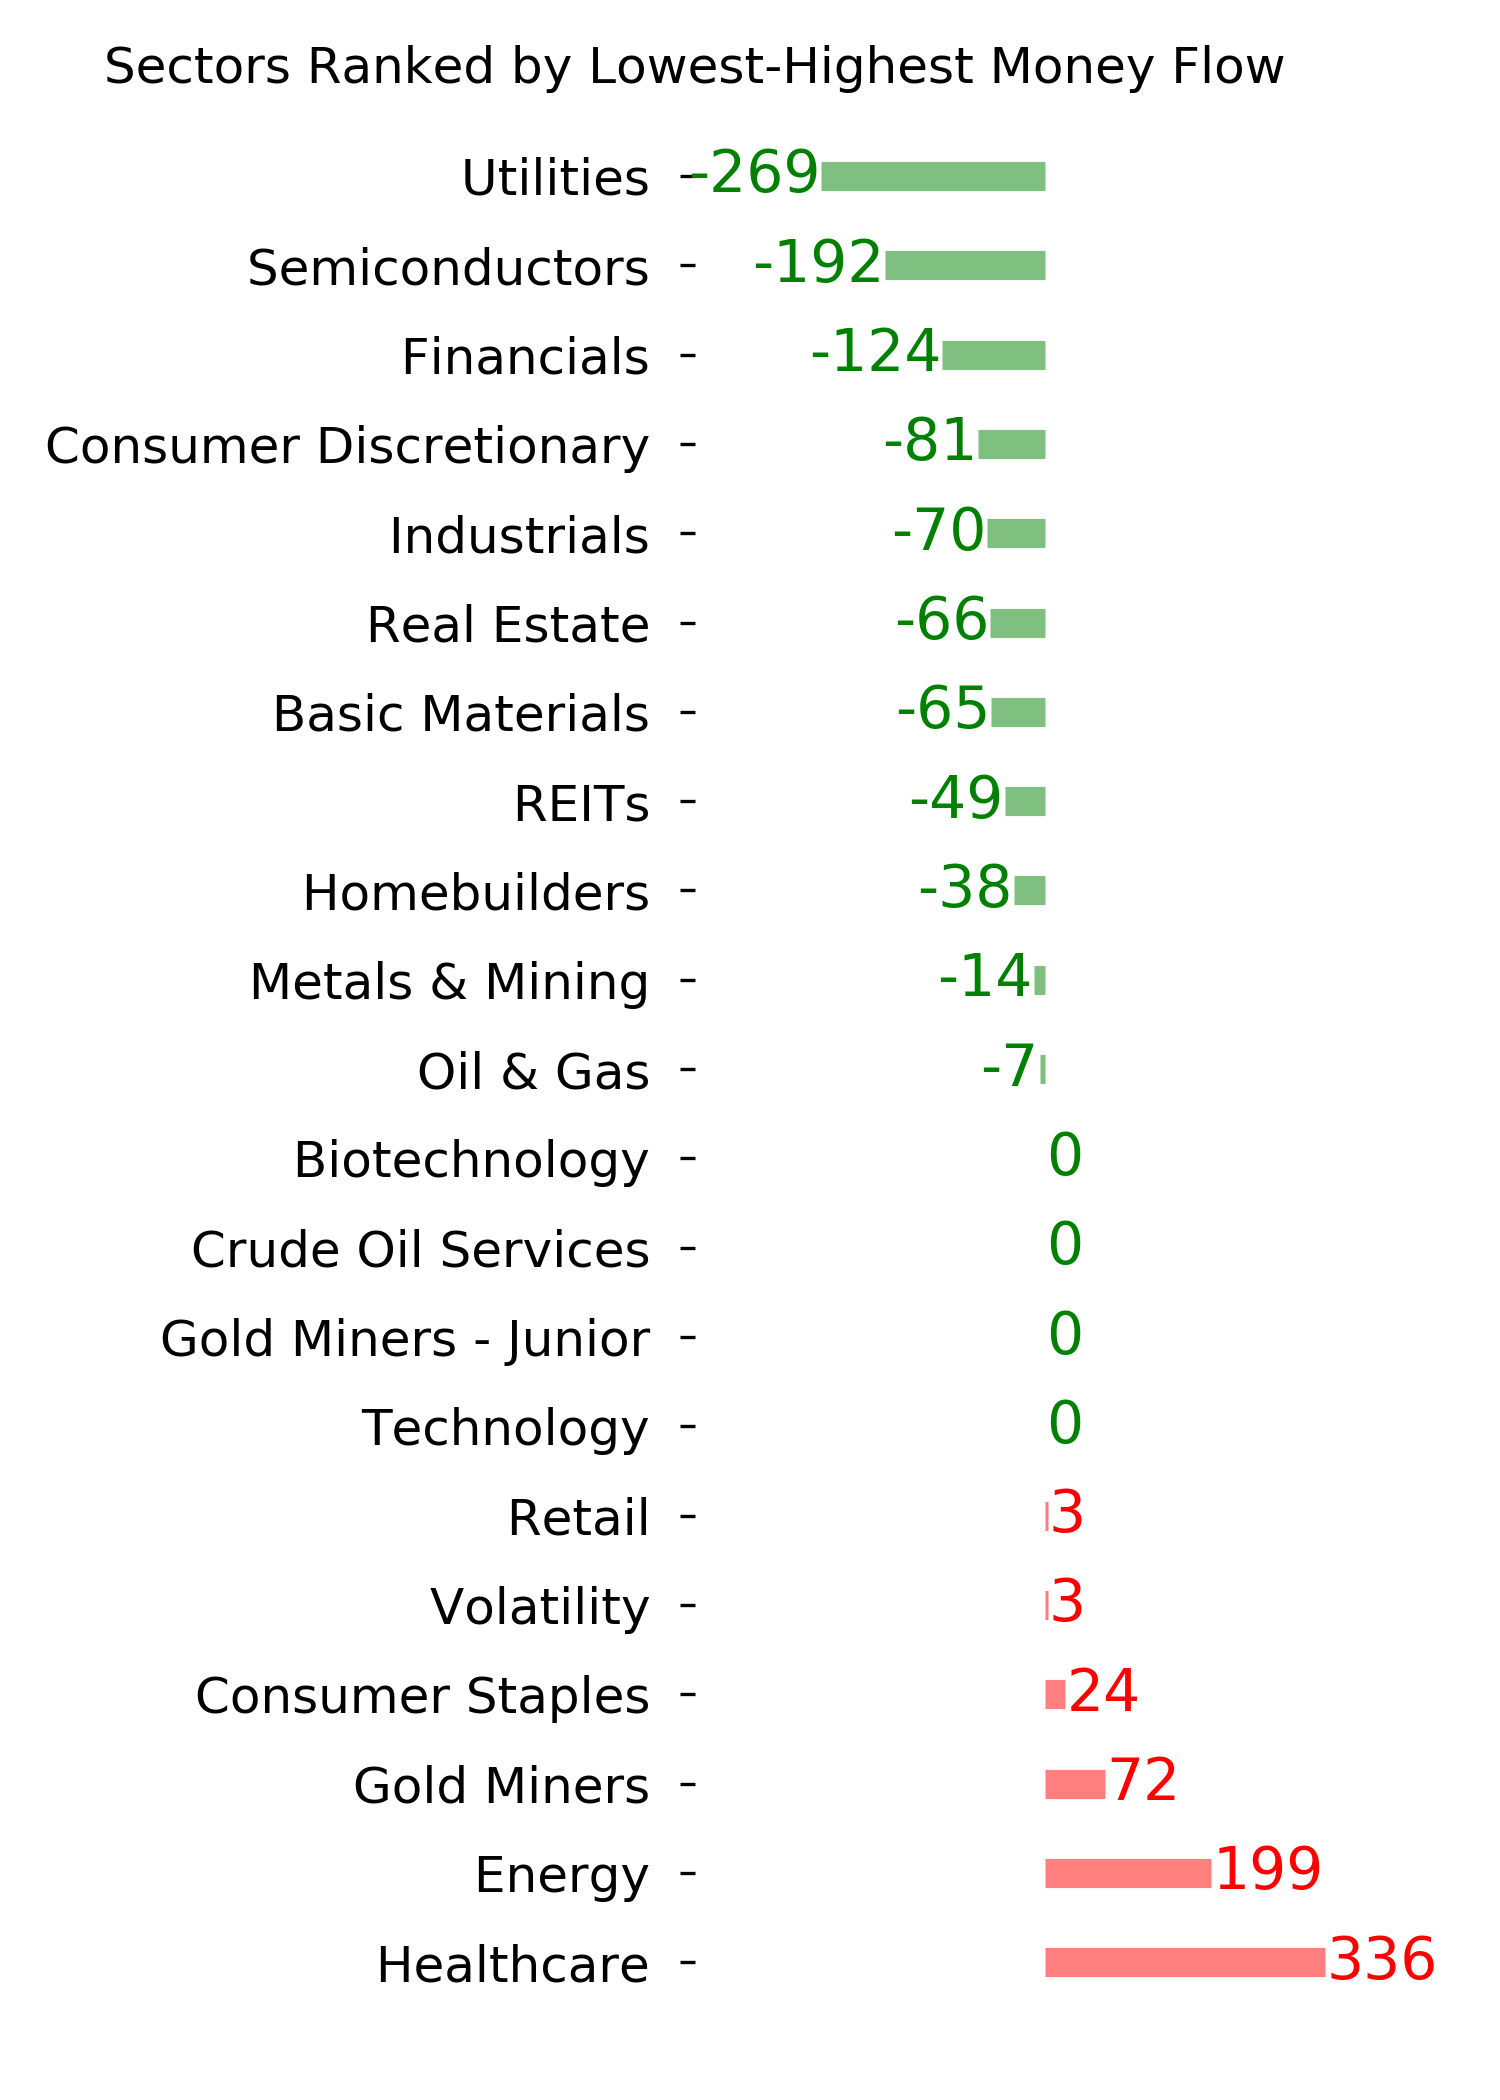
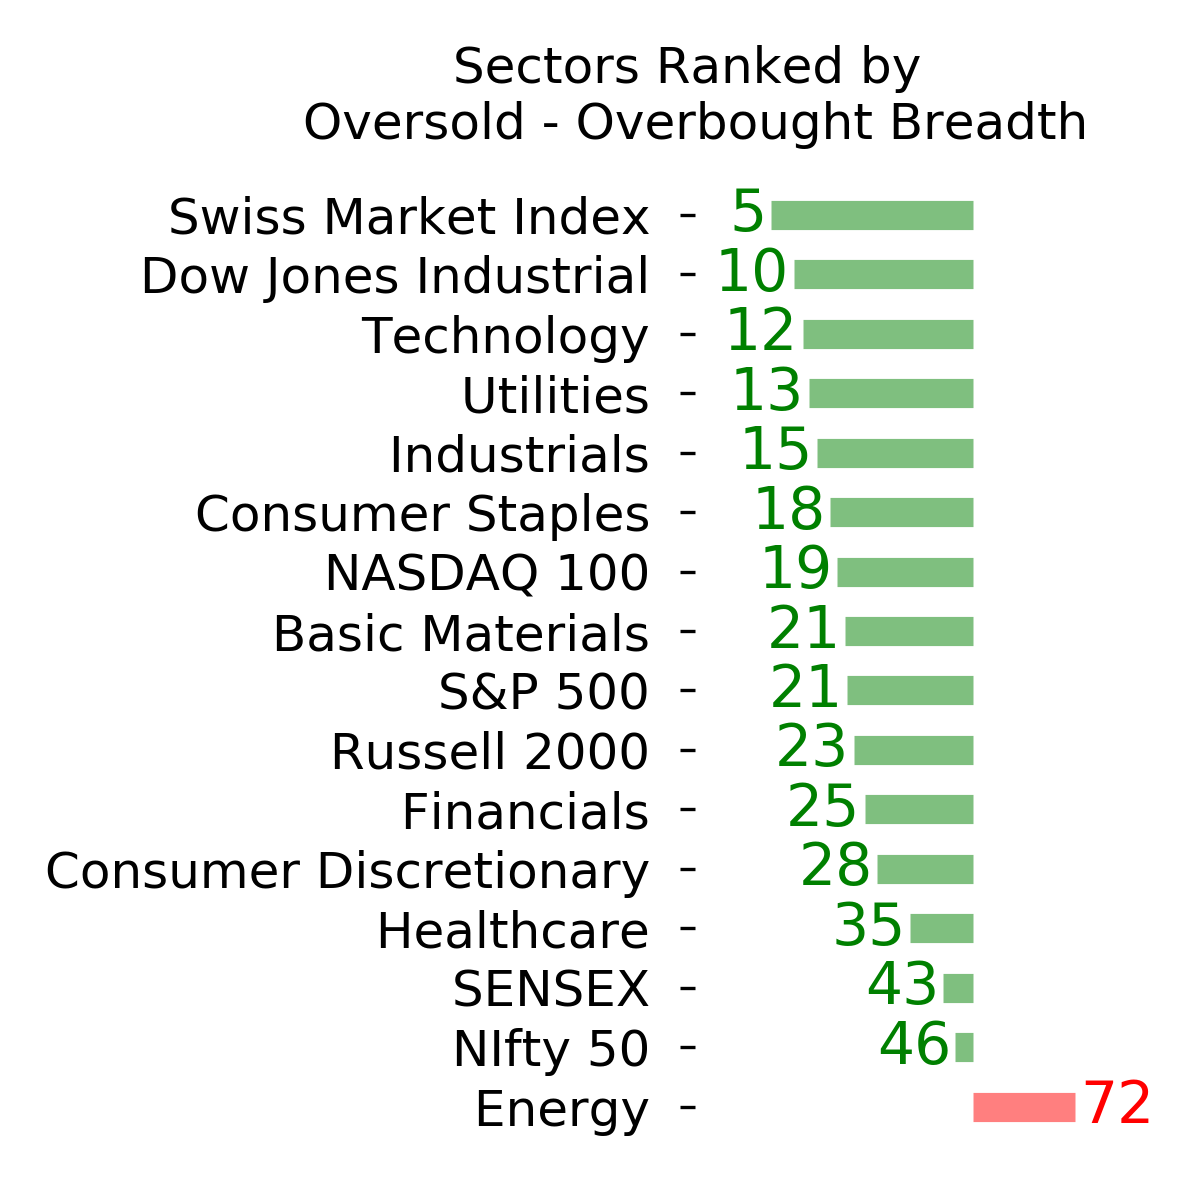
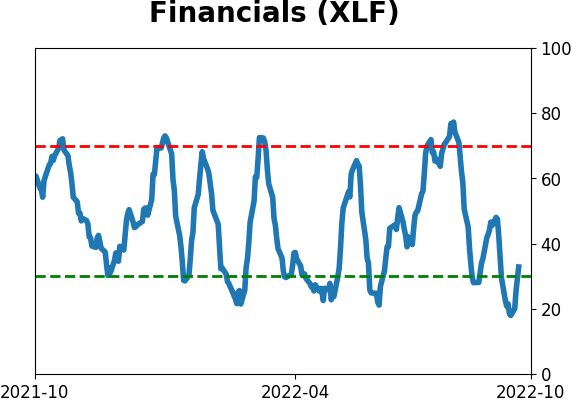
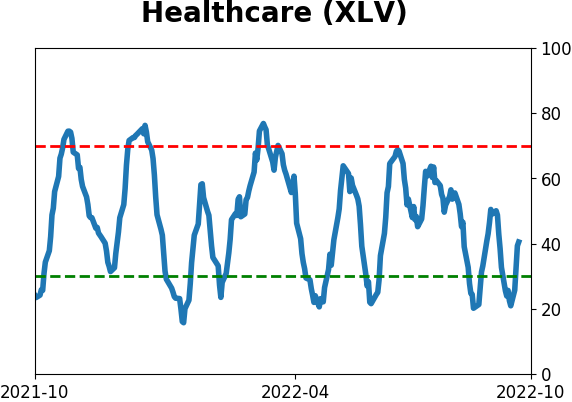
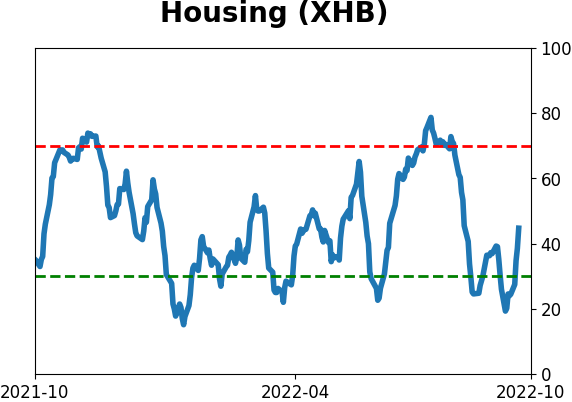
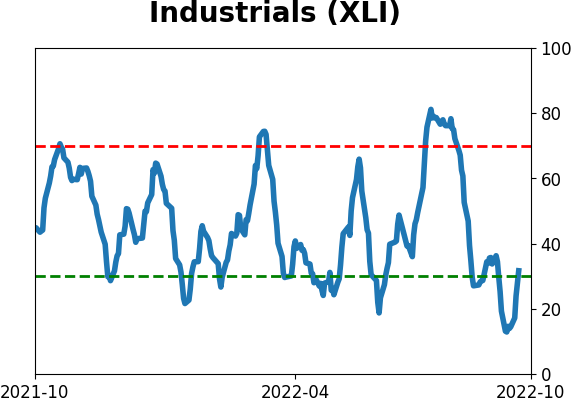
Sector ETF's - 10-Day Moving Average
|
|
|
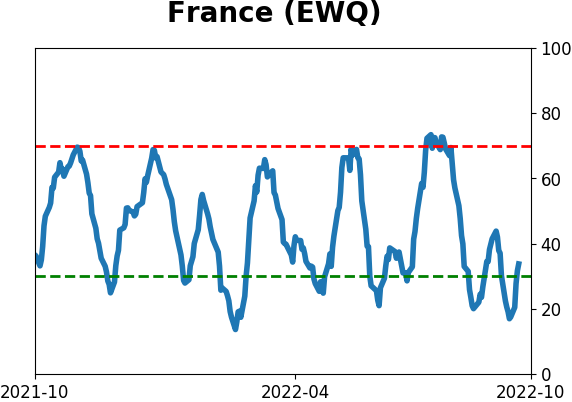
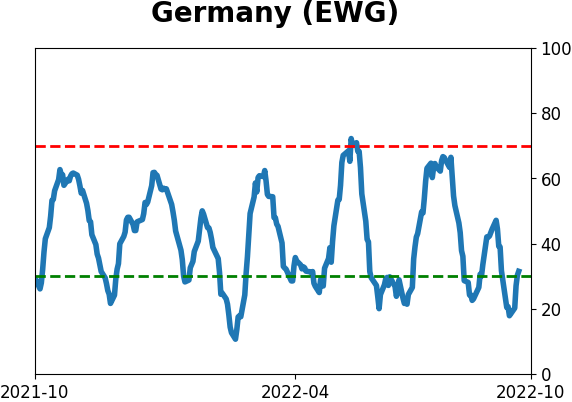
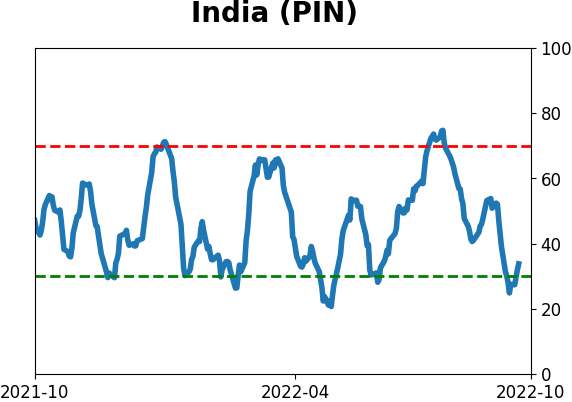
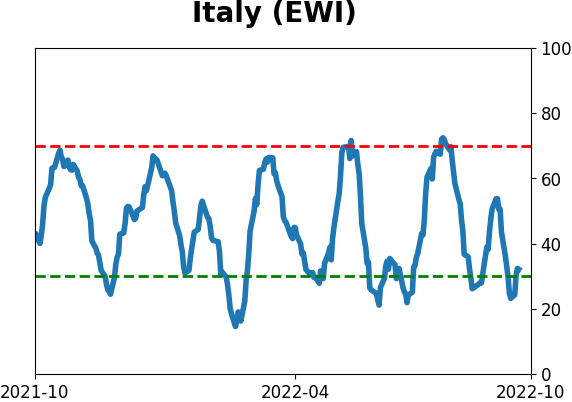
Country ETF's - 10-Day Moving Average
|
|
|
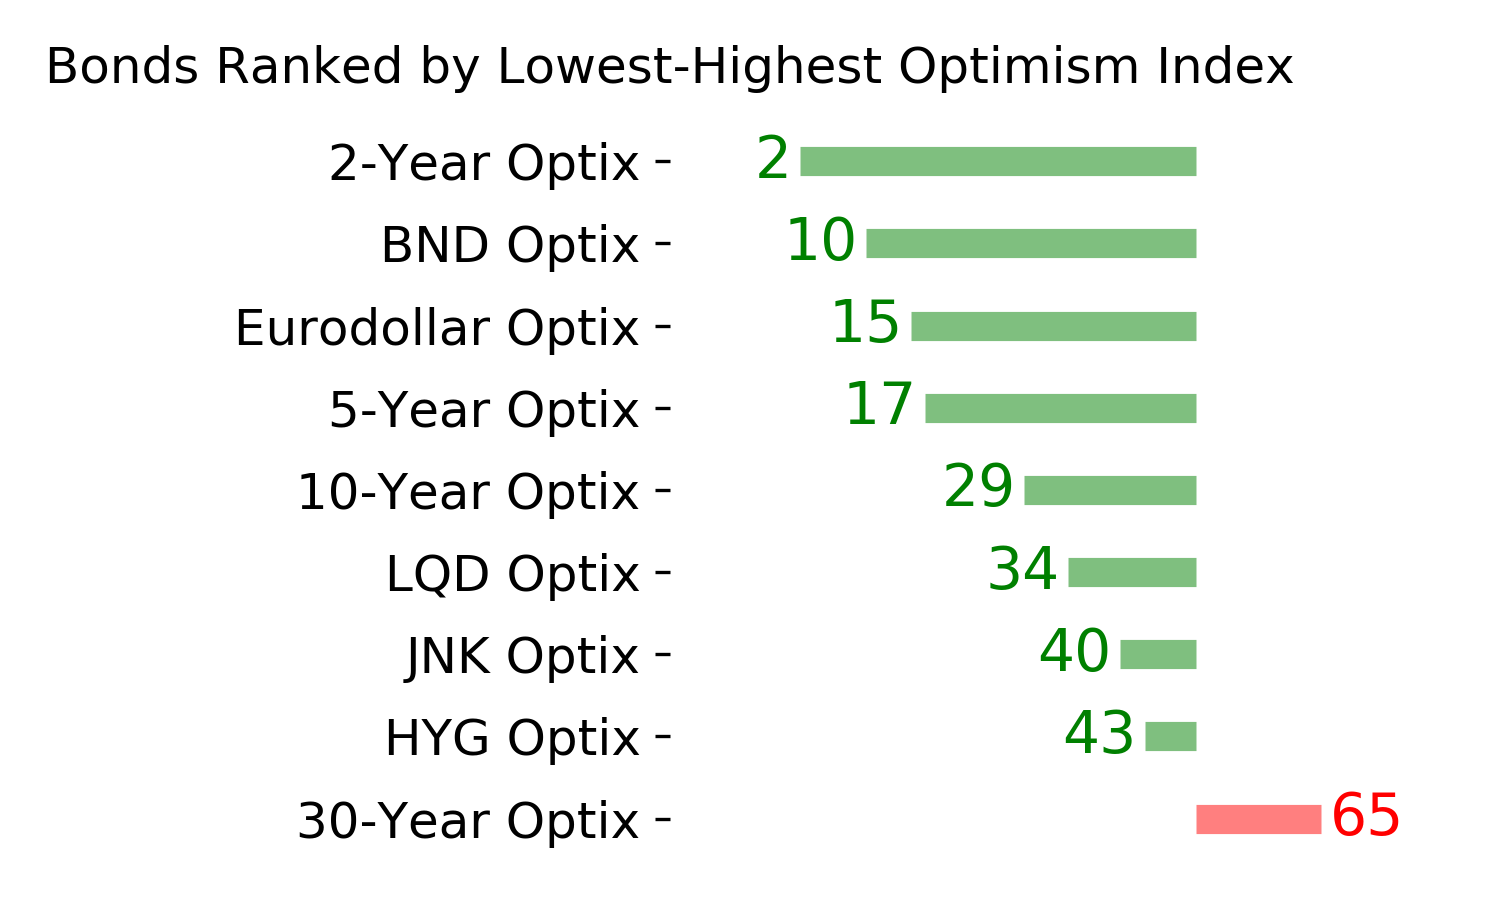
Bond ETF's - 10-Day Moving Average
|
|
|
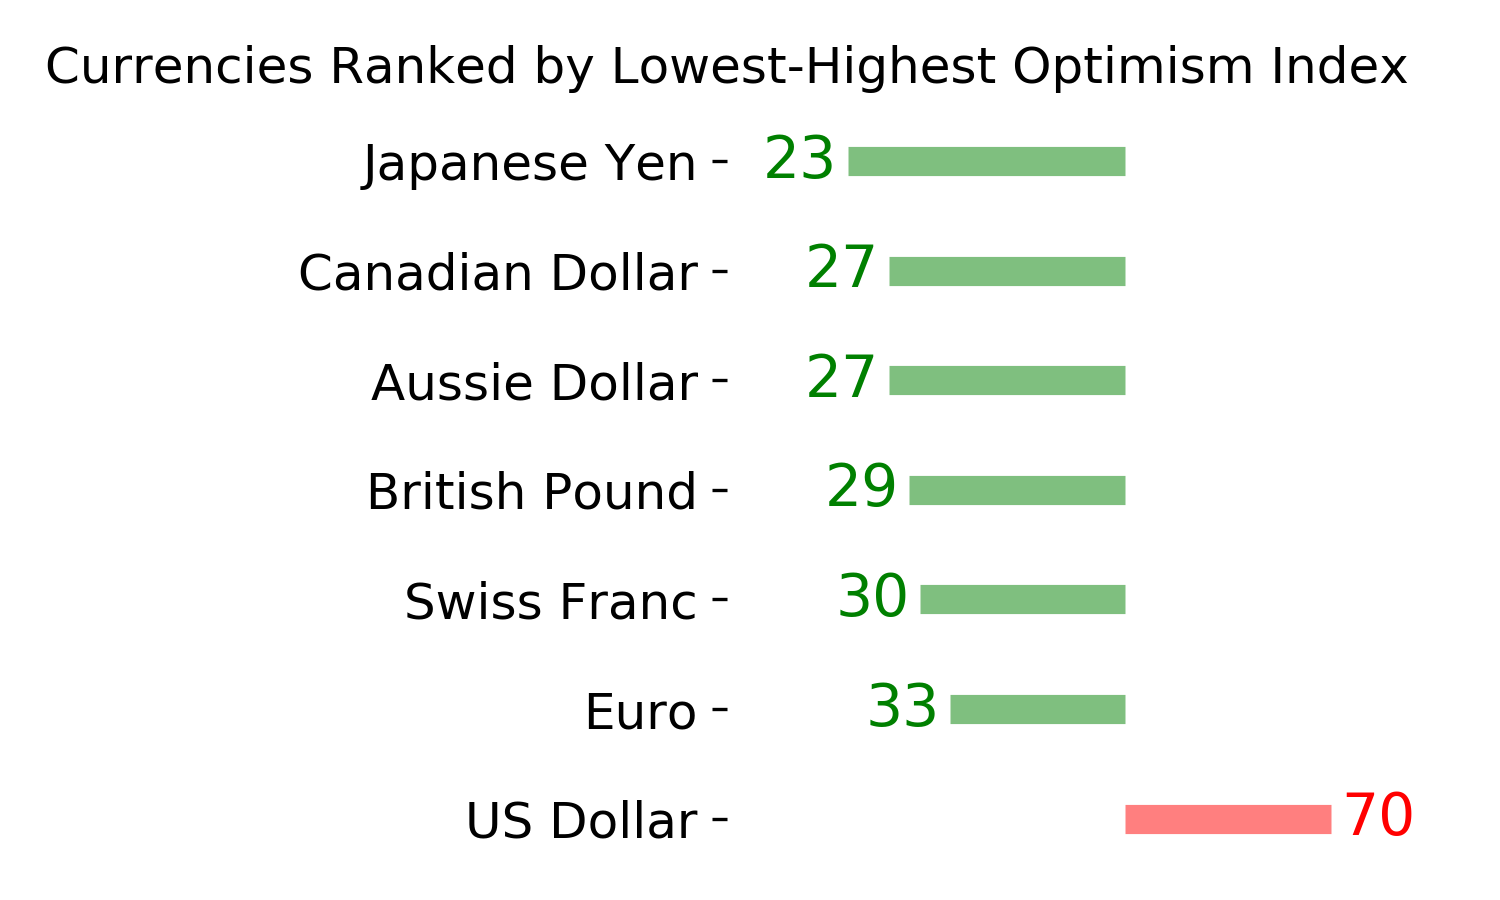
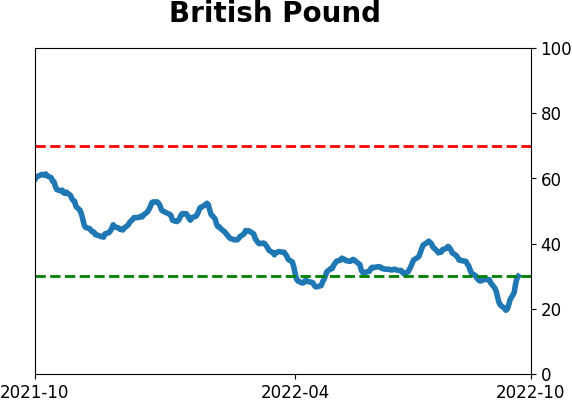
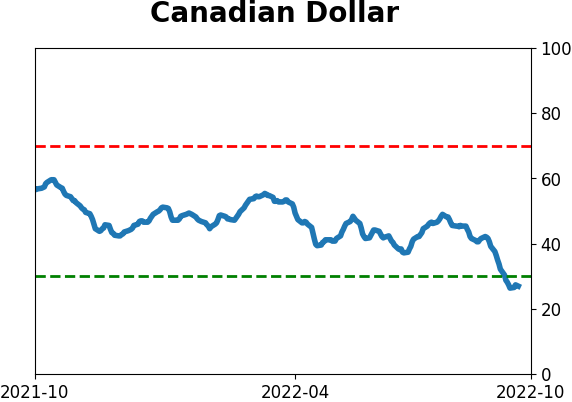
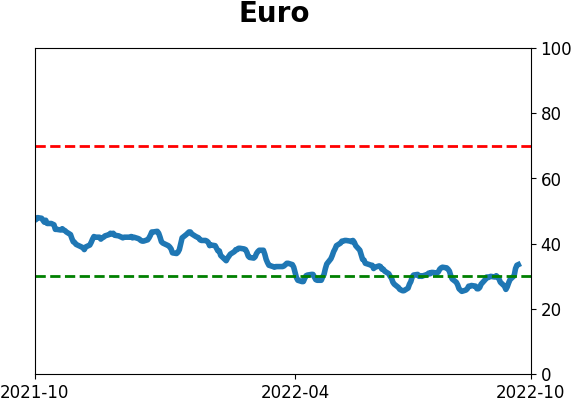
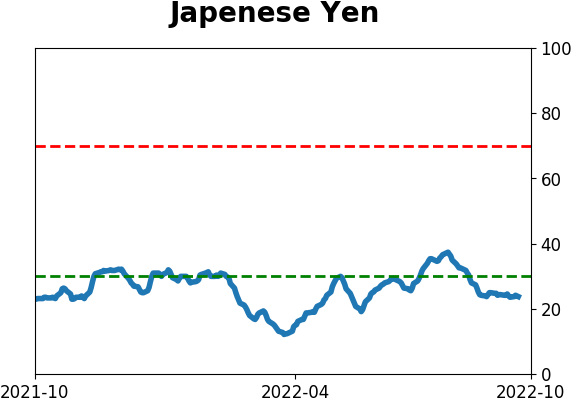
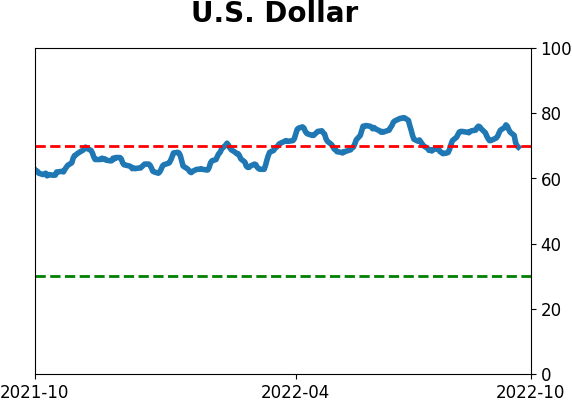
Currency ETF's - 5-Day Moving Average
|
|
|
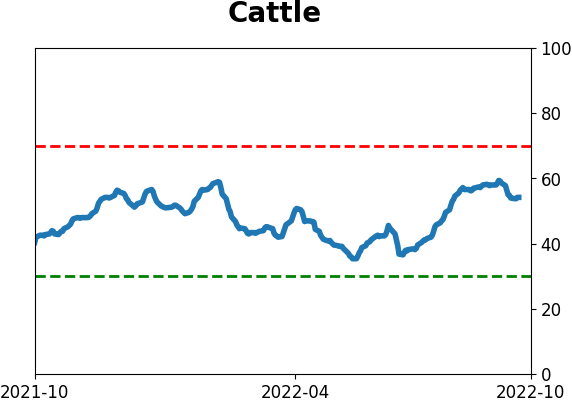
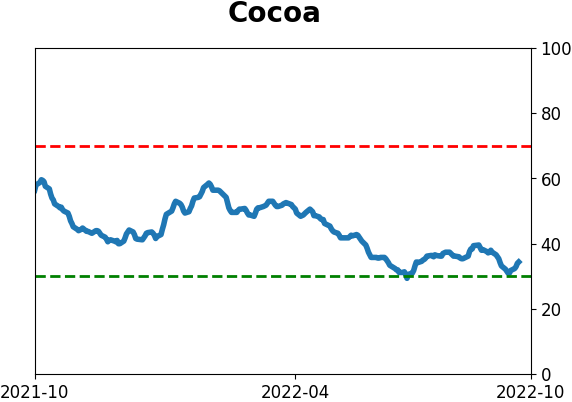
Commodity ETF's - 5-Day Moving Average
|
|