Headlines
|
|
A historic plunge in crude oil:
Crude oil plunged by more than -10% over five sessions from a 1-year high. Similar declines point toward the likelihood of the negative momentum persisting for the time being, with the prospect of a rebound in the upcoming months. However, the long-term outlook suggests oil could be in the early stages of a more significant topping pattern.
|
Smart / Dumb Money Confidence
|
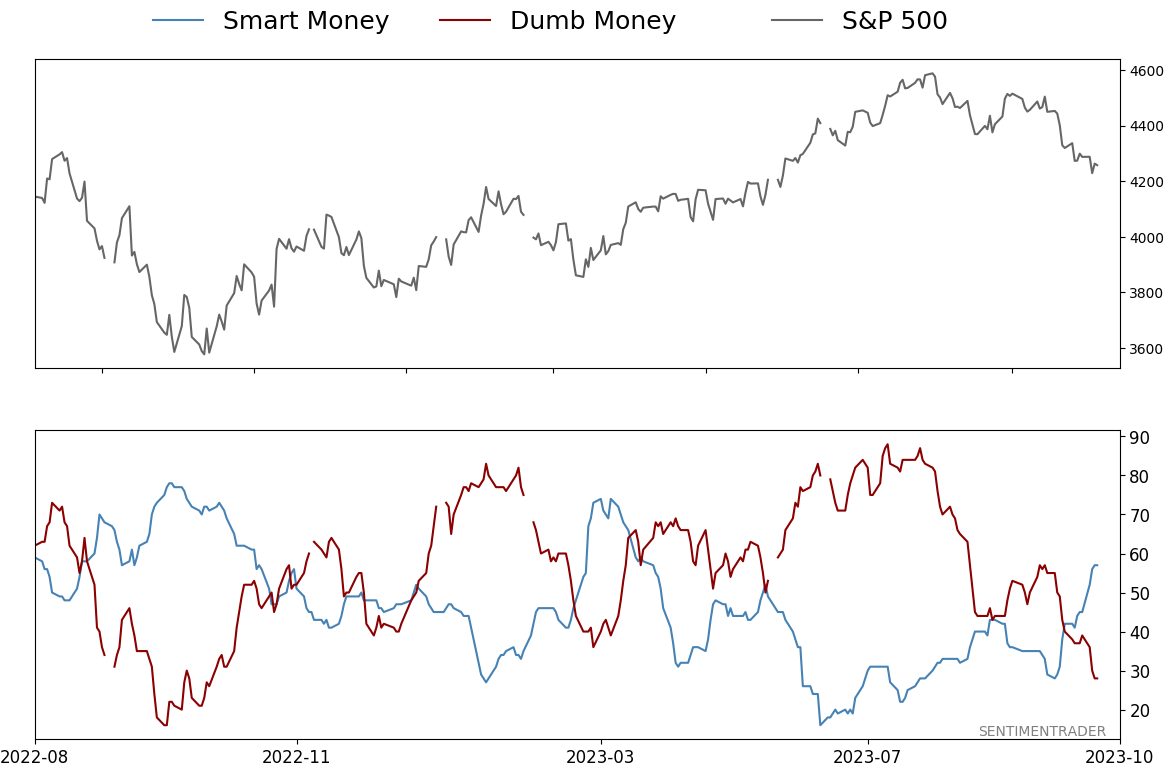
Smart Money Confidence: 57%
Dumb Money Confidence: 28%
|
|
Risk Levels
Stocks Short-Term

|
Stocks Medium-Term
|
|
Bonds
|
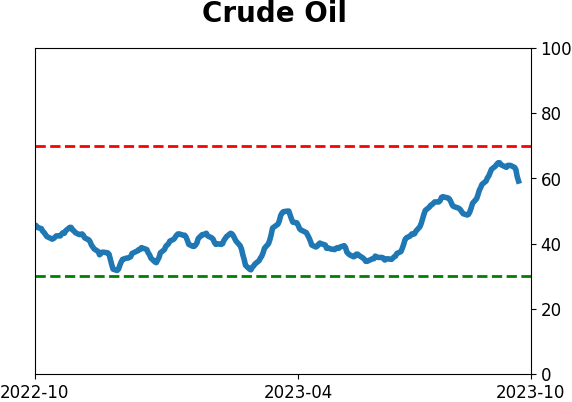
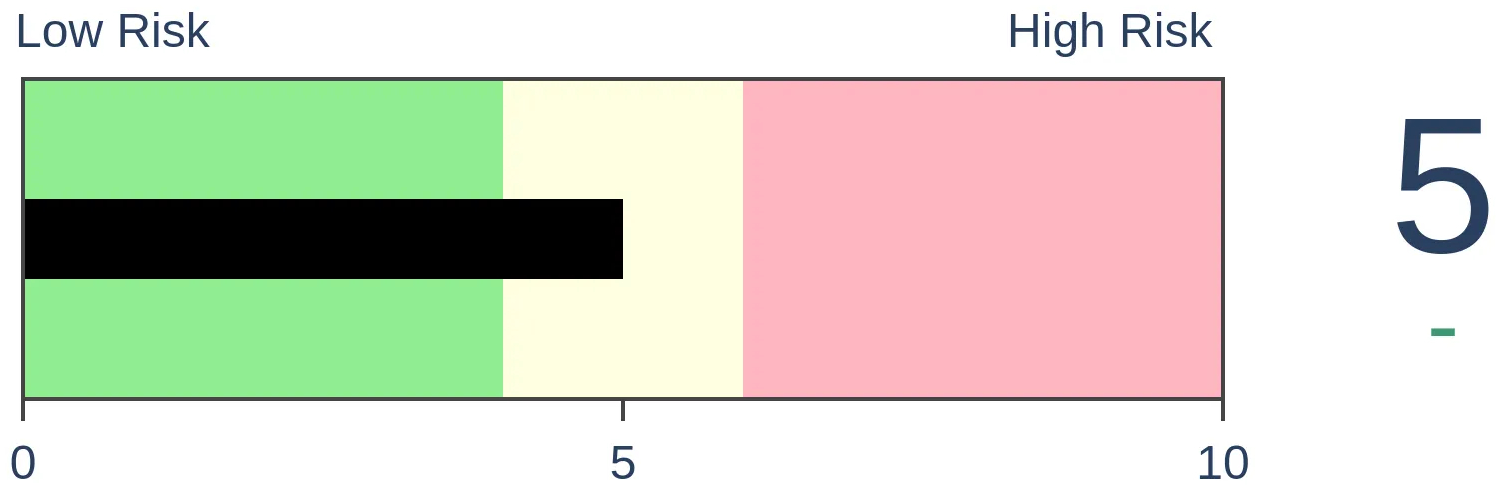
Crude Oil
|
|
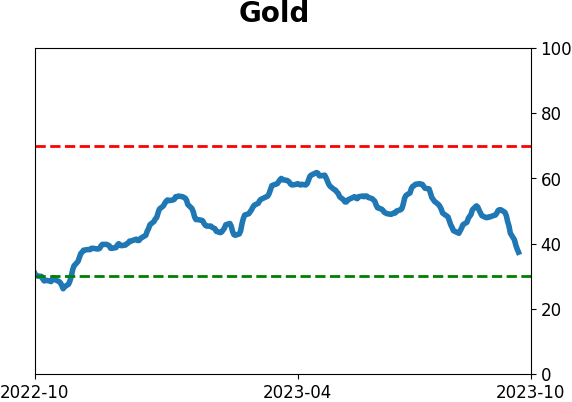
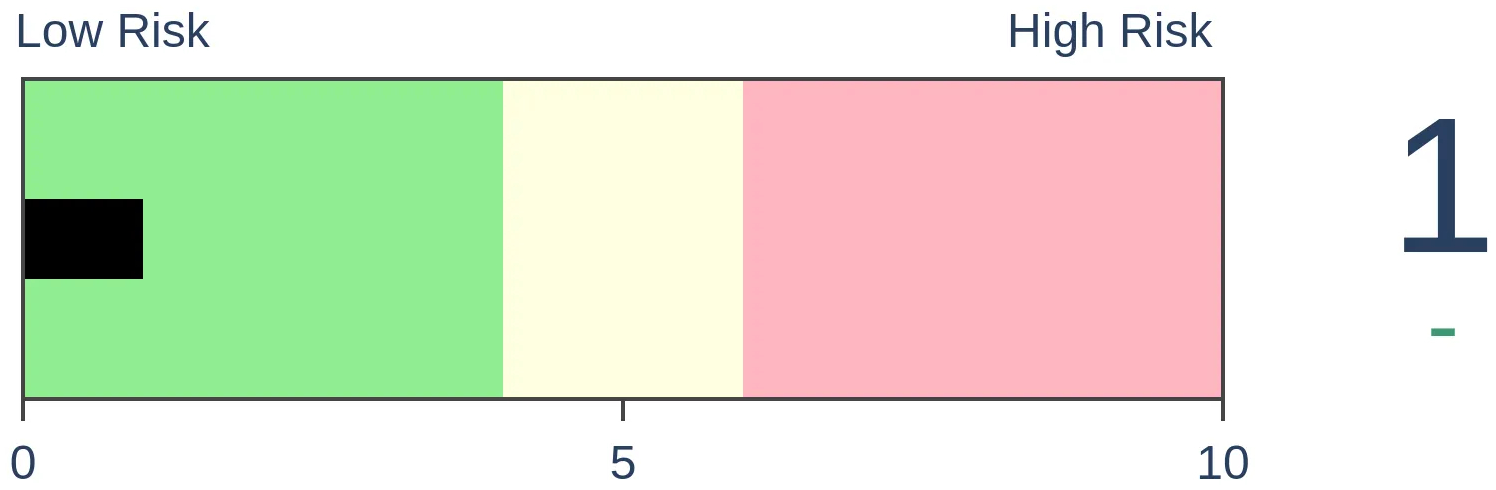
Gold

|
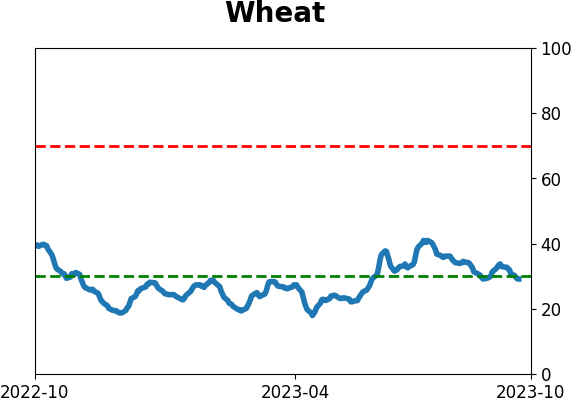
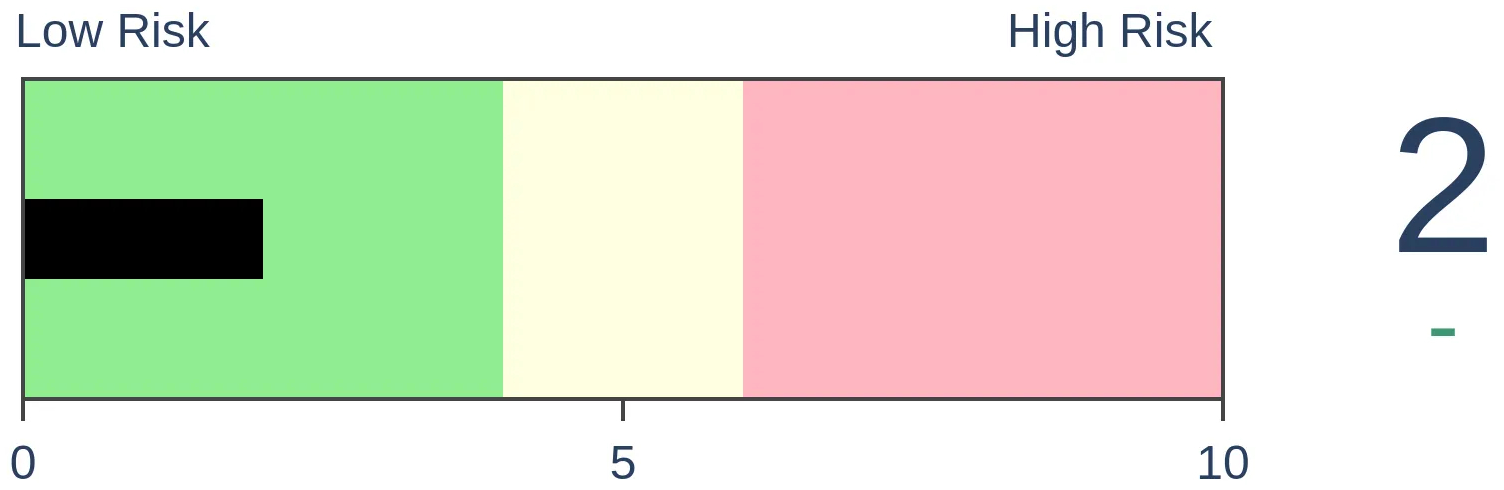
Agriculture

|
|
Research
By Dean Christians
BOTTOM LINE
Crude oil plunged by more than -10% over five sessions from a 1-year high. Similar declines point toward the likelihood of the negative momentum persisting for the time being, with the prospect of a rebound in the upcoming months. However, the long-term outlook suggests oil could be in the early stages of a more significant topping pattern.
FORECAST / TIMEFRAME
None
|
Key points:
- Crude oil plunged by more than -10% over five sessions from a 1-year high
- Similar patterns led to downside follow-through over the subsequent four sessions, followed by a rebound
- Remarkably, the energy sector did not follow crude oil's descent and bounced back with a vengeance
Does the swift decline in crude oil foreshadow a significant top?
In recent research reports, we shared several studies suggesting caution for crude oil as the commodity was overbought, exhibiting bullish optimism, and the curve was in backwardation.
In overbought markets characterized by optimism, it's not uncommon for a catalyst to emerge, causing traders to doubt their bullish outlook, ultimately leading to a price reversal.
For only the 9th time since 1983, crude oil futures declined more than -10% over five sessions from a 1-year high.
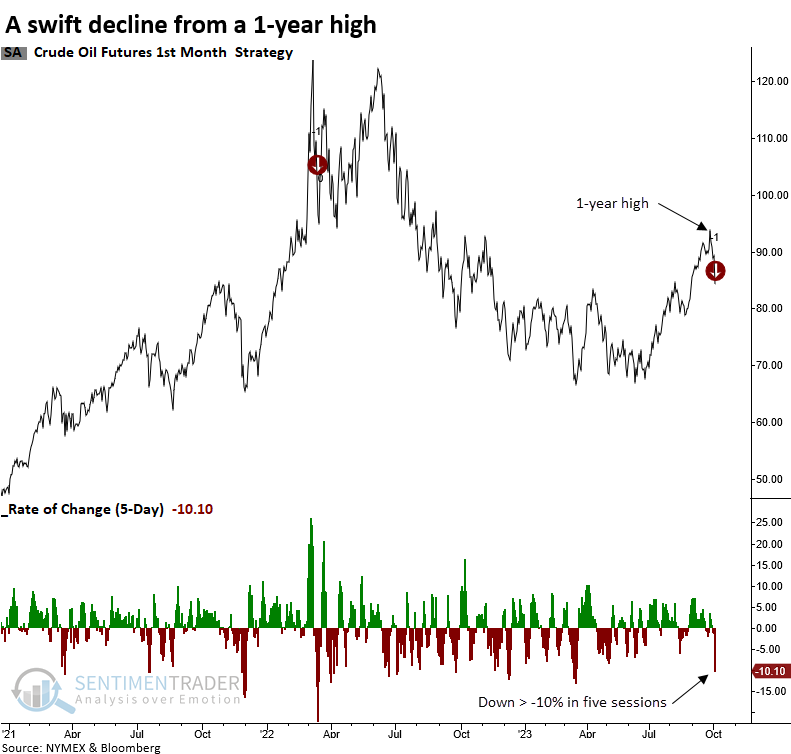
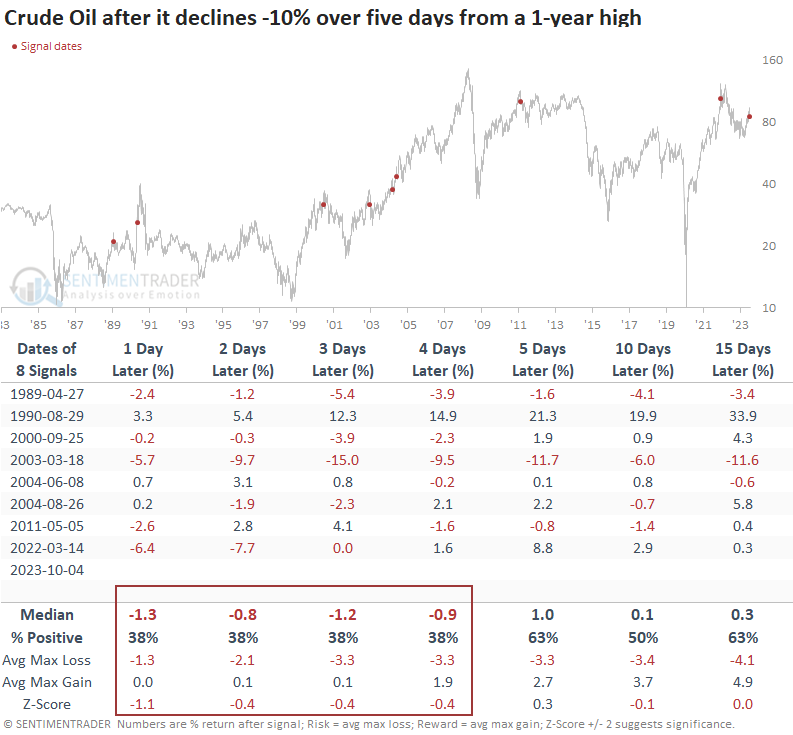
Similar momentum led to downside follow-through
When crude oil experiences a swift decline from a high, like now, the downside price momentum tends to persist over the next four trading sessions. Over that same time frame, the commodity was lower at some point in 7 out of 8 previous cases.
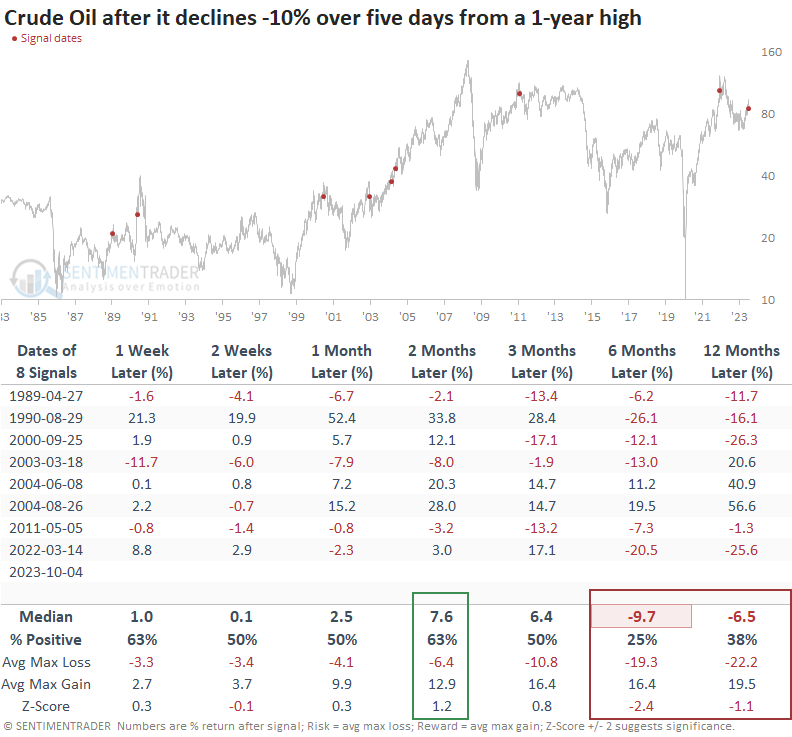
Over longer time horizons, crude oil tends to bounce back over the next two months. However, the six and twelve-month periods suggest one should be mindful that the violent move down from a high could foreshadow a more significant topping pattern.
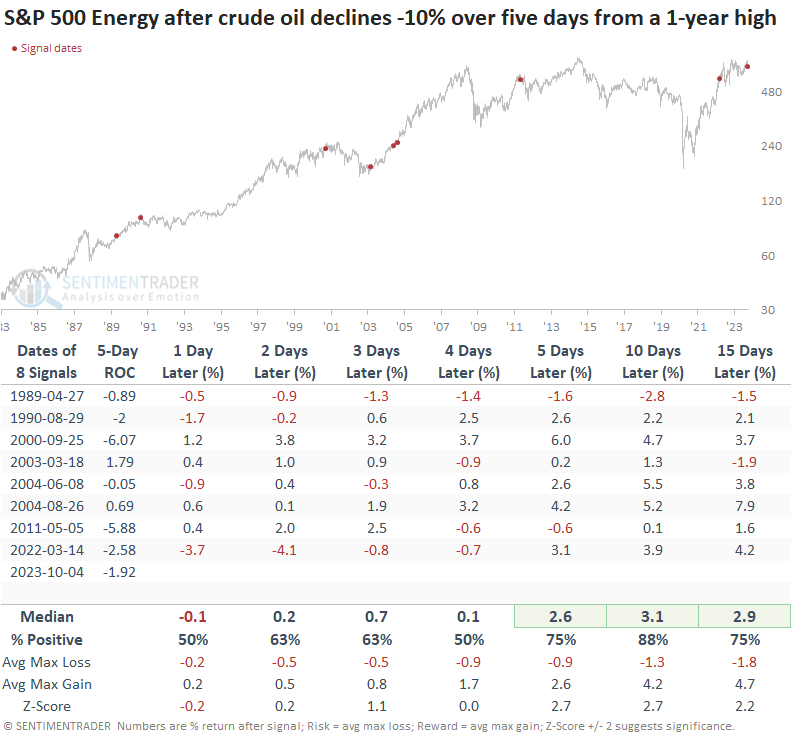
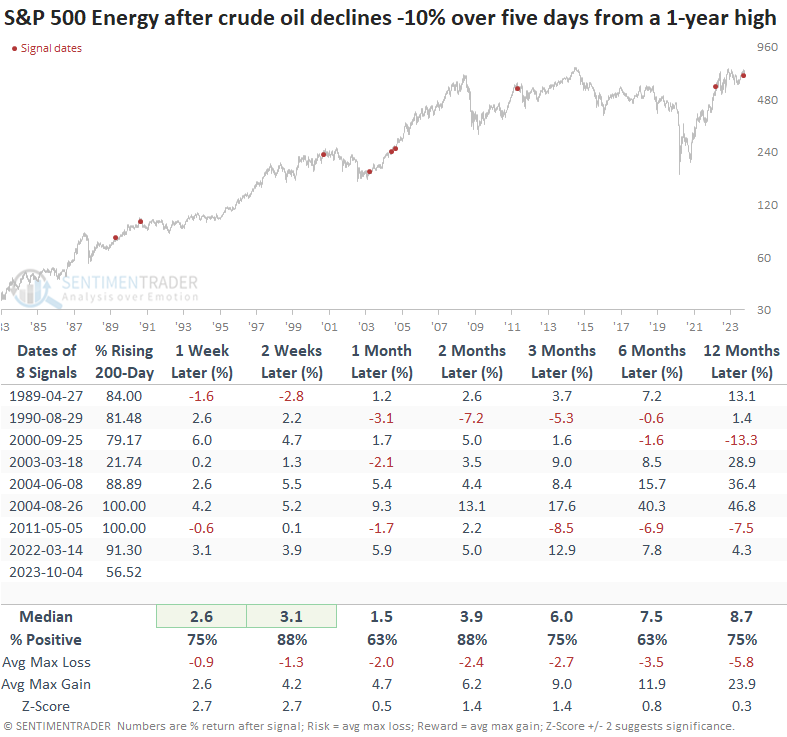
Energy stocks buck the trend
Contrary to the drop in oil prices, the S&P 500 Energy sector remains resilient over the next four sessions, with 6 out of 8 precedents yielding a positive return at some point during this period. What's of greater significance is the sector's impressive performance in the subsequent one to three weeks.
Except for 2000 and 2011, the sector's 5-day rate of change proved to be surprisingly durable in light of the sharp oil price decline.
While the swift decline from a high tends to create an unfavorable long-term outlook for crude oil, that's not the case for energy stocks. In most precedents, a high percentage of energy stocks maintained a rising 200-day average, indicating a bullish long-term trend backdrop.
What the research tells us...
Crude oil experienced a swift decline over the last five sessions from a 1-year high. Similar patterns suggest further downside over the subsequent four sessions. Once the downside momentum subsides, history suggests oil could rebound. However, we need to be mindful that any rally could be within the context of a more broad topping process. Regardless of the price action in oil, the energy sector tends to decouple from the commodity, displaying a bullish outlook.
Indicators at Extremes
Phase Table
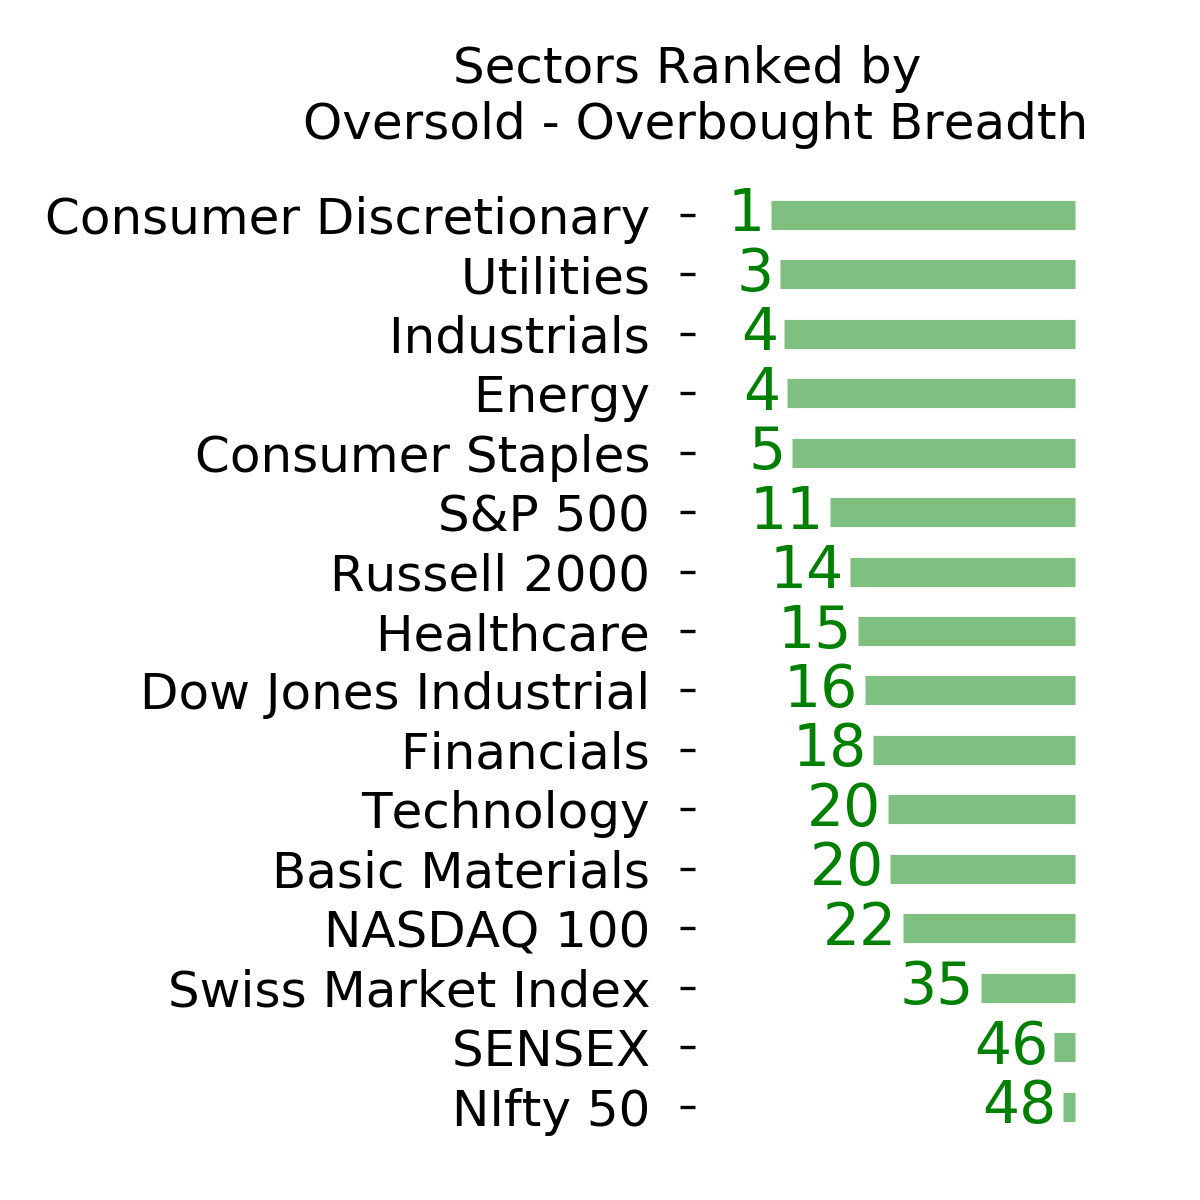
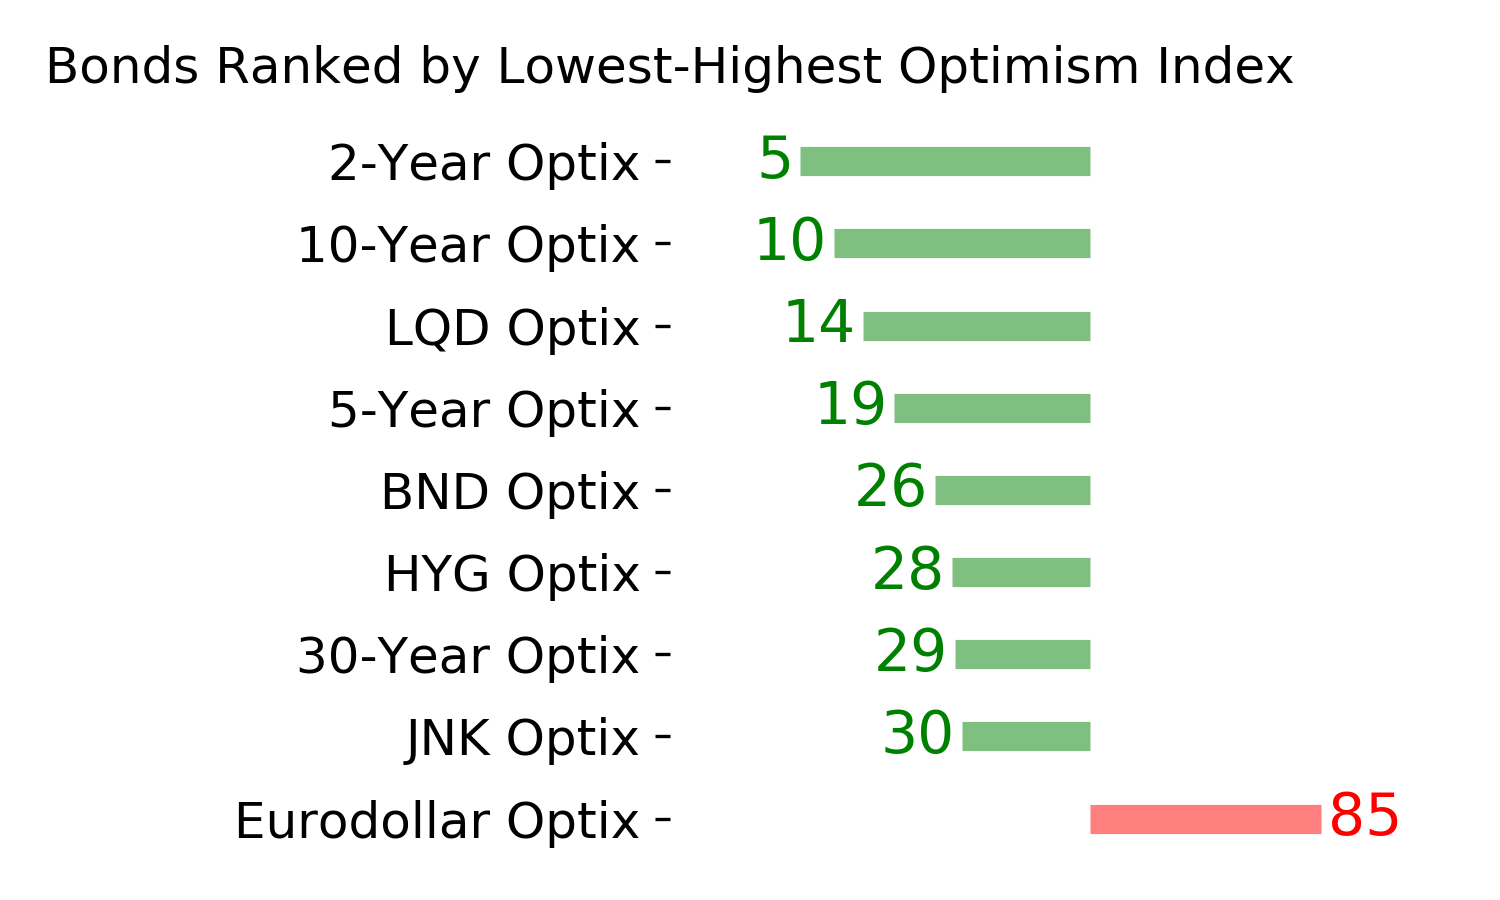
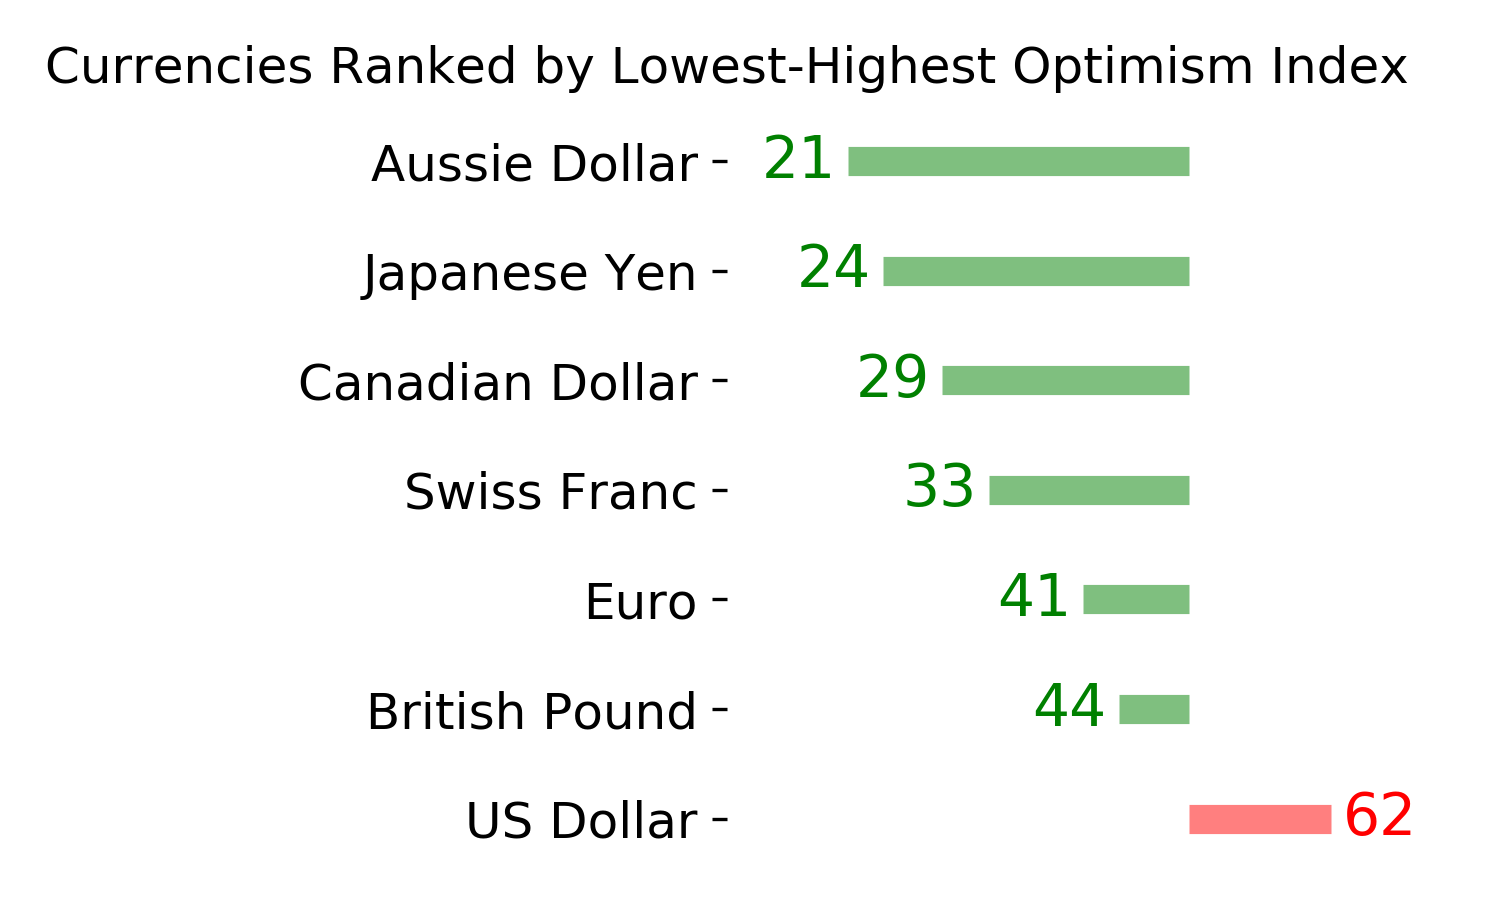
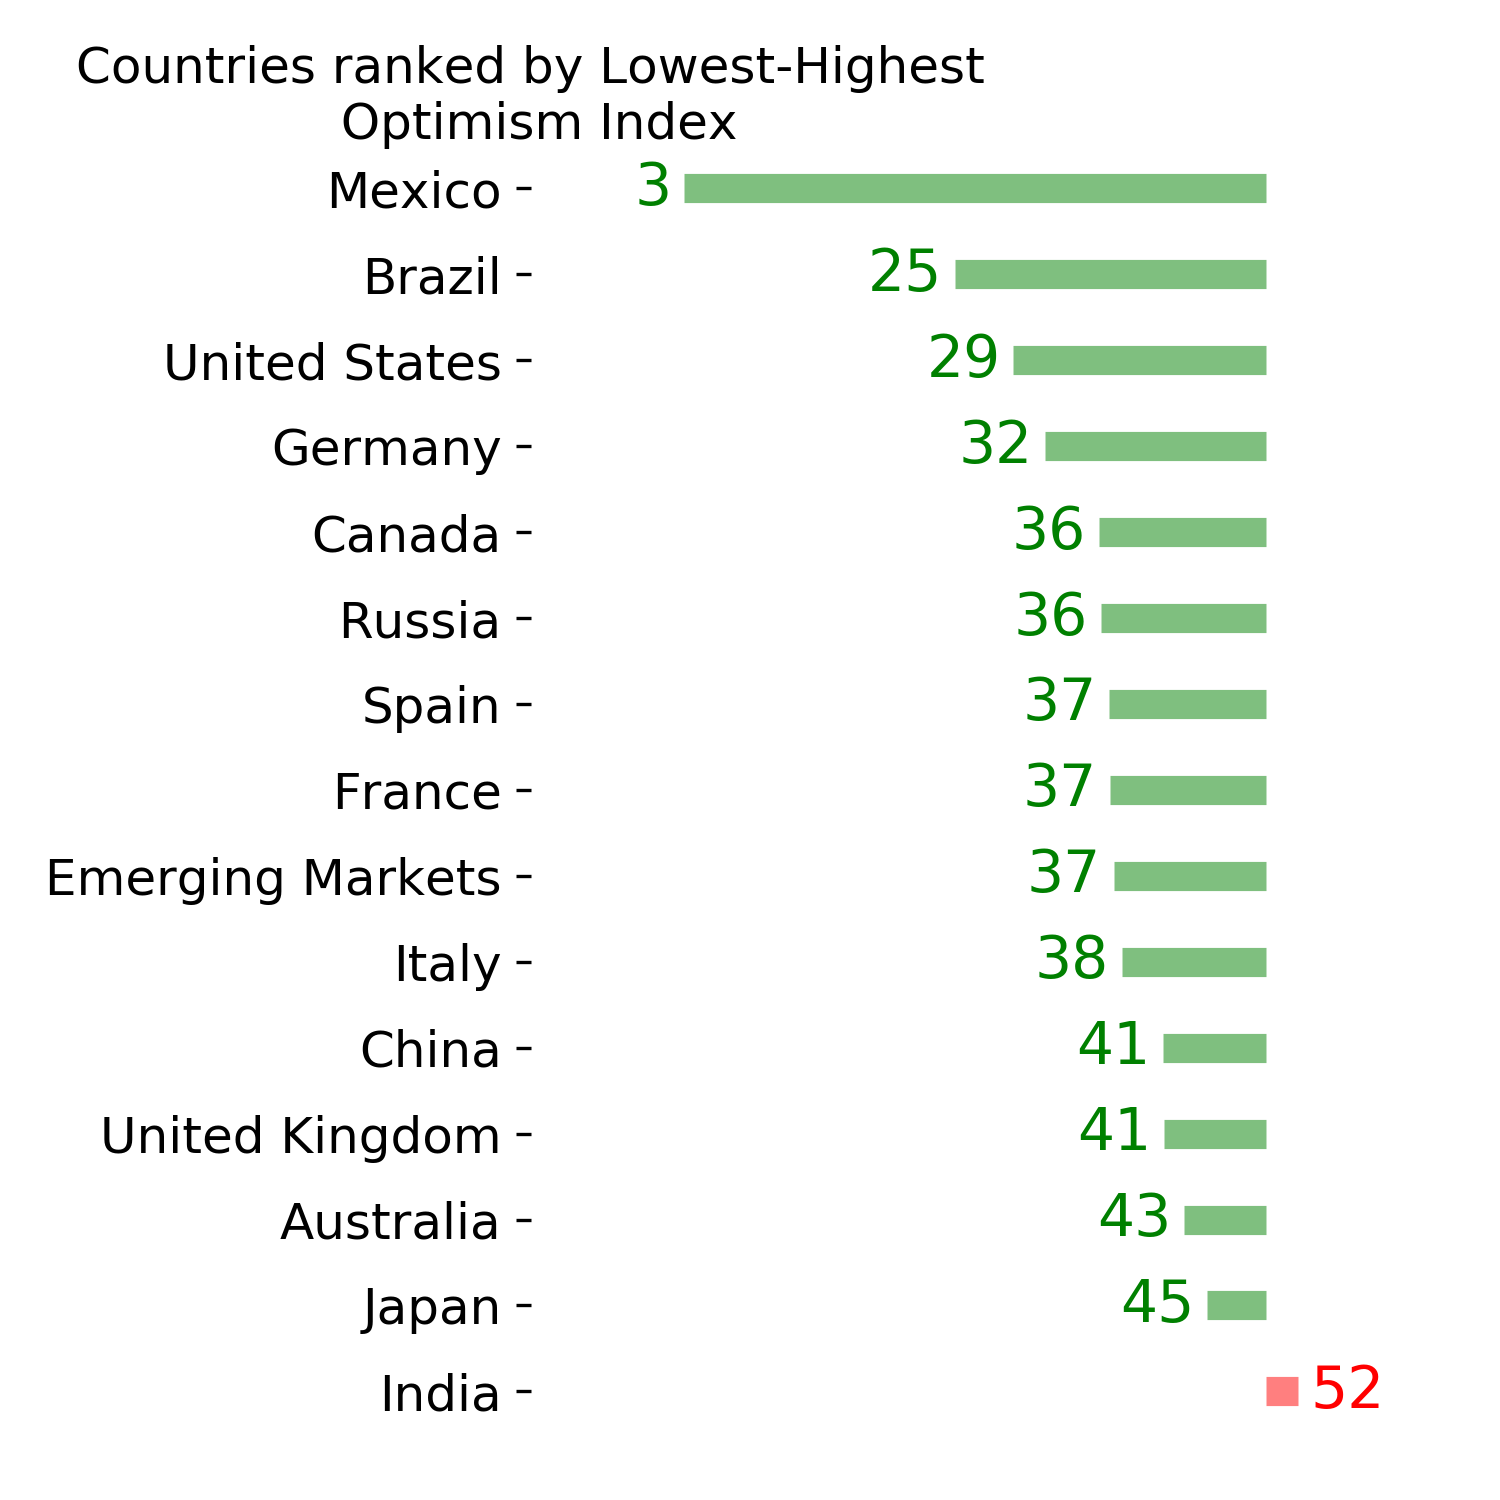
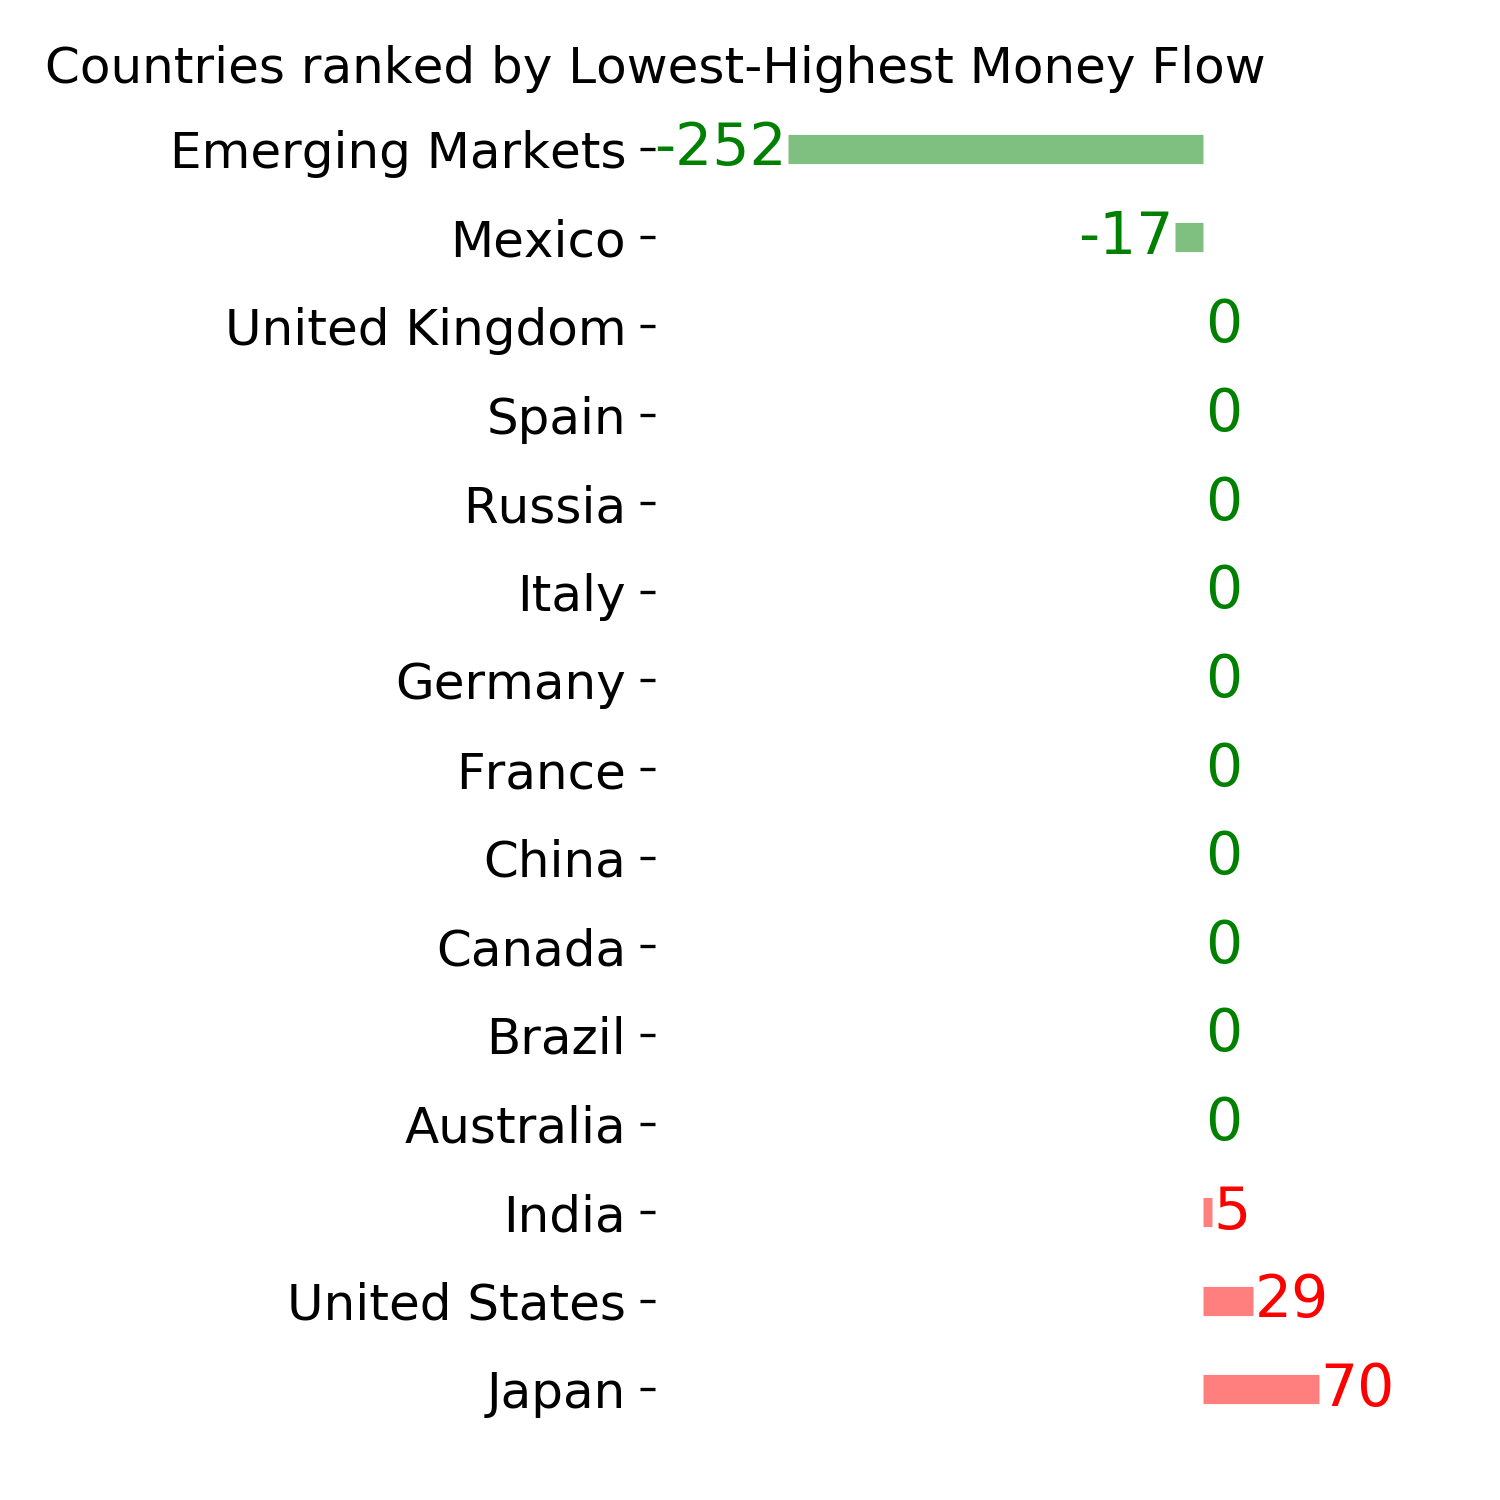
Ranks
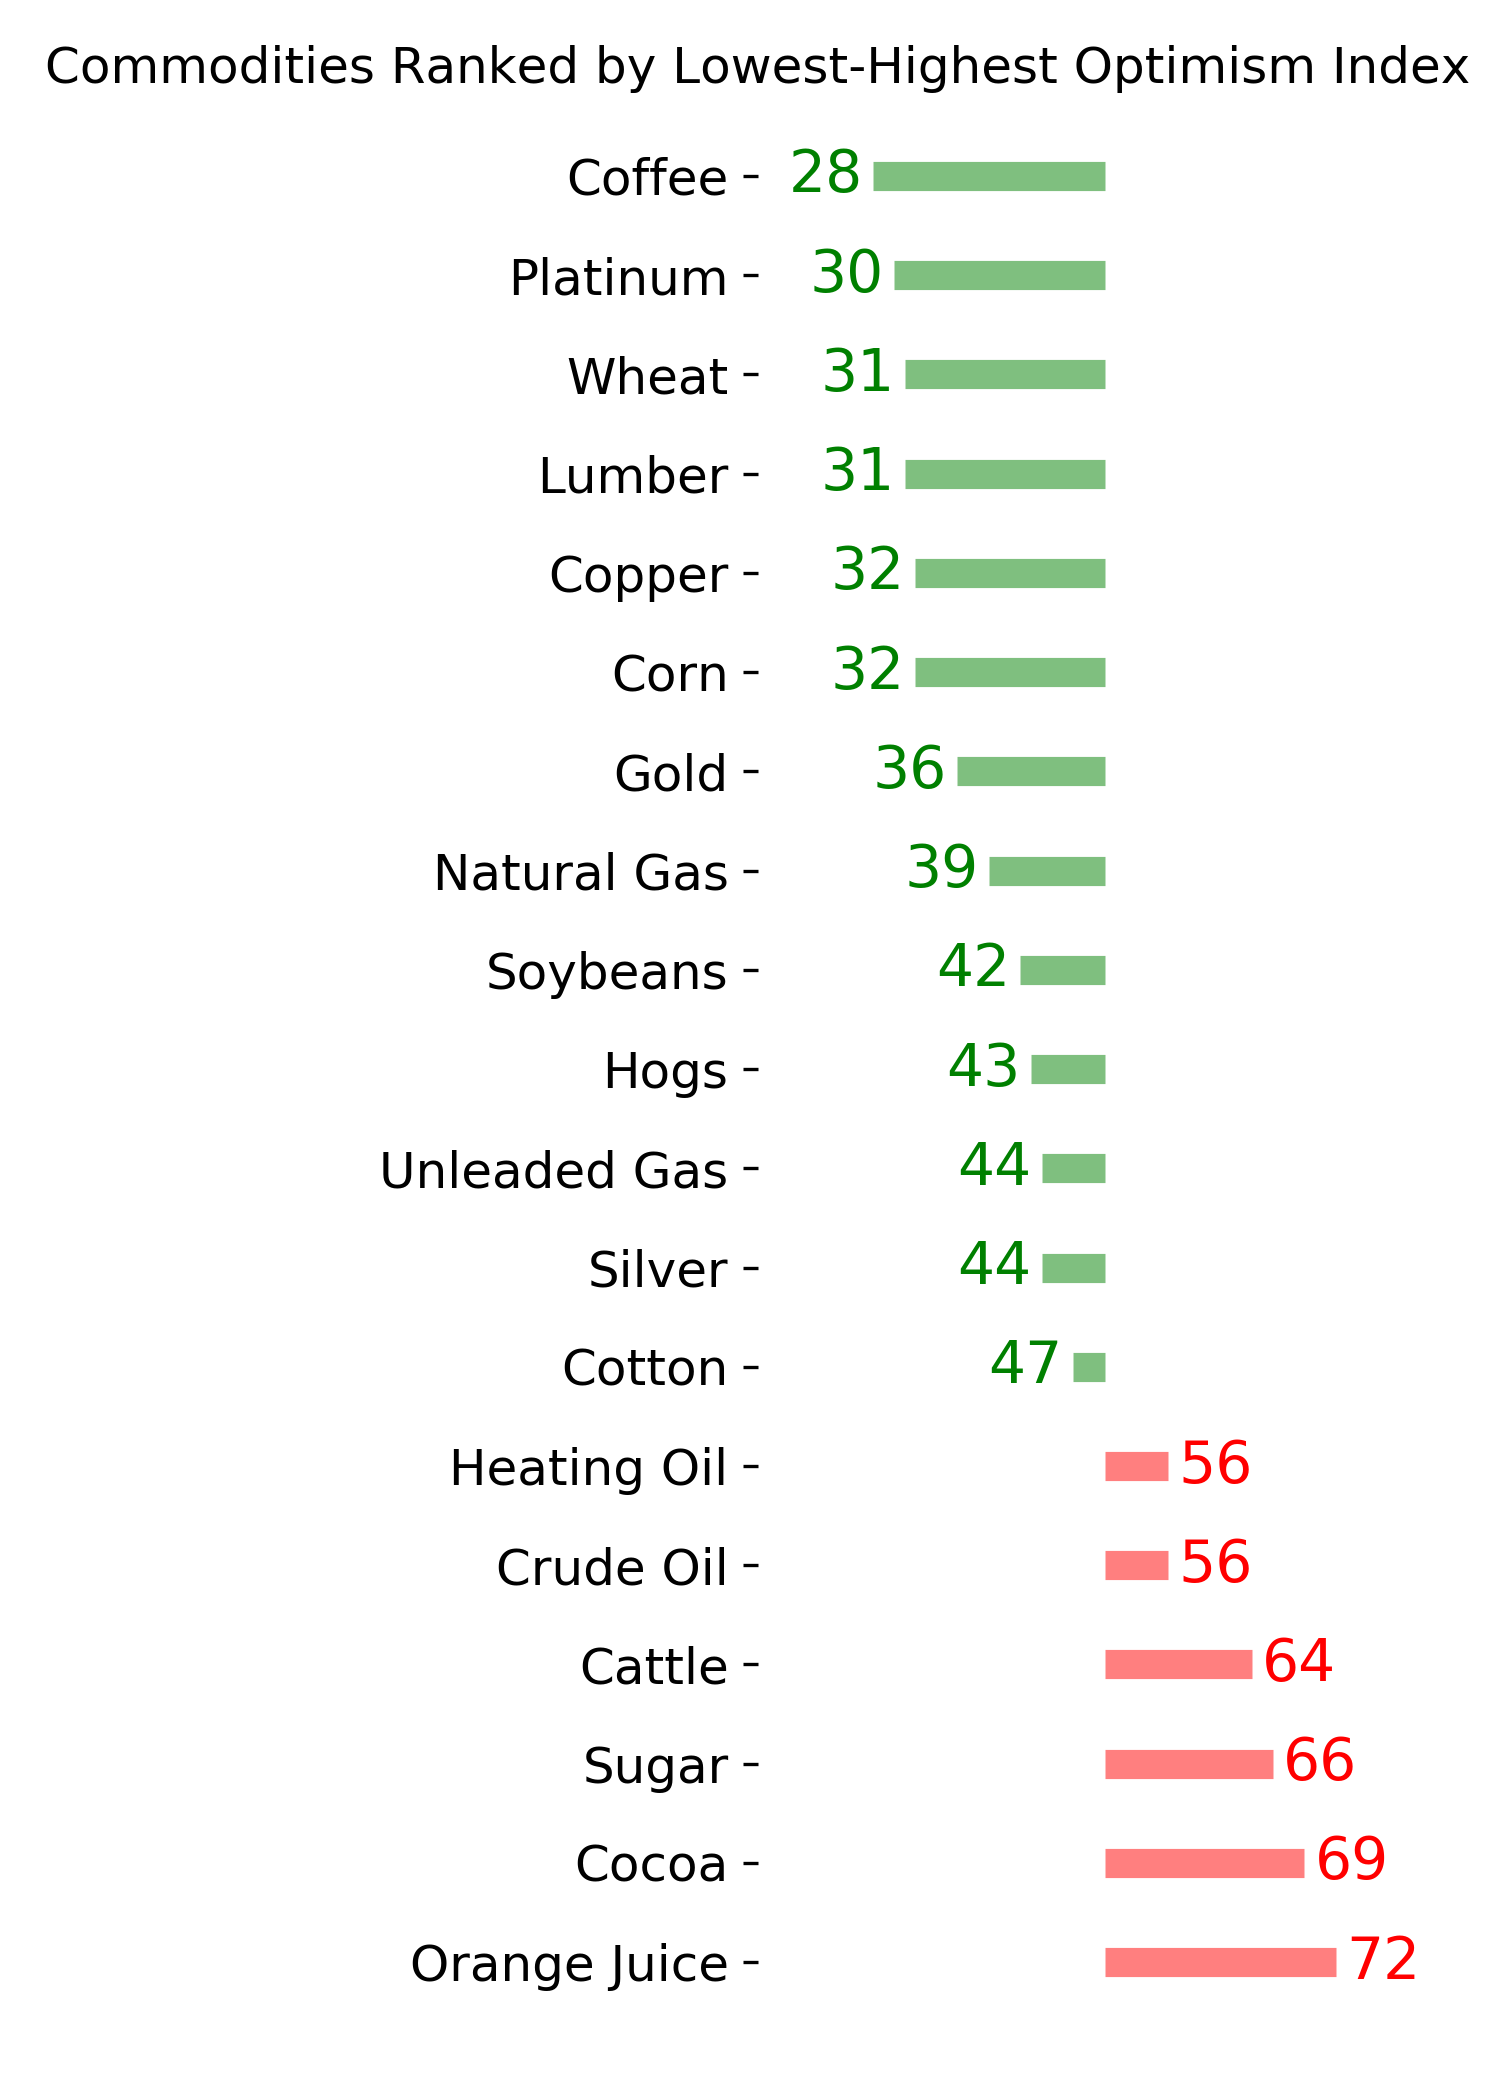
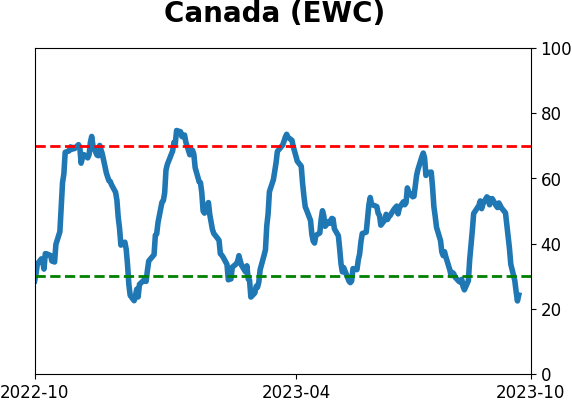
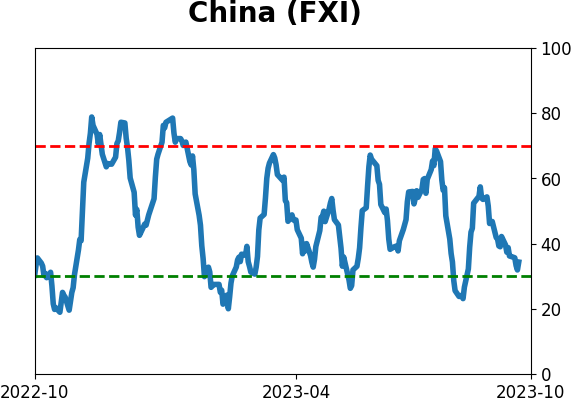
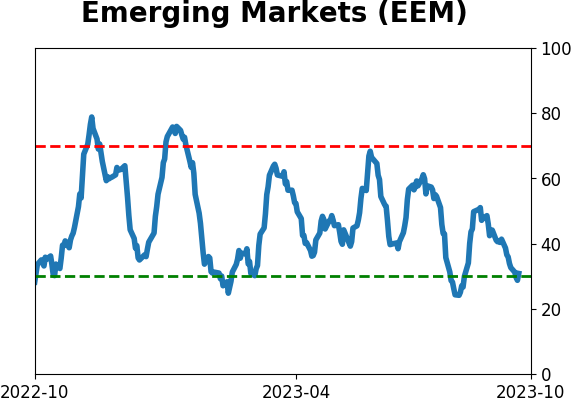
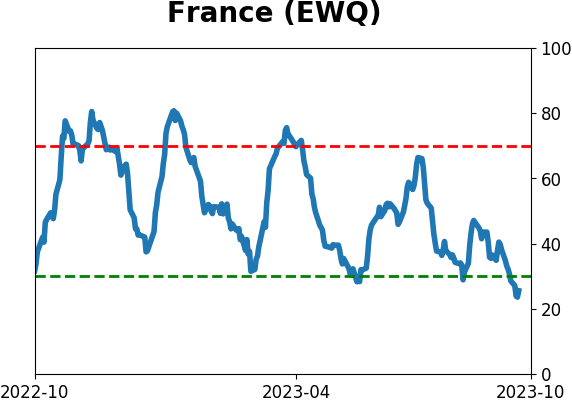
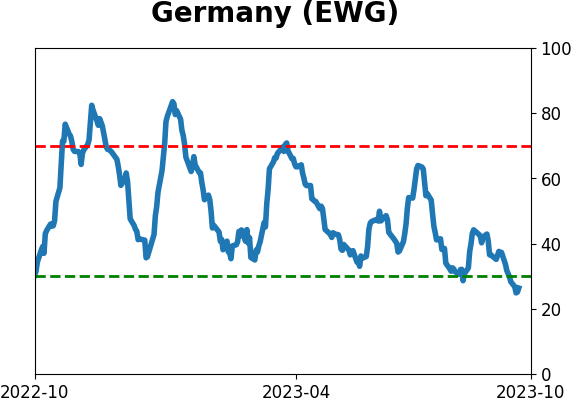
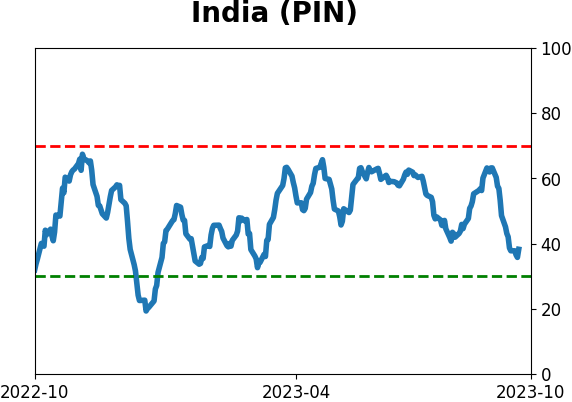
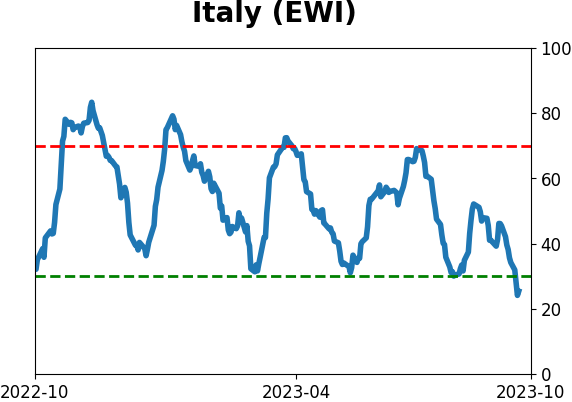
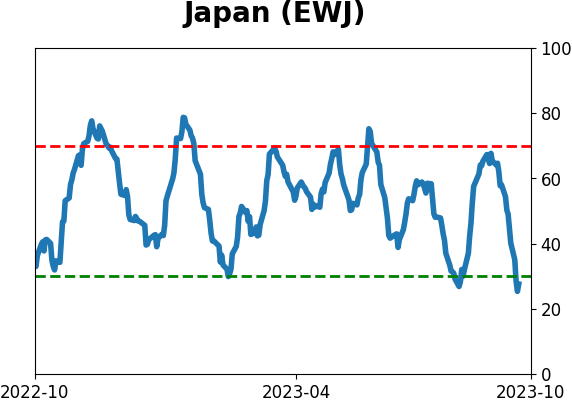
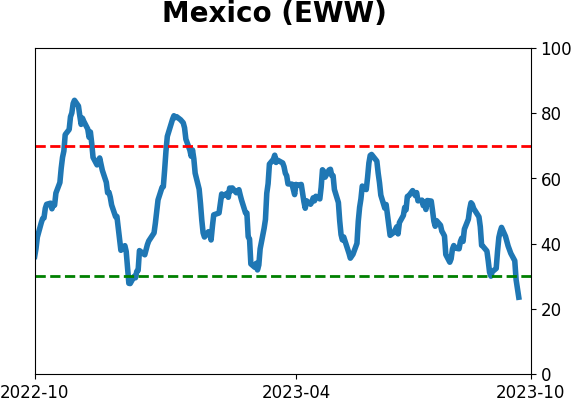
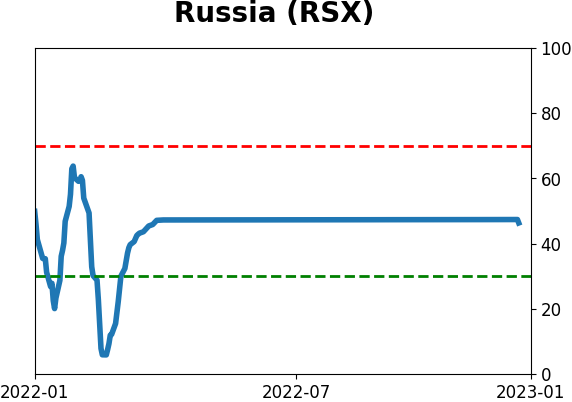
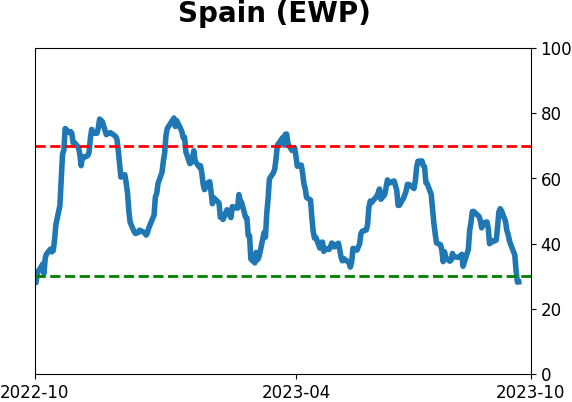
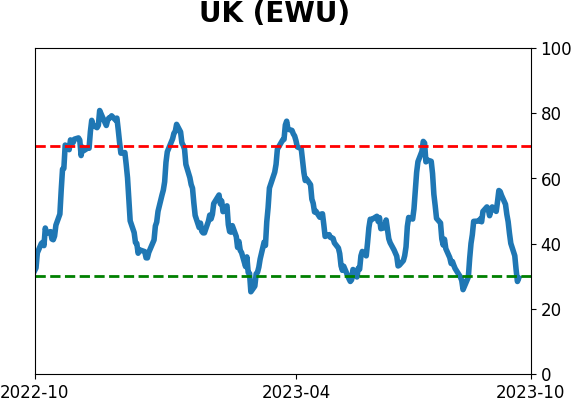
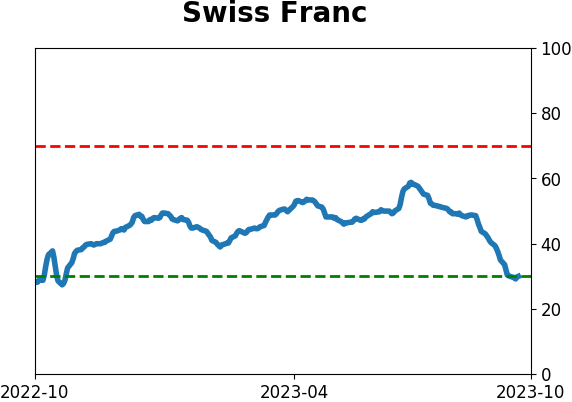
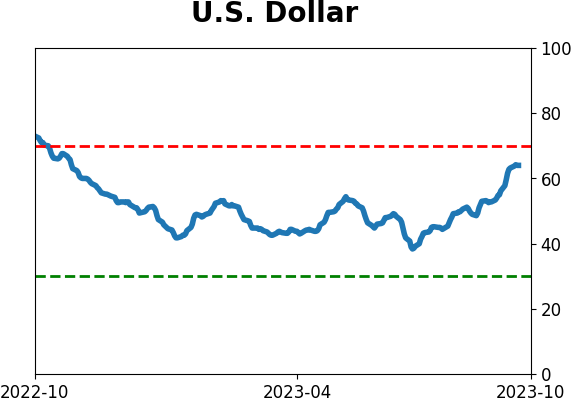
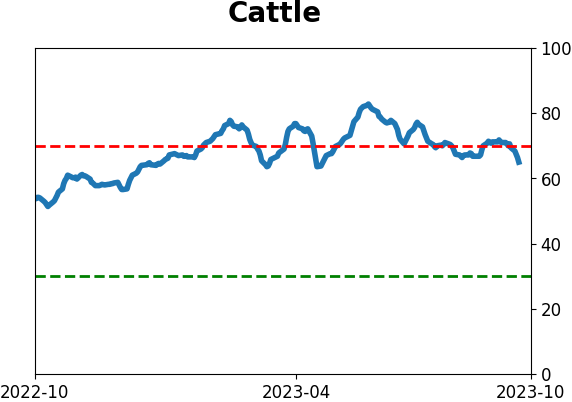
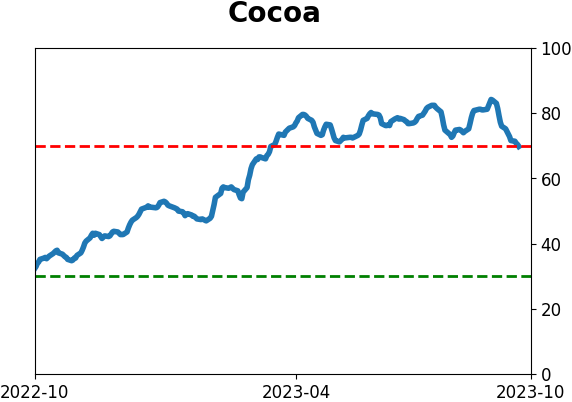
Sentiment Around The World
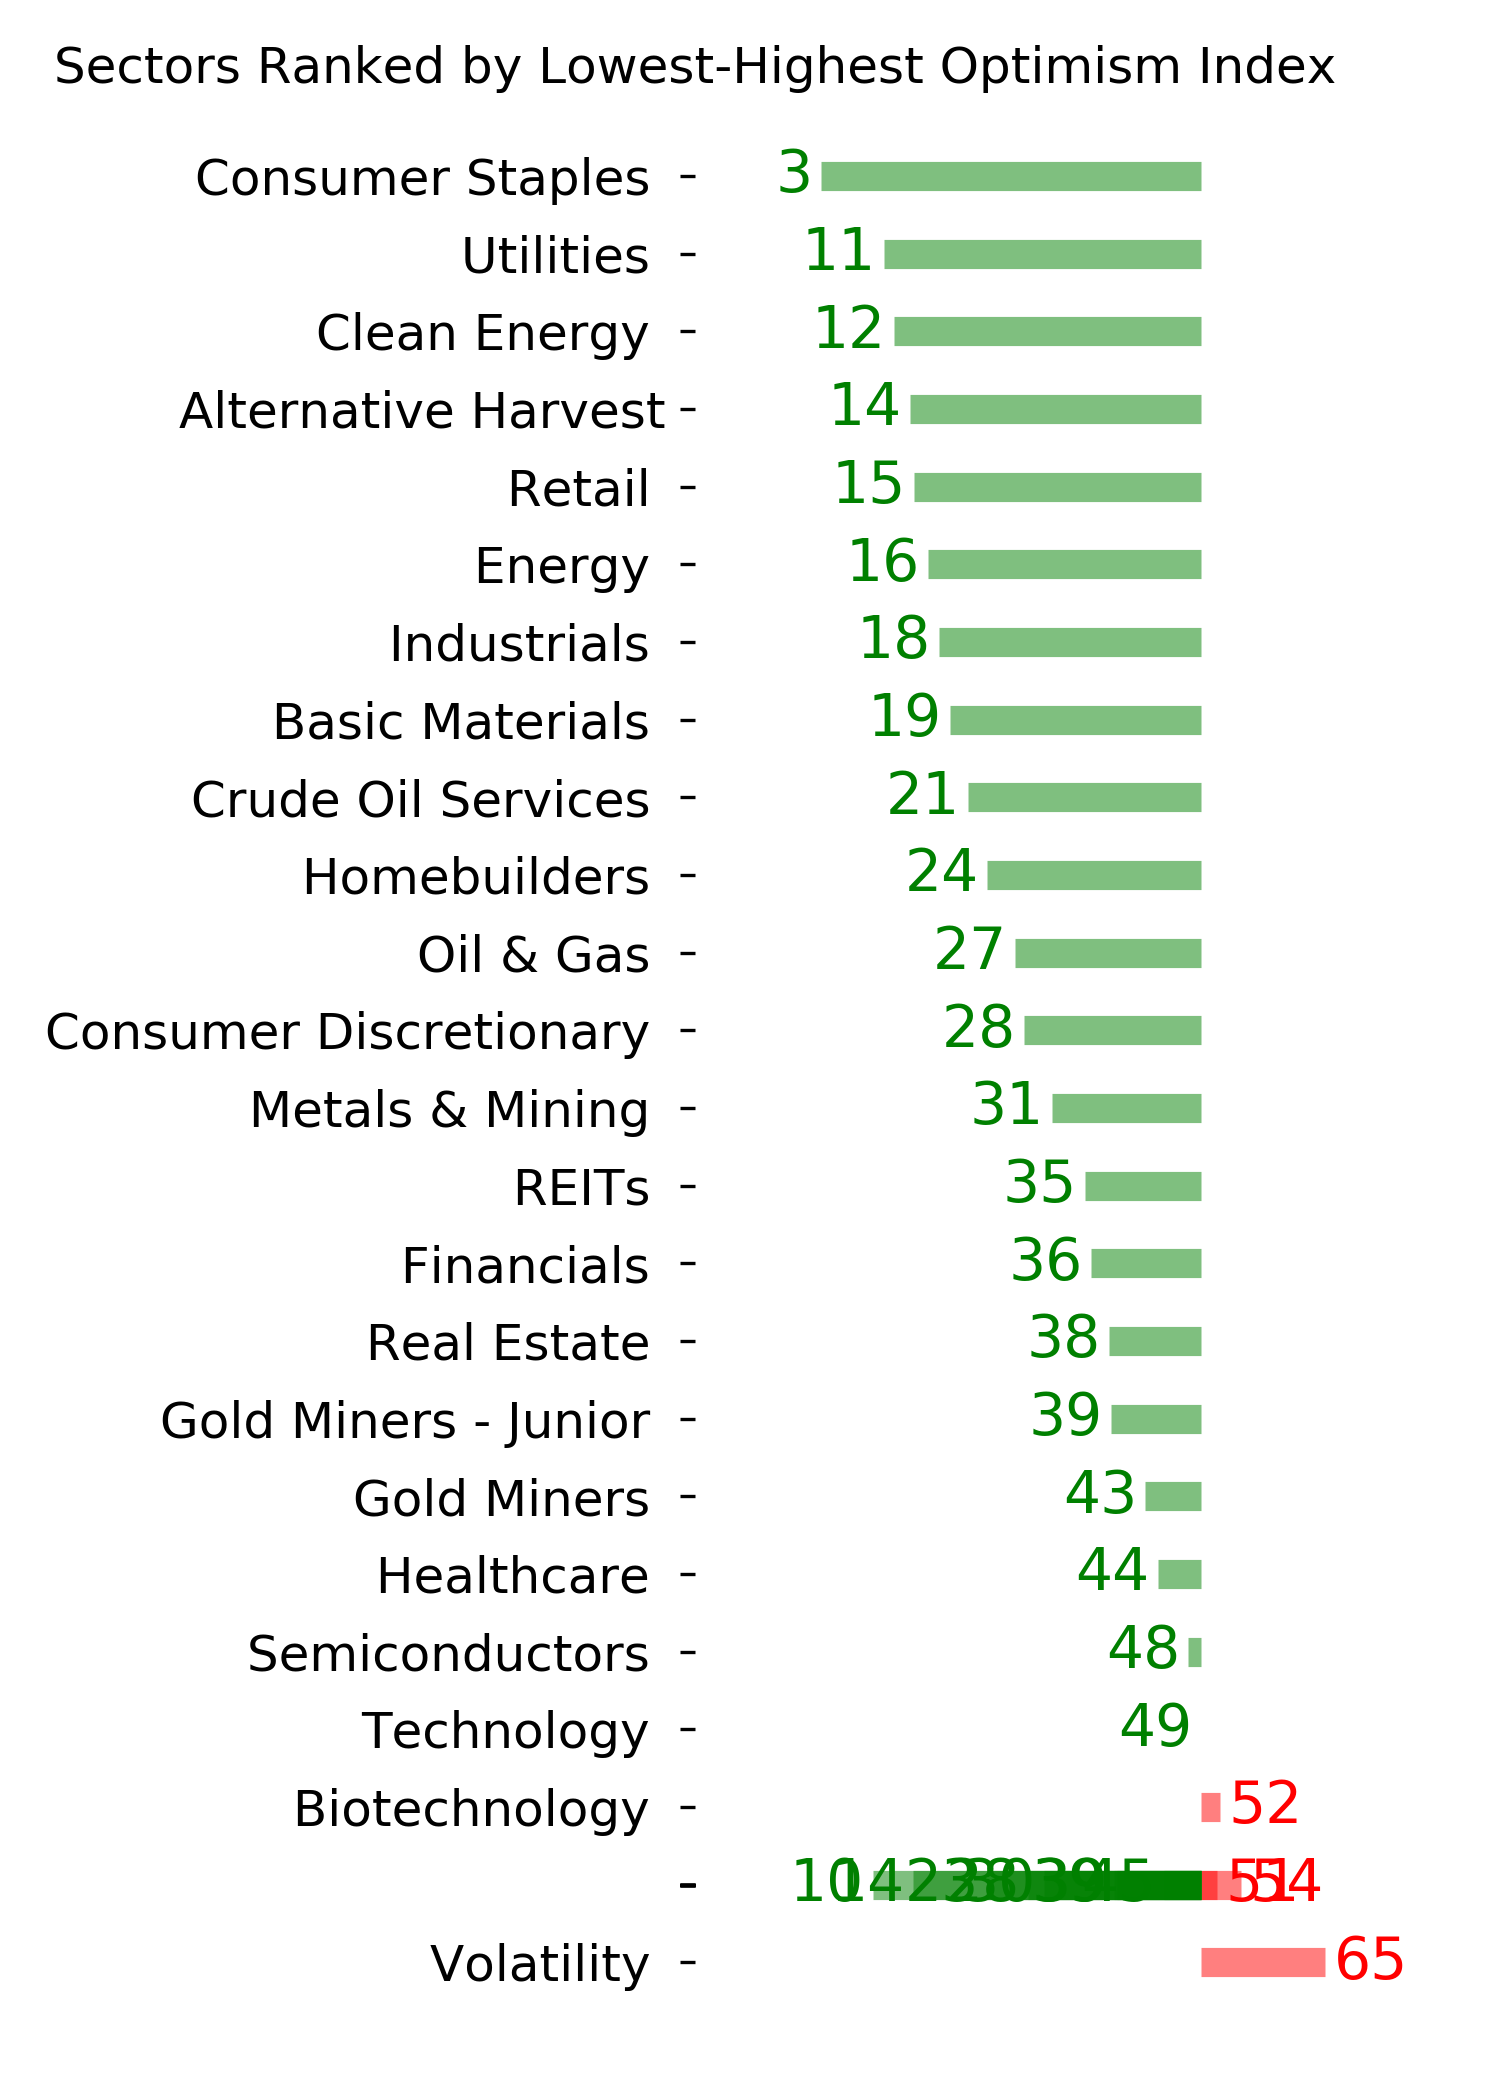
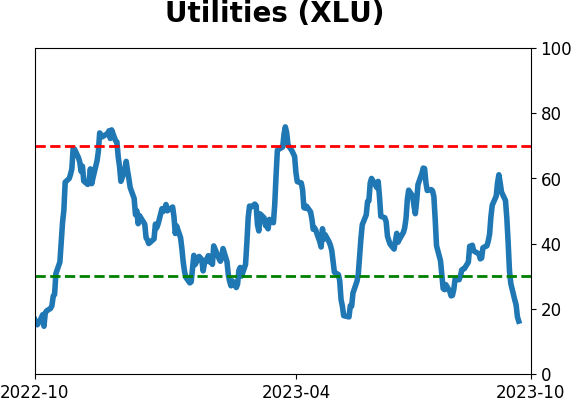
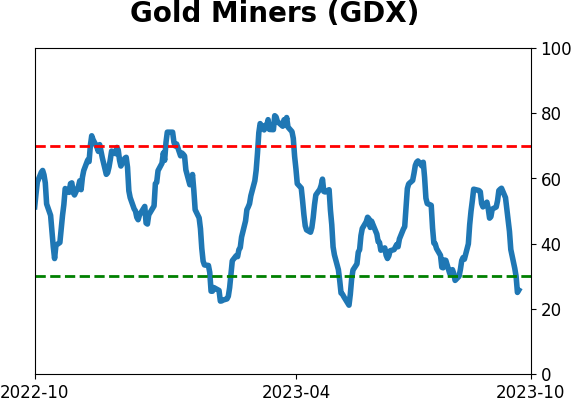
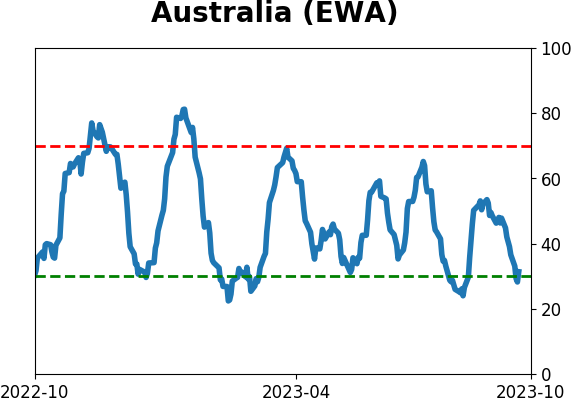
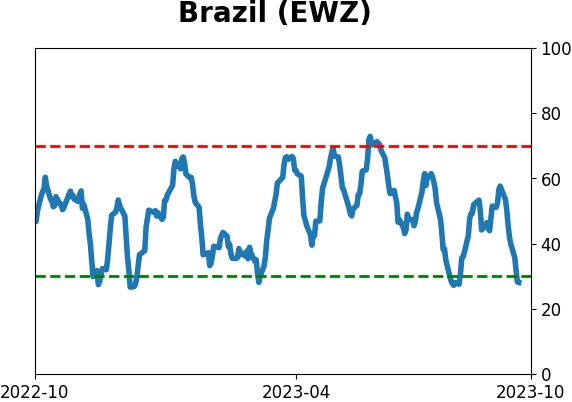
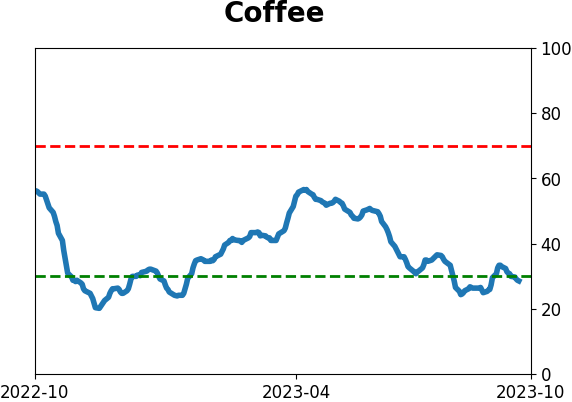
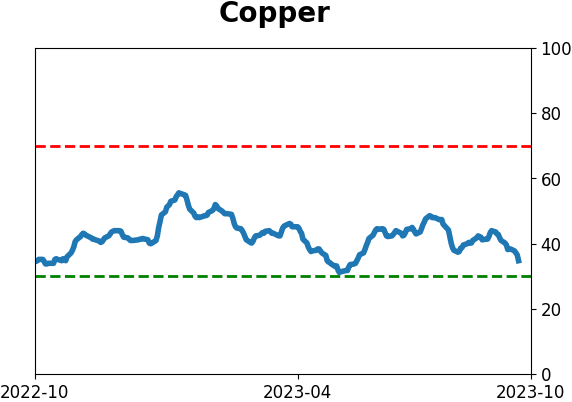
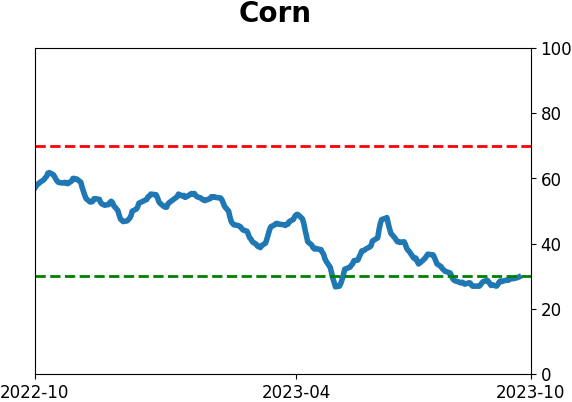
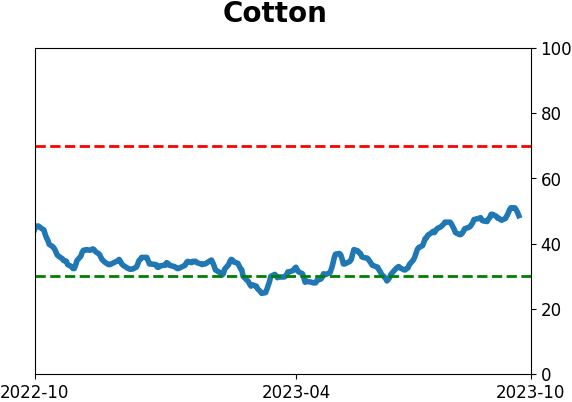
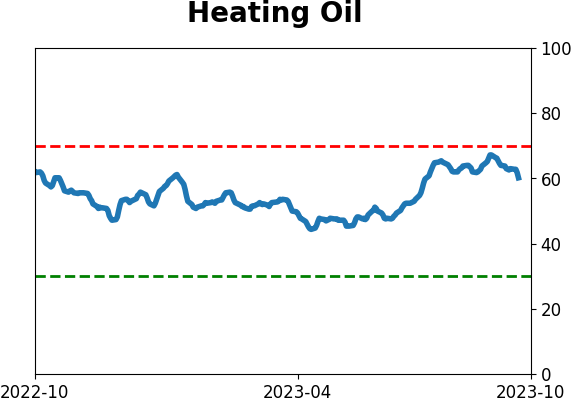
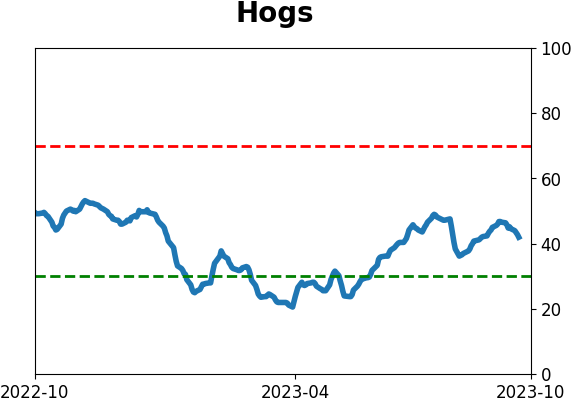
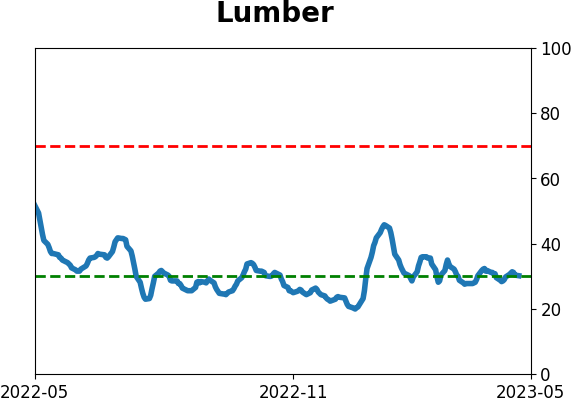
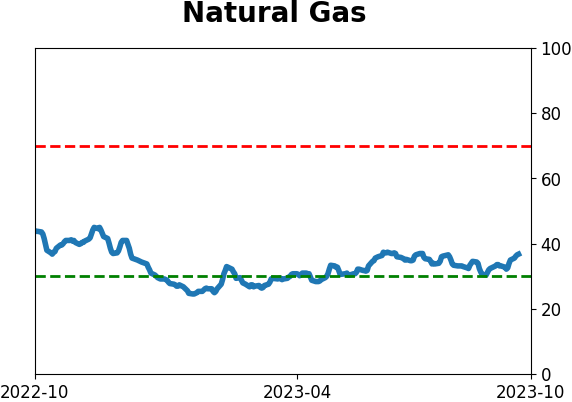
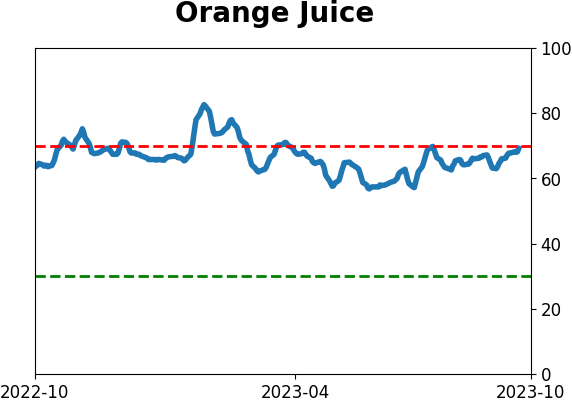
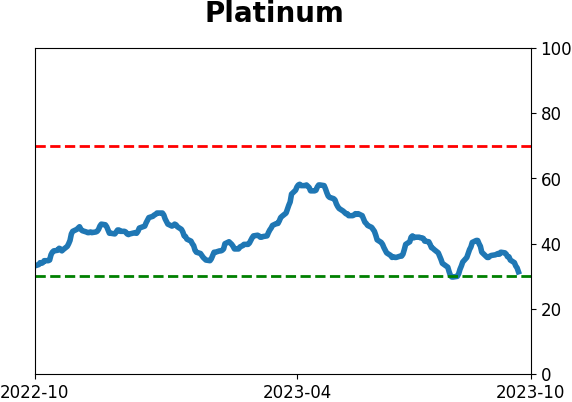
Optimism Index Thumbnails
|
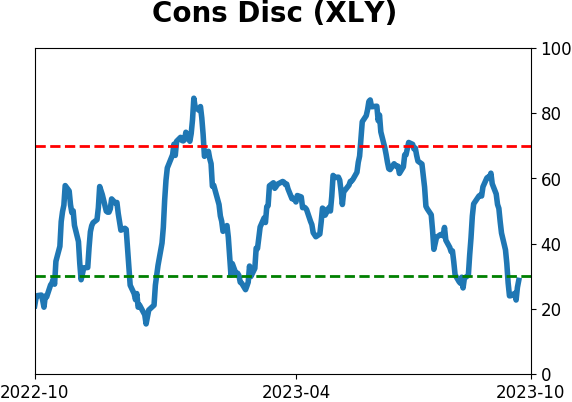
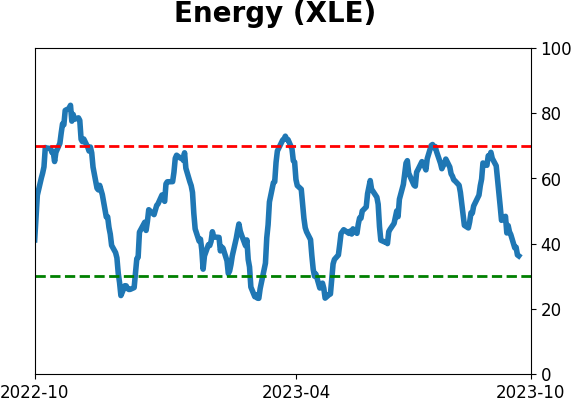
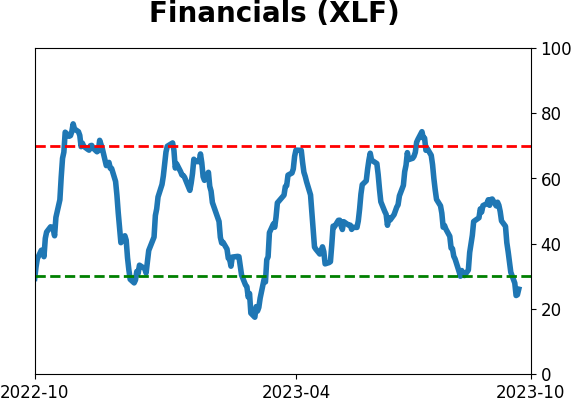
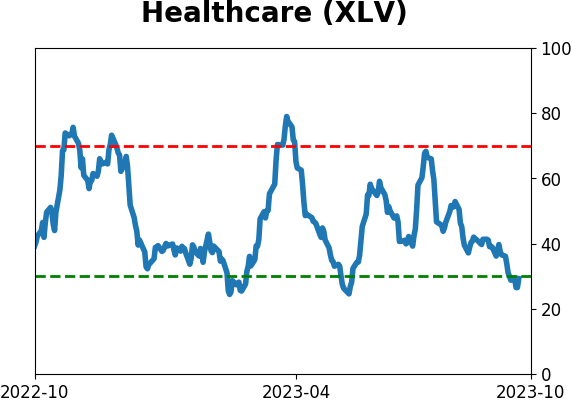
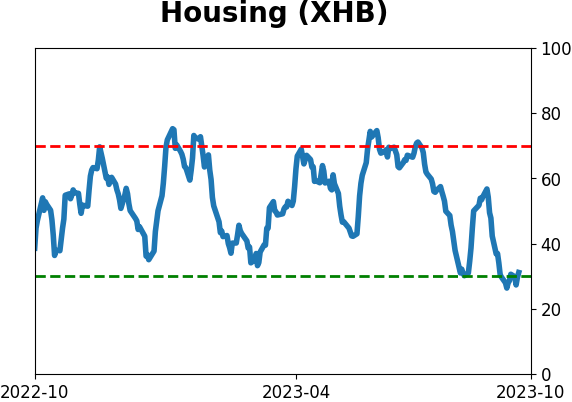
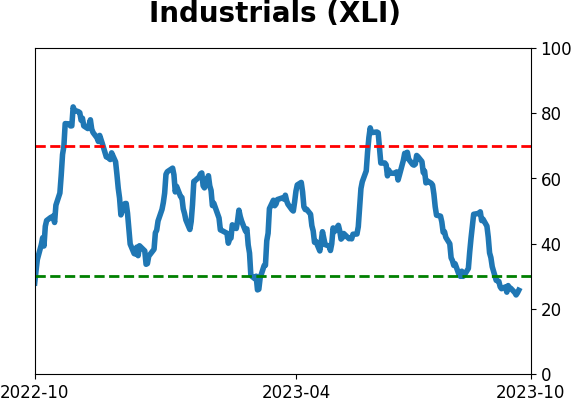
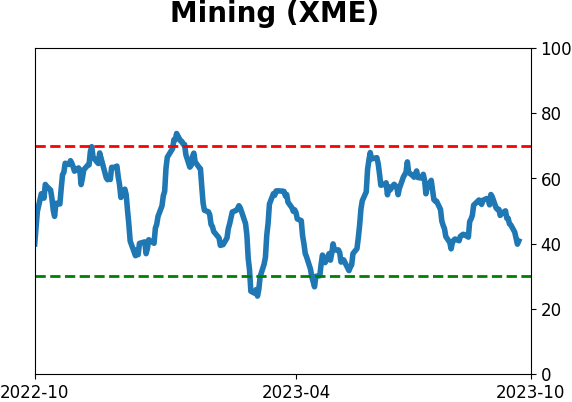
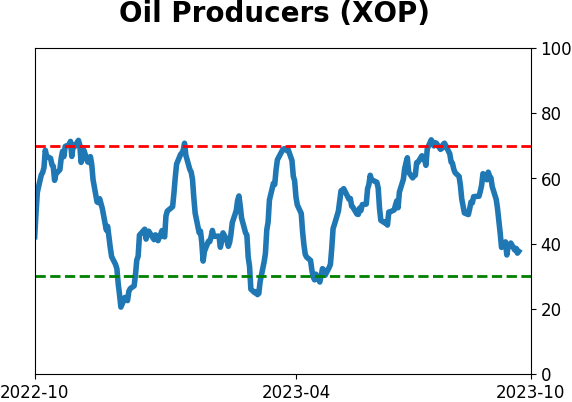
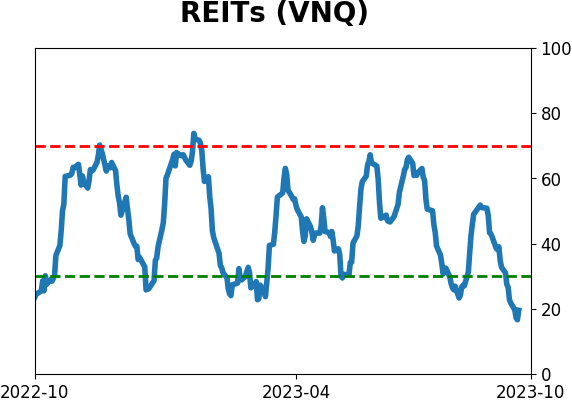
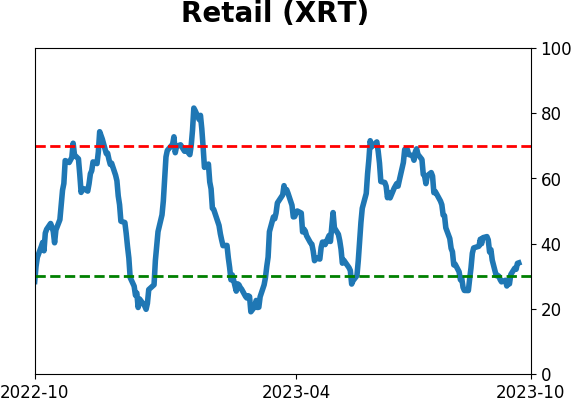
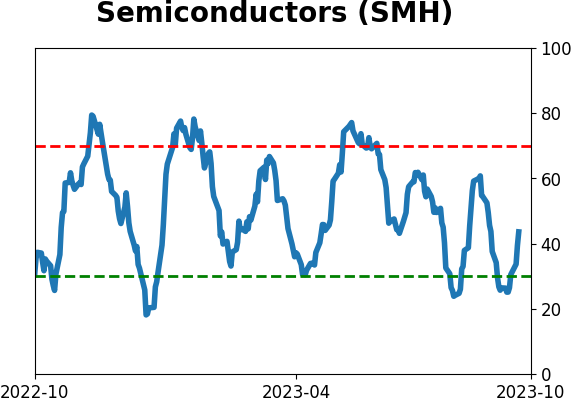
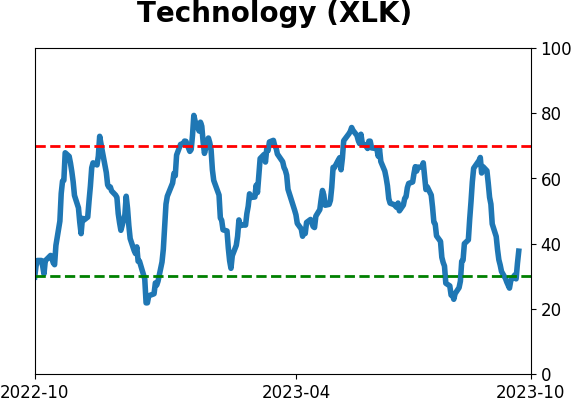
Sector ETF's - 10-Day Moving Average
|
|
|
Country ETF's - 10-Day Moving Average
|
|
|
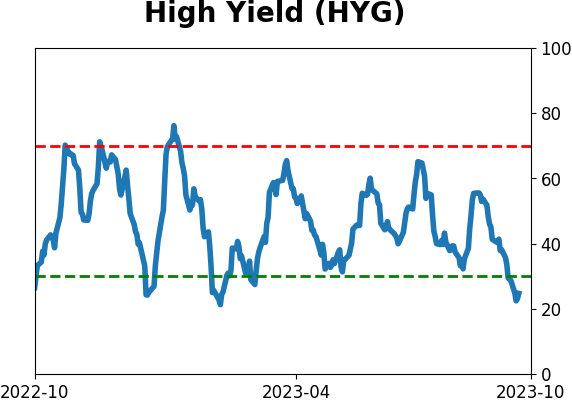
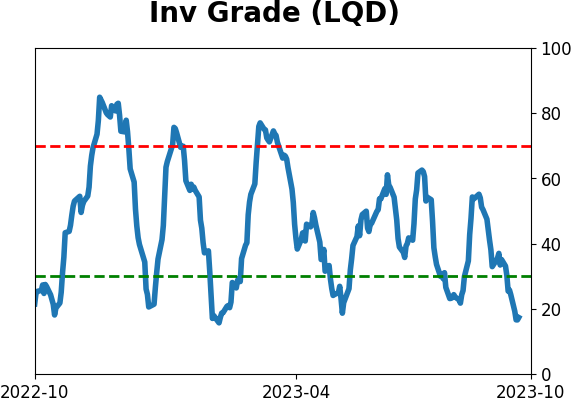
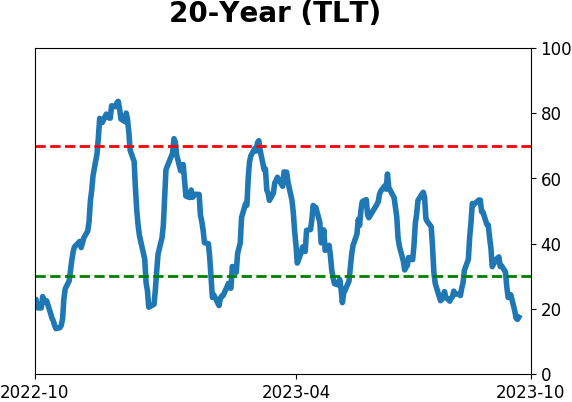
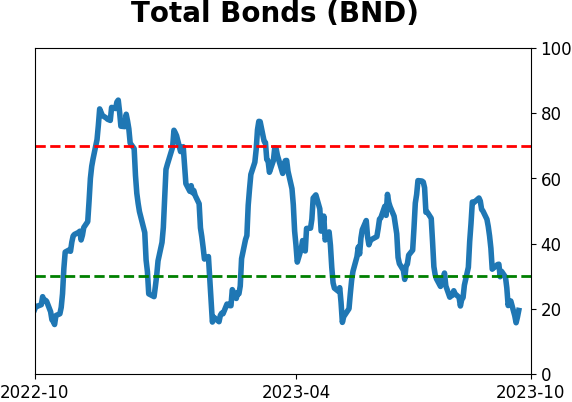
Bond ETF's - 10-Day Moving Average
|
|
|
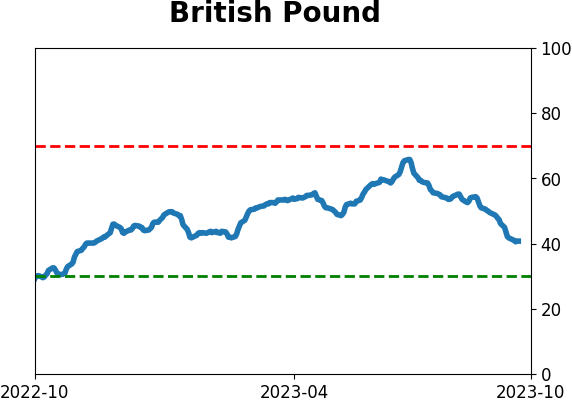
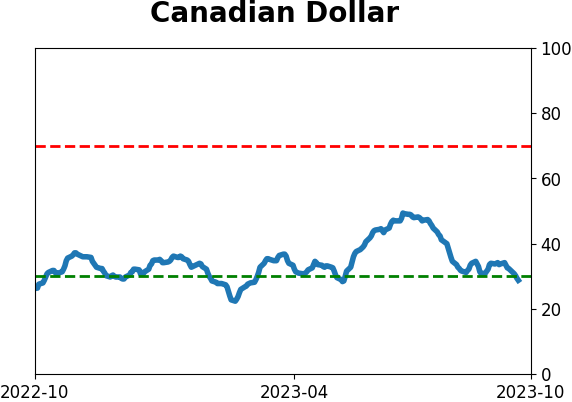
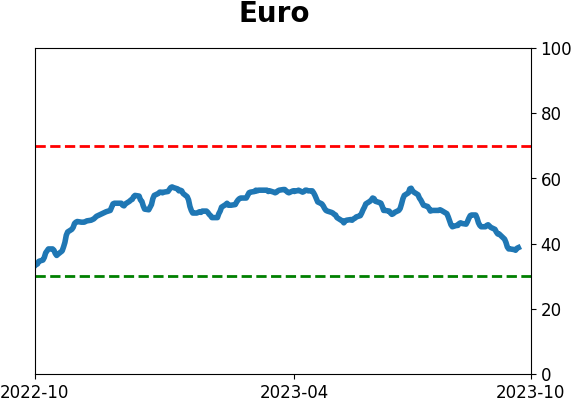
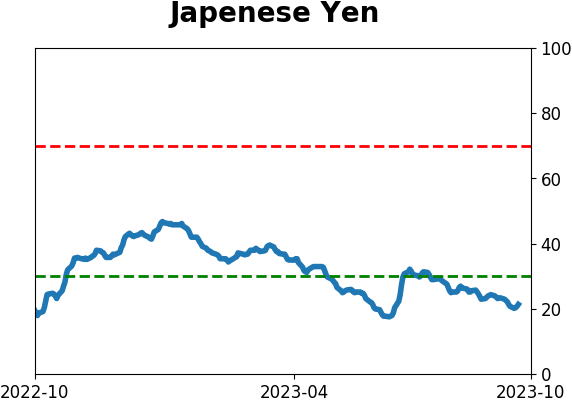
Currency ETF's - 5-Day Moving Average
|
|
|
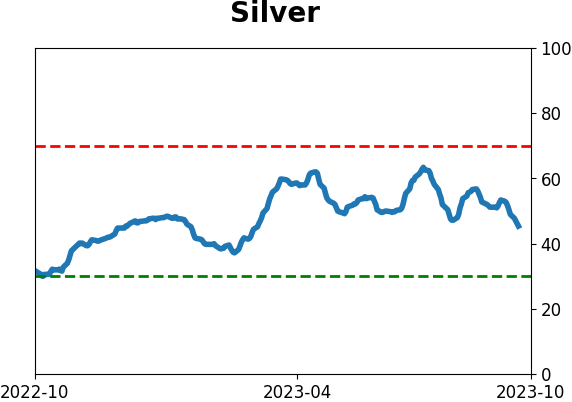
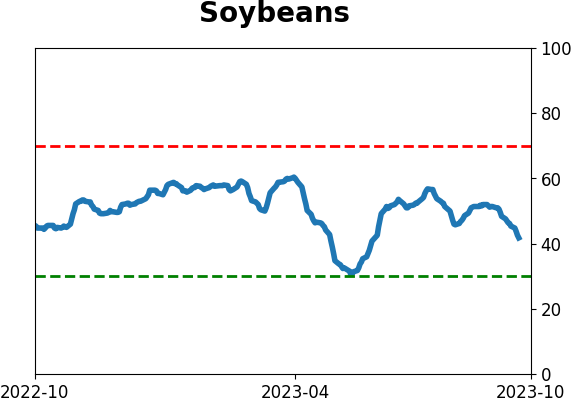
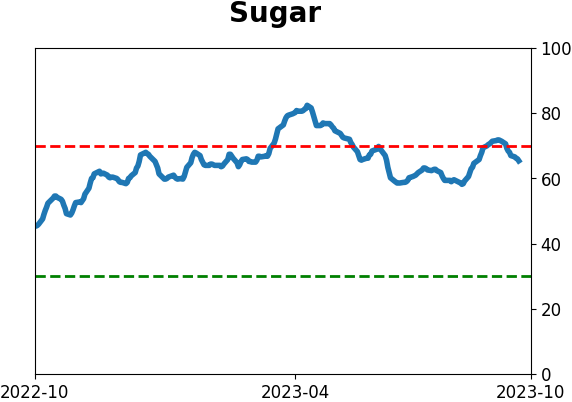
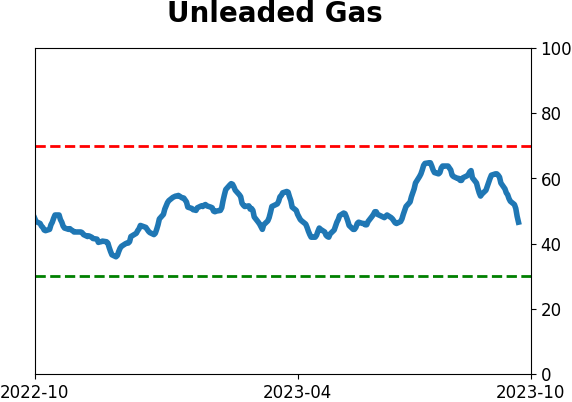
Commodity ETF's - 5-Day Moving Average
|
|