Headlines
|
|
Double thrusts have never failed:
On consecutive sessions, buyers overwhelmed sellers in NYSE-listed securities. More than five times as many securities advanced as declined, and more than ten times as much volume flowed into those securities. Similar thrusts always preceded a positive one-year return in stocks.
|
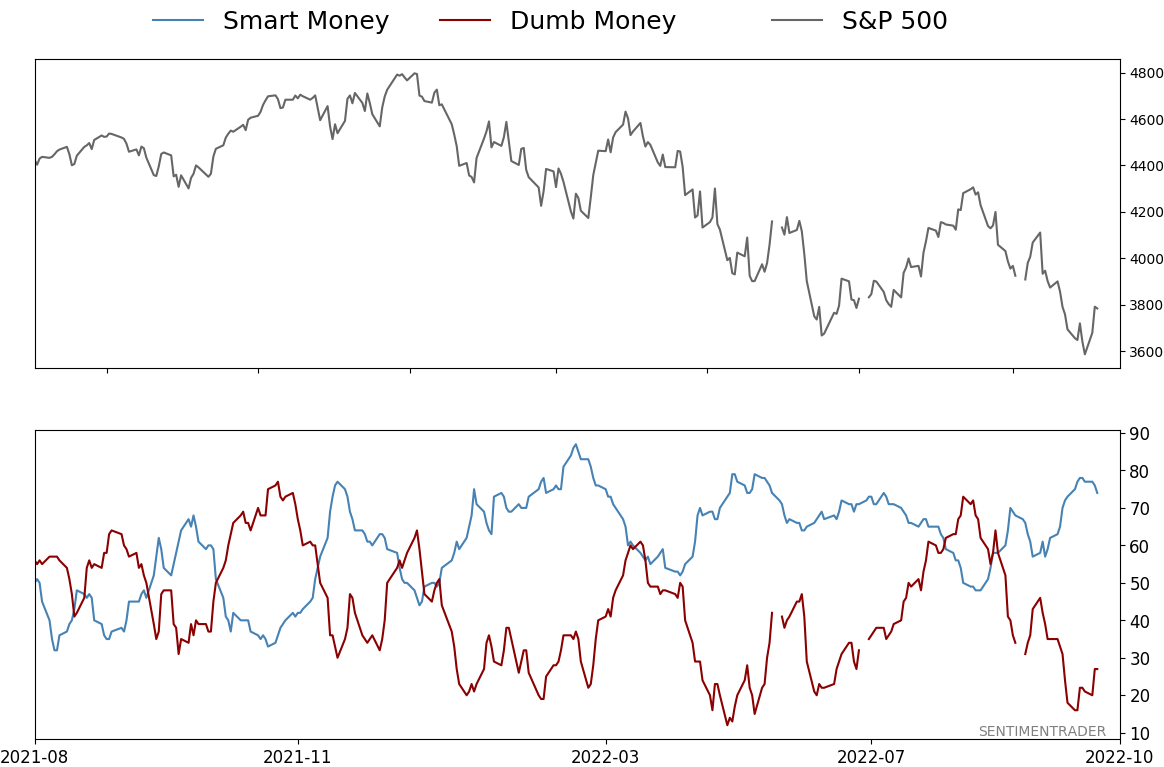
Smart / Dumb Money Confidence
|
Smart Money Confidence: 74%
Dumb Money Confidence: 27%
|
|
Risk Levels
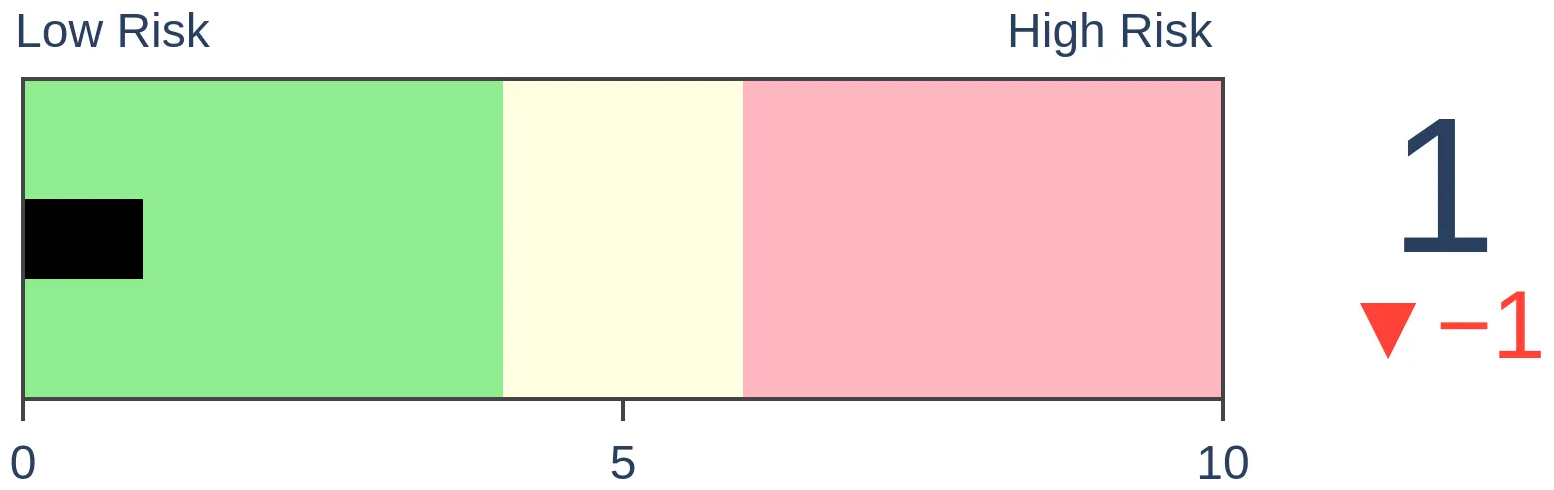
Stocks Short-Term
|
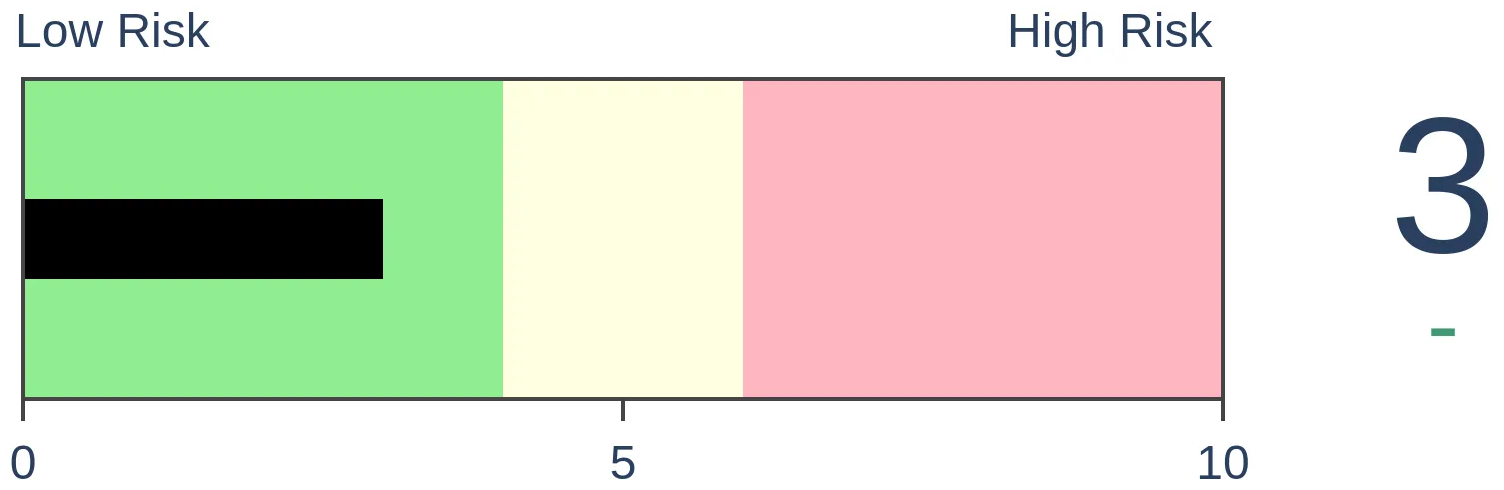
Stocks Medium-Term
|
|
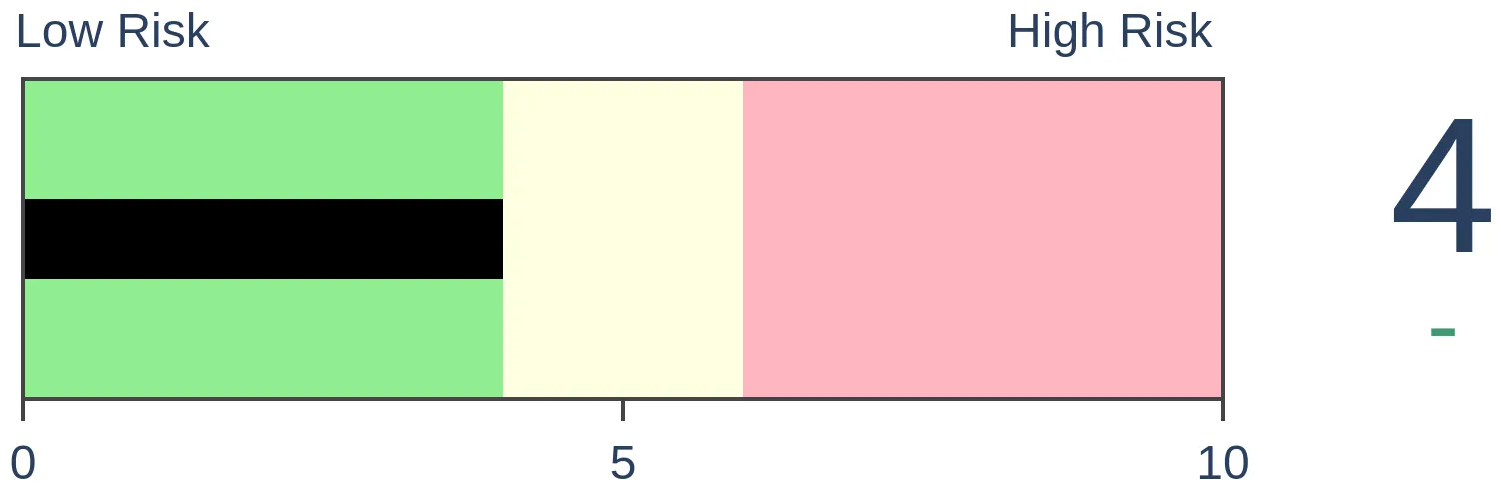
Bonds
|
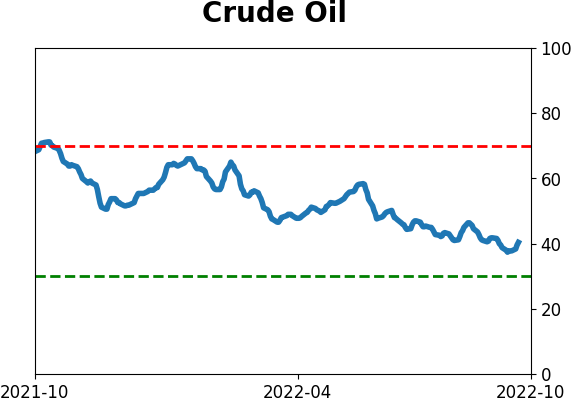
Crude Oil

|
|
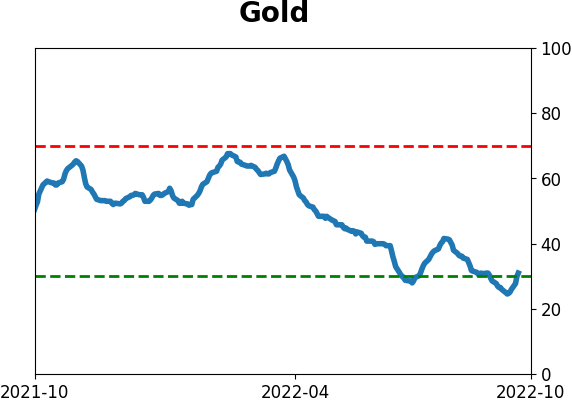
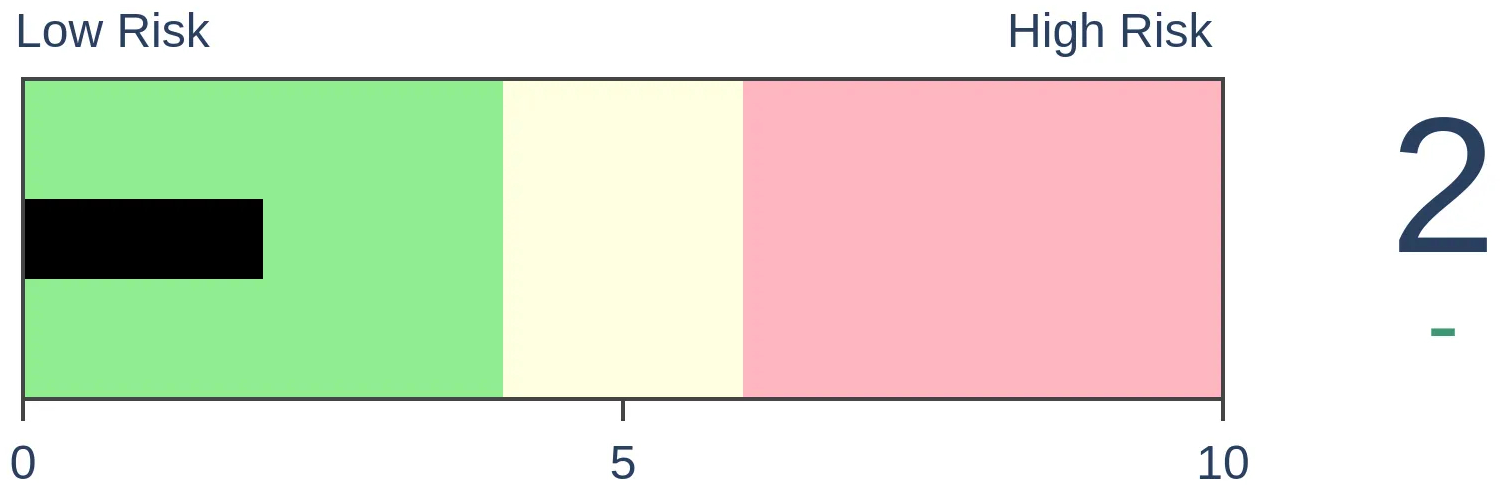
Gold
|
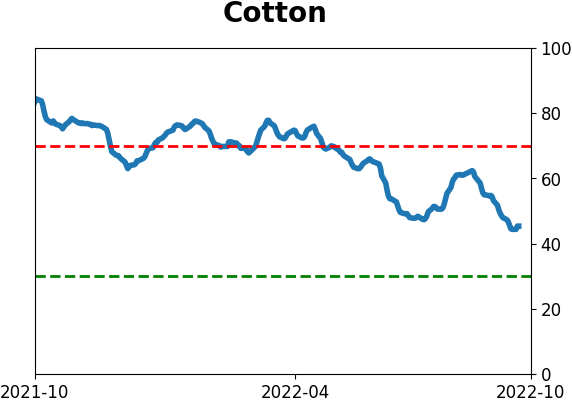
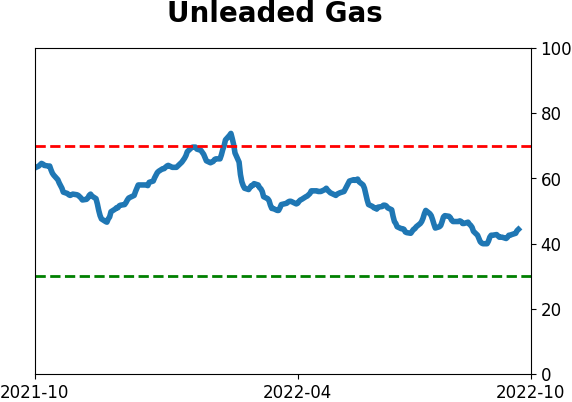
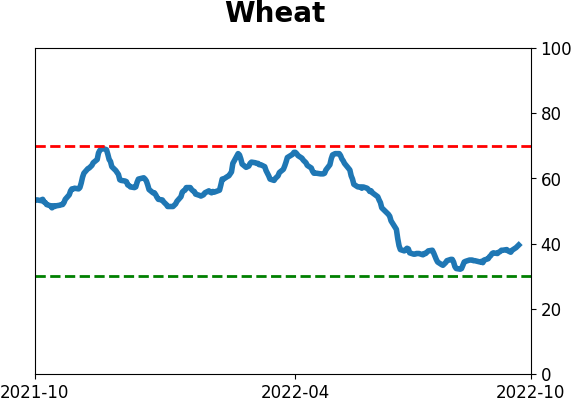
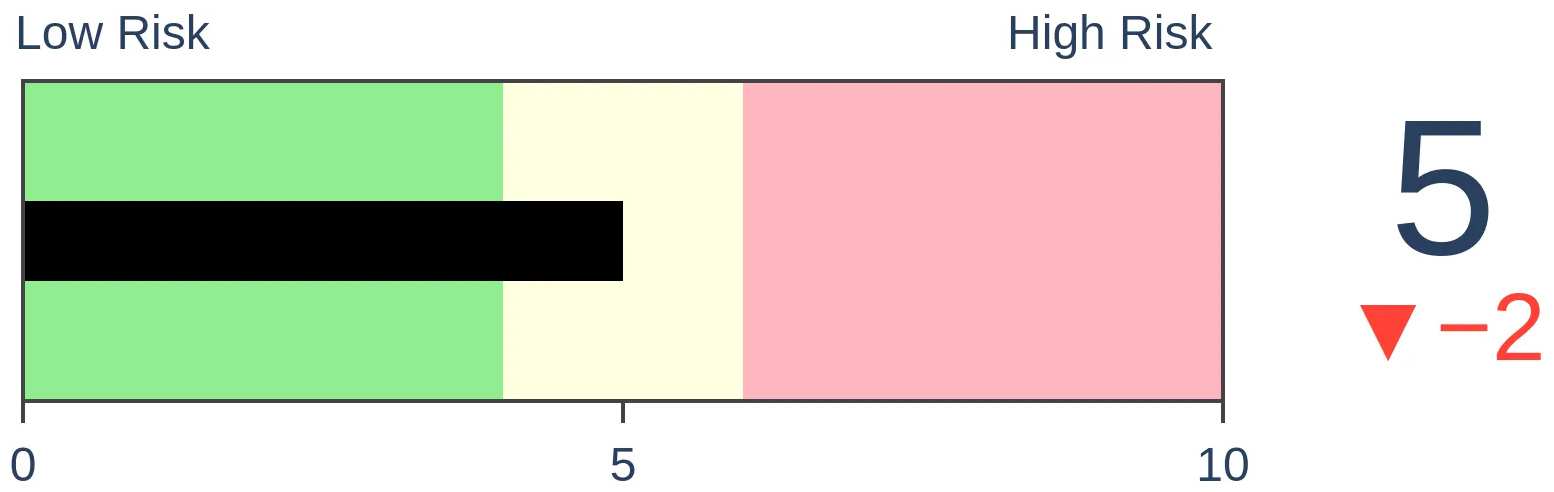
Agriculture
|
|
Research
By Jason Goepfert
BOTTOM LINE
On consecutive sessions, buyers overwhelmed sellers in NYSE-listed securities. More than five times as many securities advanced as declined, and more than ten times as much volume flowed into those securities. Similar thrusts always preceded a positive one-year return in stocks.
FORECAST / TIMEFRAME
SPY -- Up, Long-Term
|
Key points:
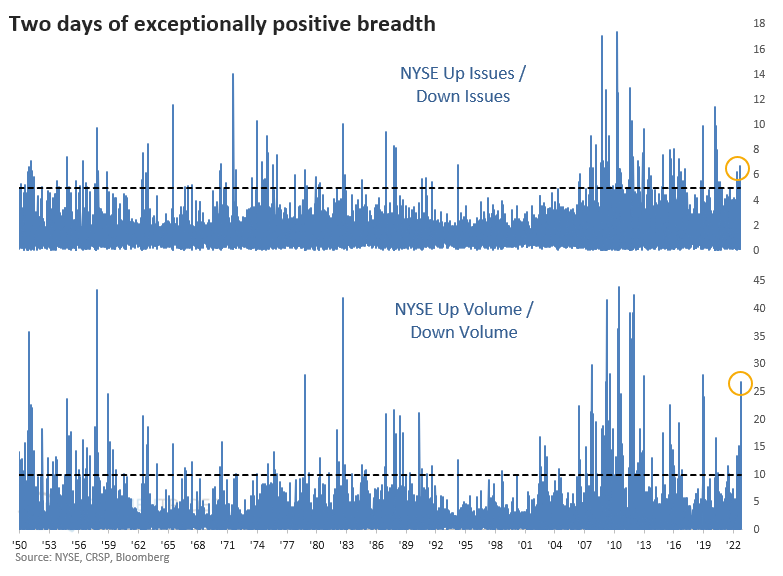
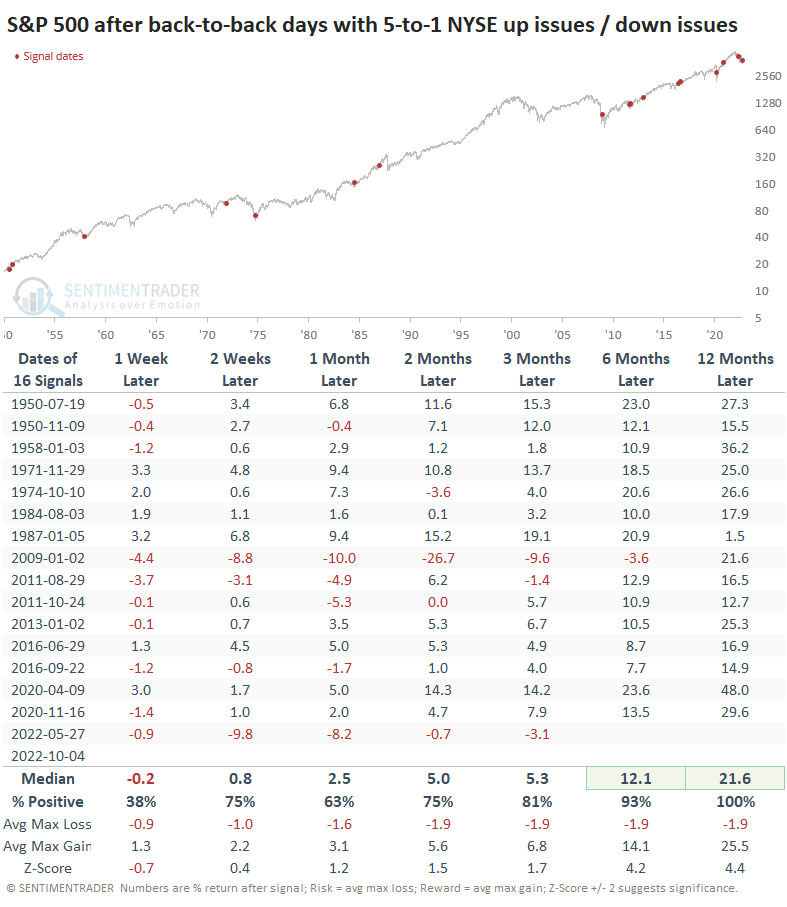
- On consecutive sessions, more than 5 times as many securities on the NYSE advanced as declined
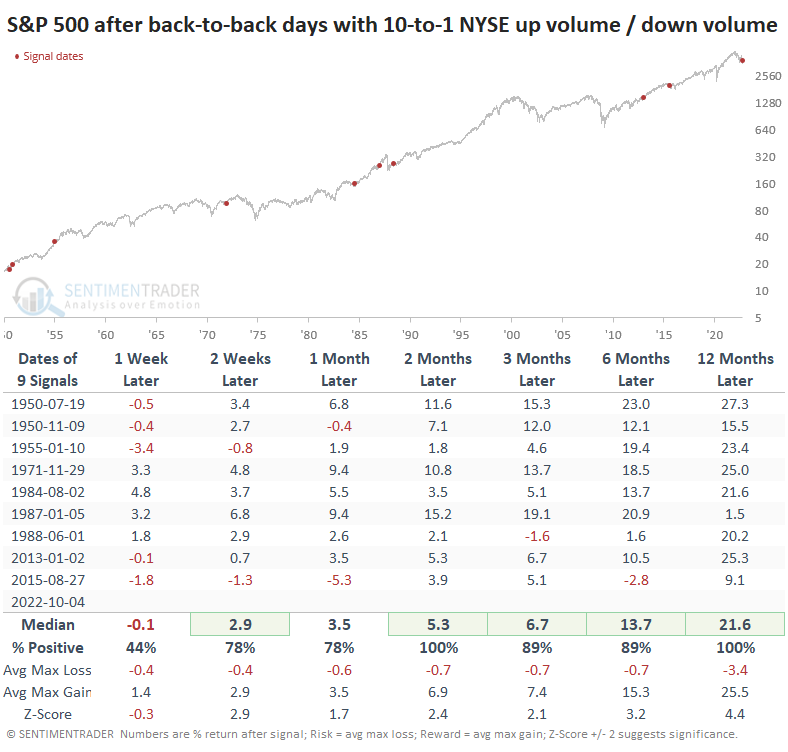
- Even more notably, more than 10 times as much volume flowed into advancing than declining securities
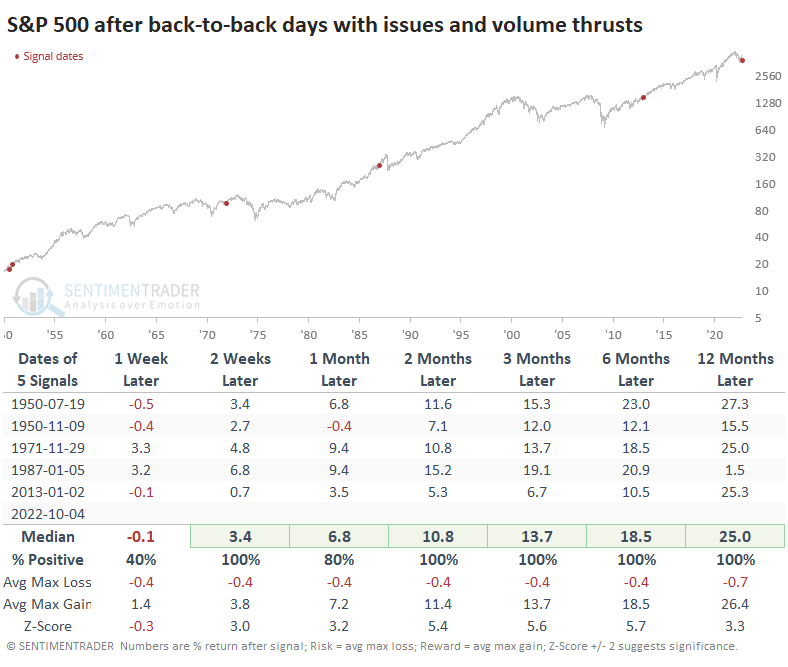
- Both types of thrusts have always preceded a positive one-year return in the S&P 500
The last two days saw historic buying pressure
Might as well get this over with since everyone will likely be discussing and asking about it today: Yes, there has been a massive thrust over the last couple of days; yes, it has never erred in preceding higher returns.
As we saw in March 2020, the last two days have witnessed overwhelming buying interest. On the NYSE, five times more securities advanced than declined, and ten times more volume flowed into advancing than declining securities.
Even going back to 1928, this is a rare occurrence. We have less confidence in breadth metrics before 1962, especially before 1950, so we'll limit the lookback to then.
When five times as many securities rose as declined on consecutive sessions, the S&P 500 never suffered a negative one-year return. Even over the next six months, there was only a single small loss. The maximum decline even up to a year later was minuscule on average, though five of them suffered drawdowns larger than -5%. Every signal saw a maximum gain of more than +15% within the following year.
When more than ten times as much volume flowed into advancing versus declining securities, returns were even more consistently positive.
If we combine both studies, the last couple of days has only a few precedents.
What the research tells us...
Breadth thrusts have been one of the most consistently reliable market developments for decades. Unfortunately, in 2022, we've seen several of them fail when they haven't really before. That's enough to be a bit suspect of ones triggering now. The last two days have surpassed prior thrusts this year and from a significantly lower level, so perhaps that will be enough to trigger more short-covering initially, then FOMO buying interest. It would be typical for stocks to back off over the next week, but we should not see materially lower prices if this thrust is going to hold.
Indicators at Extremes
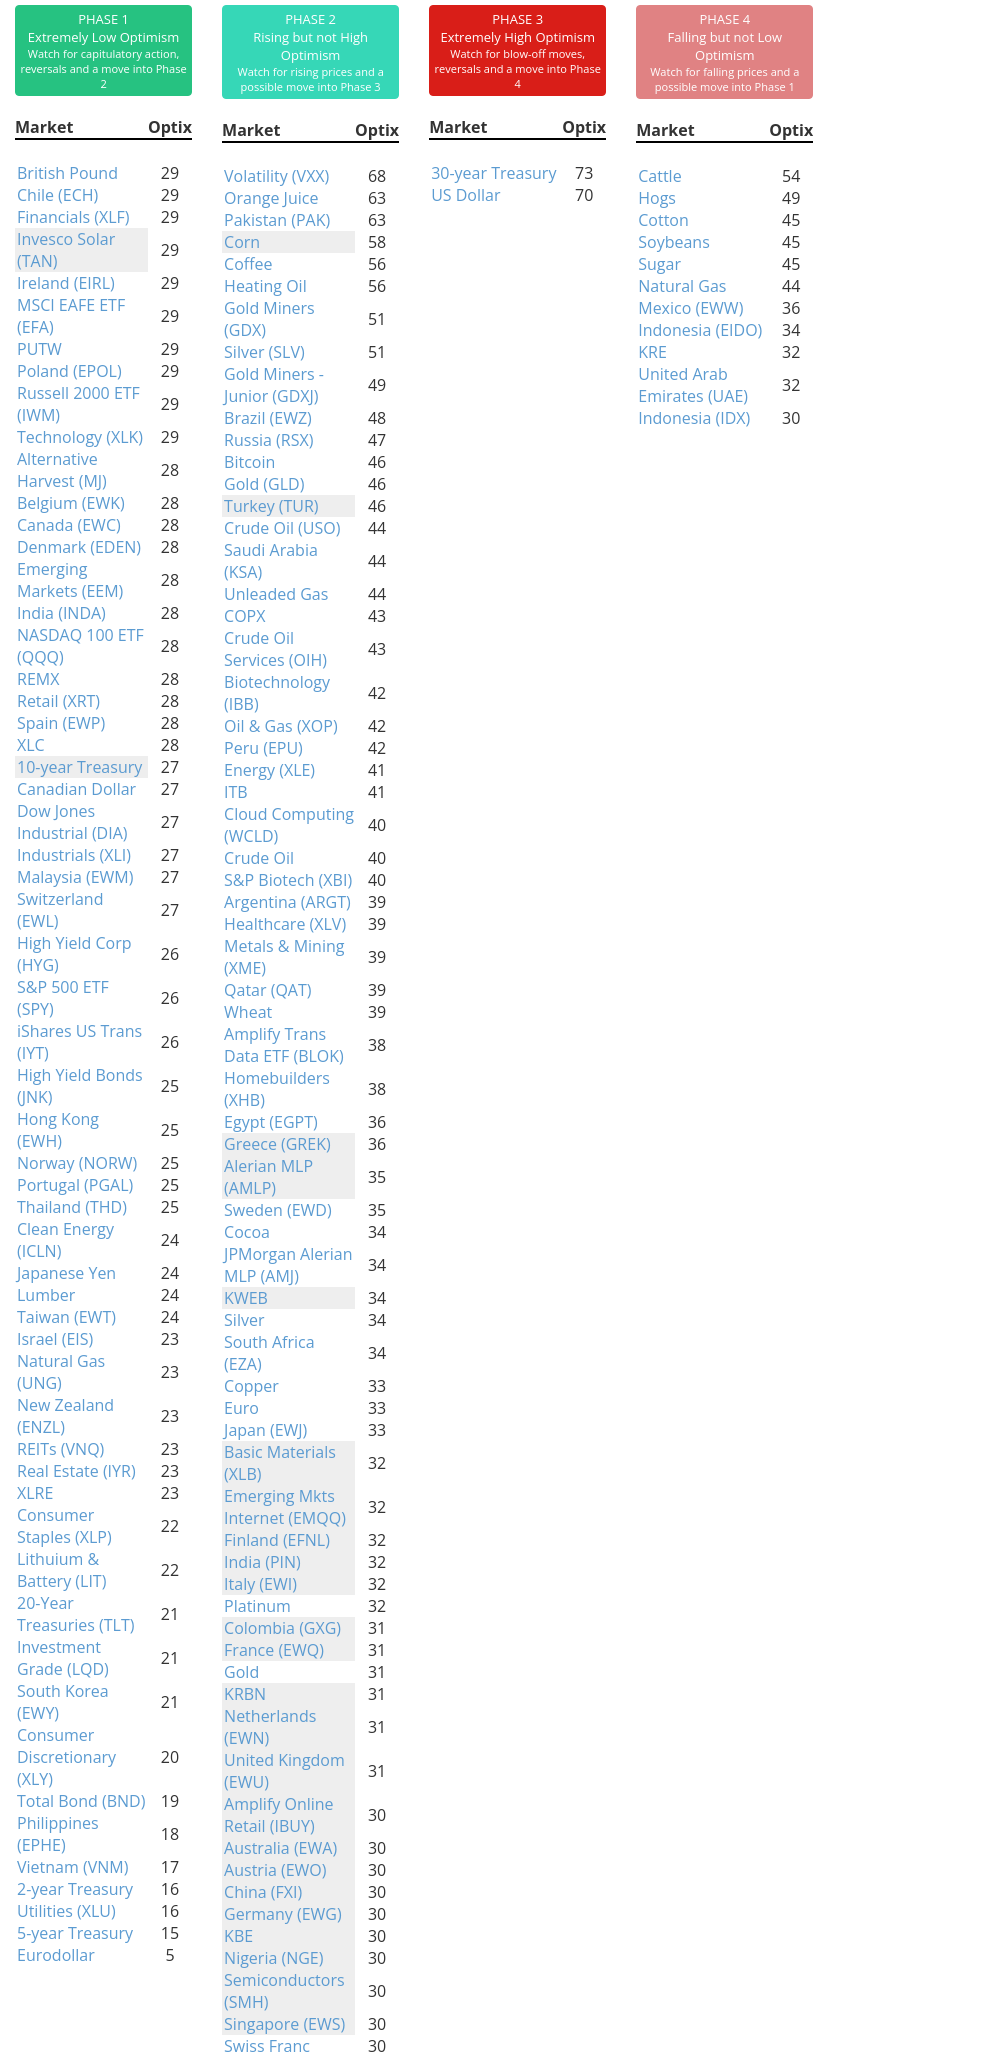
Phase Table
Ranks
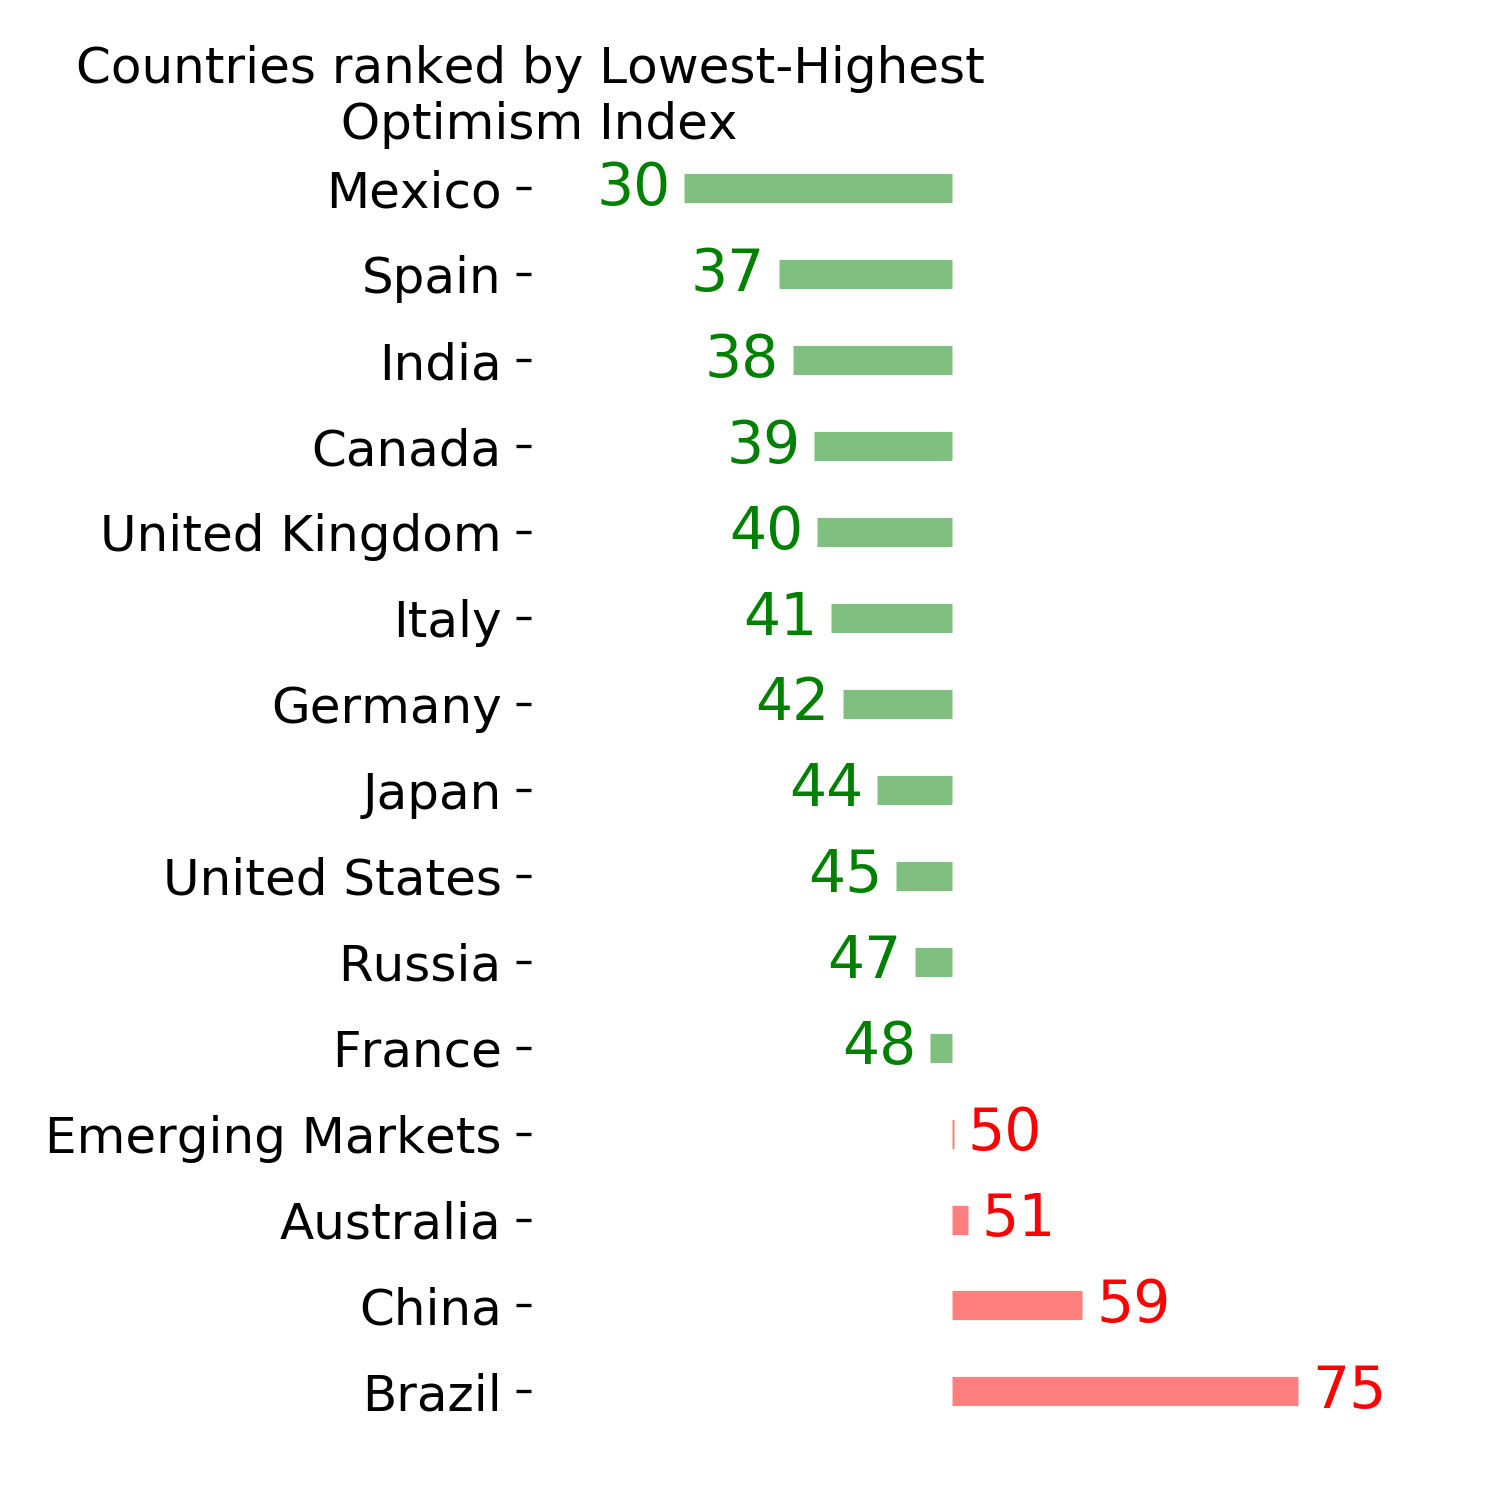
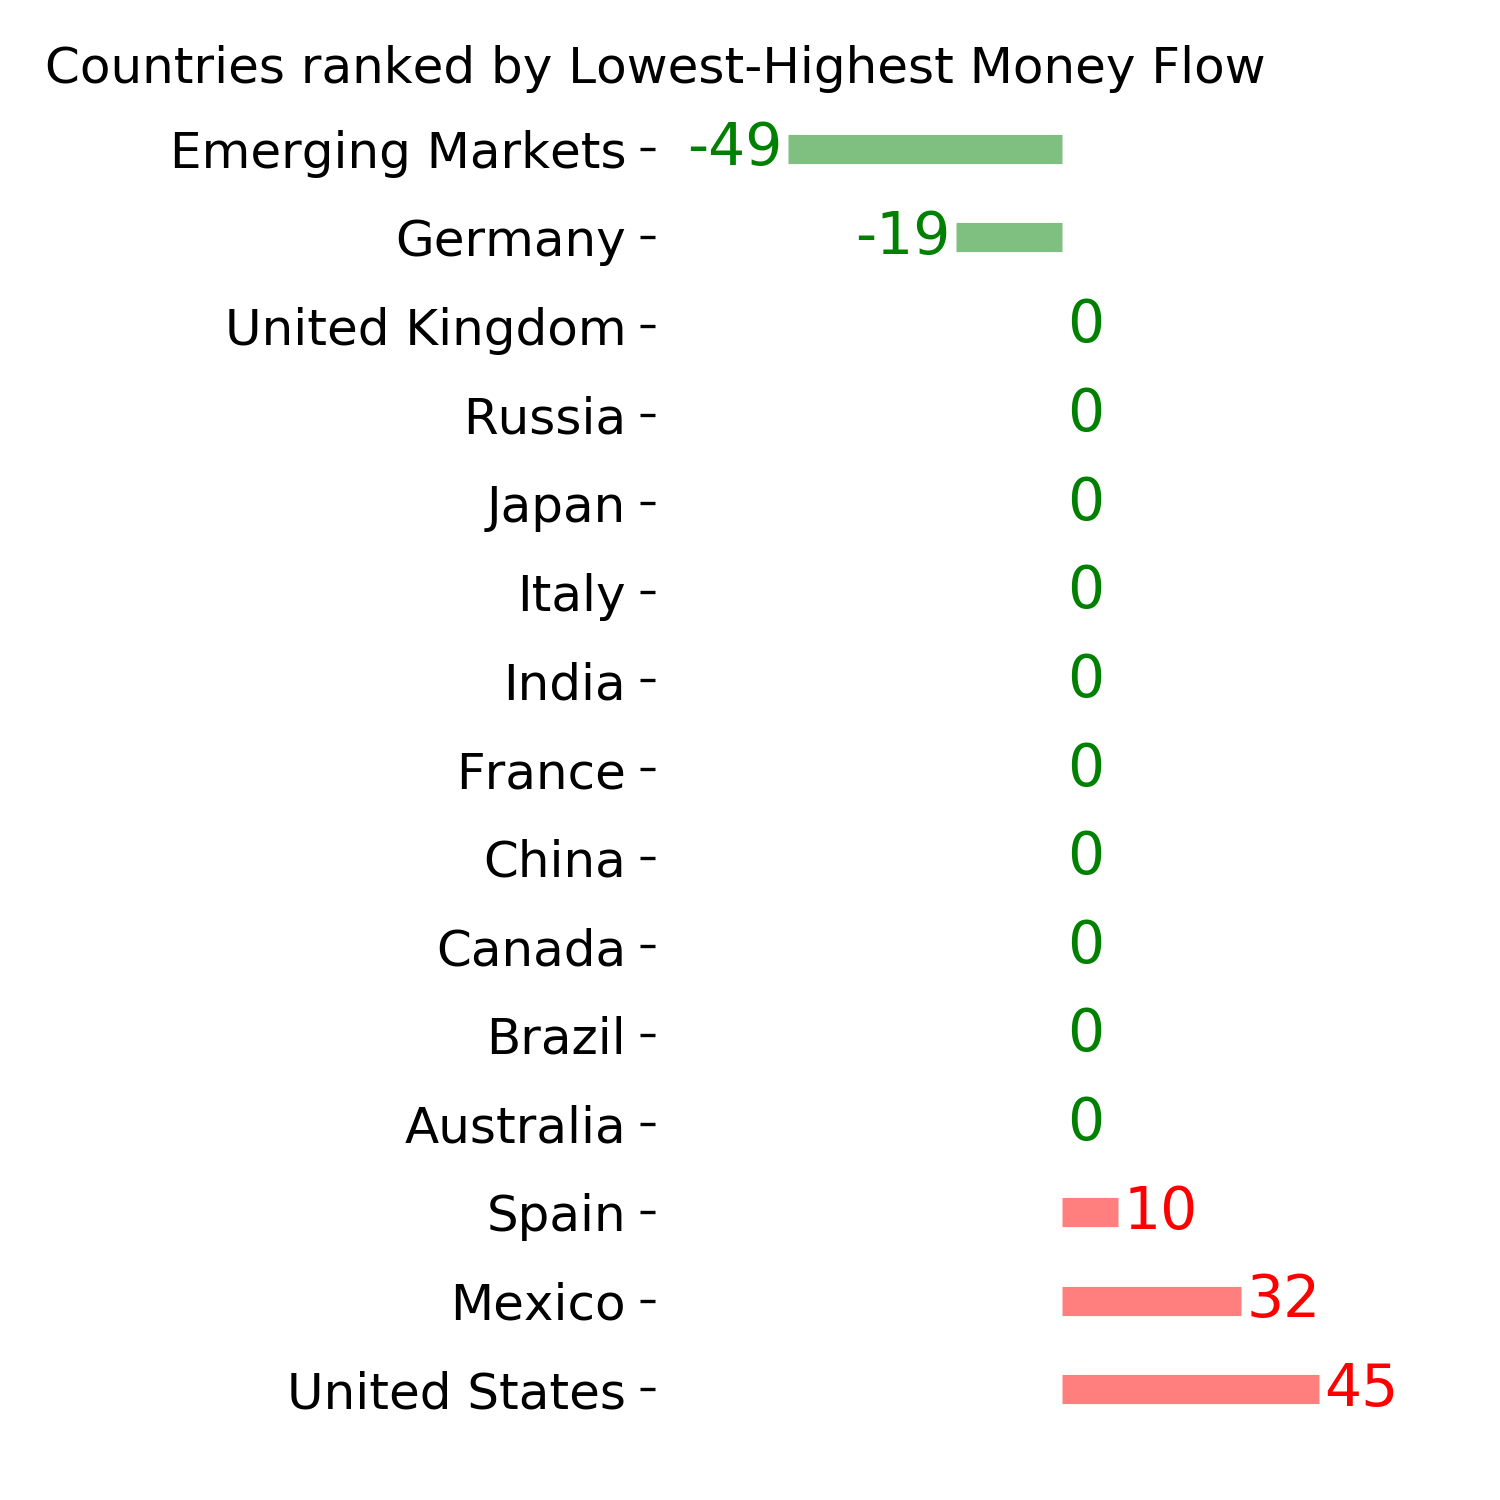
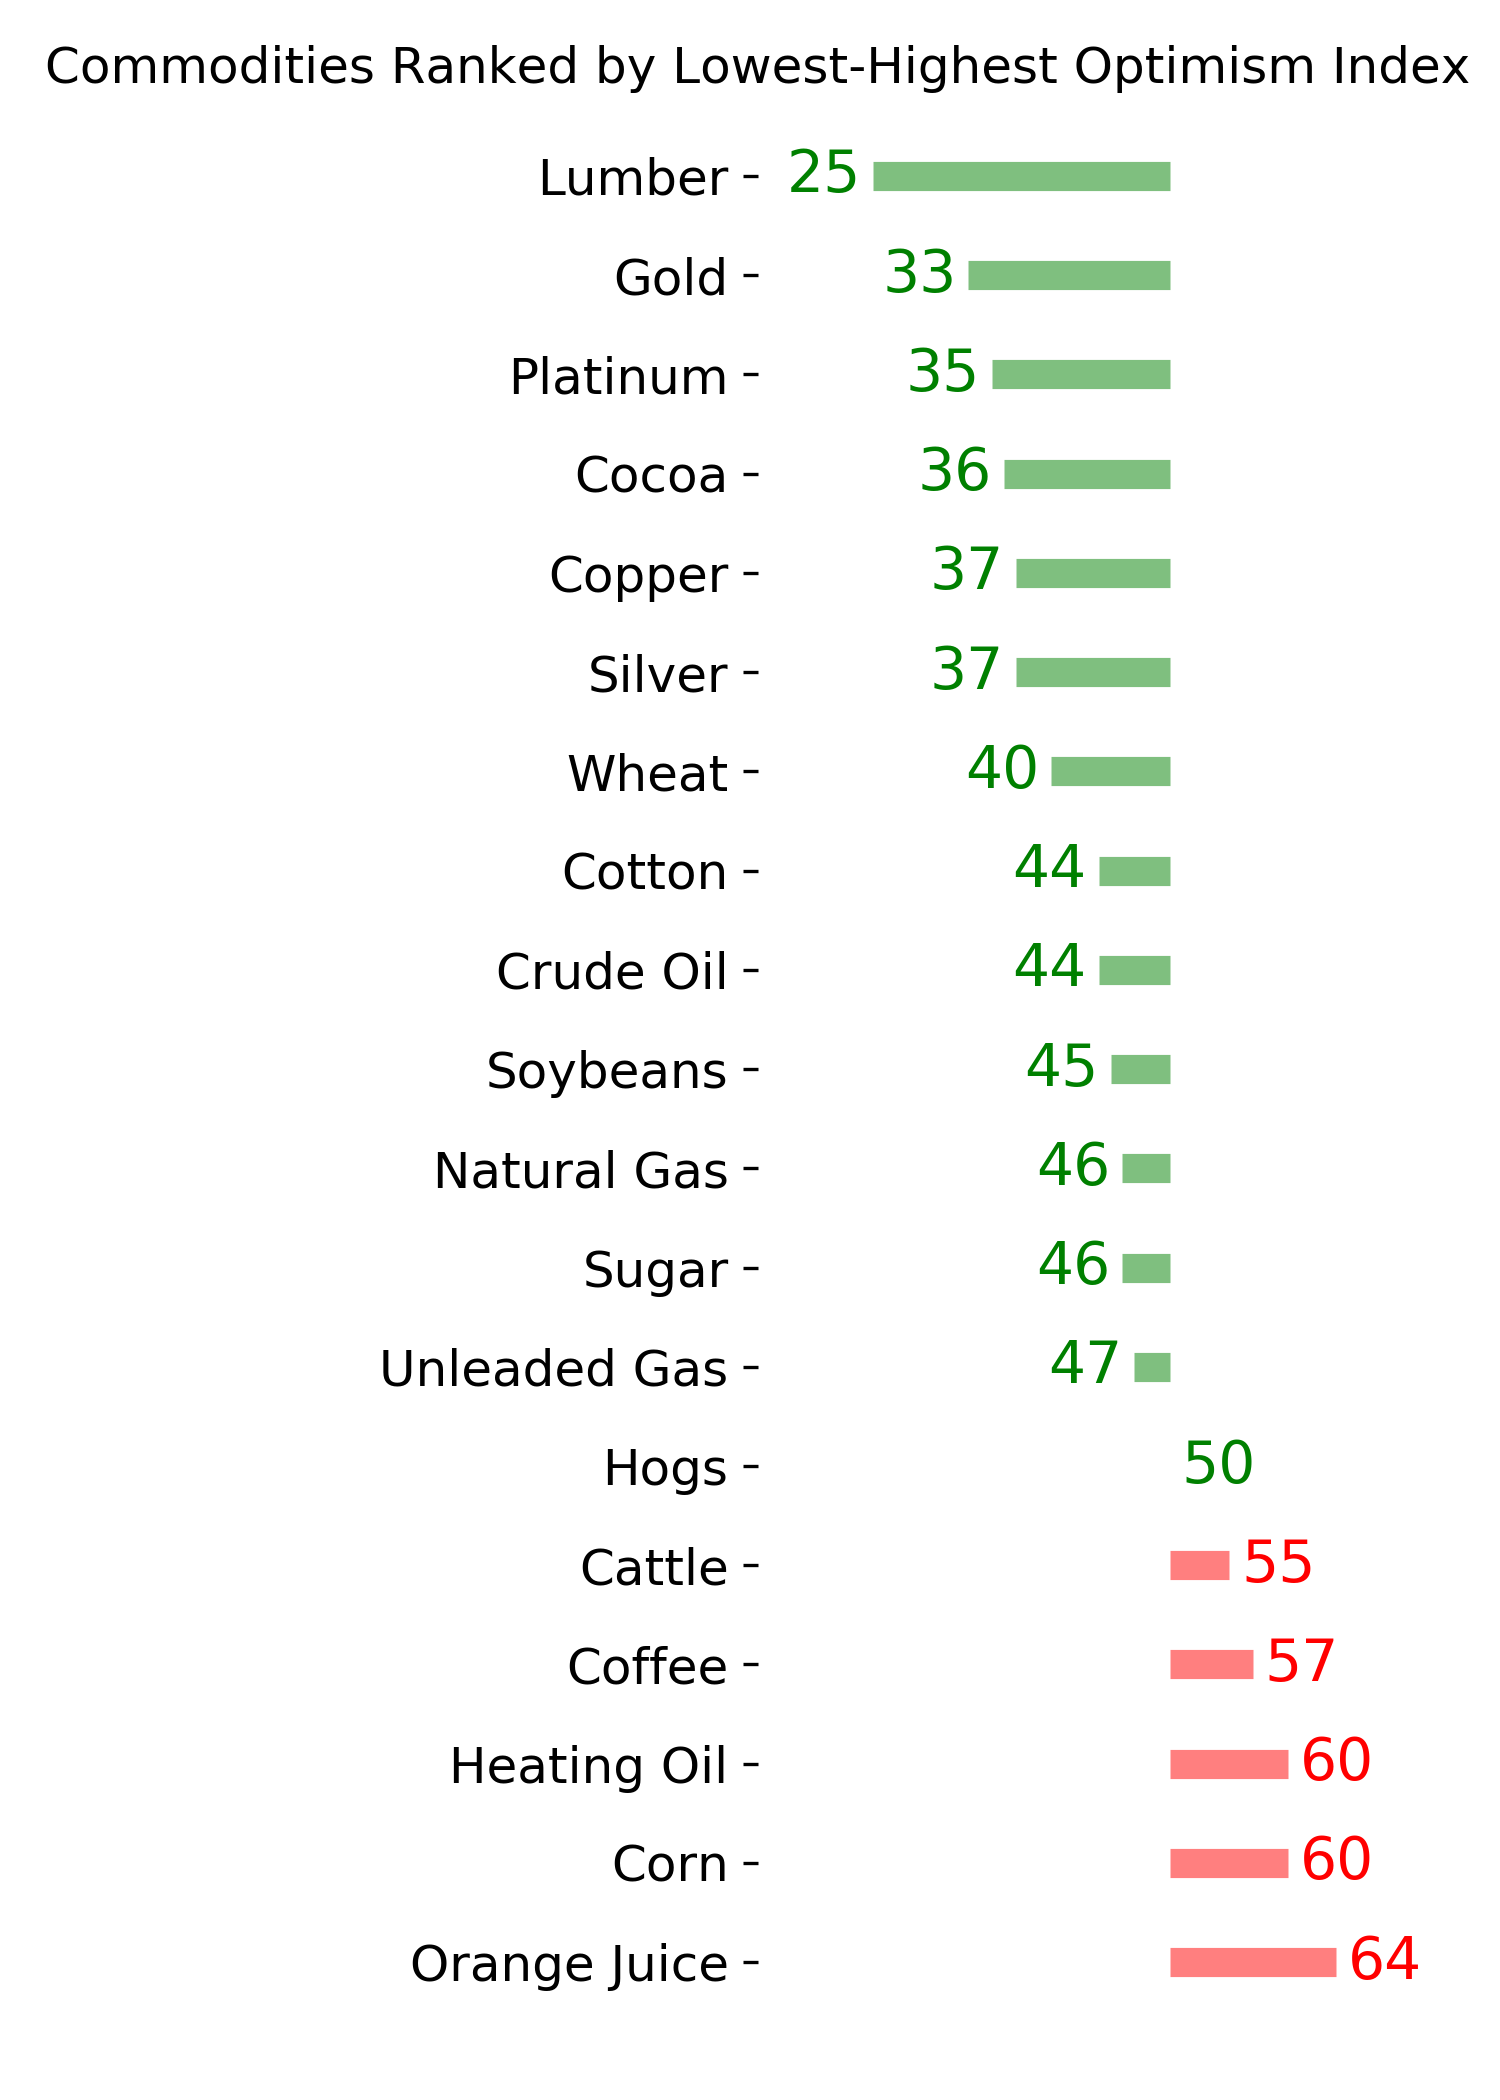
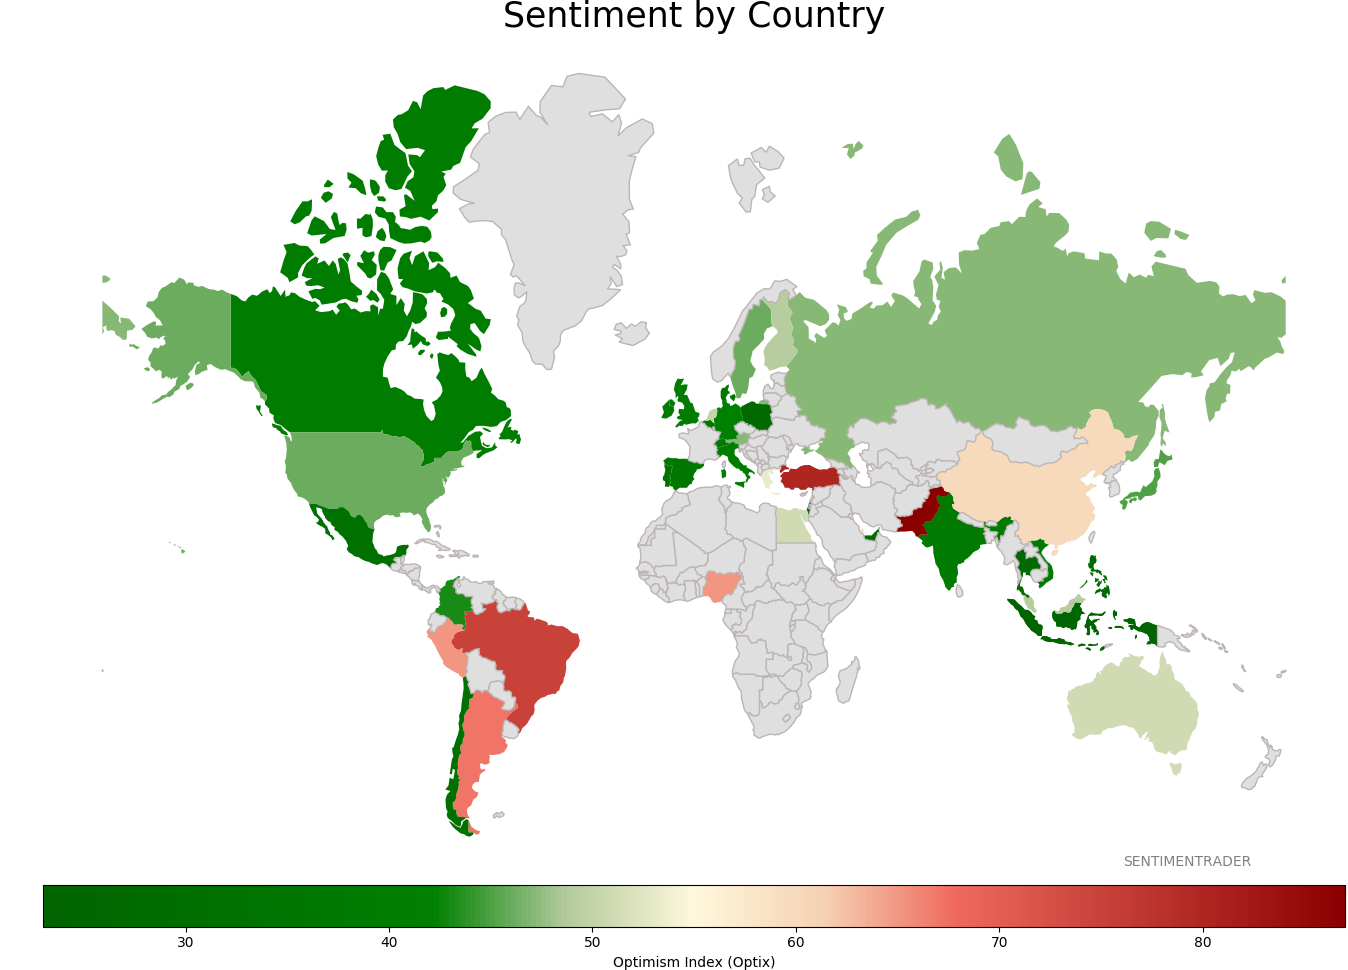
Sentiment Around The World
Optimism Index Thumbnails
|
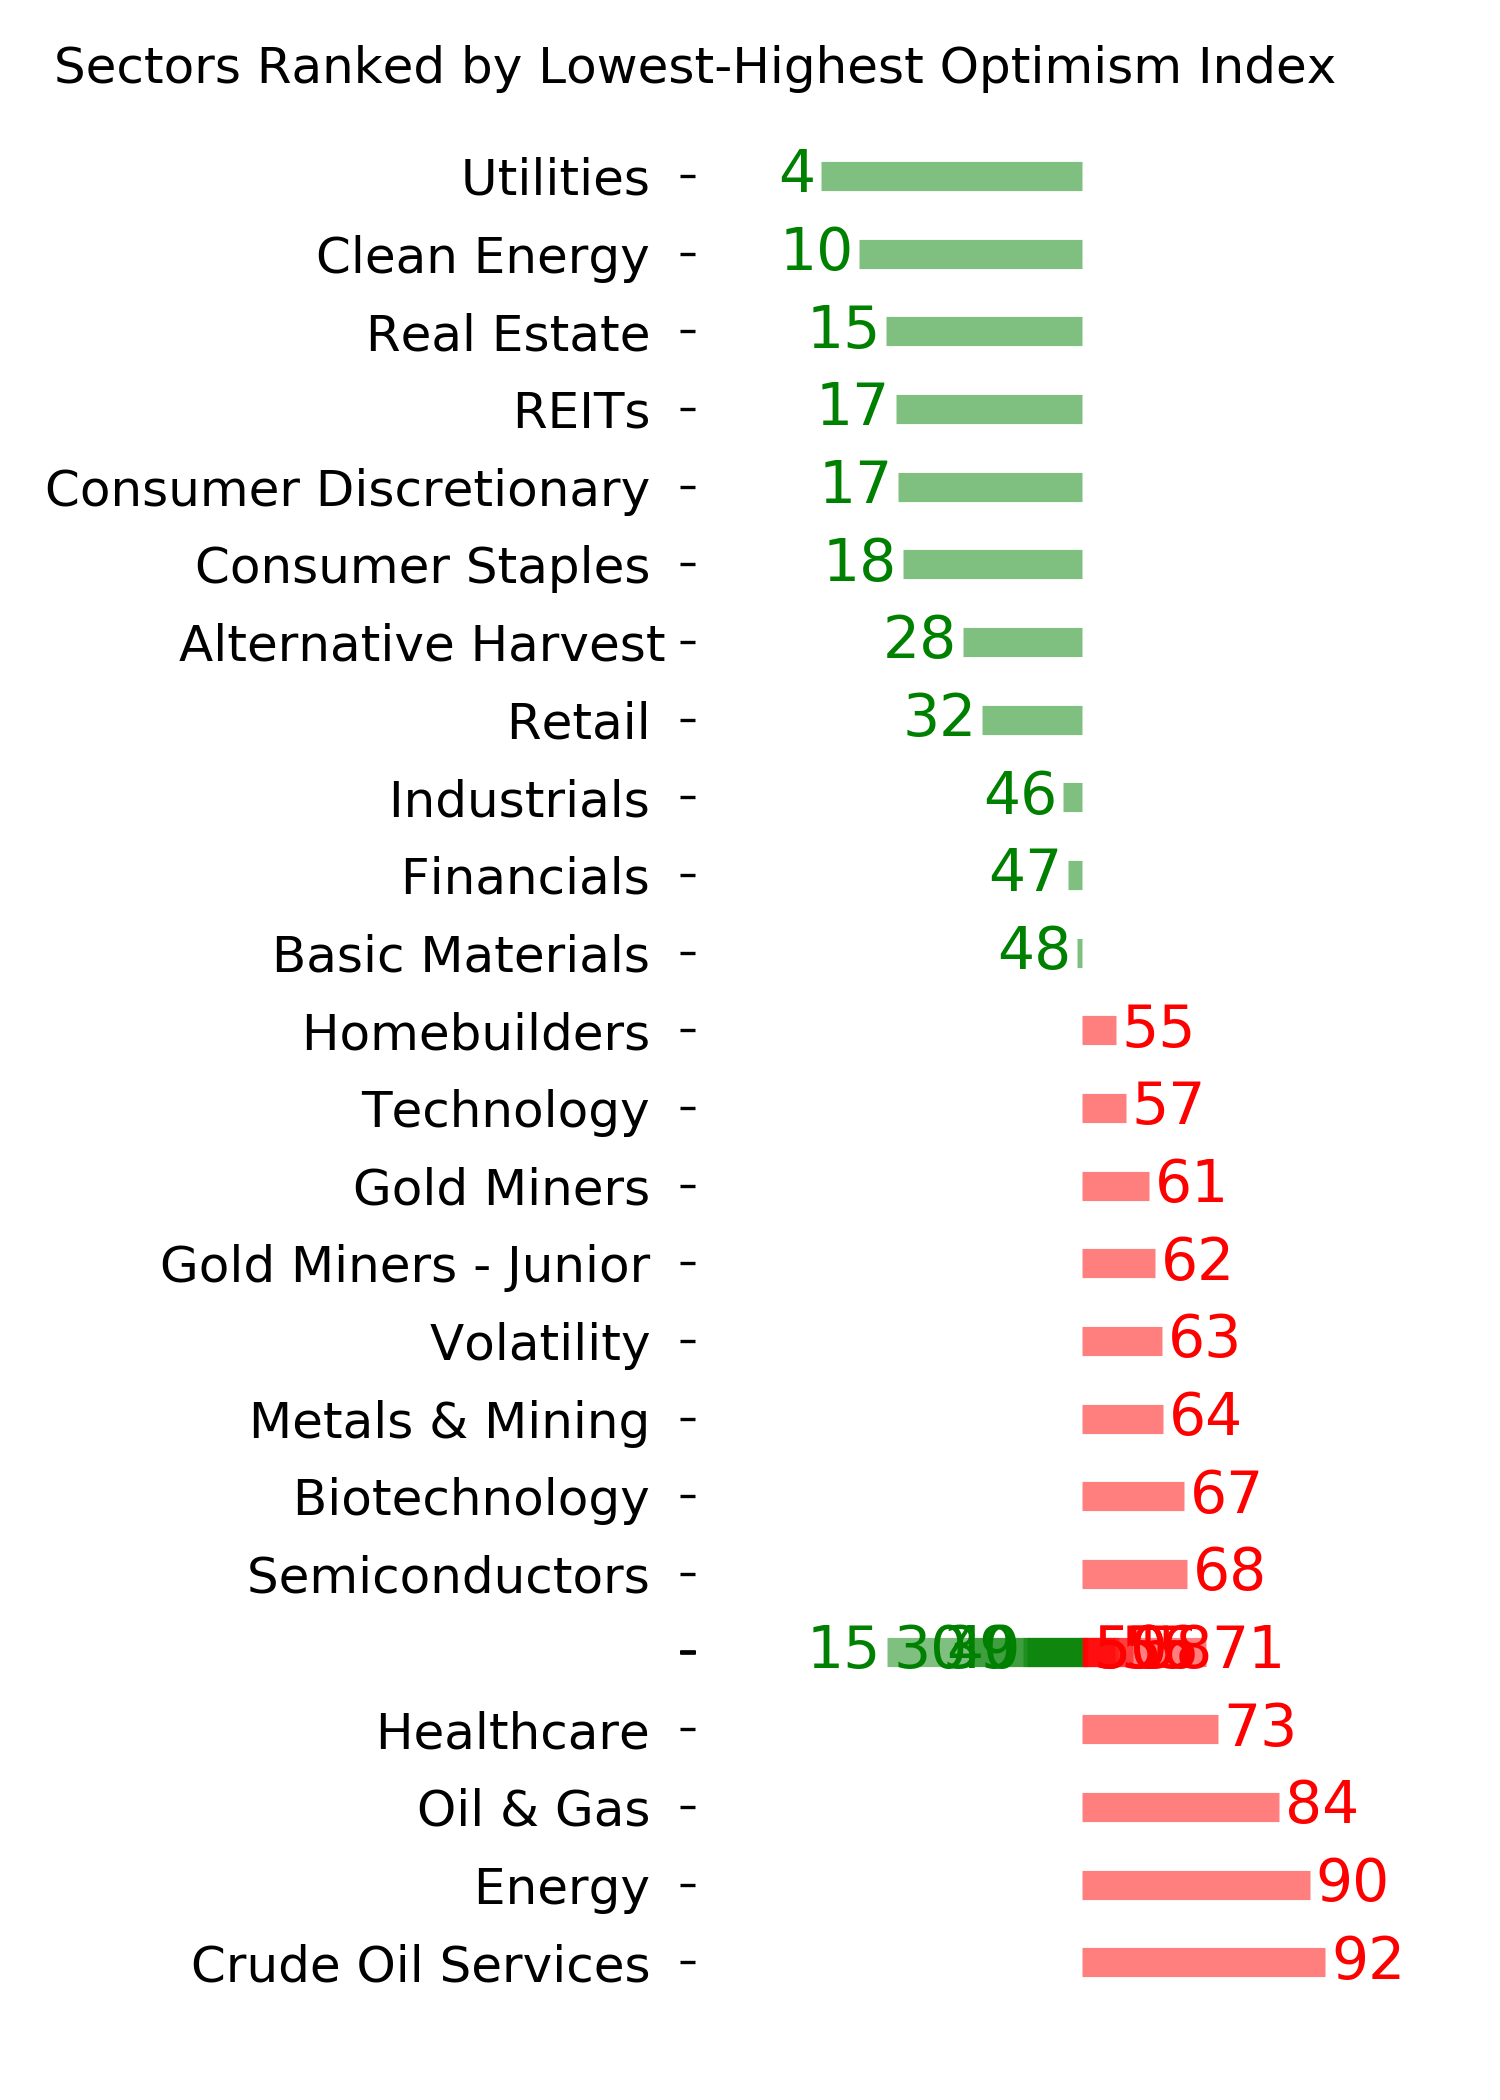
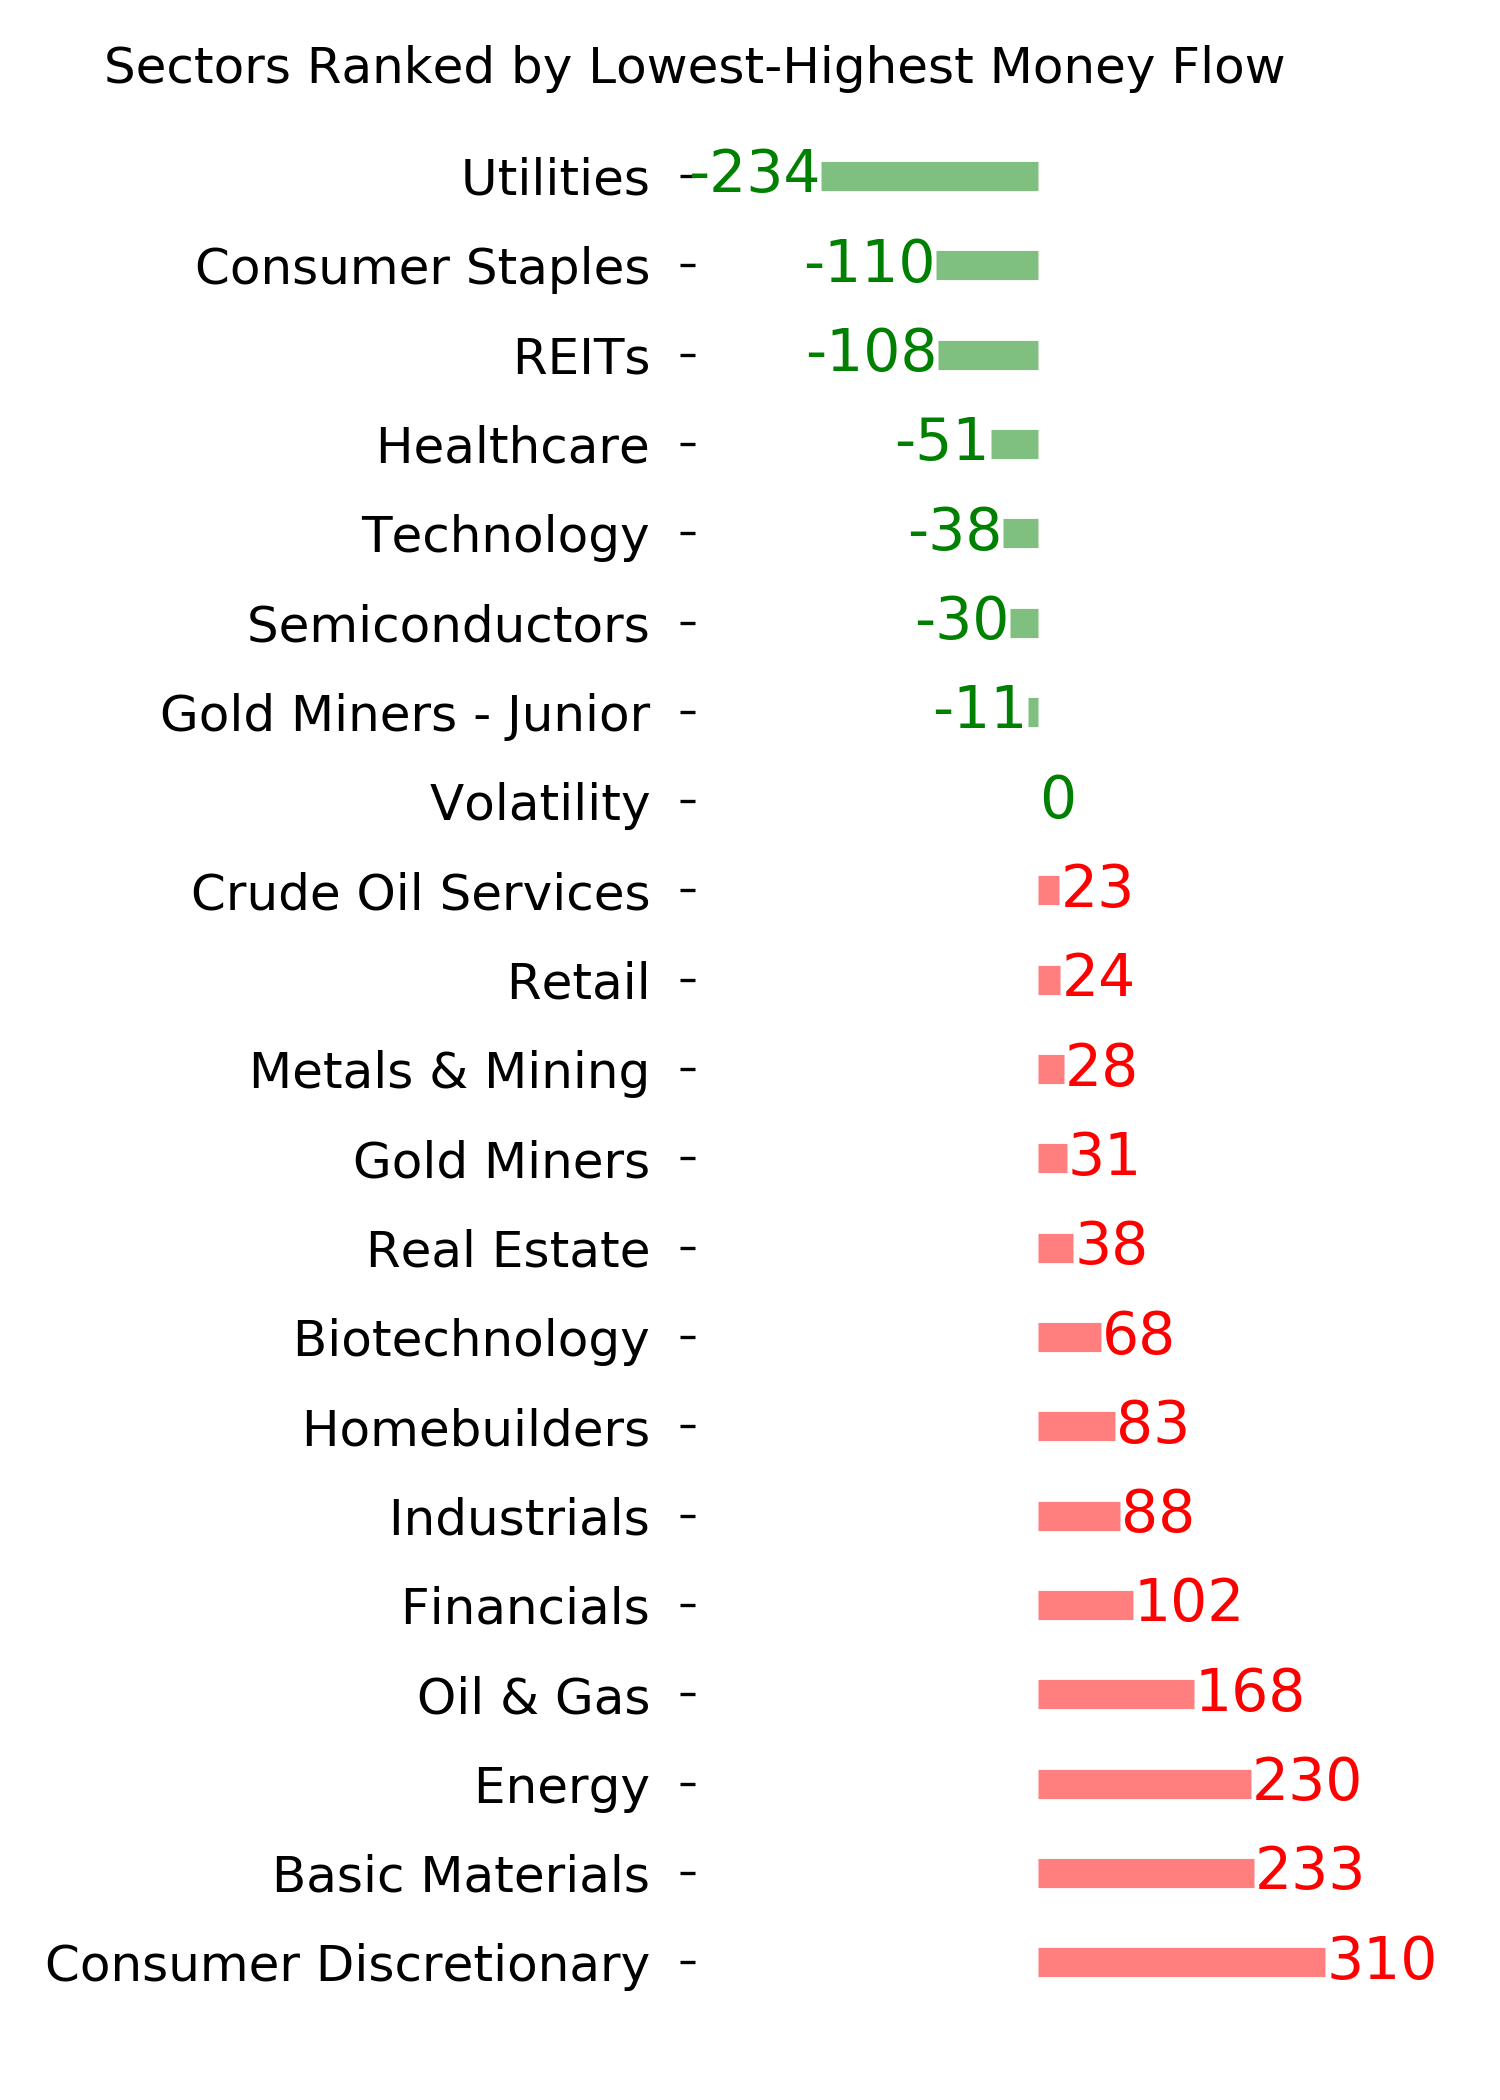
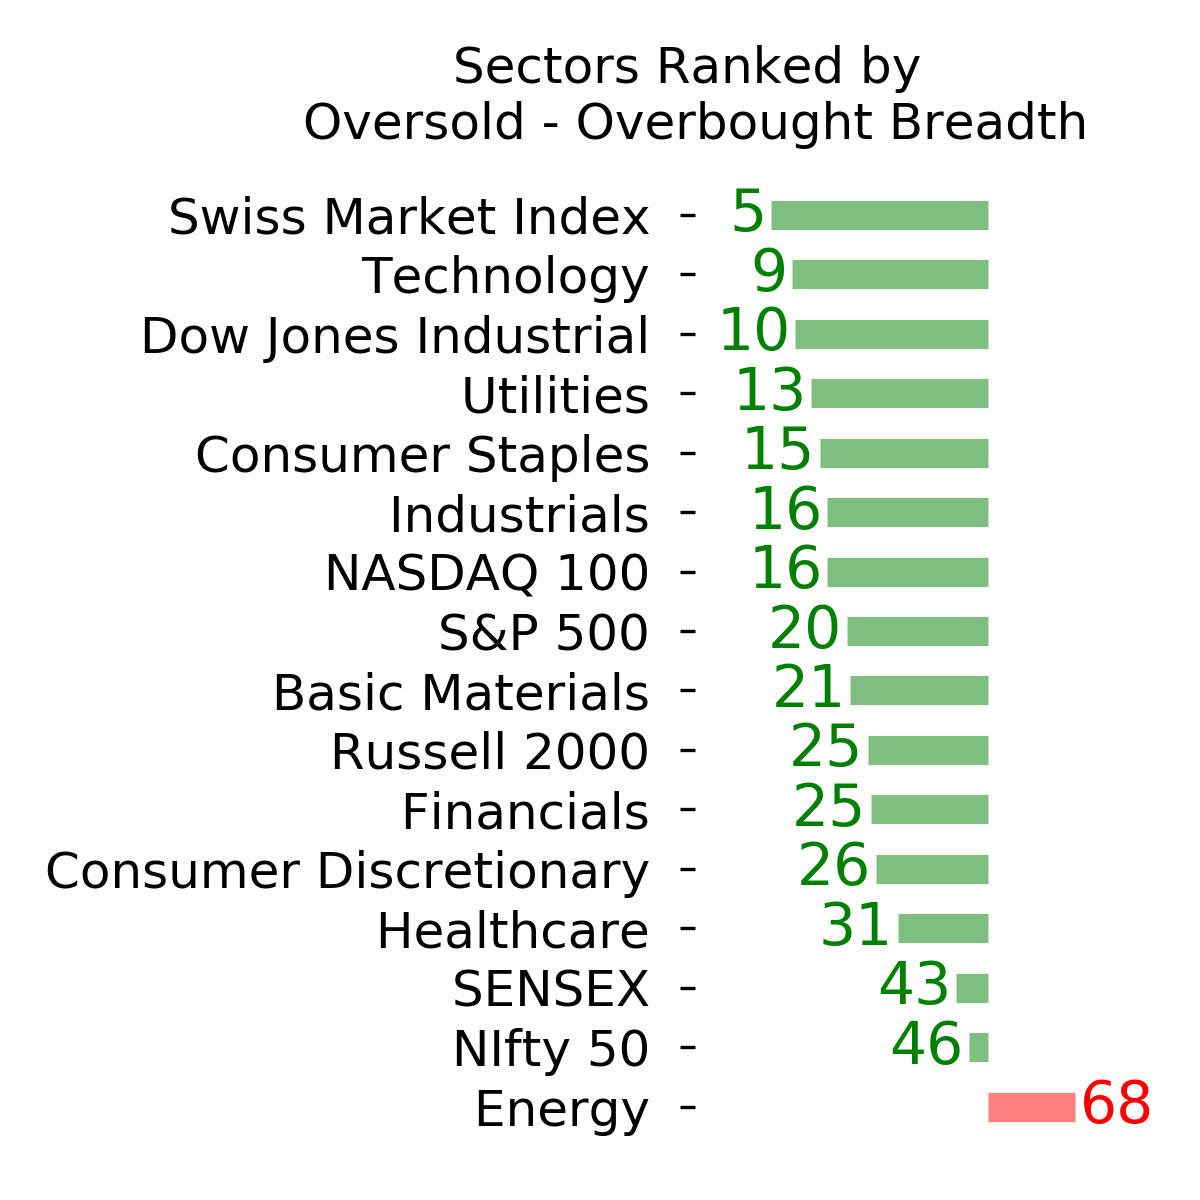
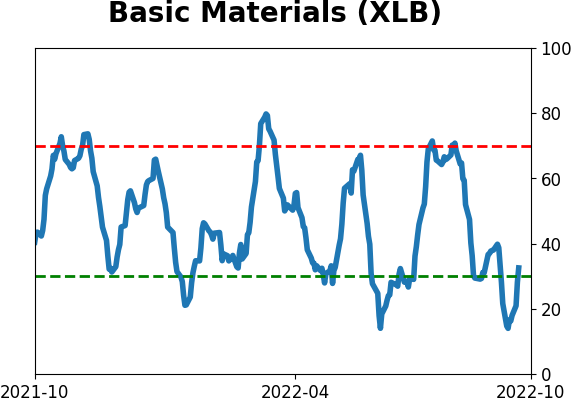
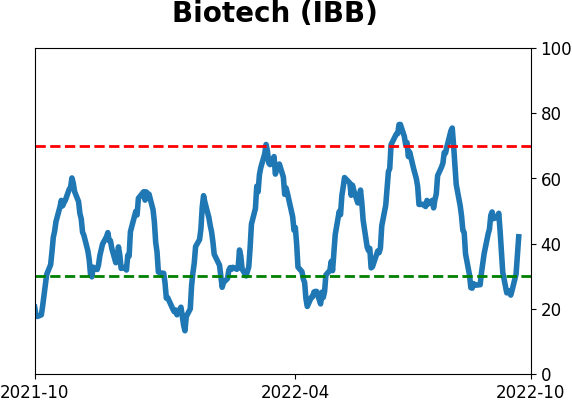
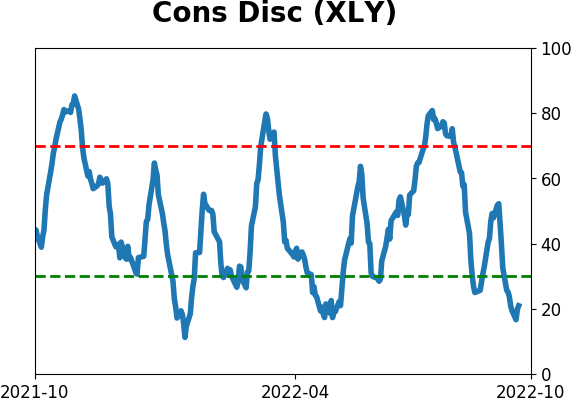
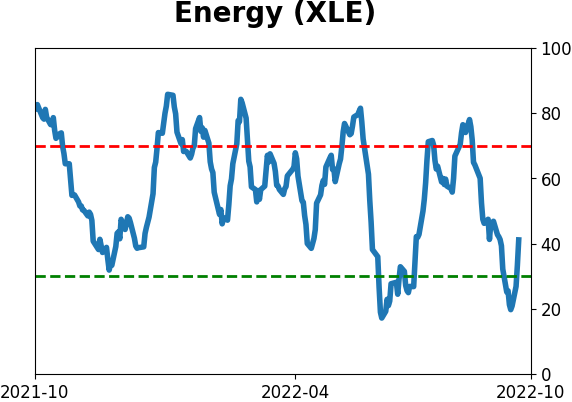
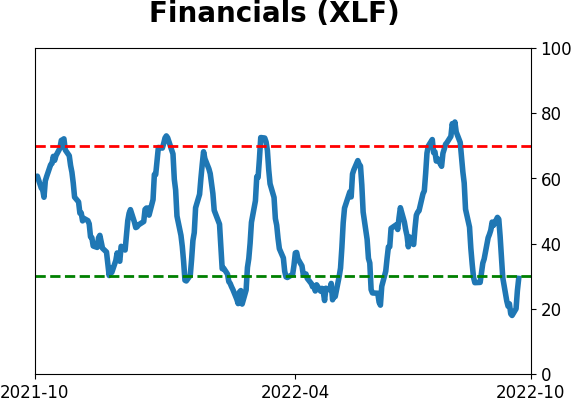
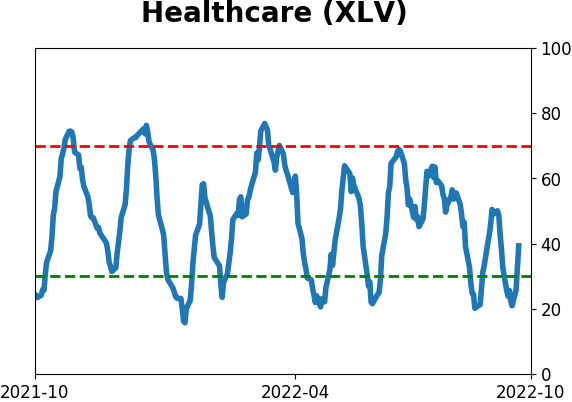
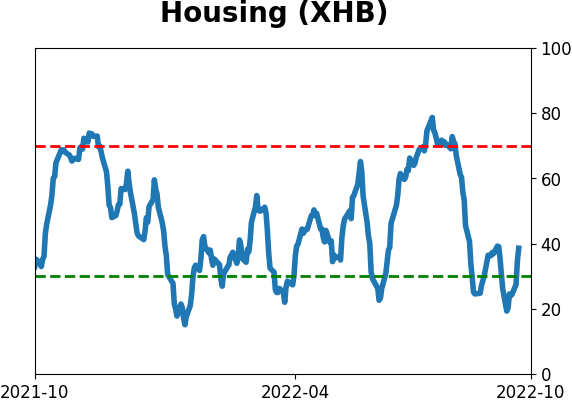
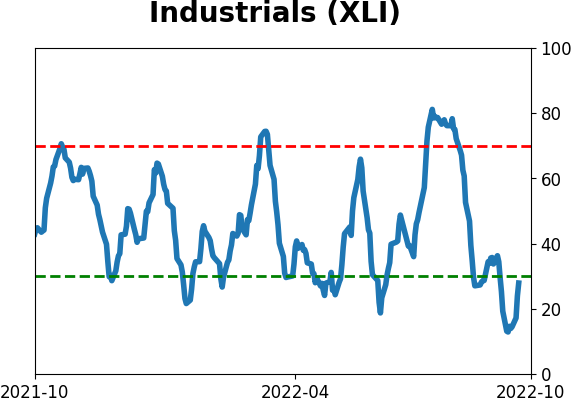
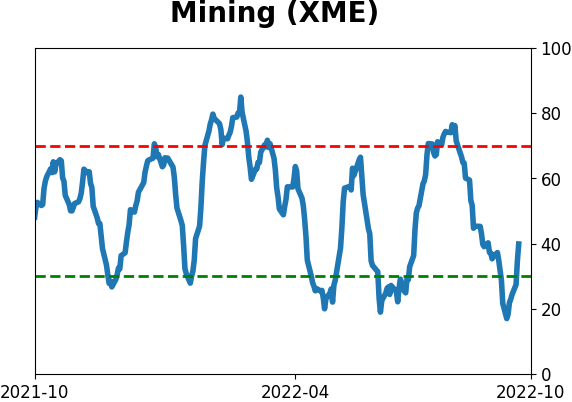
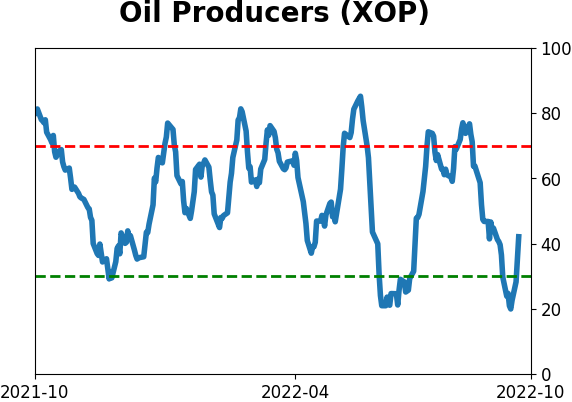
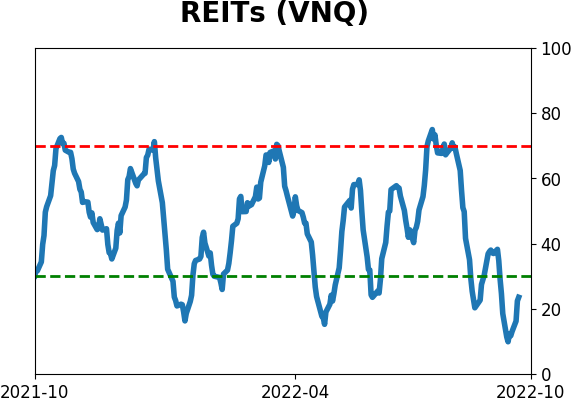
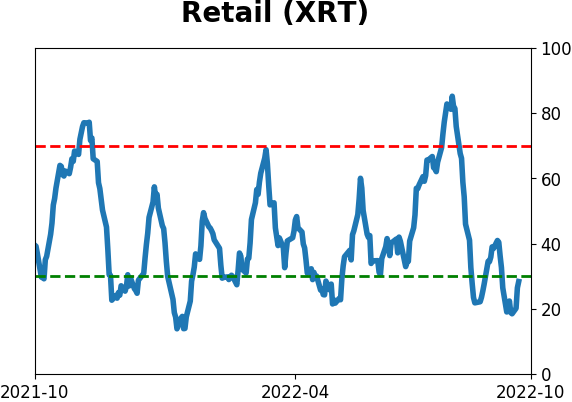
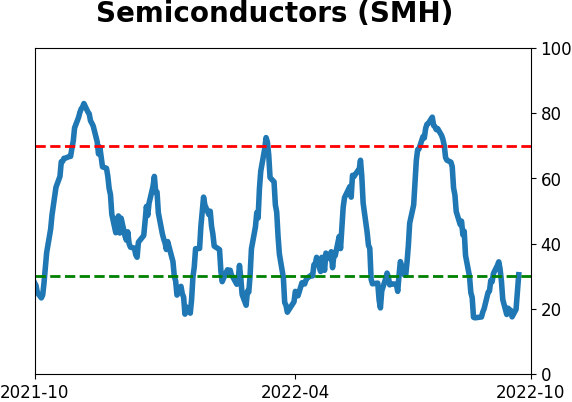
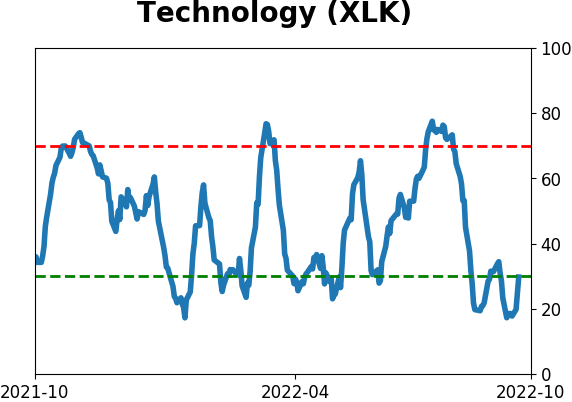
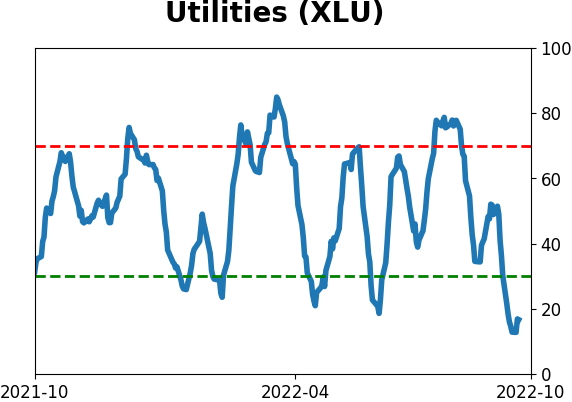
Sector ETF's - 10-Day Moving Average
|
|
|
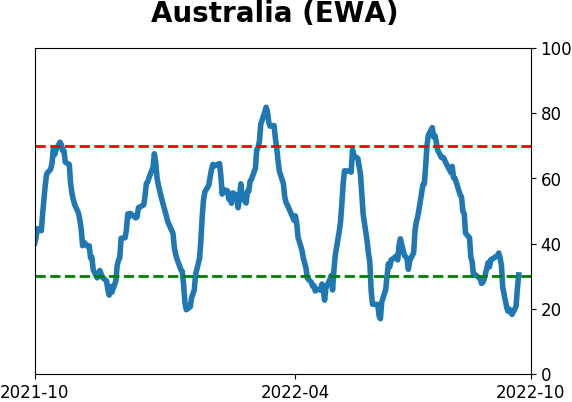
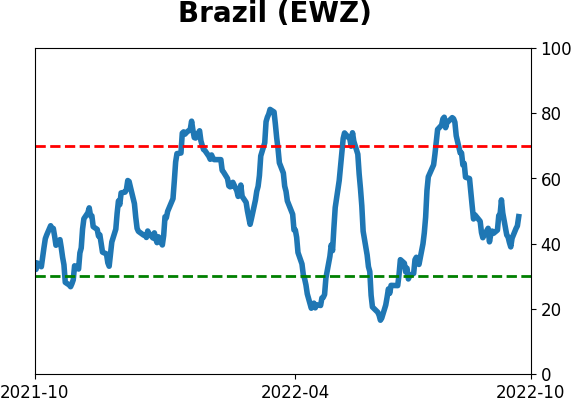
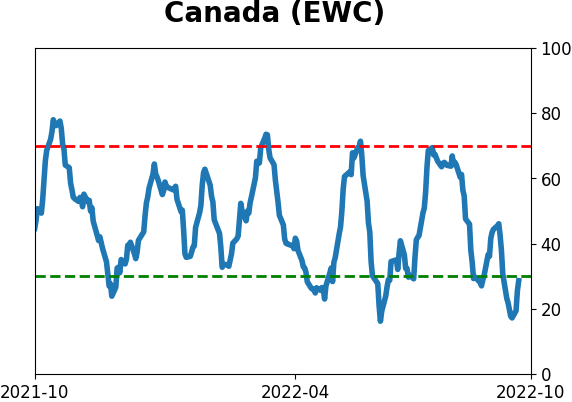
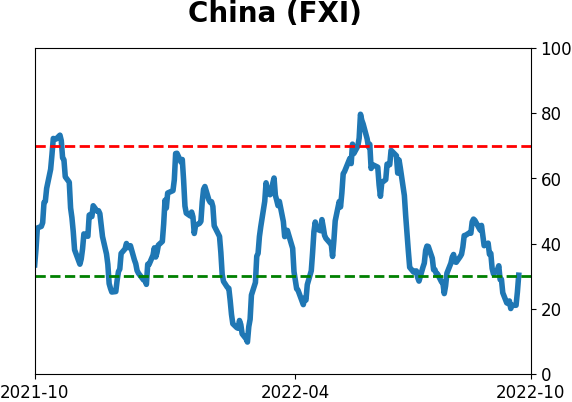
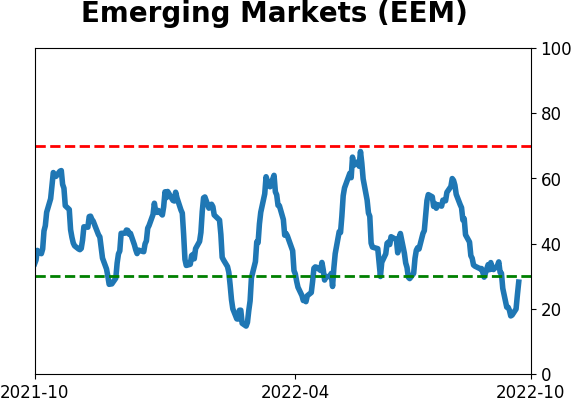
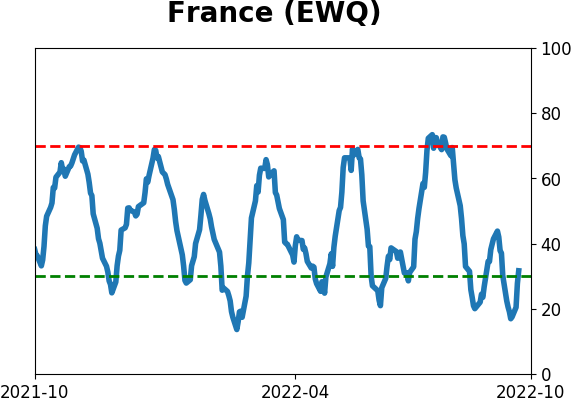
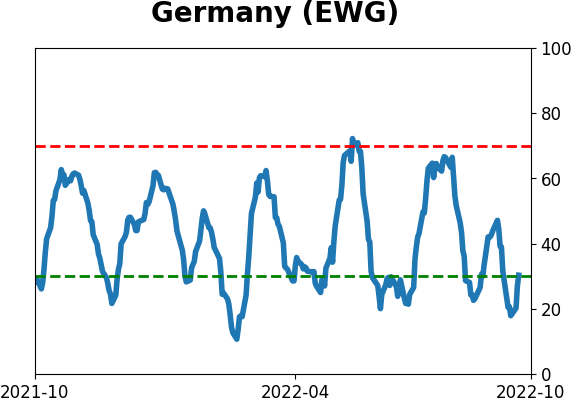
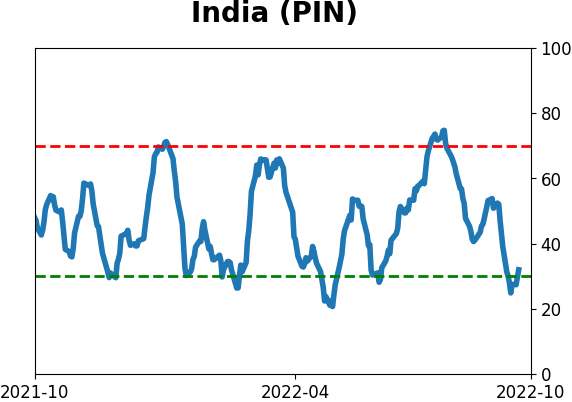
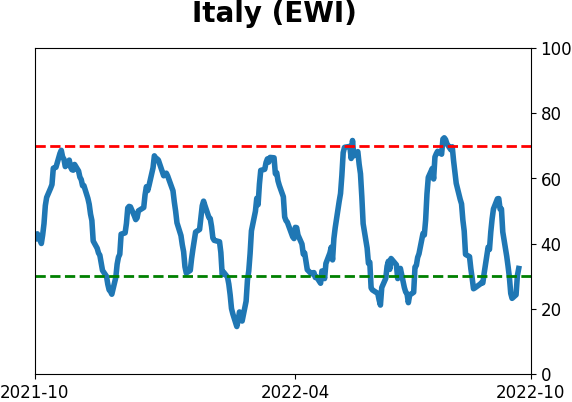
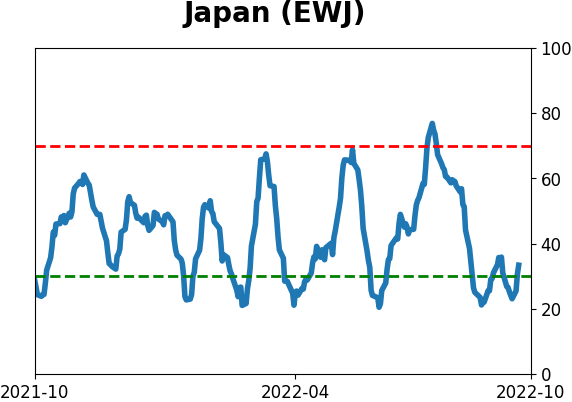
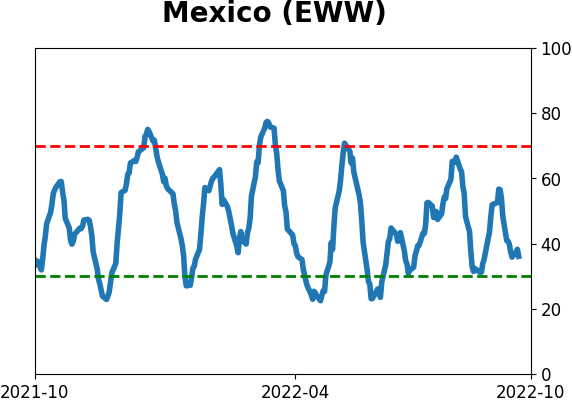
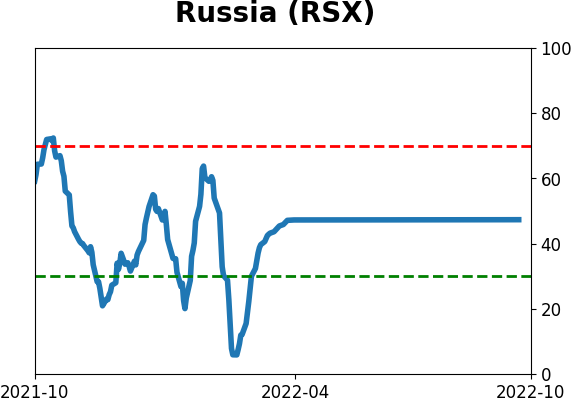
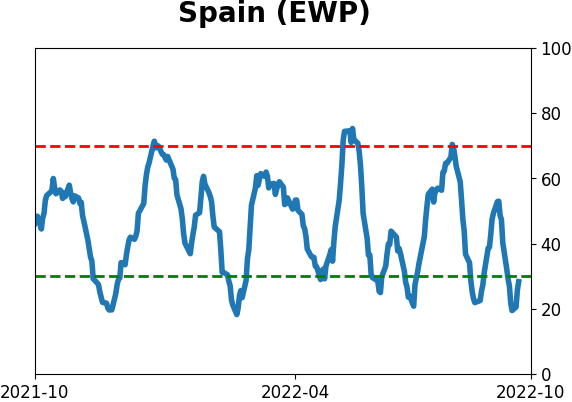
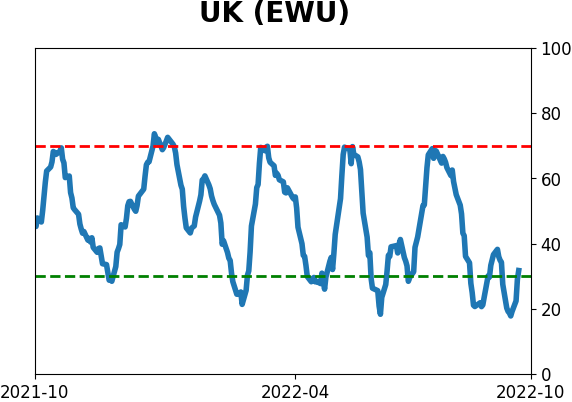
Country ETF's - 10-Day Moving Average
|
|
|
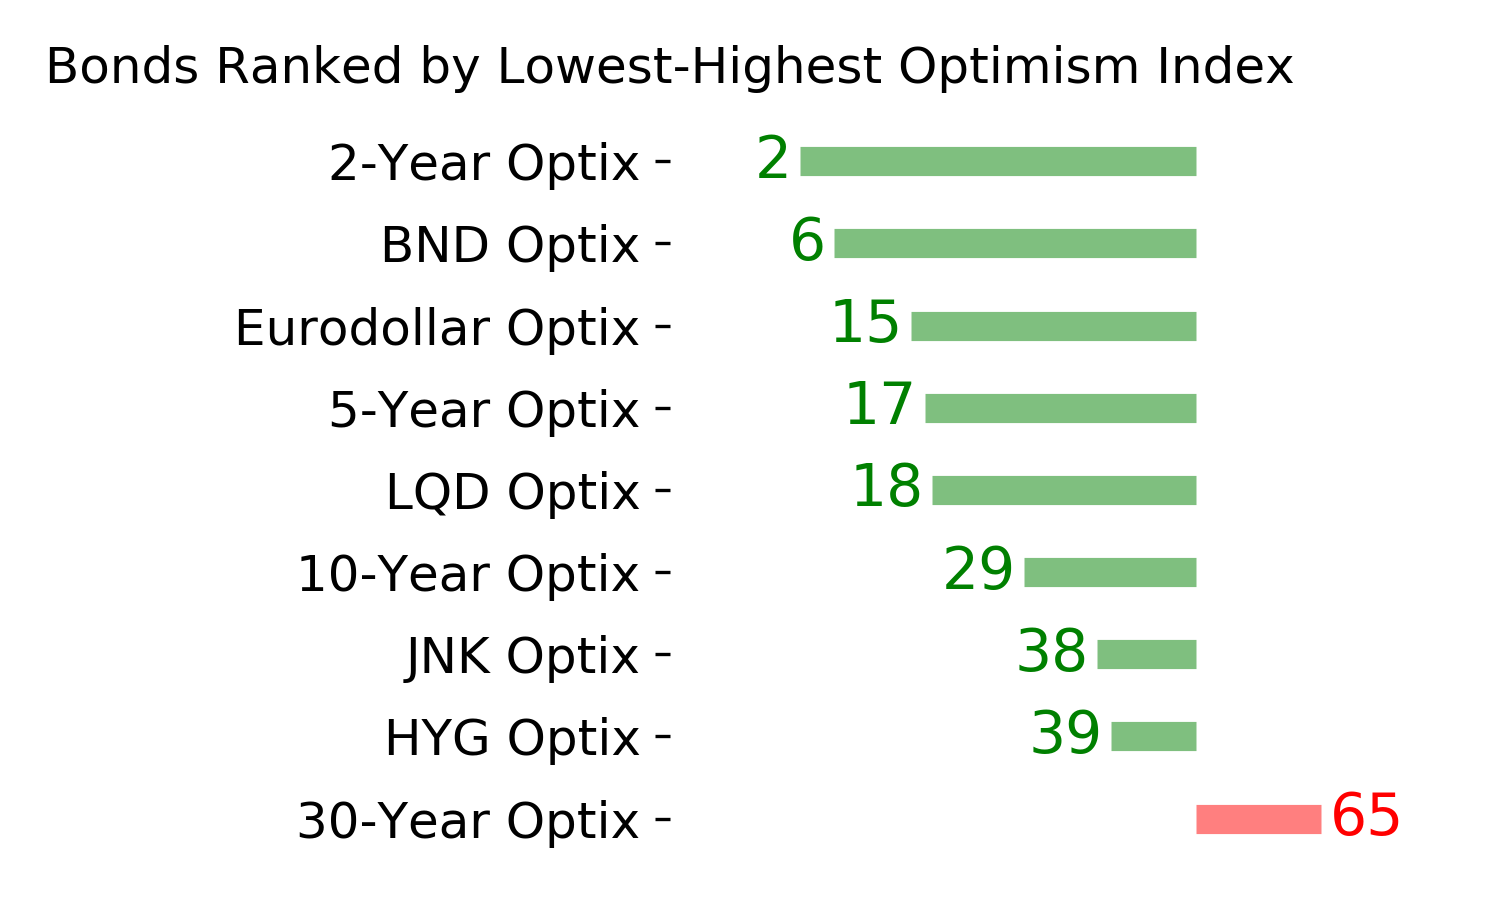
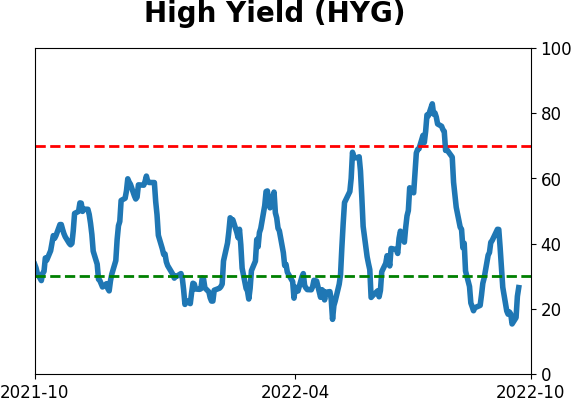
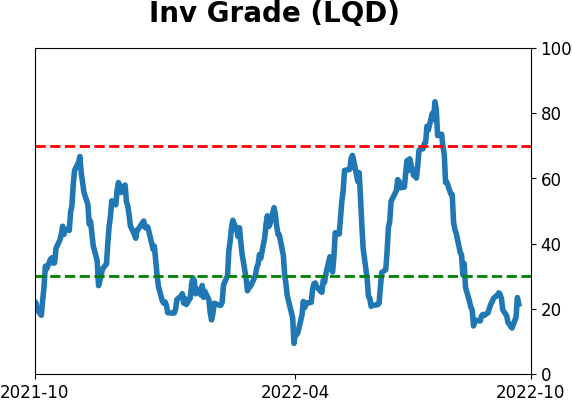
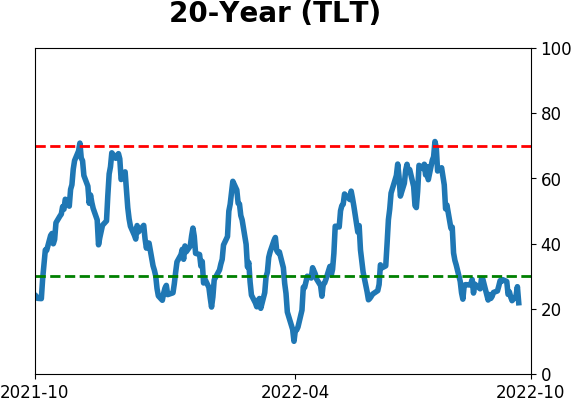
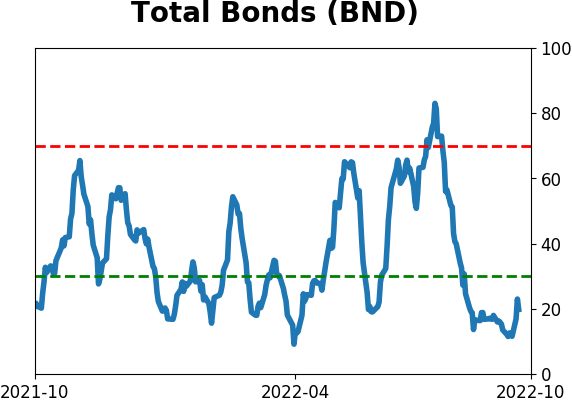
Bond ETF's - 10-Day Moving Average
|
|
|
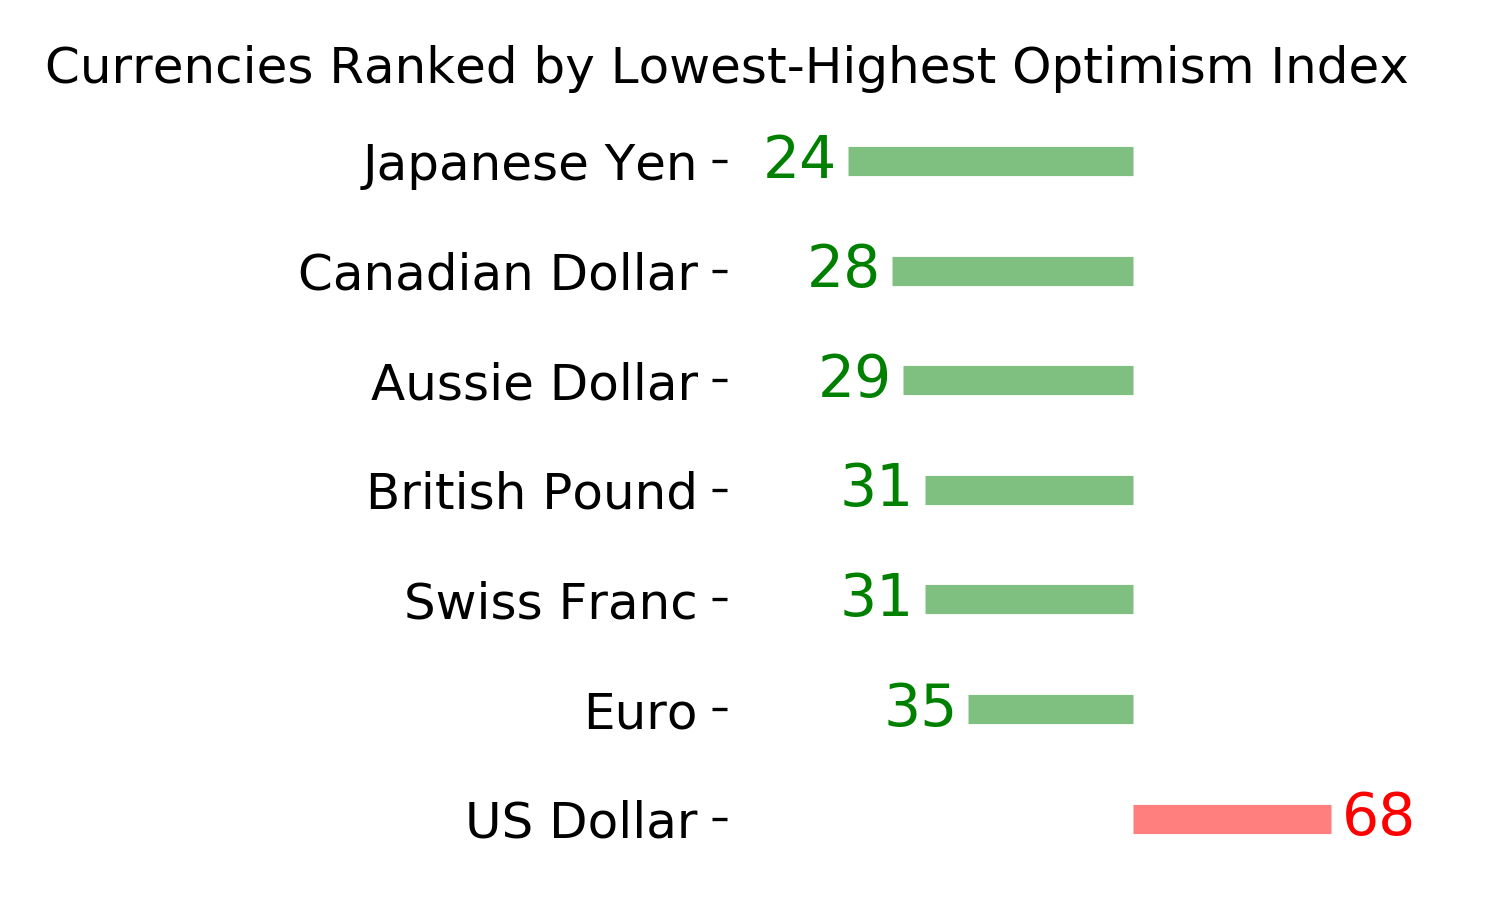
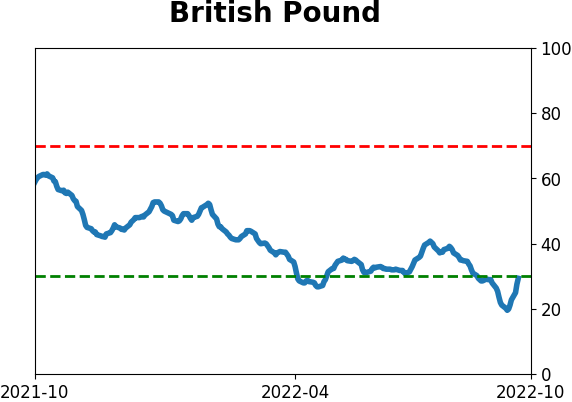
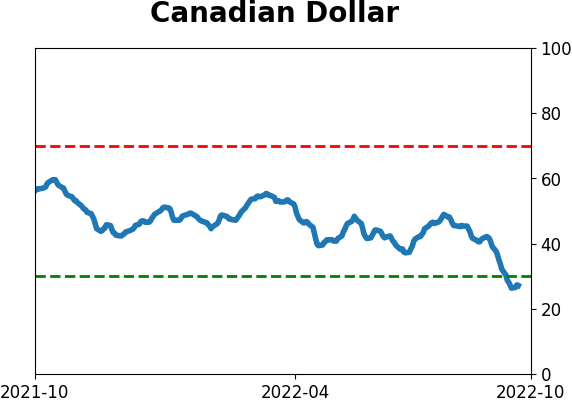
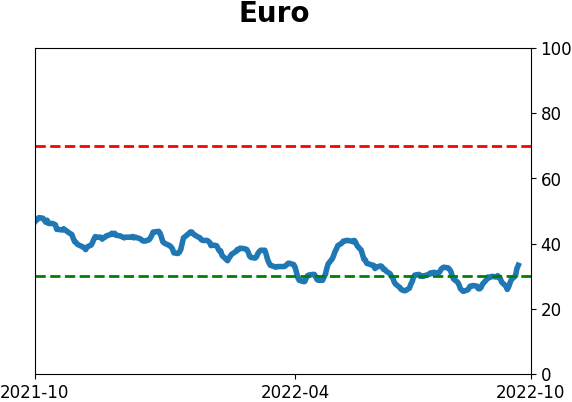
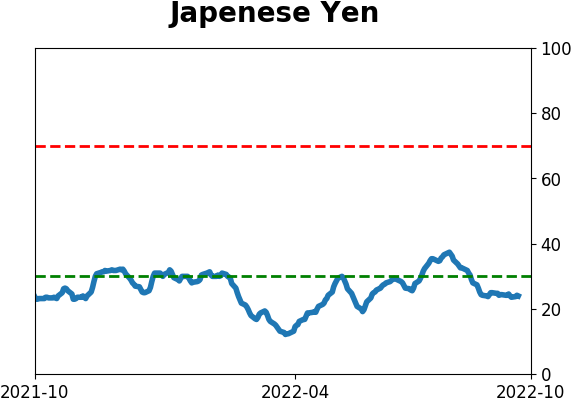
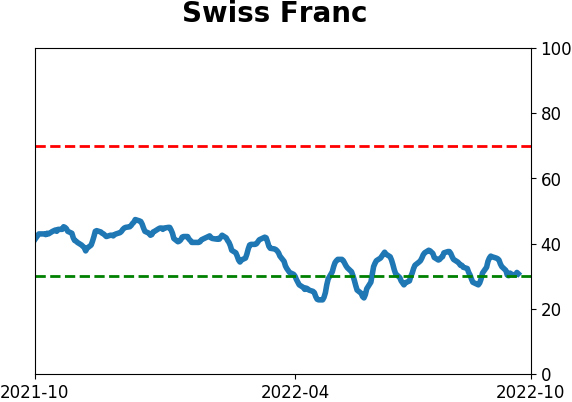
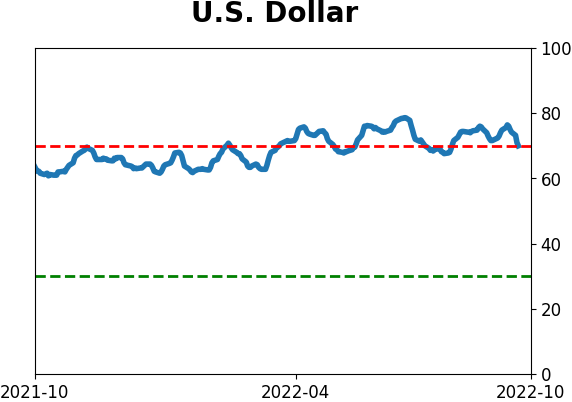
Currency ETF's - 5-Day Moving Average
|
|
|
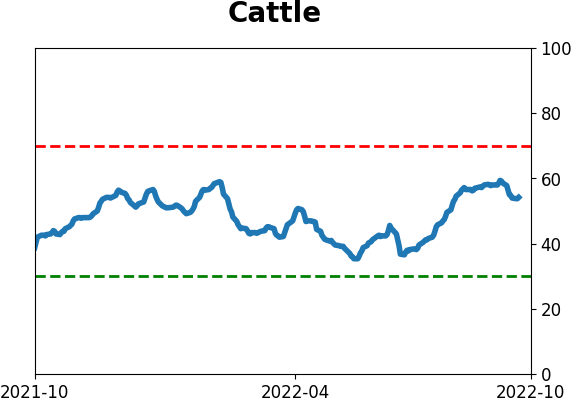
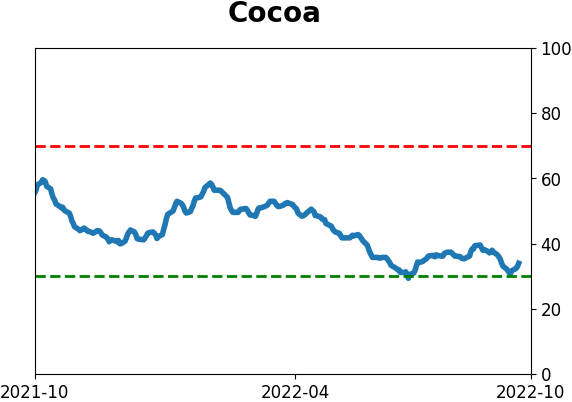
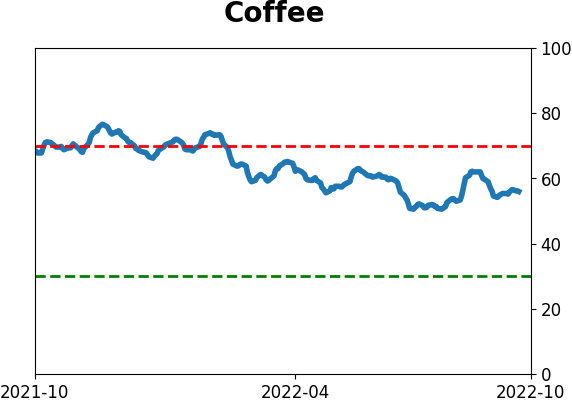
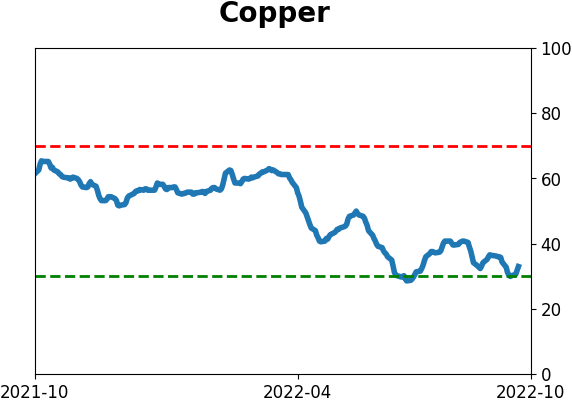
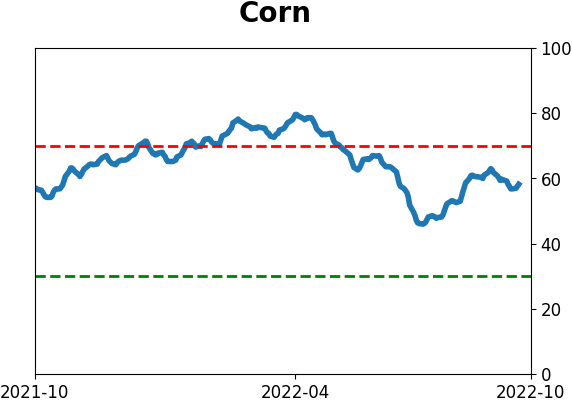
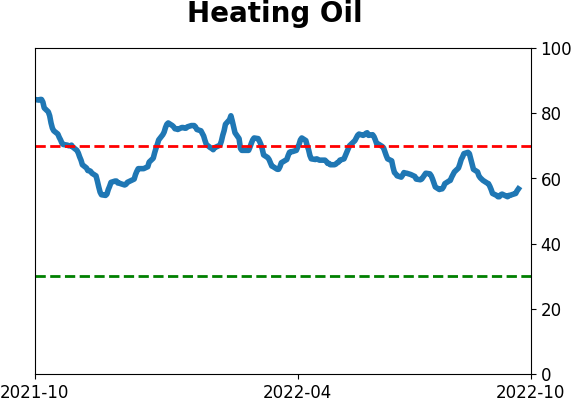
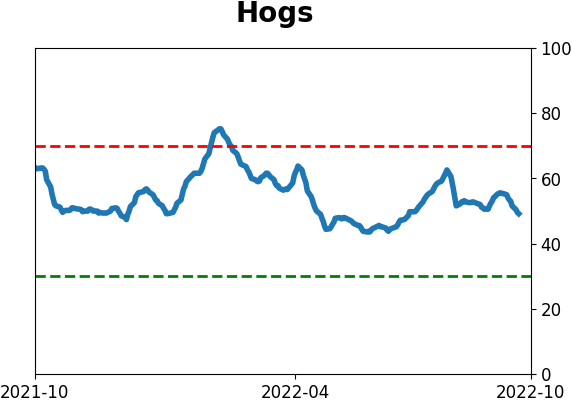
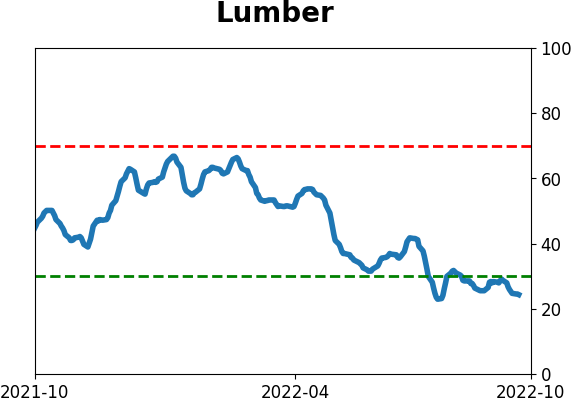
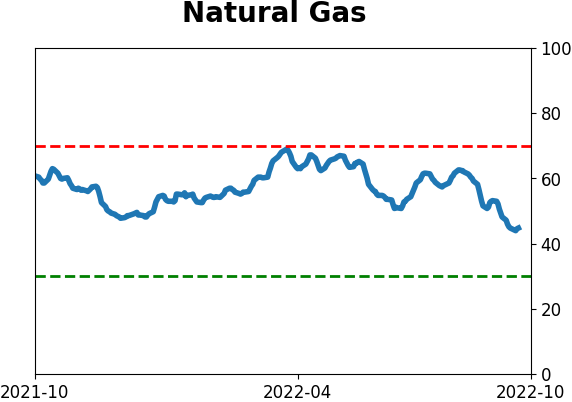
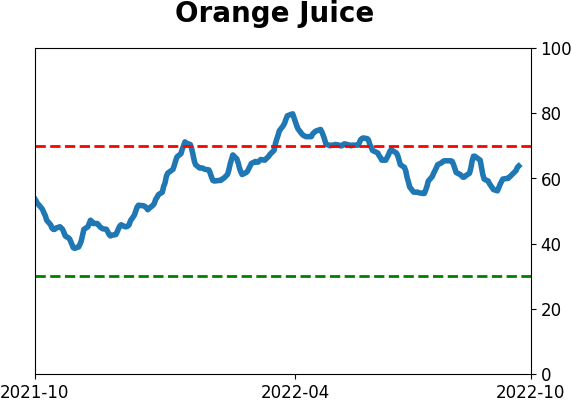
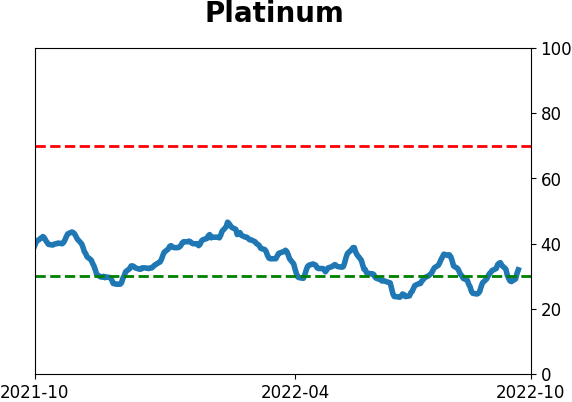
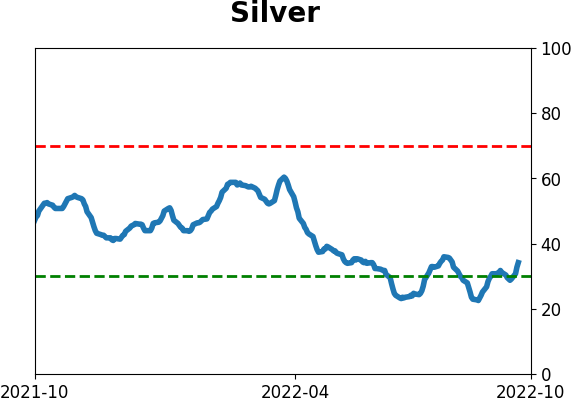
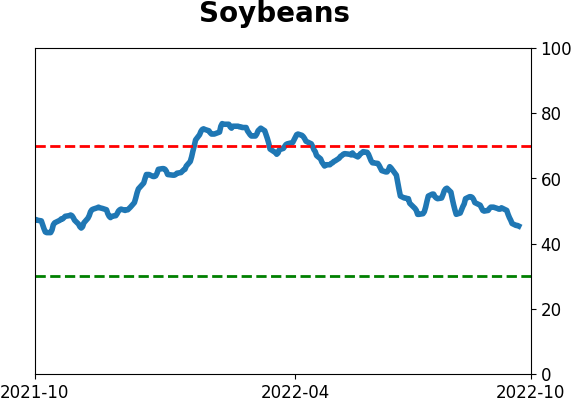
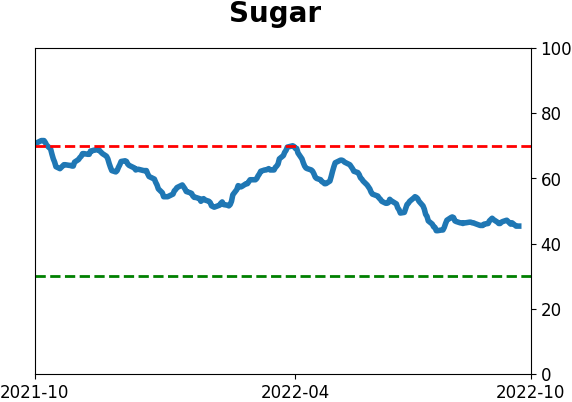
Commodity ETF's - 5-Day Moving Average
|
|