Headlines
|
|
Bond yields march on with a relentless rise:
Another spurt higher in yields has captured the media's attention, with "relentless" becoming an increasingly common reference. Over multiple time frames, the rise in 10-year yields is nearing a historic extreme, but that has not preceded consistent results for bonds. It has for stocks, and it was almost universally bad.
|
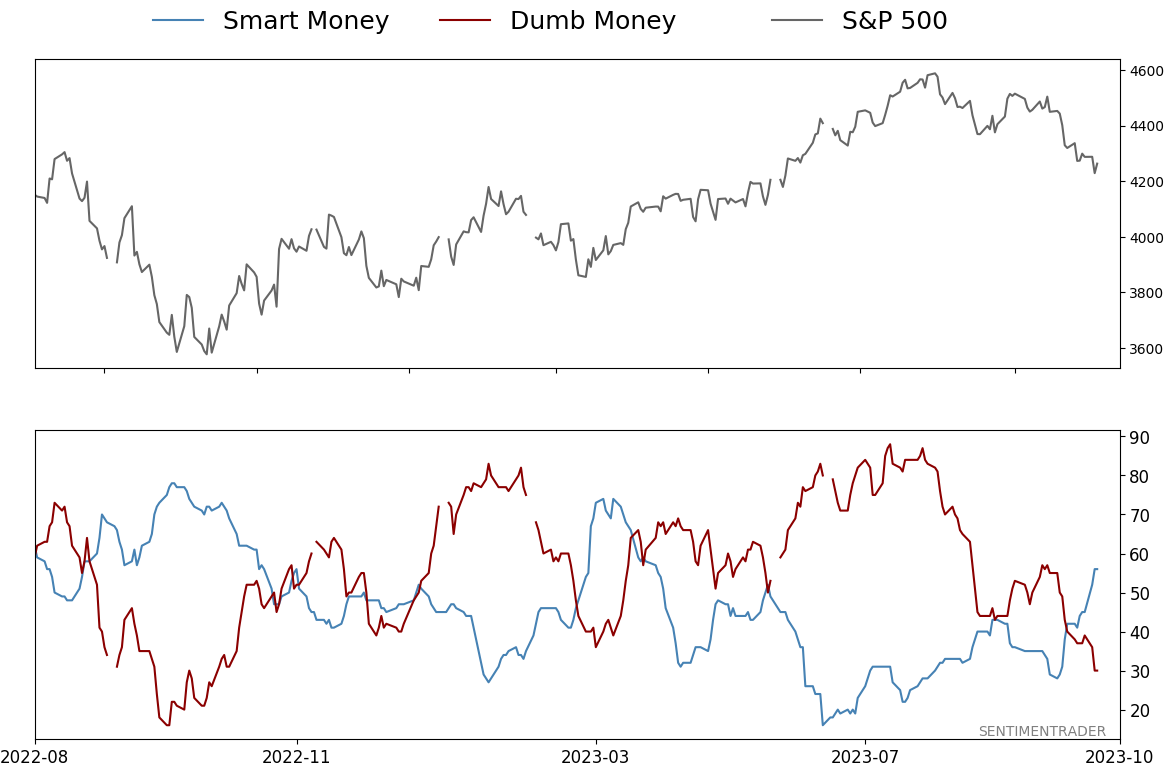
Smart / Dumb Money Confidence
|
Smart Money Confidence: 56%
Dumb Money Confidence: 30%
|
|
Risk Levels
Stocks Short-Term
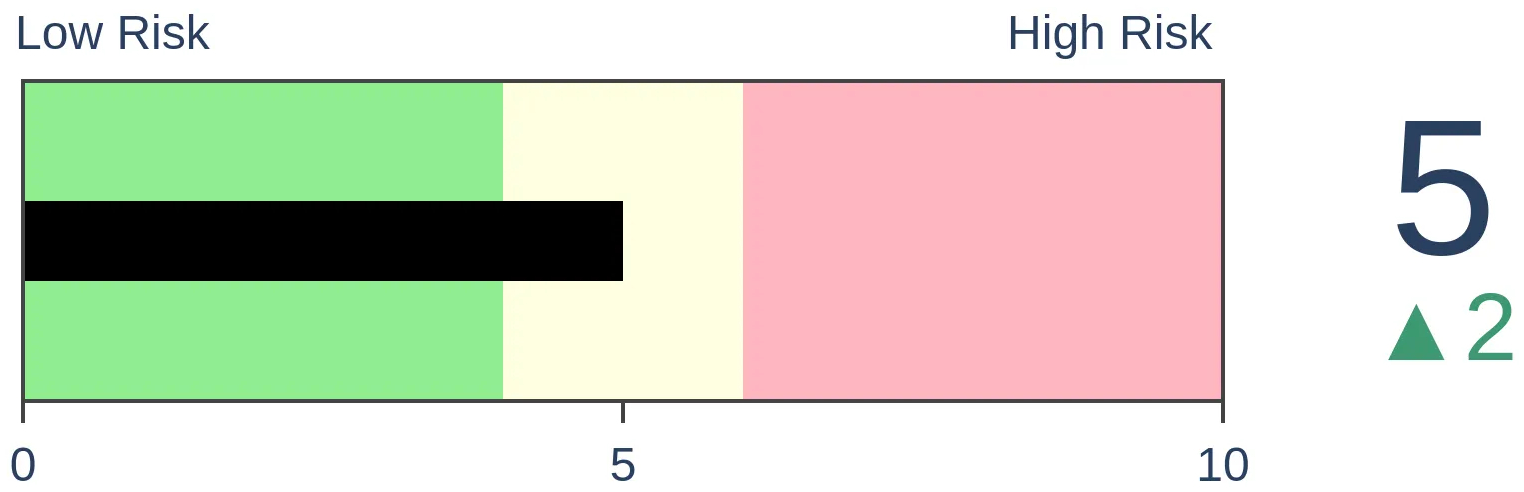
|
Stocks Medium-Term
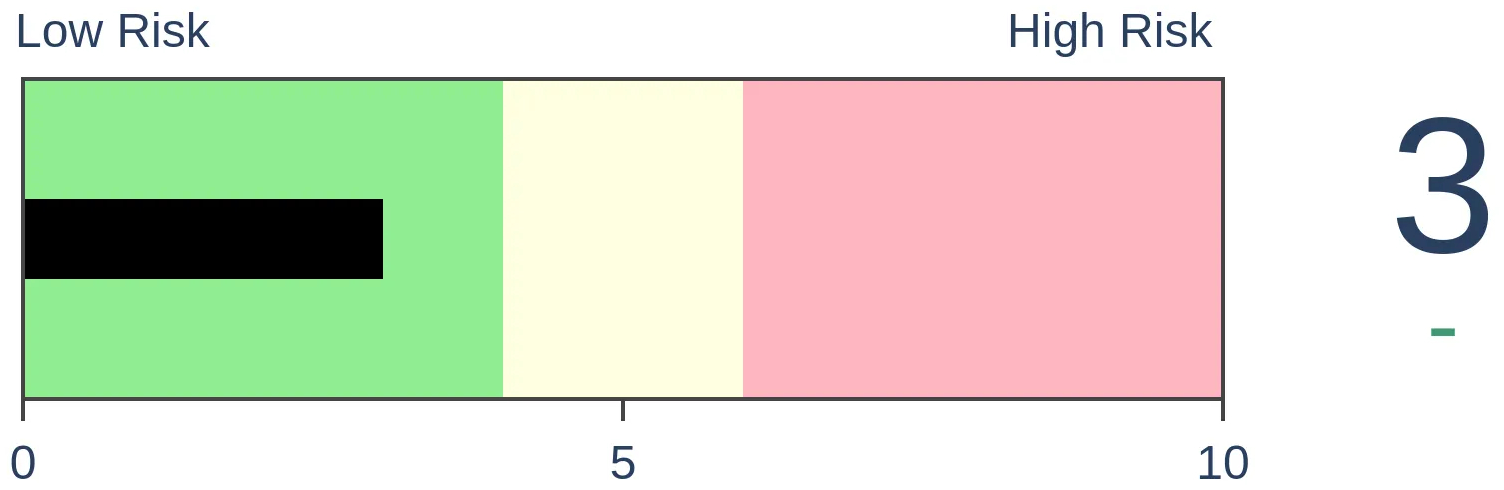
|
|
Bonds
|
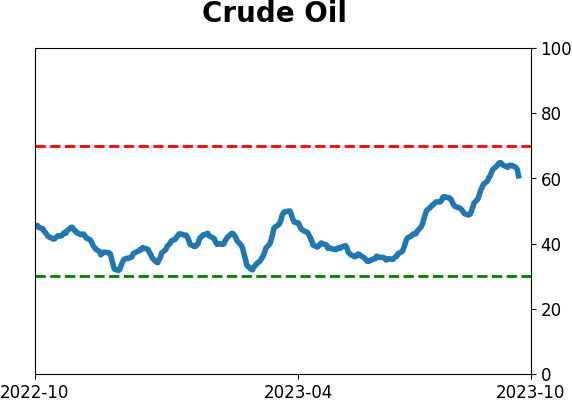
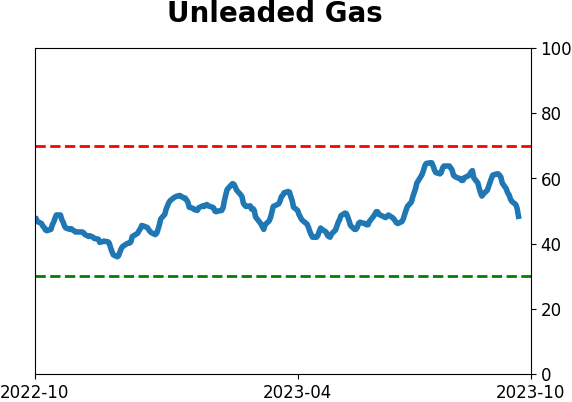
Crude Oil
|
|
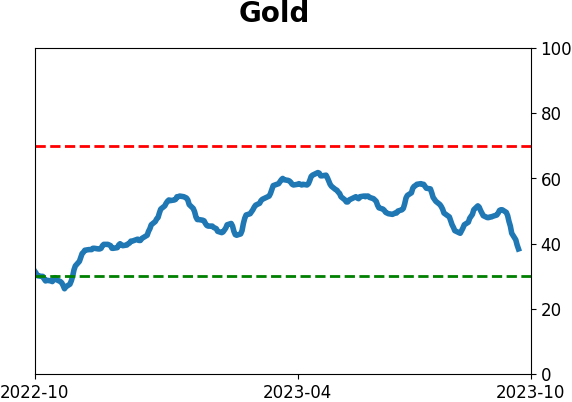
Gold

|
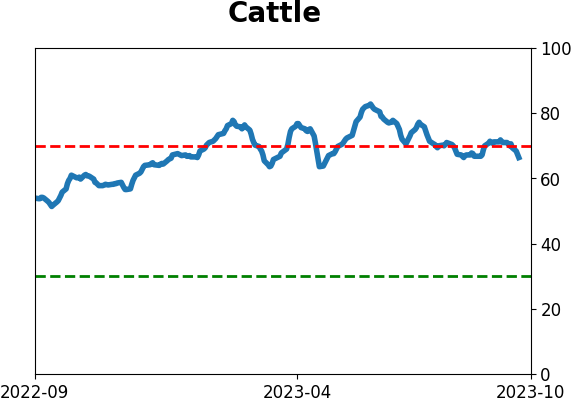
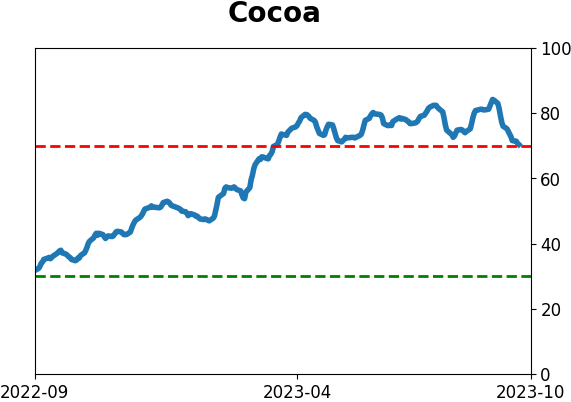
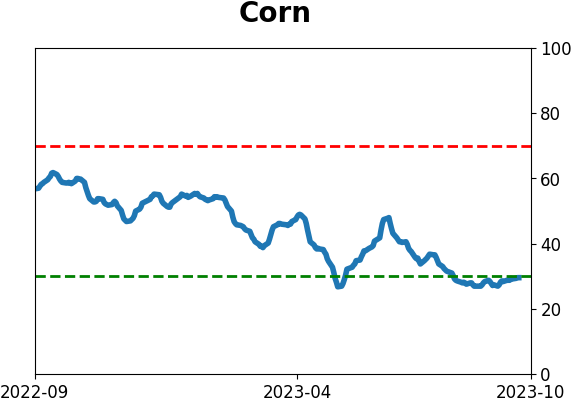
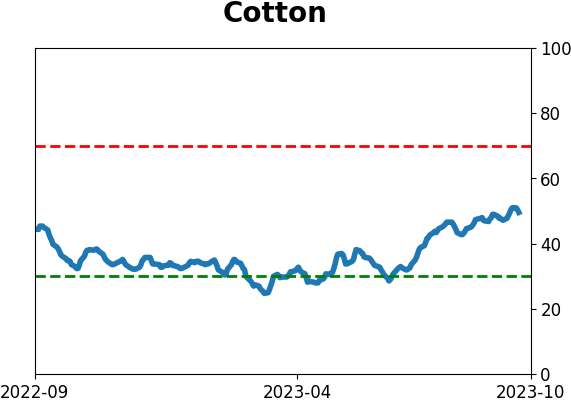
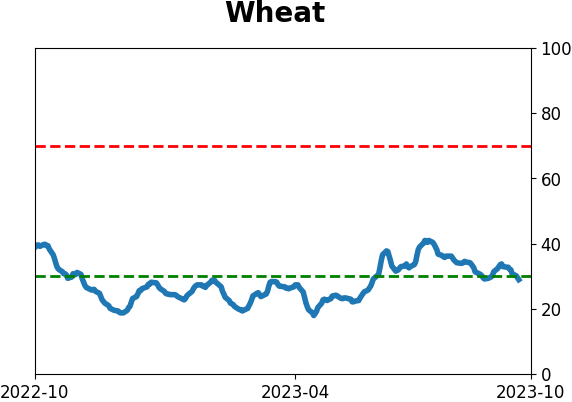
Agriculture
|
|
Research
By Jason Goepfert
BOTTOM LINE
Another spurt higher in yields has captured the media's attention, with "relentless" becoming an increasingly common reference. Over multiple time frames, the rise in 10-year yields is nearing a historic extreme, but that has not preceded consistent results for bonds. It has for stocks, and it was almost universally bad.
FORECAST / TIMEFRAME
None
|
Key points:
- Over multiple time frames, the yield on 10-year Treasuries has reached an extreme
- The relentless rise in yields has captured media attention
- Similar behavior has preceded mixed results for bonds but was generally bad for stocks
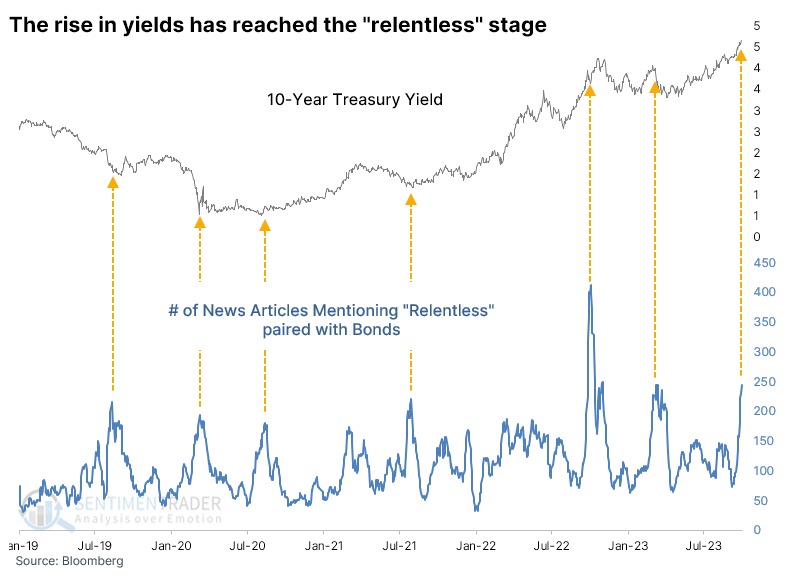
Bond yields march on with a relentless rise
We've reached the "relentless" stage of the rise in Treasury yields.
The number of news articles in the Bloomberg data feed that mention relentless along with the bond market has spiked to the 2nd-highest reading in at least eight years. Over the past five years, spikes in news mentions have roughly coincided with turning points in yield.
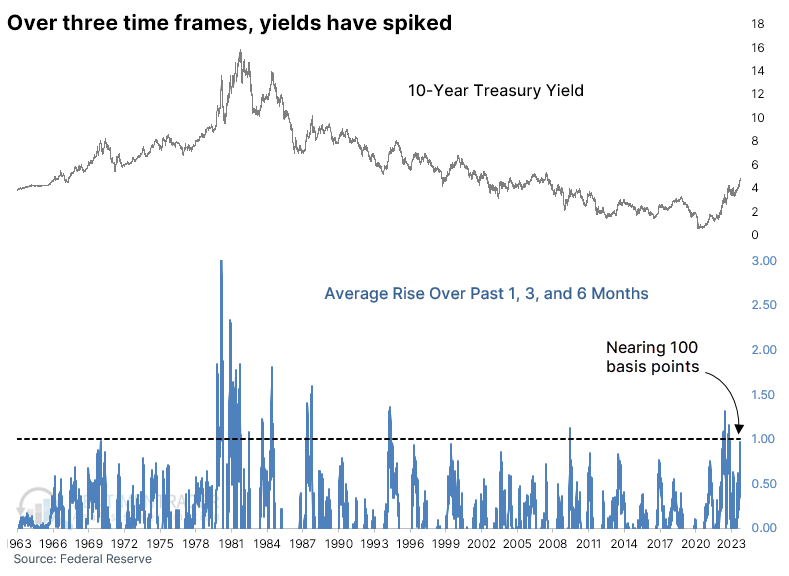
In the past, we've often looked at a market's rise or fall over multiple time frames, usually one, three, and six months. It gives us a decent look at momentum over a wide time frame and has been moderately useful at indicating extremes.
Looking at this for 10-year Treasury yields, we see that they have increased by more than 50 basis points over the past month, 75 b.p. over three months, and 125 b.p. over six months.
On average, the rise is just under 100 basis points or 1% over the three time frames. This is among the largest triple time frame rises in over 60 years.
Relentless rise in yields led to mixed results but was bad for stocks
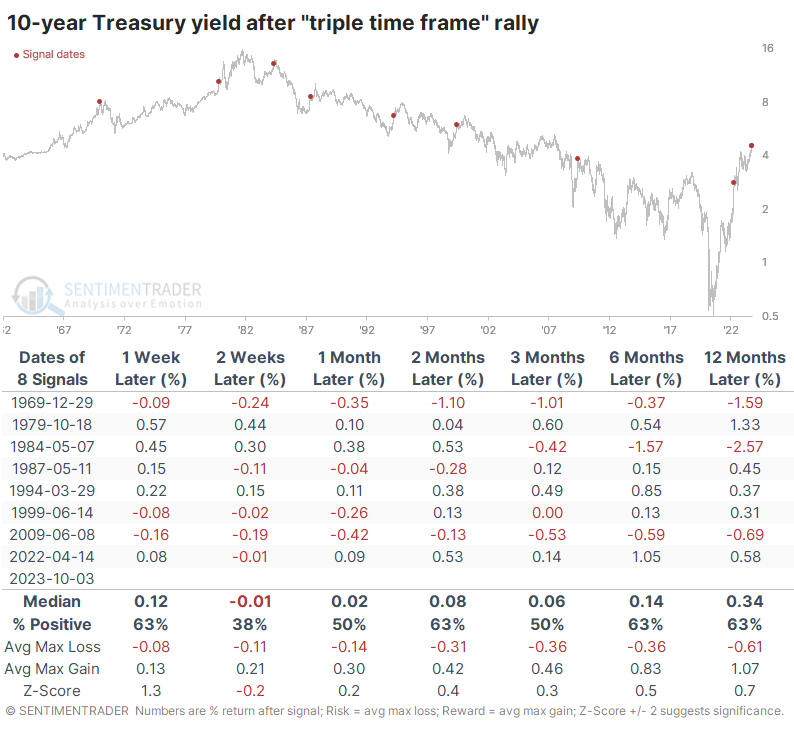
The table below shows that T-note yields tended to drop (in basis points) during the next couple of weeks, but not by much. After that, it was a toss-up whether they rose or fell, which isn't a lot of help. Only in 1969 and 1984 did it approximately equate with a significant peak. We could maybe throw 2009 in there even though that took longer to play out.
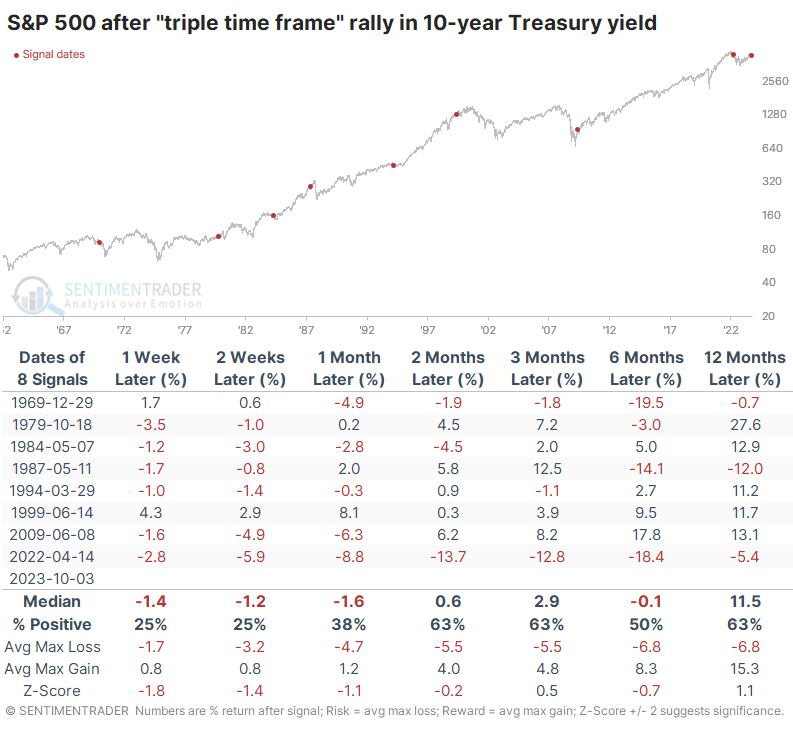
Where it gets interesting (and concerning) is related to other markets. The most benchmarked index in the world, the S&P 500, did not react well to these rapid and sustained increases in the 10-year yield. The first month was rough except for 1999, which ended up being rough over a much longer time frame.
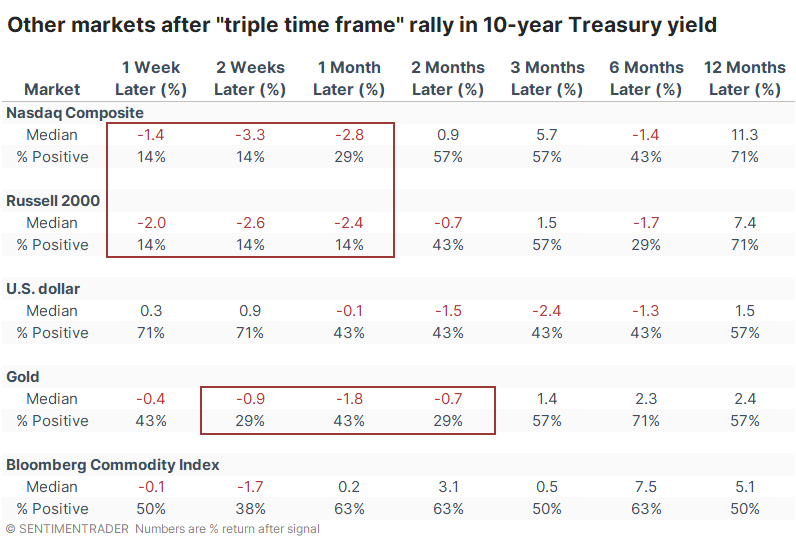
Among other indexes and markets, the Nasdaq Composite and Russell 2000 fared even worse than the S&P across most time frames up to six months later. They had a tough time showing any meaningful or sustained gains. Surprisingly, the dollar also didn't fare all that well beyond the first couple of weeks. That didn't help gold much at first, but six months later, the yellow metal sported a gain 71% of the time.
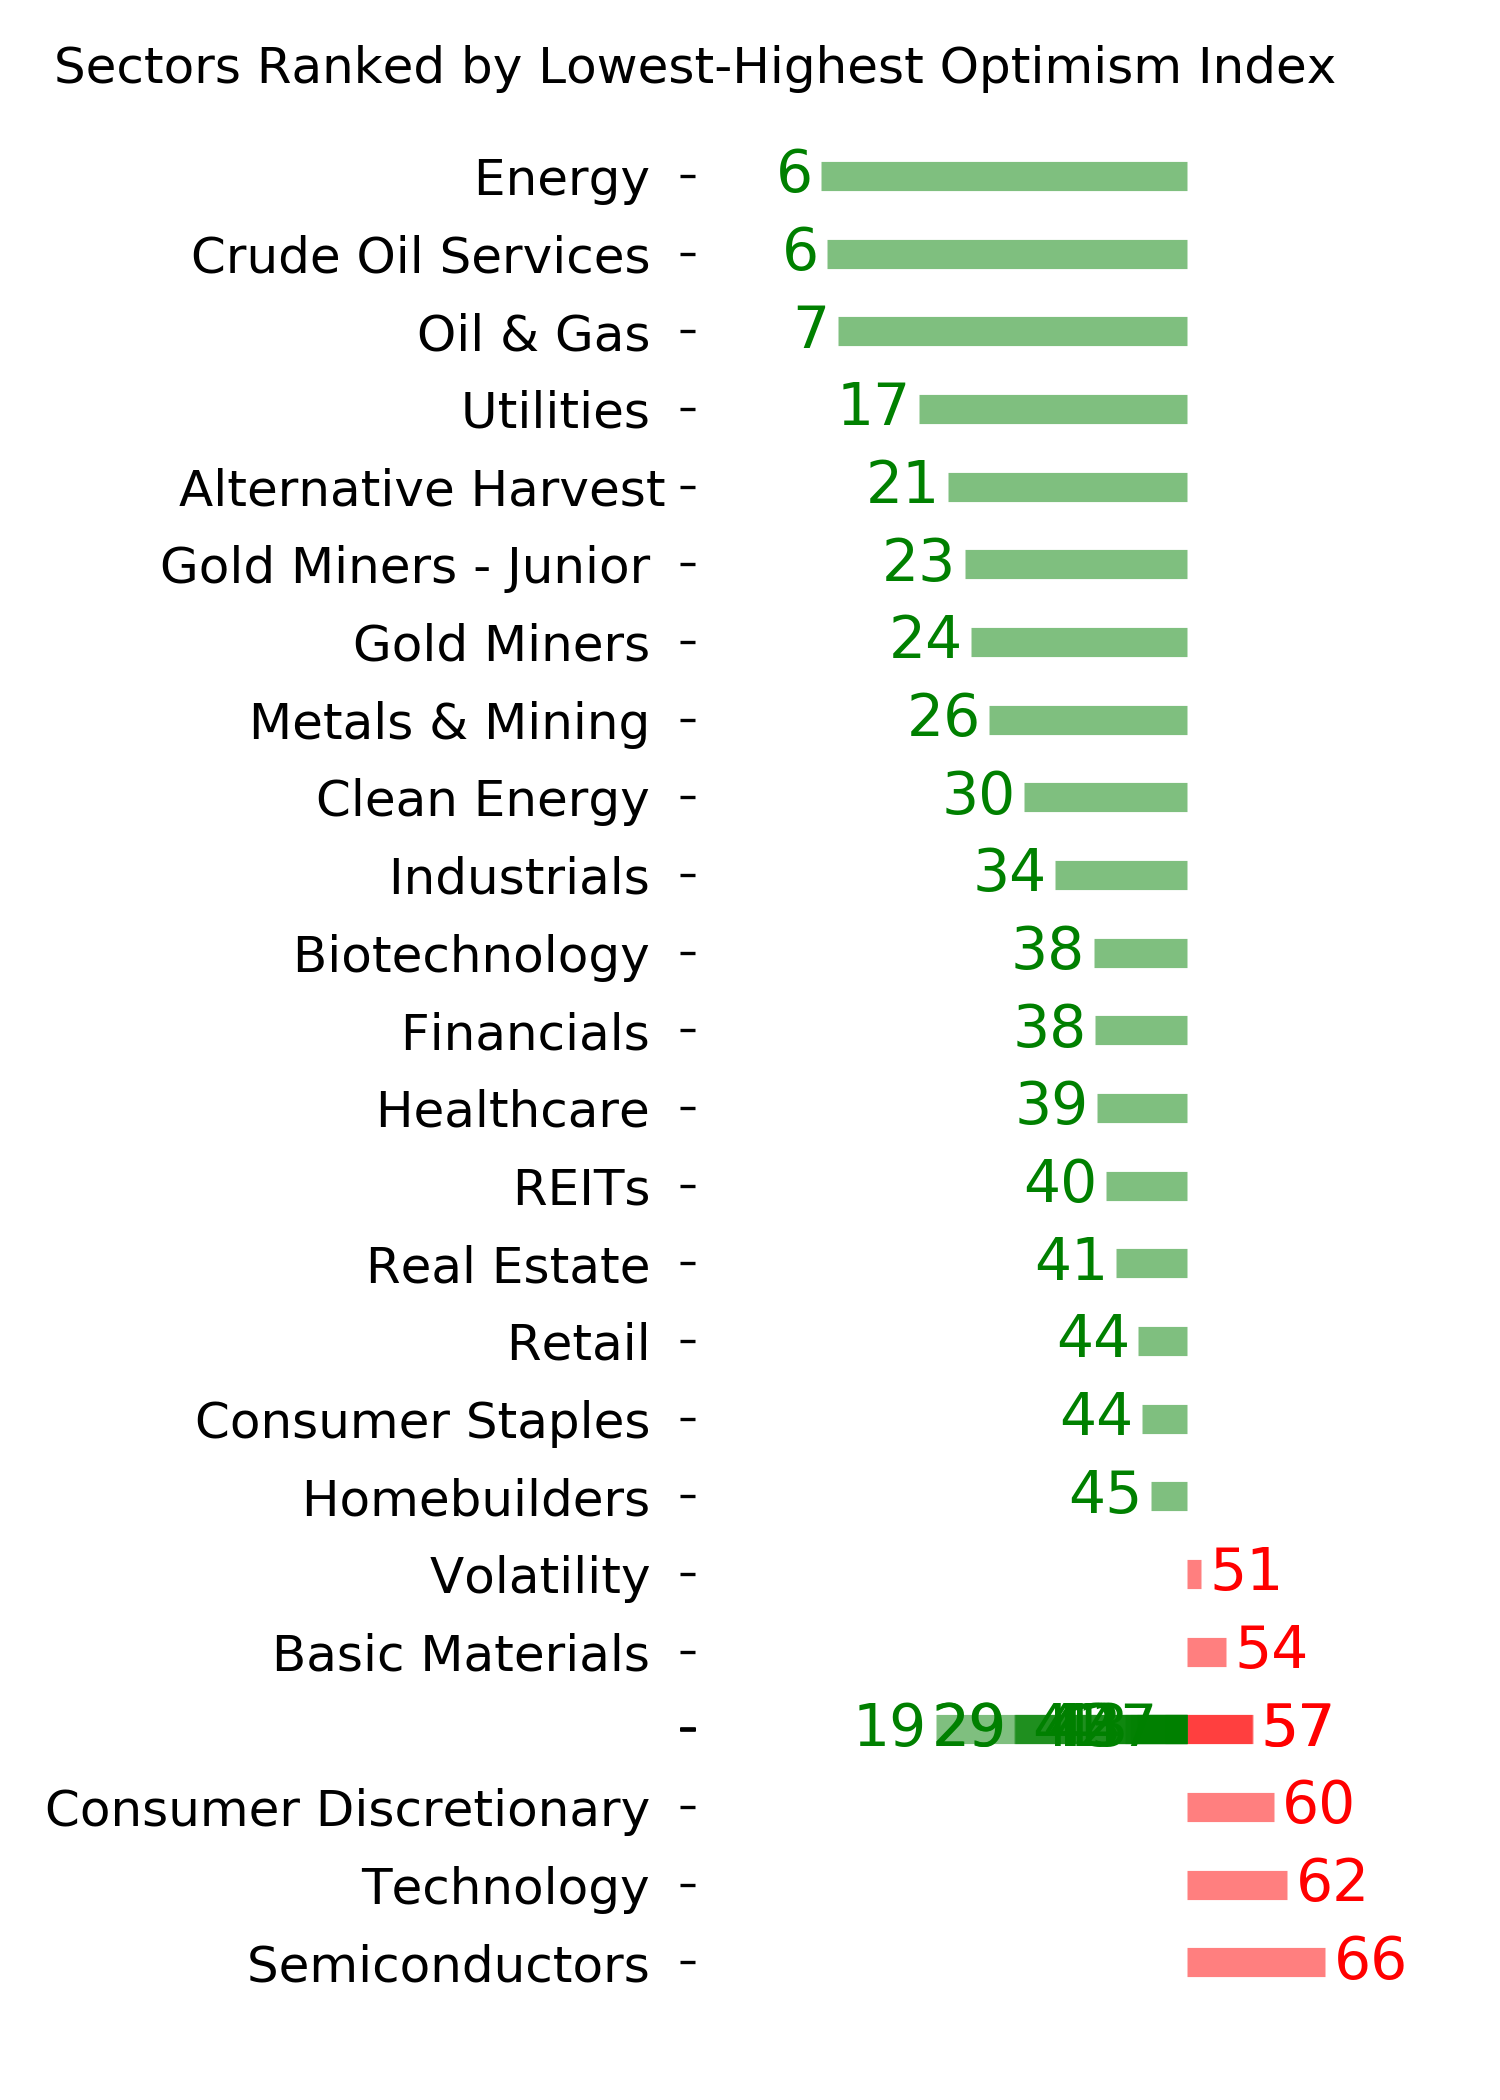
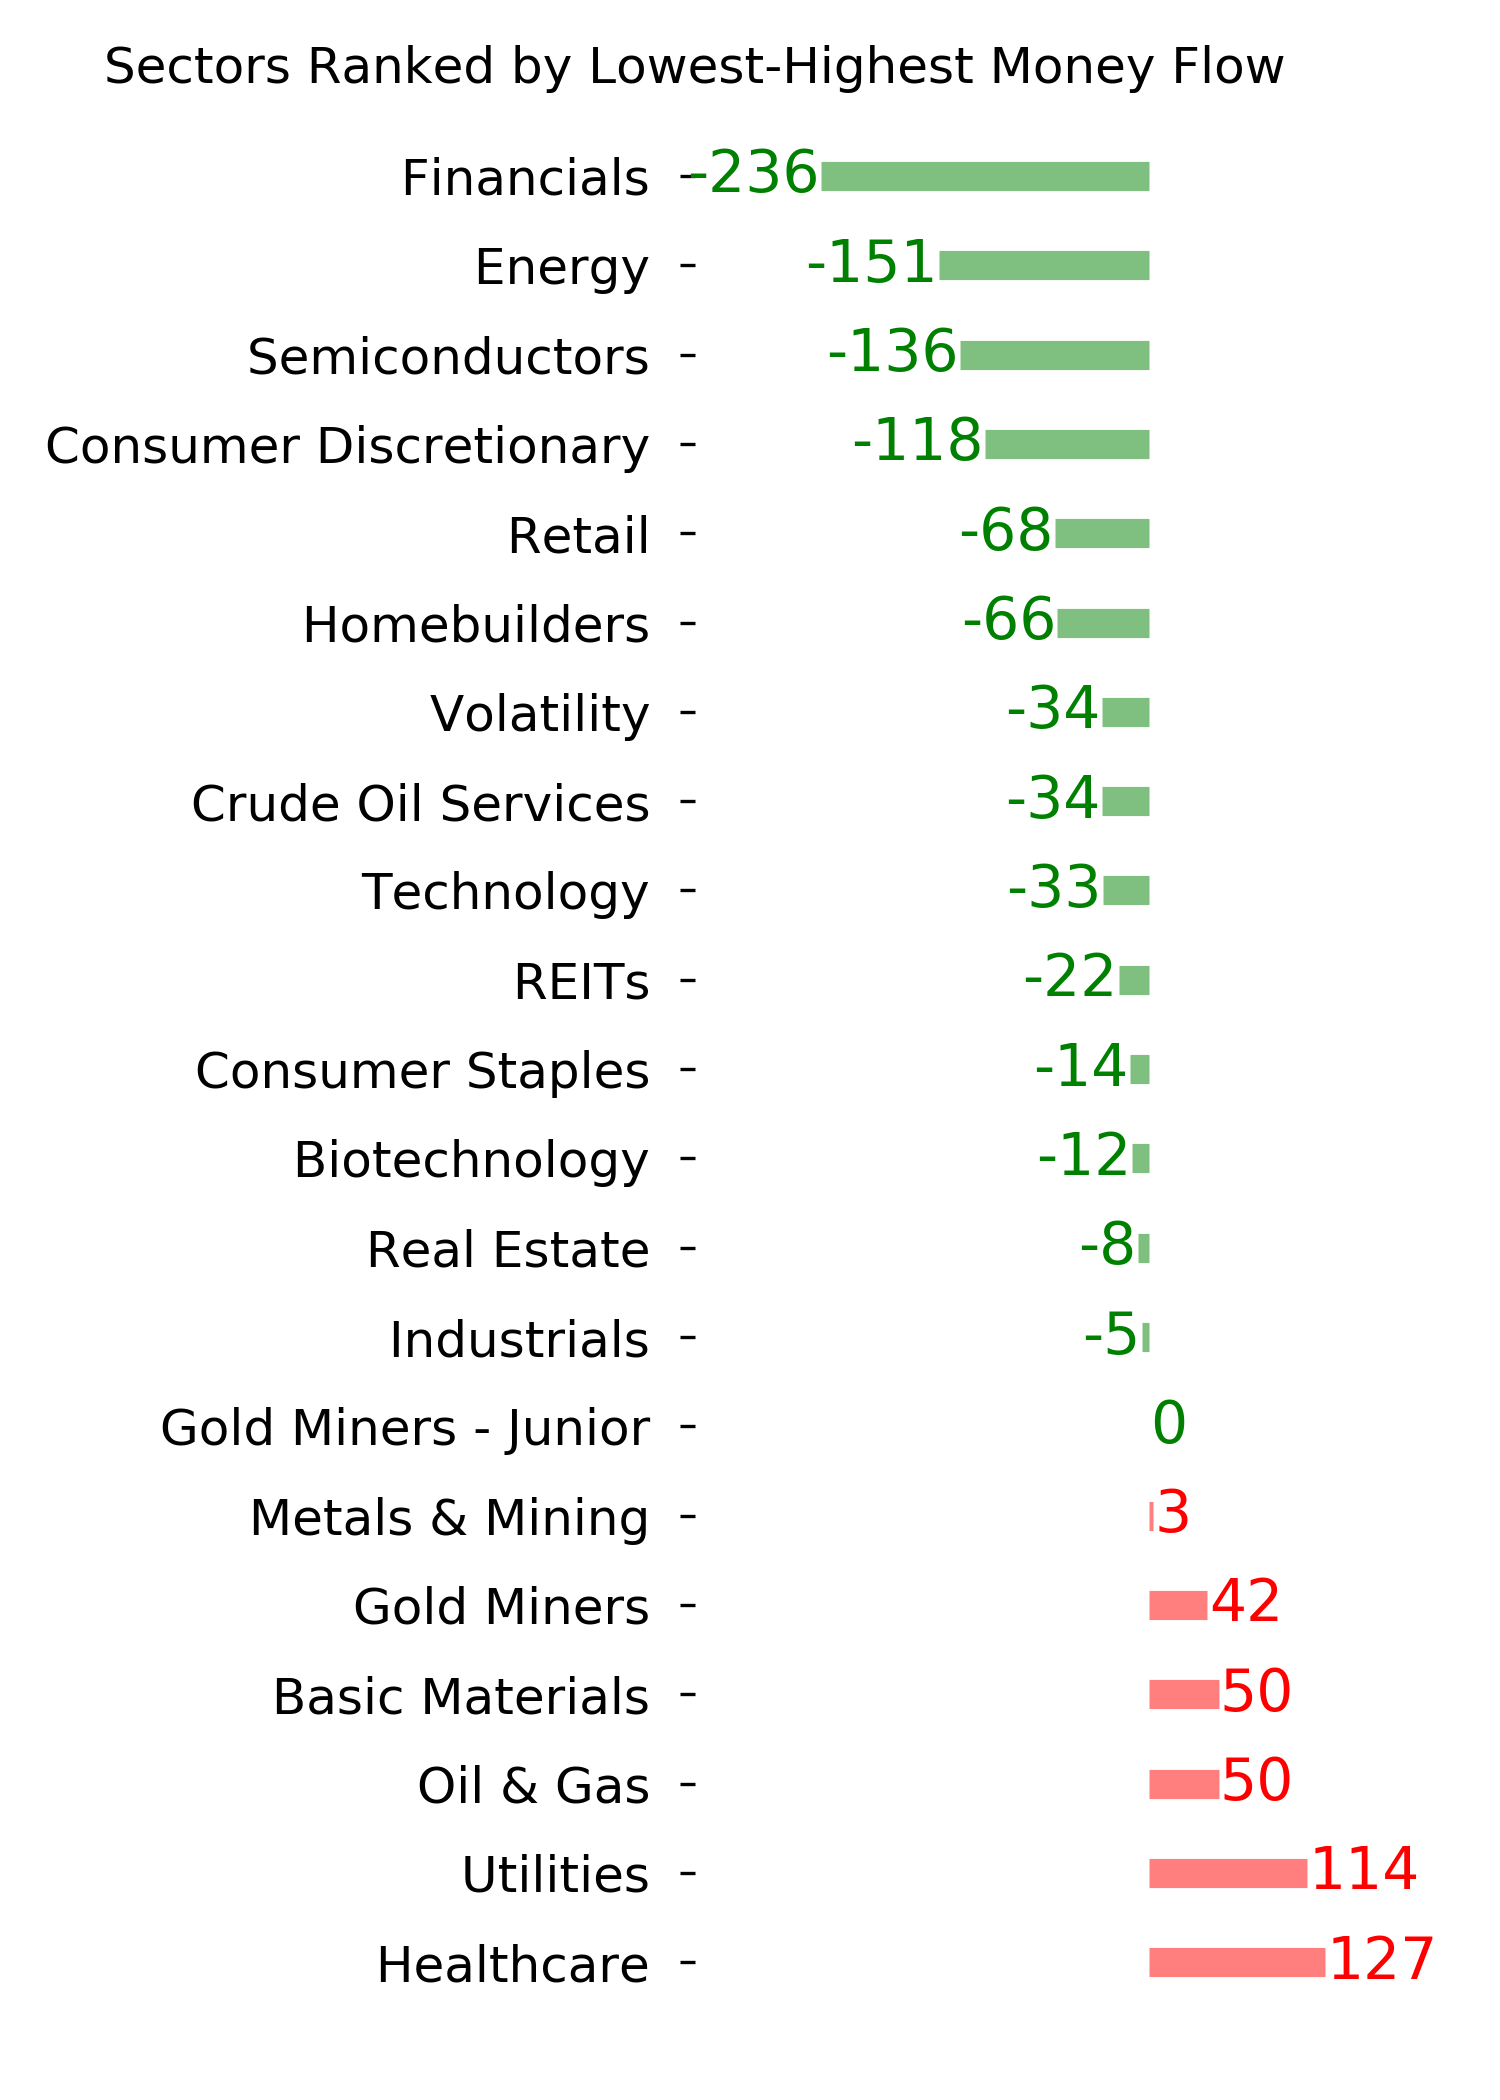
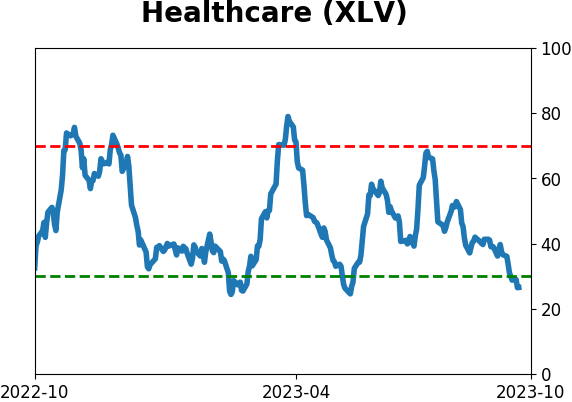
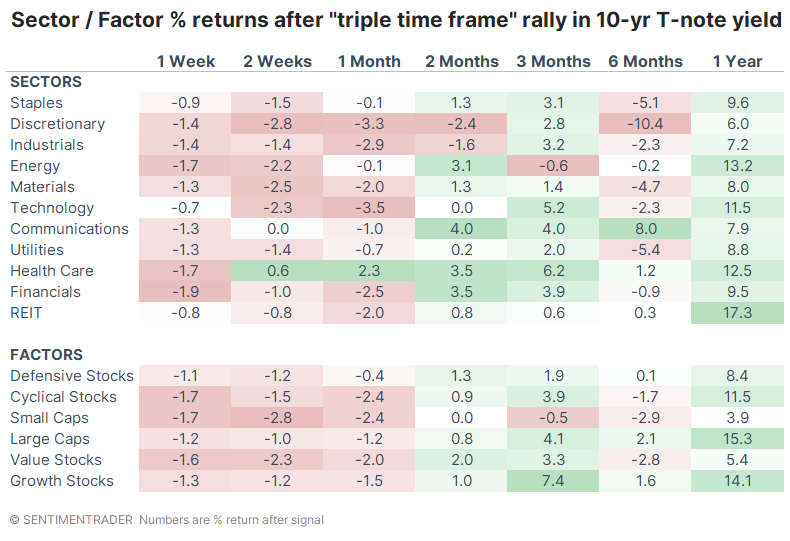
Among sectors and factors, it's not a shock that defensive sectors tended to hold up the best across most time frames. Health Care showed the most consistent positive returns, with defensive stocks suffering the smallest losses over the short term. Discretionary stocks bore some of the worst losses, with a median return of a woeful -10.4% six months later.
What the research tells us...
It's pretty clear we're in a different bond market environment than we've seen over the past 40 years, and it seems investors don't know how to react. Some sectors are acting kind of screwy, and it's not hard to see why. We're not used to seeing moves like this in the bond market, which, by some metrics, is suffering a never-seen-before destruction in price (rise in yield). This can potentially be a major wrench in the machine, as significant leverage is tied to normal behavior.
The relentless rise in yields has captured the attention of the media, which is usually a pretty good sign that we're nearing the end of the "relentless" move. Still, again, bonds have not been acting according to the playbook we've gotten used to. There is a modest argument that yields should back off temporarily - it's harder to argue that this is anything but bad for stocks and most other markets.
Indicators at Extremes
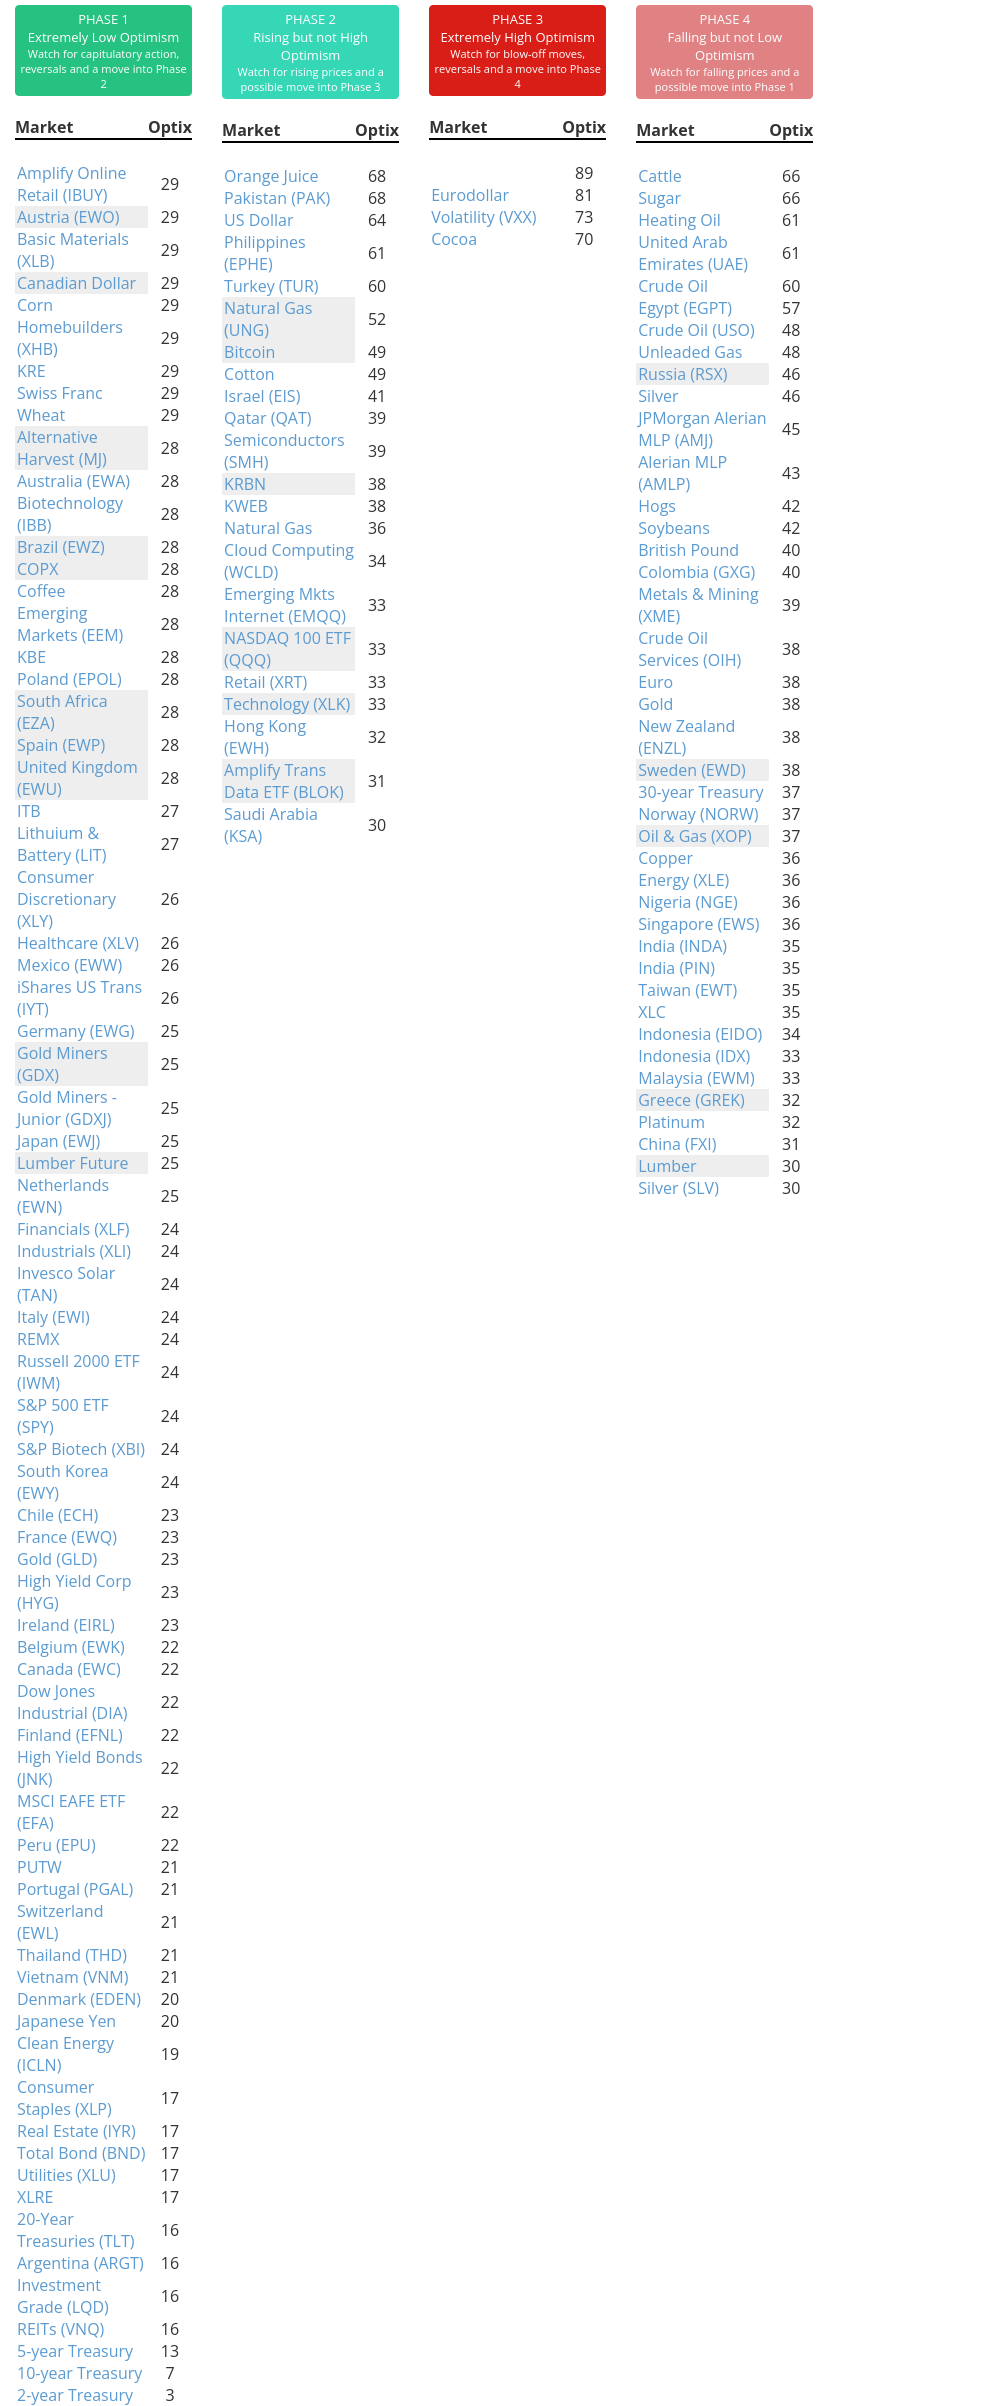
Phase Table
Ranks
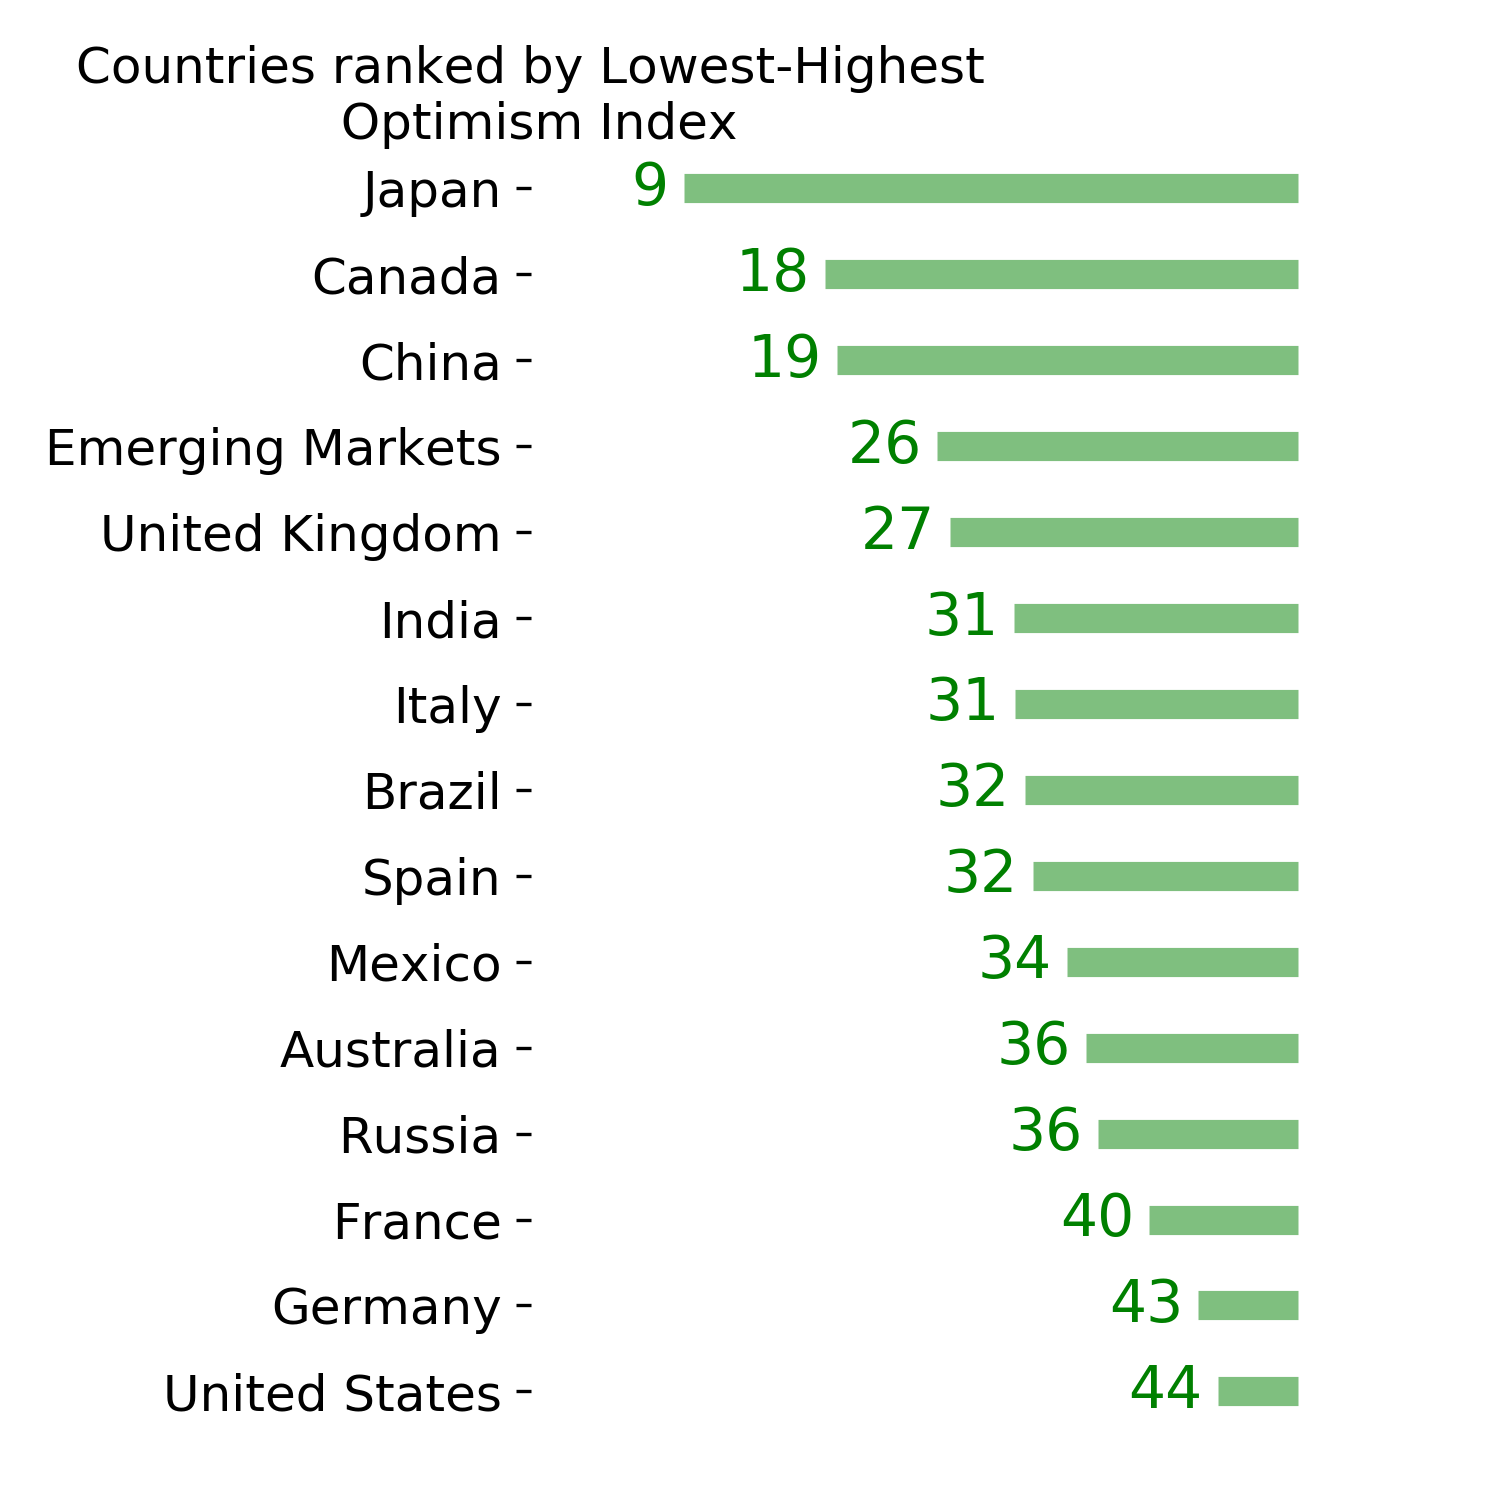
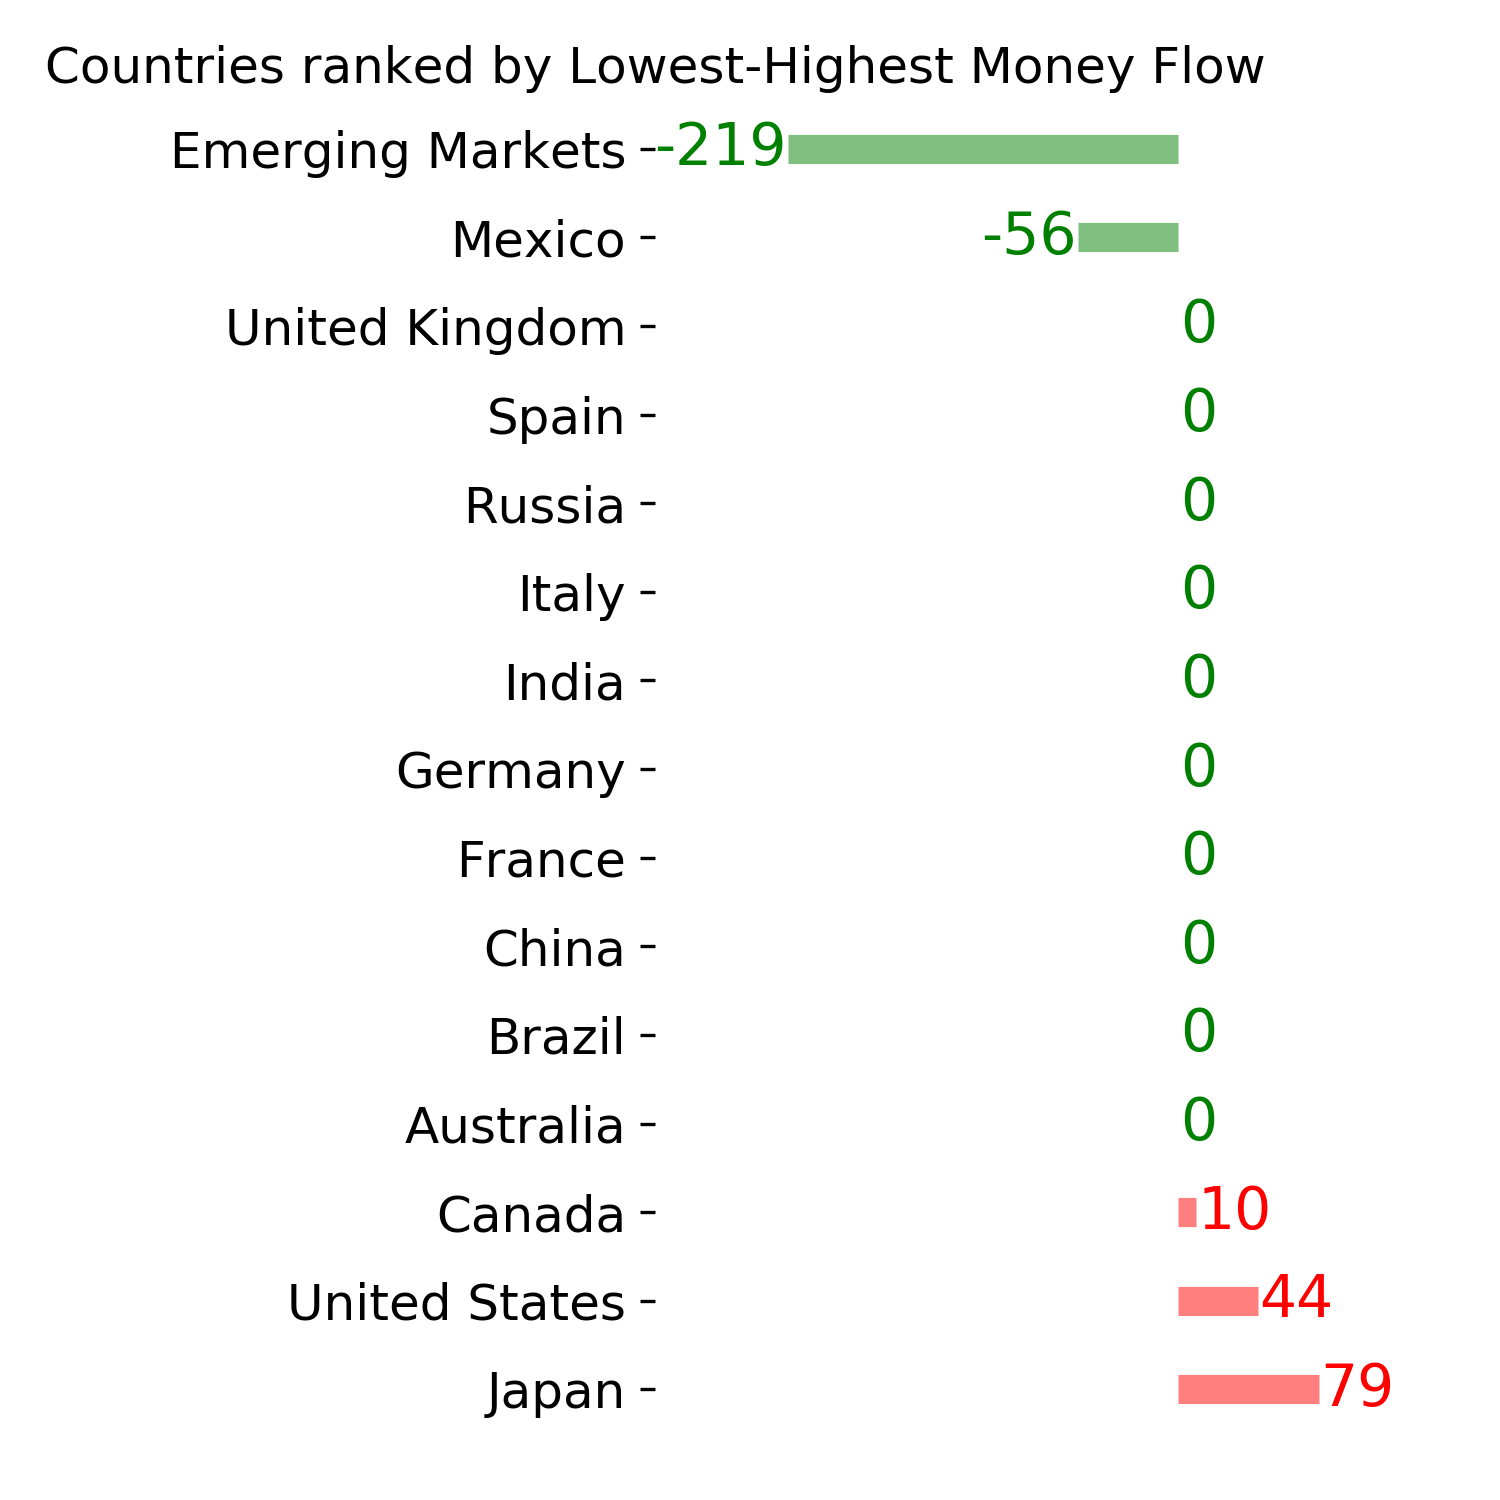
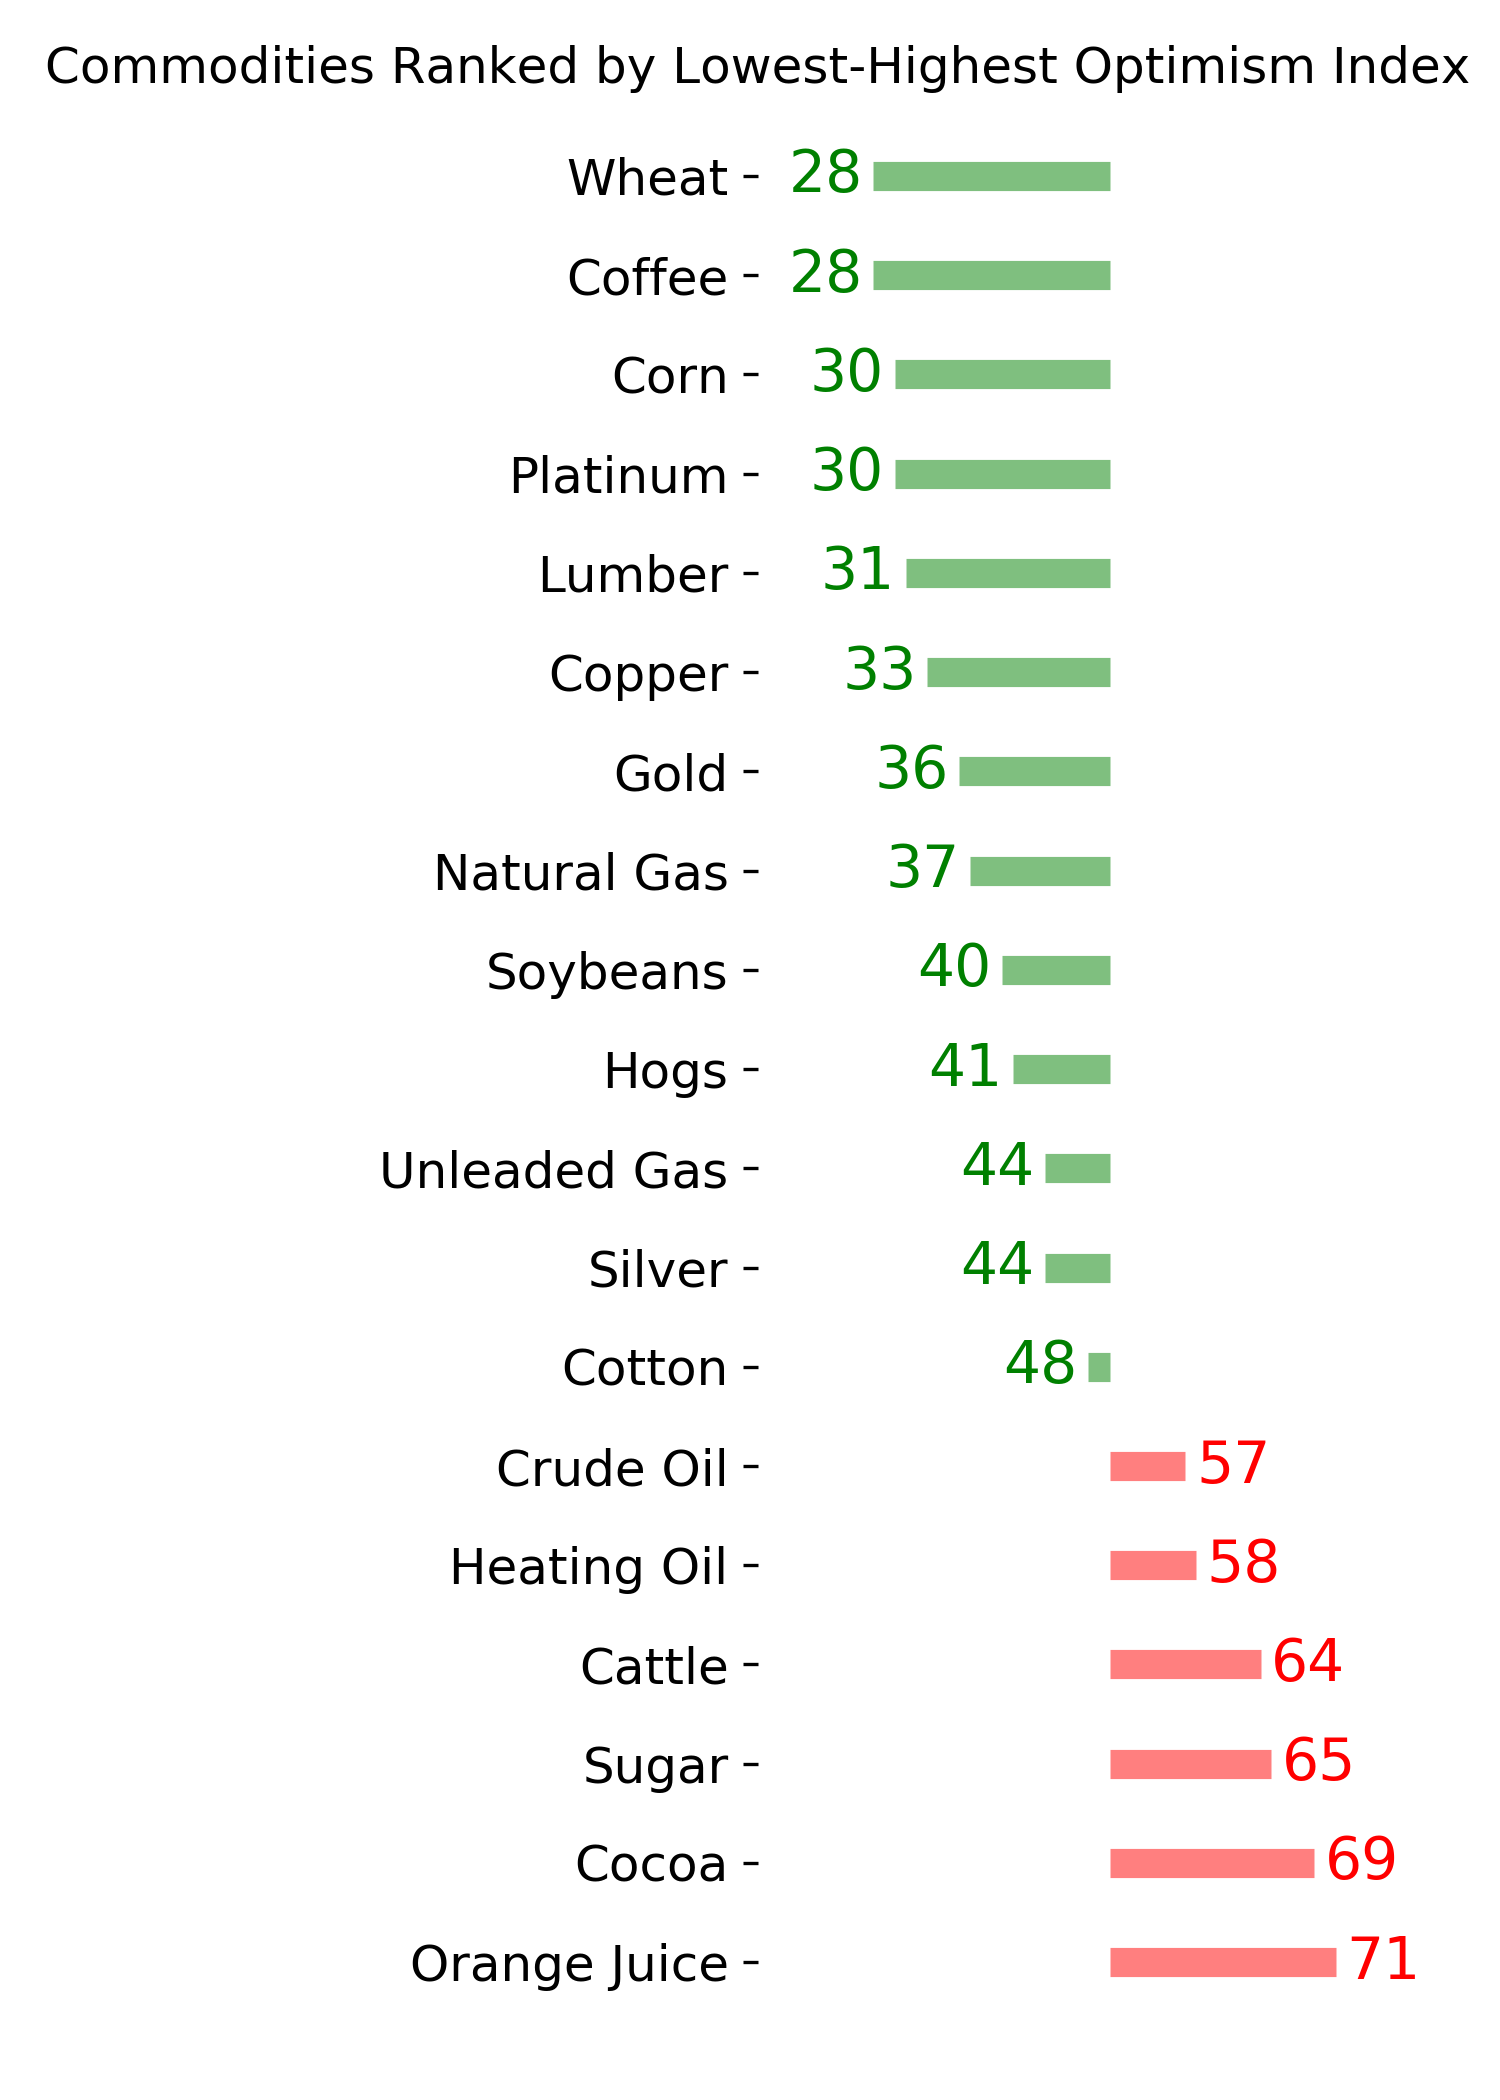
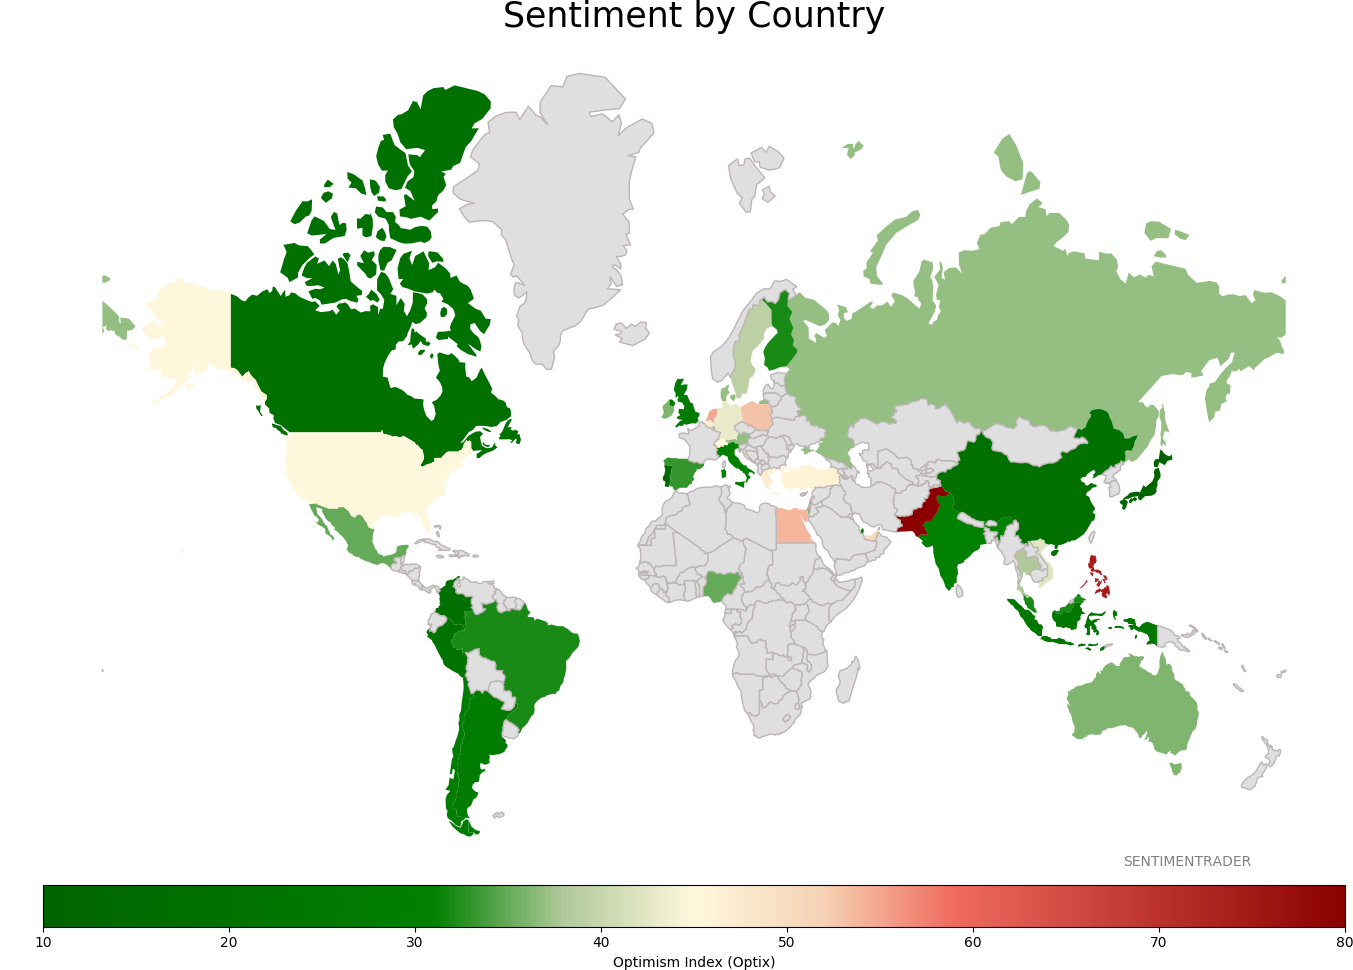
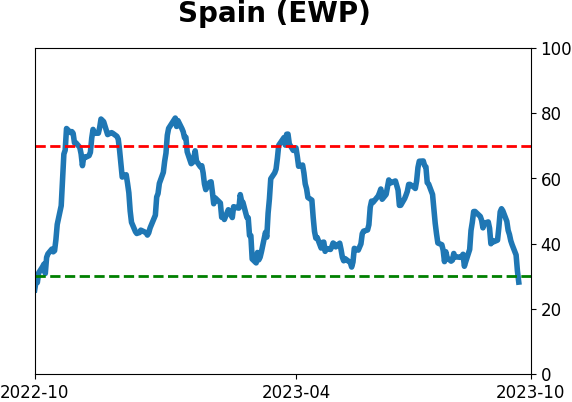
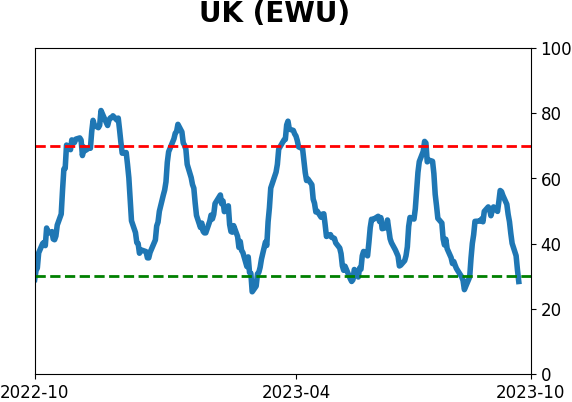
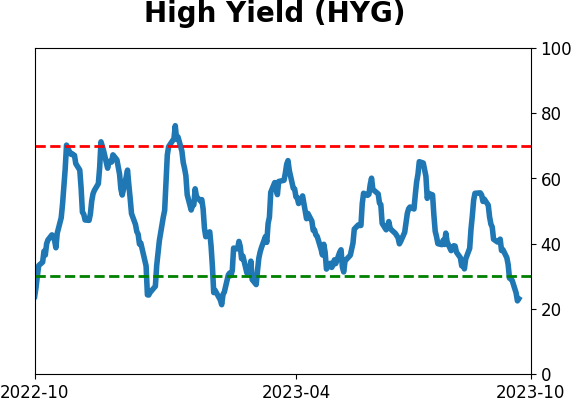
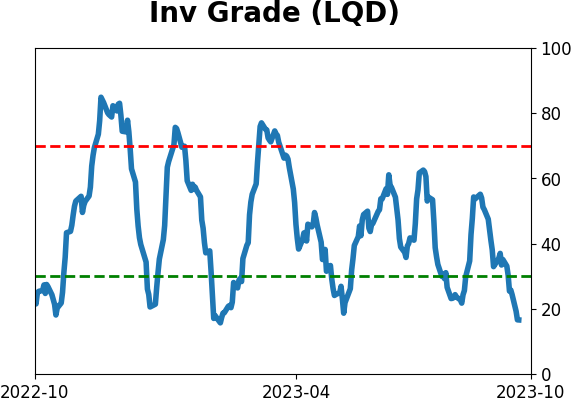
Sentiment Around The World
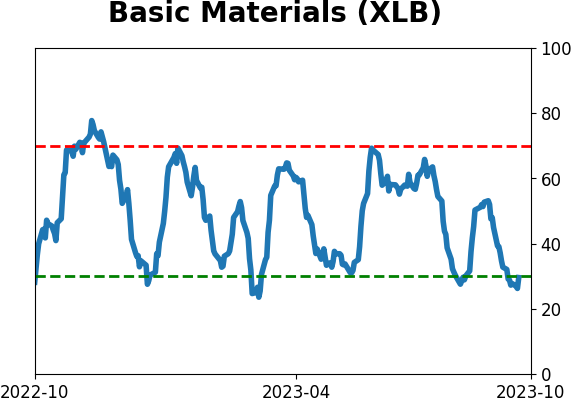
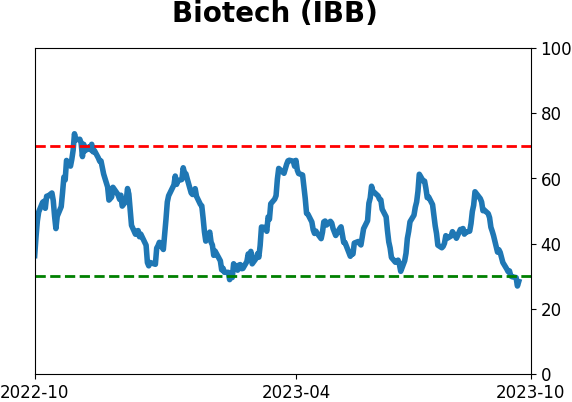
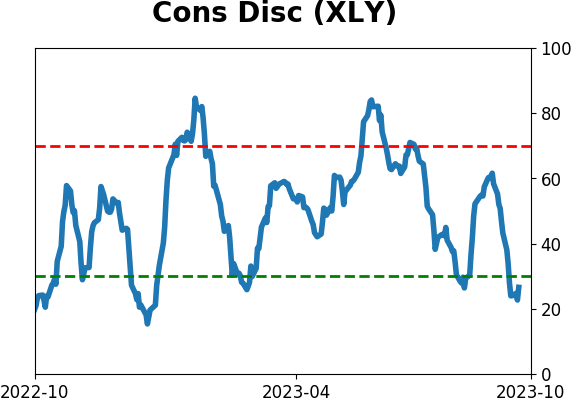
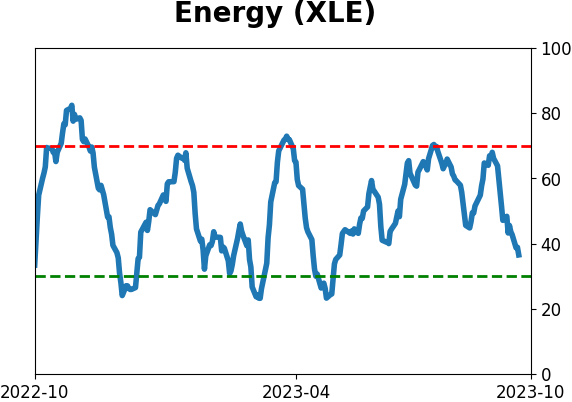
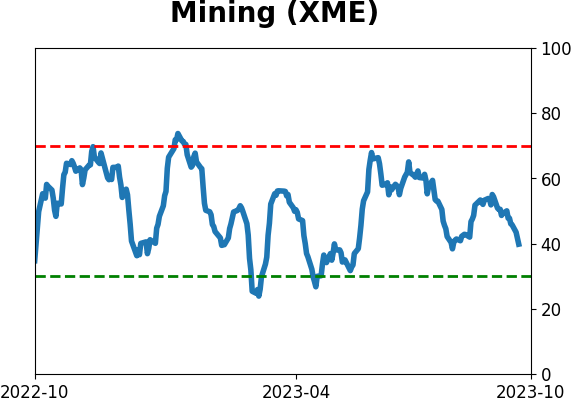
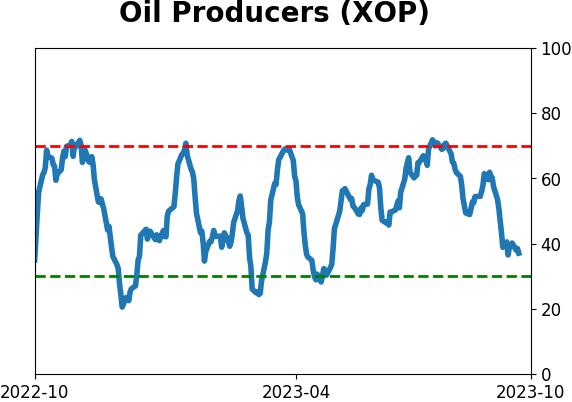
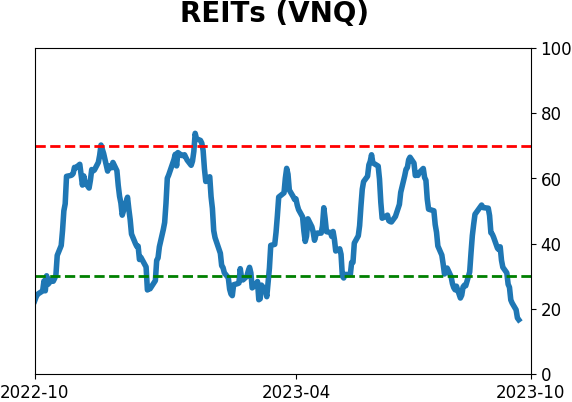
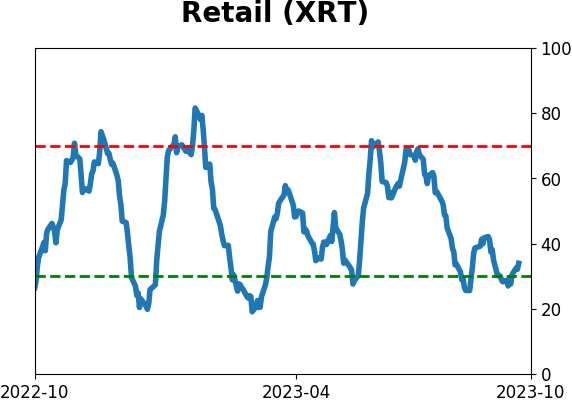
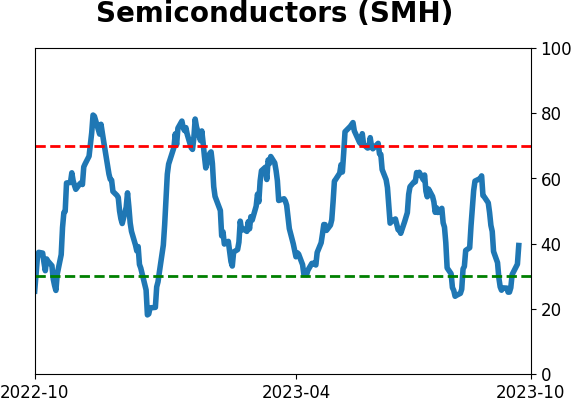
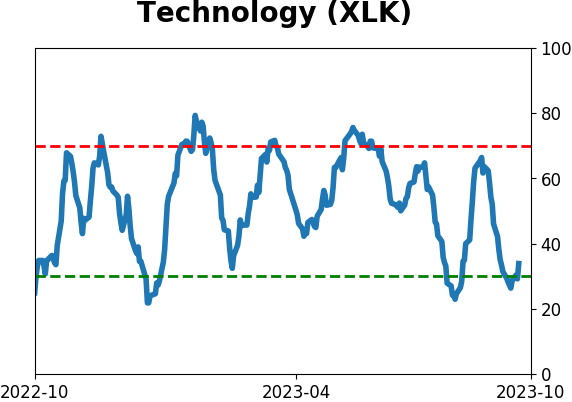
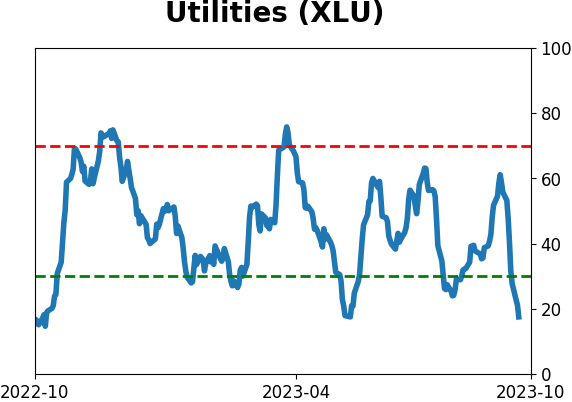
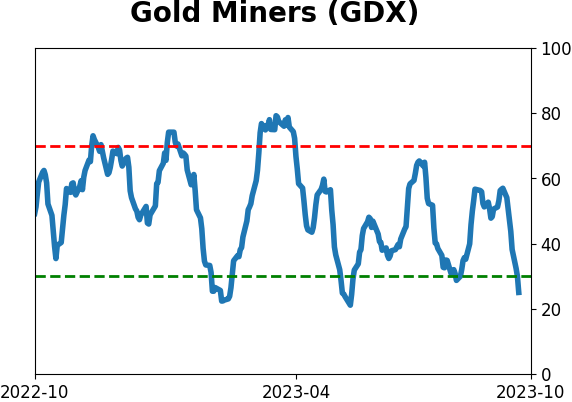
Optimism Index Thumbnails
|
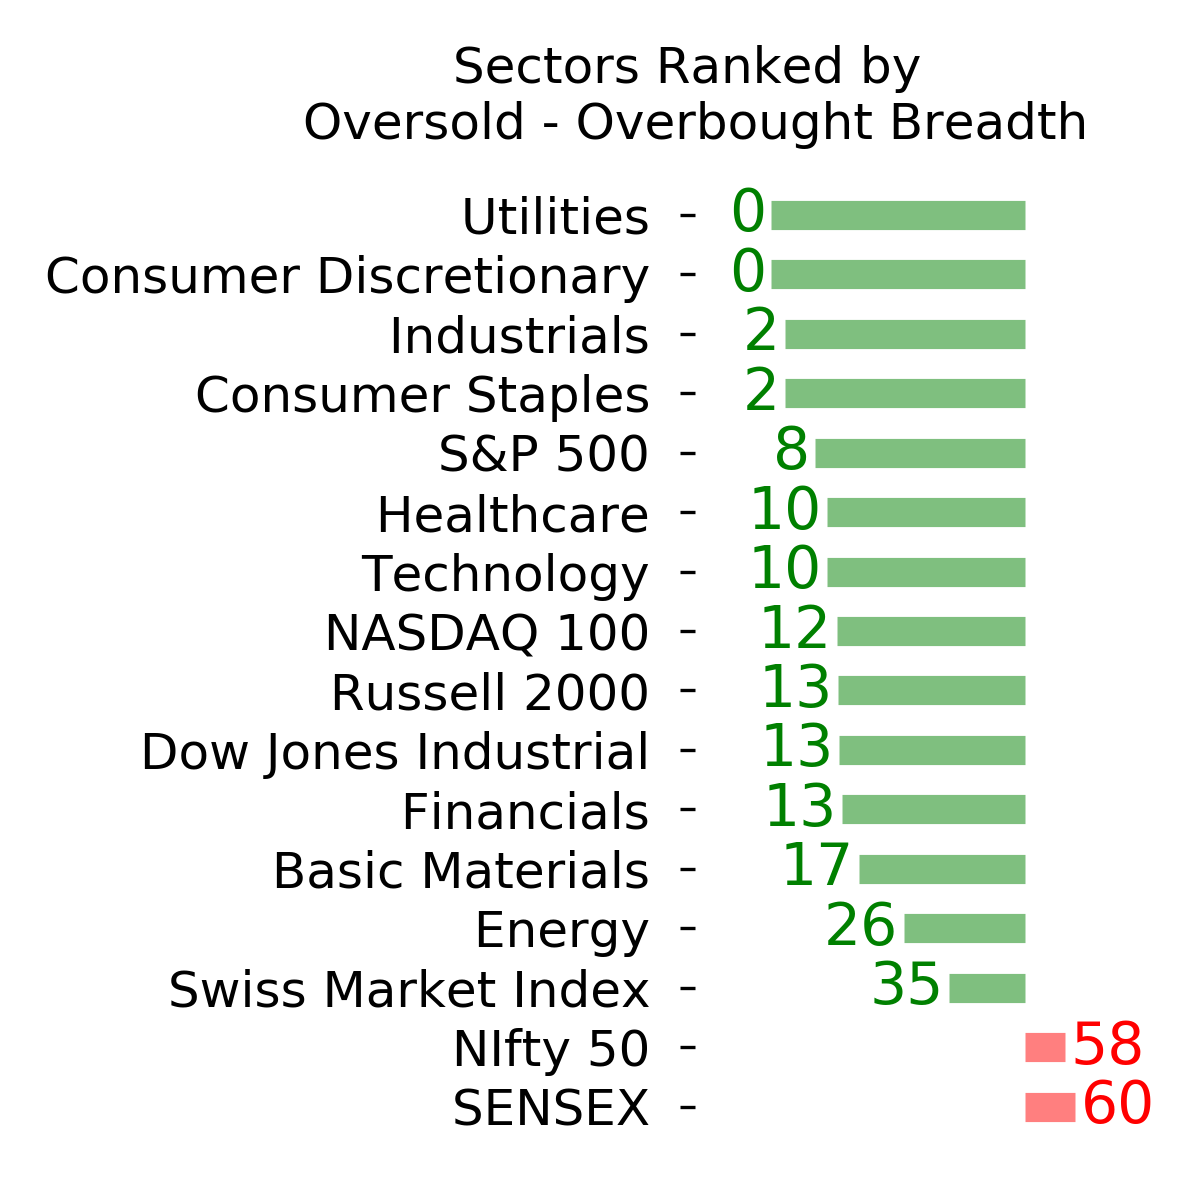
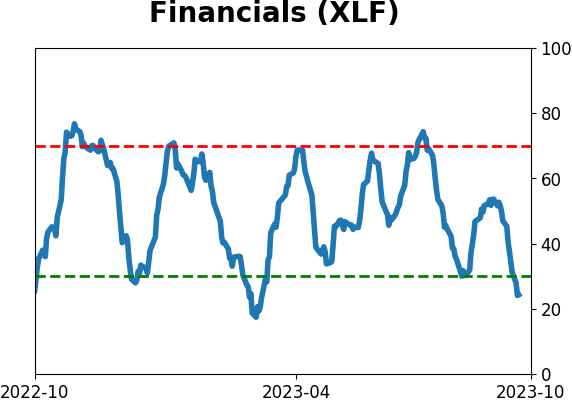
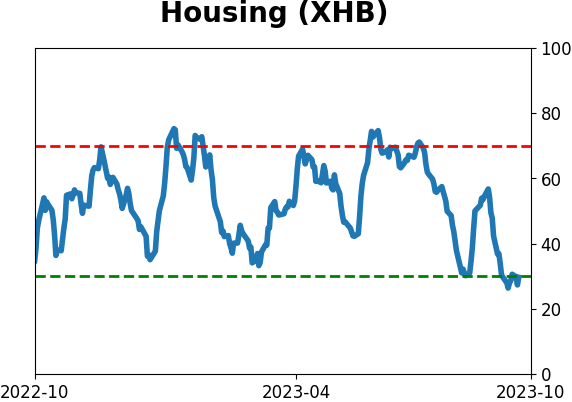
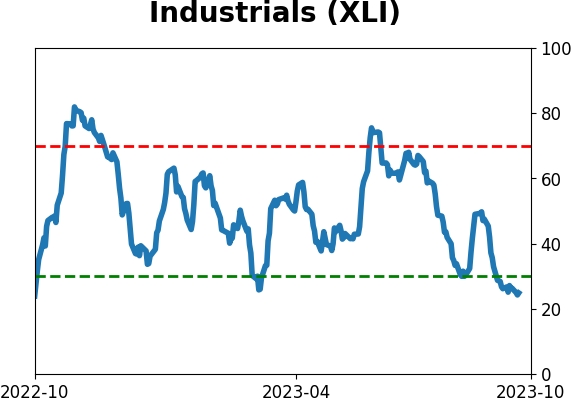
Sector ETF's - 10-Day Moving Average
|
|
|
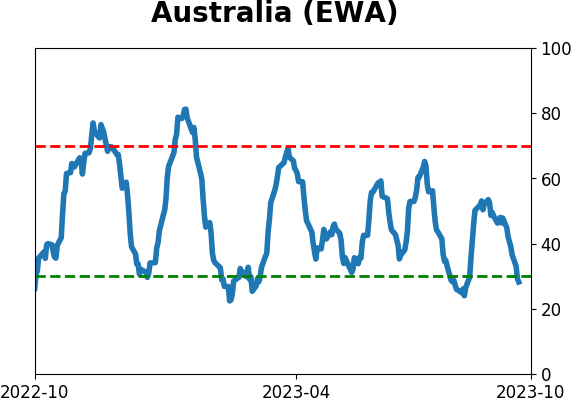
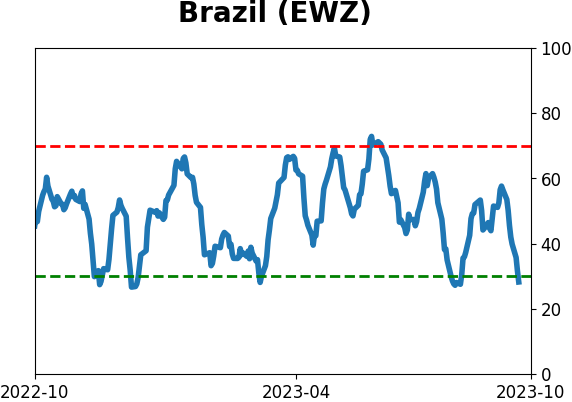
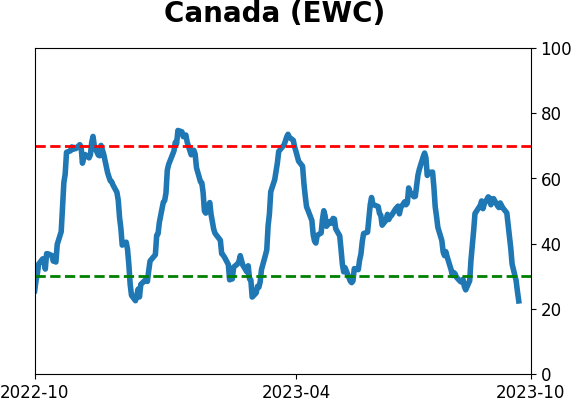
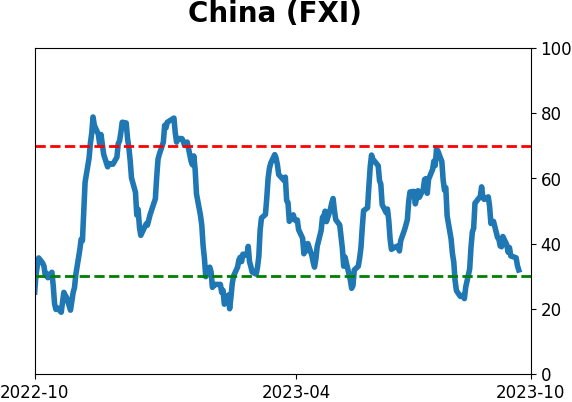
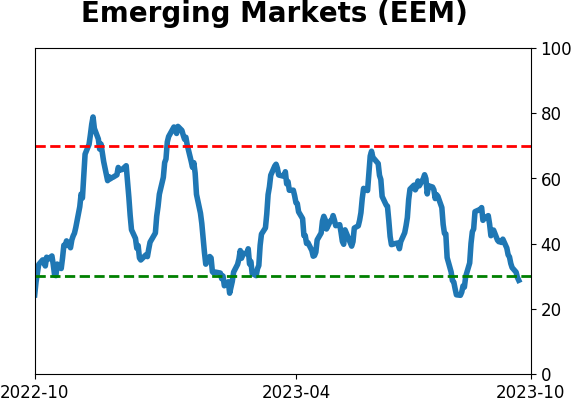
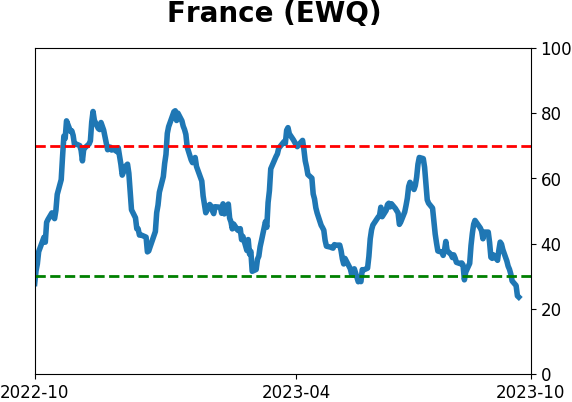
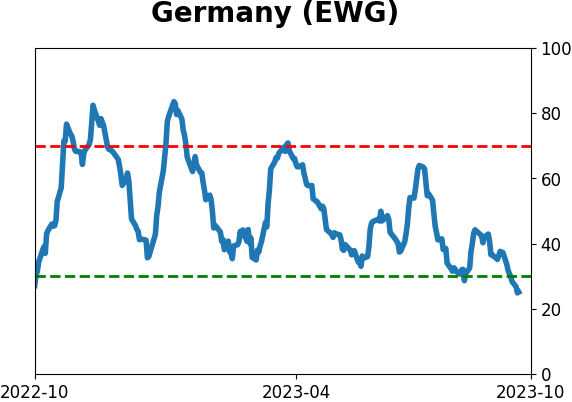
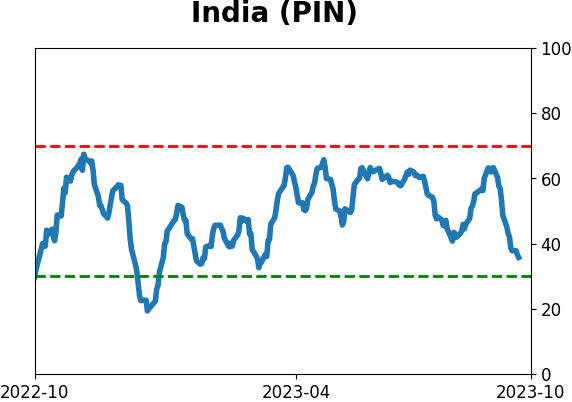
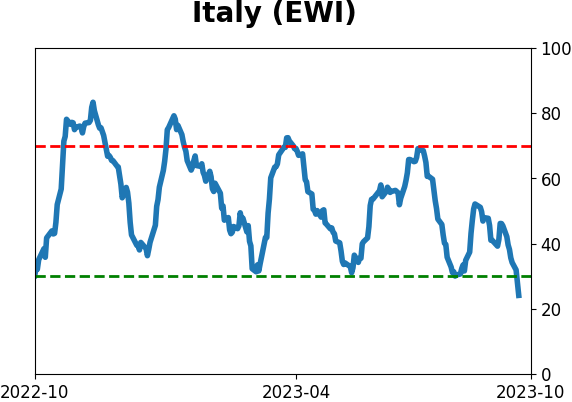
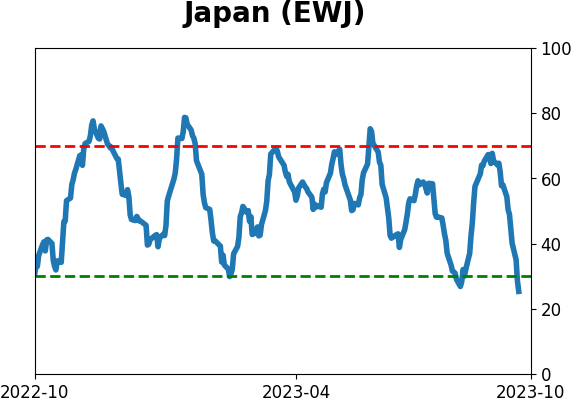
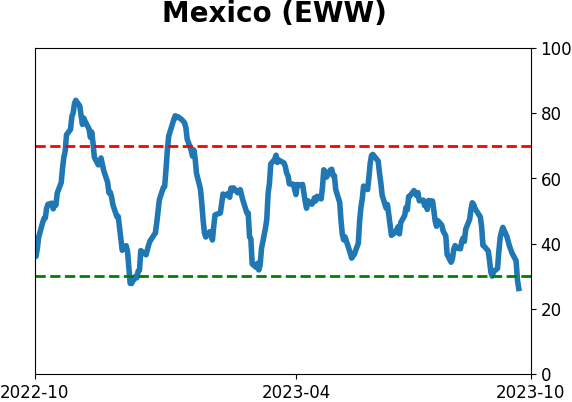
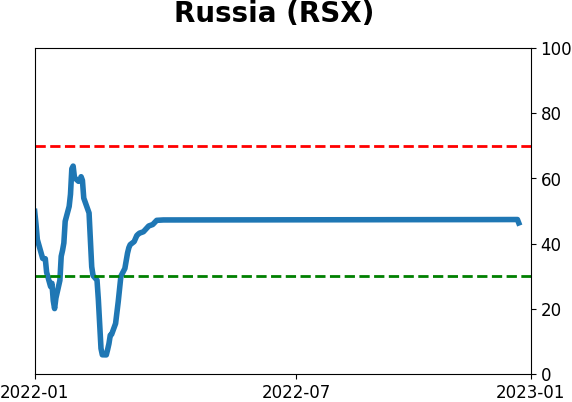
Country ETF's - 10-Day Moving Average
|
|
|
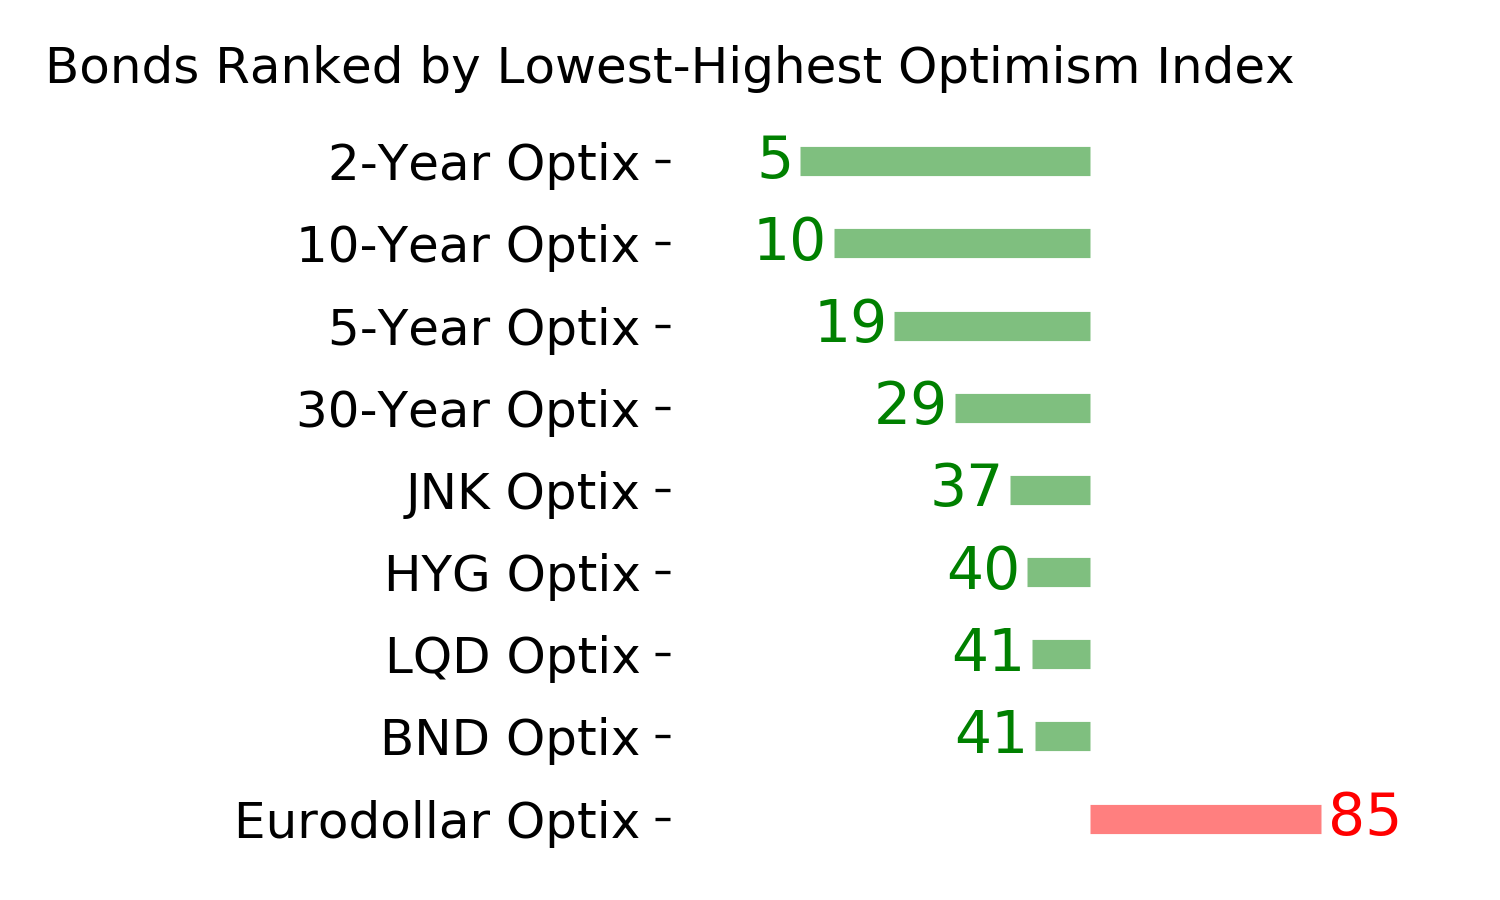
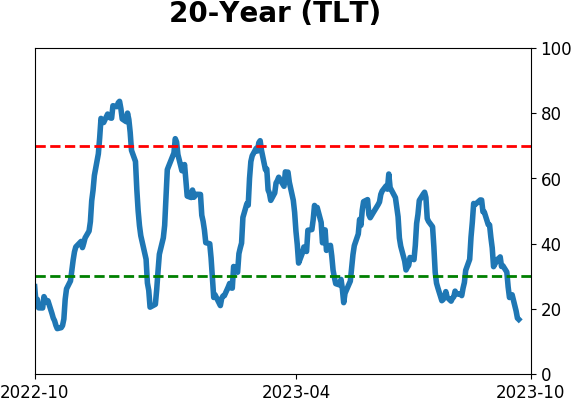
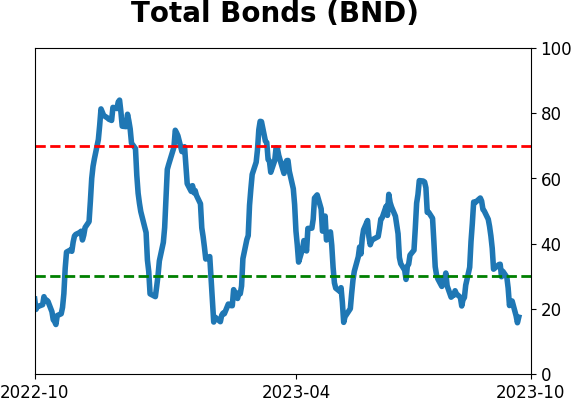
Bond ETF's - 10-Day Moving Average
|
|
|
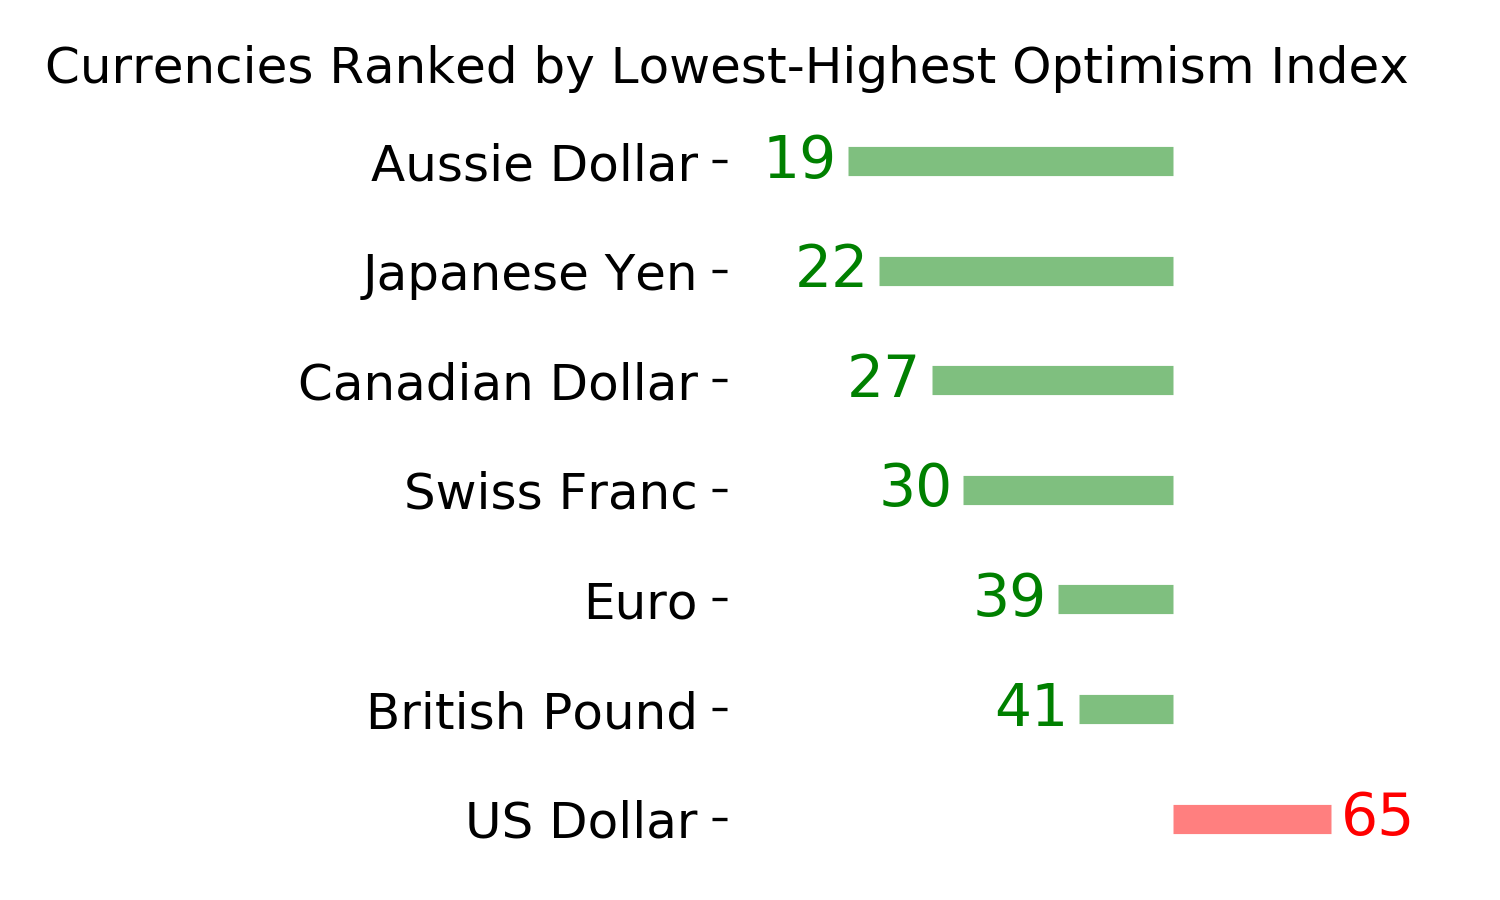
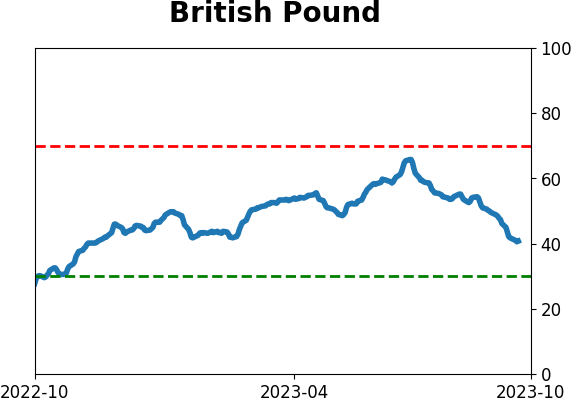
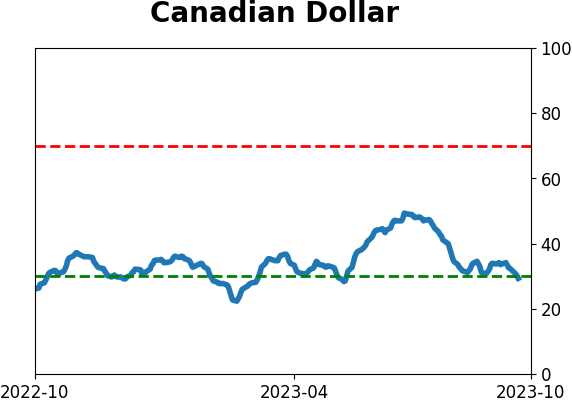
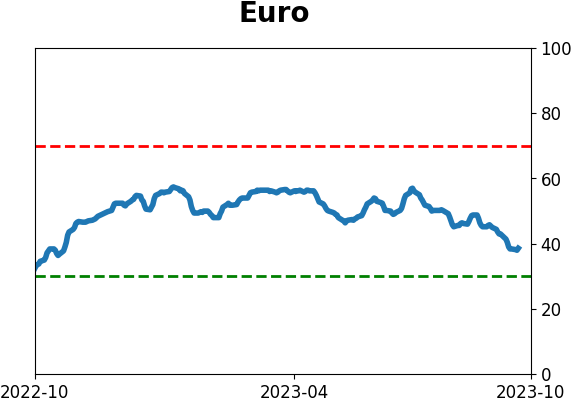
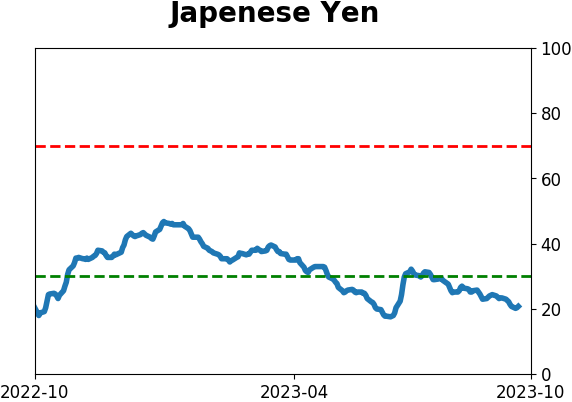
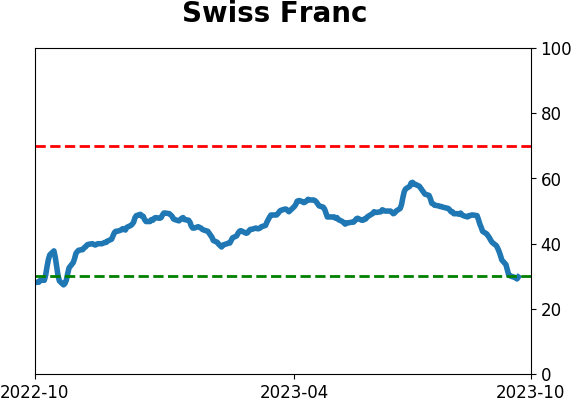
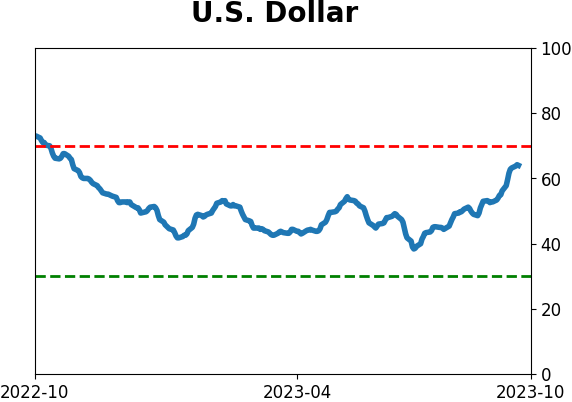
Currency ETF's - 5-Day Moving Average
|
|
|
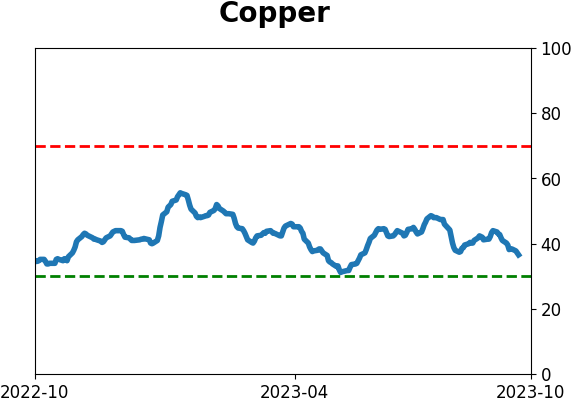
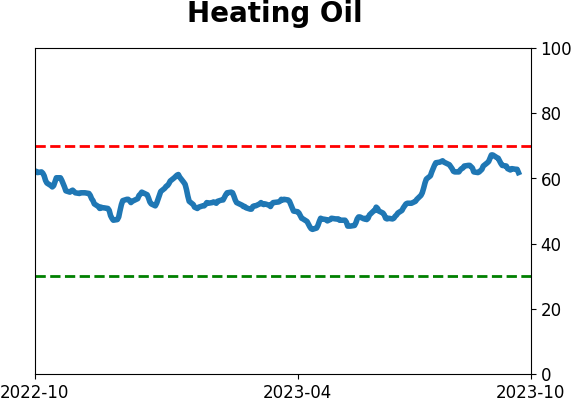
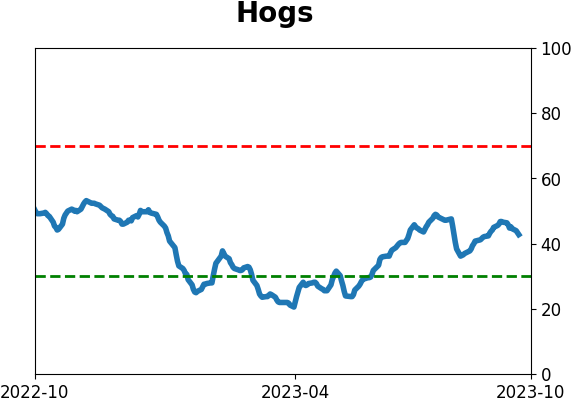
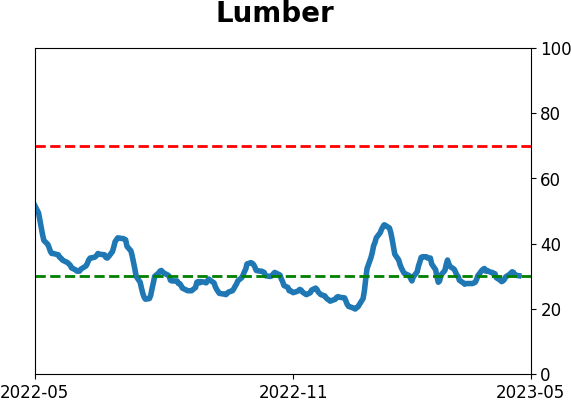
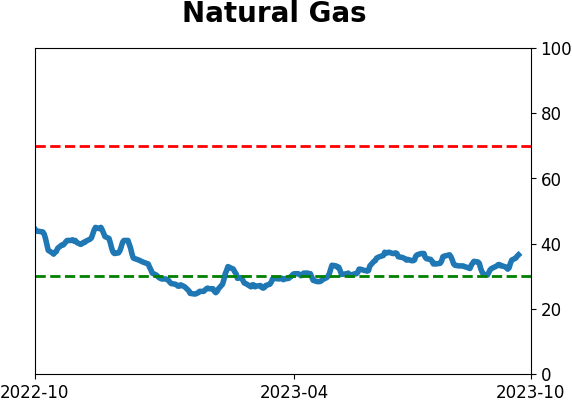
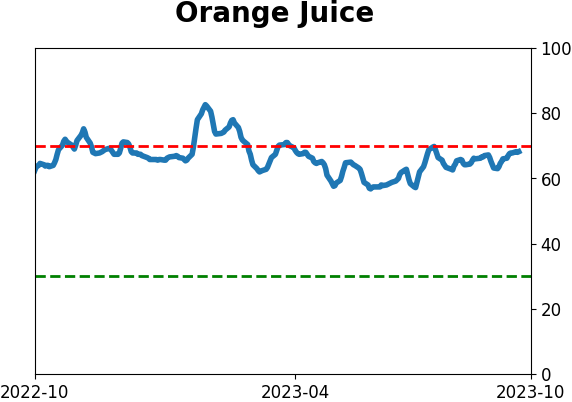
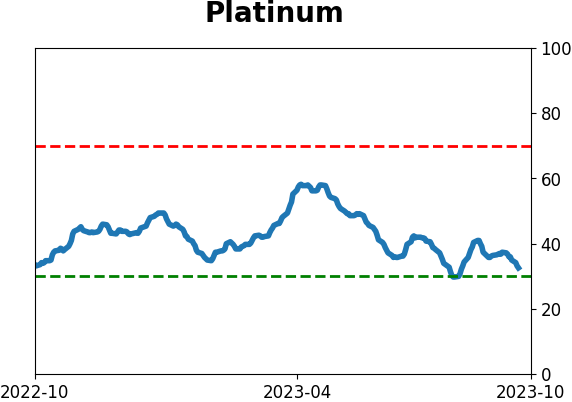
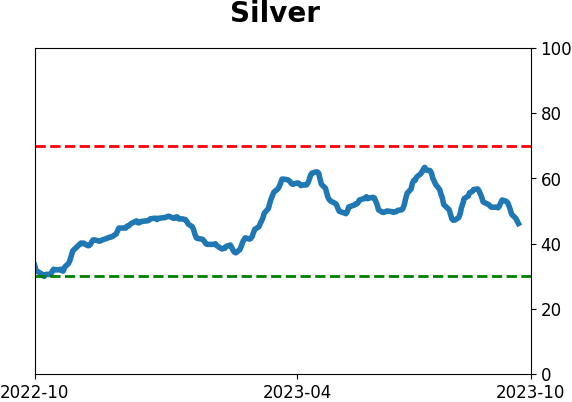
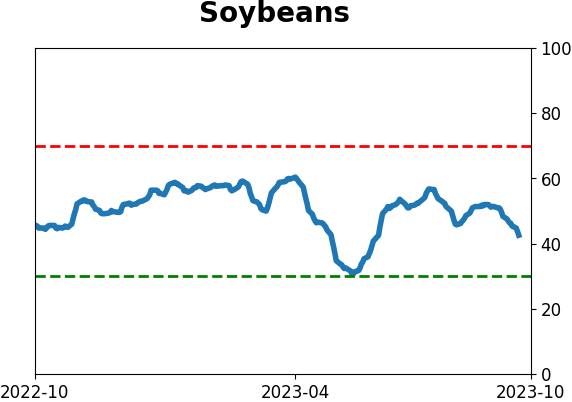
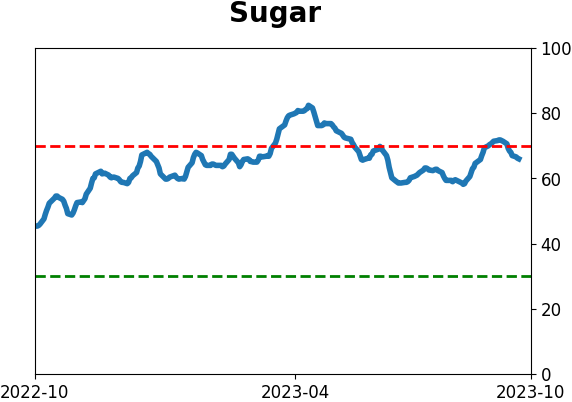
Commodity ETF's - 5-Day Moving Average
|
|