Headlines
|
|
Small Caps suffer another historic losing streak:
For a record fifth straight year, Small Caps underperformed Large Caps through Q3. Small stocks trailed Large Caps by more than 10% through Q3 this year, one of the largest divergences in total return since 1928. Those betting on relative mean reversion tended to be frustrated by momentum.
|
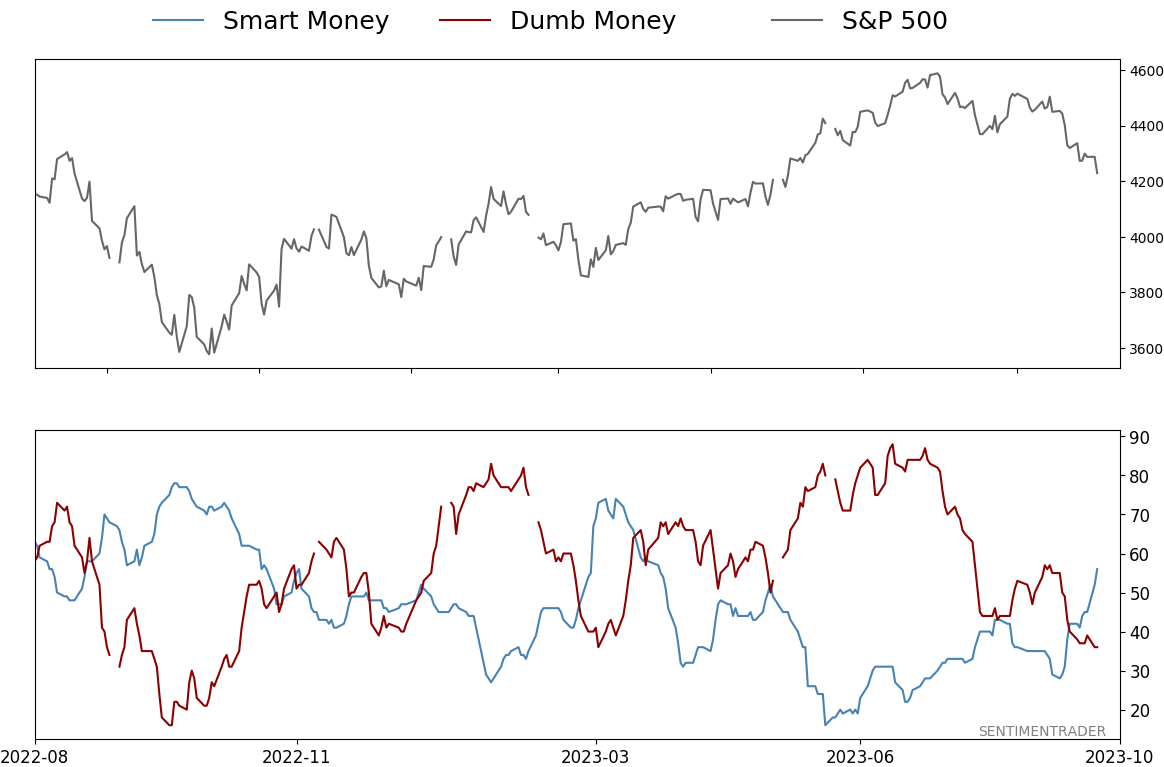
Smart / Dumb Money Confidence
|
Smart Money Confidence: 56%
Dumb Money Confidence: 36%
|
|
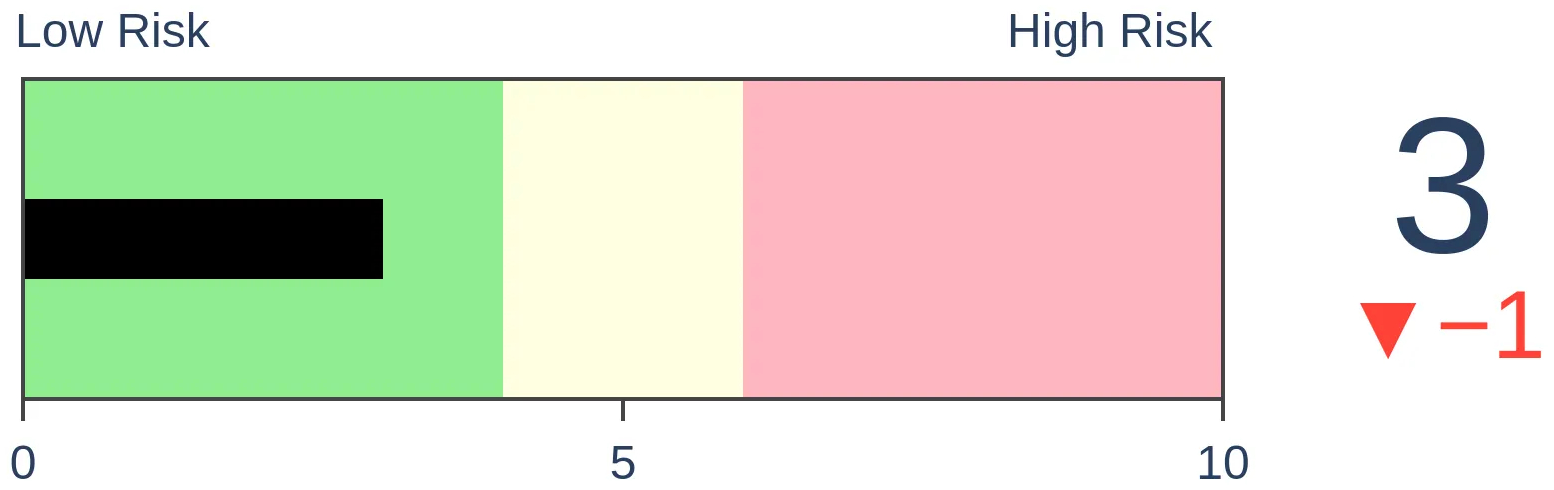
Risk Levels
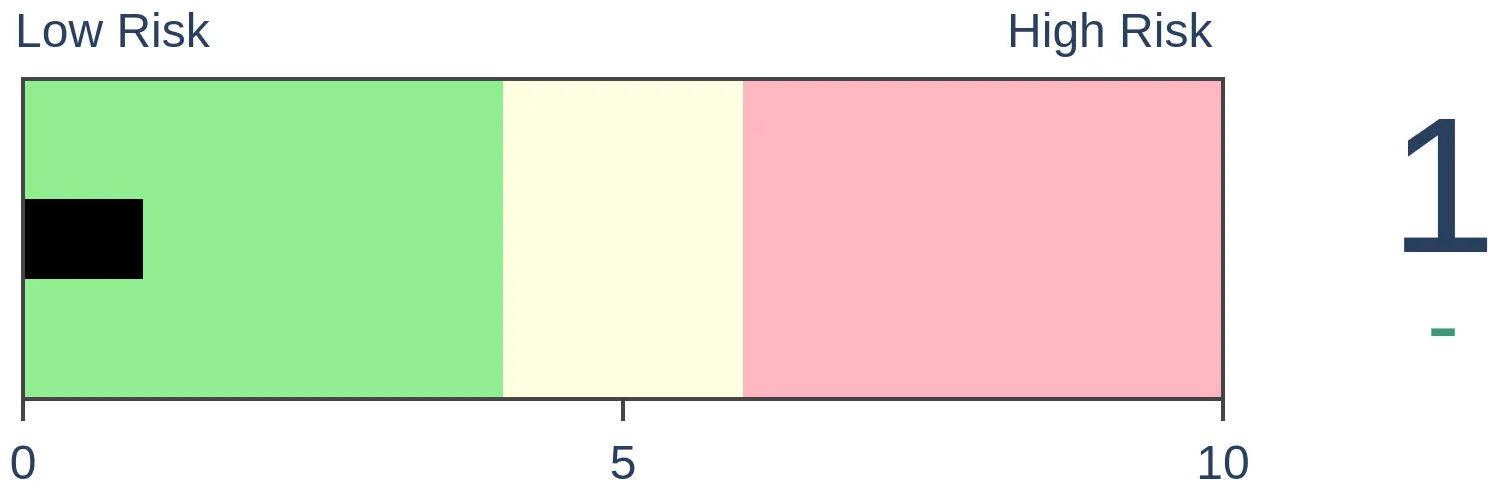
Stocks Short-Term
|
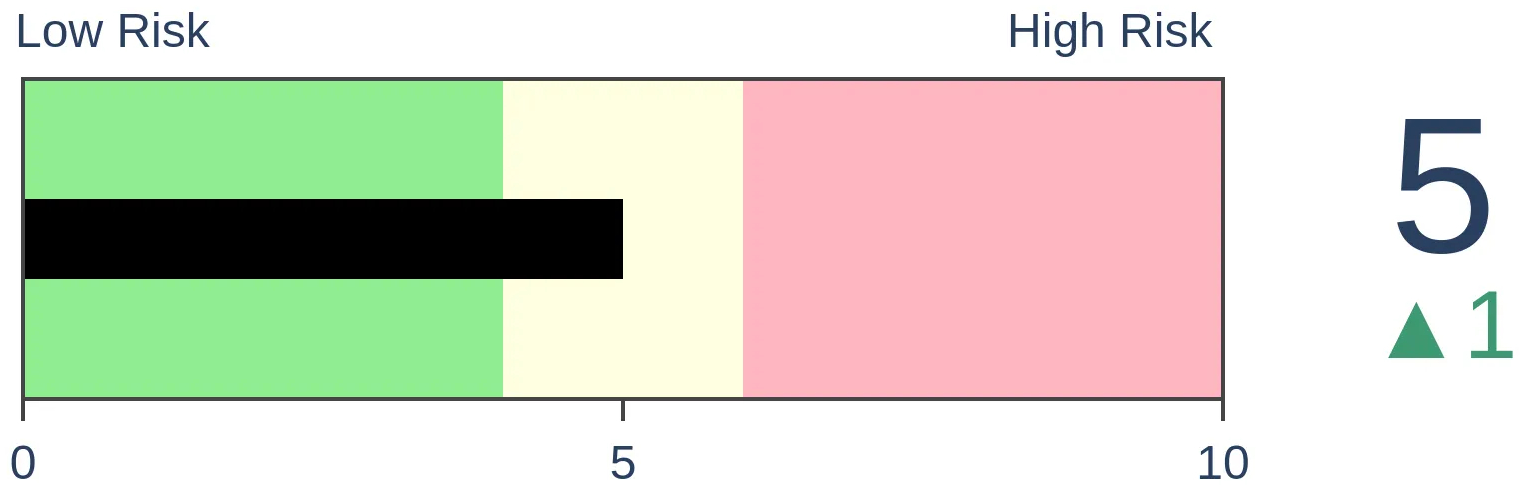
Stocks Medium-Term

|
|
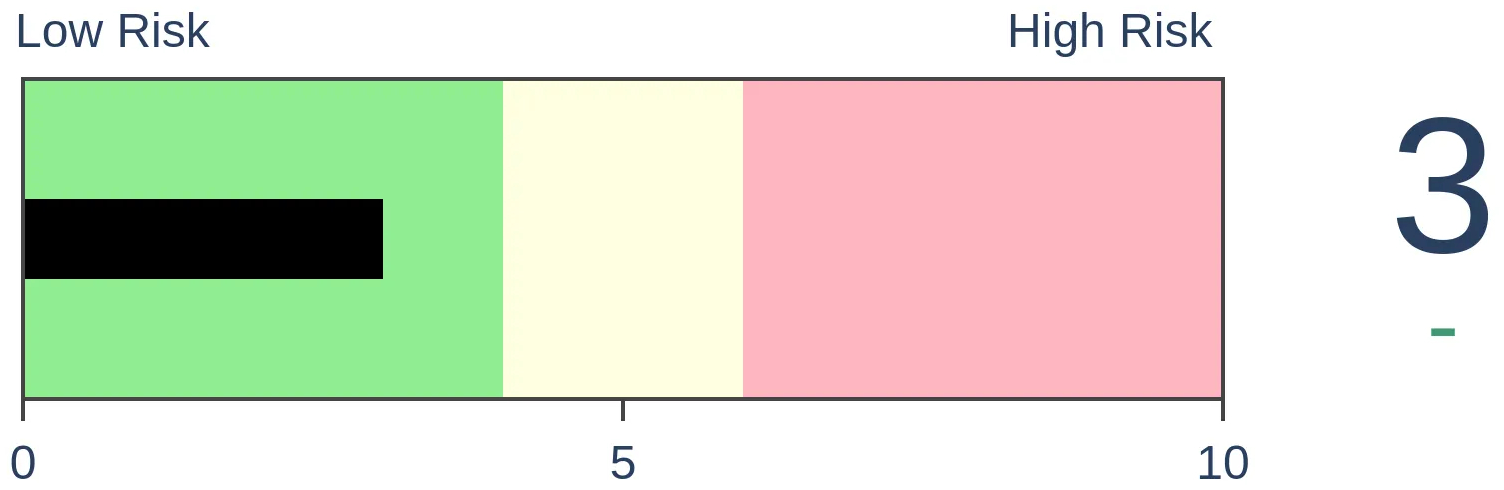
Bonds
|
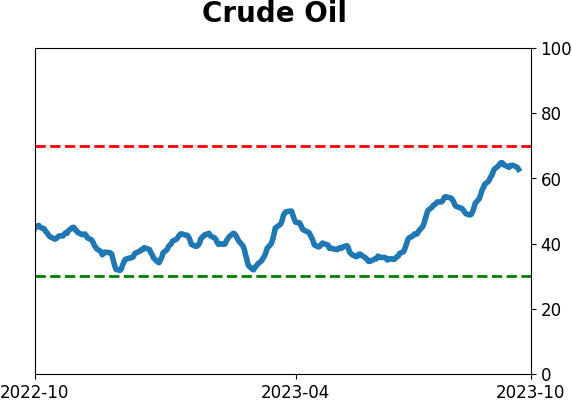
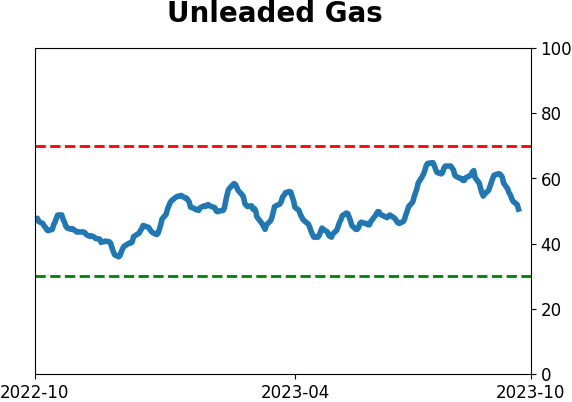
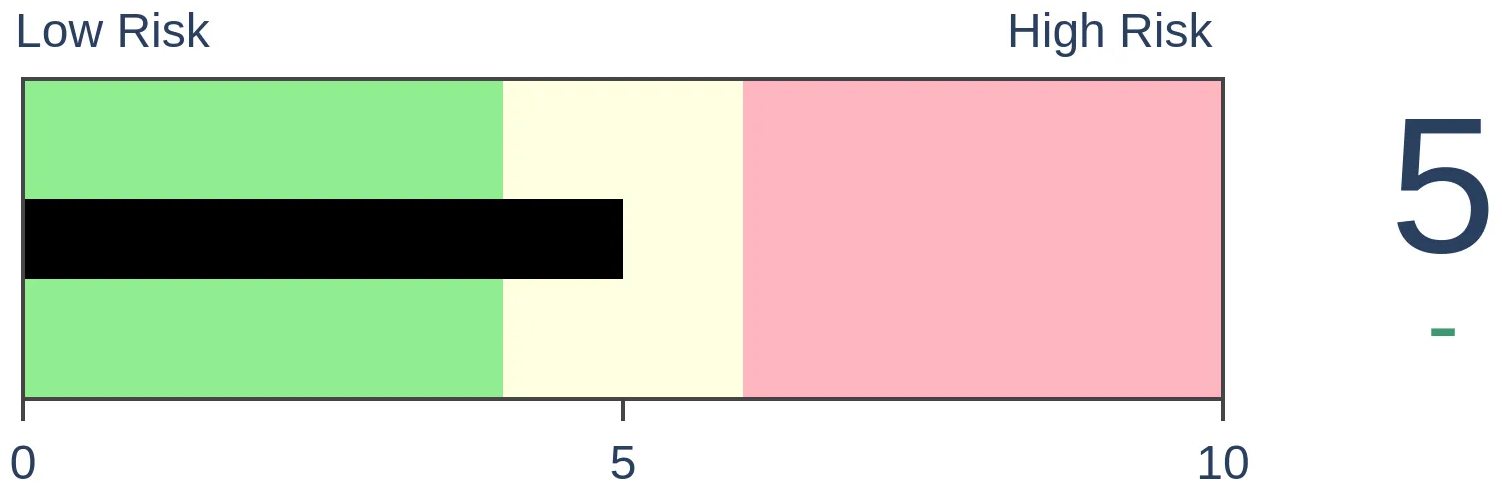
Crude Oil
|
|
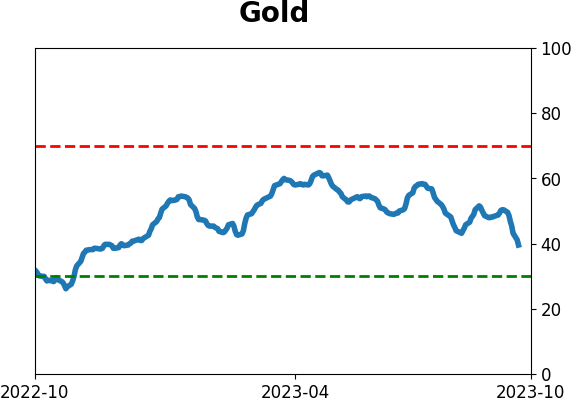
Gold
|
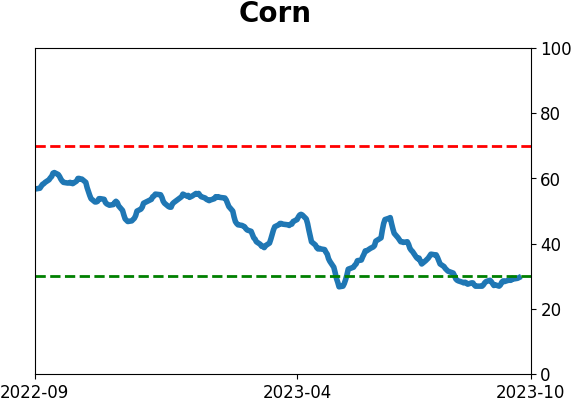
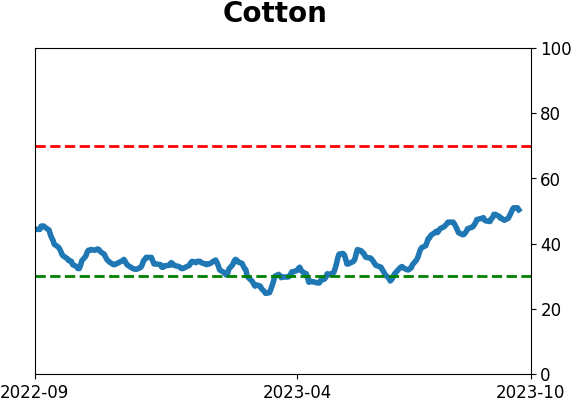
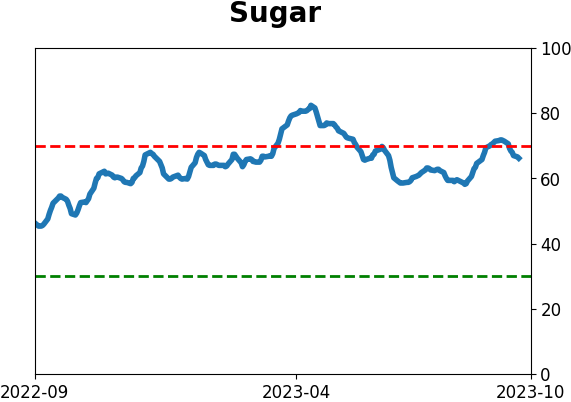
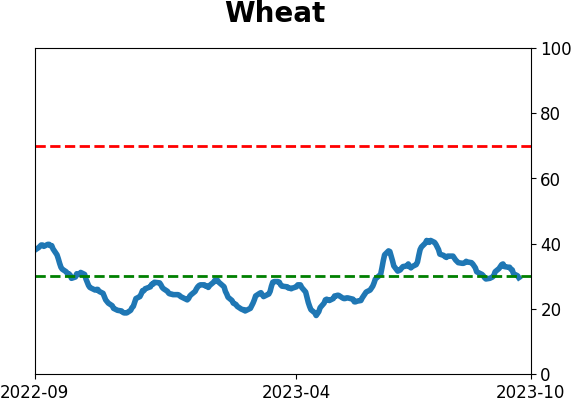
Agriculture
|
|
Research
By Jason Goepfert
BOTTOM LINE
For a record fifth straight year, Small Caps underperformed Large Caps through Q3. Small stocks trailed Large Caps by more than 10% through Q3 this year, one of the largest divergences in total return since 1928. Those betting on relative mean reversion tended to be frustrated by momentum.
FORECAST / TIMEFRAME
None
|
Key points:
- Small Cap stocks underperformed Large Caps through Q3 for the fifth year in a row, a record
- Other times when the streak reached four years, they tended to bounce back
- When they underperformed by 10% or more through Q3, mean reversion was much less common
For the fifth year in a row, Small Caps suffer a relative struggle
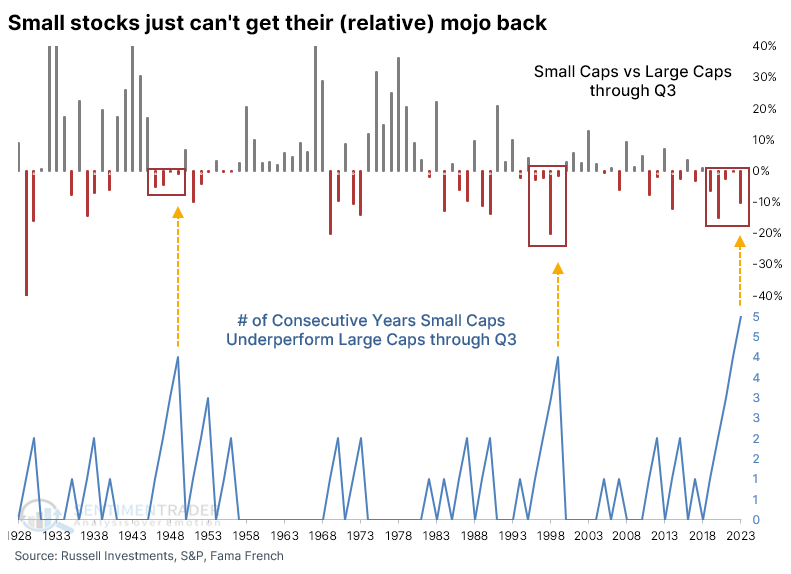
A couple of weeks ago, we saw that the ratio of smaller stocks to large stocks hit yet another multi-decade low. It has tended to keep going when it reaches this kind of extreme. It has since hovered near its lows.
Through the third quarter, the total return on Small Caps underperformed Large Caps by more than 10%, ranking in the bottom 15% of all years since 1928. This is now the 5th consecutive year that Small Caps underperformed Large Caps through Q3, a record stretch (some of the returns before 1950 were cut off as they were so egregious that they distorted the scale).
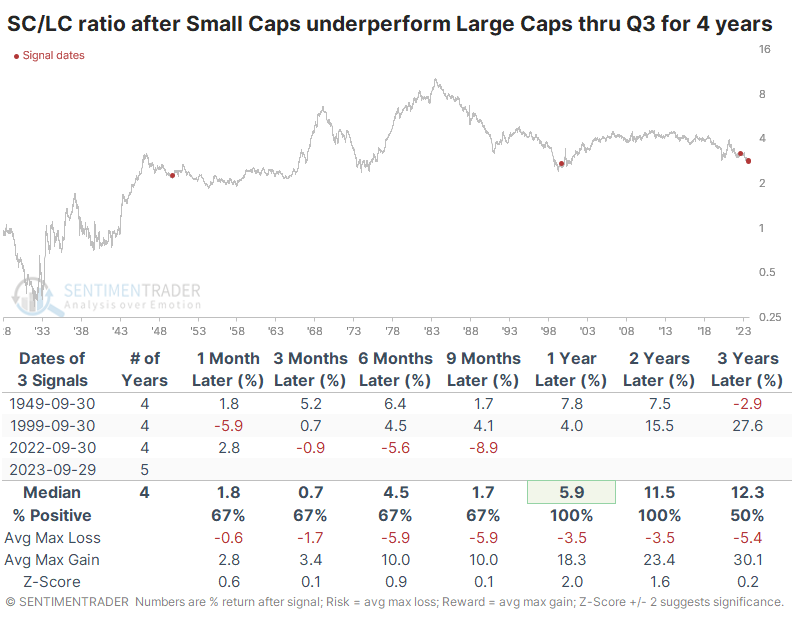
There were only three other times that the streak lasted four years, shown in the table below. Even though they underperformed again after the 2022 streak reached four years, their absolute return is still quite positive.
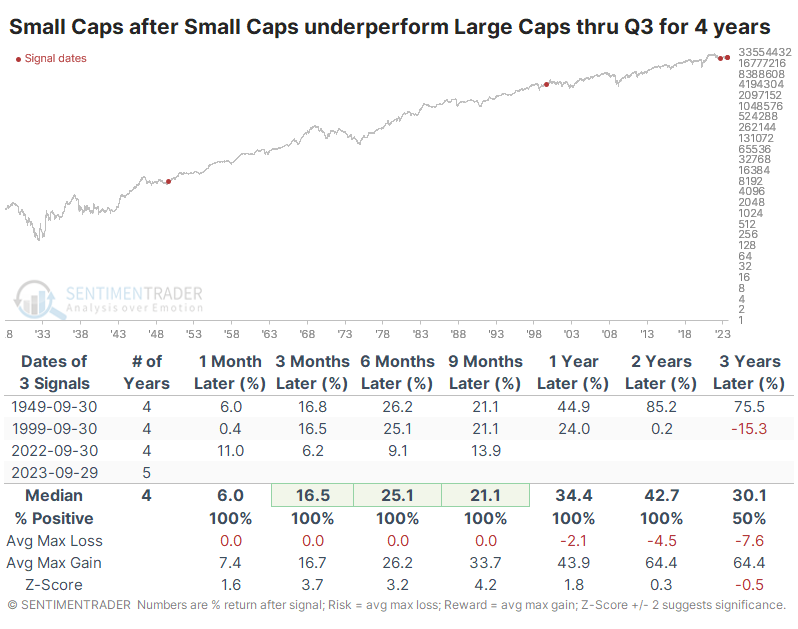
Relative to Large Caps, they did outperform over the long term when the streak reached four years in 1949 and 1999. Obviously, that failed last year because here we are.
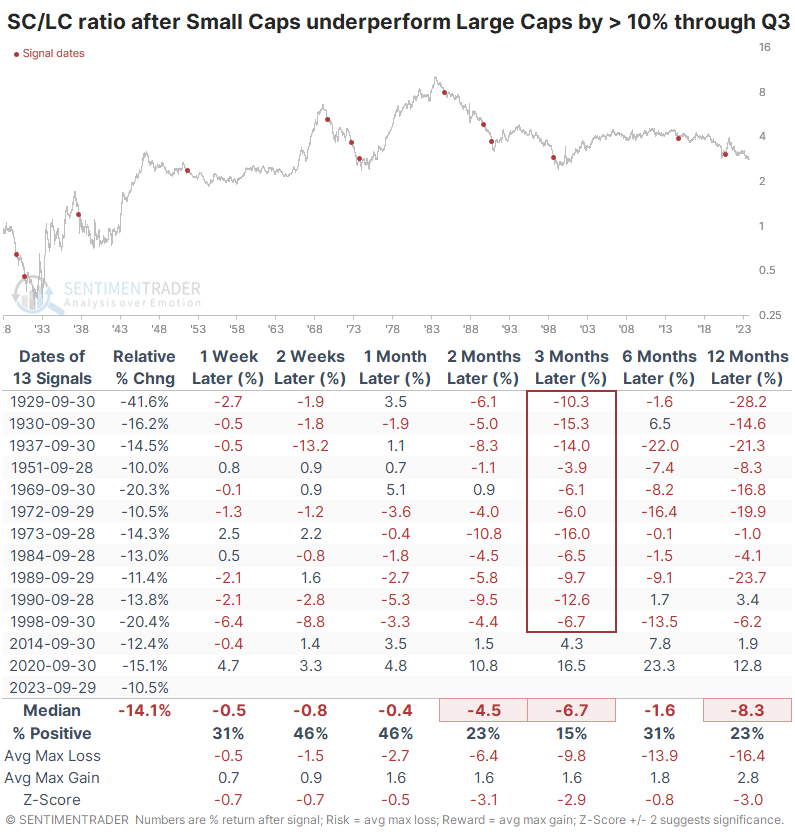
If we ignore the fact that they've underperformed through Q3 for five straight years and just look at the magnitude of the underperformance, the table below shows returns after they trailed Large Caps by 10% or more.
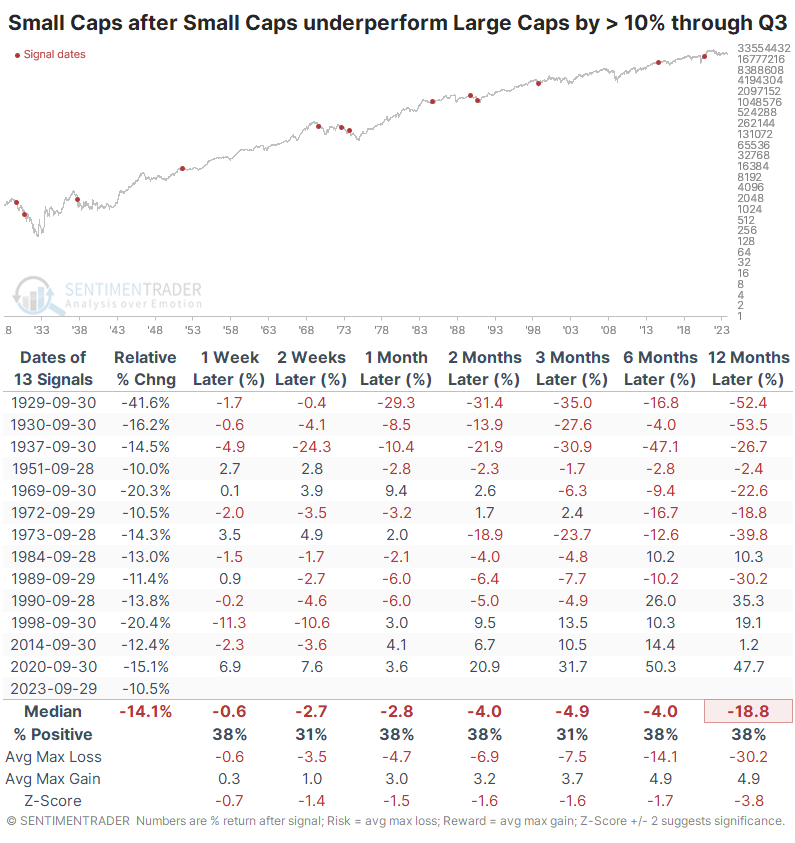
Like other studies we've looked at in recent weeks, it wasn't encouraging for mean-reversion investors. The last few signals were decent, so that's something. But prior to the last 25 years, all of them preceded losses for Small Caps either three or six months later.
Even though recent signals have preceded positive absolute returns, they have still mostly trailed the returns on Large Caps. The last two were the exception - all the preceding signals saw Small Caps continue to underperform Large Caps over the next three months, roughly taking us through year-end.
What the research tells us...
Mean reversion is an irresistible tug for contrarian-minded investors, and when it works, it often works spectacularly. The biggest hurdle is momentum, which is itself a powerful force. For some markets, mean-reversion tends to win, while momentum usually wins in others. Even within markets, it can differ between indexes, sectors, and factors. For Small Caps, there are some compelling bullish arguments, such as relative valuations. Regarding relative price performance, though, it has been hard to find a reliable study that suggests they are a good trade or investment relative to their bigger brothers.
Indicators at Extremes
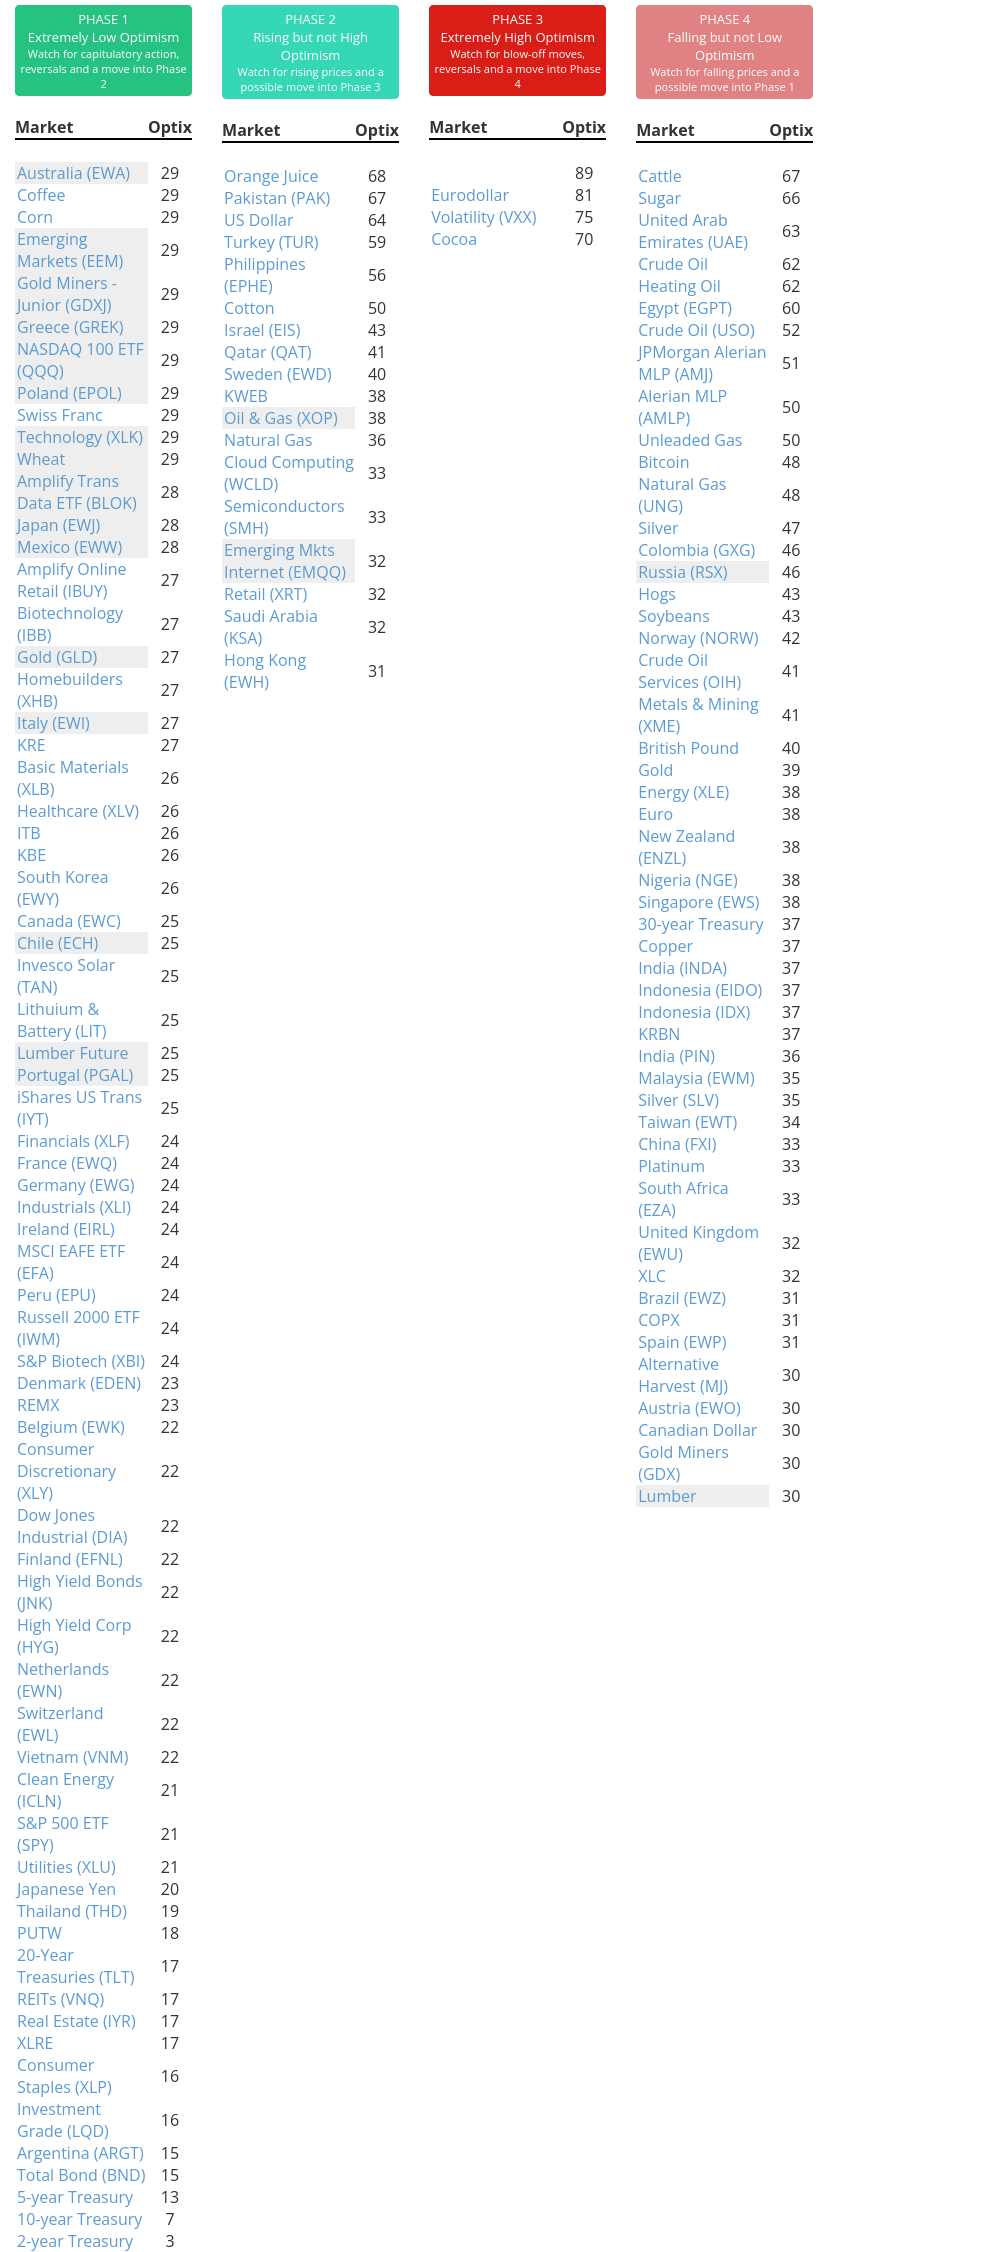
Phase Table
Ranks
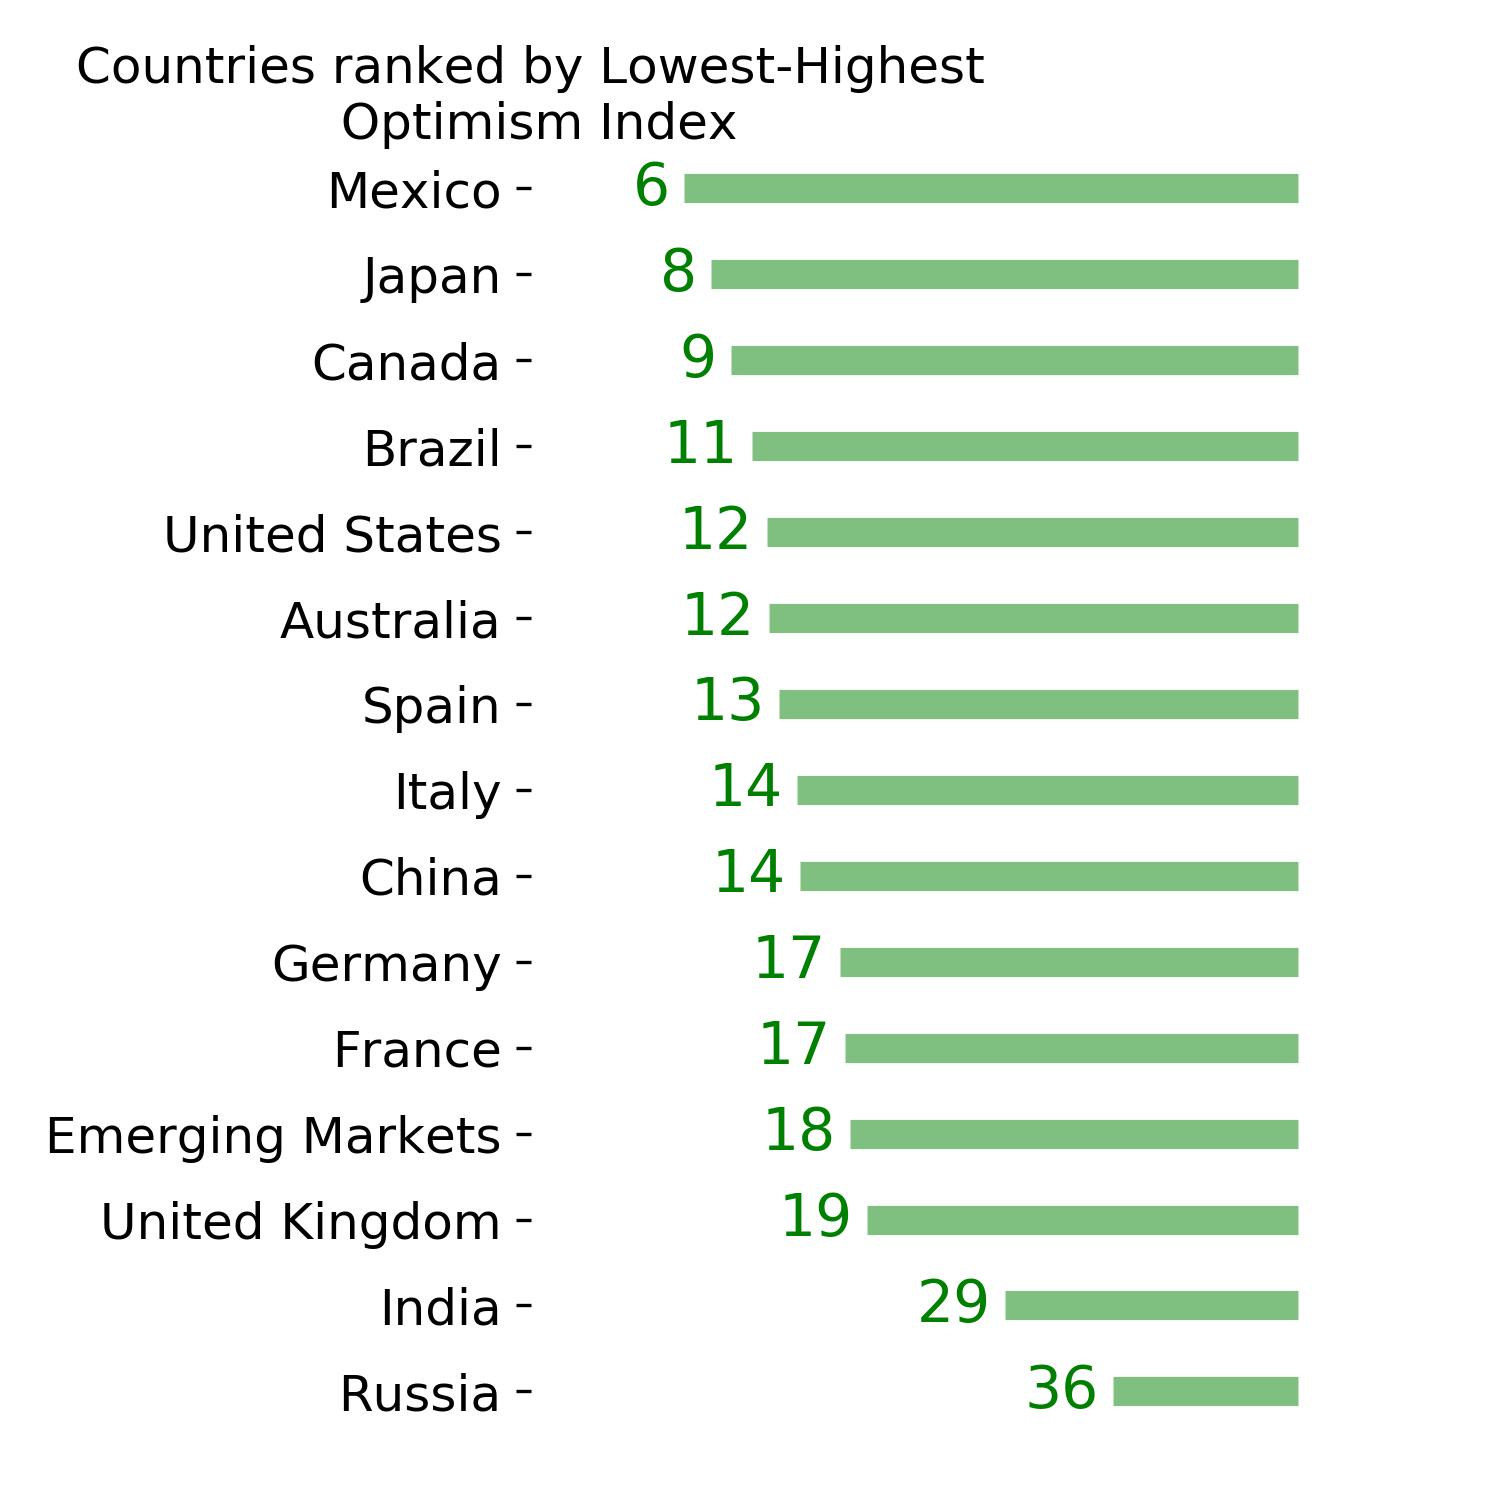
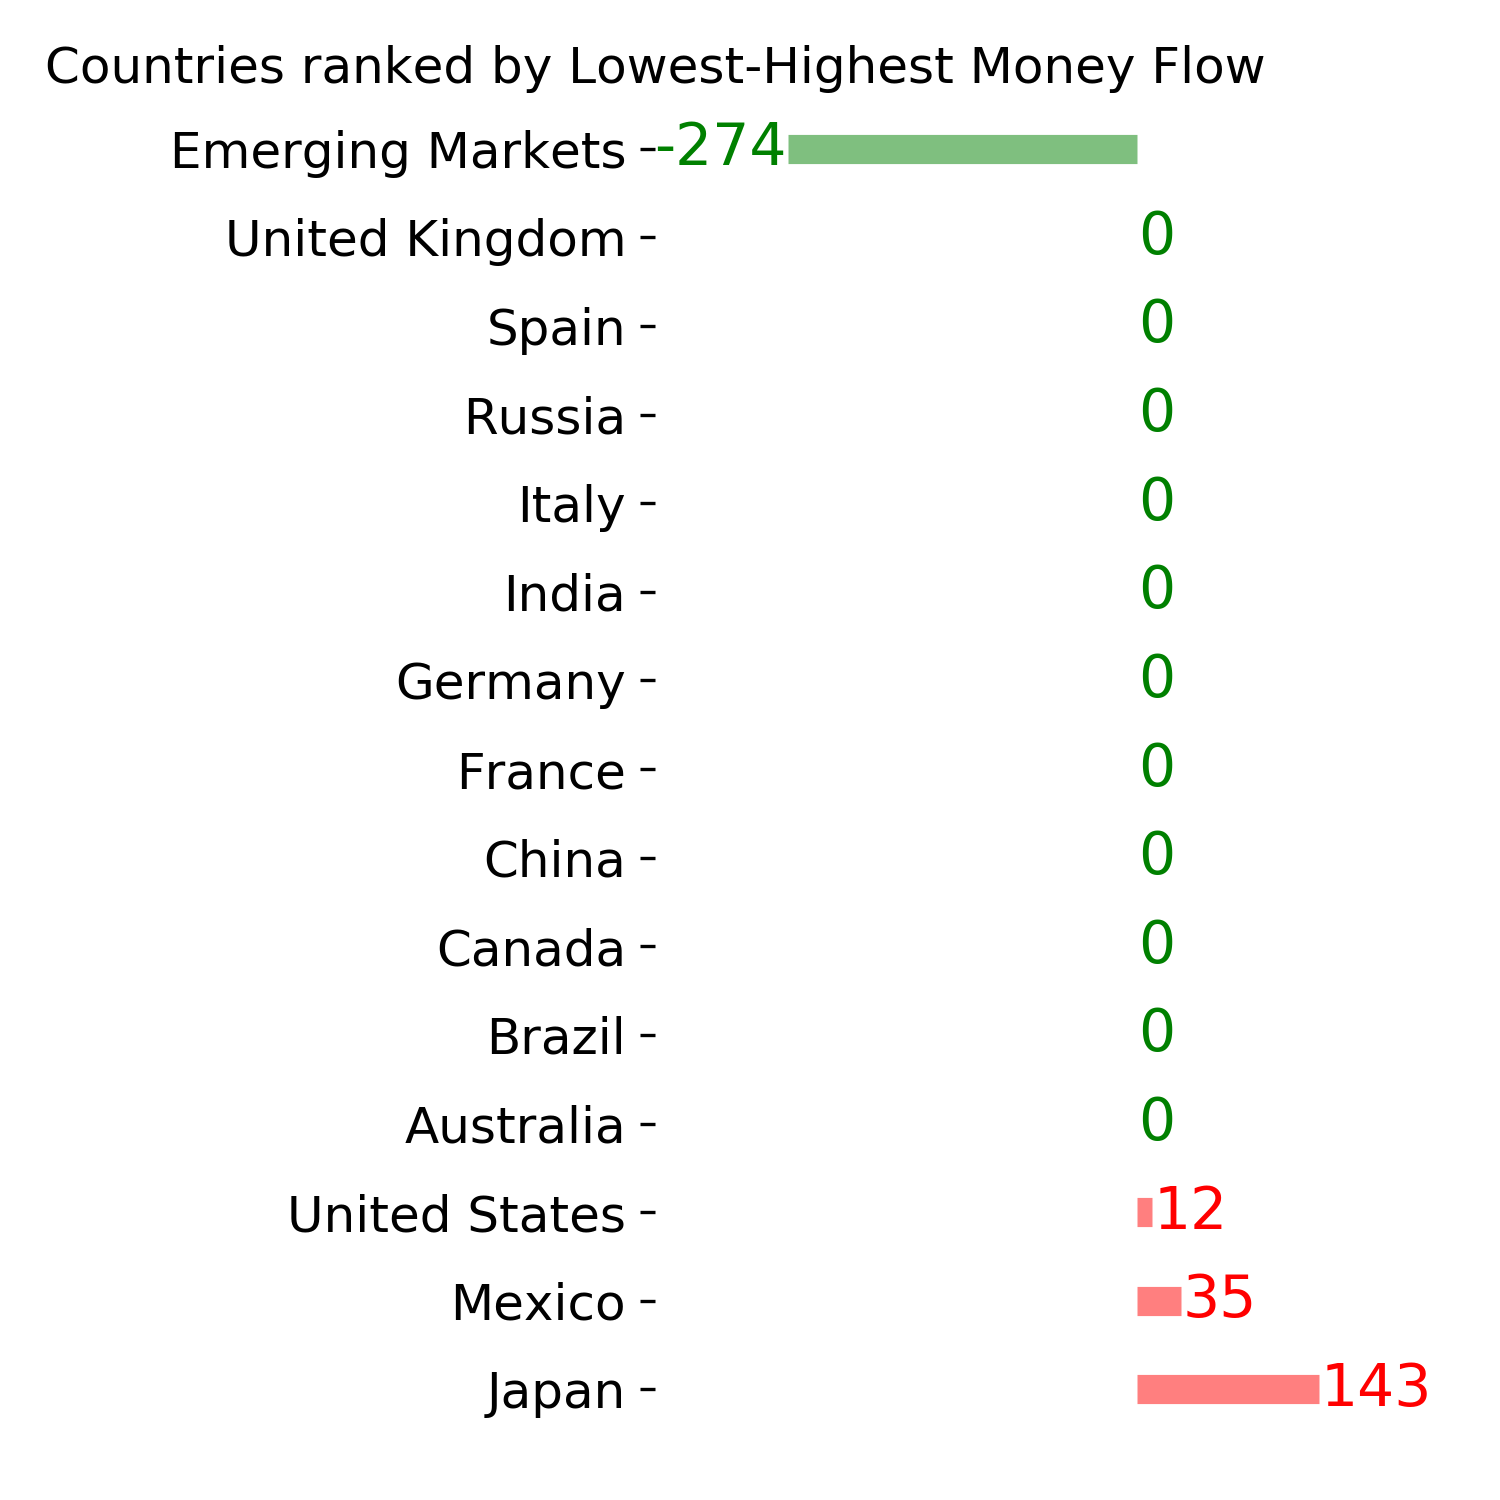
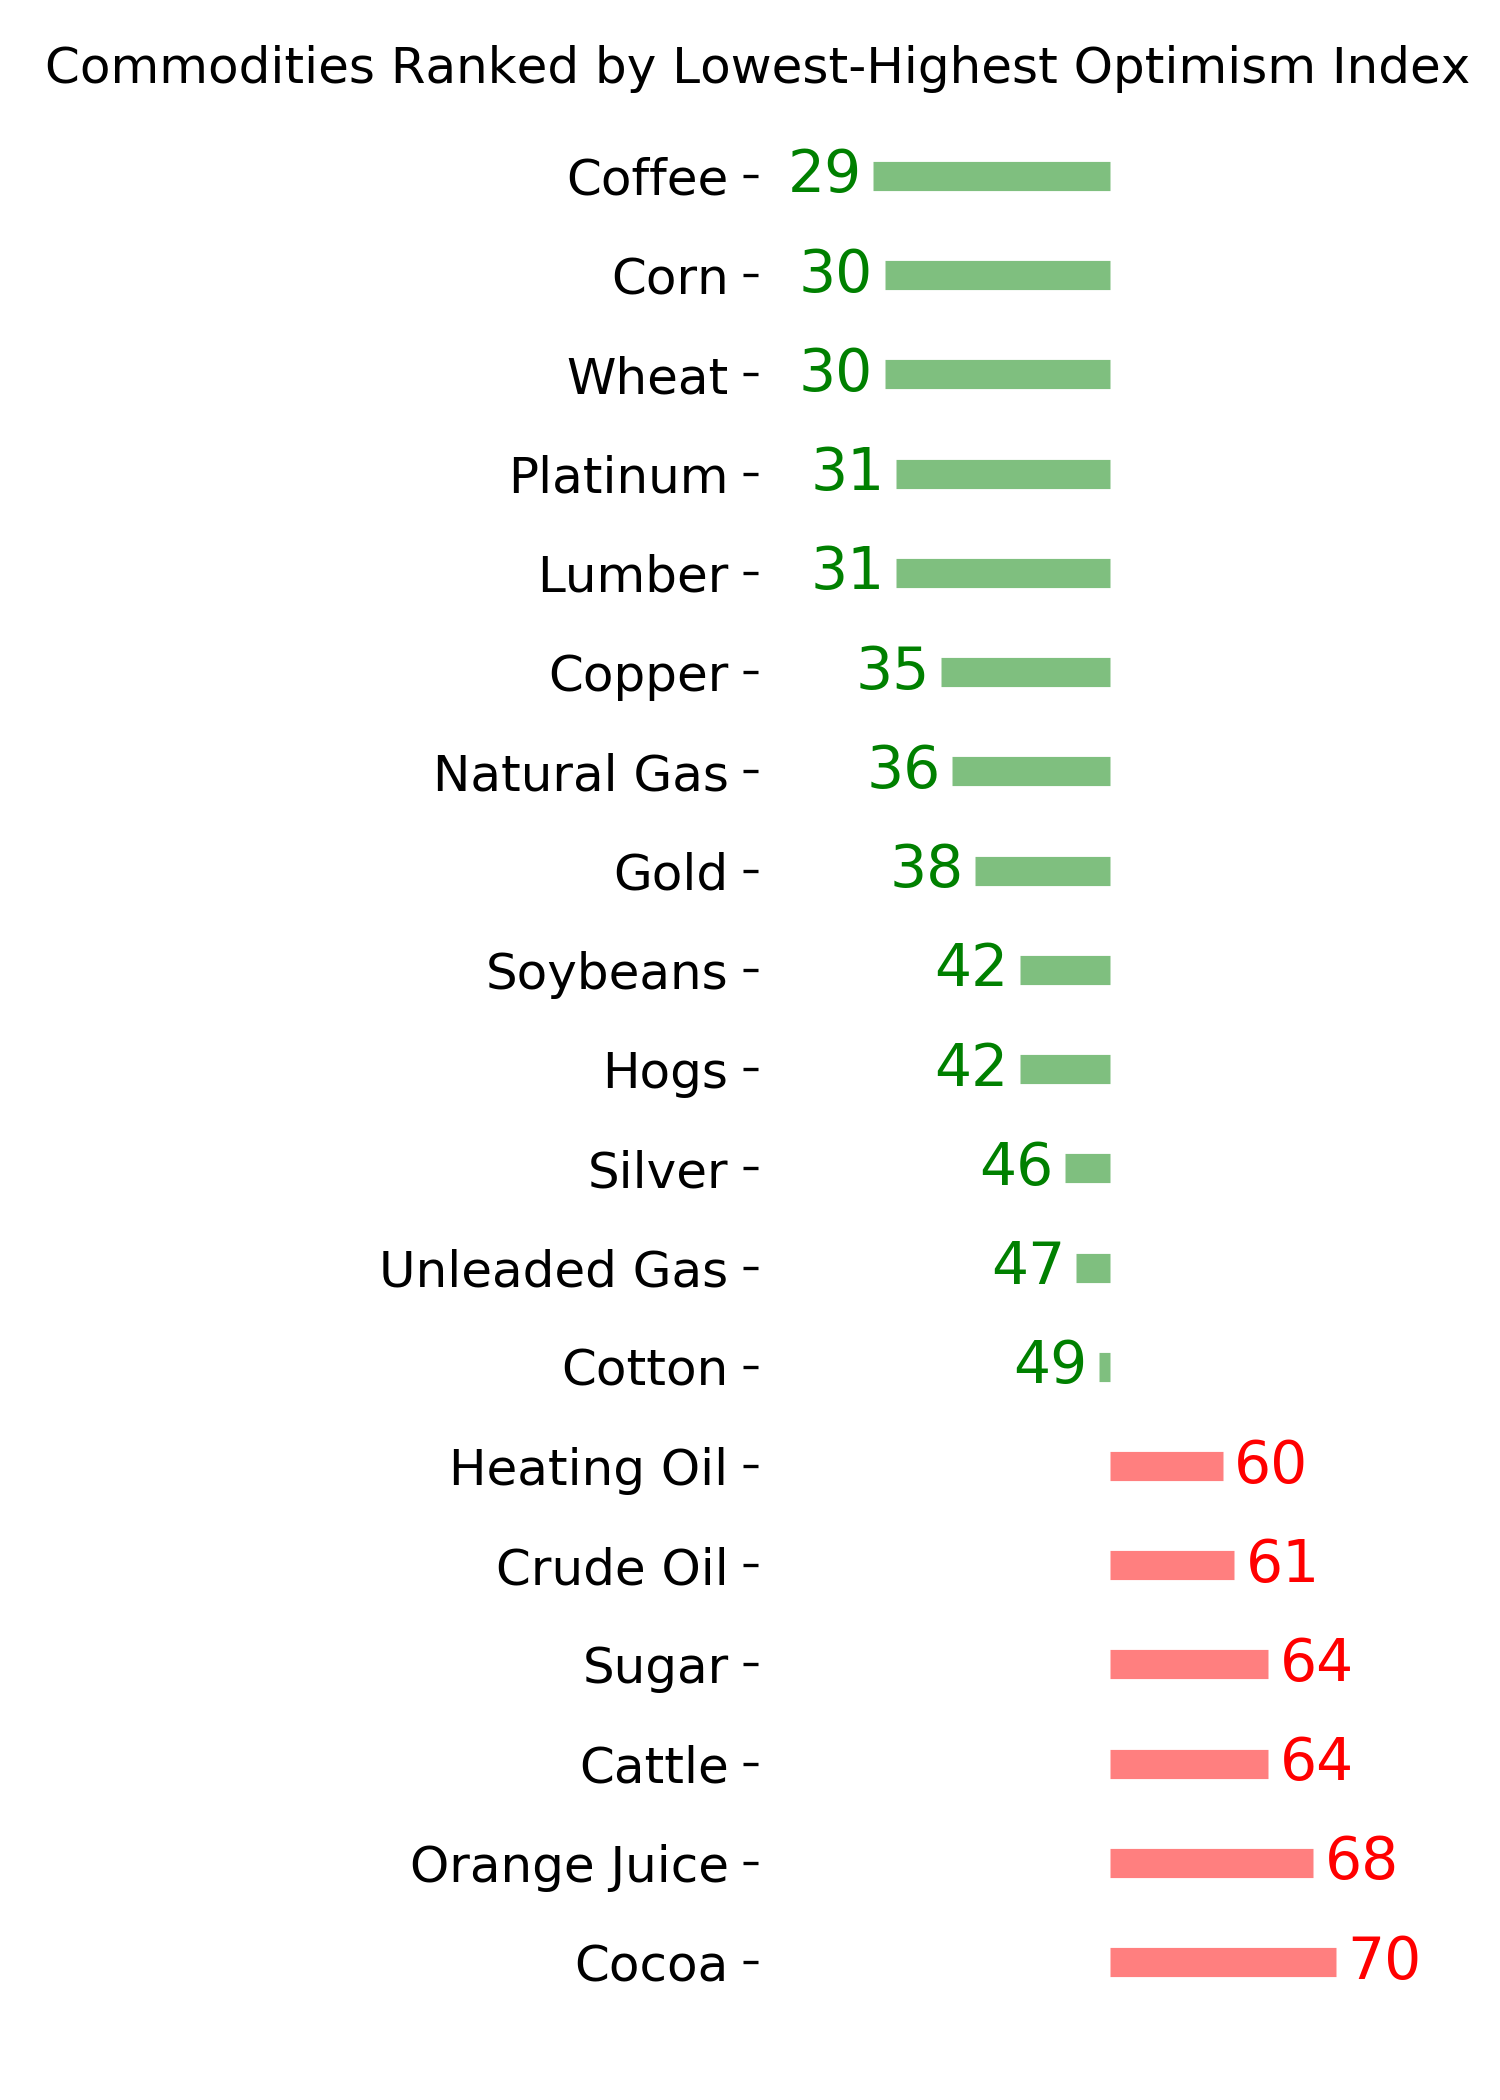
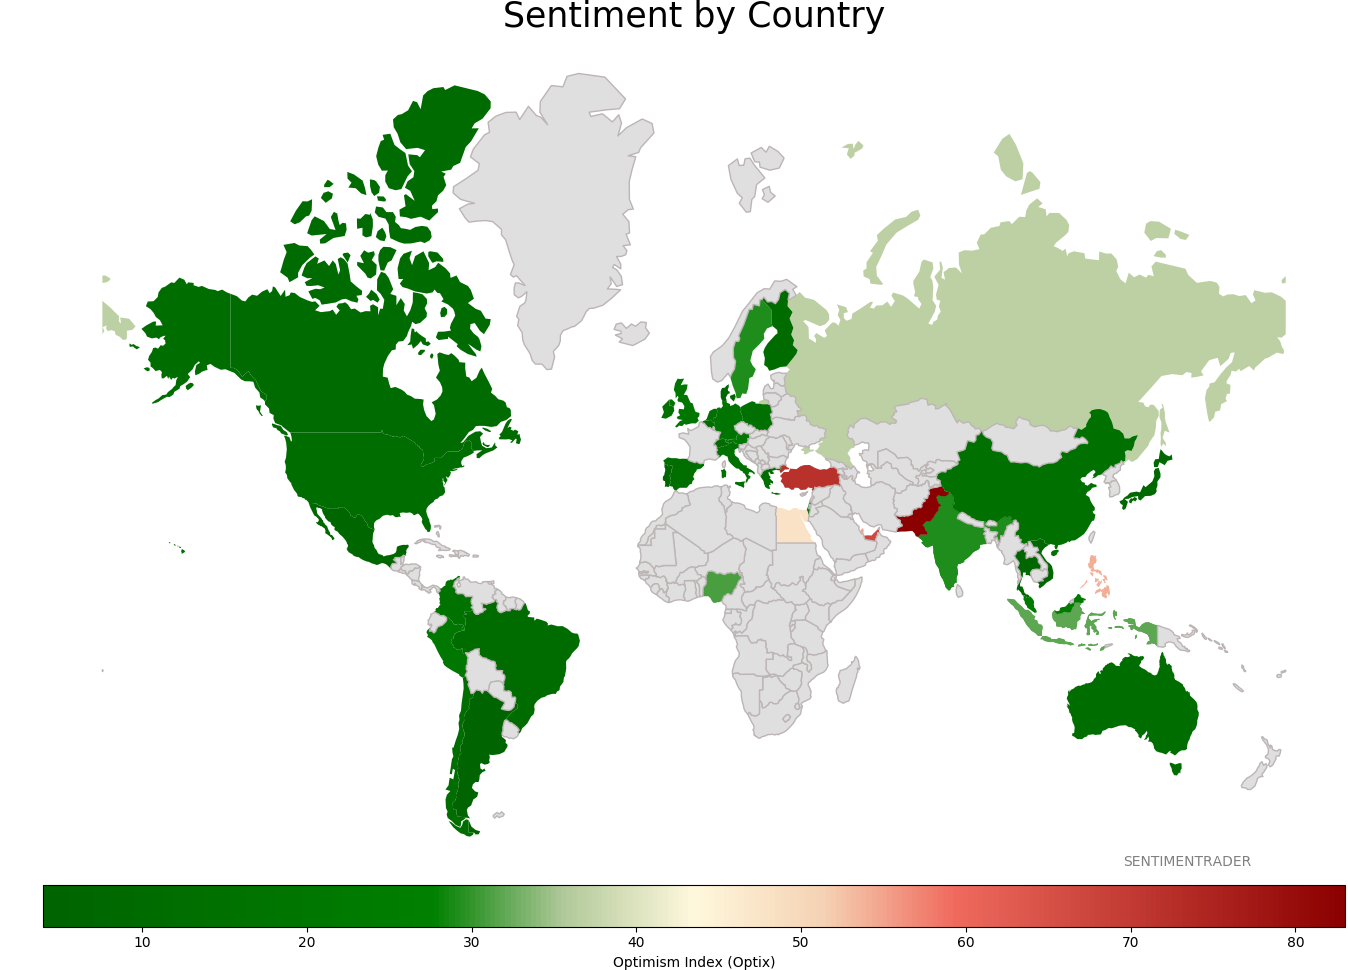
Sentiment Around The World
Optimism Index Thumbnails
|
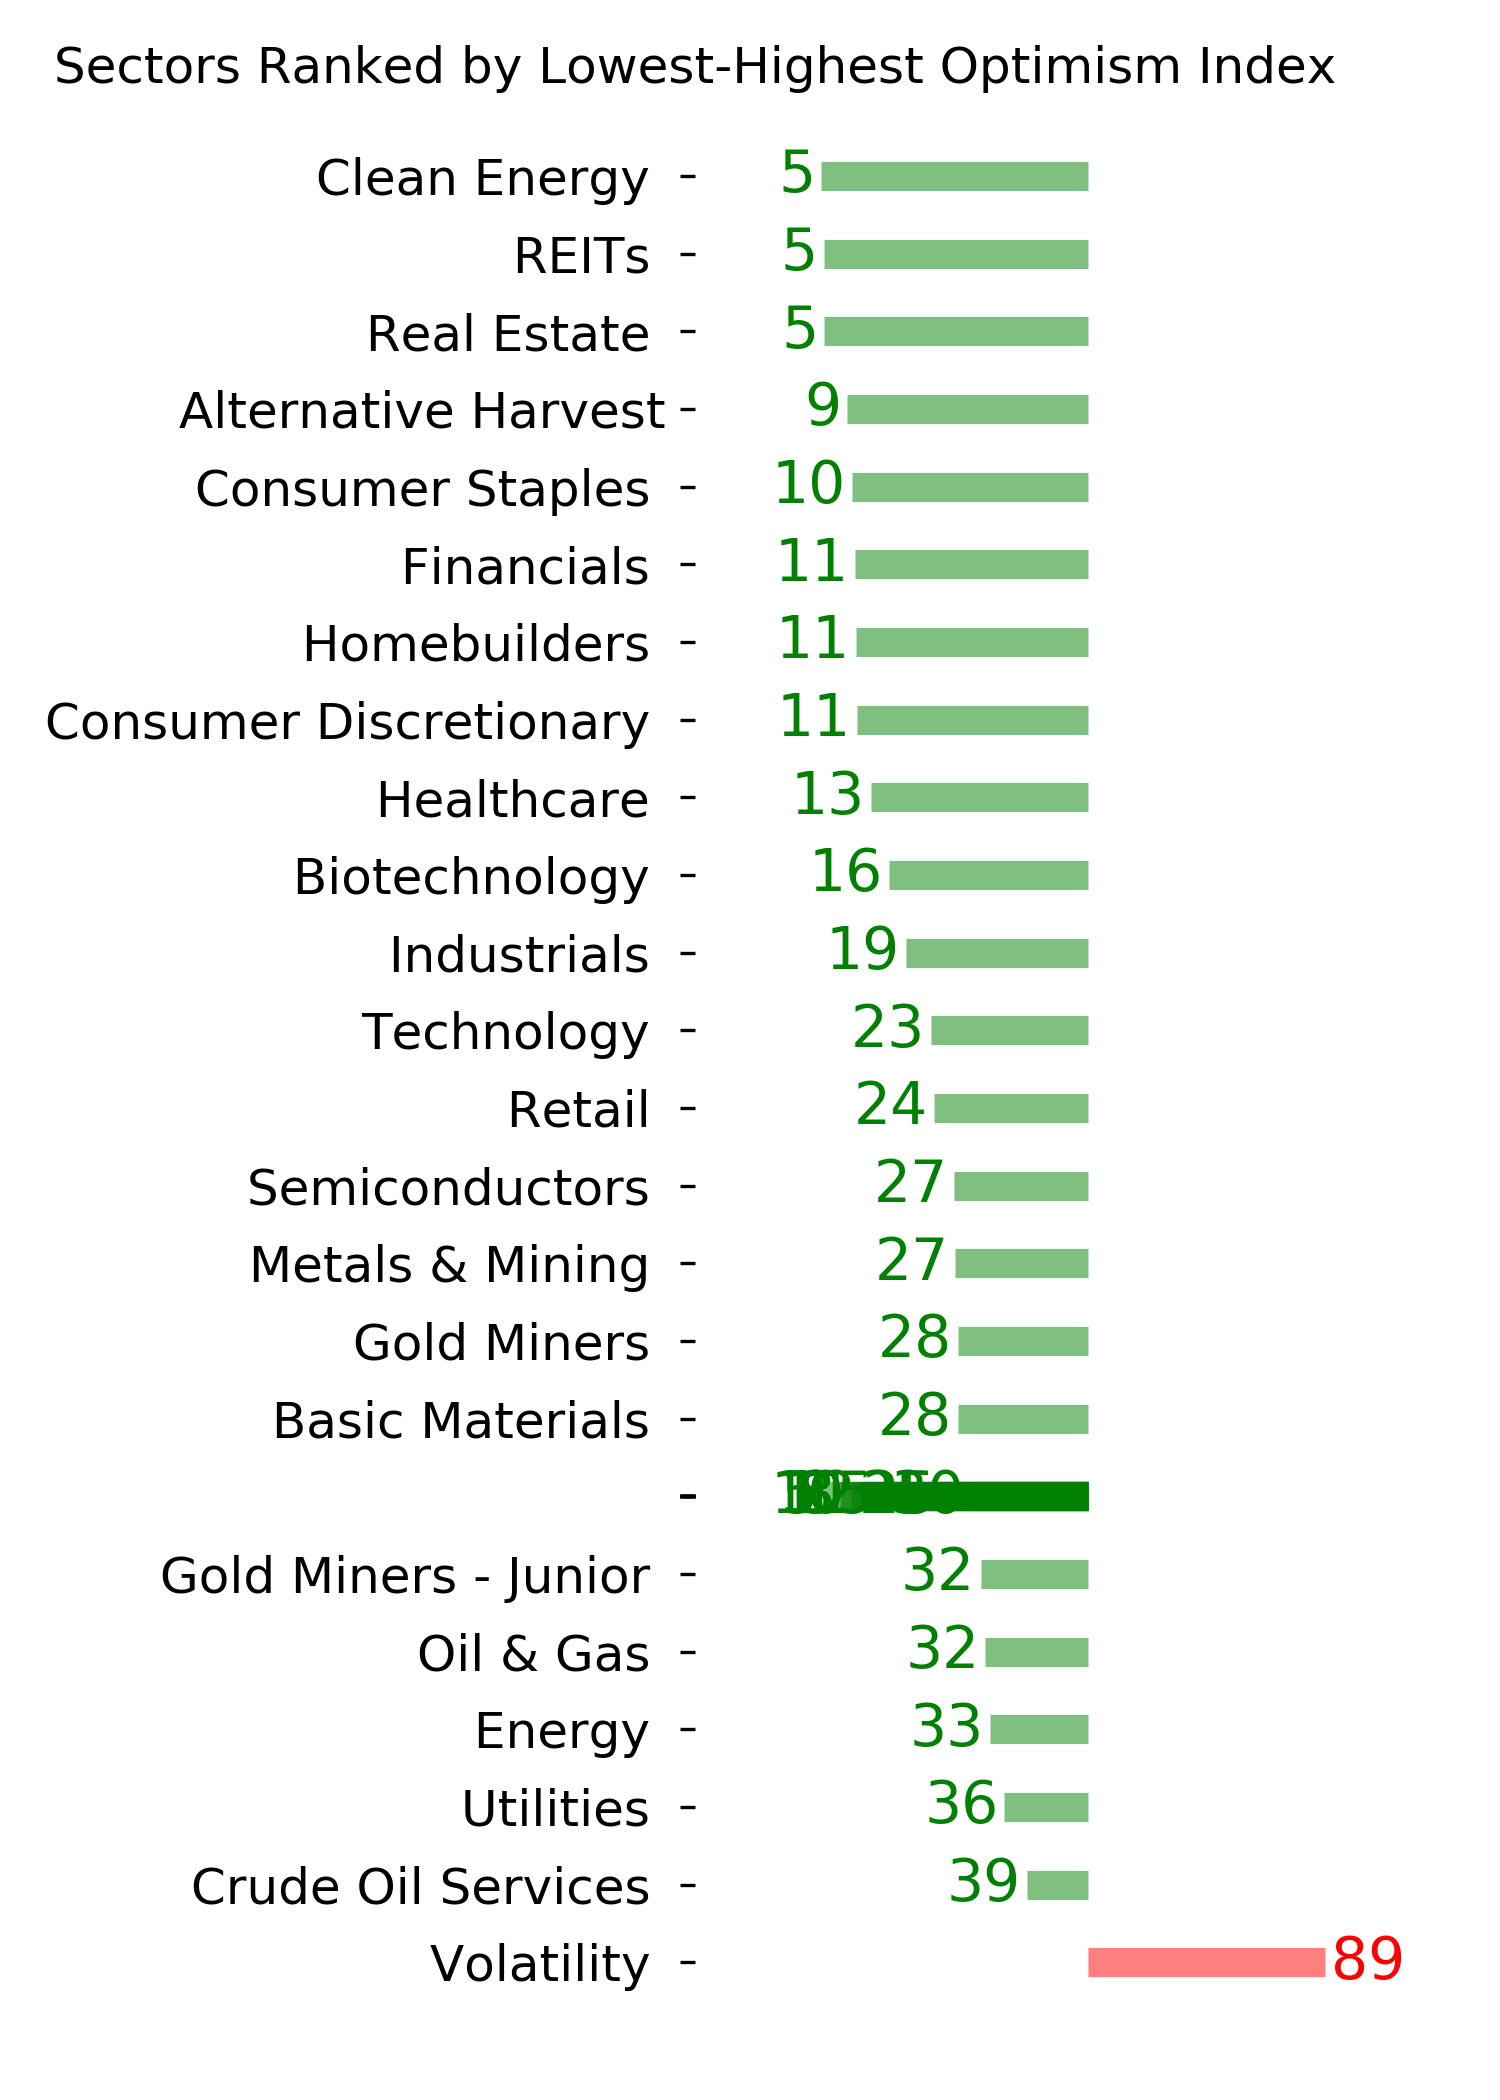
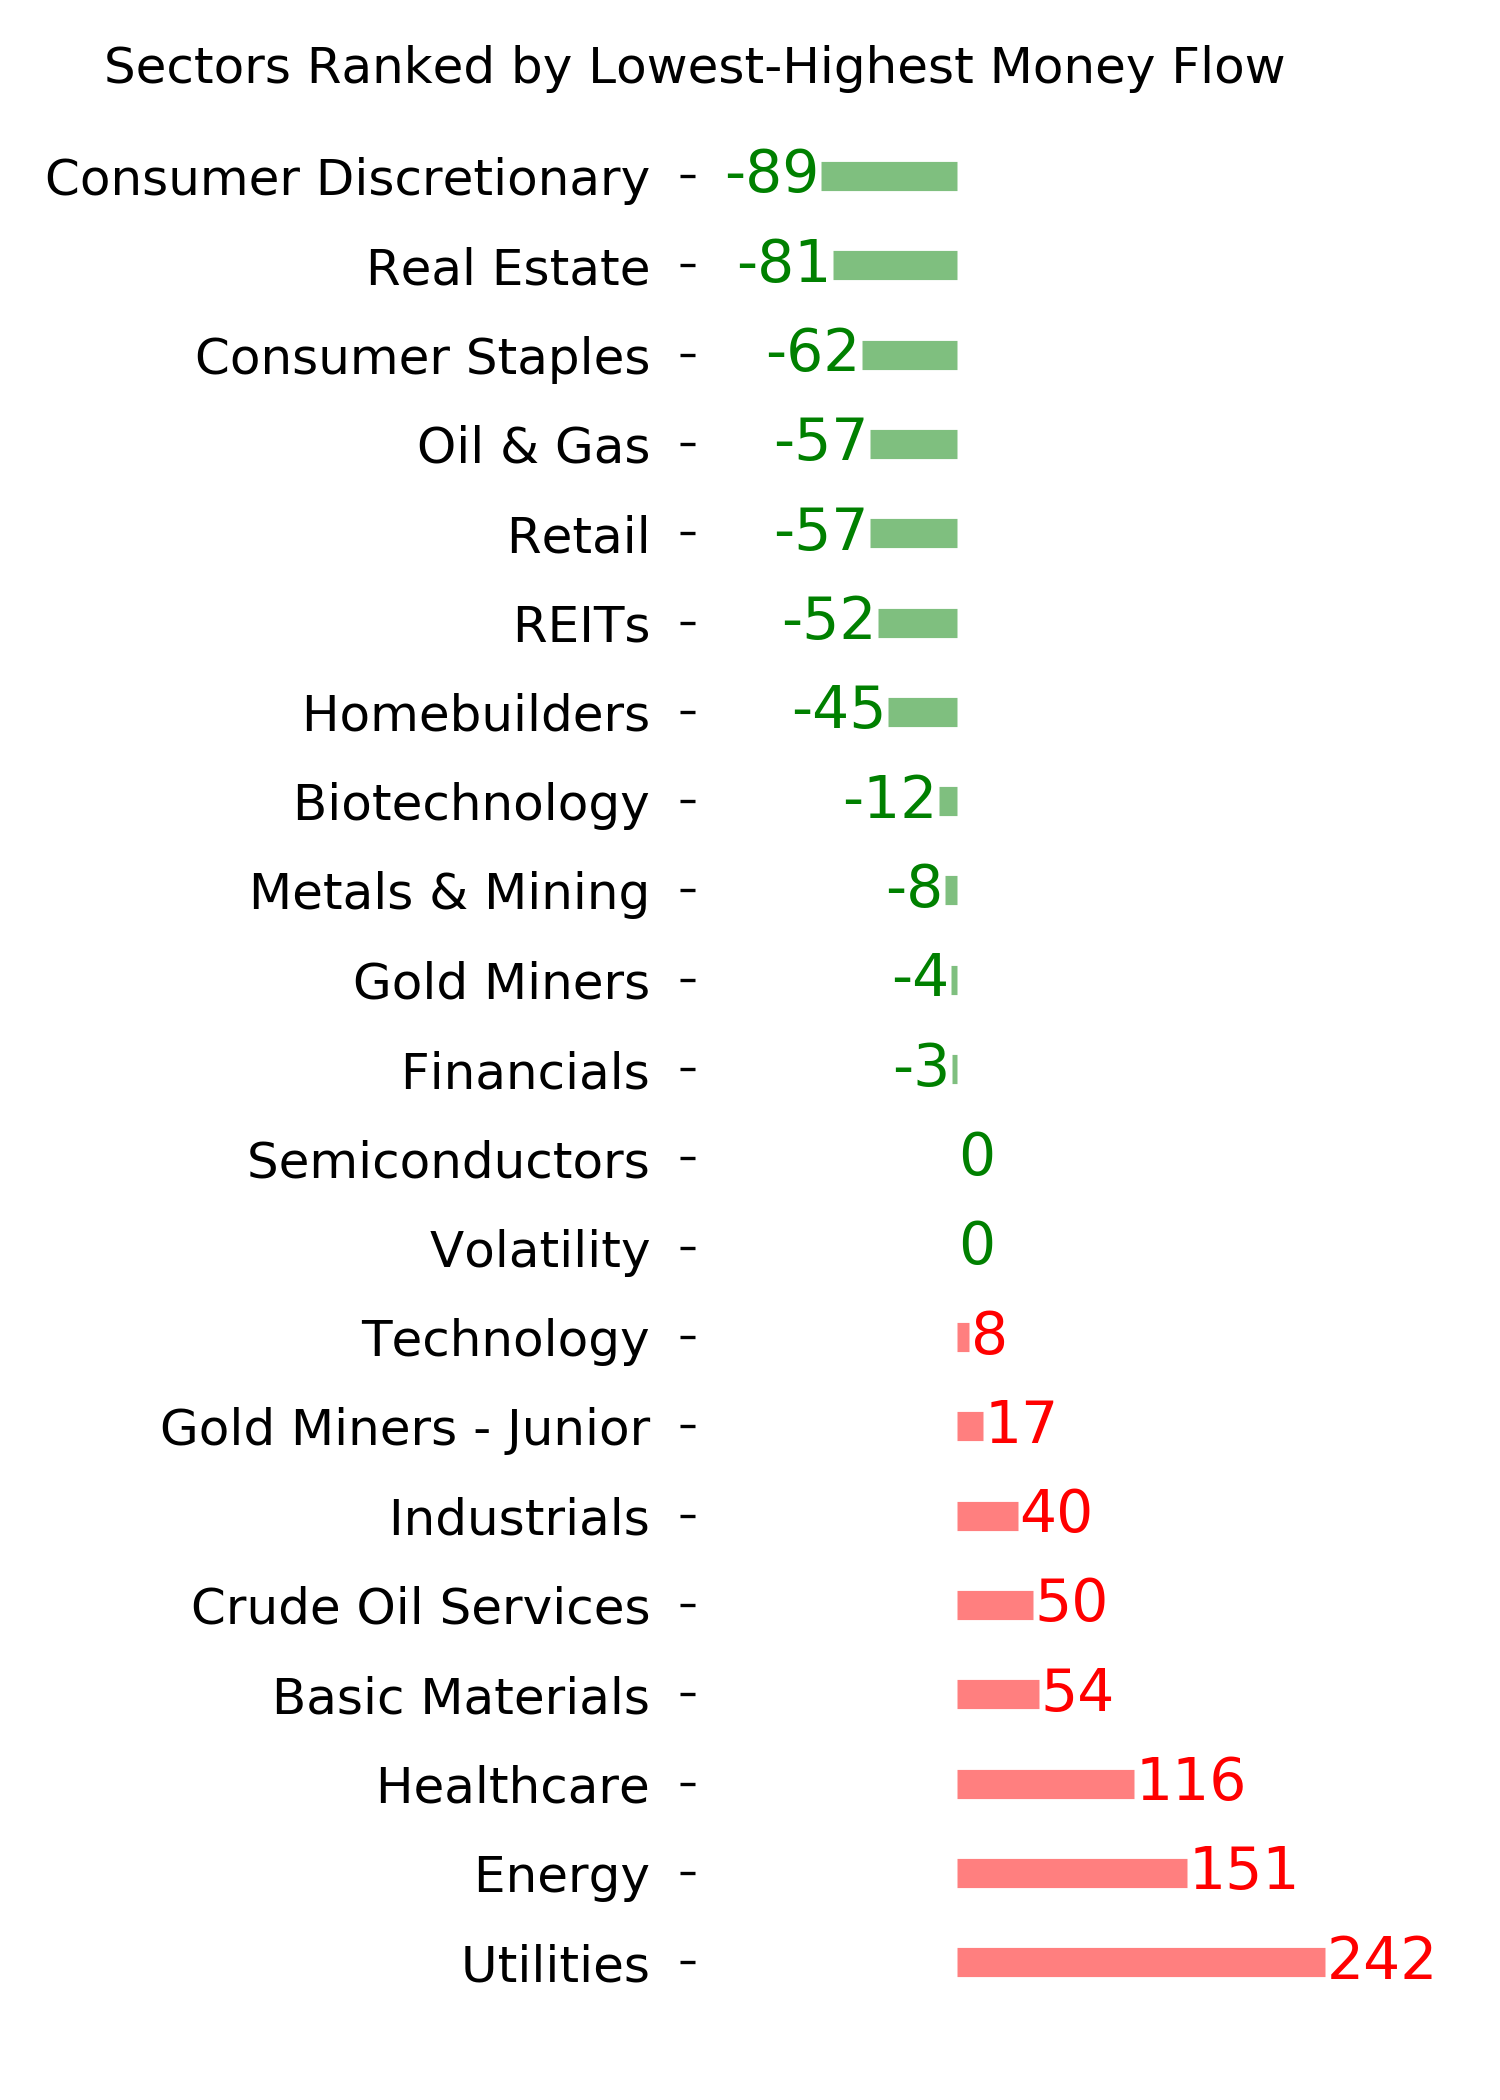
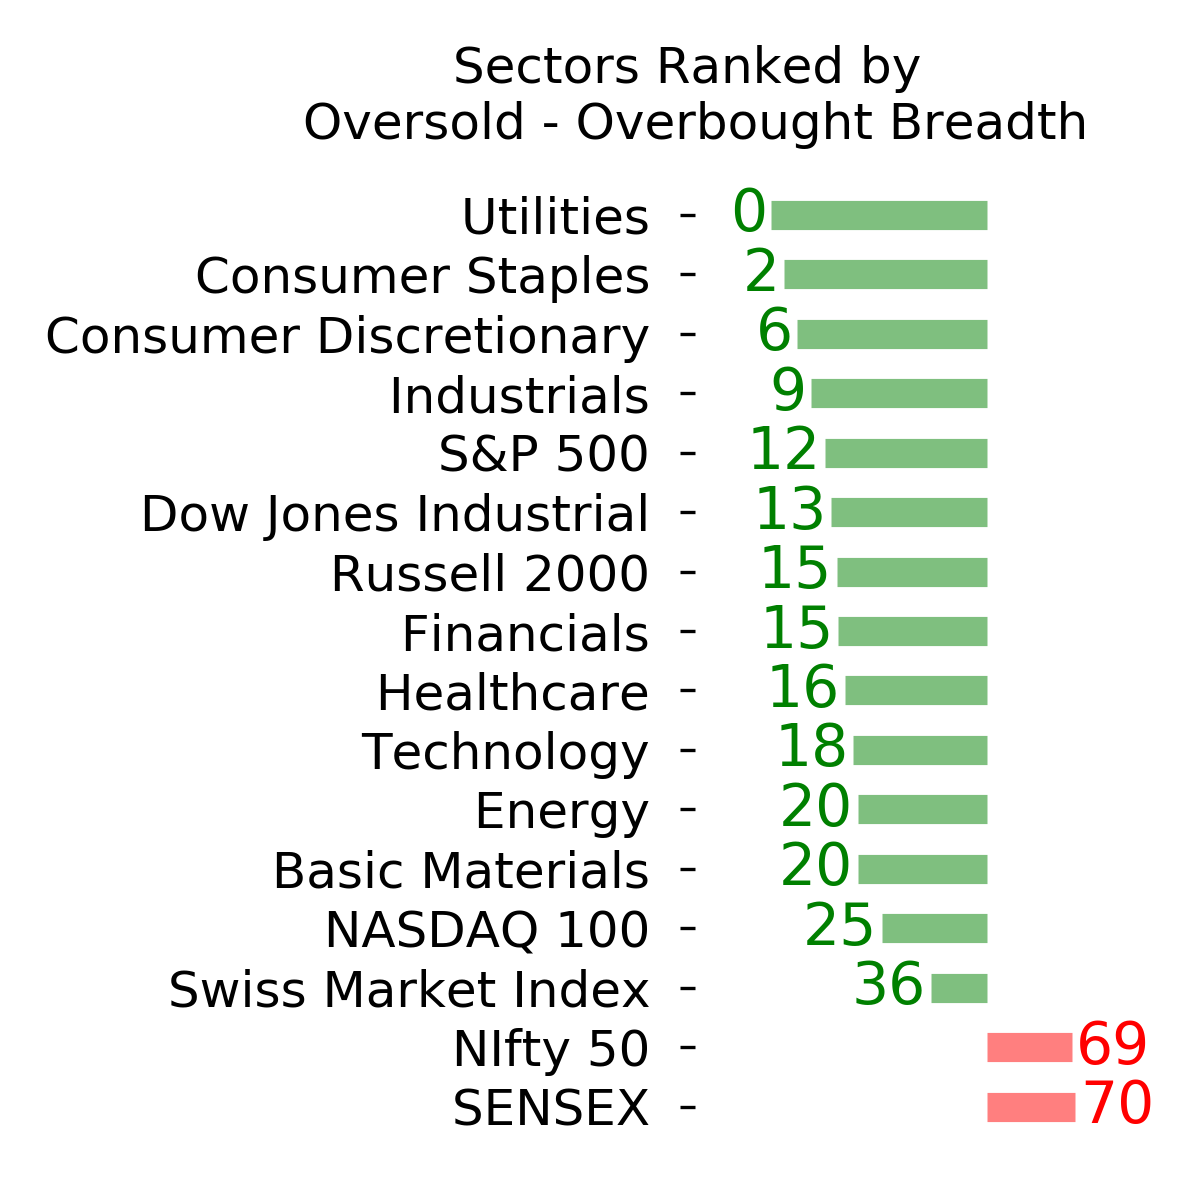
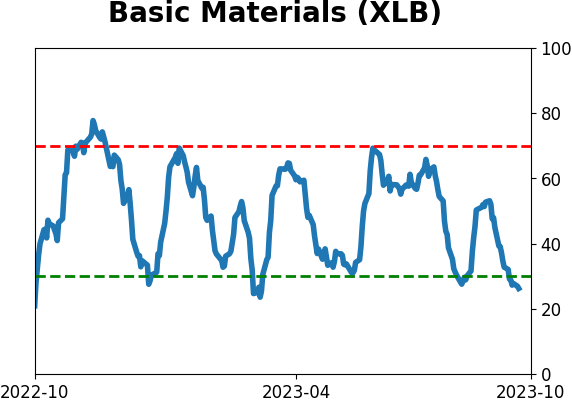
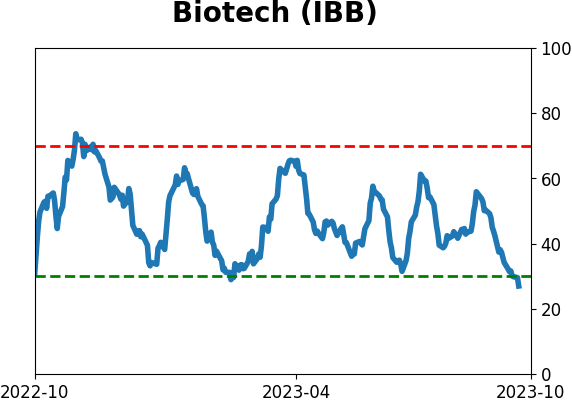
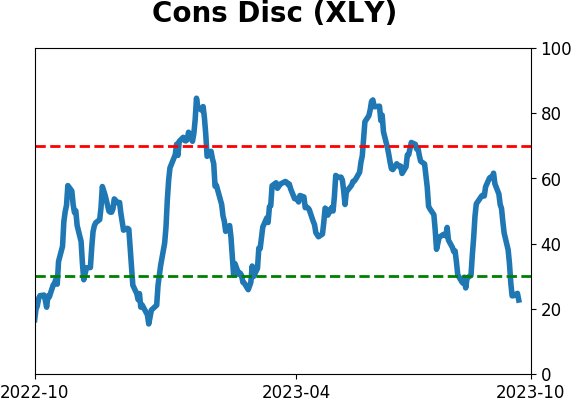
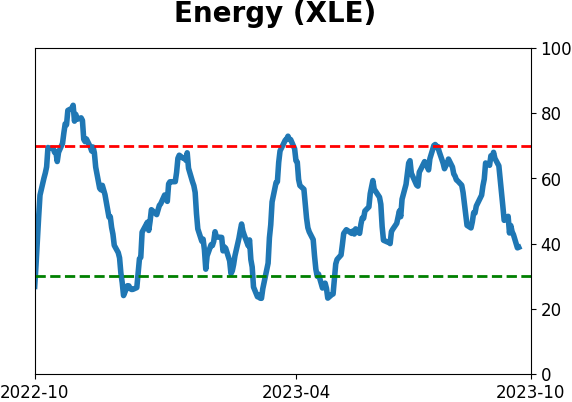
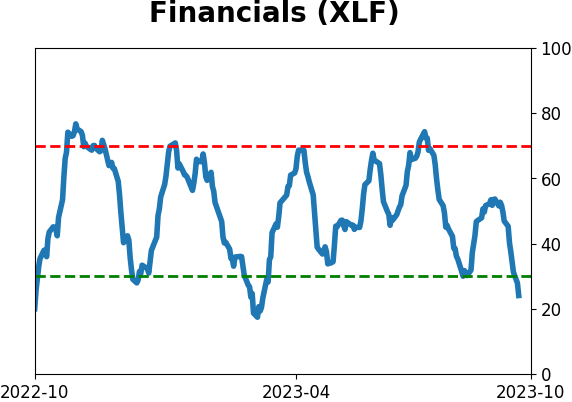
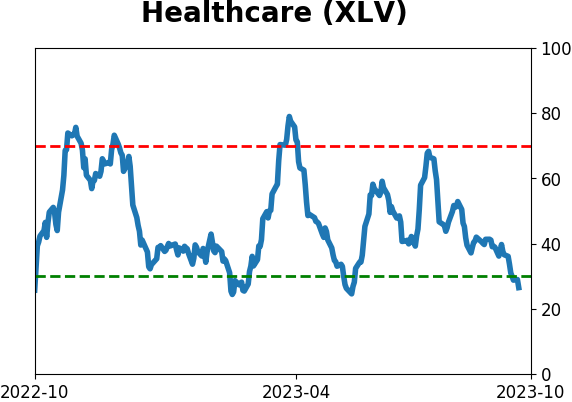
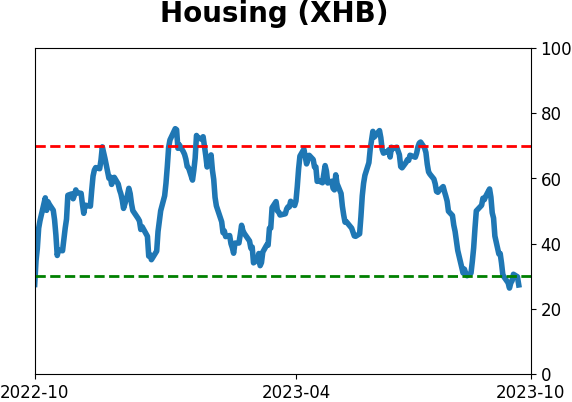
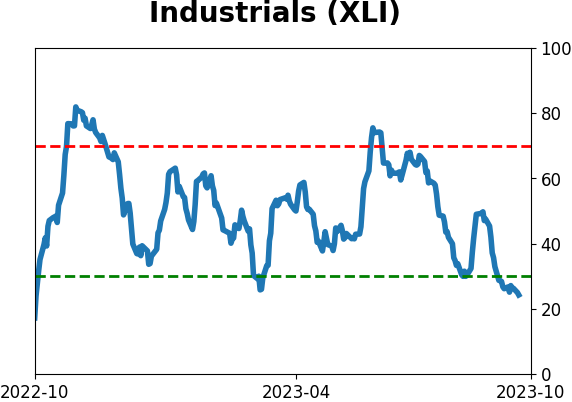
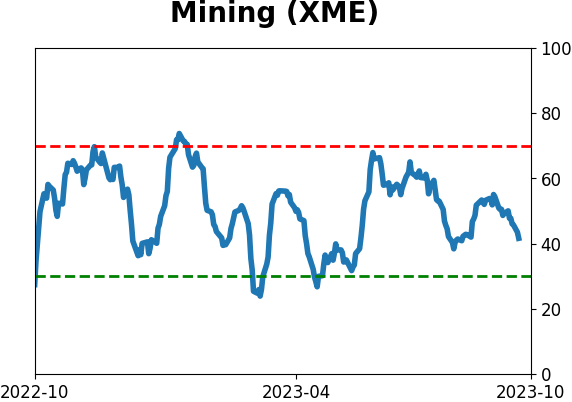
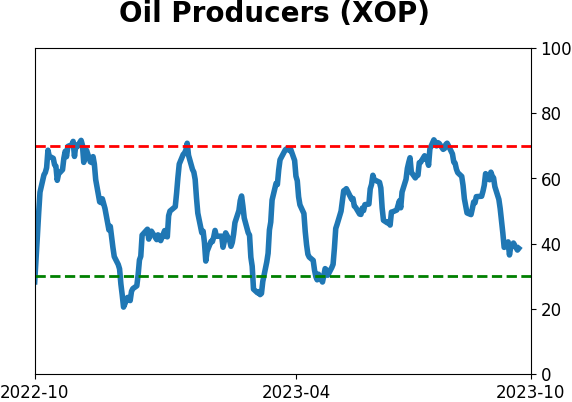
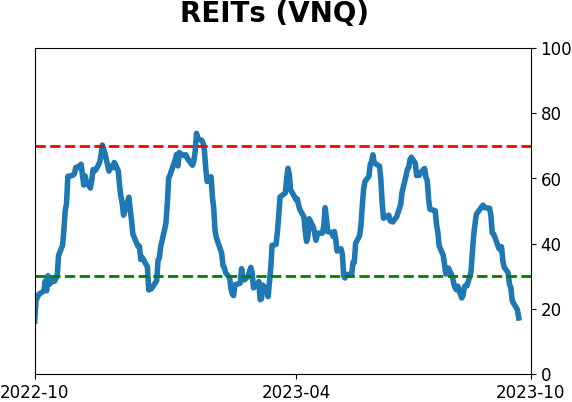
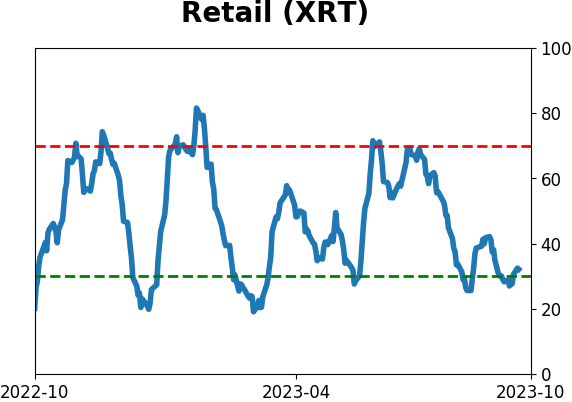
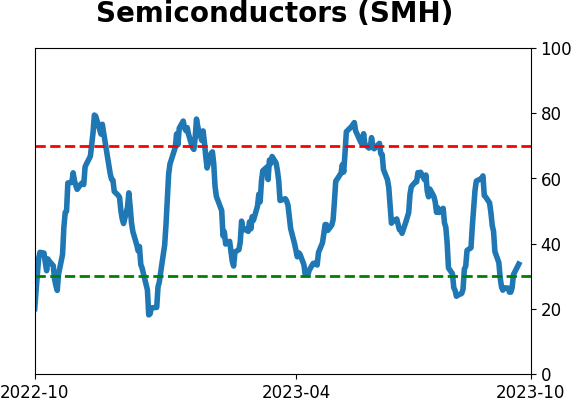
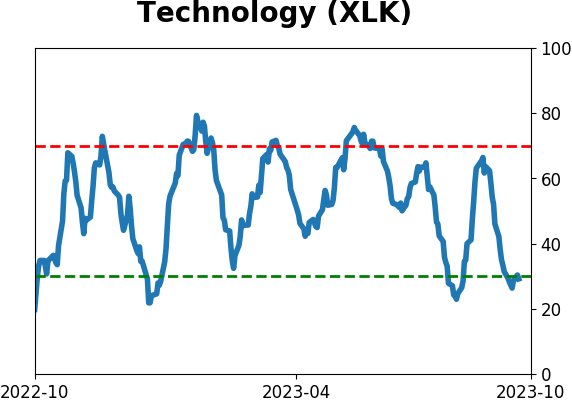
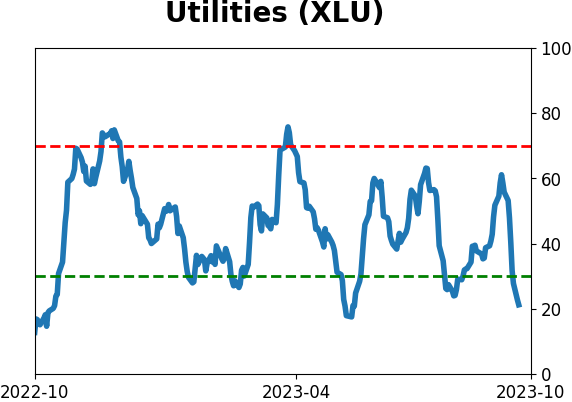
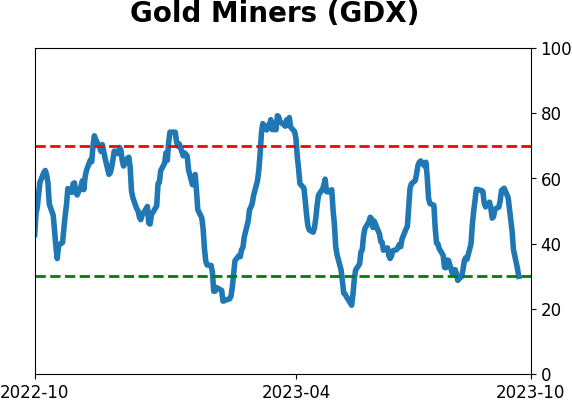
Sector ETF's - 10-Day Moving Average
|
|
|
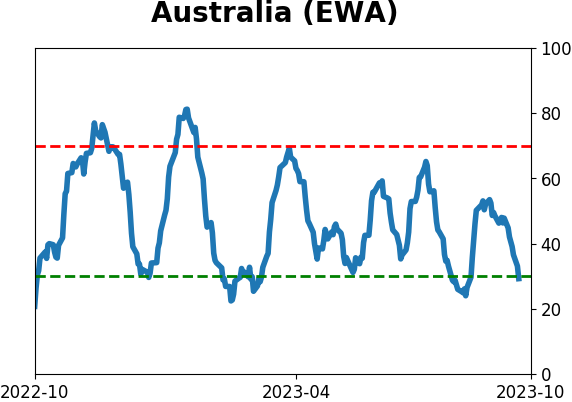
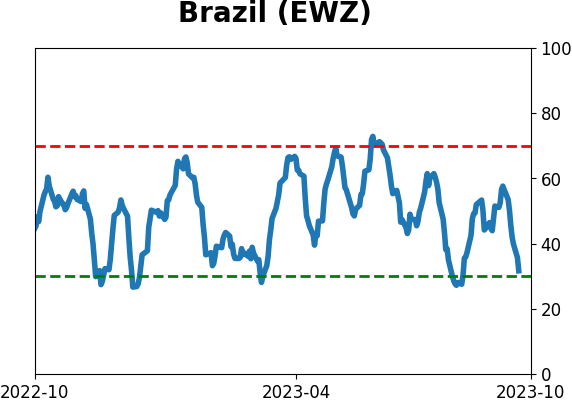
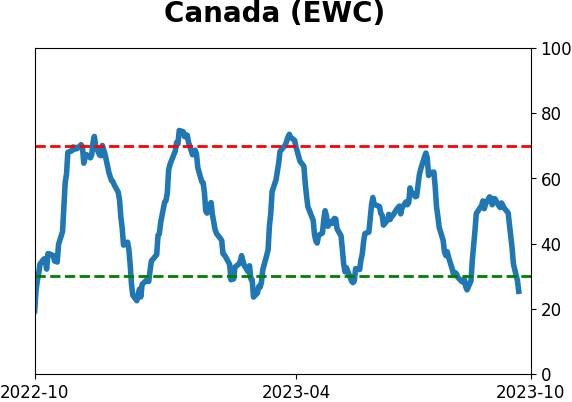
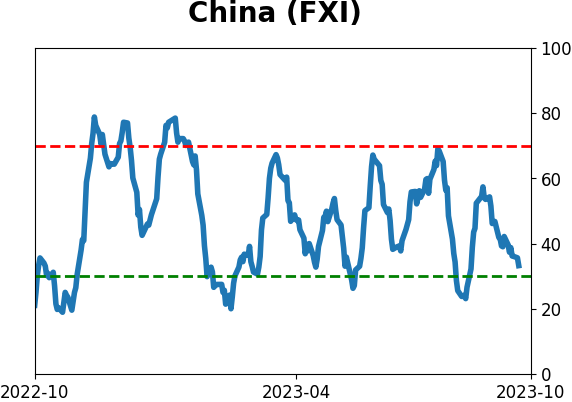
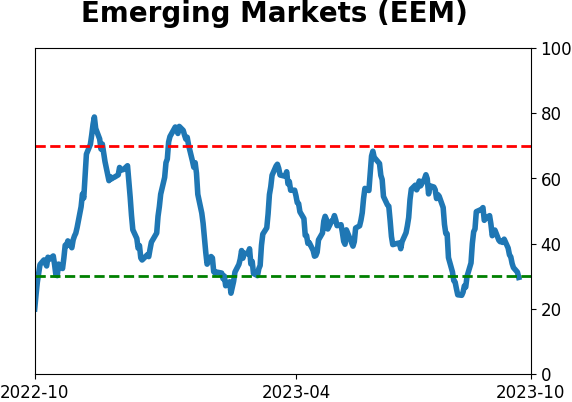
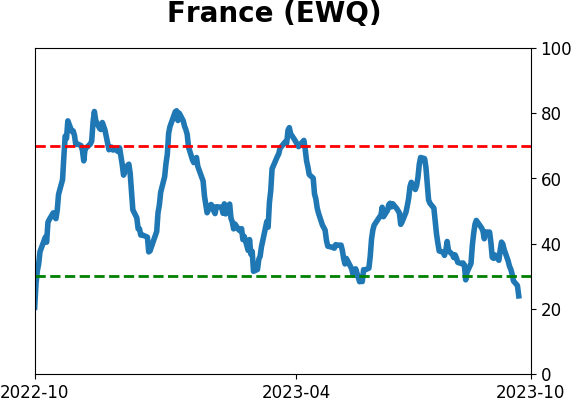
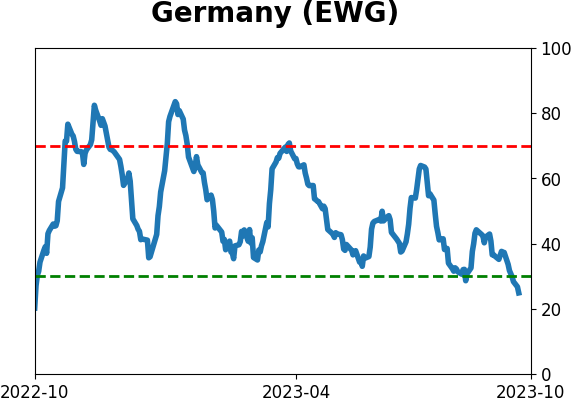
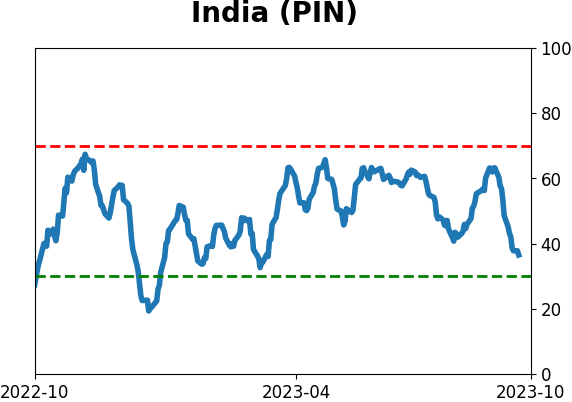
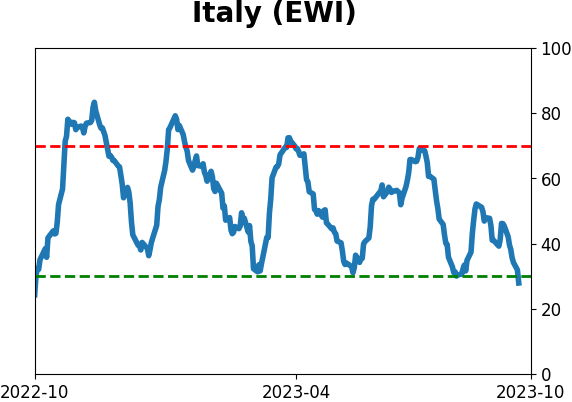
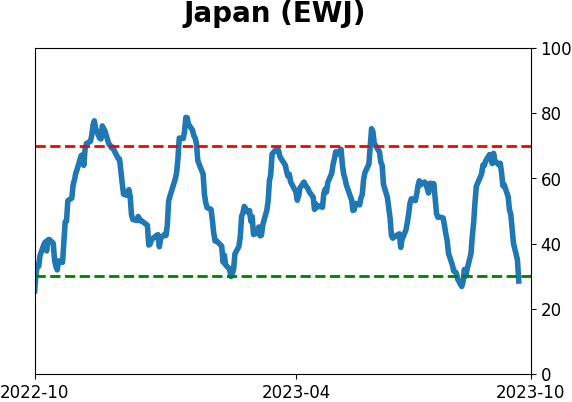
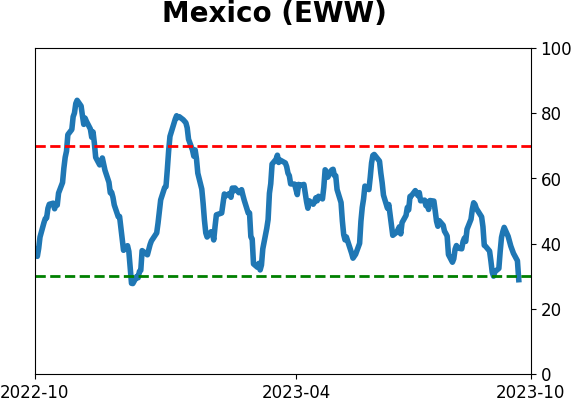
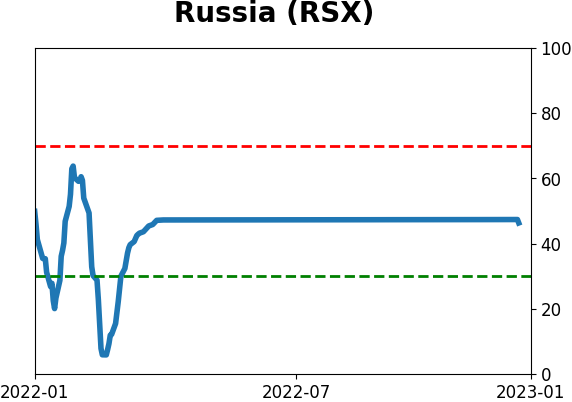
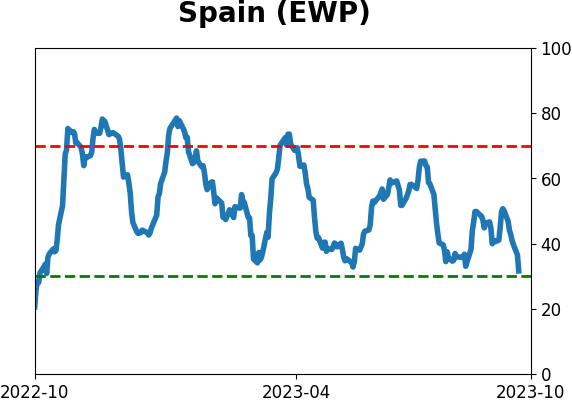
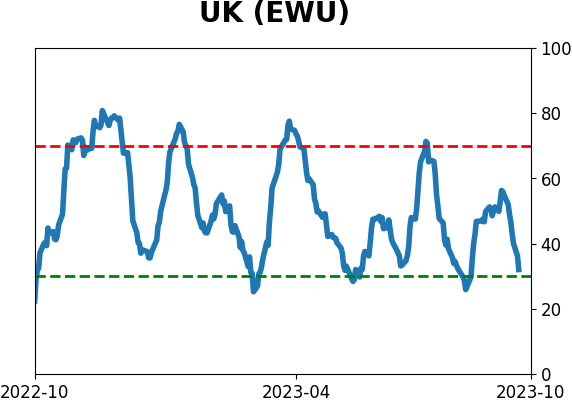
Country ETF's - 10-Day Moving Average
|
|
|
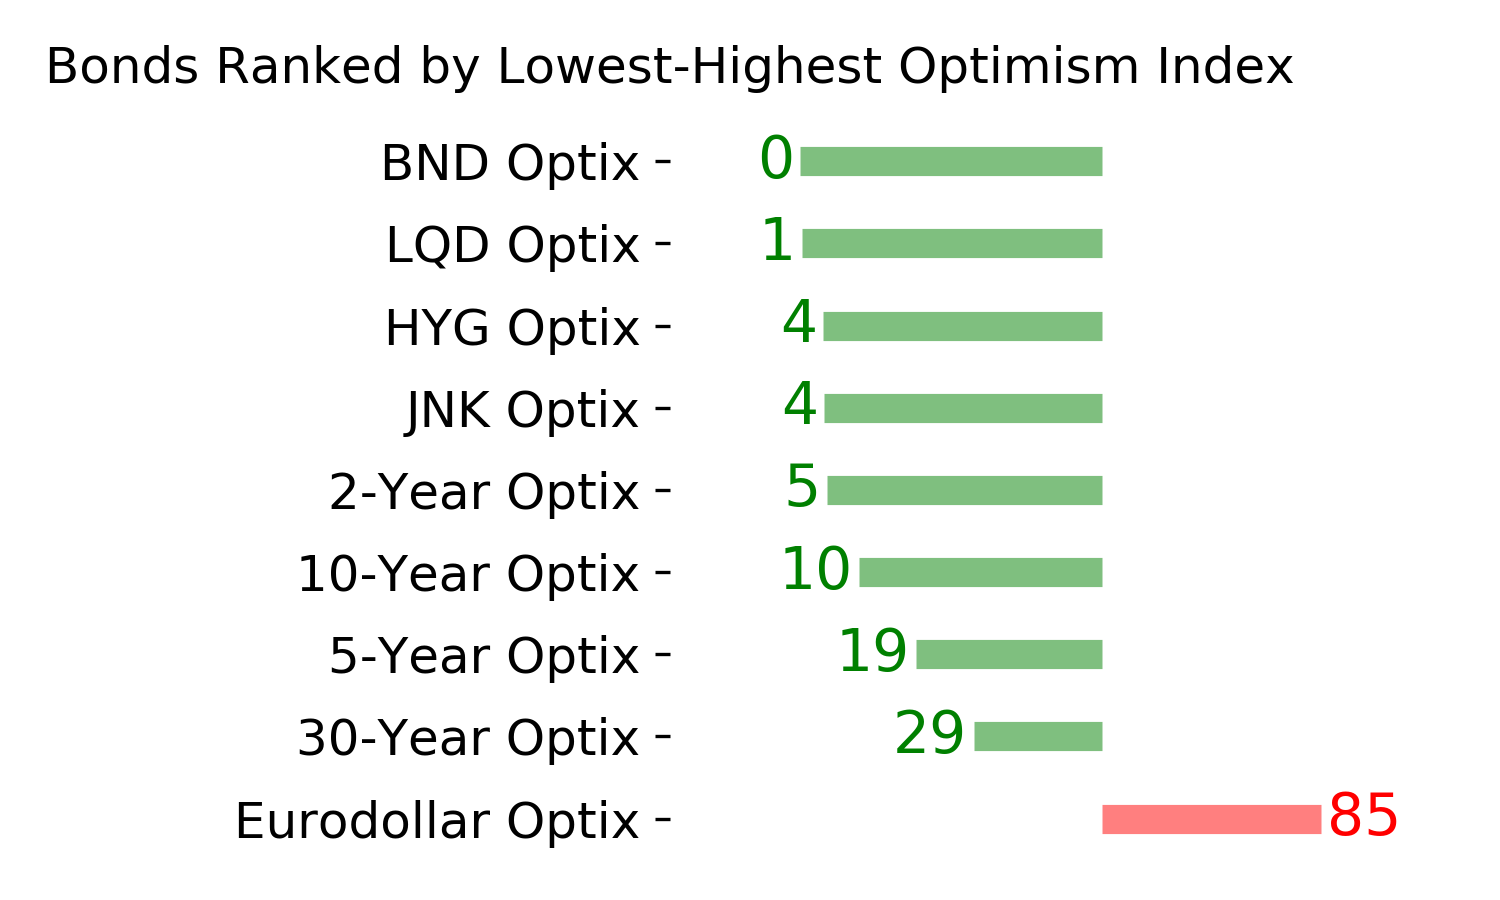
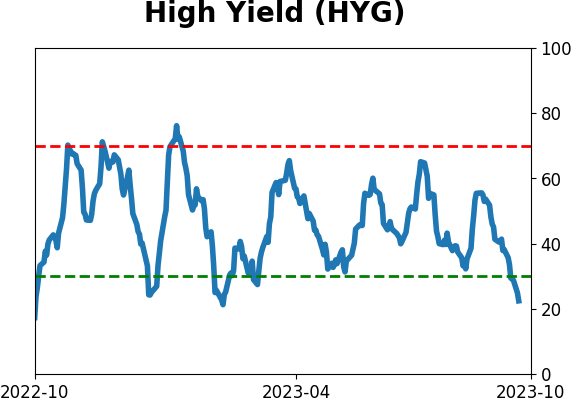
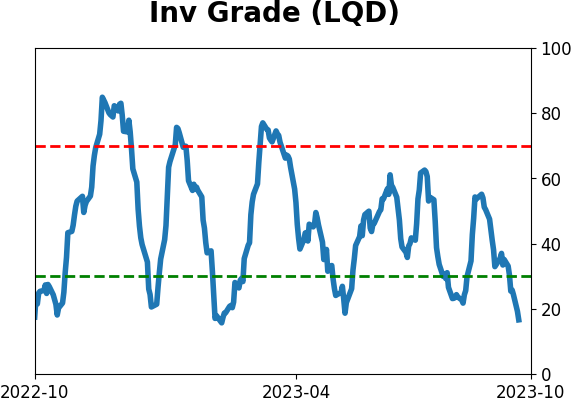
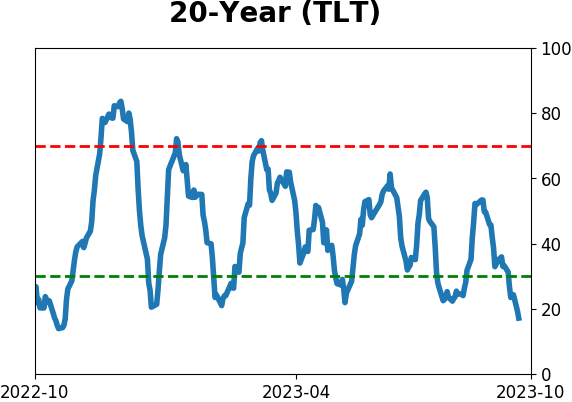
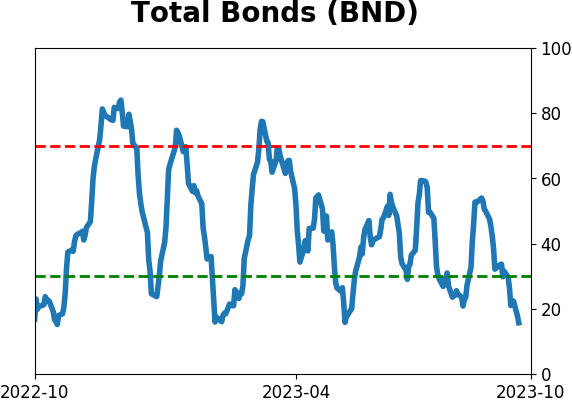
Bond ETF's - 10-Day Moving Average
|
|
|
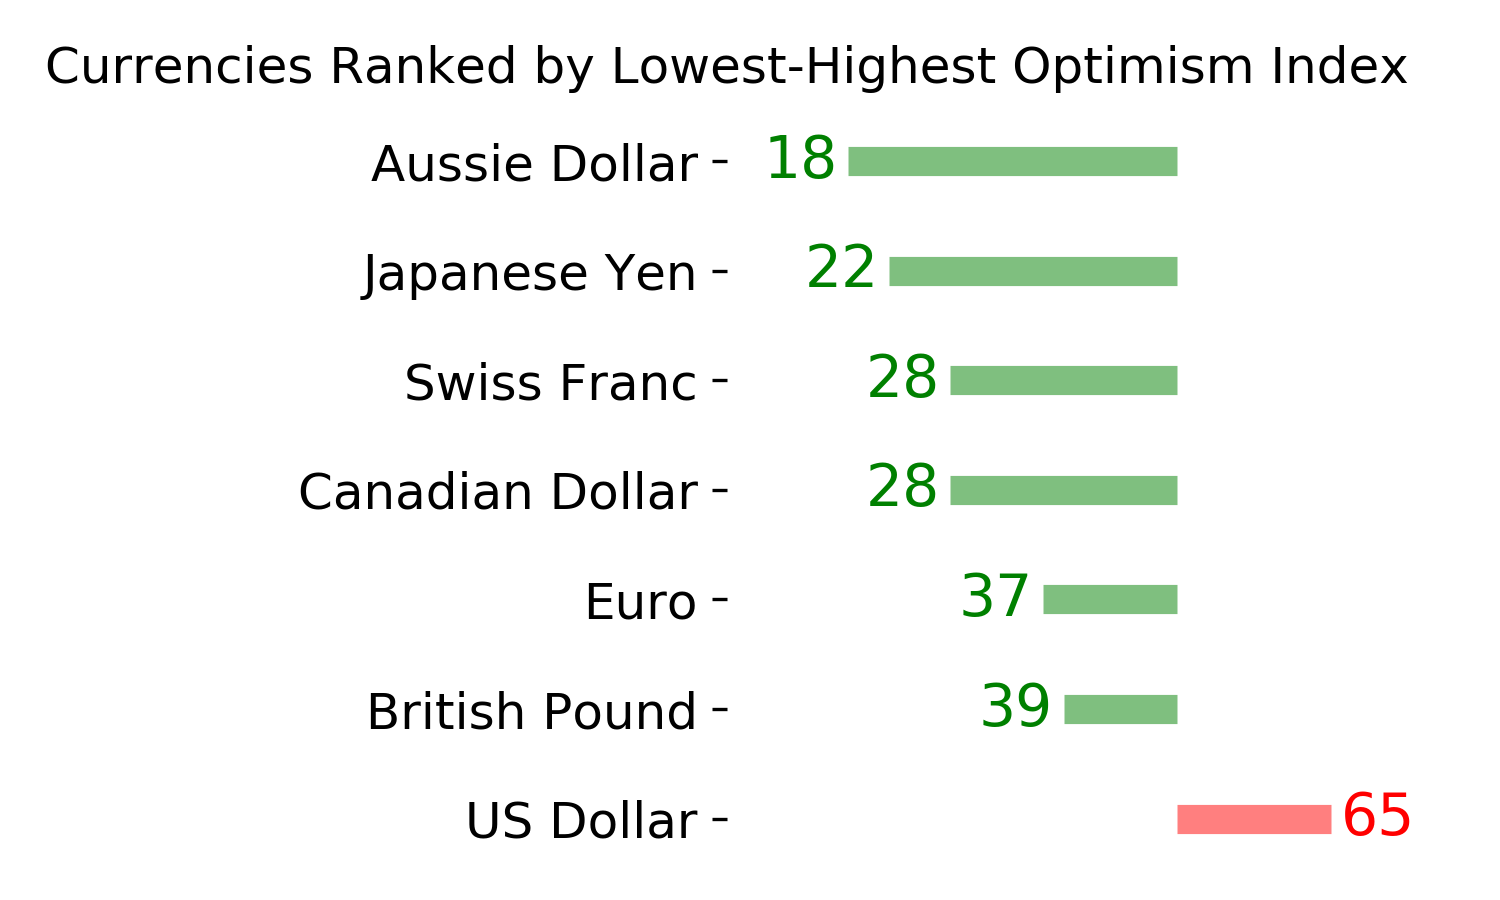
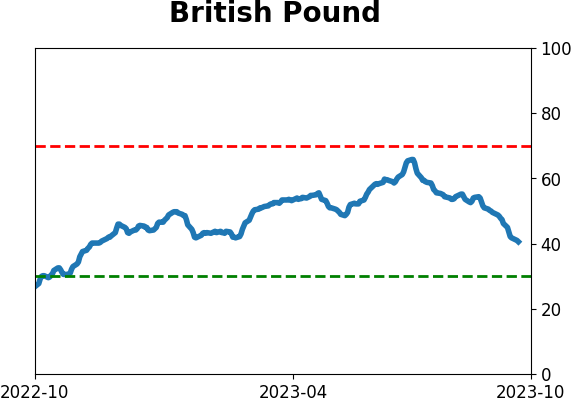
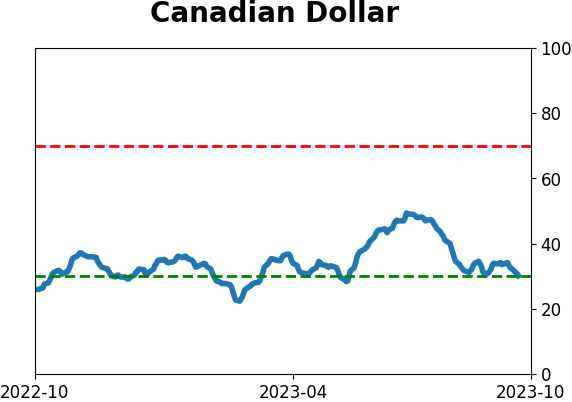
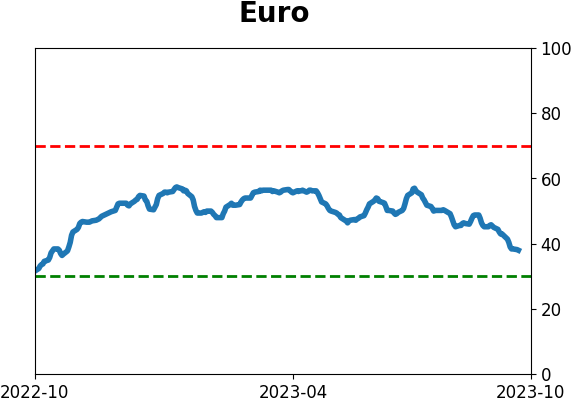
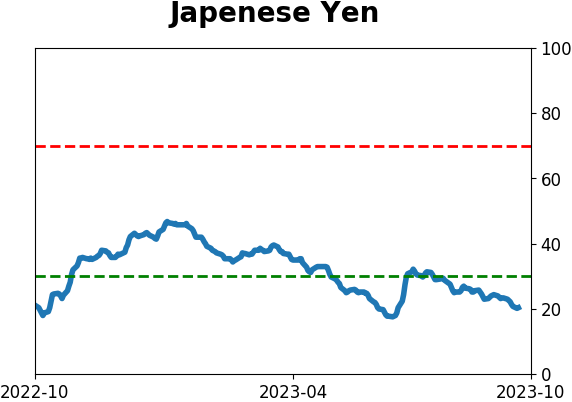
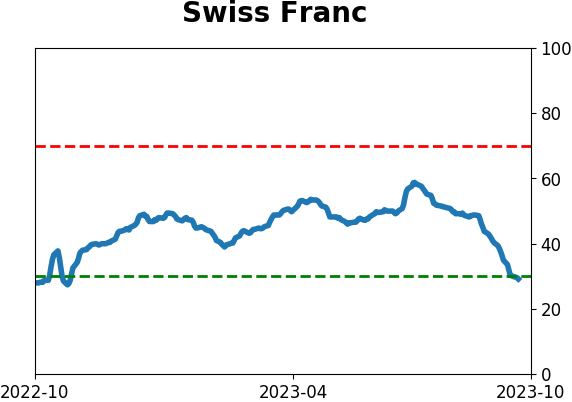
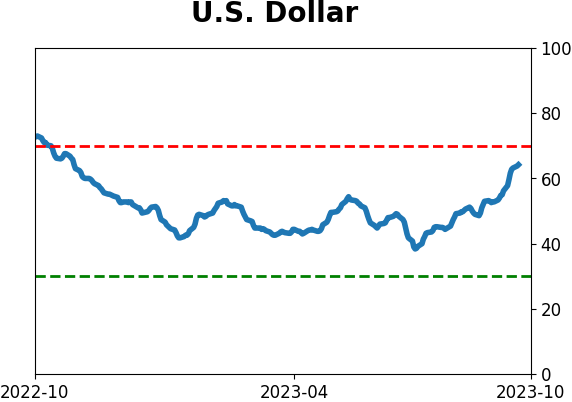
Currency ETF's - 5-Day Moving Average
|
|
|
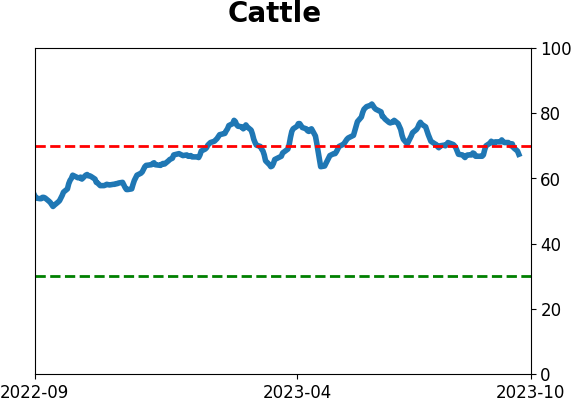
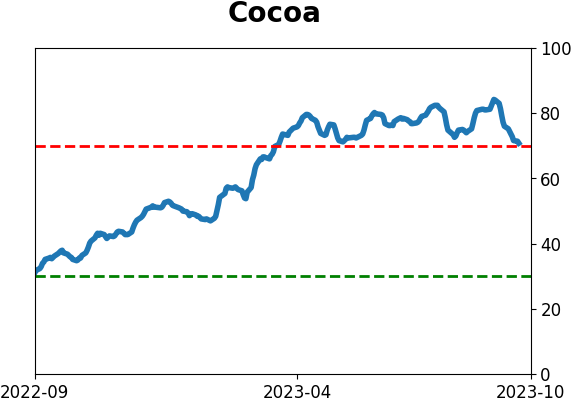
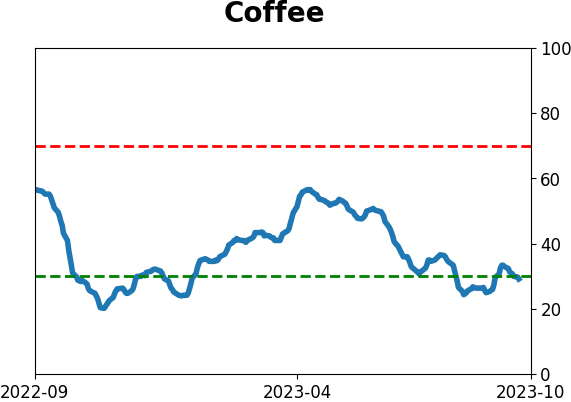
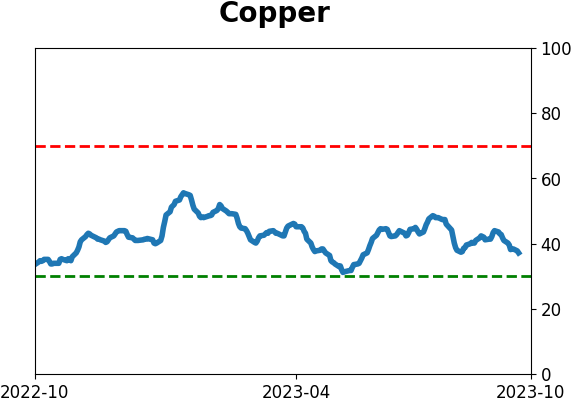
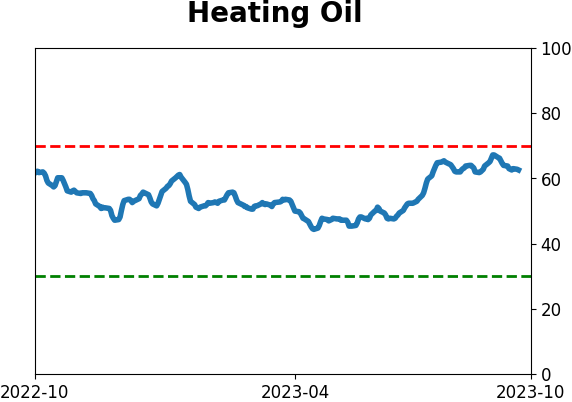
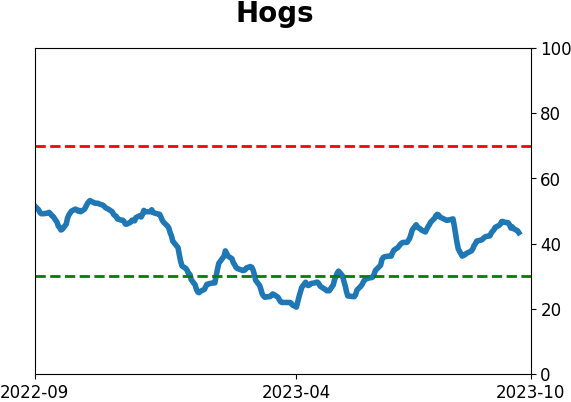
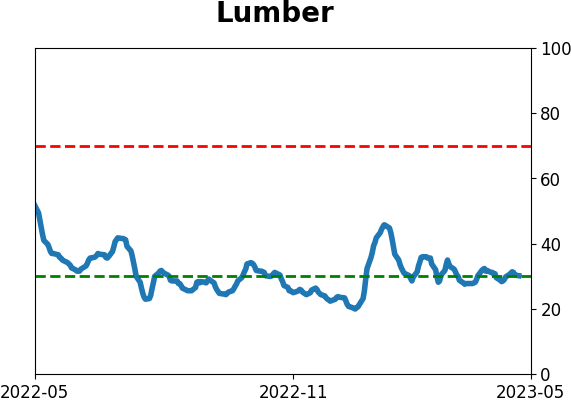
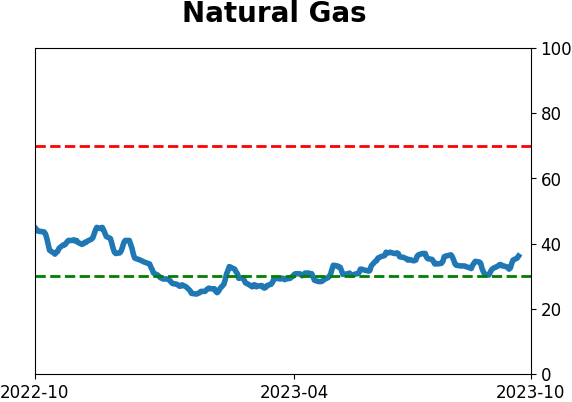
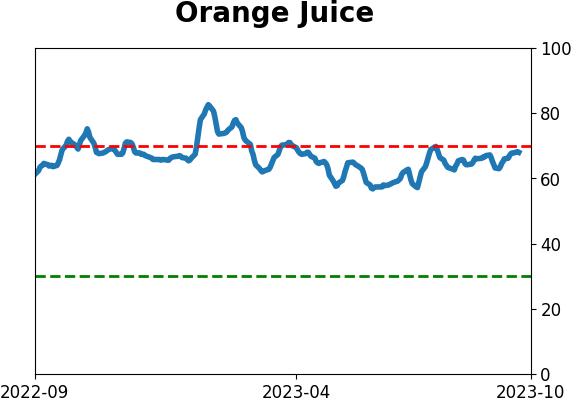
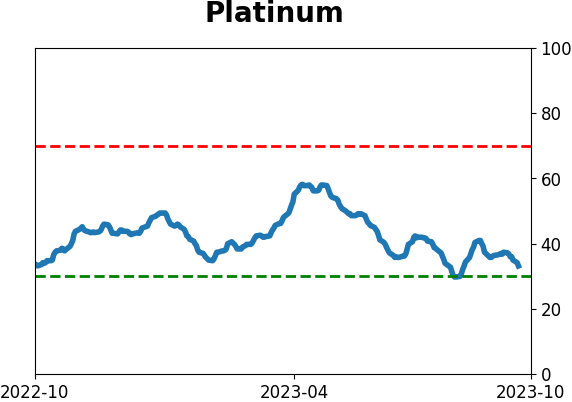
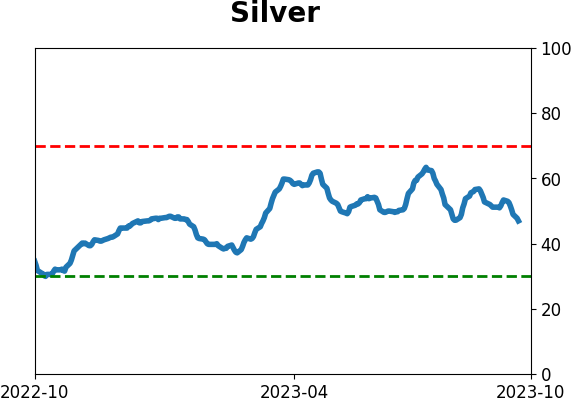
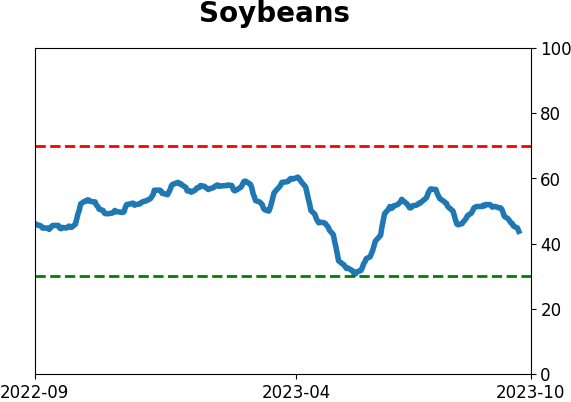
Commodity ETF's - 5-Day Moving Average
|
|