Headlines
|
|
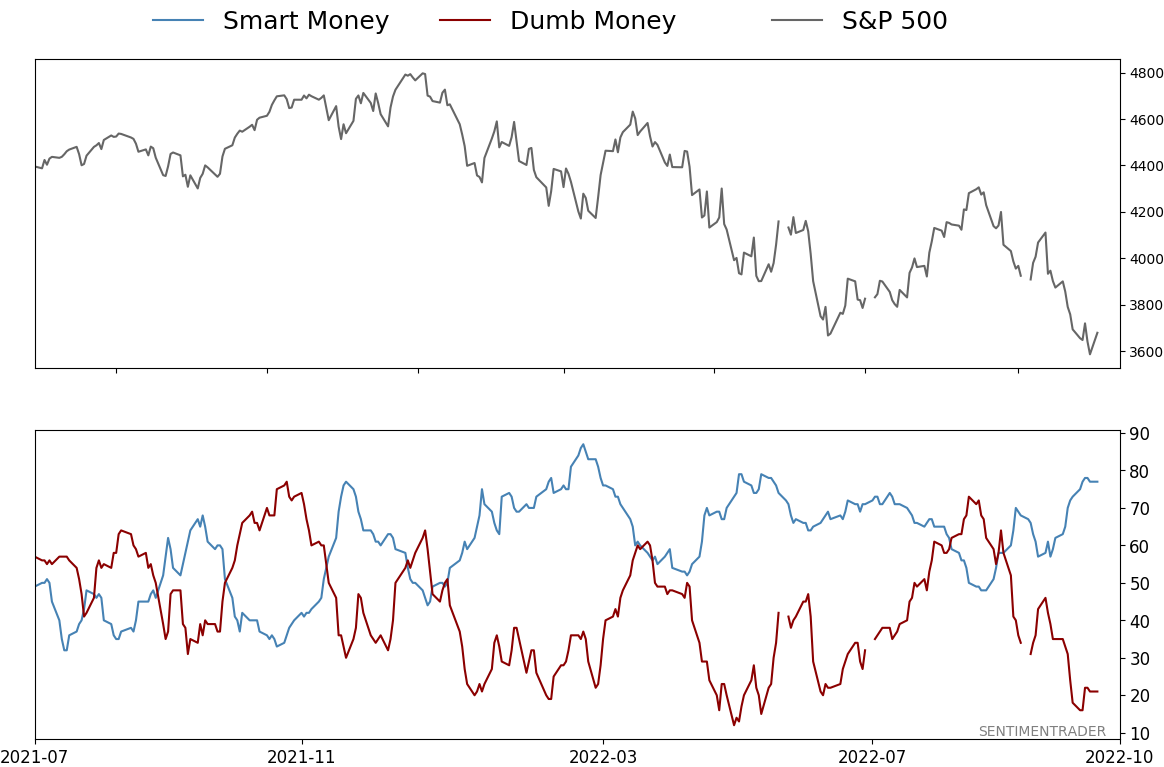
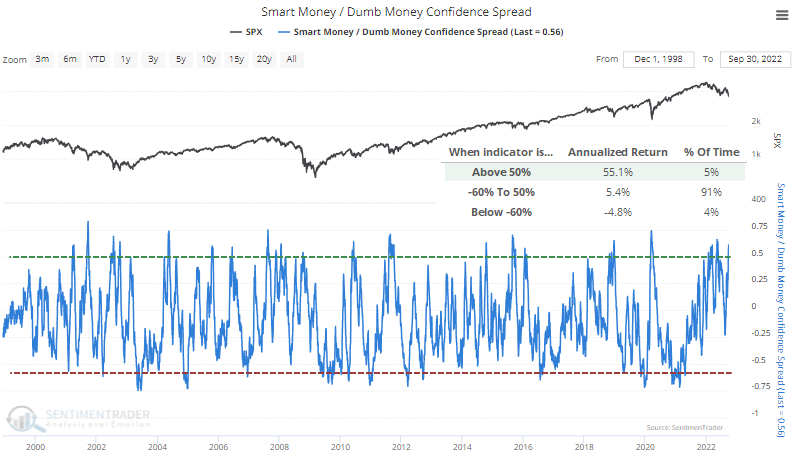
The spread between Smart and Dumb Money Confidence has blown out:
With heavy losses over the past few weeks, investors have given up. Dumb Money Confidence plunged to some of the lowest levels in 24 years. At the same time, Smart Money Confidence has spiked, so the spread between them is extreme. Forward returns in the S&P 500 have been excellent after similar sentiment readings.
|
Smart / Dumb Money Confidence
|
Smart Money Confidence: 77%
Dumb Money Confidence: 21%
|
|
Risk Levels
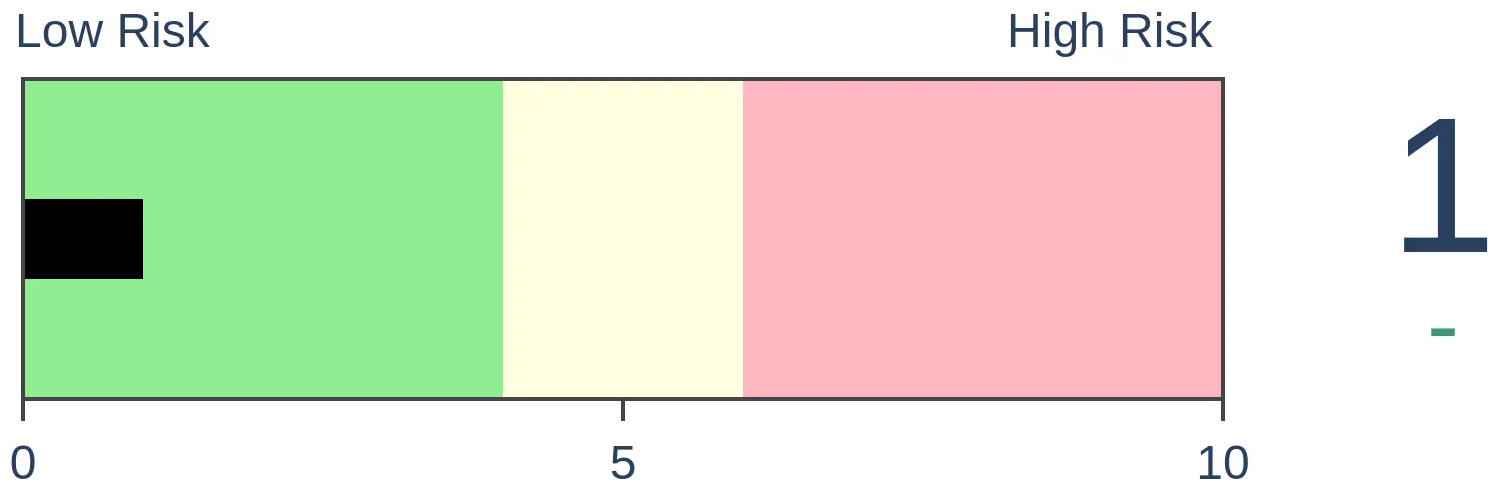
Stocks Short-Term
|
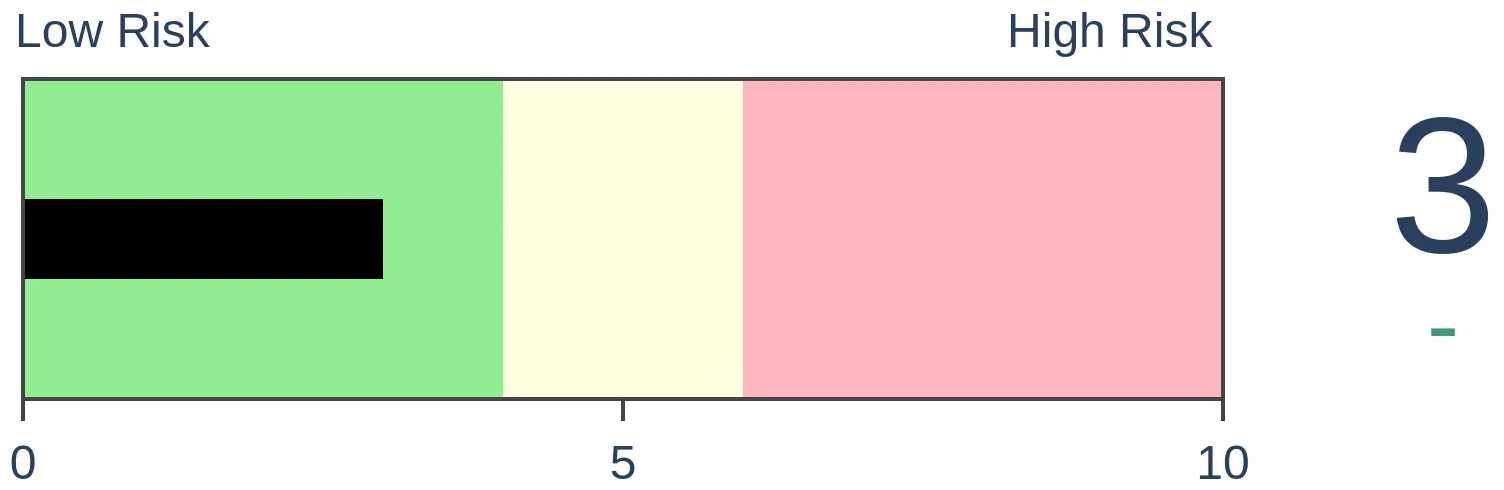
Stocks Medium-Term
|
|
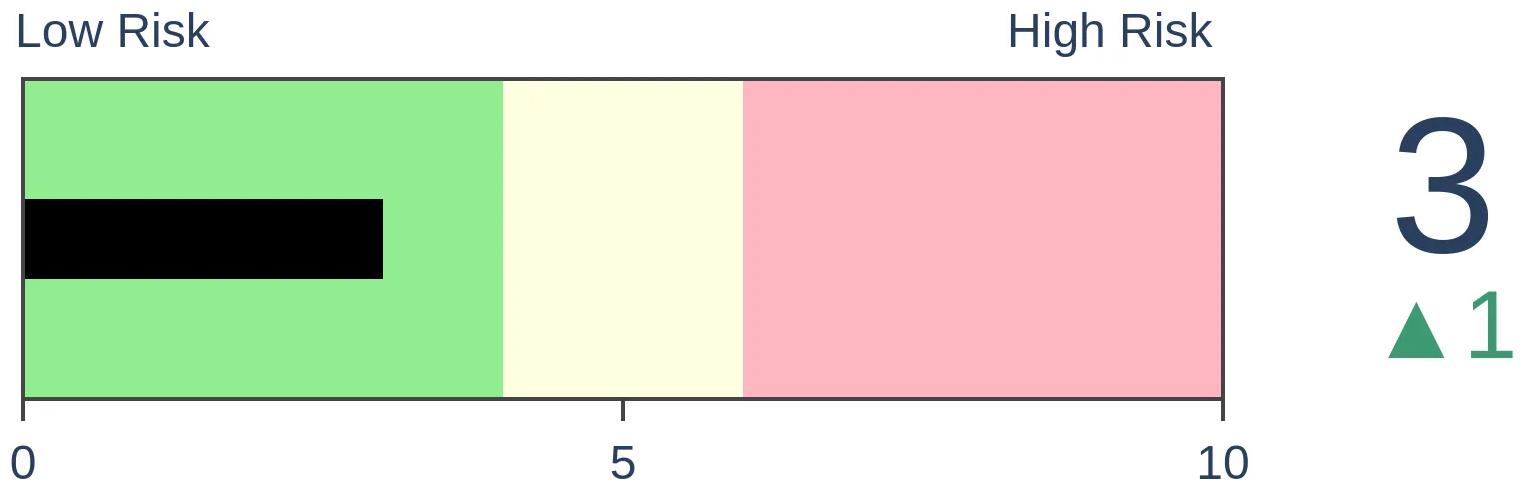
Bonds
|
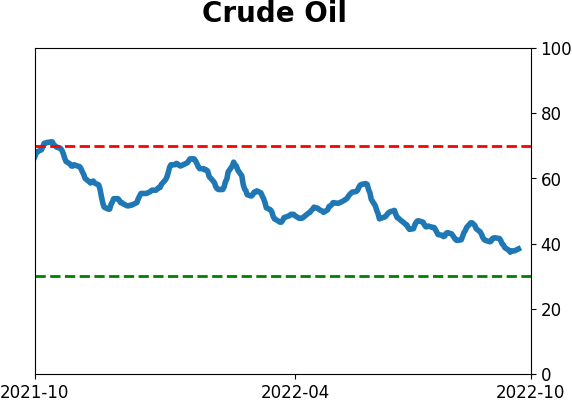
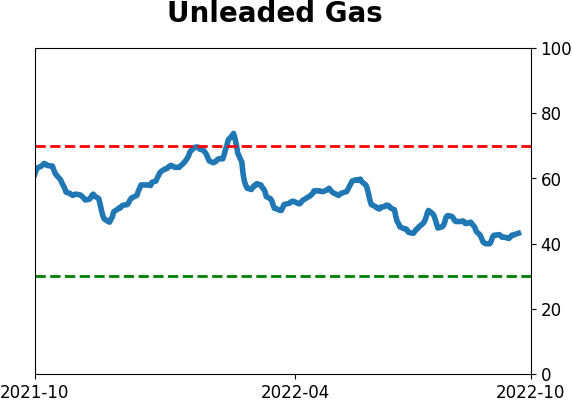
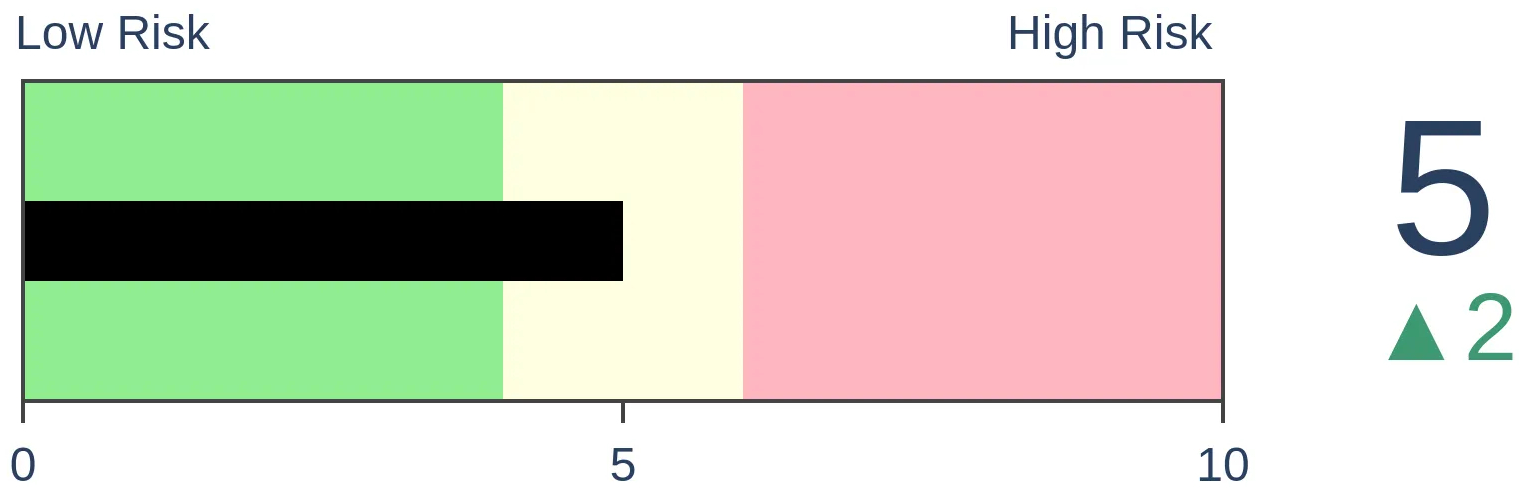
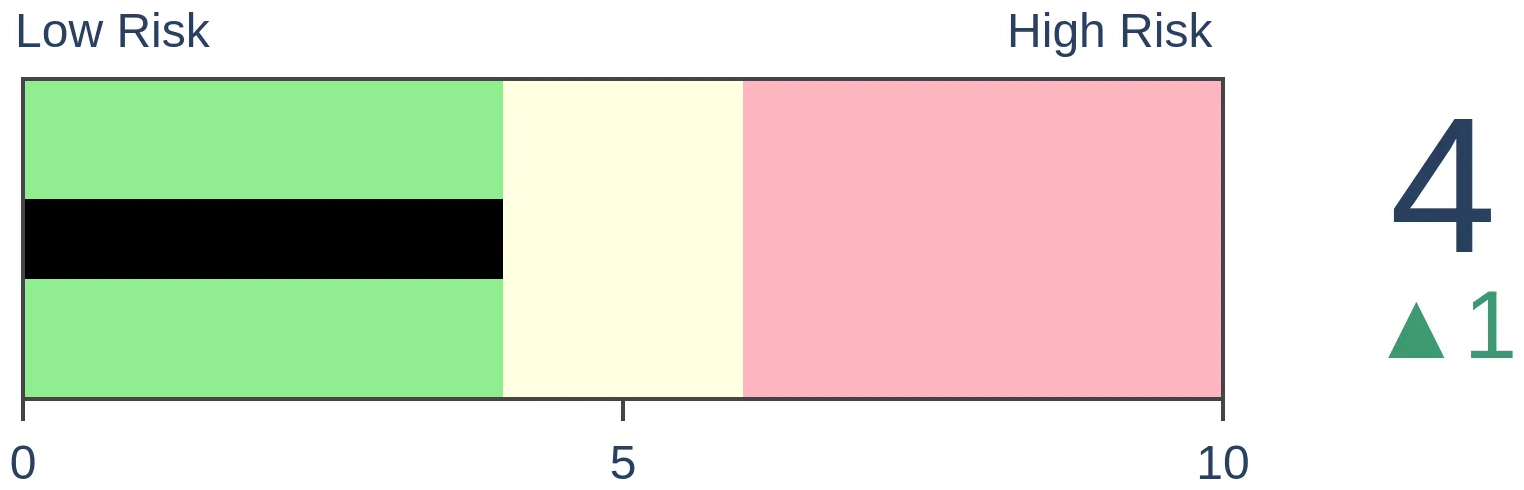
Crude Oil
|
|
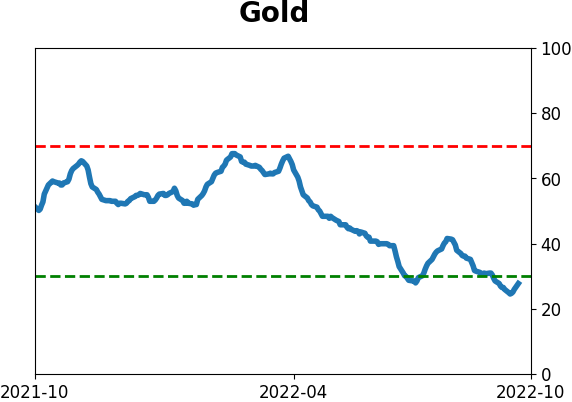
Gold
|
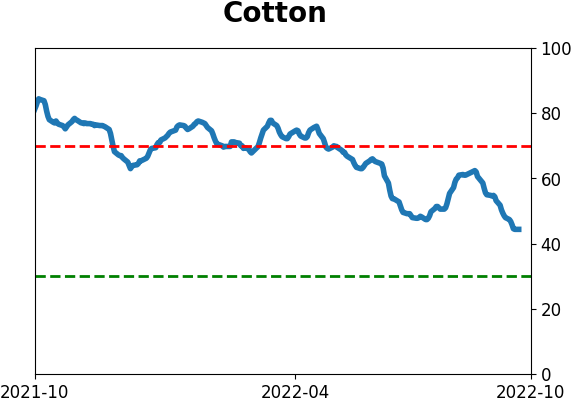
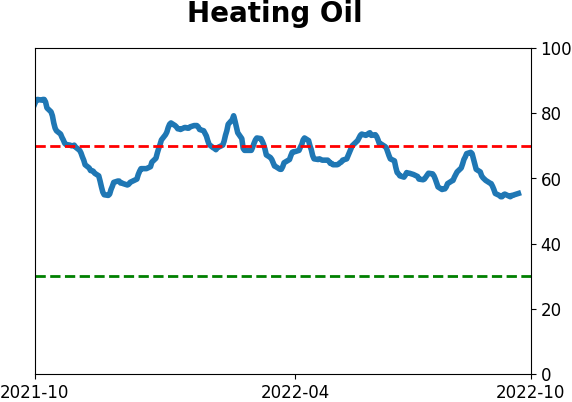
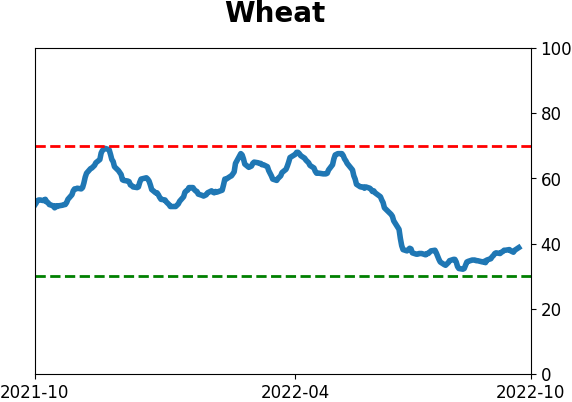
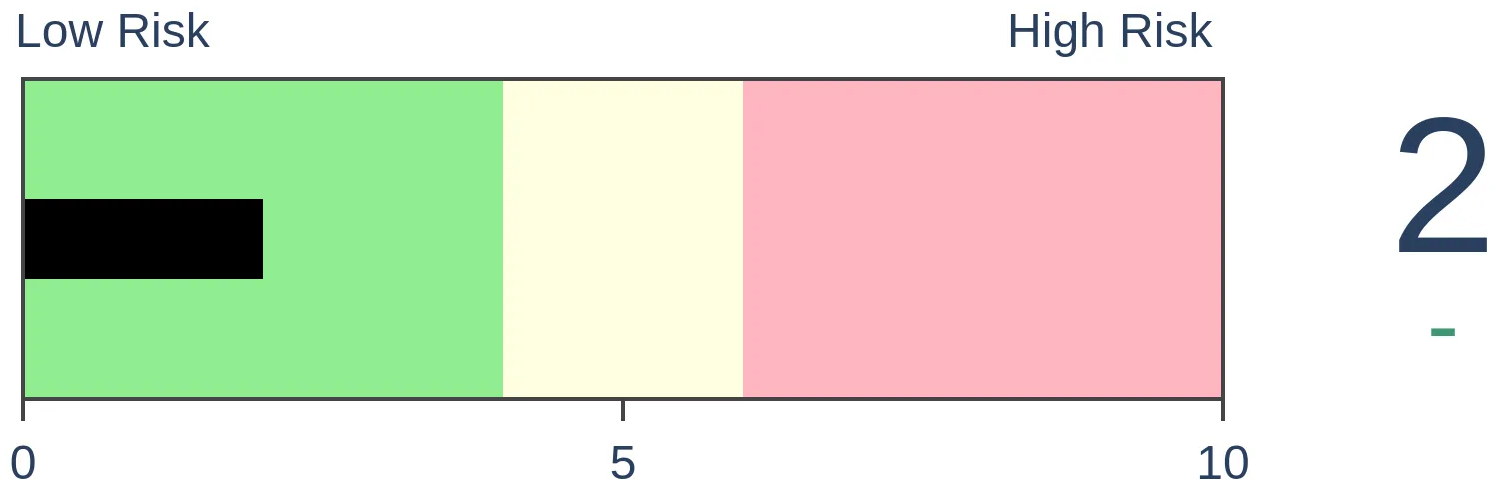
Agriculture
|
|
Research
By Jason Goepfert
BOTTOM LINE
With heavy losses over the past few weeks, investors have given up. Dumb Money Confidence plunged to some of the lowest levels in 24 years. At the same time, Smart Money Confidence has spiked, so the spread between them is extreme. Forward returns in the S&P 500 have been excellent after similar sentiment readings.
FORECAST / TIMEFRAME
SPY -- Up, Medium-Term
|
Key points:
- The spread between Smart and Dumb Money Confidence has been at an extreme for over a week
- Whenever the spread has been this high, the S&P 500's annualized return has been excellent
- When the spread was extended for a week or more, the index always saw gains over the next 2-3 months
Investors once again sour on risk assets
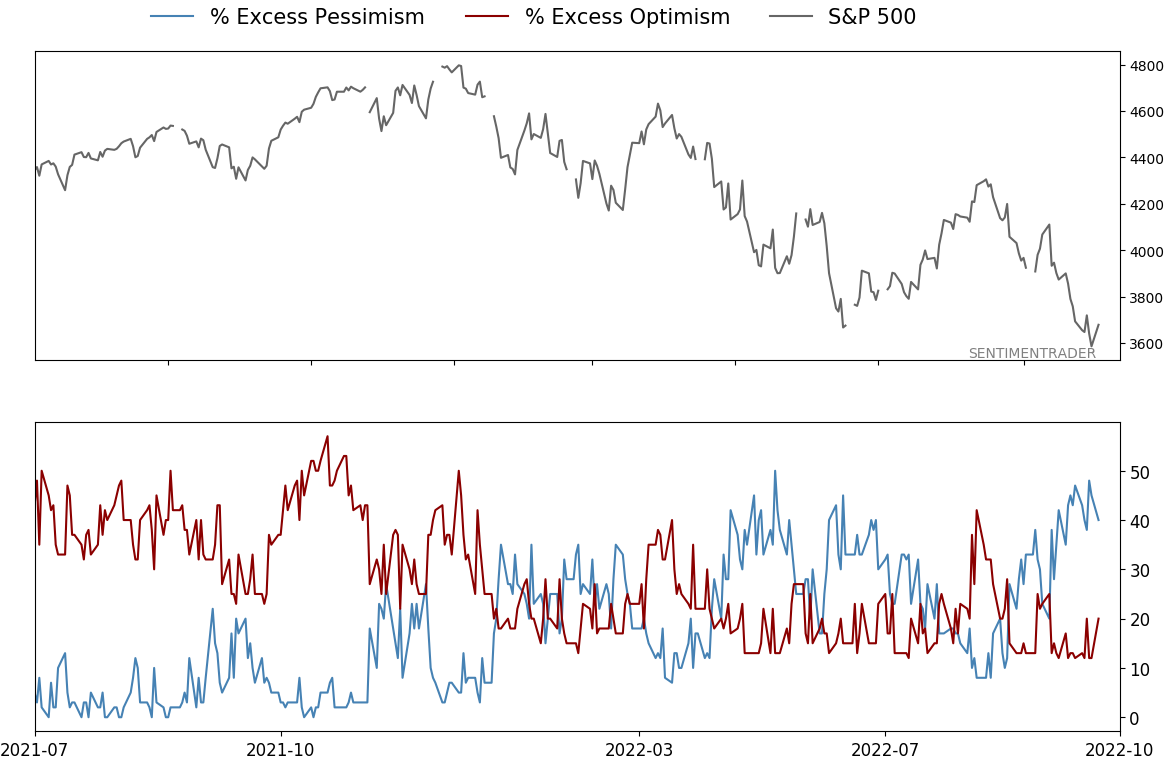
With a continued plunge in assets and high correlation among pretty much everything, retail investors have given up again. Dumb Money Confidence in a future rally has plunged anew, hanging around 20% during the past week. That's among the lowest levels since we began computing this in late 1998.
Smart Money Confidence often rises while Dumb Money declines, which has been the case this time, too. Thanks in part to high levels of corporate insider buying activity, this model has climbed to near 80%.
The spread between the Confidence indexes has therefore widened to another extreme, holding above 55%. The S&P 500's annualized return went the spread was above that threshold has been +55.1%.
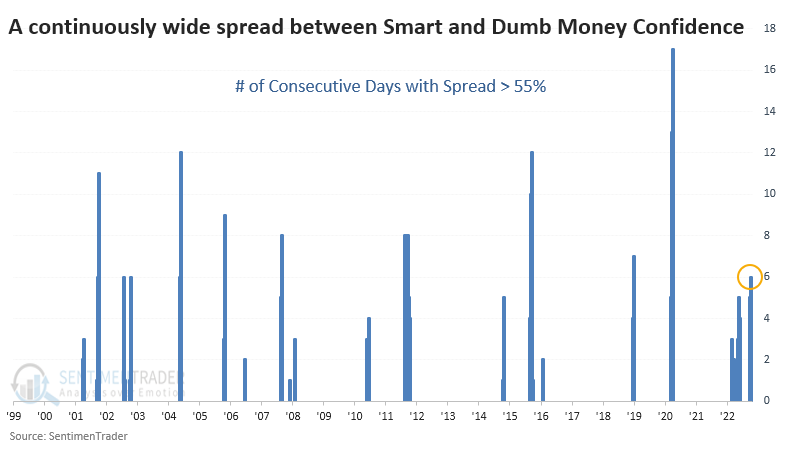
Another notable aspect of the models is that the spread has not only popped above 55%, it has held at that level or above for six consecutive sessions. We haven't seen that too many times over the past 24 years.
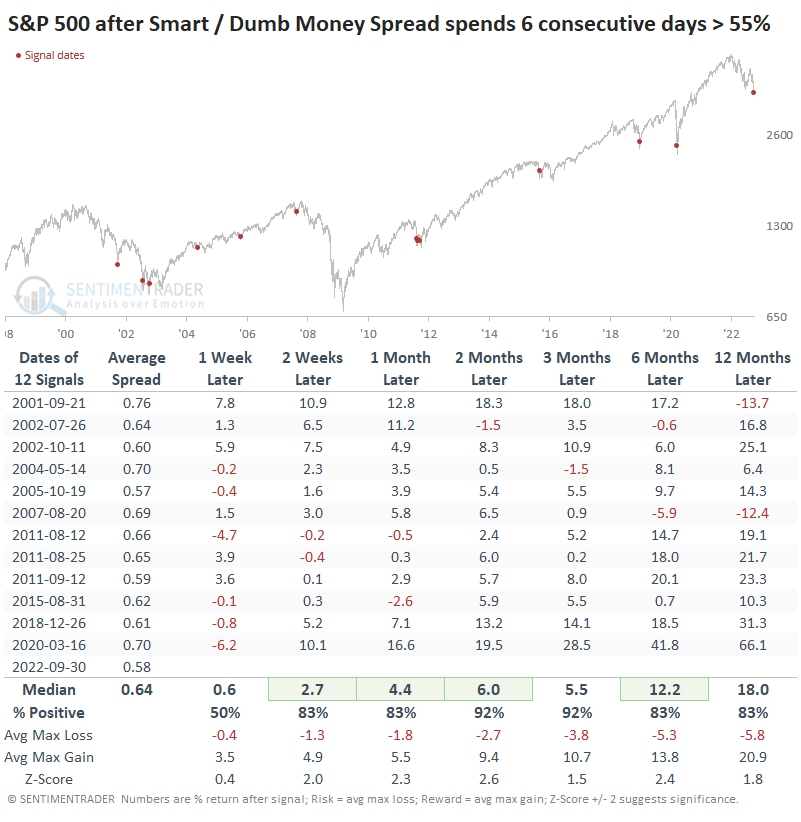
The table below shows that when the spread spent six consecutive days at or above 55%, the S&P 500 rose each time either two or three months later. Out of twelve signals, there was only one loser after two months, which was minimal and was reversed in the weeks following.
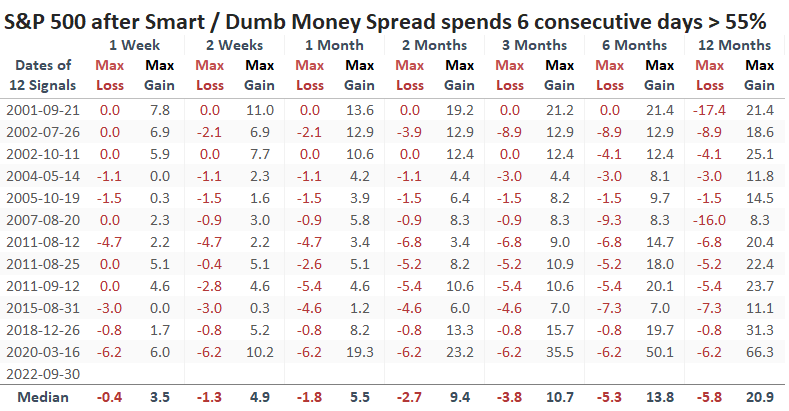
Below, we can see the S&P's maximum loss and maximum gain across each time frame. During the next three months, every signal had a max gain larger than the max loss. It was still uncomfortable after several of them, with more than a -5% drawdown, but ultimately, the gains outpaced the losses.
What the research tells us...
As we've noted ad nauseam over the years, sentiment during bear markets behaves differently than during bull markets. During the former, we typically need to see whites-of-their-eyes levels of pessimism to have any confidence in a counter-trend, multi-week to multi-month rally. With investors' losses during the last few weeks, we seemed to have reached that level again.
Indicators at Extremes
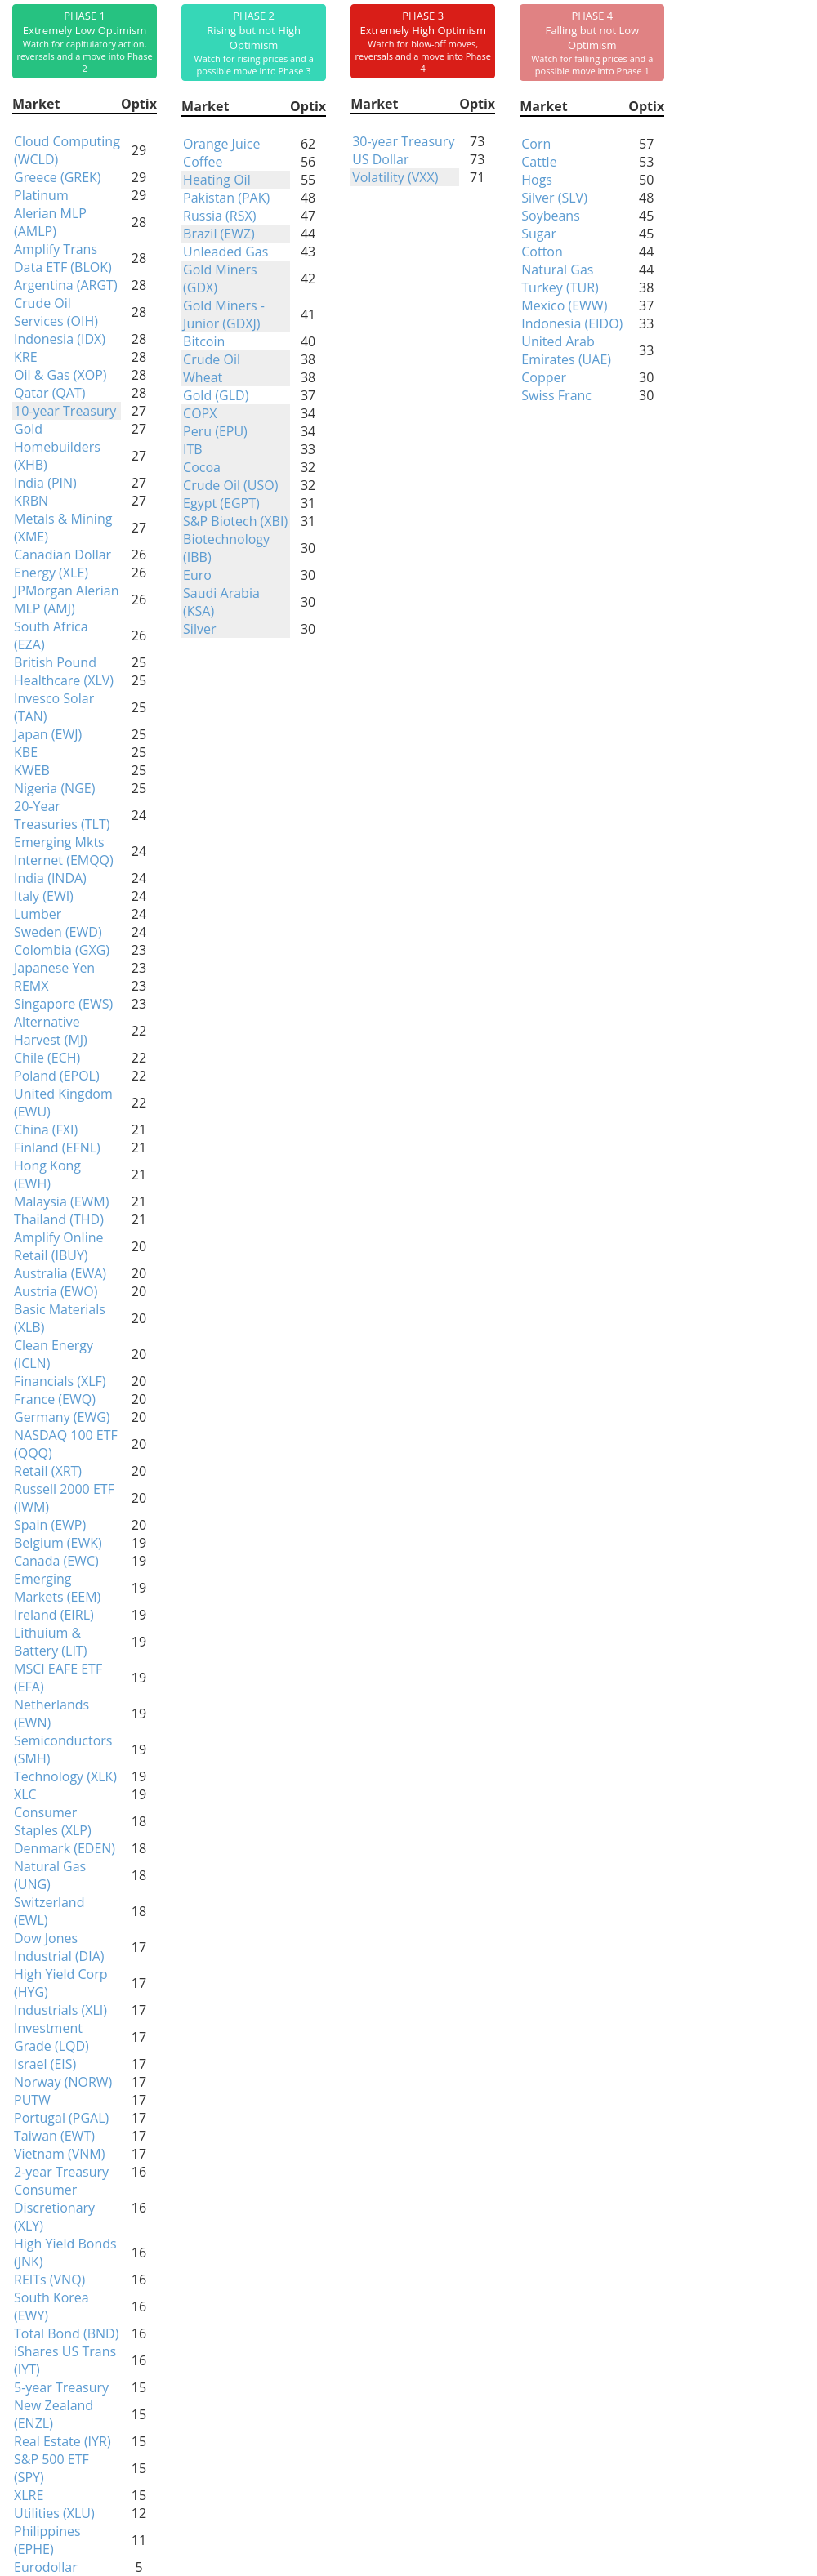
Phase Table
Ranks
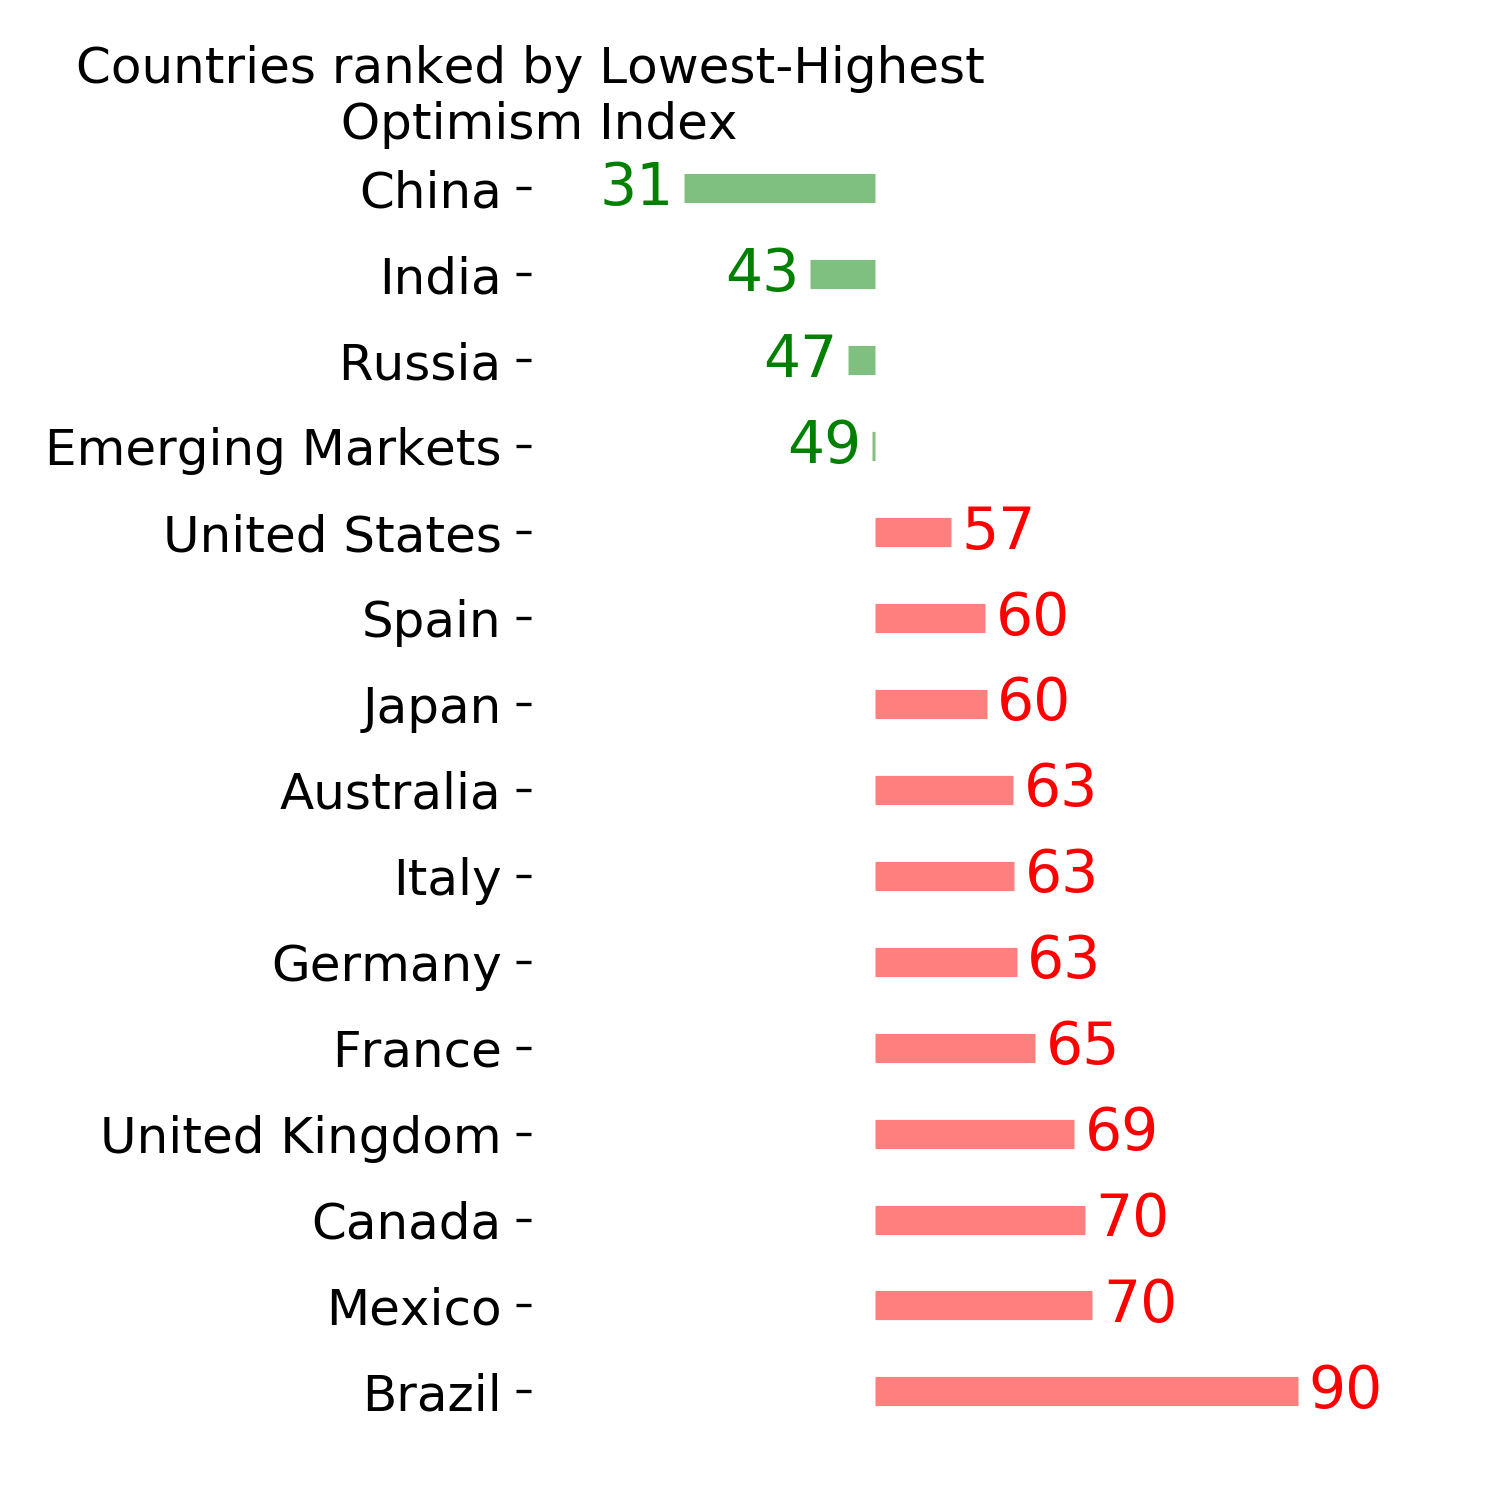
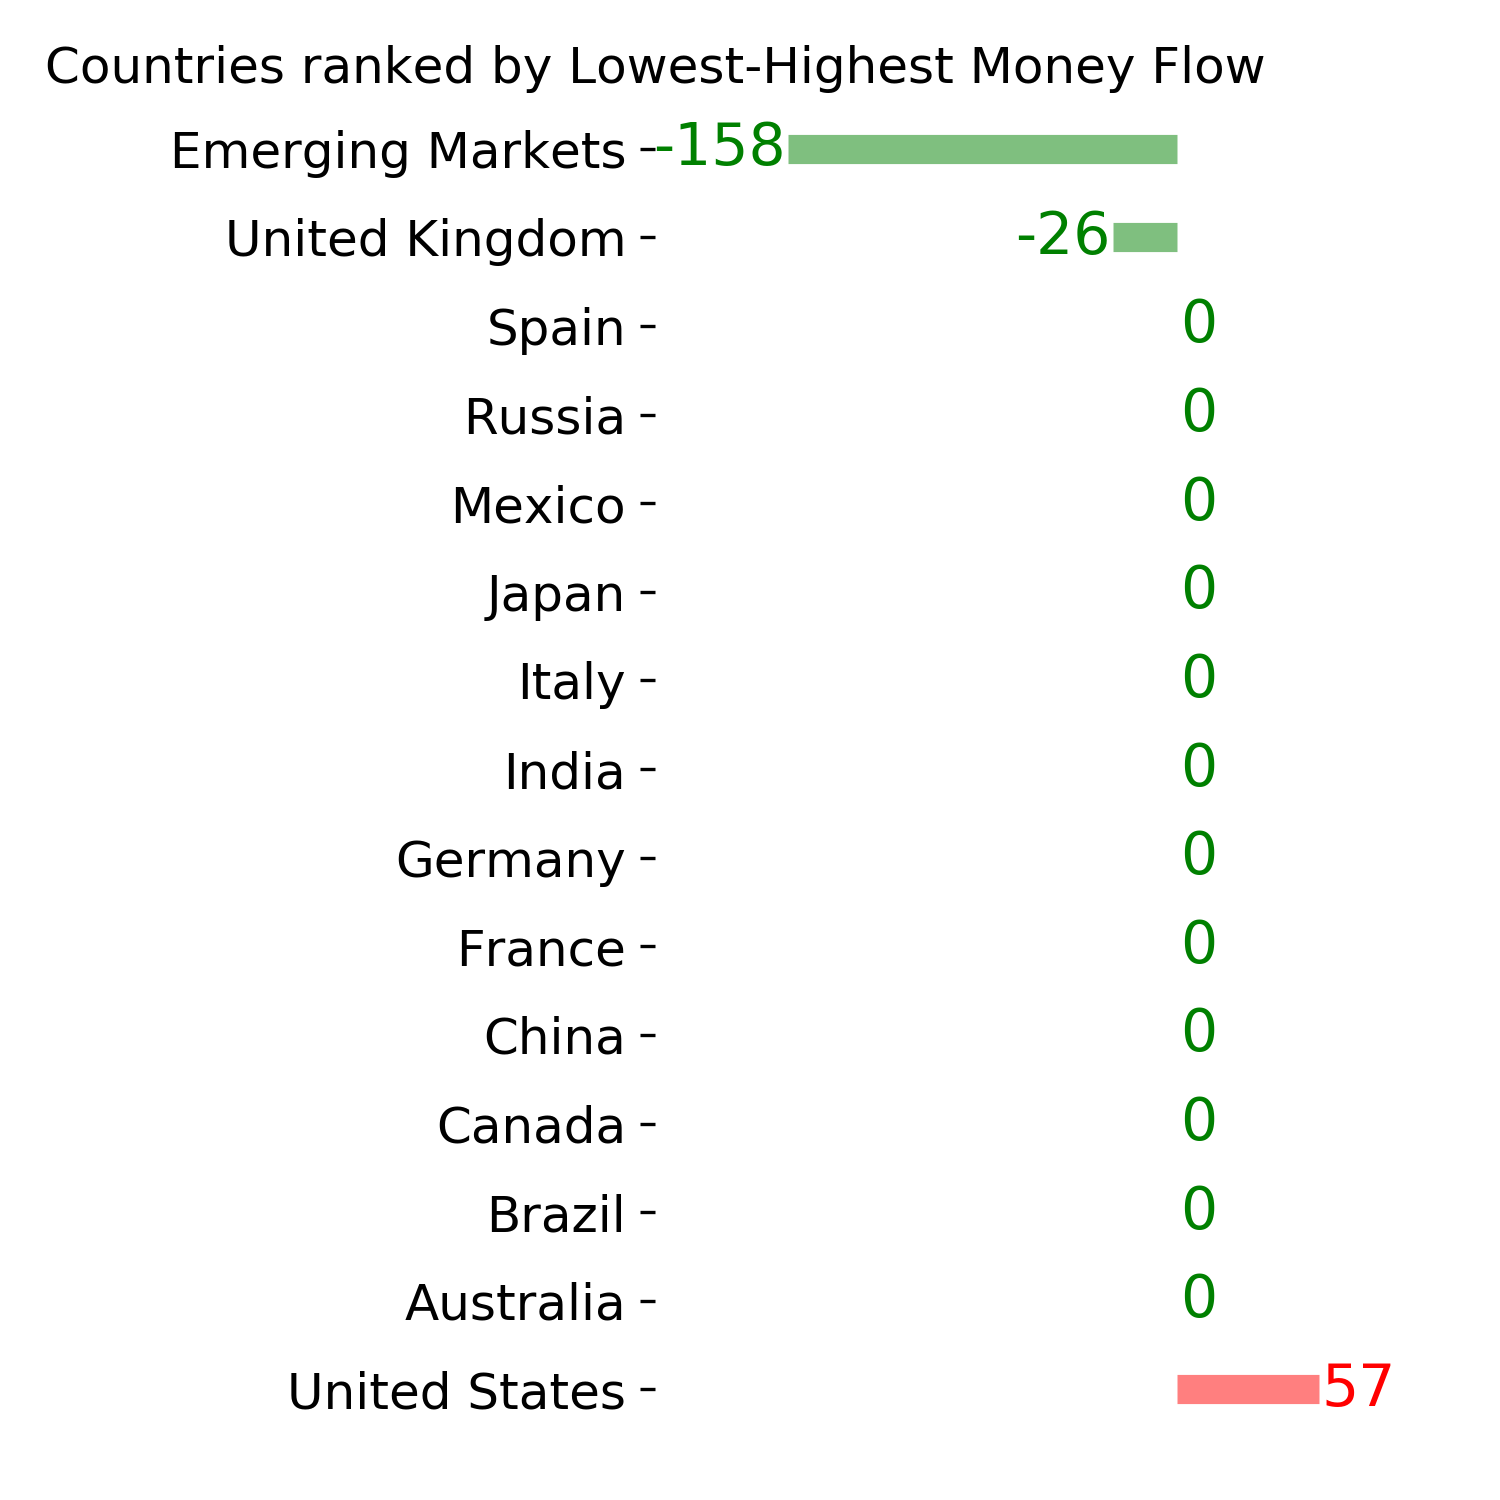
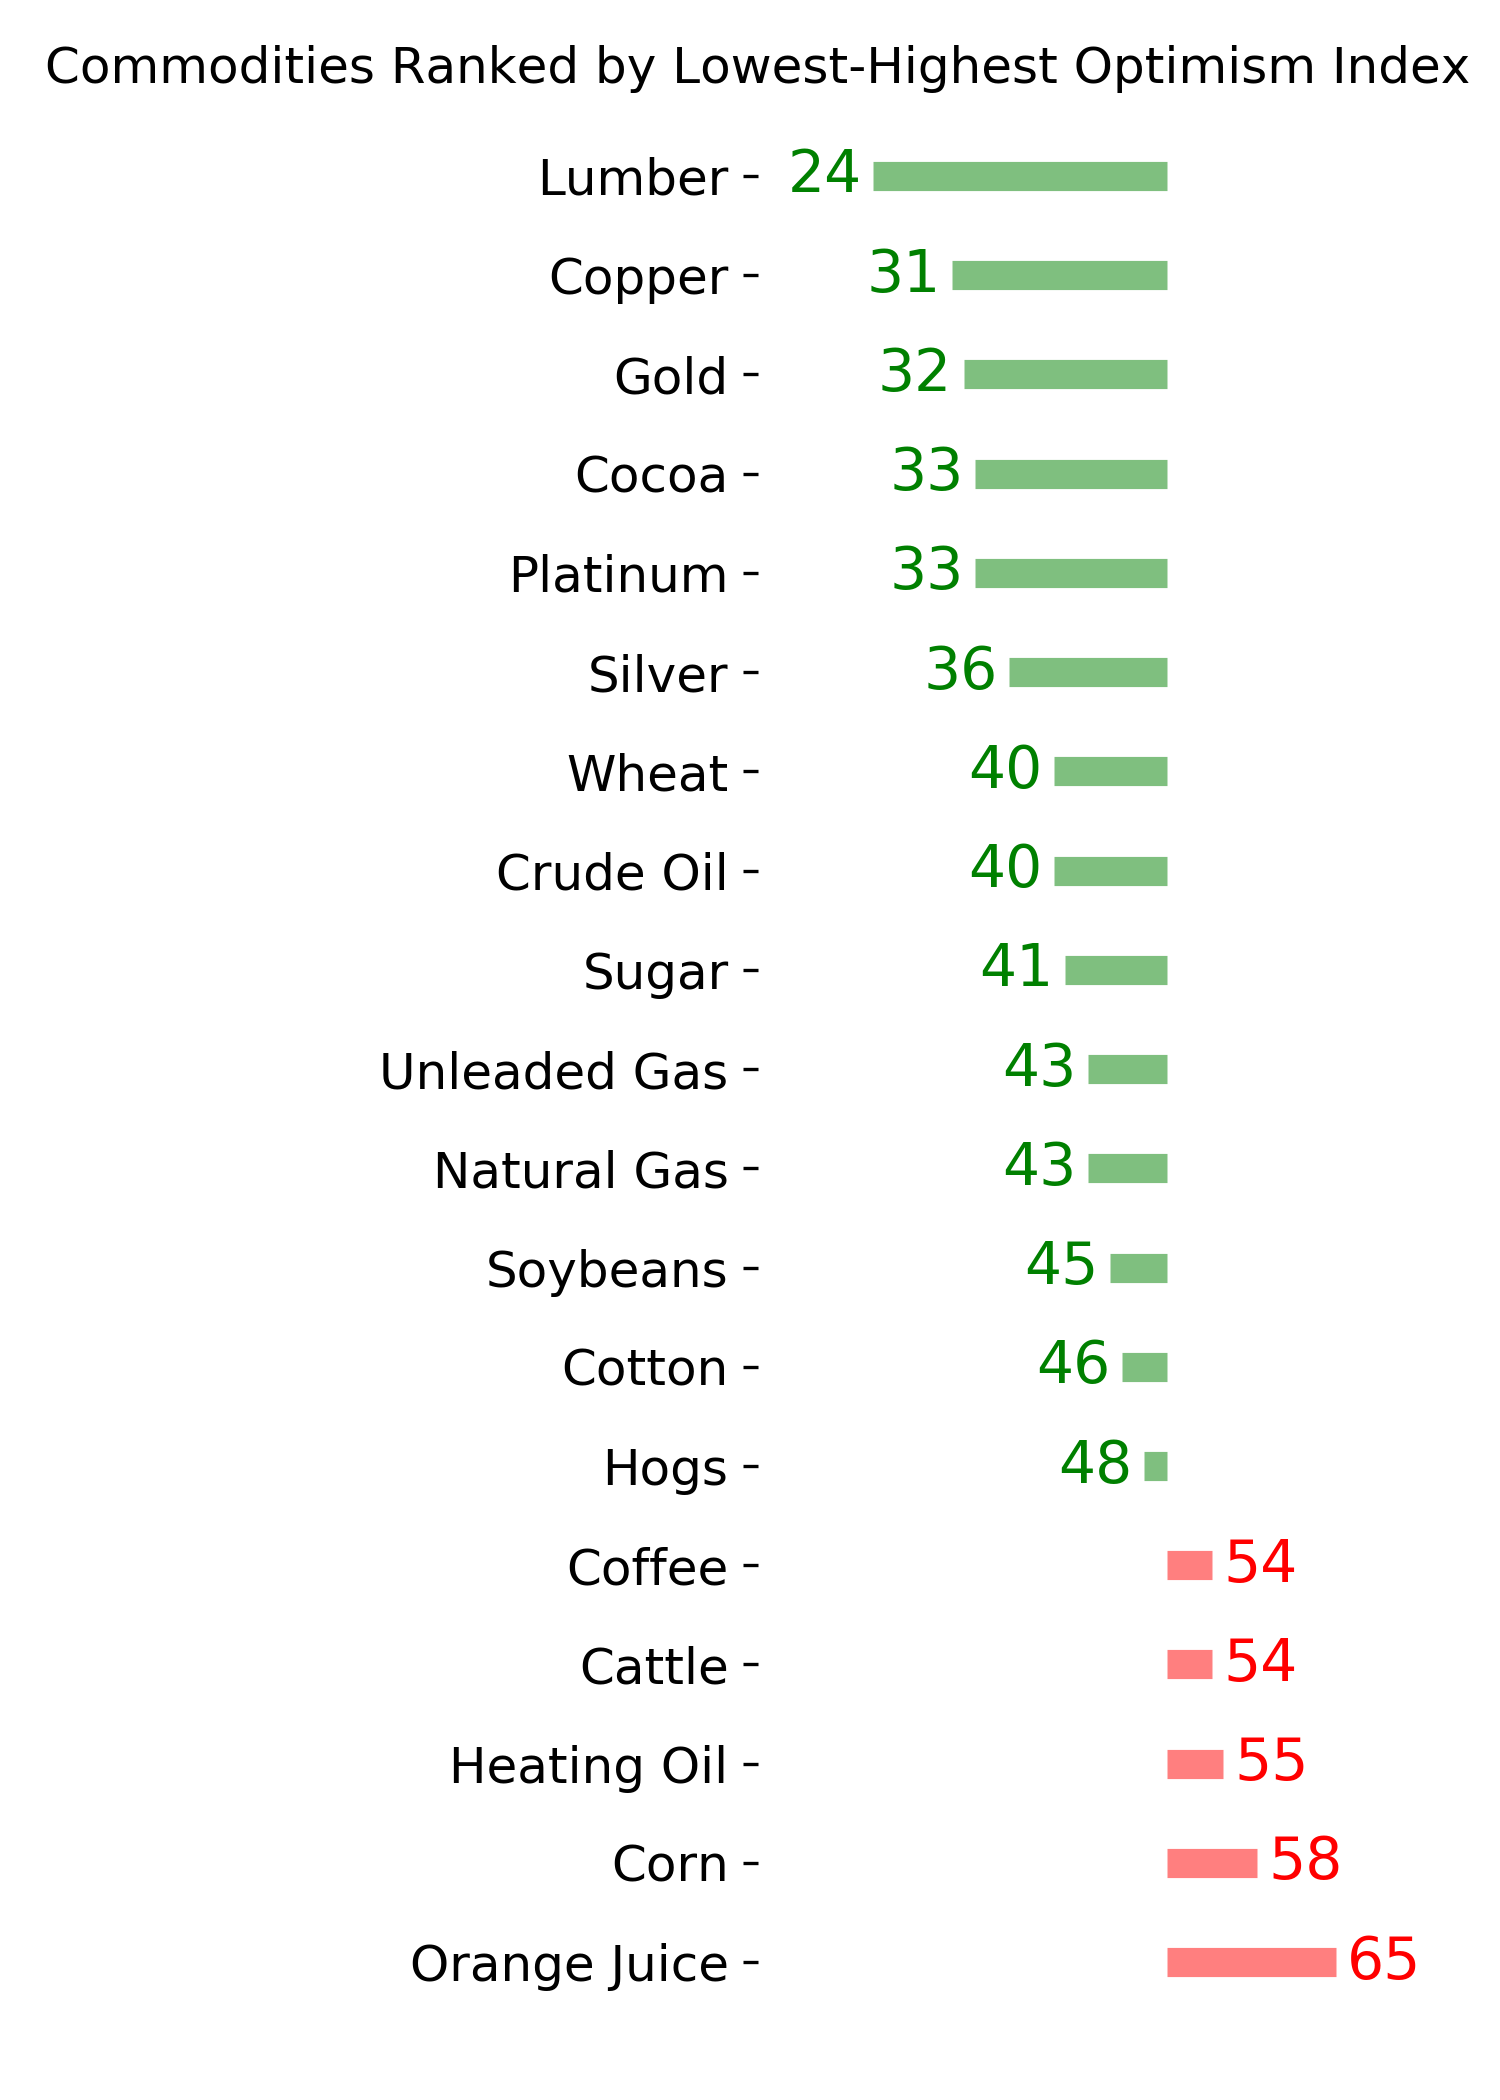
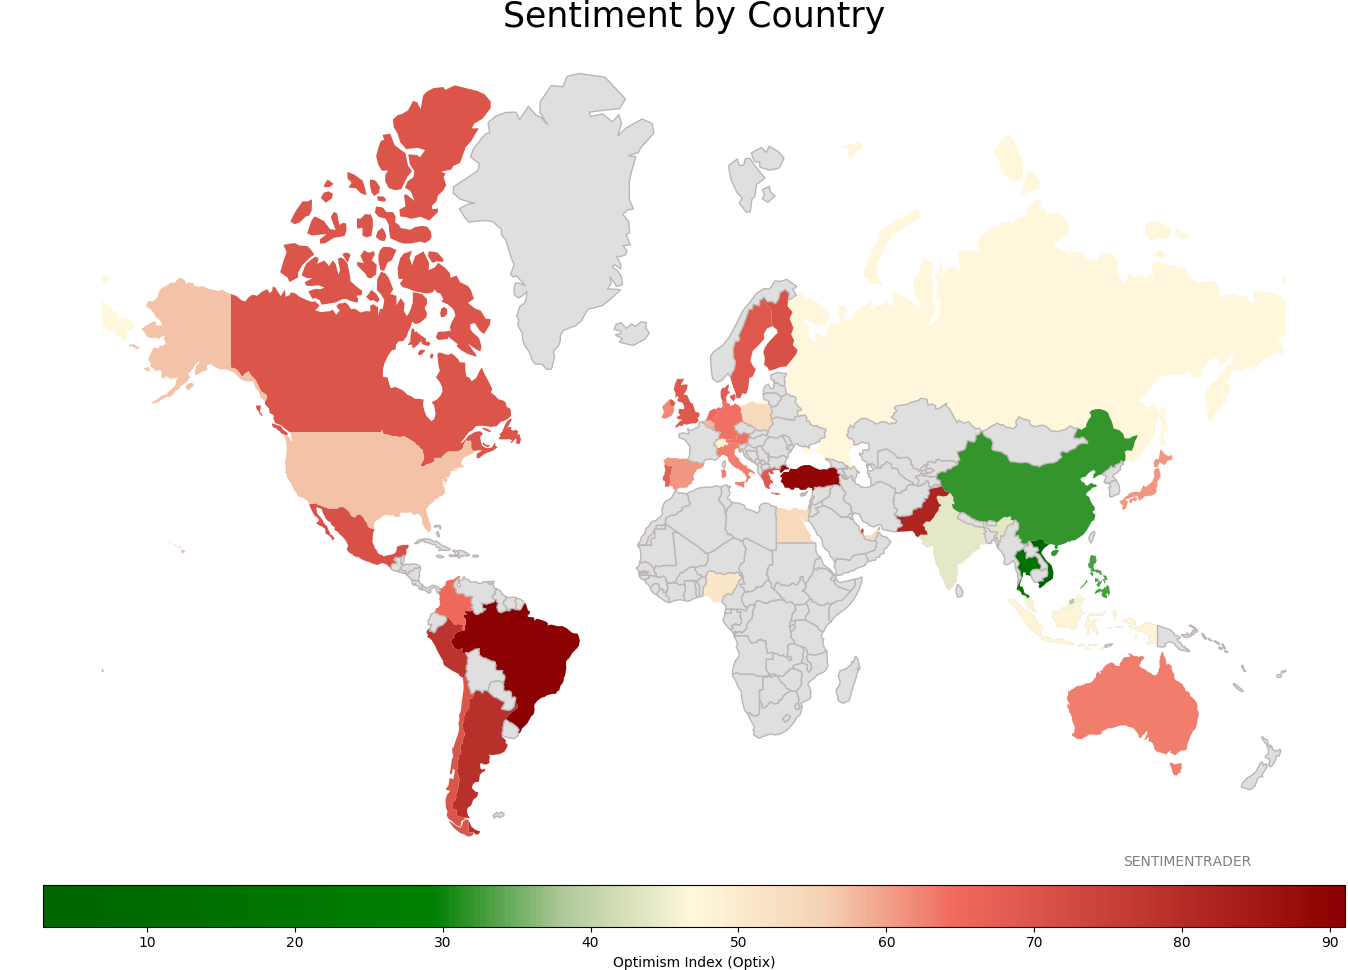
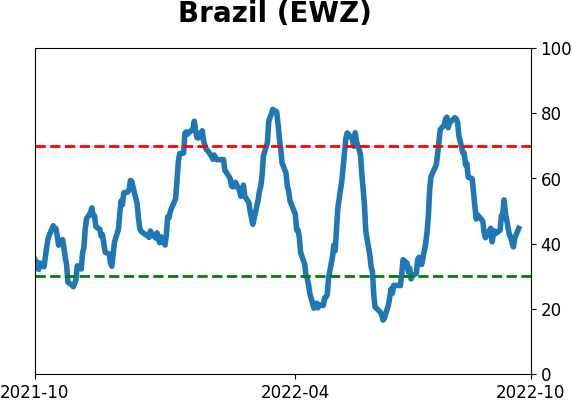
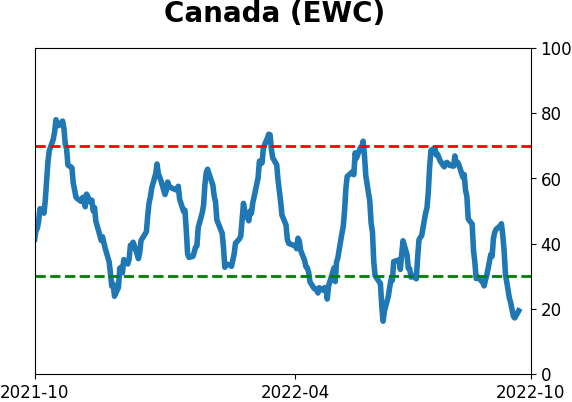
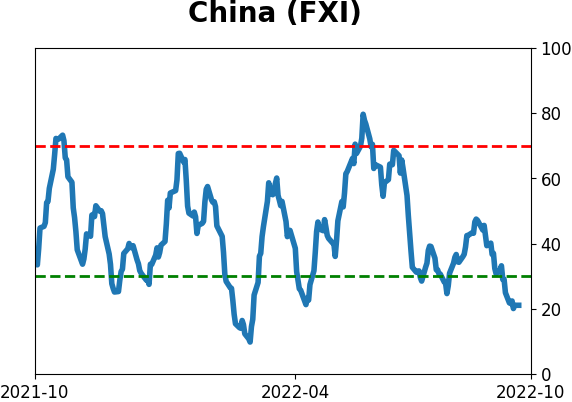
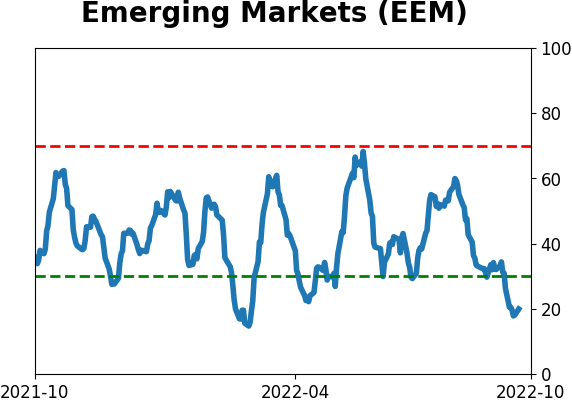
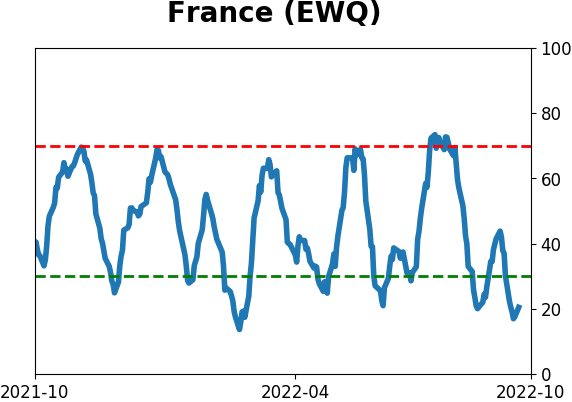
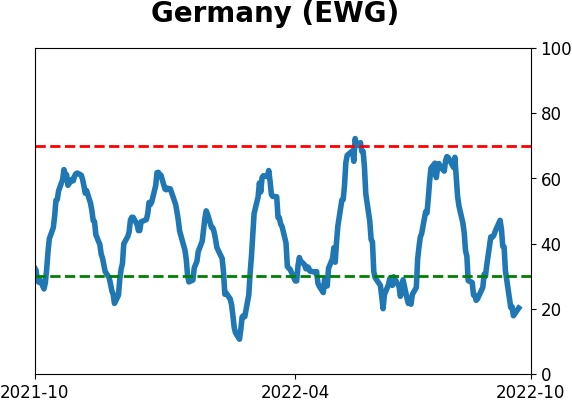
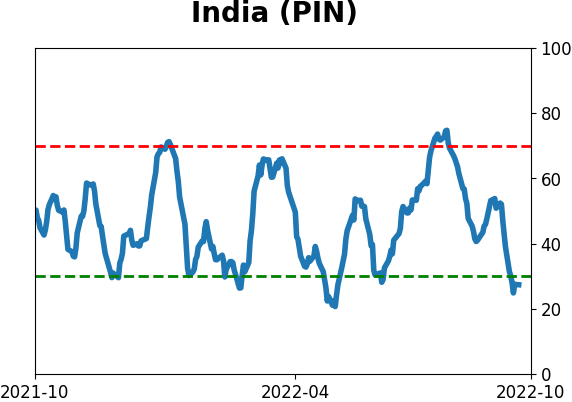
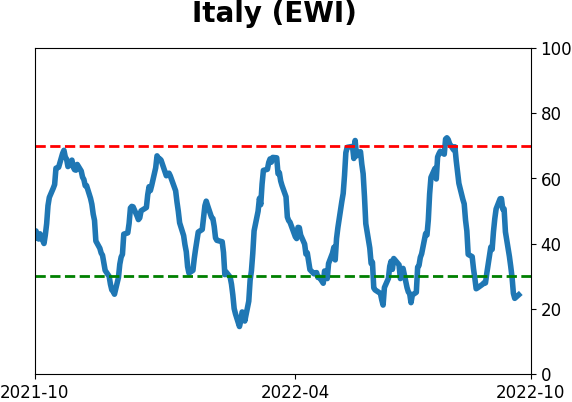
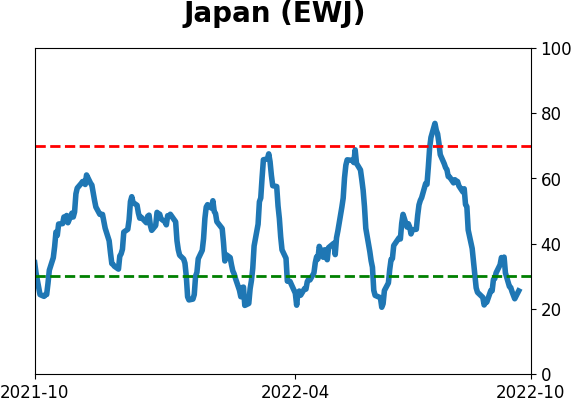
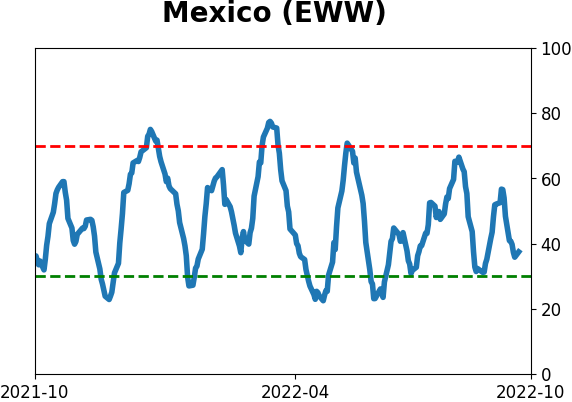
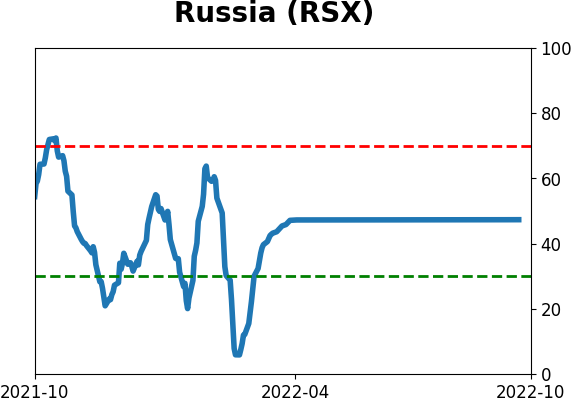
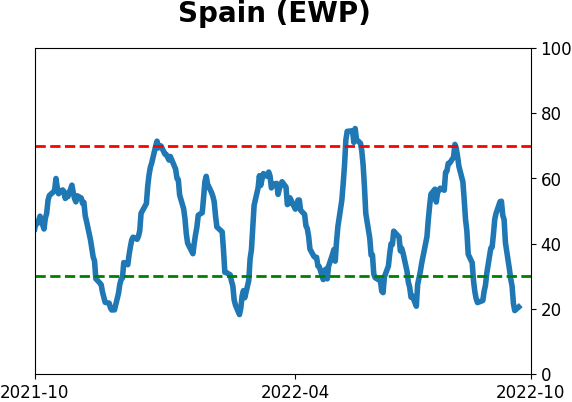
Sentiment Around The World
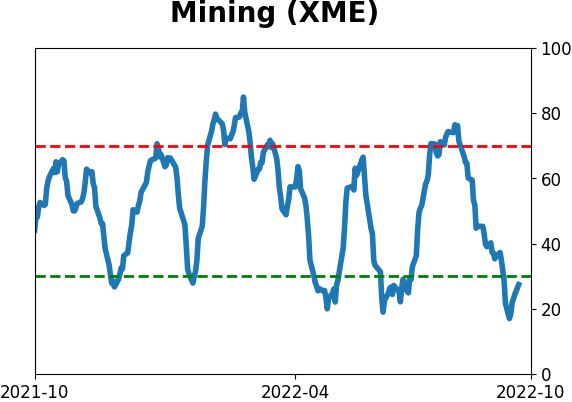
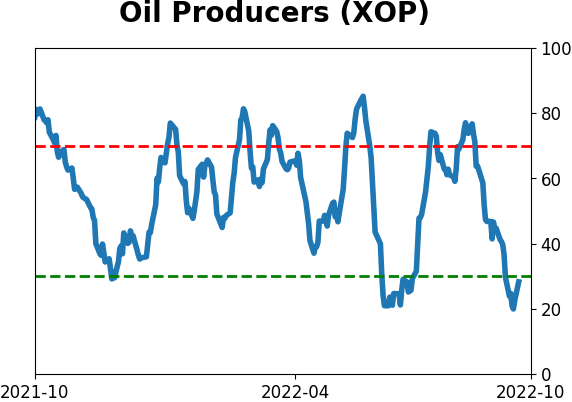
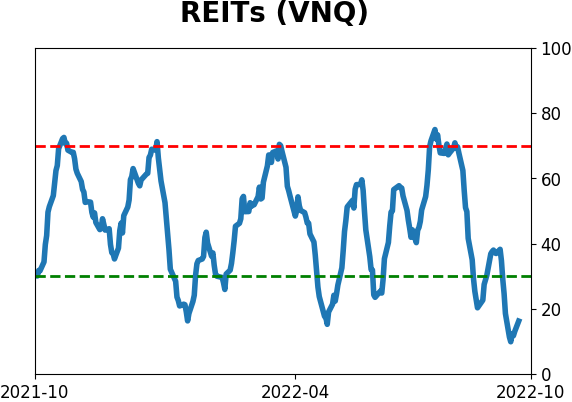
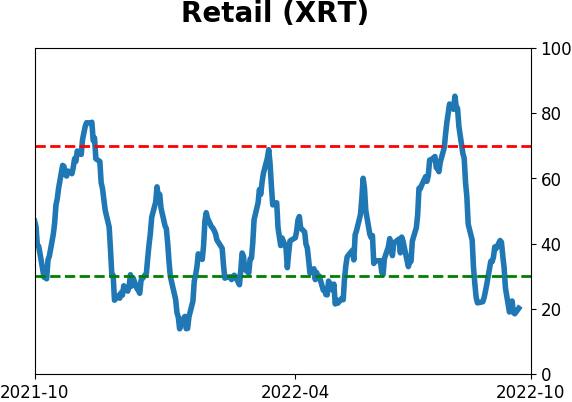
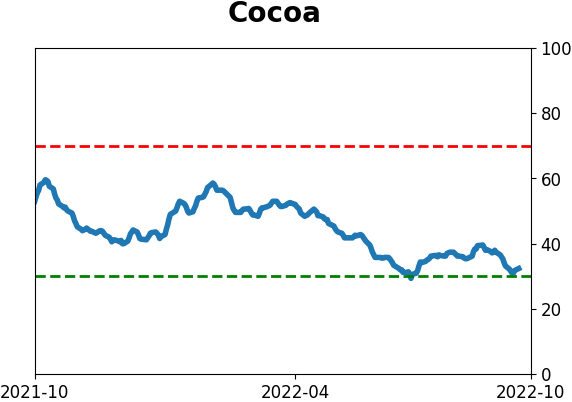
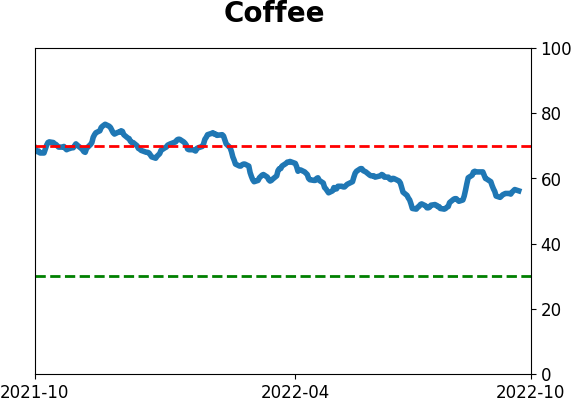
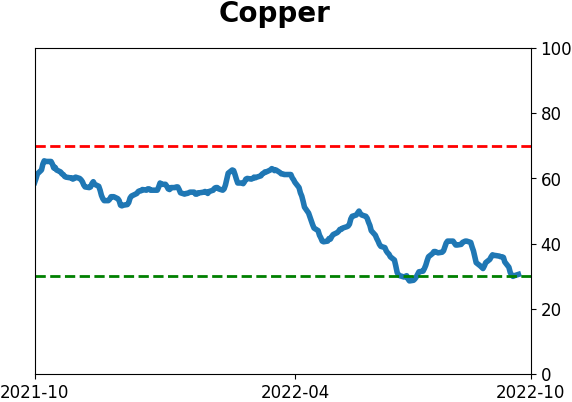
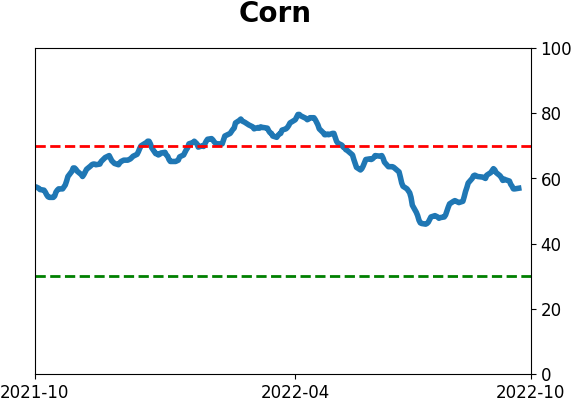
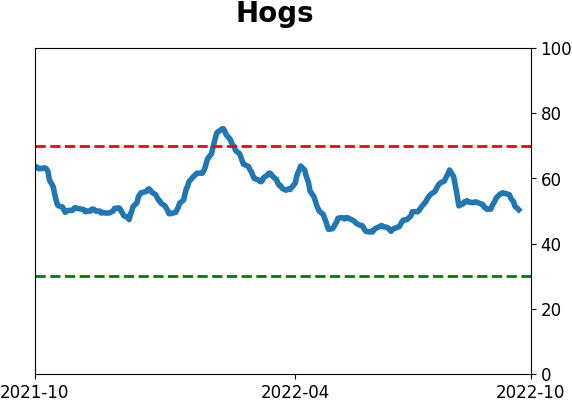
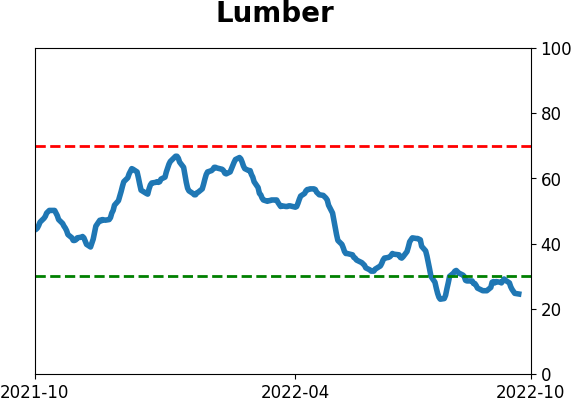
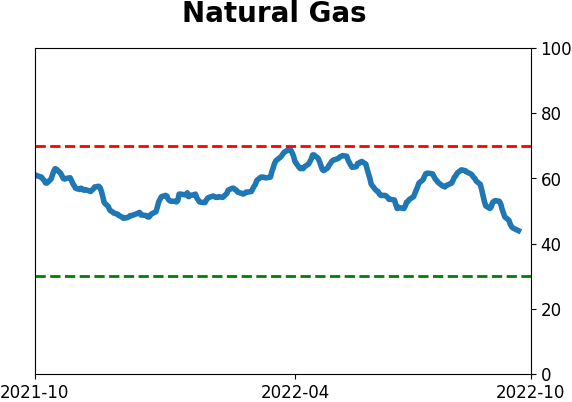
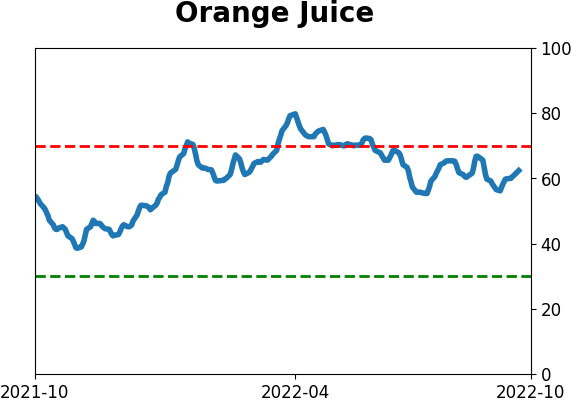
Optimism Index Thumbnails
|
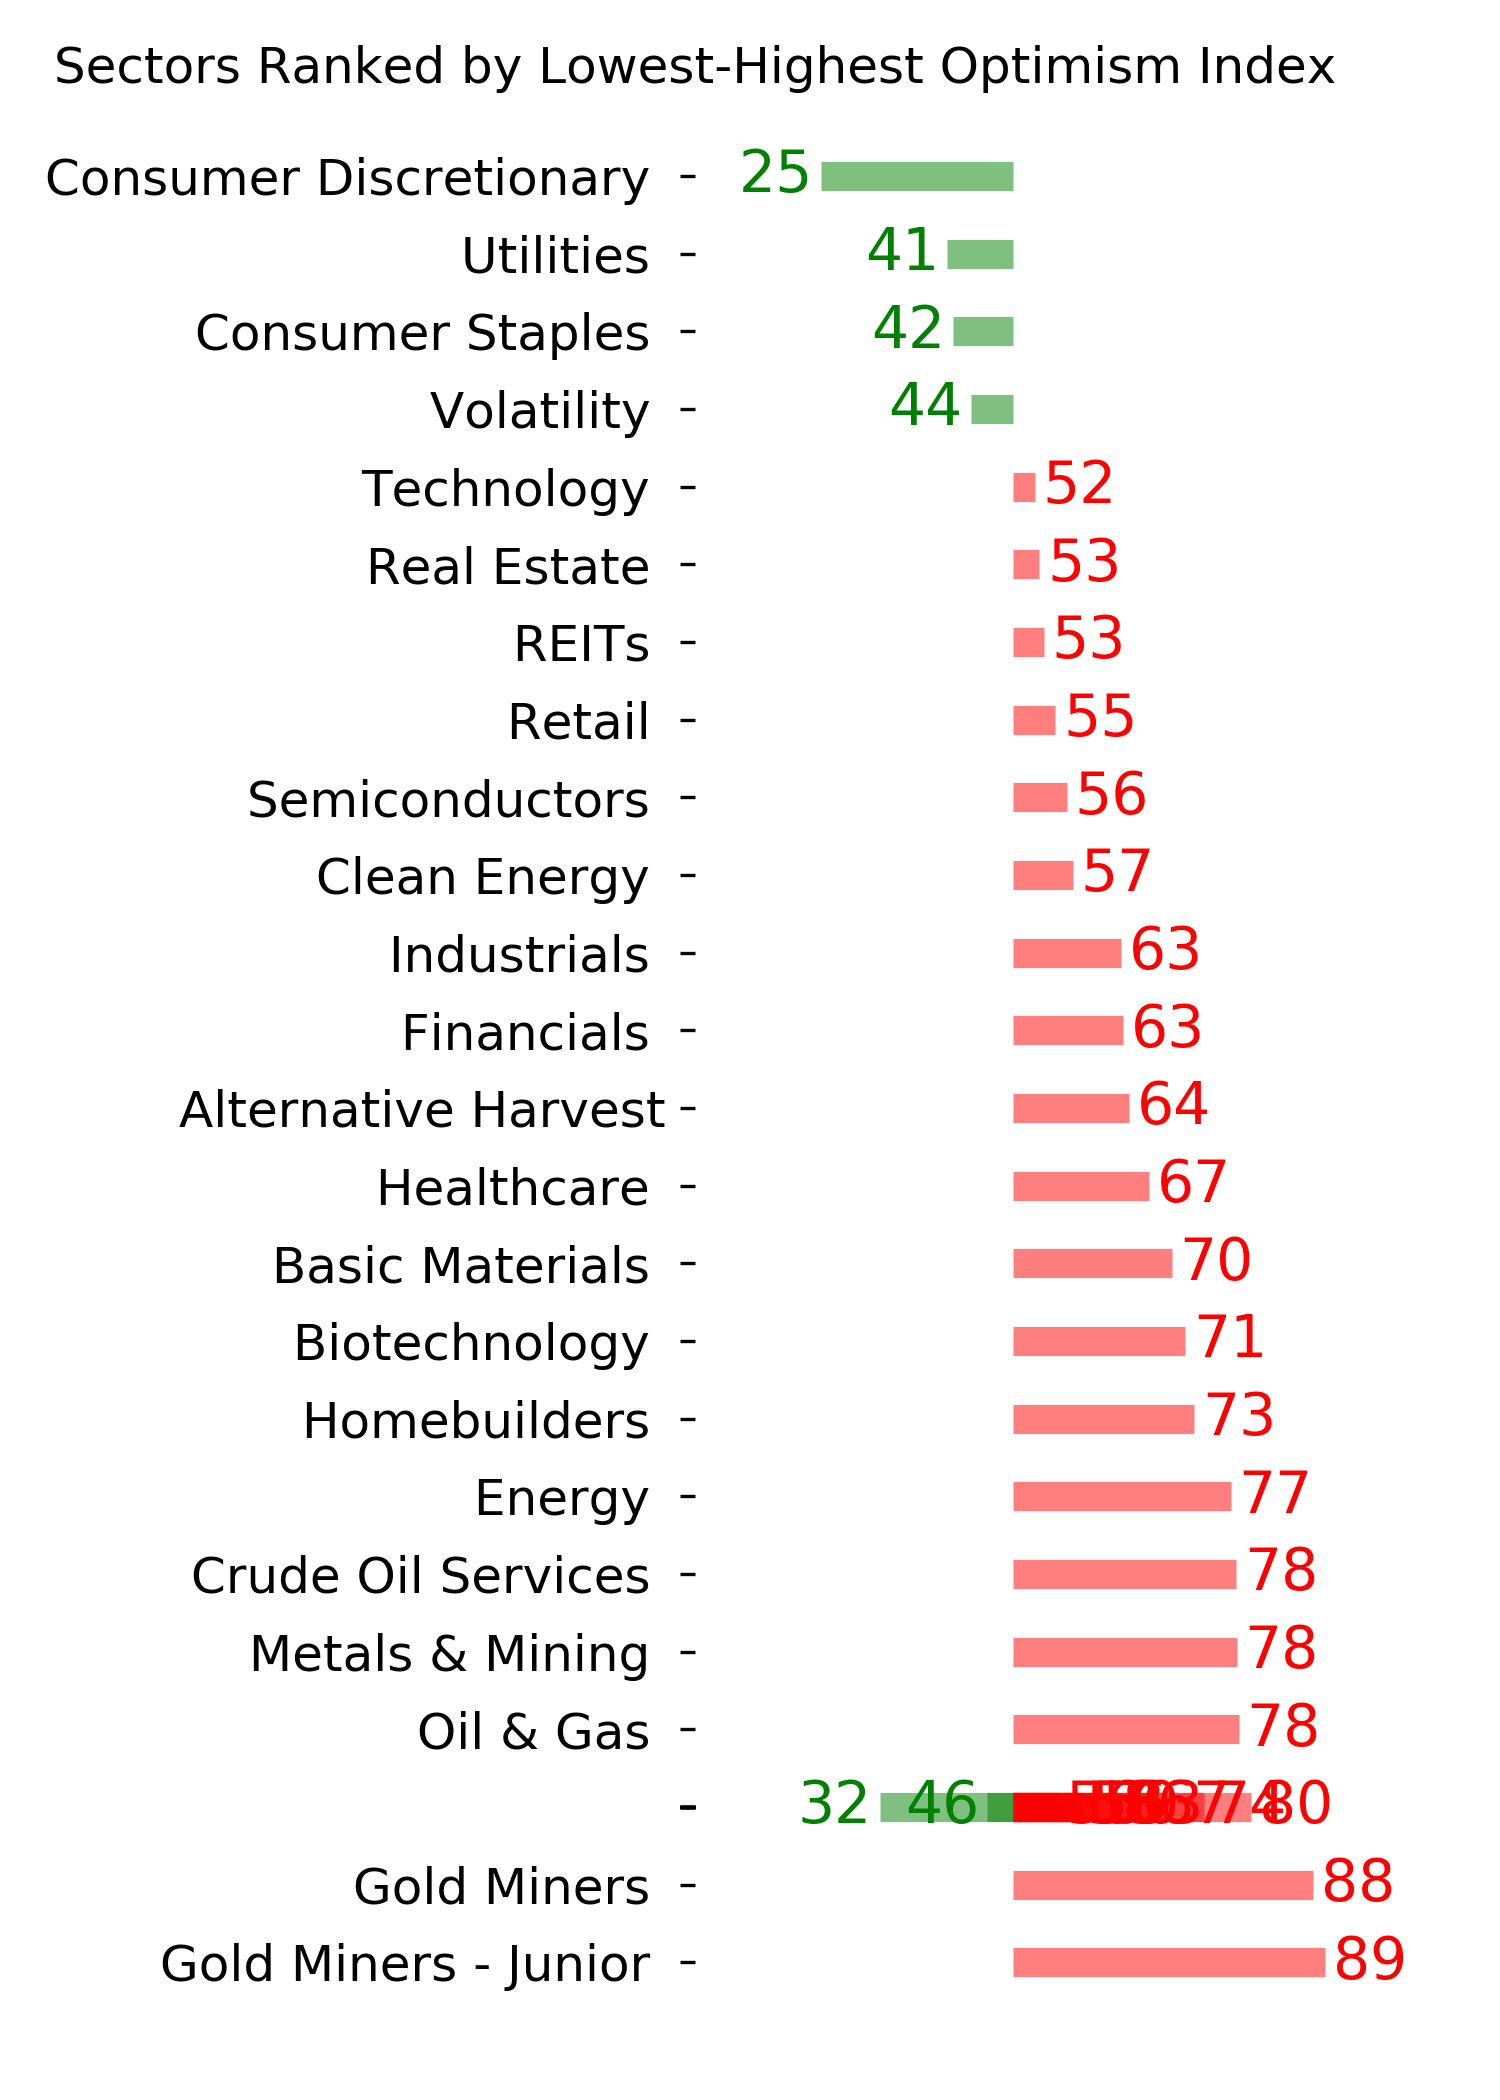
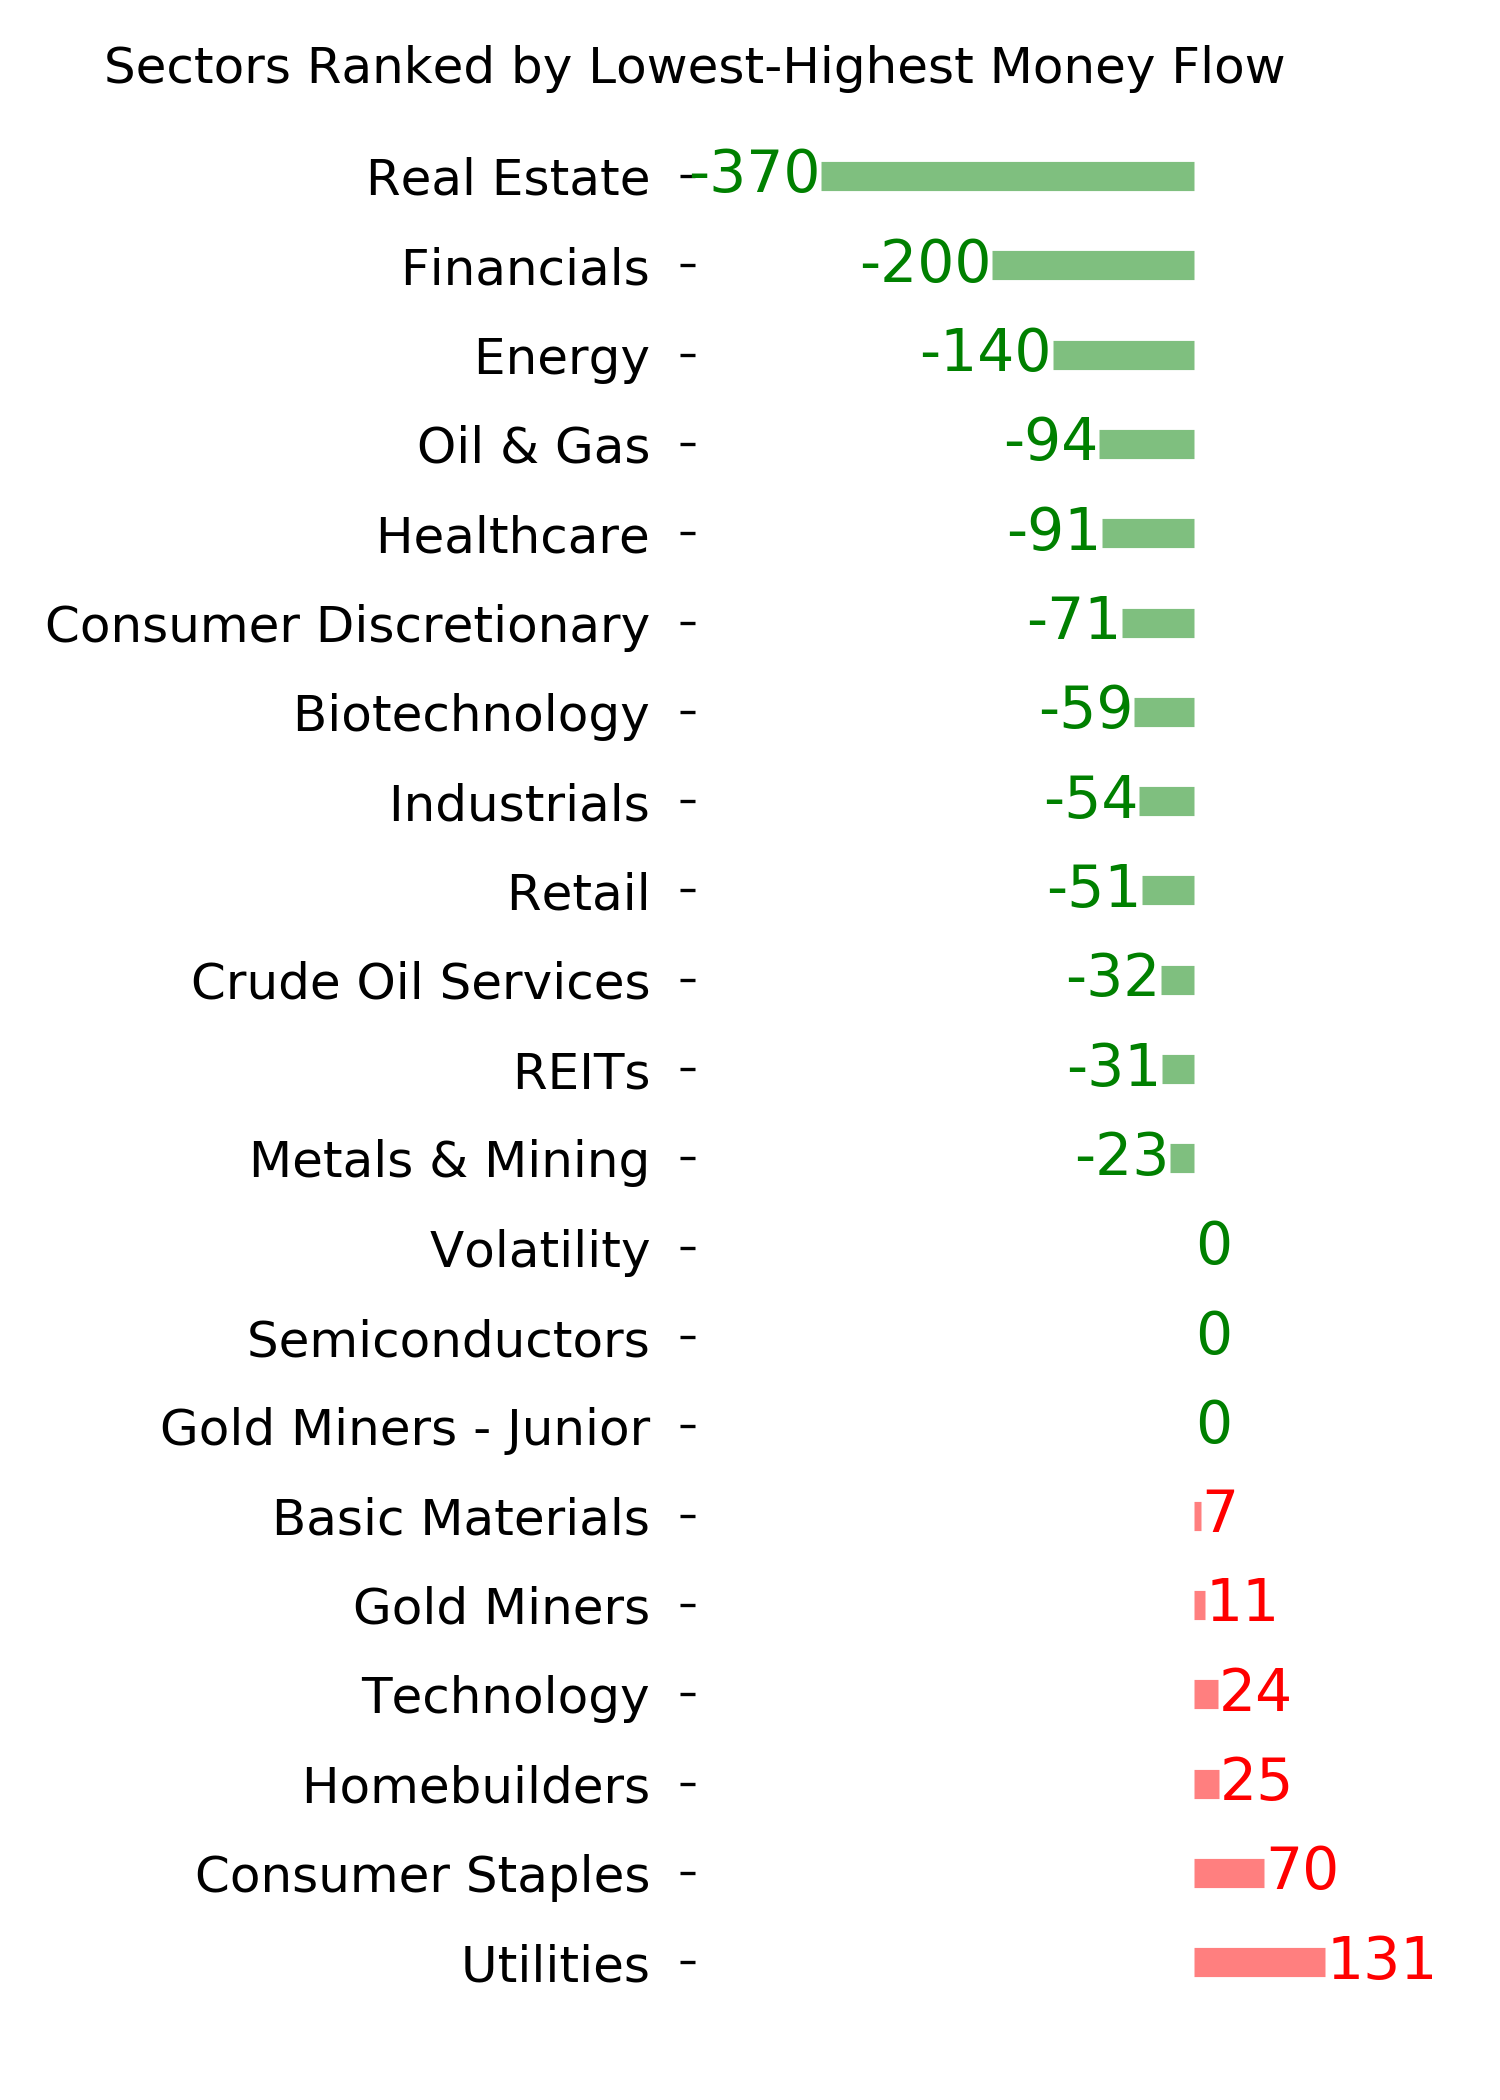
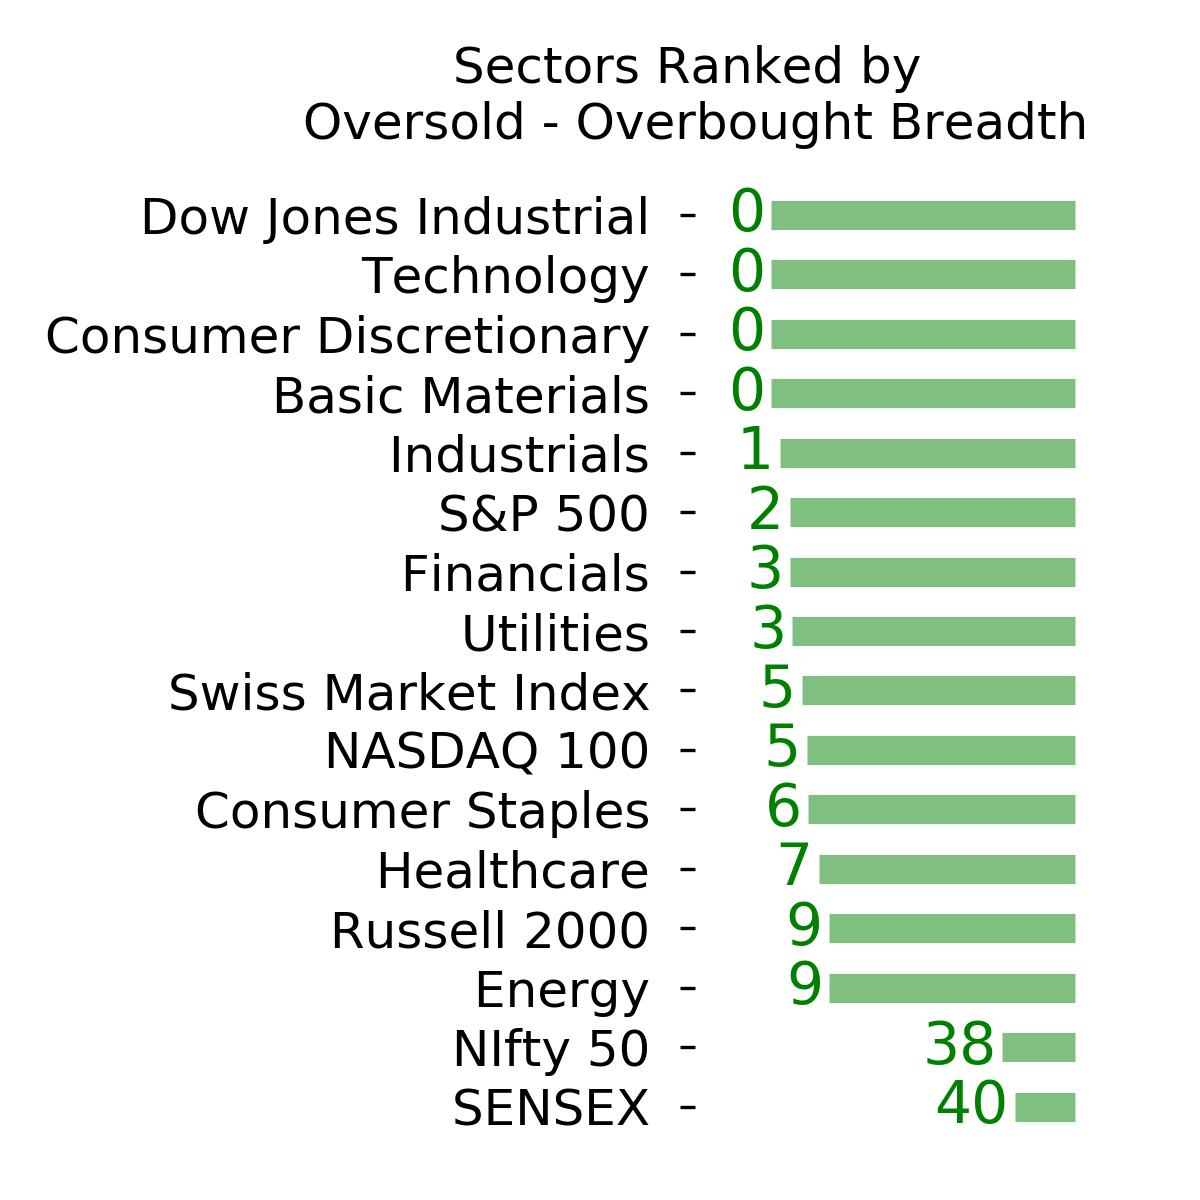
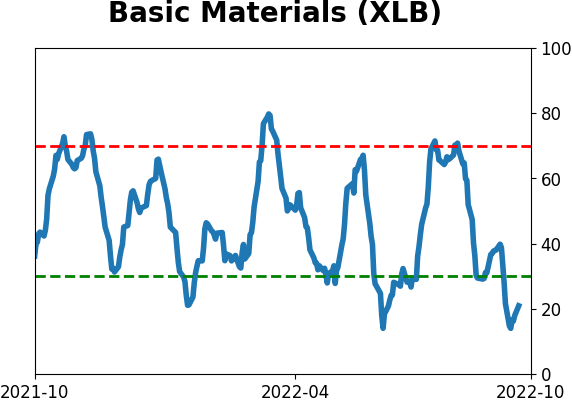
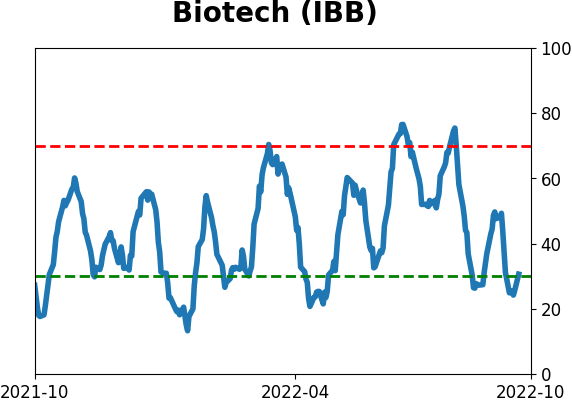
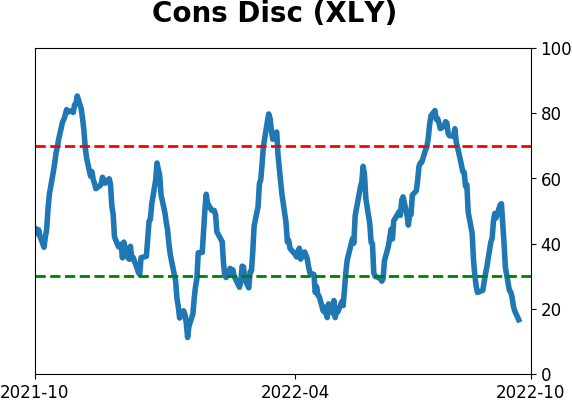
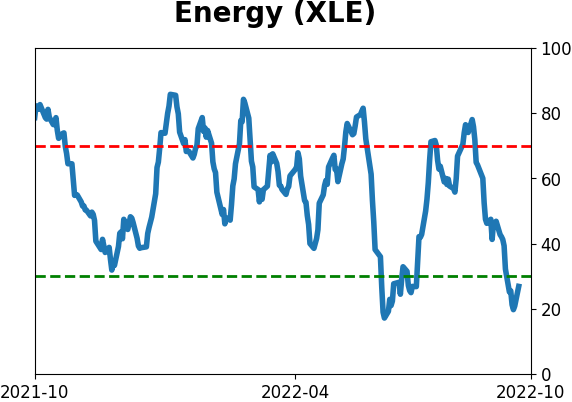
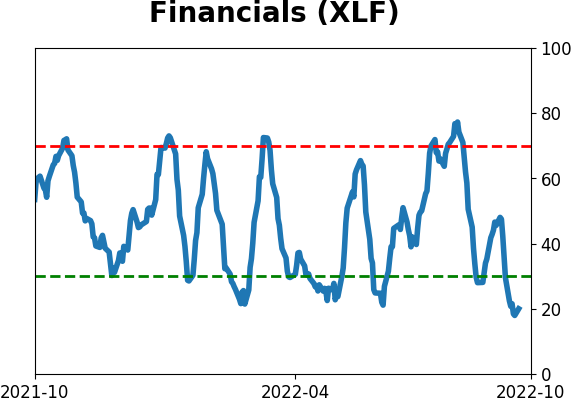
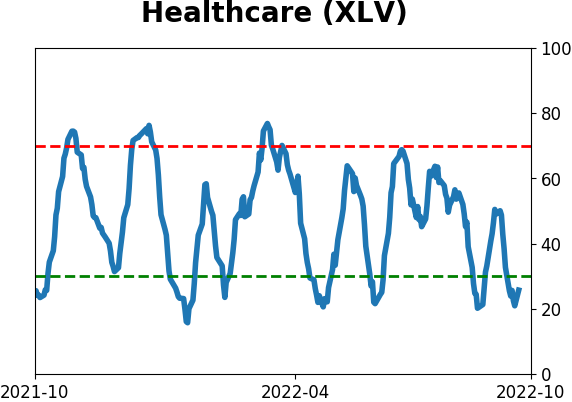
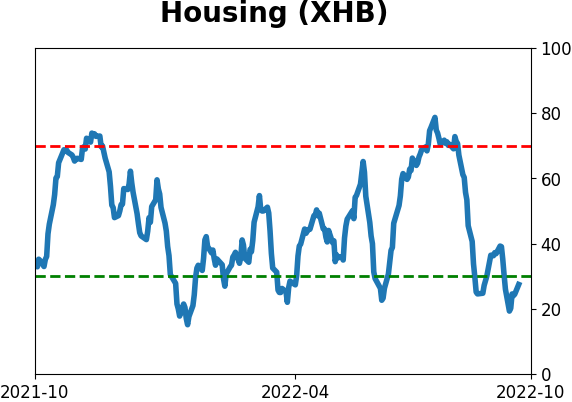
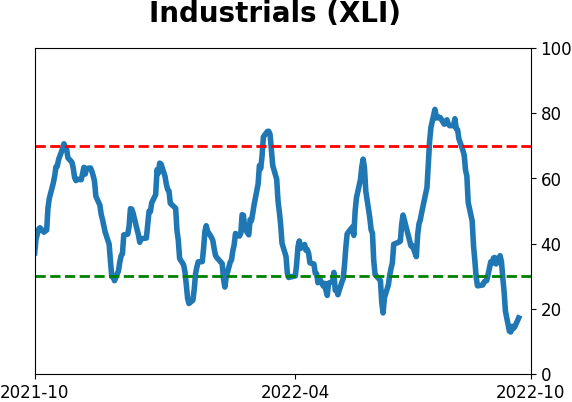
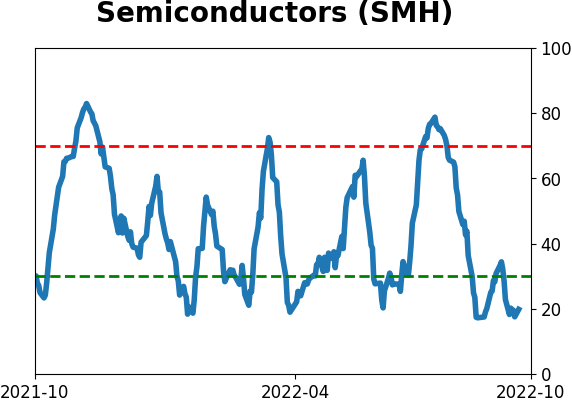
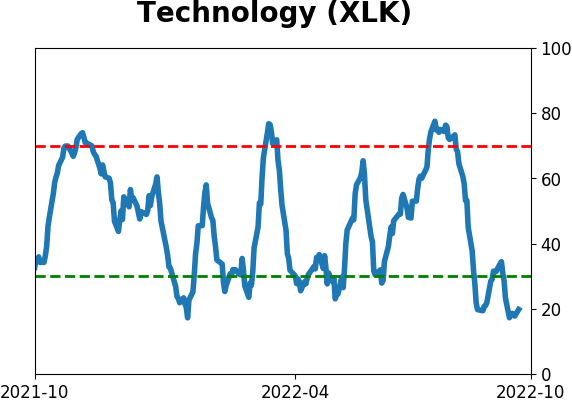
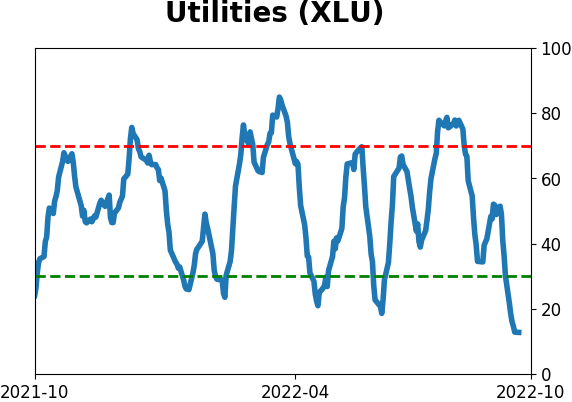
Sector ETF's - 10-Day Moving Average
|
|
|
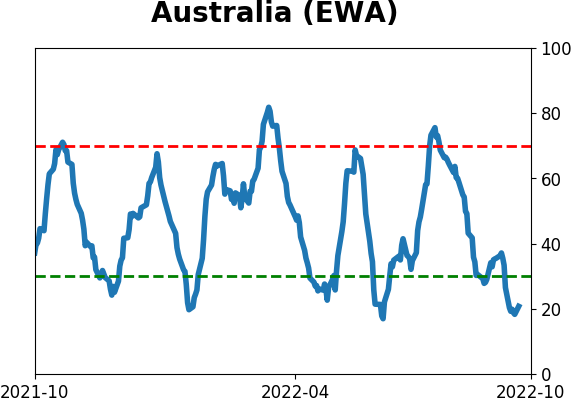
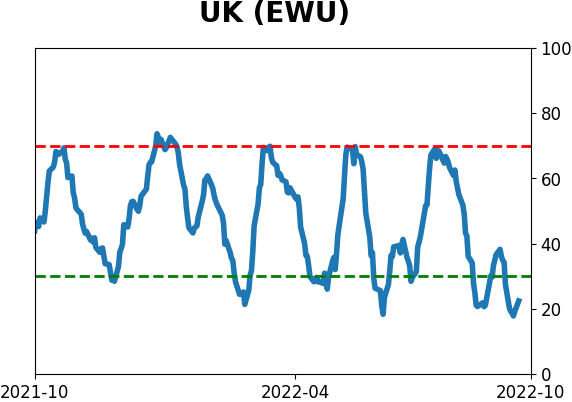
Country ETF's - 10-Day Moving Average
|
|
|
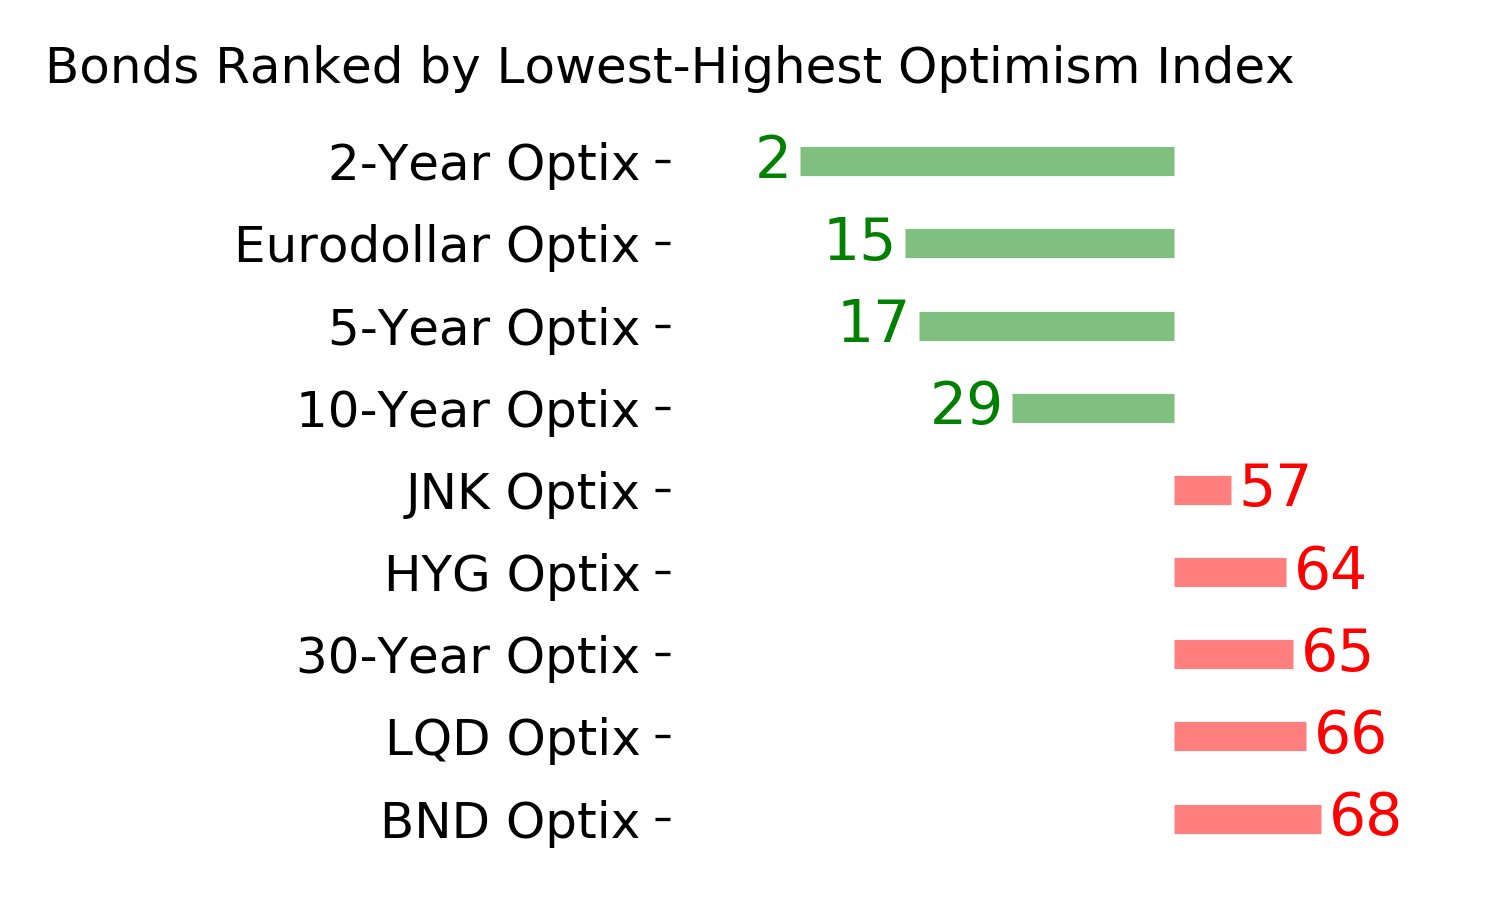
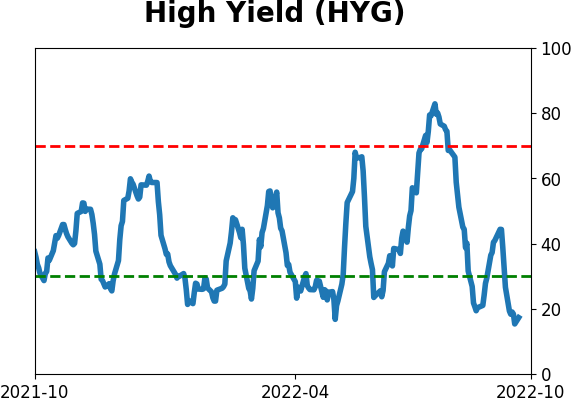
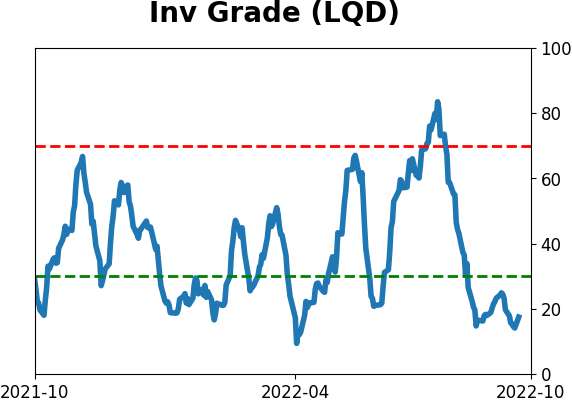
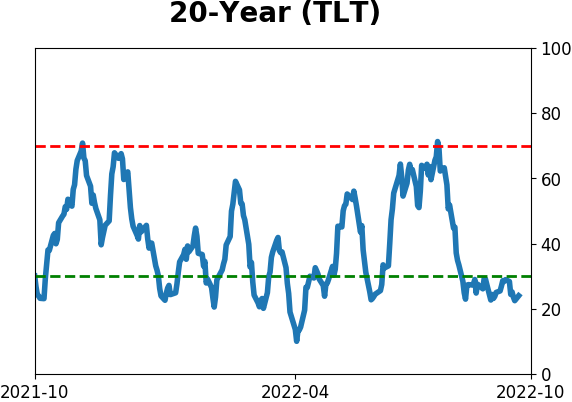
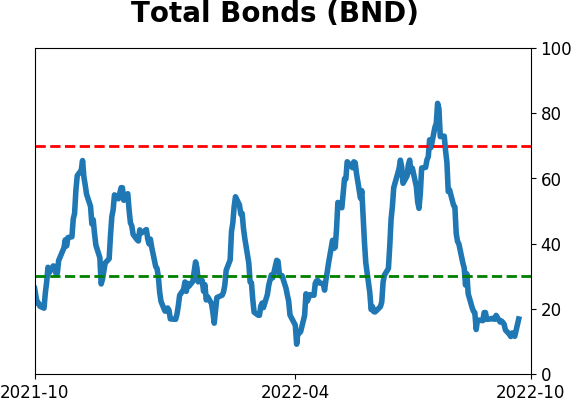
Bond ETF's - 10-Day Moving Average
|
|
|
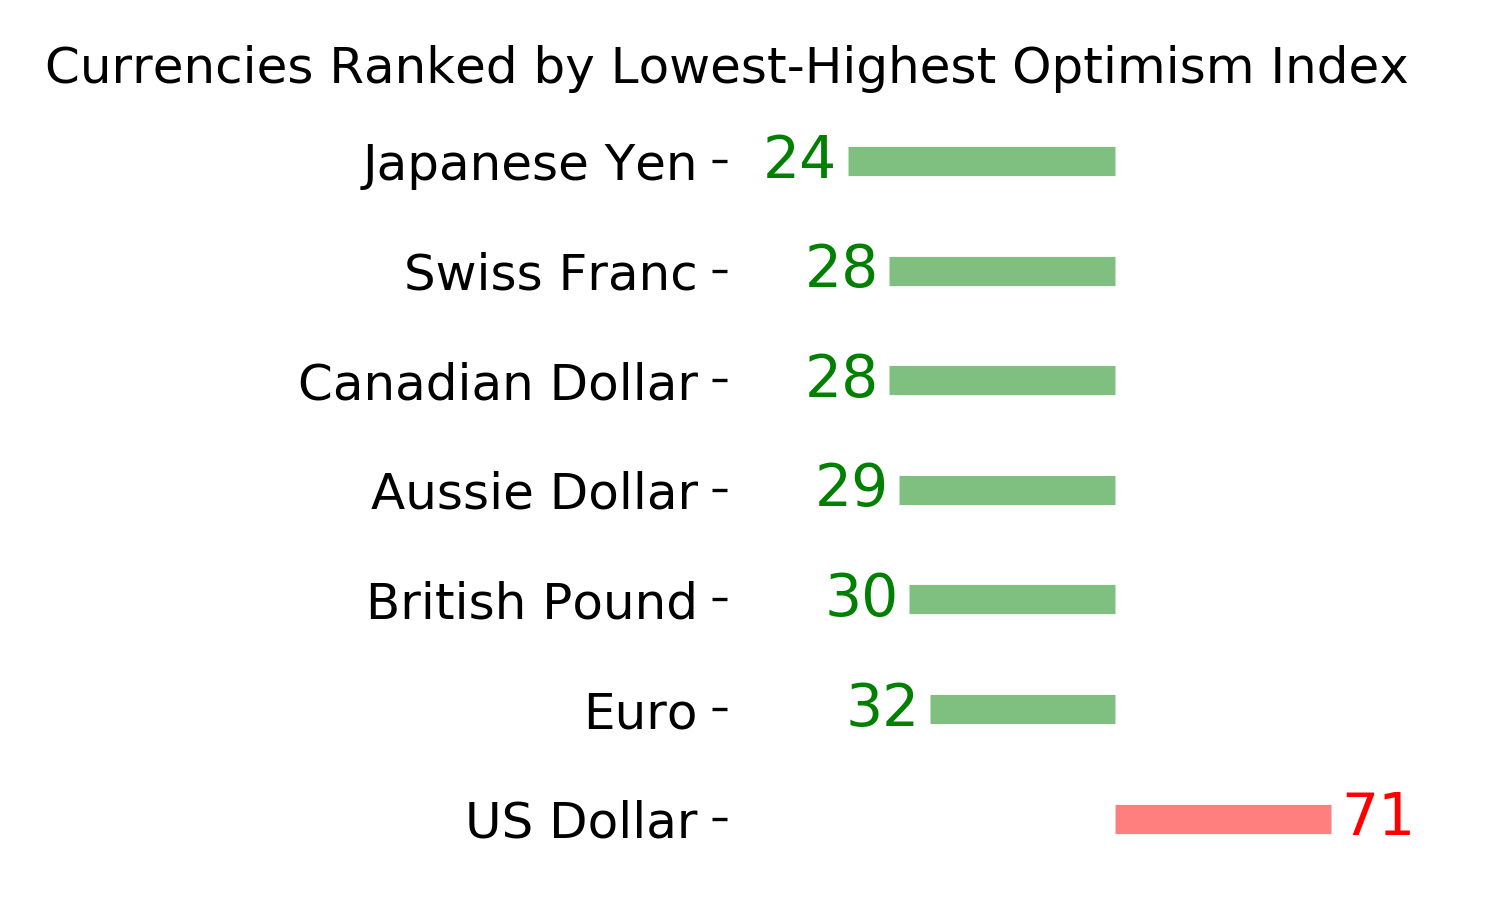
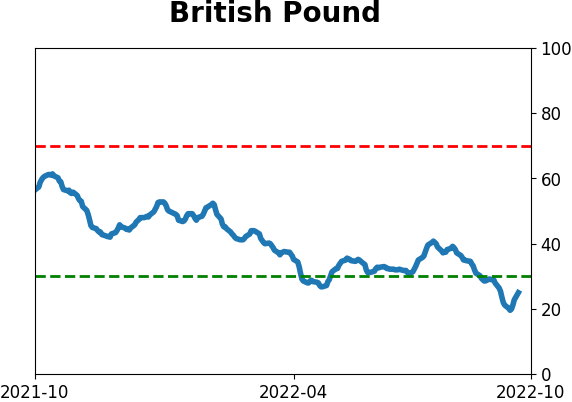
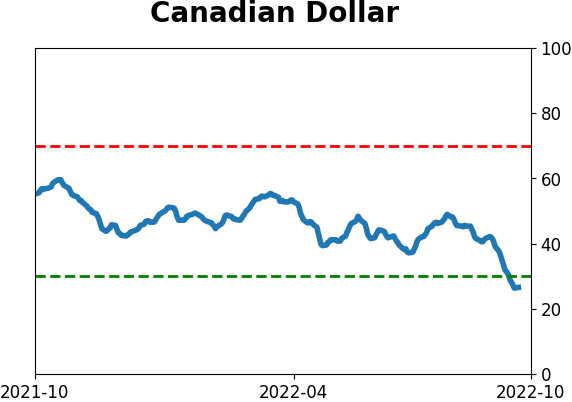
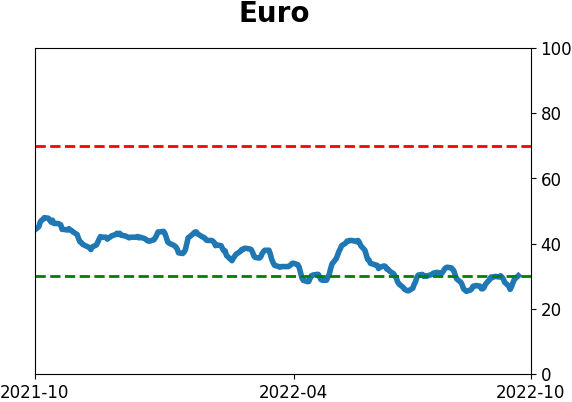
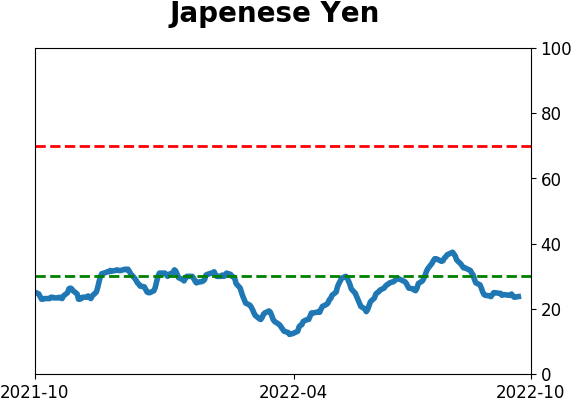
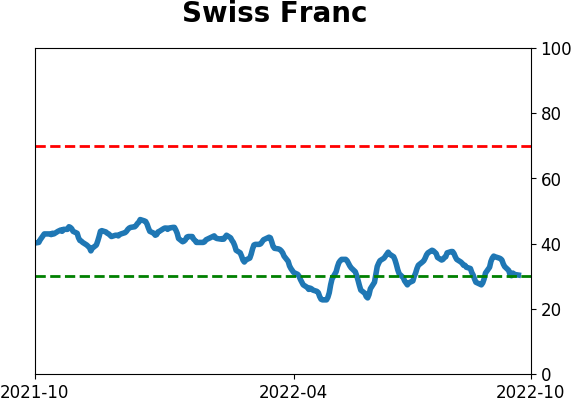
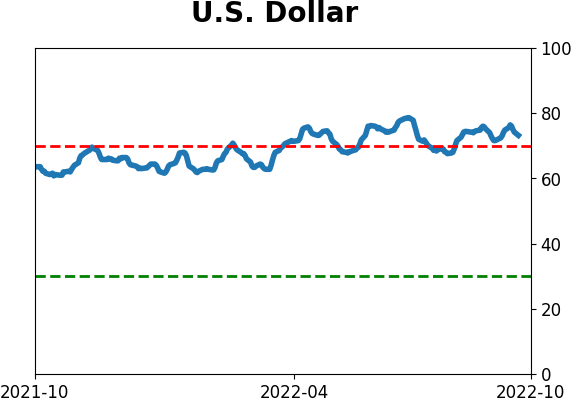
Currency ETF's - 5-Day Moving Average
|
|
|
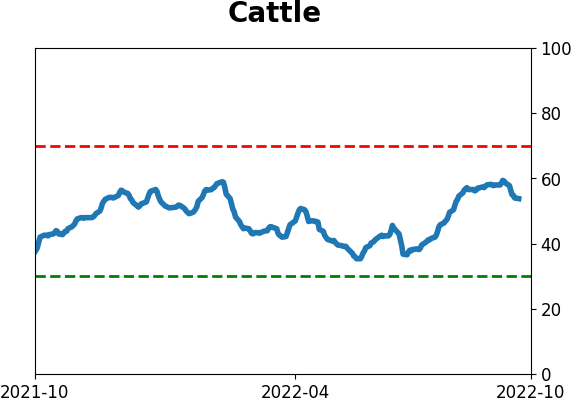
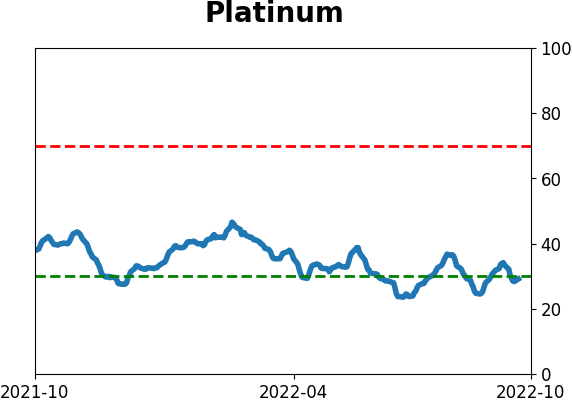
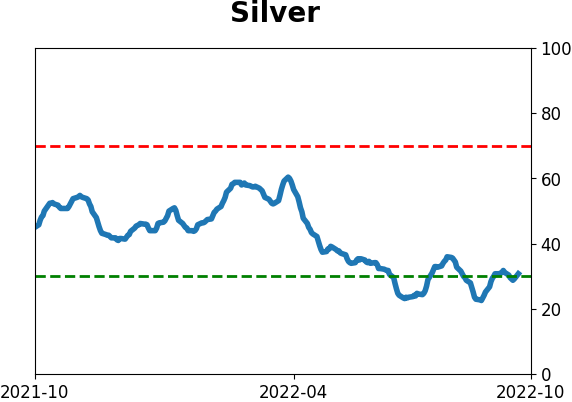
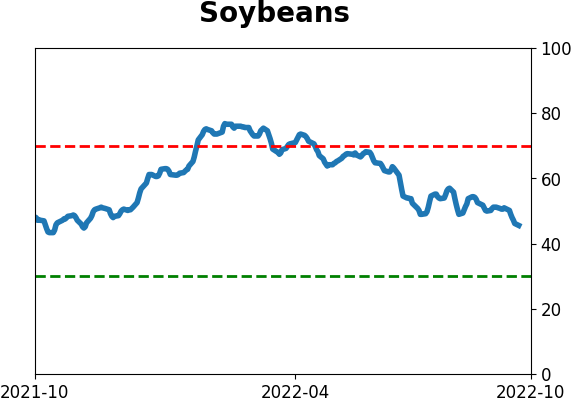
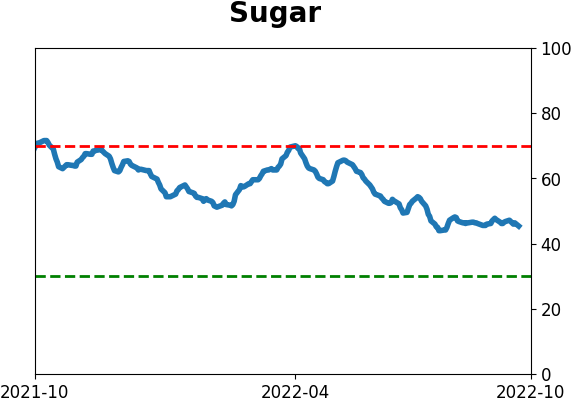
Commodity ETF's - 5-Day Moving Average
|
|