Headlines
|
|
Recent activity pulls bull market breadth down:
Over the past 50 days, the net number of advancing minus declining stocks on the S&P 500 has plunged to -25, one of the lowest in a decade. It is bad enough to pull total net breadth since the October bottom down to one of the weakest readings since 1928. Weak breadth during the first year of rallies preceded weaker forward returns.
|
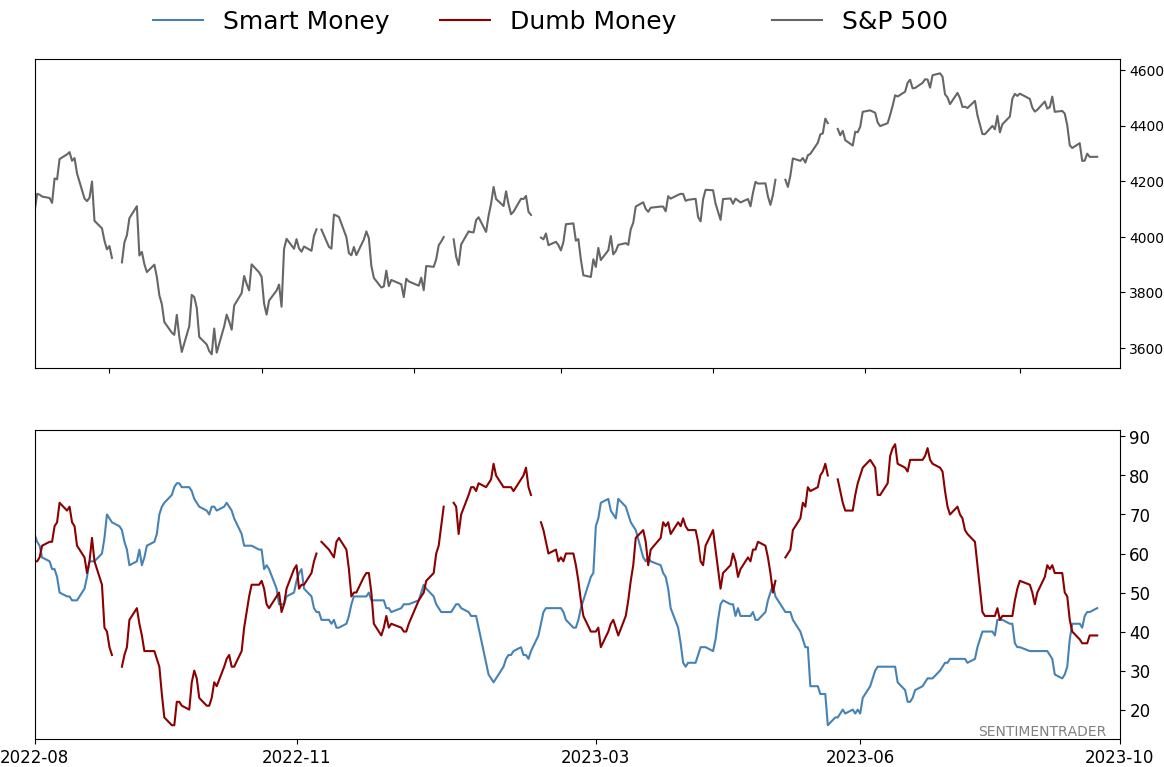
Smart / Dumb Money Confidence
|
Smart Money Confidence: 46%
Dumb Money Confidence: 39%
|
|
Risk Levels
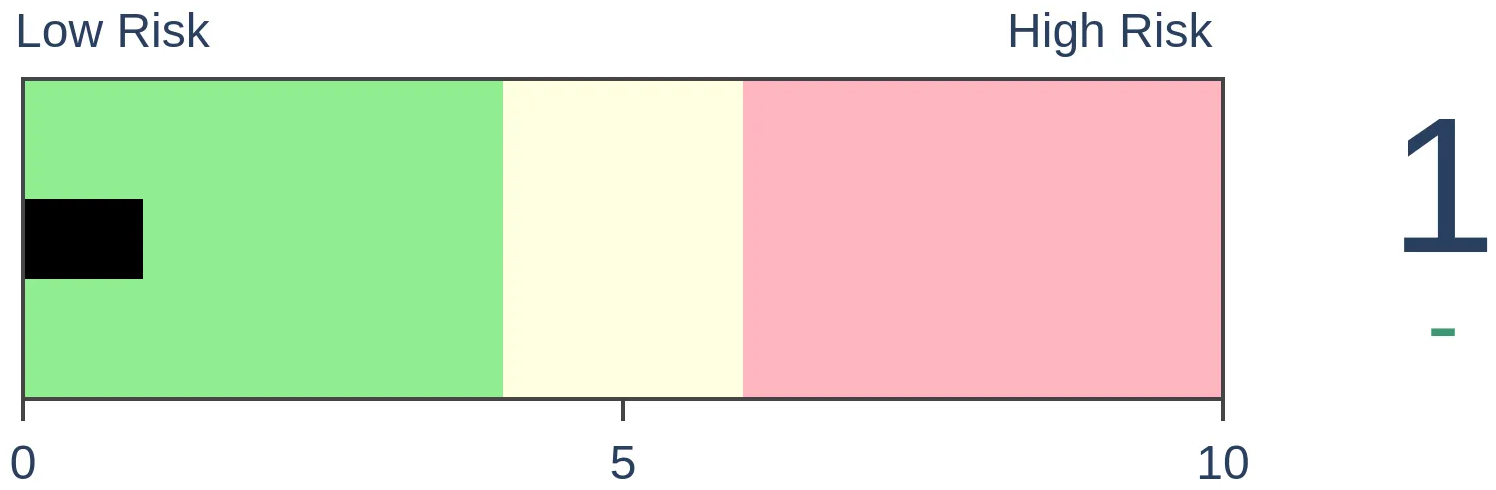
Stocks Short-Term

|
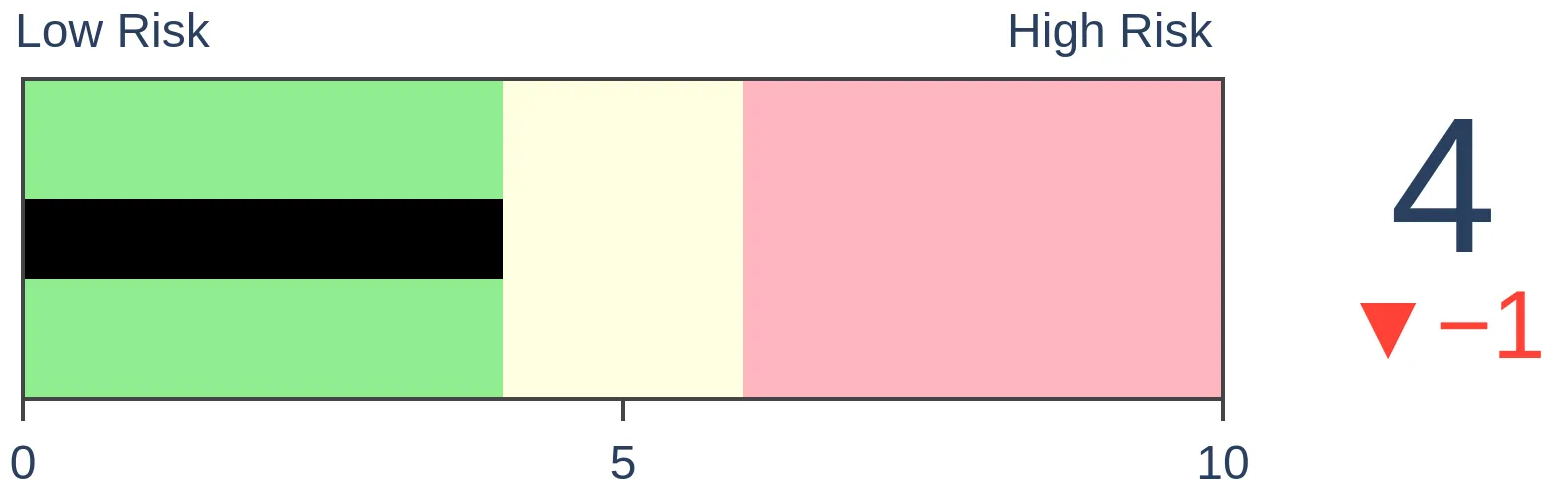
Stocks Medium-Term
|
|
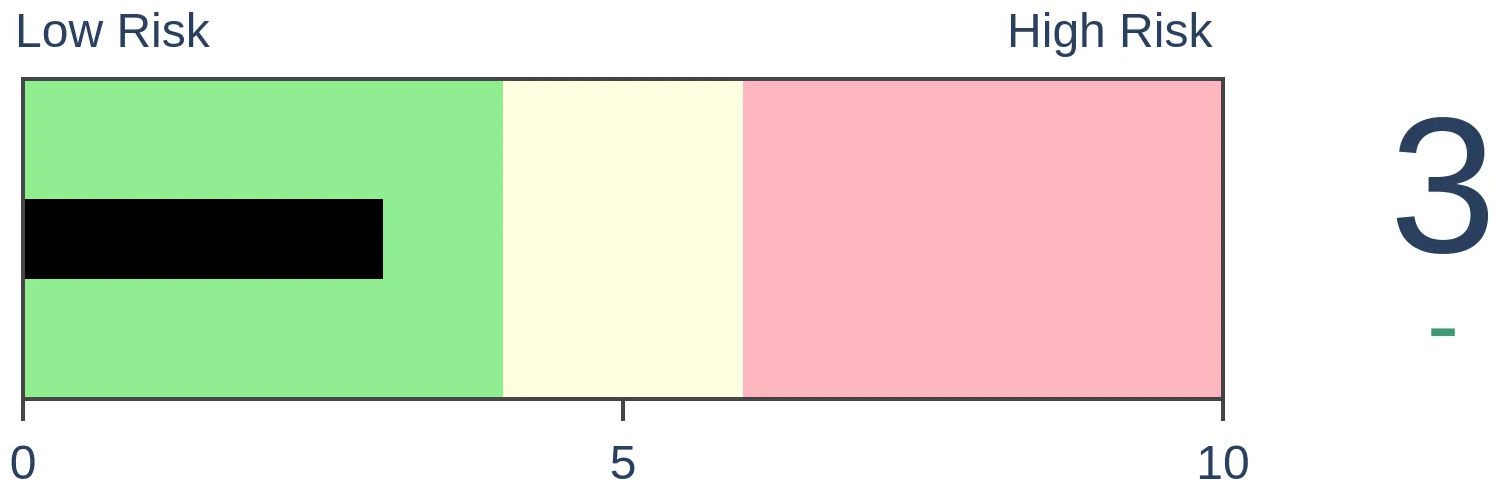
Bonds
|
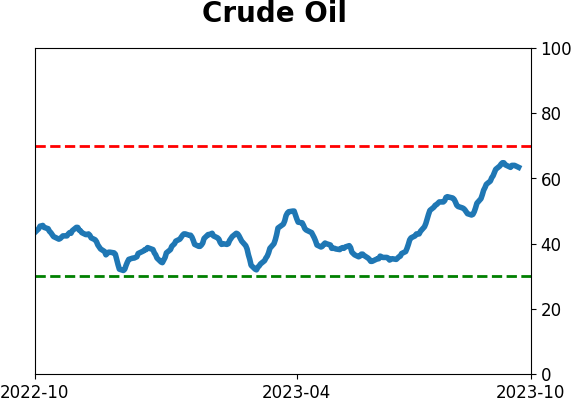
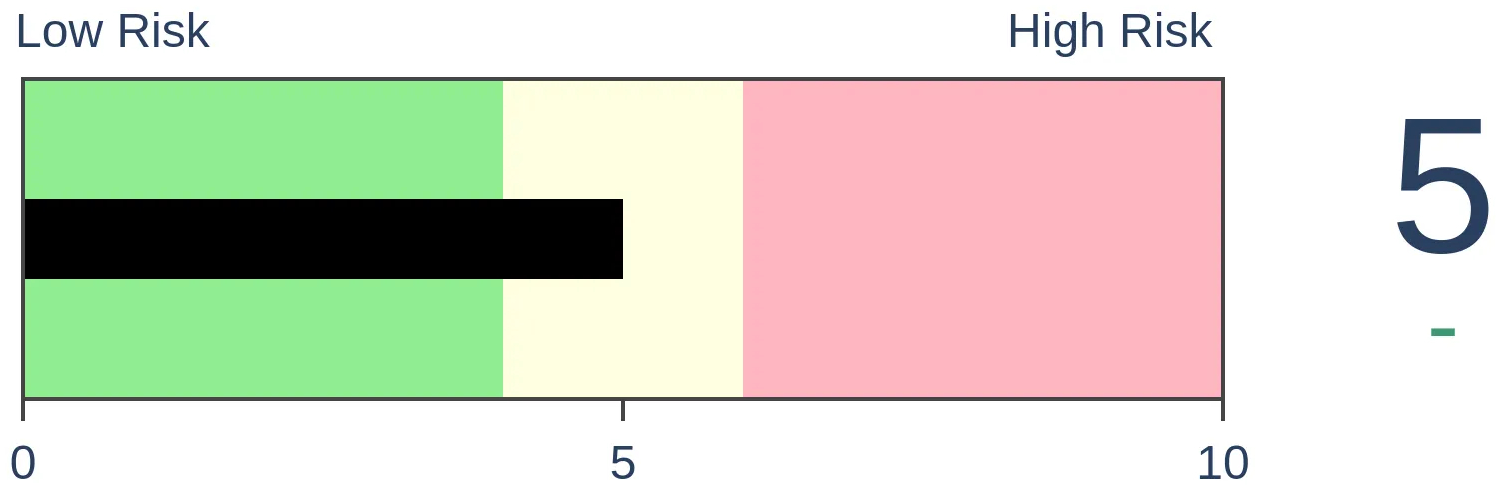
Crude Oil
|
|
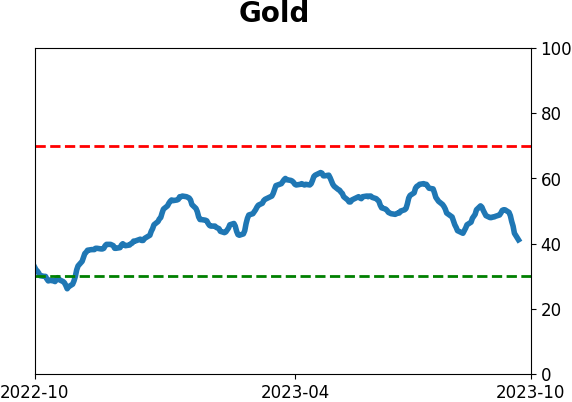
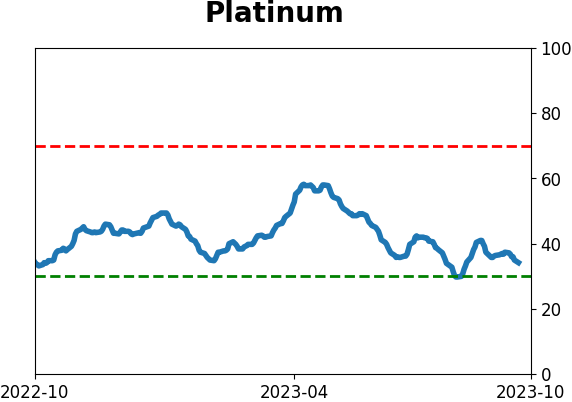
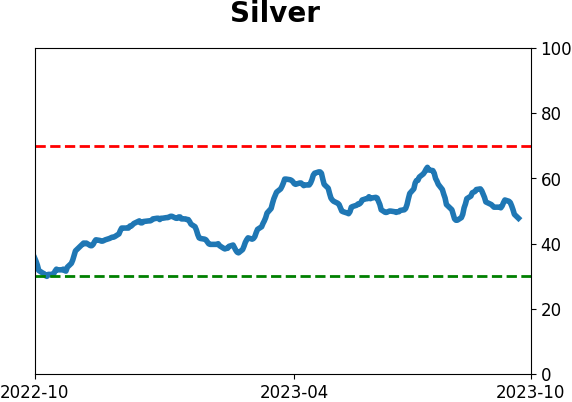
Gold
|
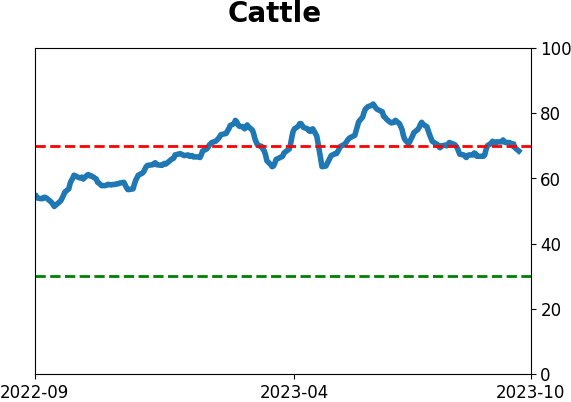
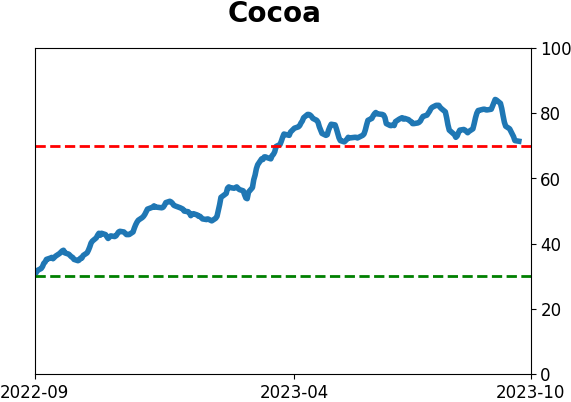
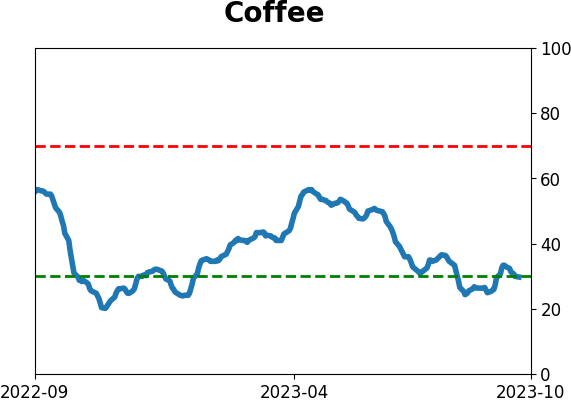
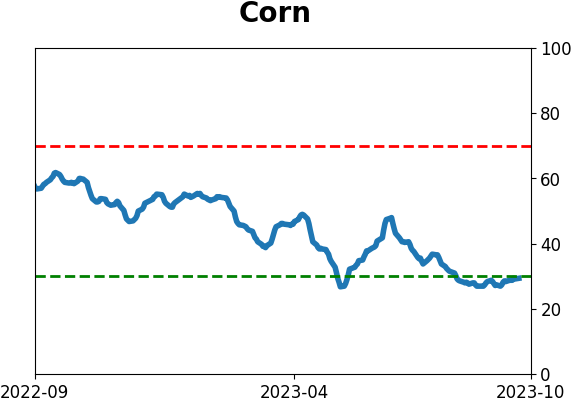
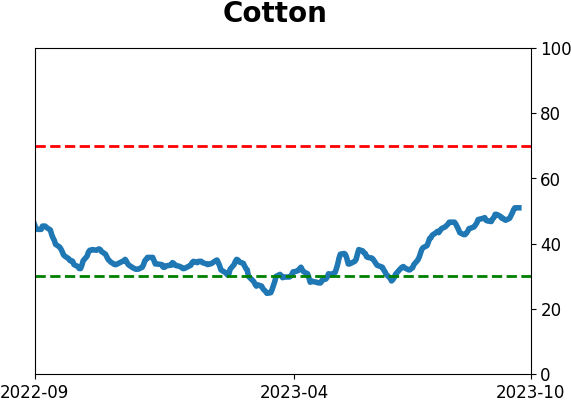
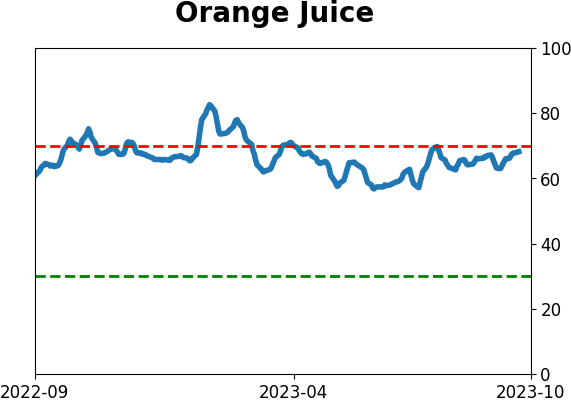
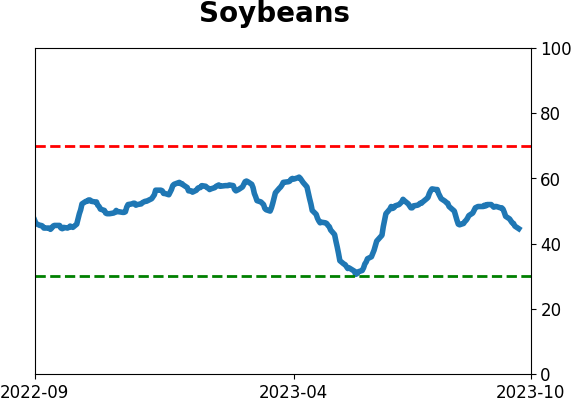
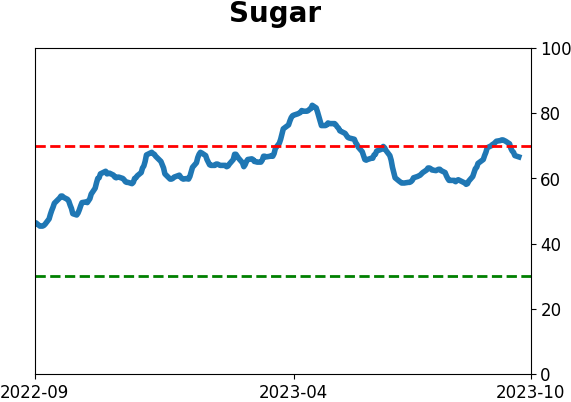
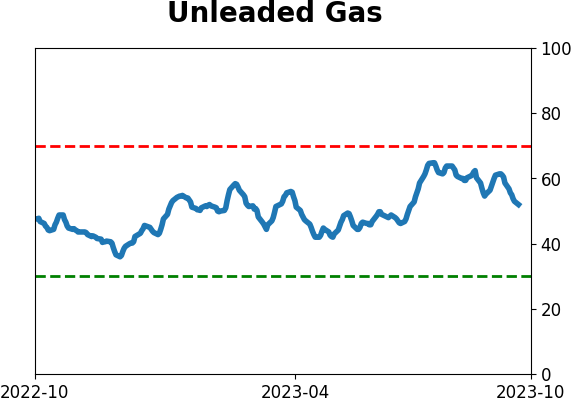
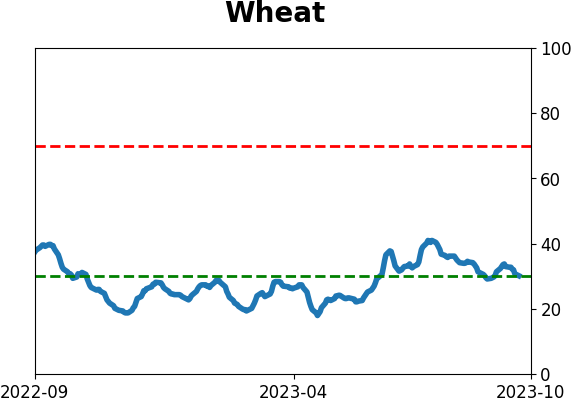
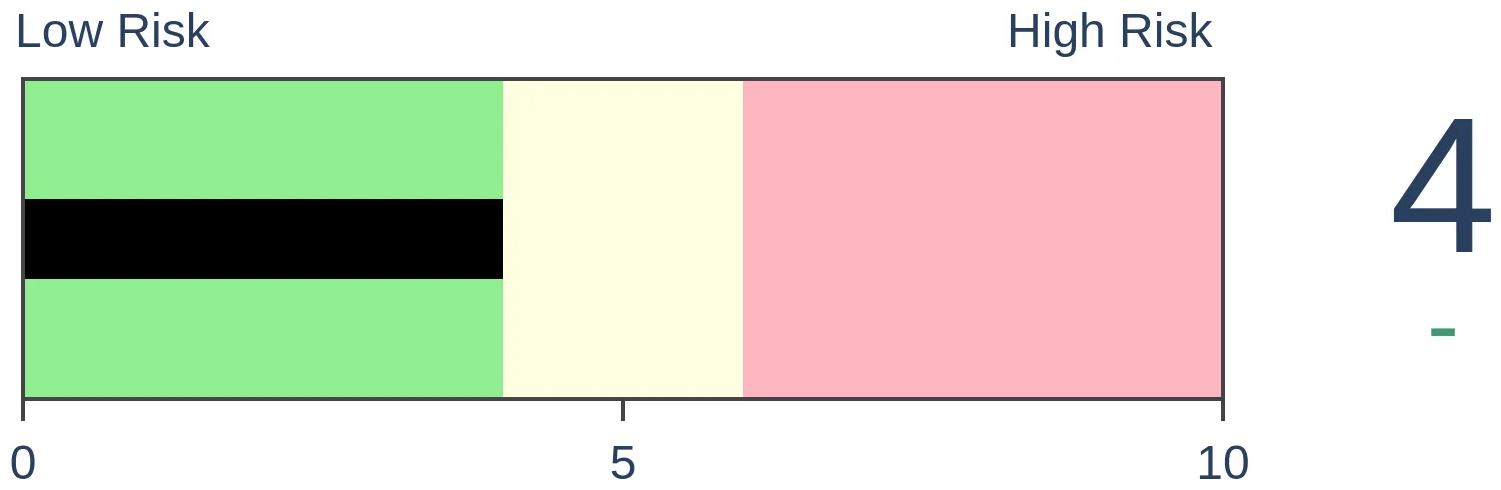
Agriculture
|
|
Research
By Jason Goepfert
BOTTOM LINE
Over the past 50 days, the net number of advancing minus declining stocks on the S&P 500 has plunged to -25, one of the lowest in a decade. It is bad enough to pull total net breadth since the October bottom down to one of the weakest readings since 1928. Weak breadth during the first year of rallies preceded weaker forward returns.
FORECAST / TIMEFRAME
None
|
Key points:
- Over the past 50 days, breadth in the S&P 500 has been bad enough to trigger an extreme
- It has been enough to pull long-term measures lower, including total net breadth, since the October bottom
- Weak breadth in the 240 days following a low preceded lower returns in the months ahead
The last two months have wiped away a lot of breadth gains
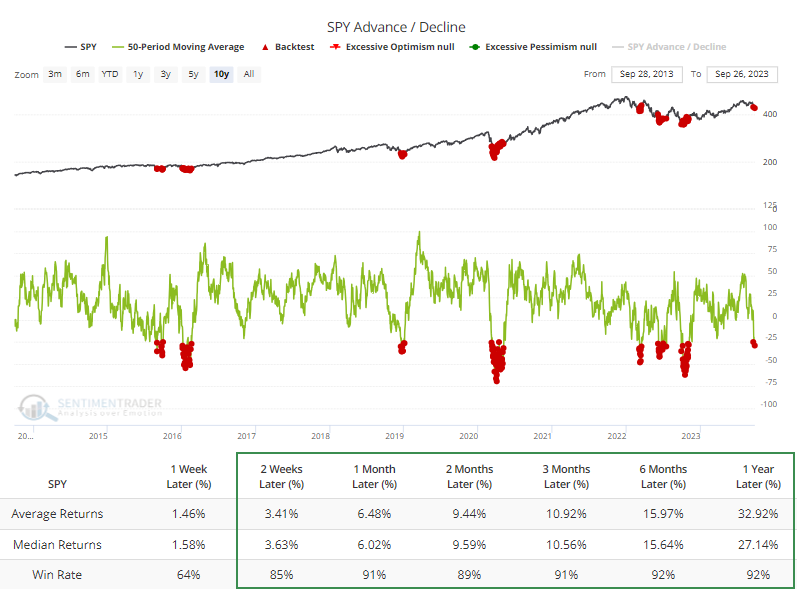
It's been a rough couple of months for the average stock. Over the past 50 days, an average of 25 more stocks in the S&P 500 have declined than advanced. That's one of the most extreme readings in the past decade.
If the last ten years are any indication, the Backtest Engine shows abnormally high returns across virtually all time frames.
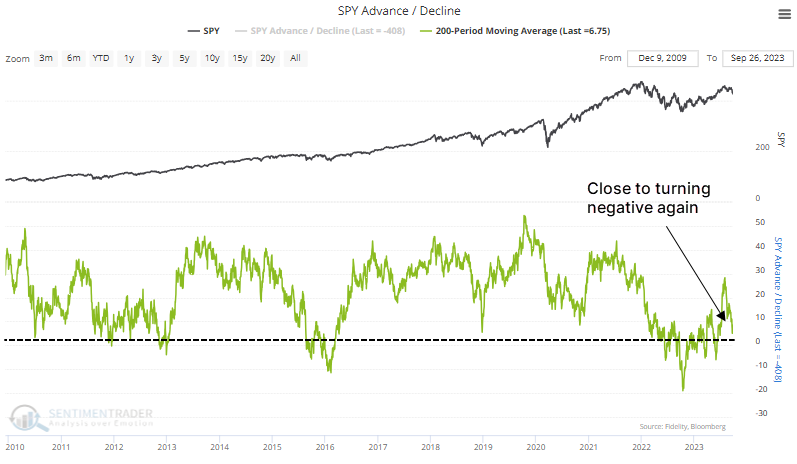
It's not a lot better over a longer time frame. Over the past 200 sessions, the S&P 500's breadth is almost flat. That's taking an average of each day's net number of advancing minus declining stocks.
During the past decade, the figure has been in positive territory most of the time, but the last couple of months have knocked it down severely, and it's on the cusp of turning negative.
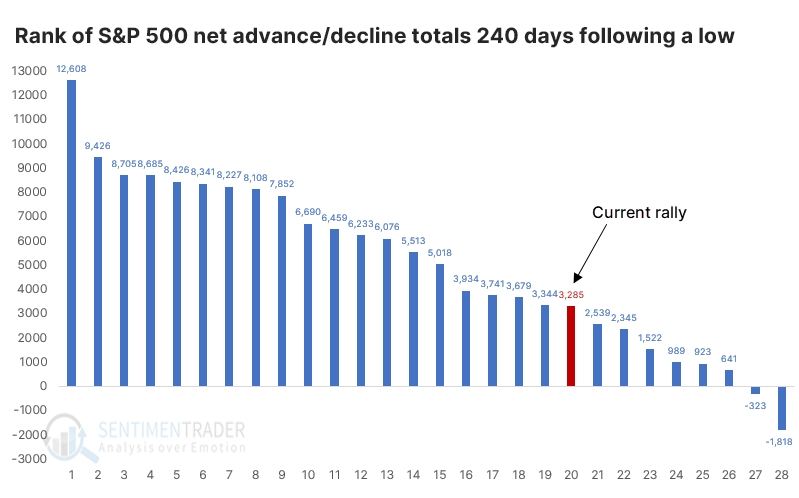
It's been 240 days since the S&P's bottom last October, so let's extend our time frame a bit longer. There has been an overall total of 2,943 more stocks rising than declining during this stretch. That sounds impressive, but it's not really; it ranks in the bottom half of all bottoms since 1928.
The chart below ranks the net number of advancing minus declining stocks in the S&P during the 240 days following a 52-week low. There were 28 of these bottoms, and the current one is on the weaker end.
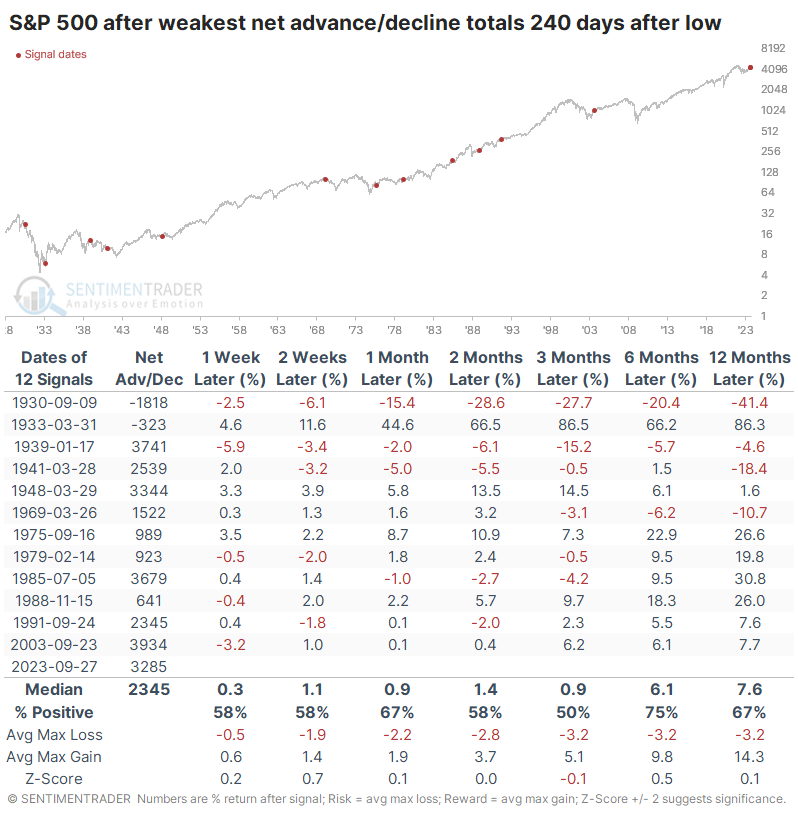
When breadth was weak in the first 240 days, forward returns were less impressive
The S&P's returns after the weakest rallies were unimpressive. While it rallied across all time frames most of the time, and its median returns were mostly slightly above random, it was uninspiring. There were a couple of significant declines, though those were in earlier decades. Over the past 40 years, the S&P showed a gain every time over the next six and twelve months.
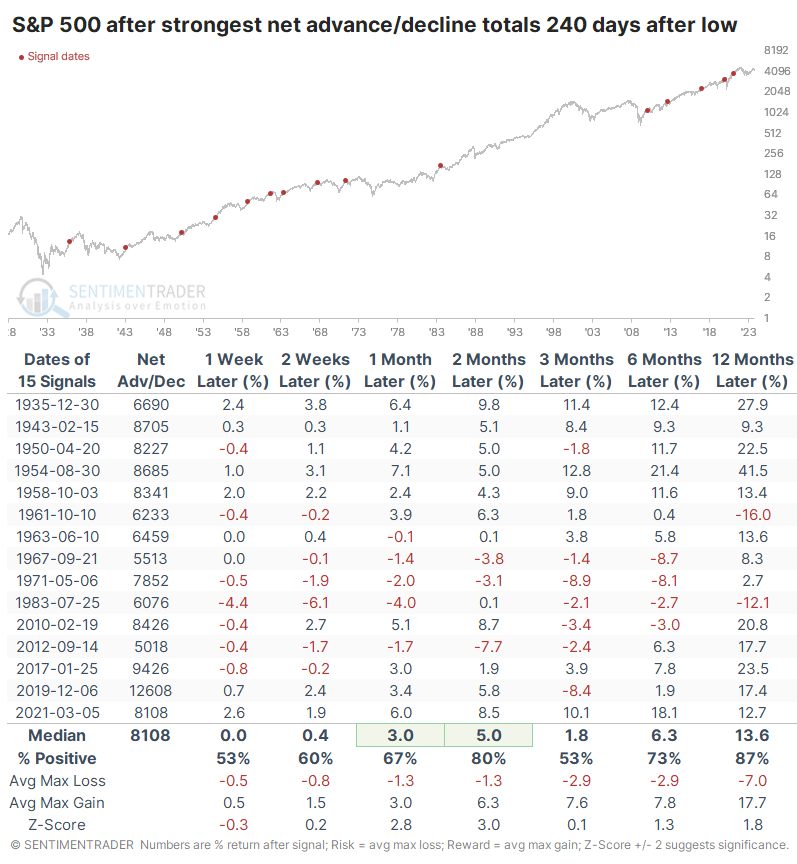
Compare that to the strongest rallies, when many more stocks tended to rally more consistently. The average net number of advancing minus declining stocks was much stronger during these rallies and preceded more robust returns.
The S&P rose more strongly and more consistently, with less risk. So, there did seem to be some benefit to seeing more consistently stronger breadth numbers than we've seen during the first 240 days following the bottom.
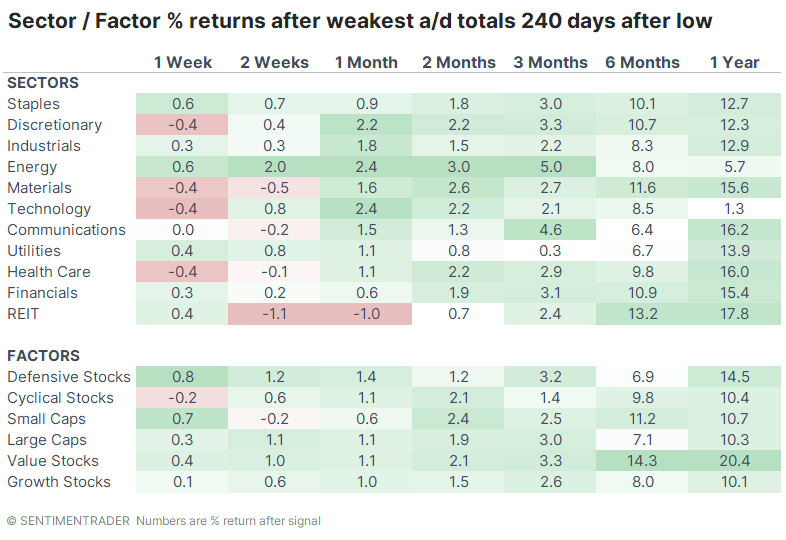
Value stocks tended to show the strongest returns over the next 6-12 months following the weakest rallies. The factor rose after 11 out of 12 signals during the next six months.
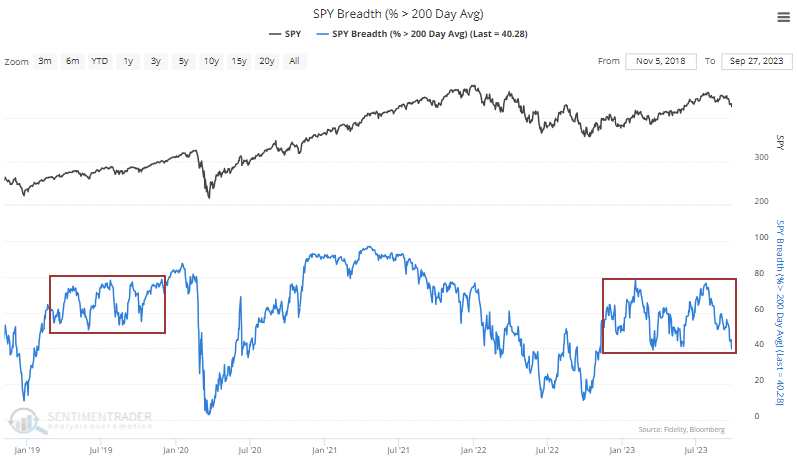
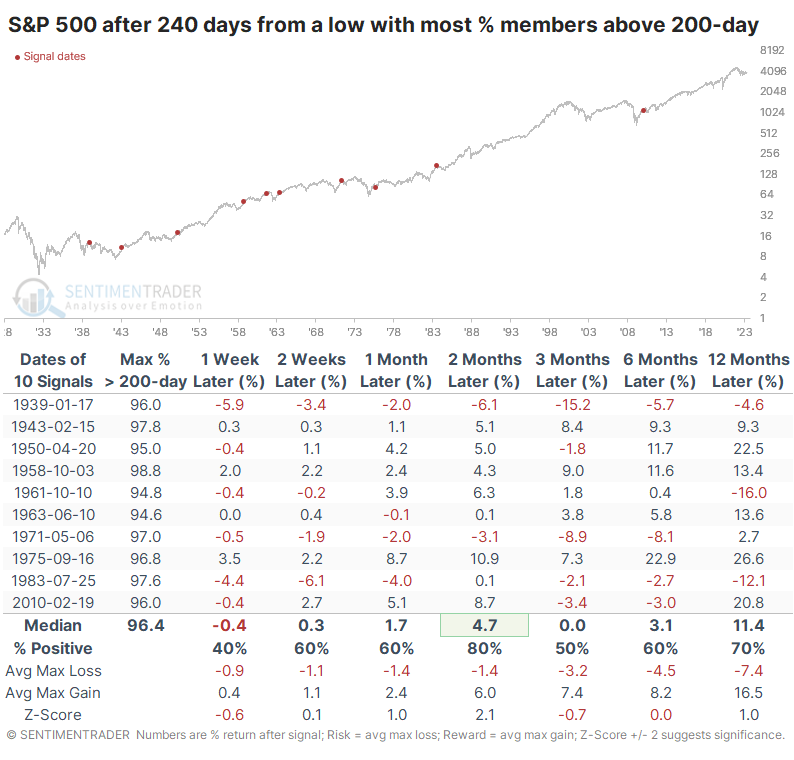
There is also some concern that within the S&P 500, we haven't truly seen a surge in the percentage of stocks that managed to climb above their 200-day moving averages. At no point during the first 240 days of the rally did more than 80% of stocks close above their long-term averages.
This is distinctly different from the 2020-21 rally but somewhat similar to the 2019 one.
The table below shows the S&P's future returns when it went 240 days past a low, with the fewest members climbing above their 200-day averages.
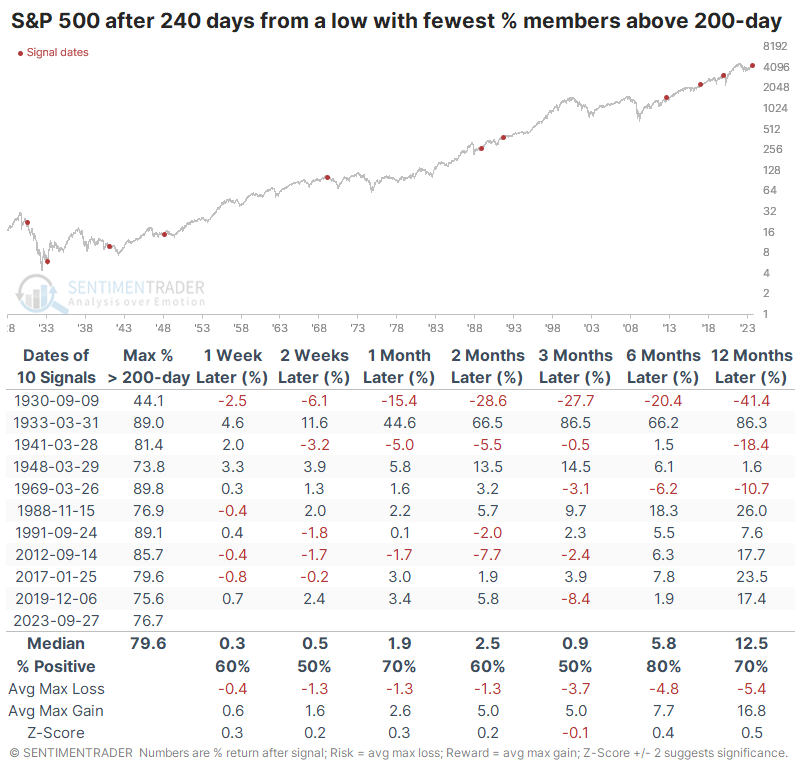
Once again, the returns were mostly positive but not all that inspiring. However, they were mostly better this time than after those rallies when almost all stocks exceeded their averages.
What the research tells us...
In the first months following the October low, we had multiple opportunities to show how aggressive buyers were in acquiring stocks. That persisted into January and even April for some indicators. Since then, it has slowed markedly and turned downright poor starting in late July.
While that doesn't necessarily cancel out all the positives built up over the prior eleven months, it makes things dicier moving forward. There are some indications that it has been weak enough to be considered oversold, but bulls have to show that they will buy into those conditions.
Indicators at Extremes
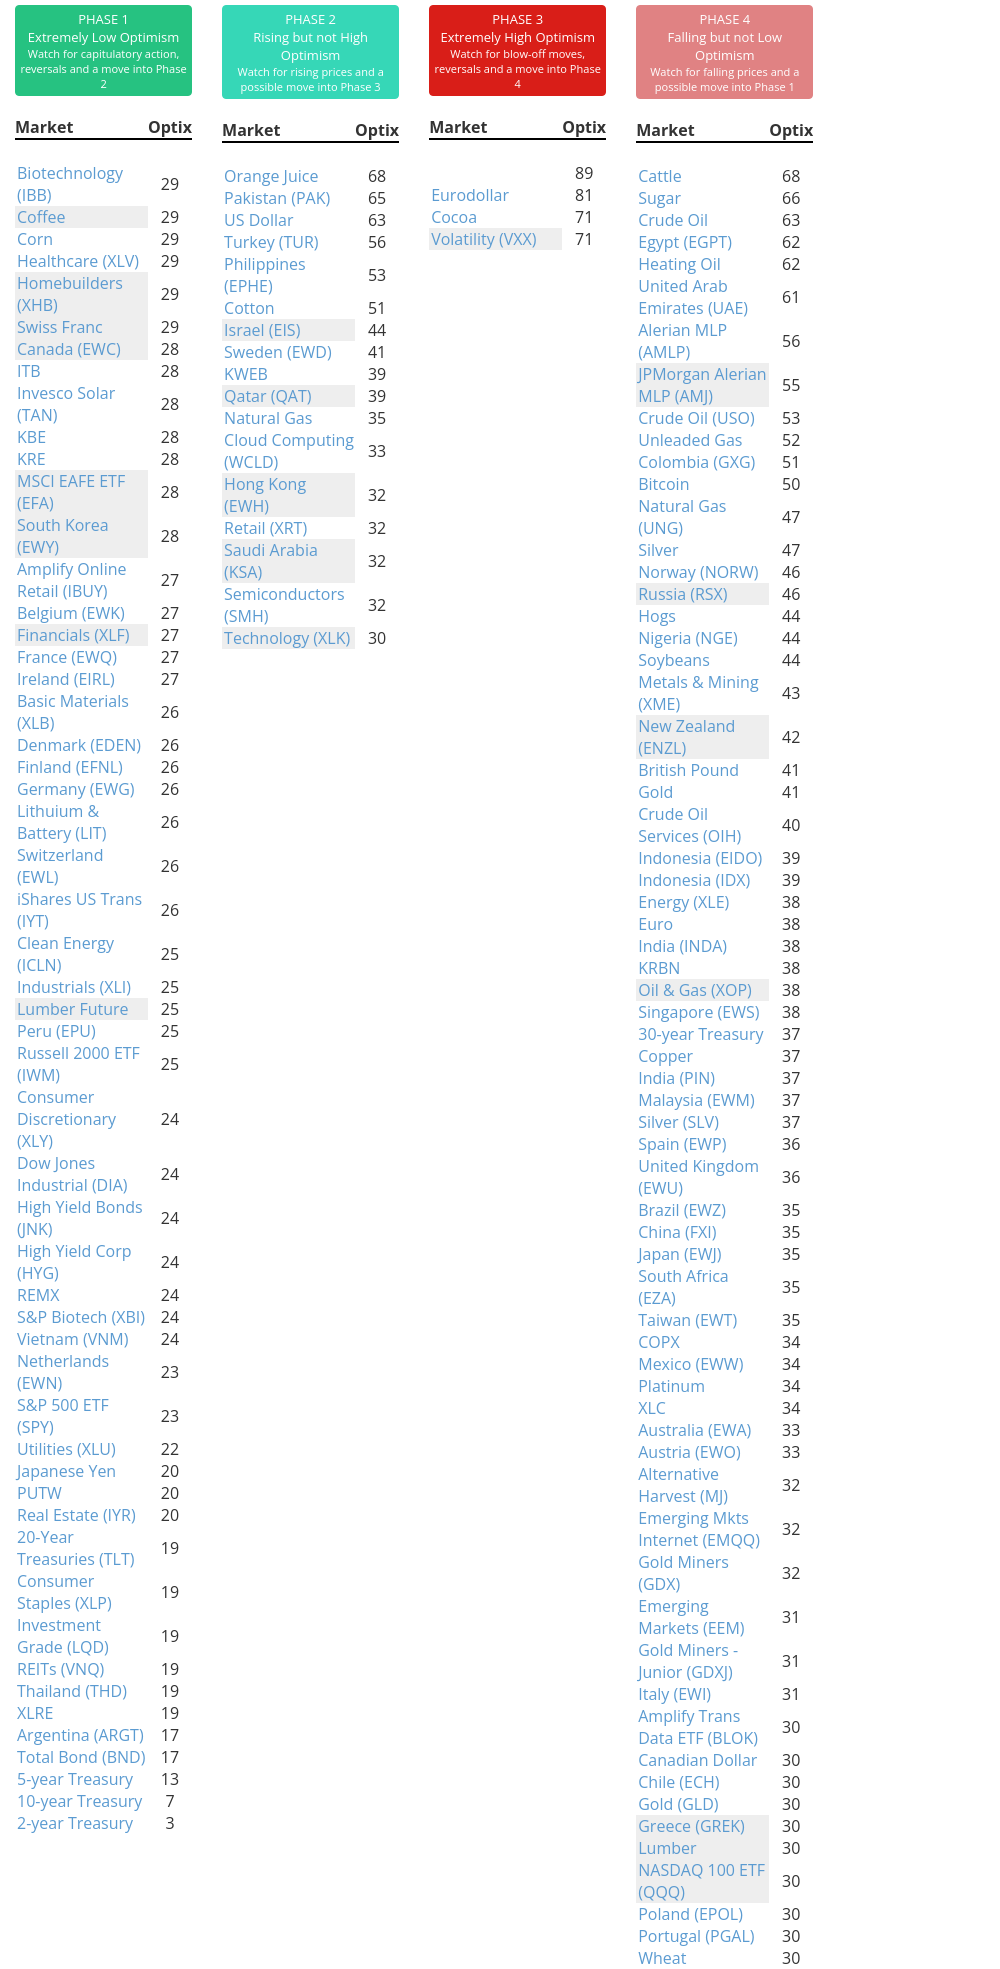
Phase Table
Ranks
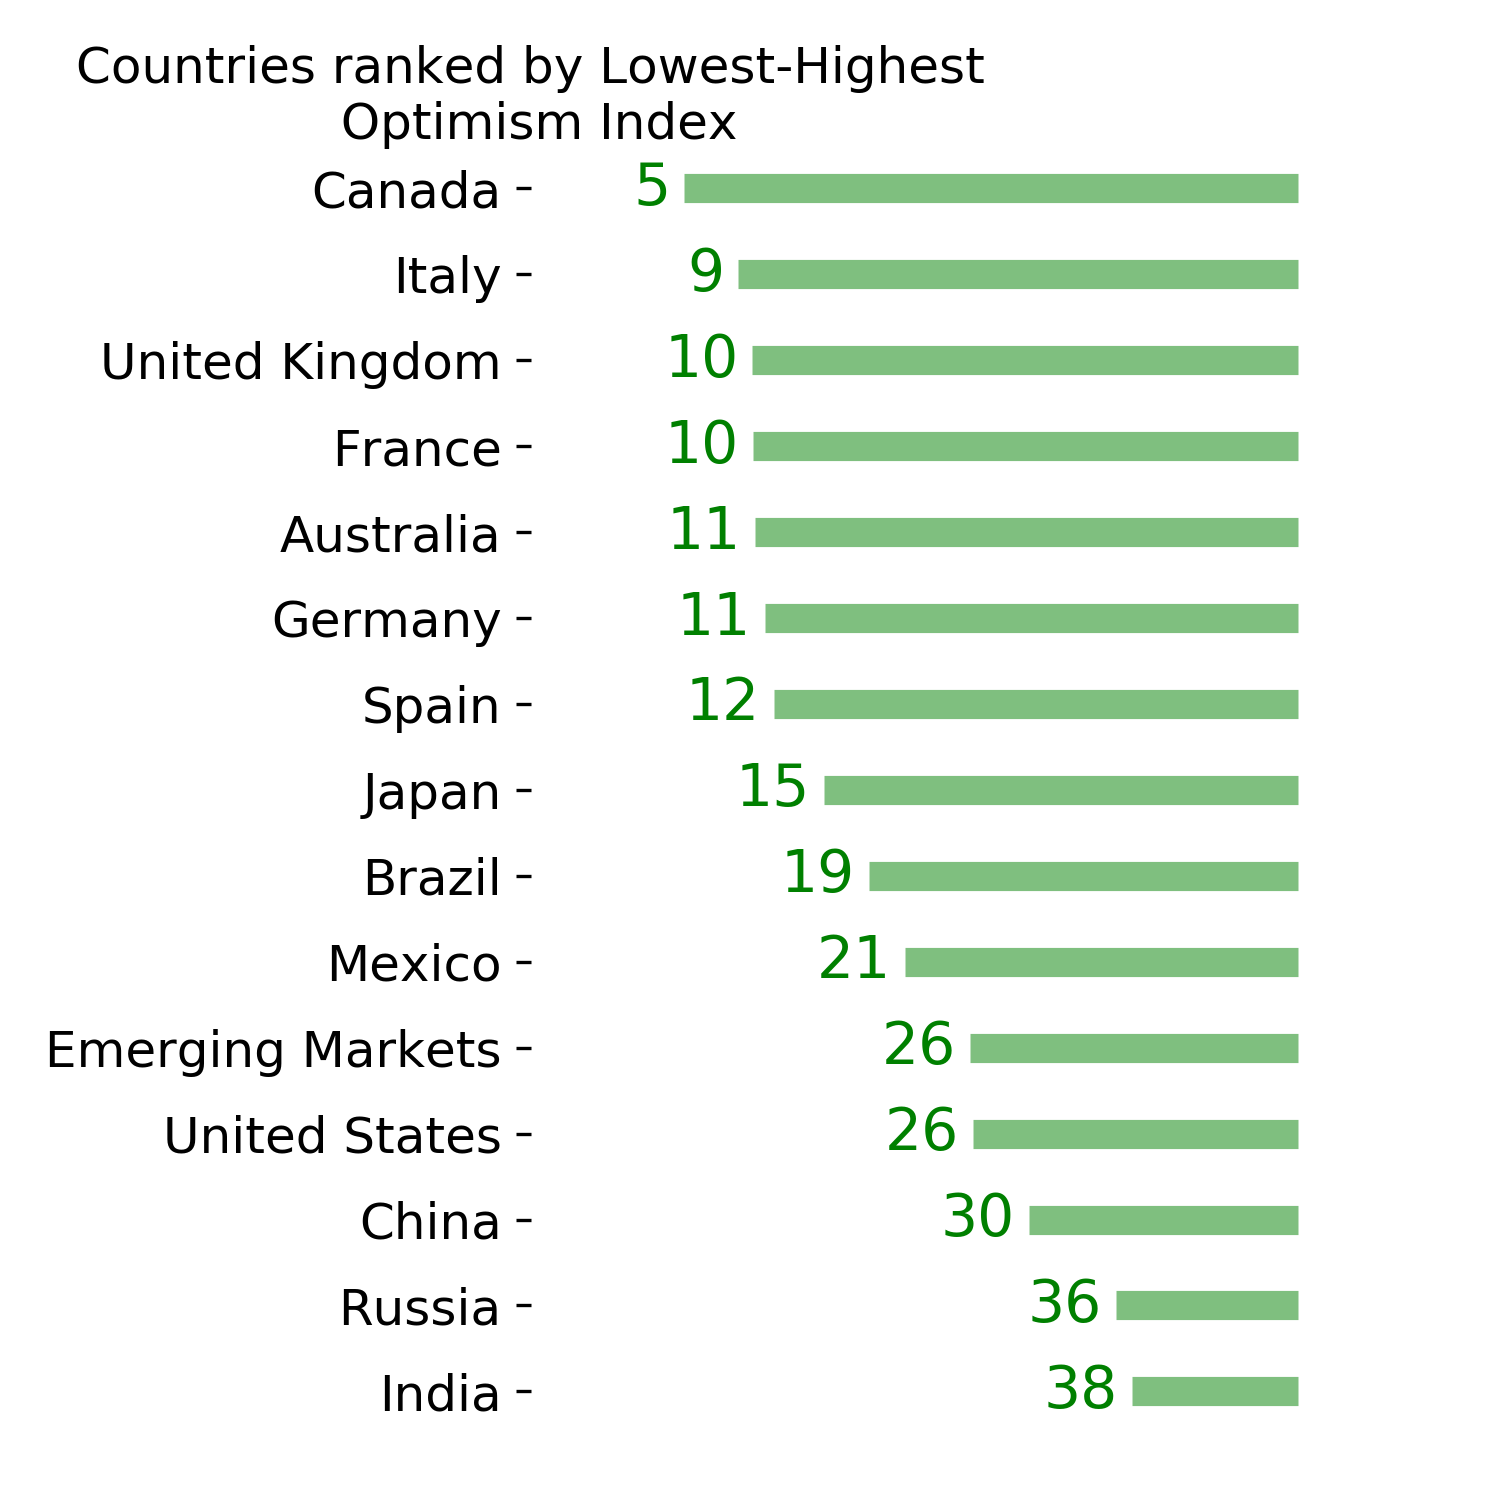
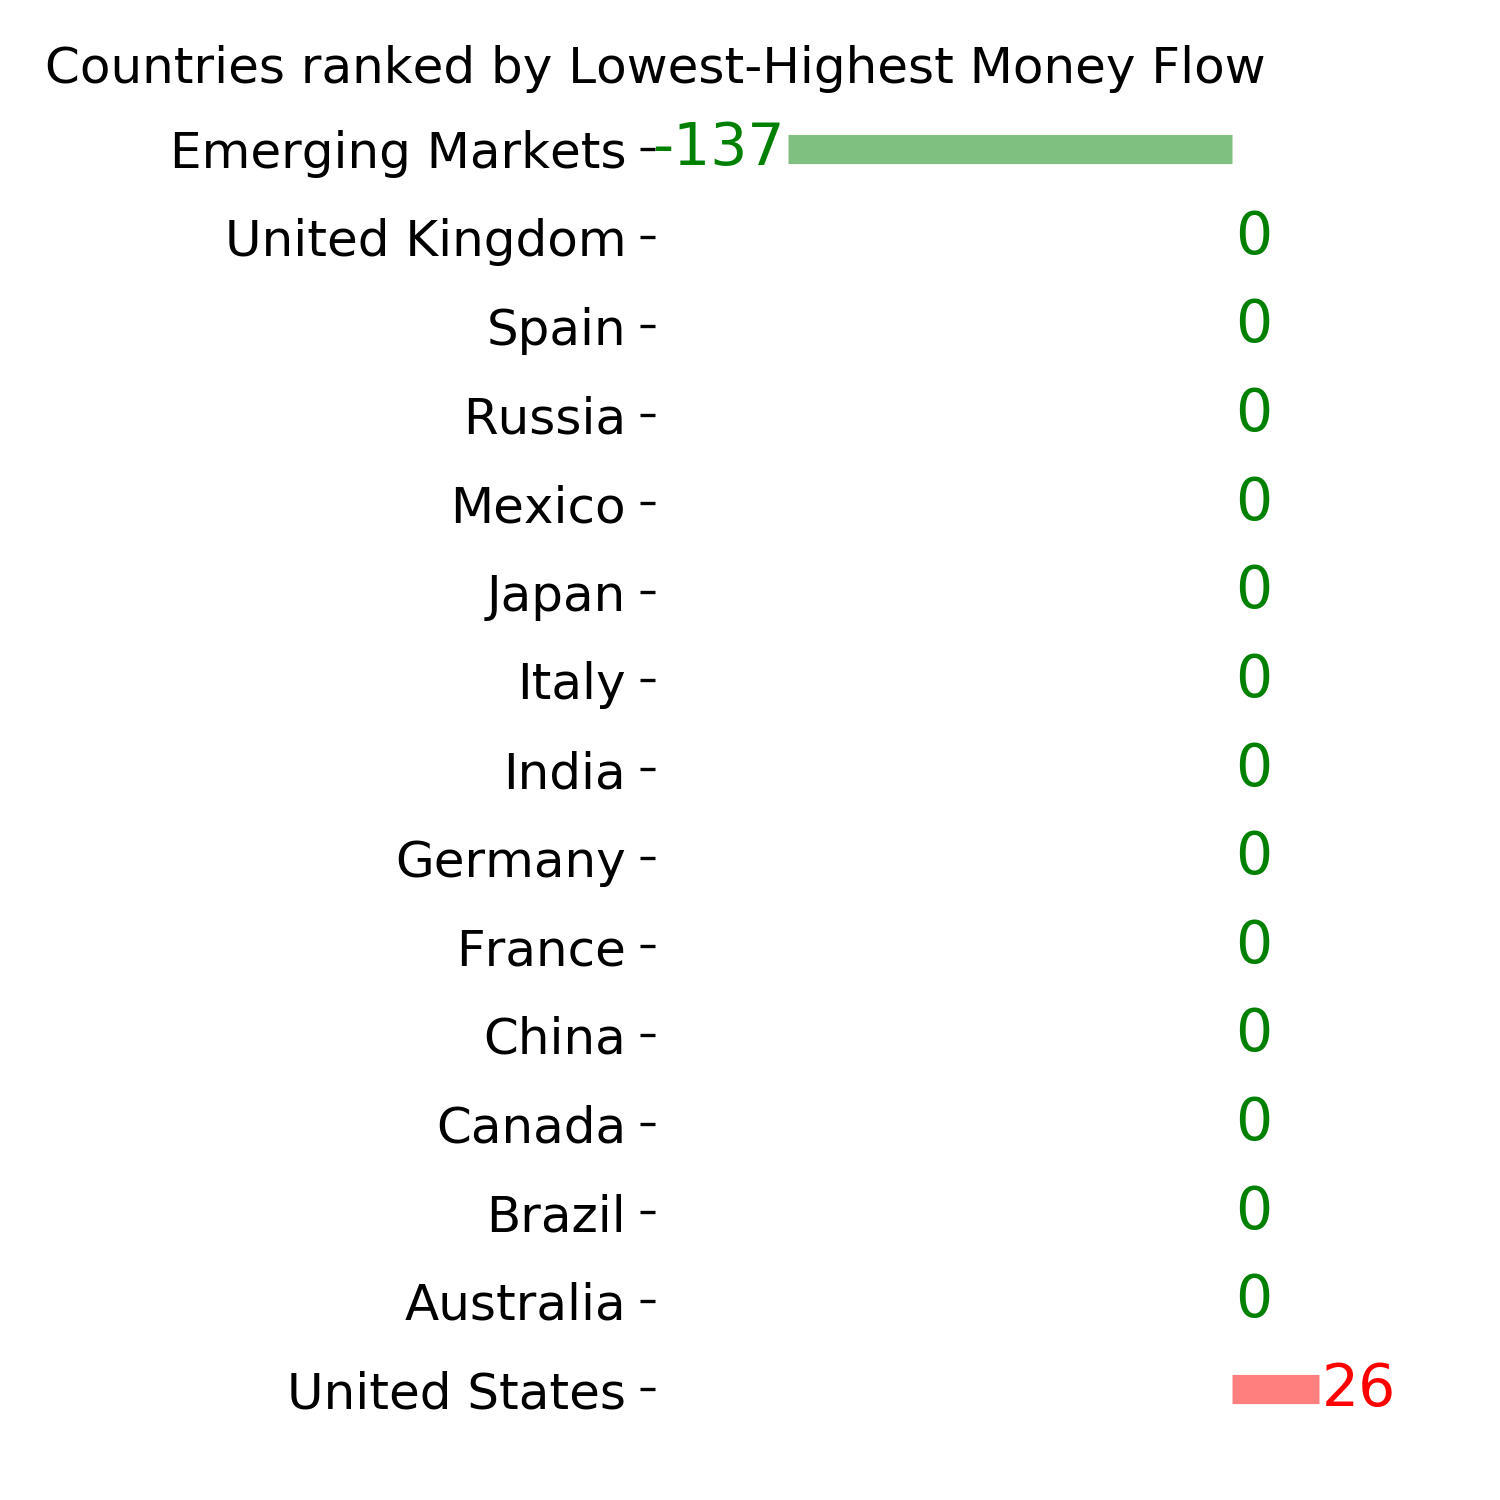
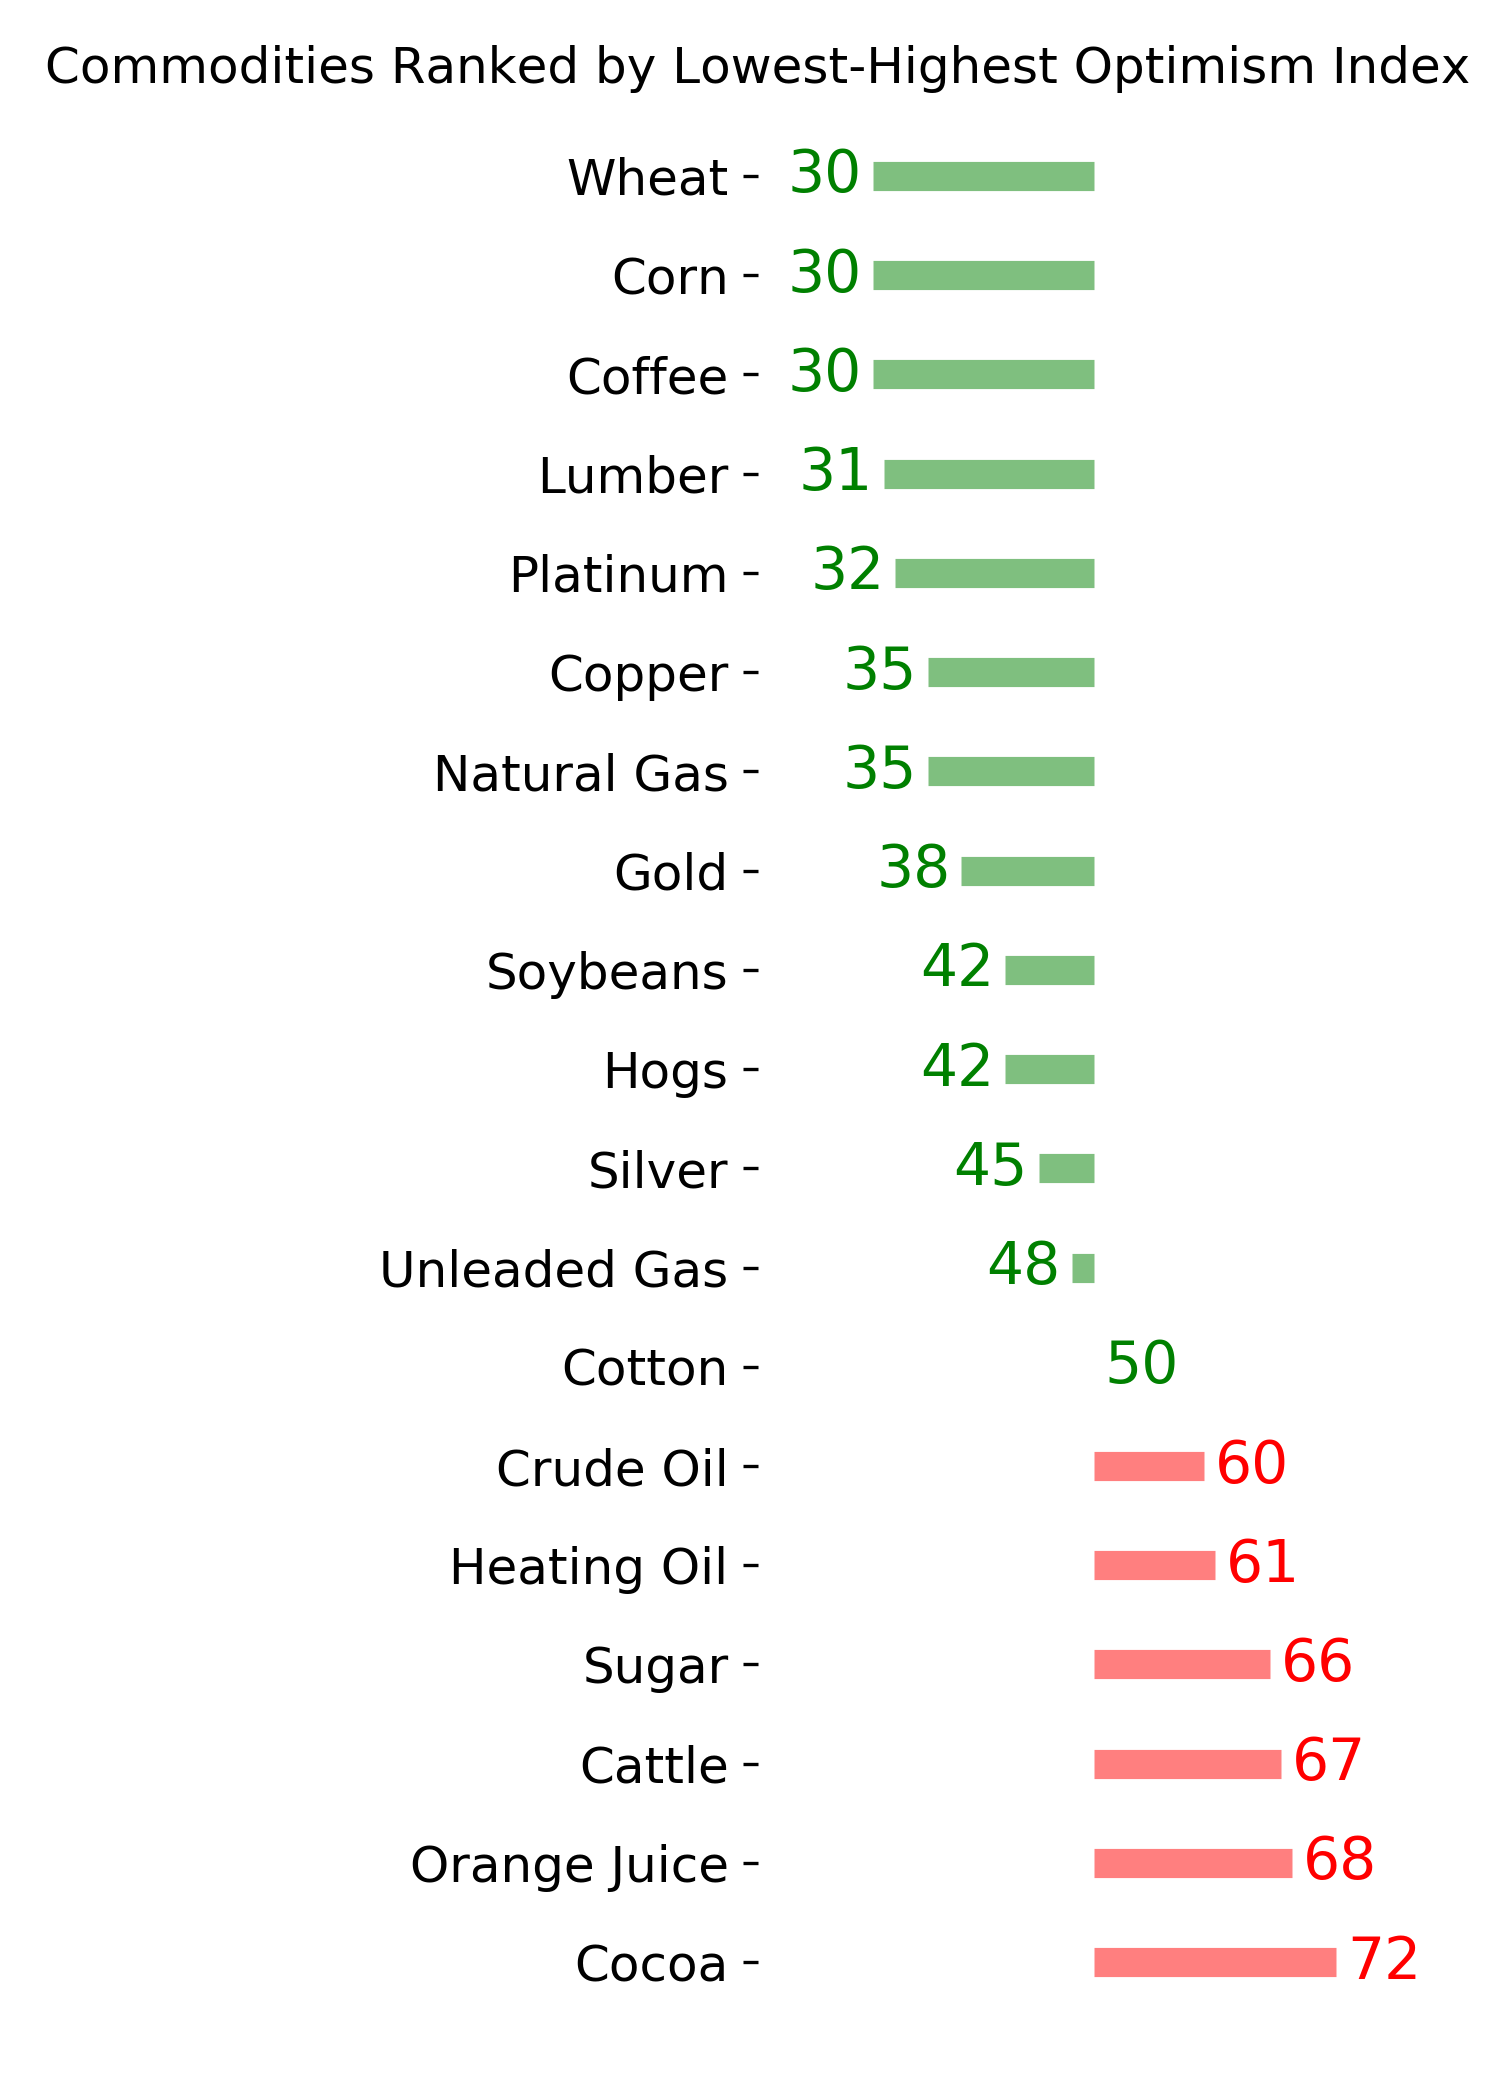
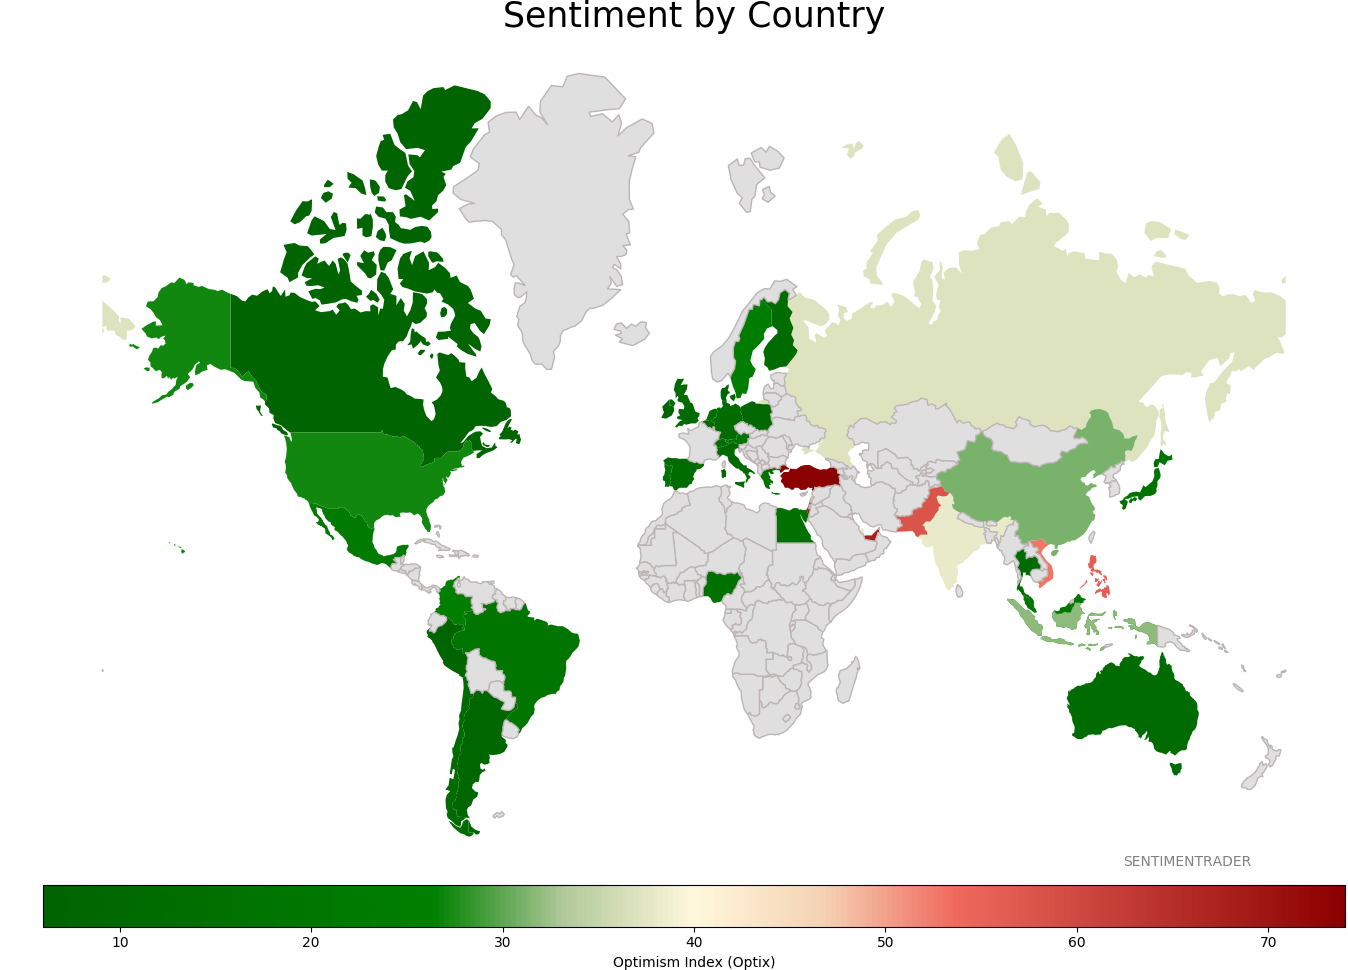
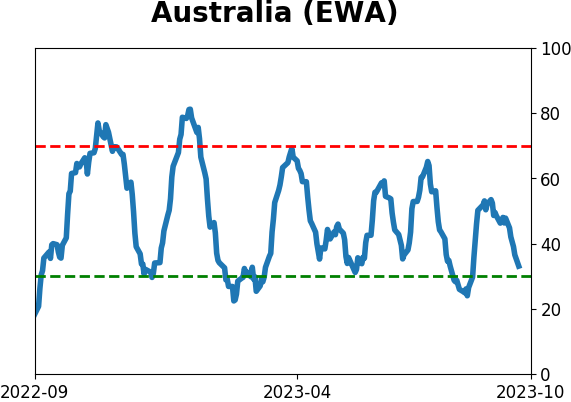
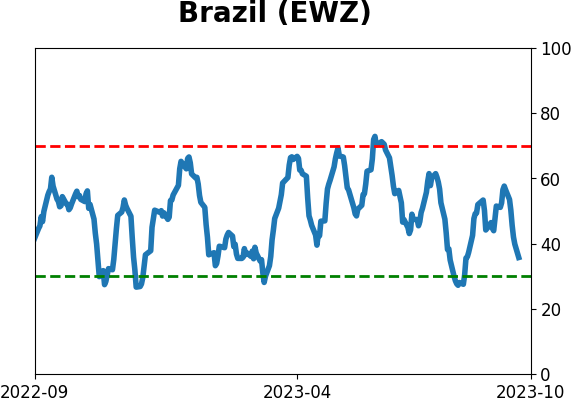
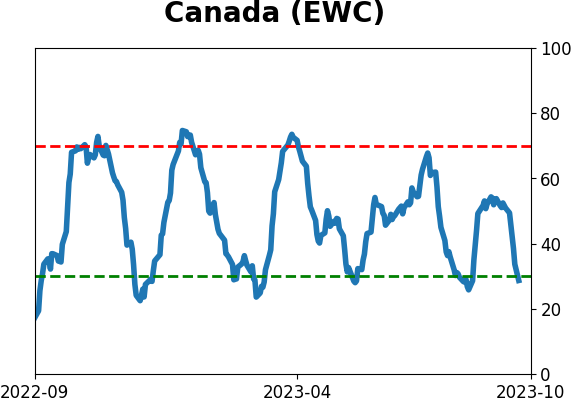
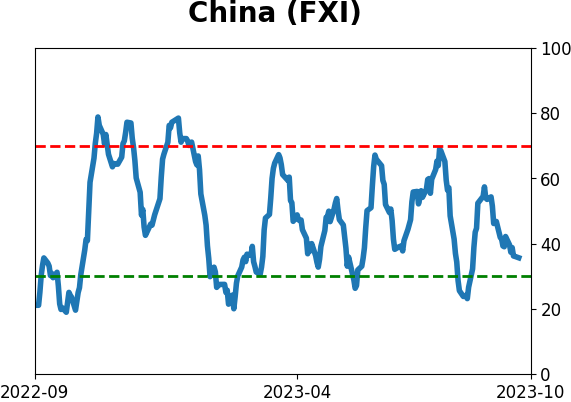
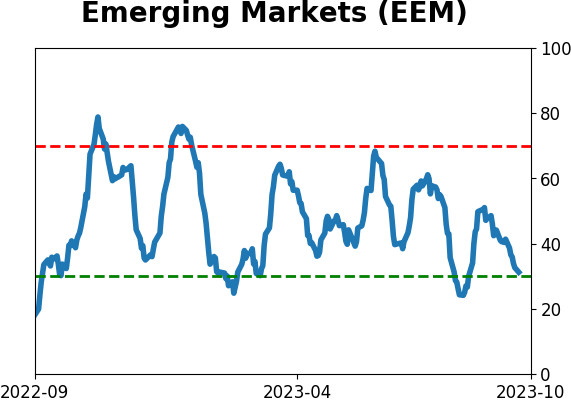
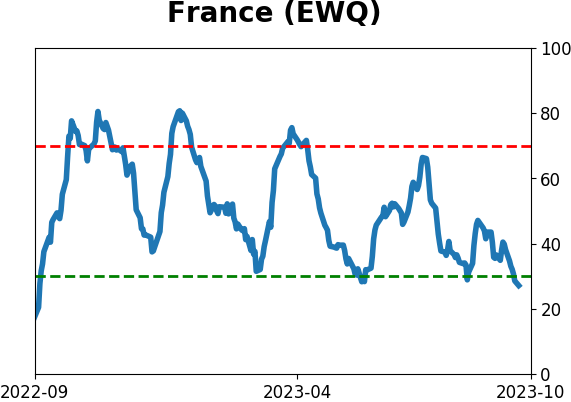
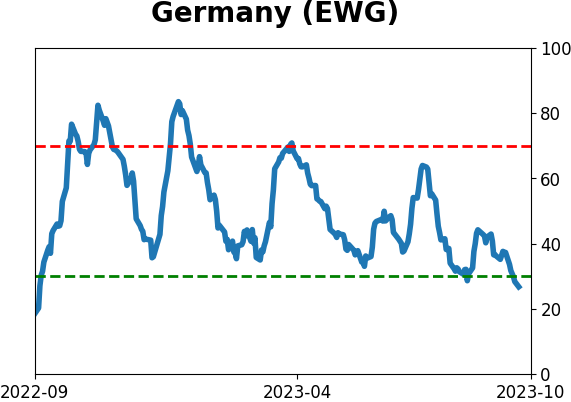
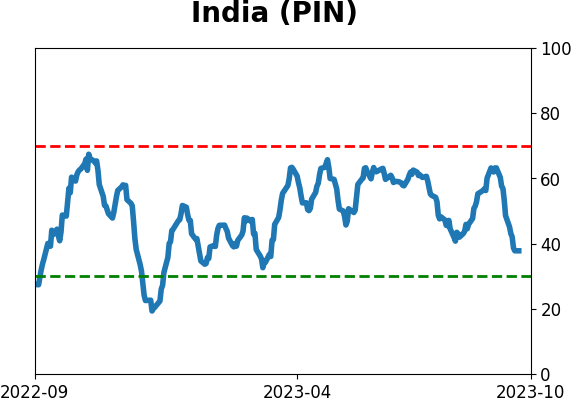
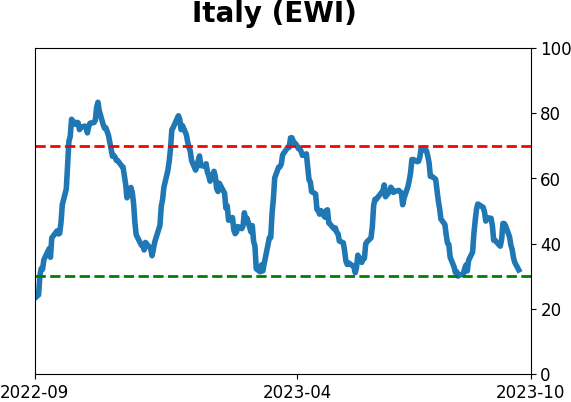
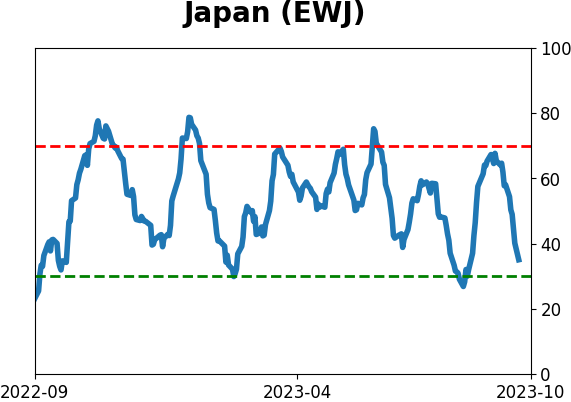
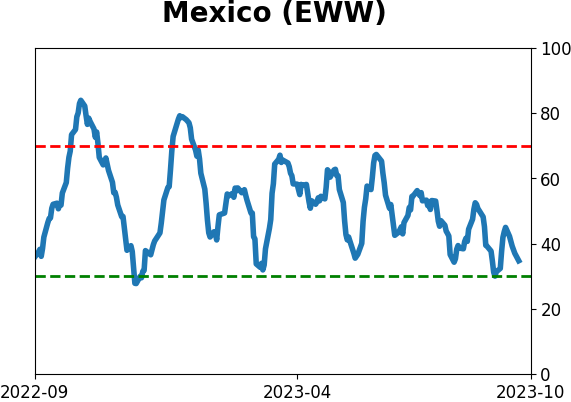
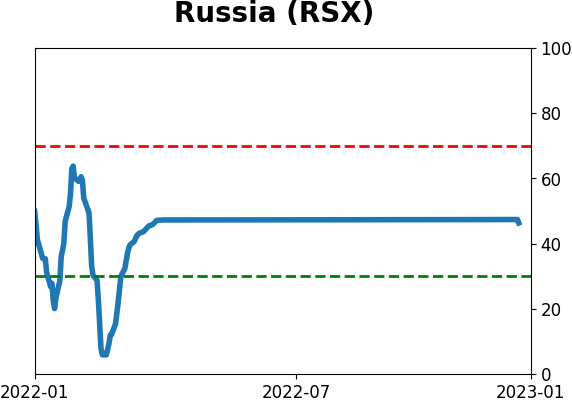
Sentiment Around The World
Optimism Index Thumbnails
|
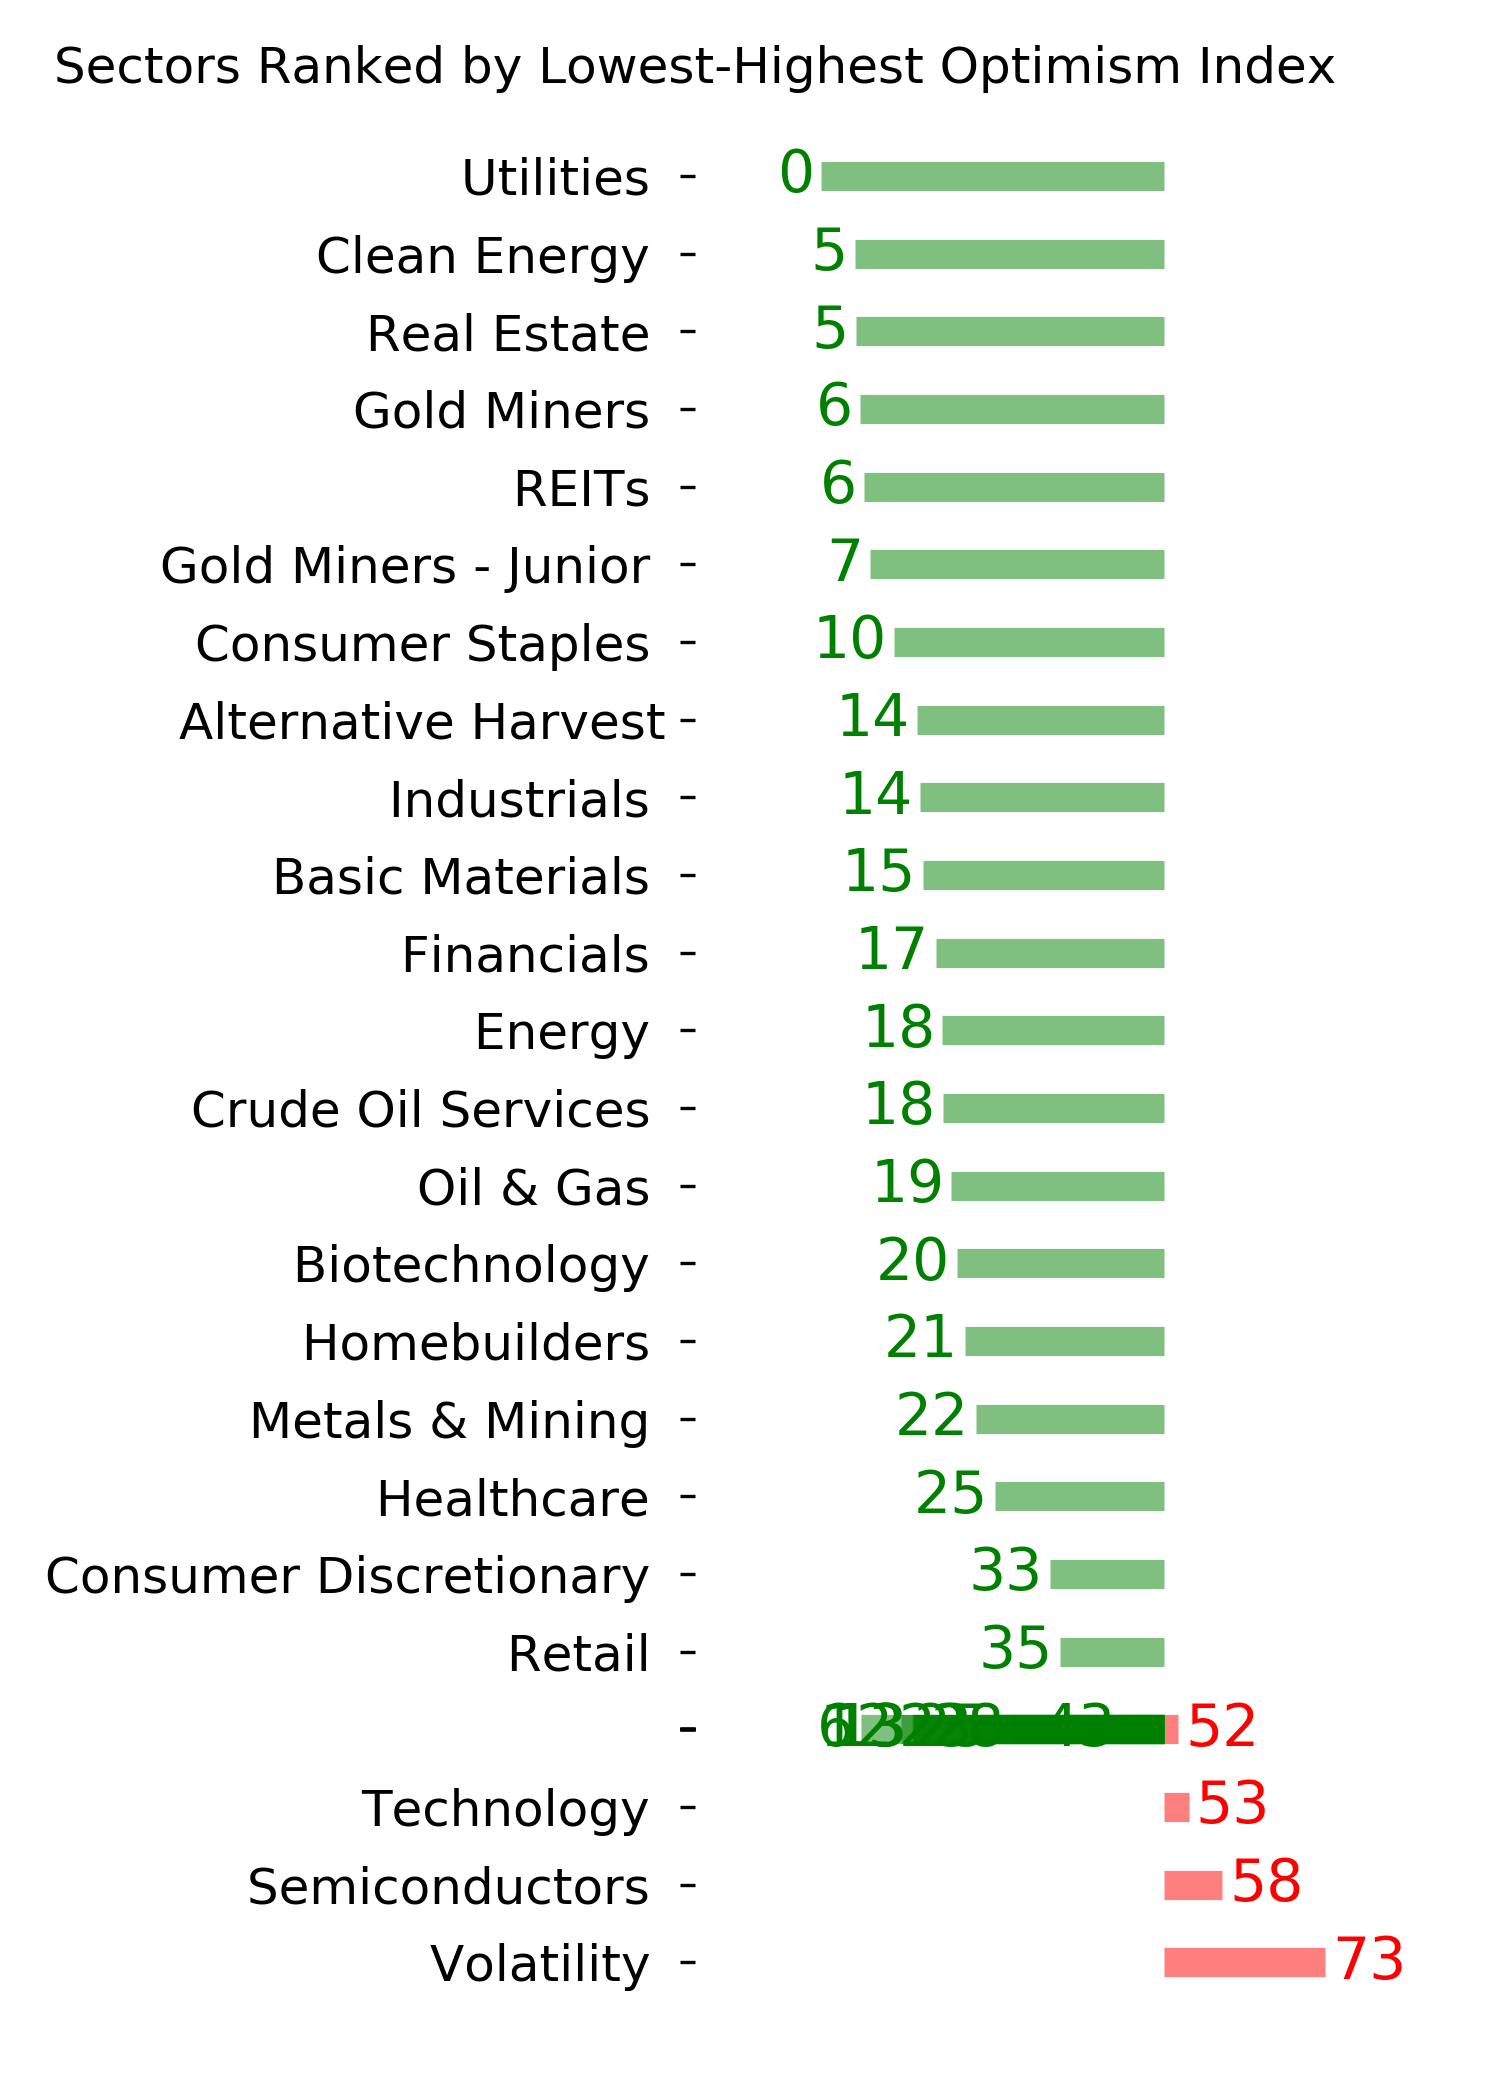
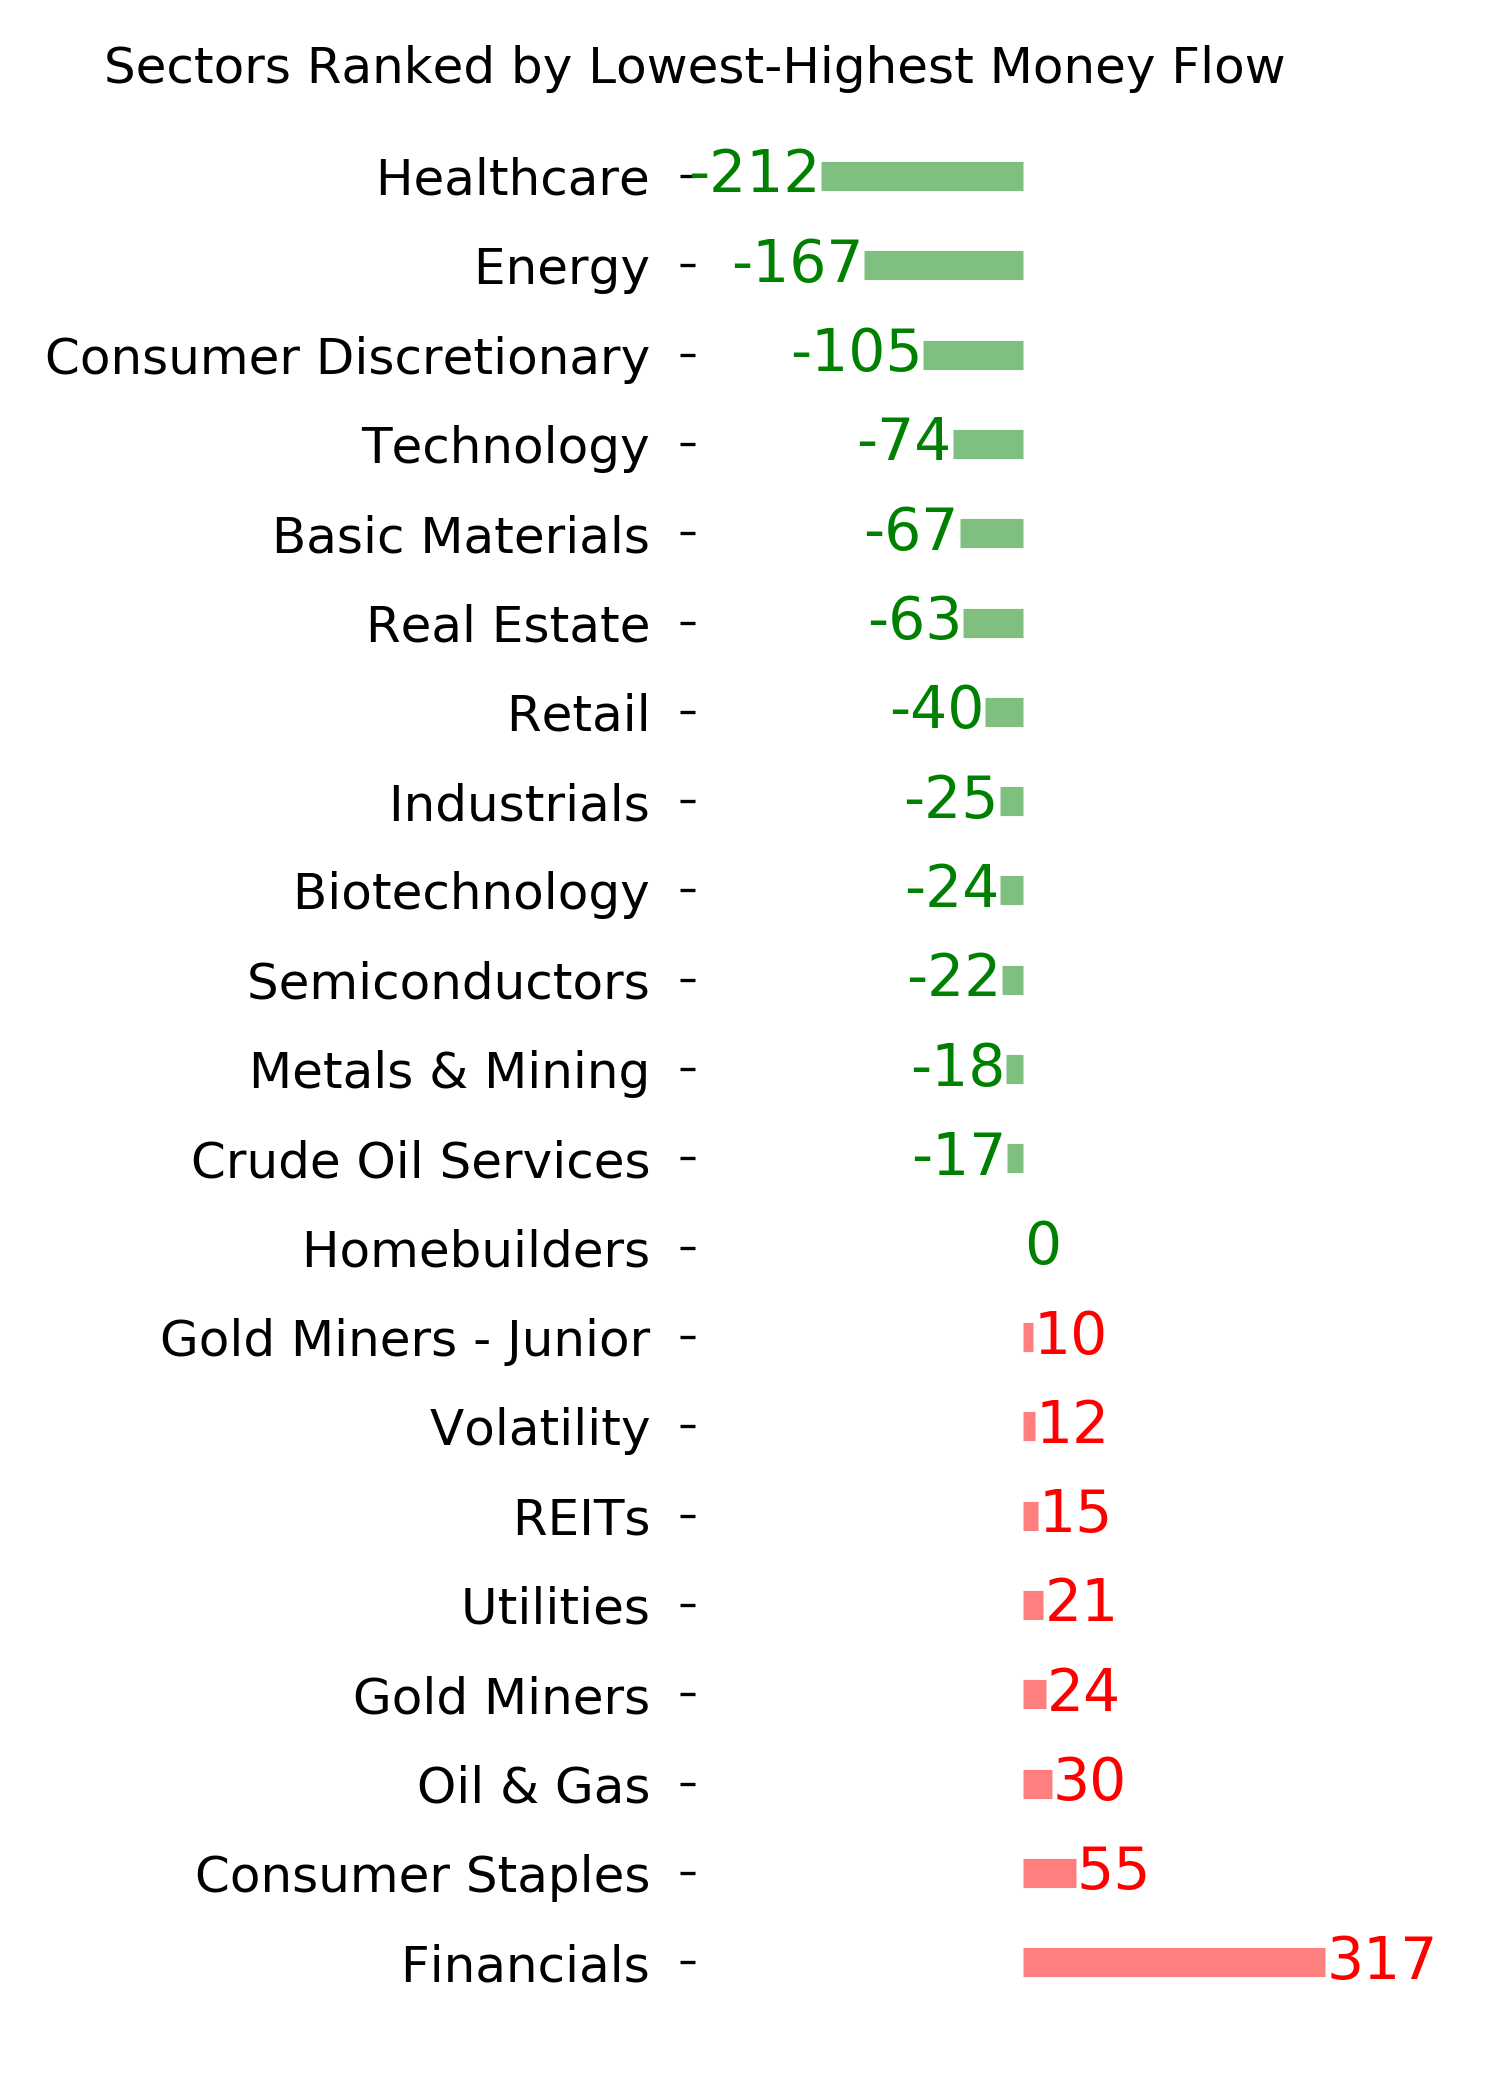
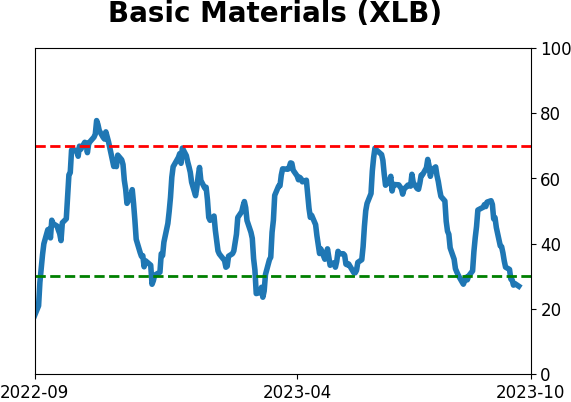
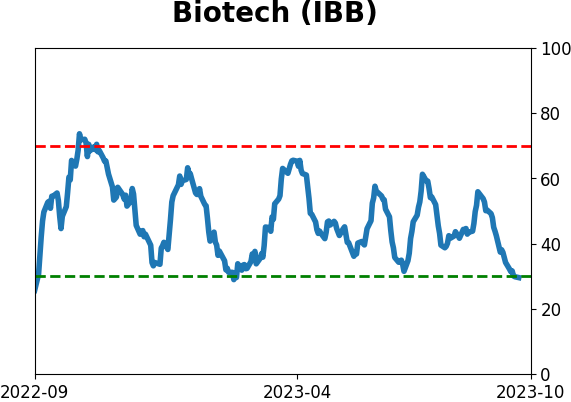
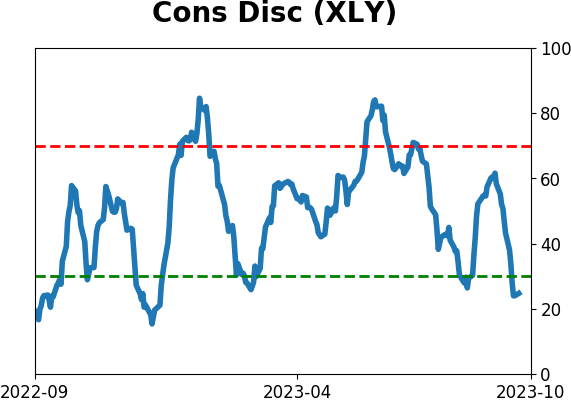
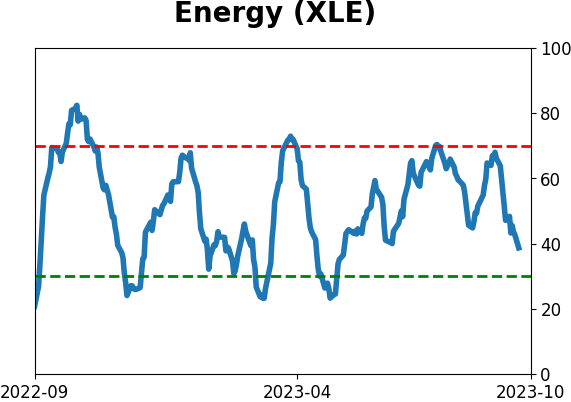
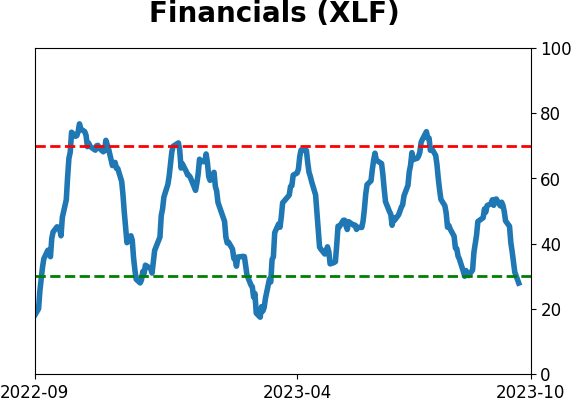
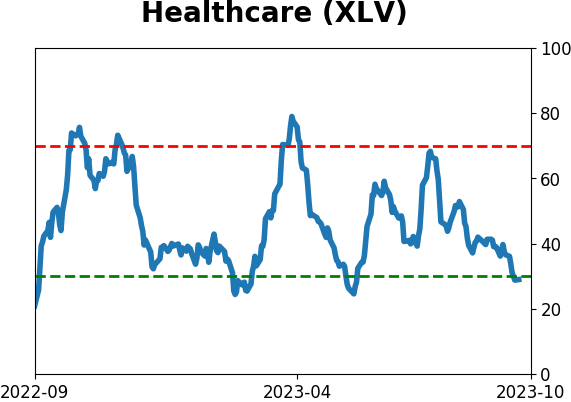
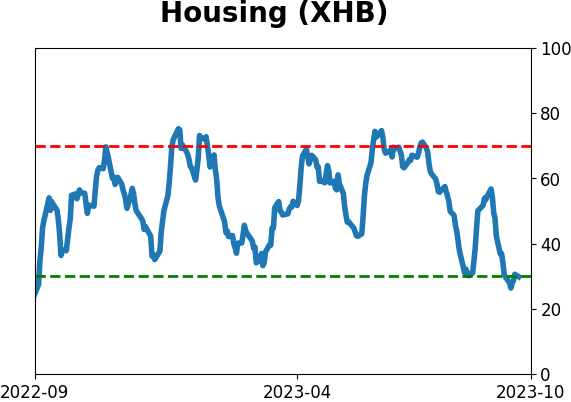
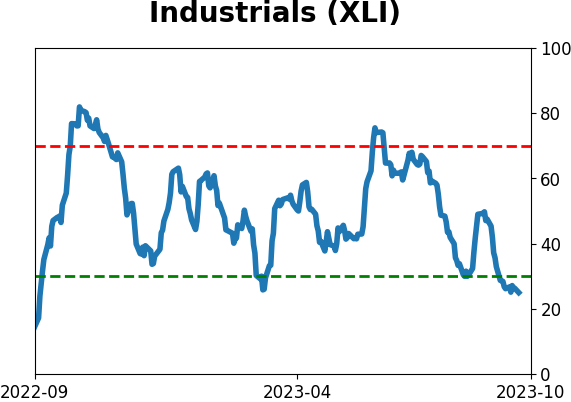
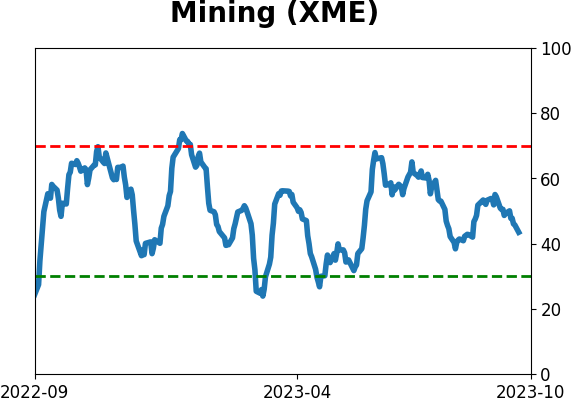
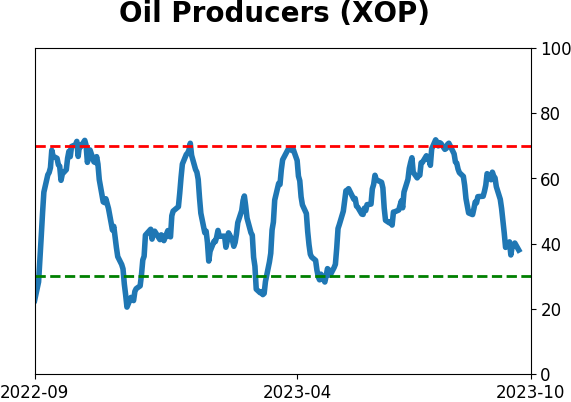
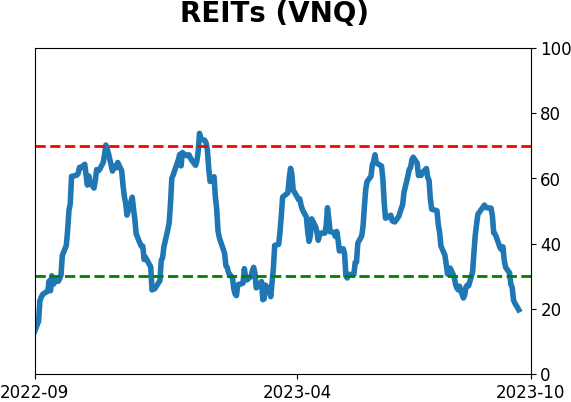
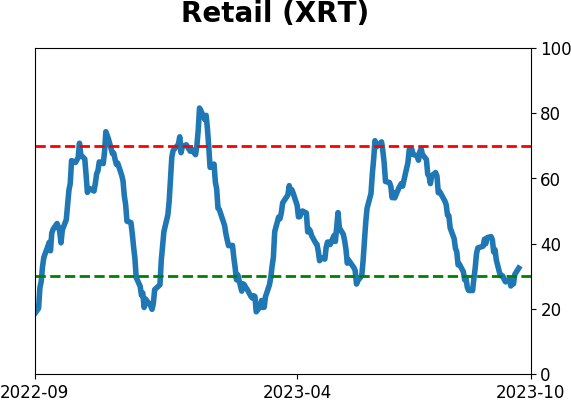
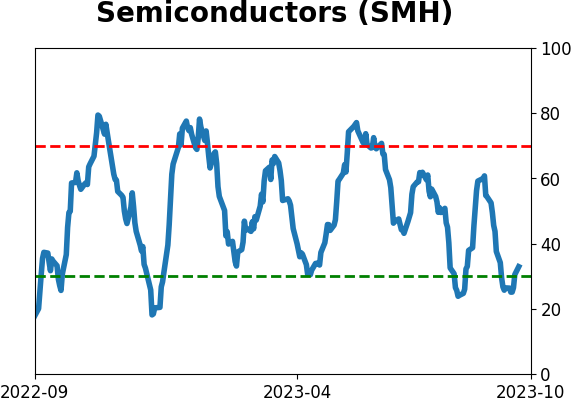
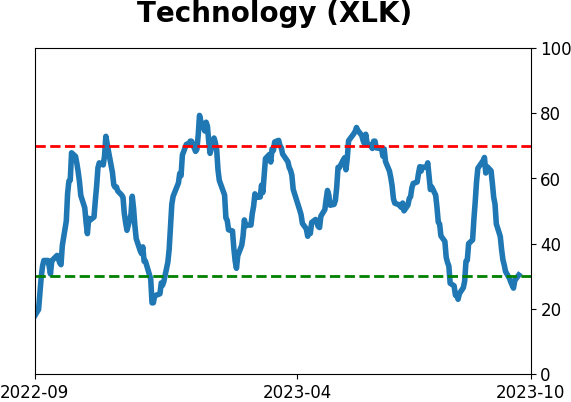
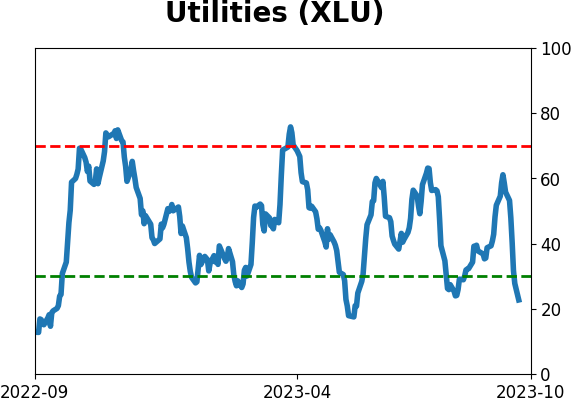
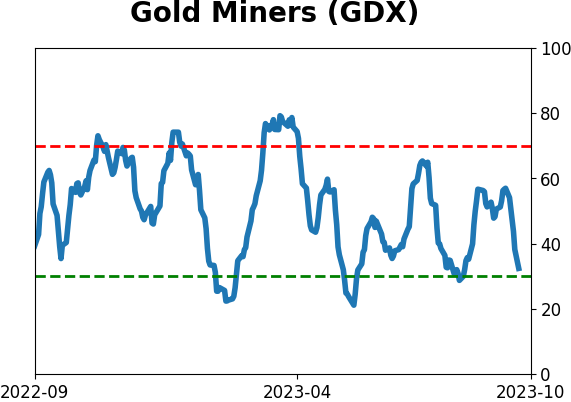
Sector ETF's - 10-Day Moving Average
|
|
|
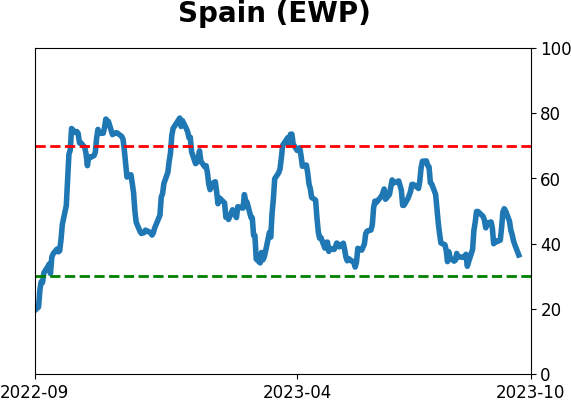
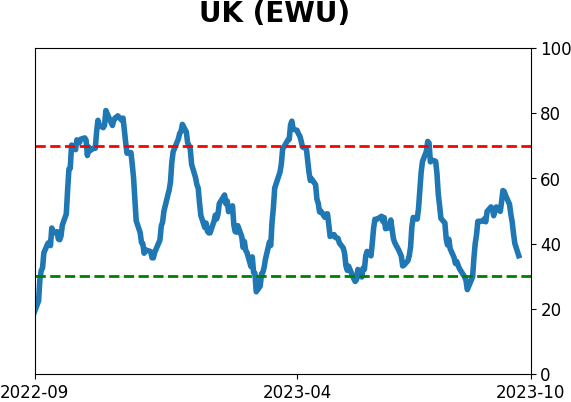
Country ETF's - 10-Day Moving Average
|
|
|
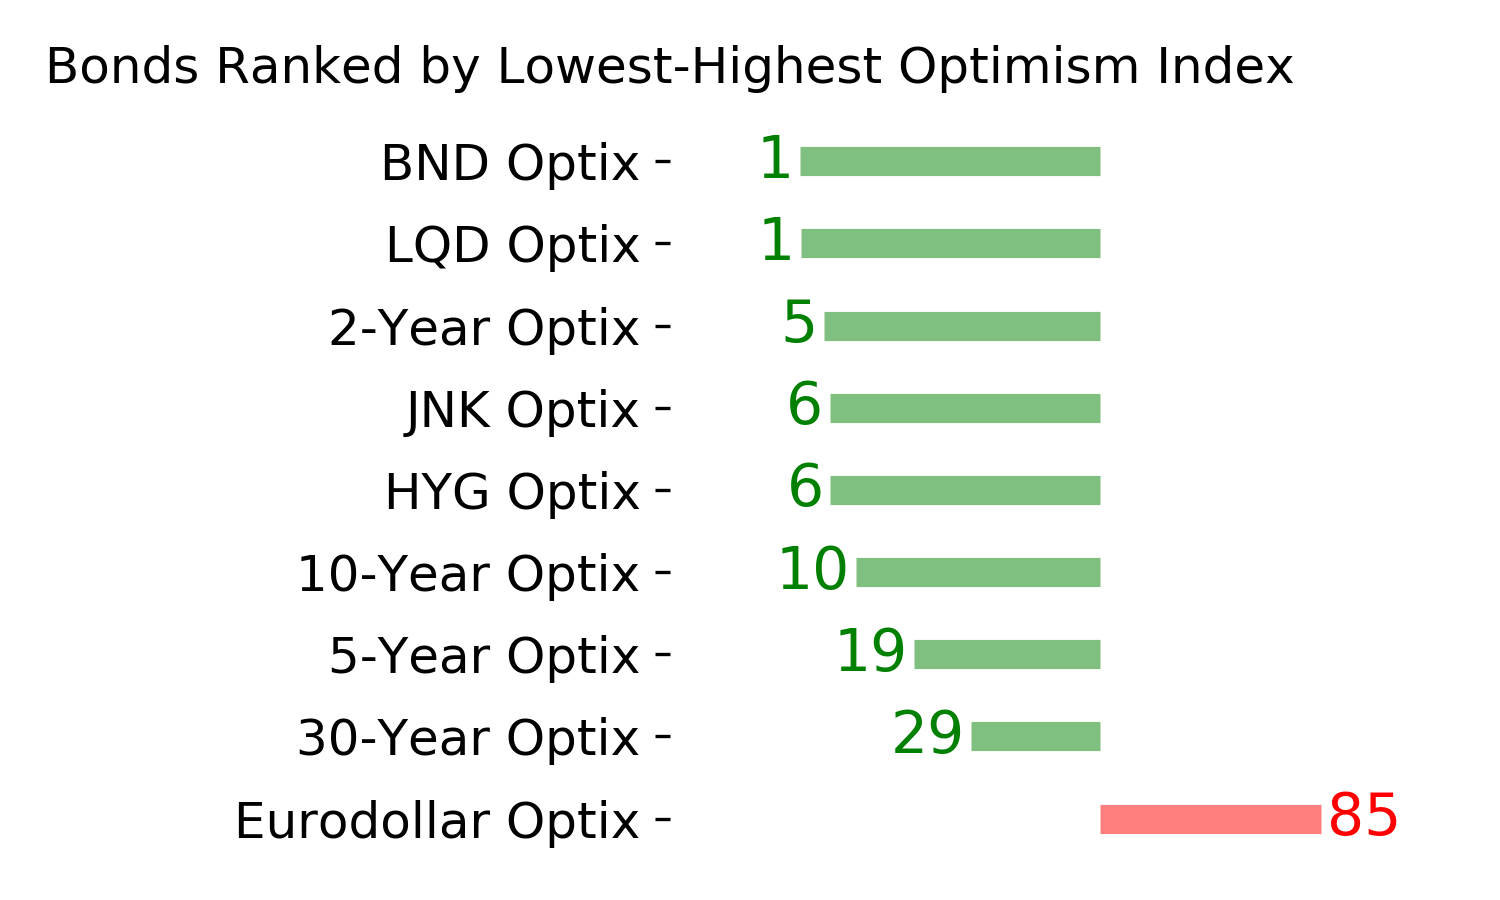
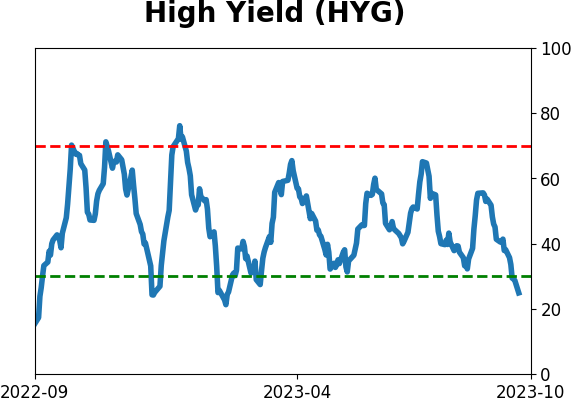
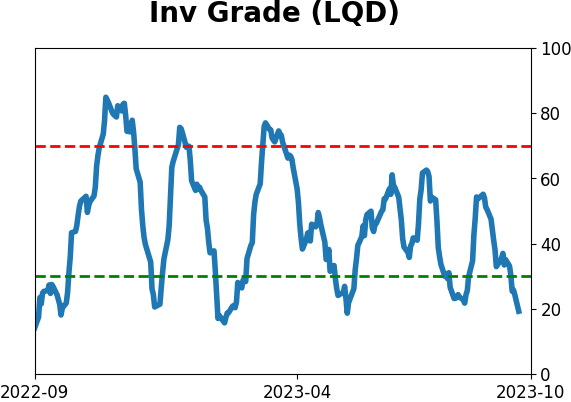
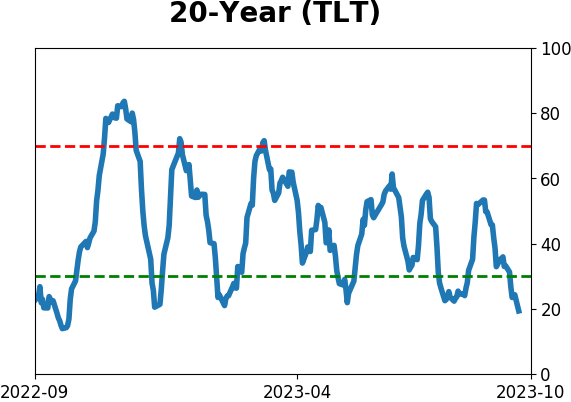
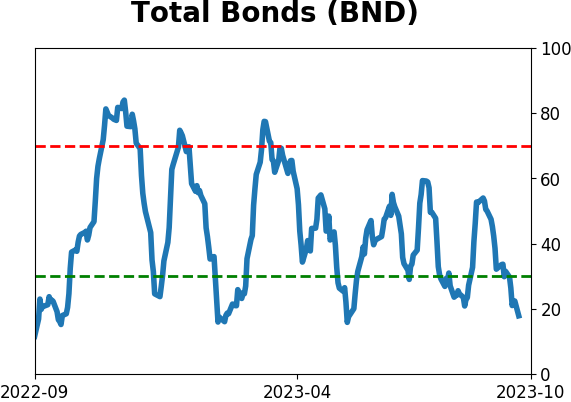
Bond ETF's - 10-Day Moving Average
|
|
|
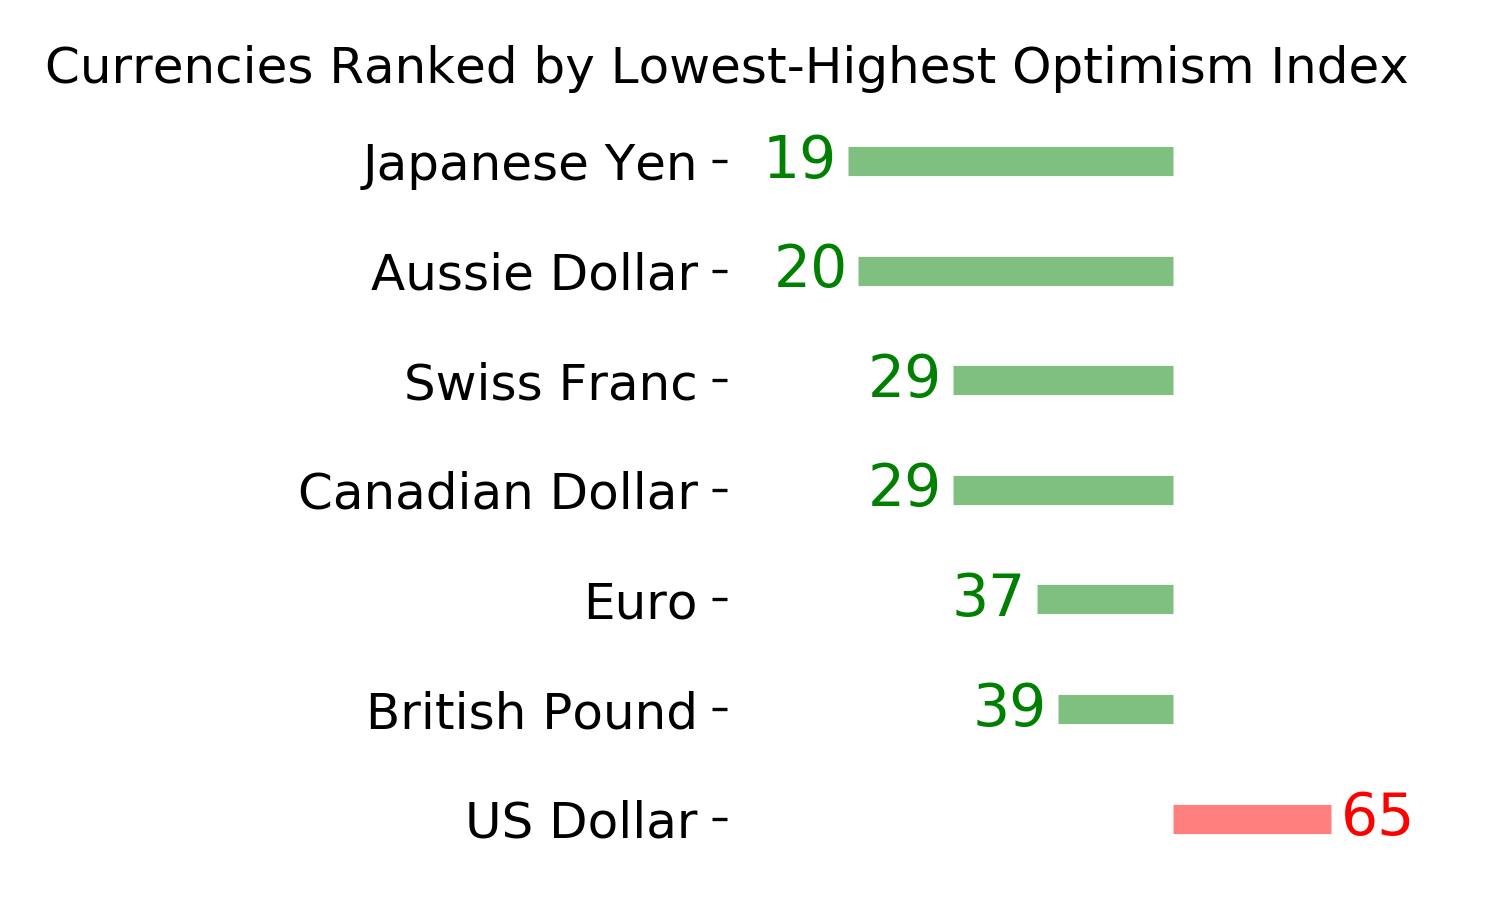
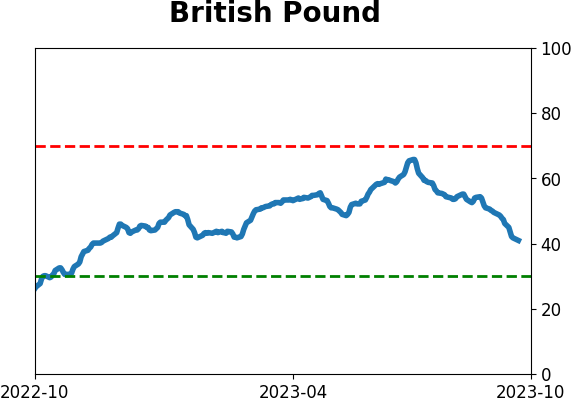
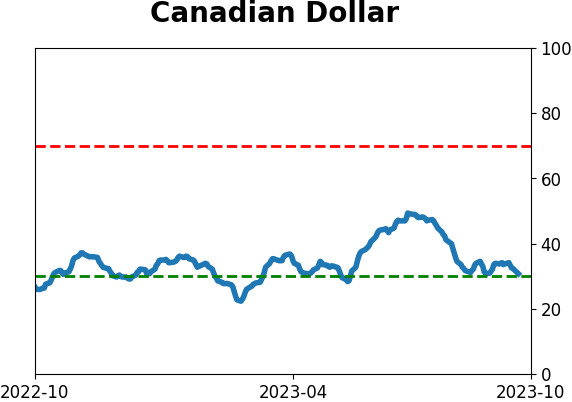
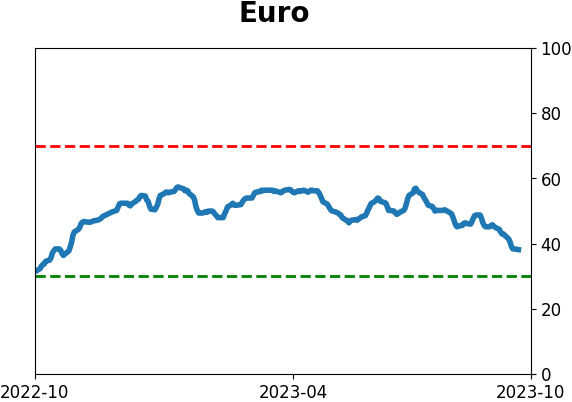
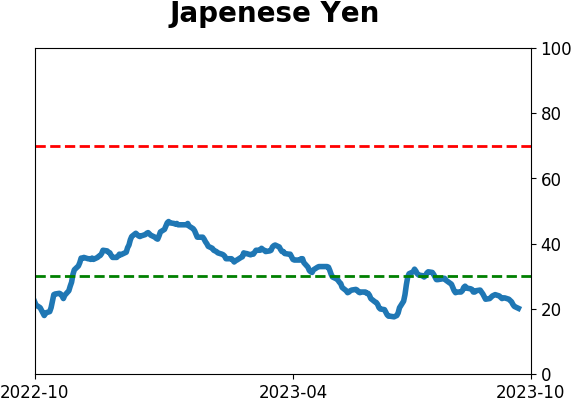
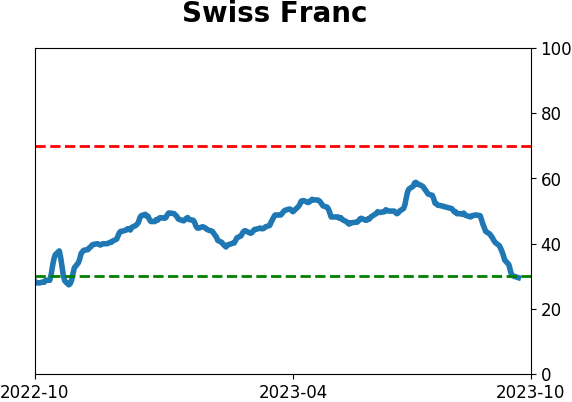
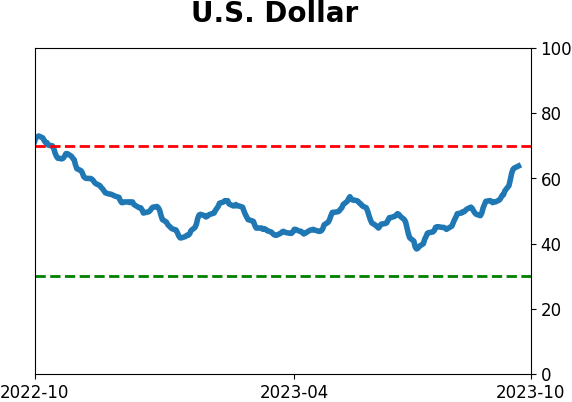
Currency ETF's - 5-Day Moving Average
|
|
|
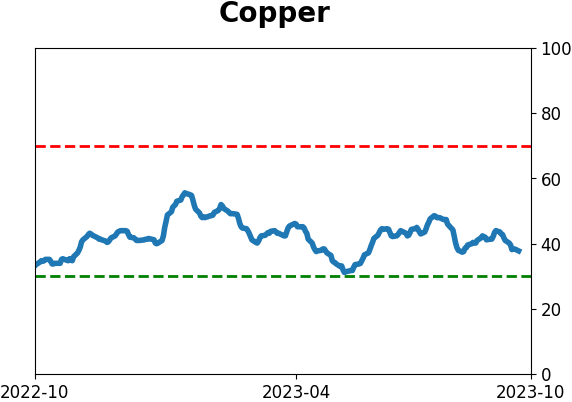
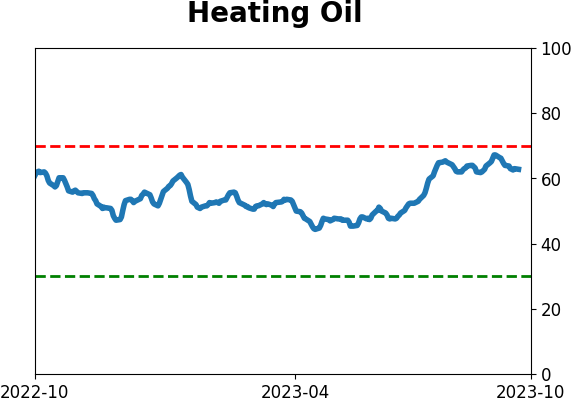
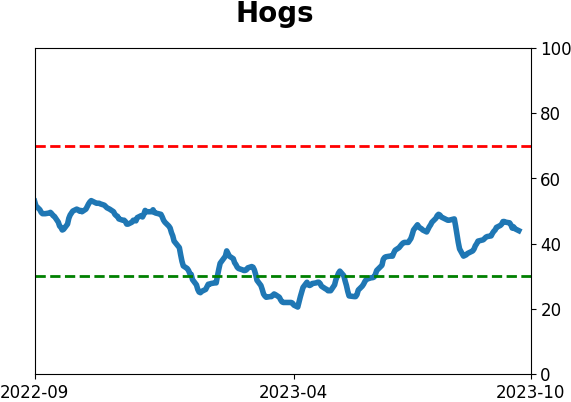
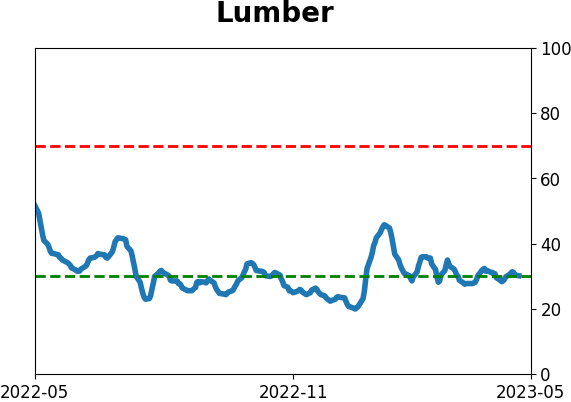
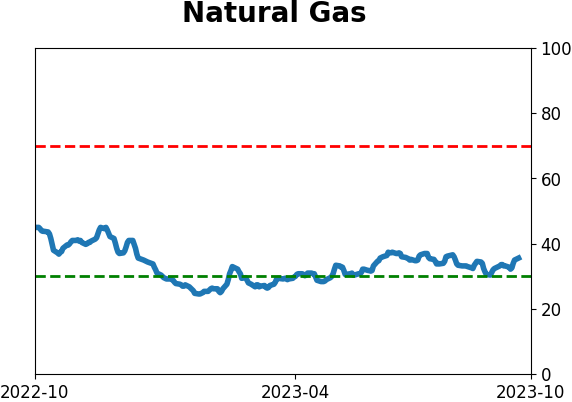
Commodity ETF's - 5-Day Moving Average
|
|