Headlines
|
|
Cash is king:
A trading system that compares high-yield bonds to cash issued a sell signal for riskier corporate bonds. Comparable warnings suggest one should avoid junk bonds. With the new alert, a composite model that measures ten diverse fixed-income ETFs relative to cash fell to 10%, a level associated with an unfavorable outlook for stocks.
|
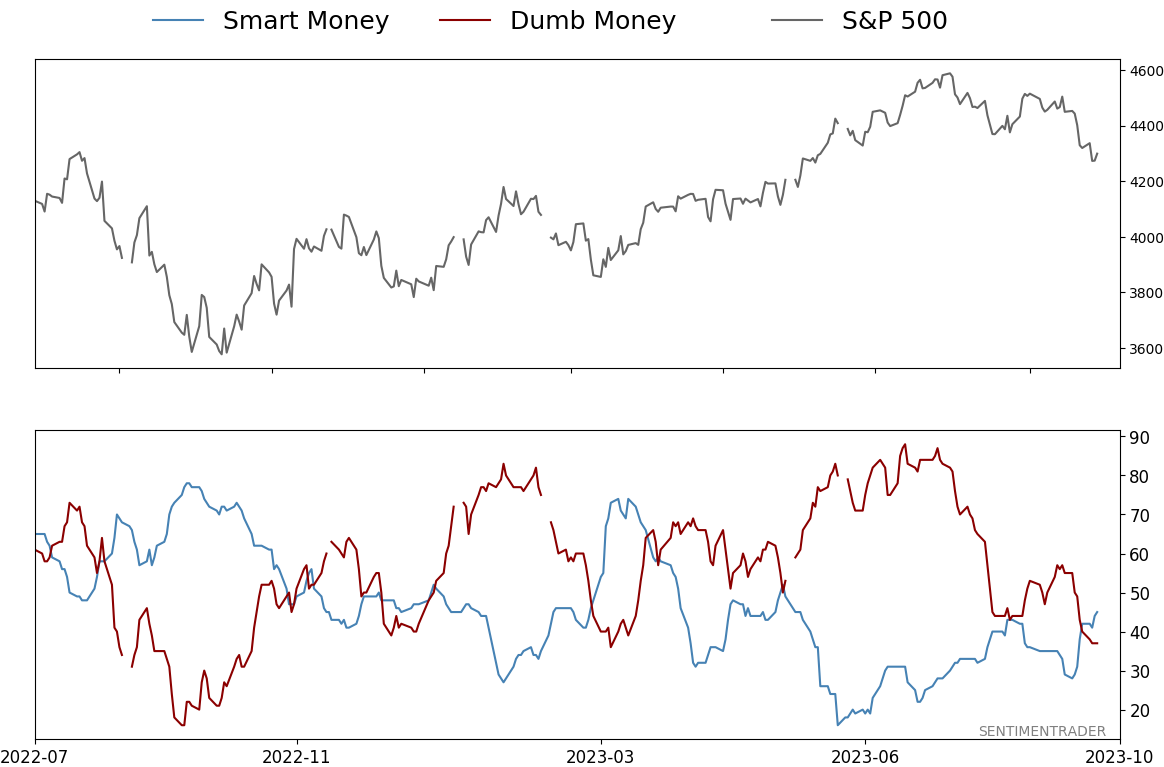
Smart / Dumb Money Confidence
|
Smart Money Confidence: 45%
Dumb Money Confidence: 37%
|
|
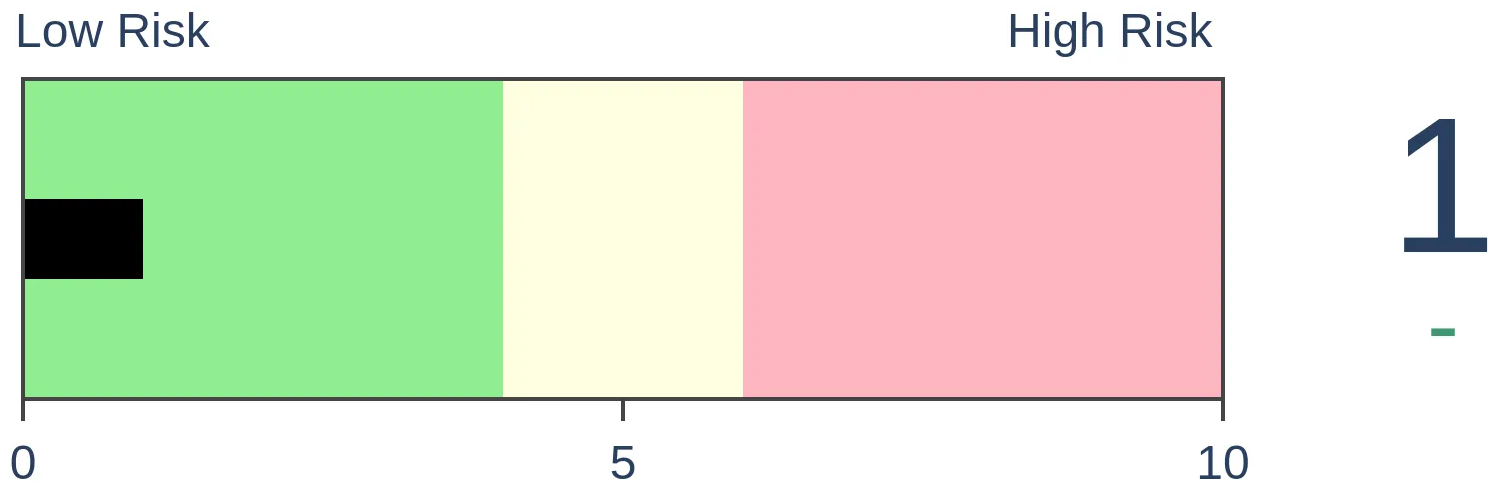
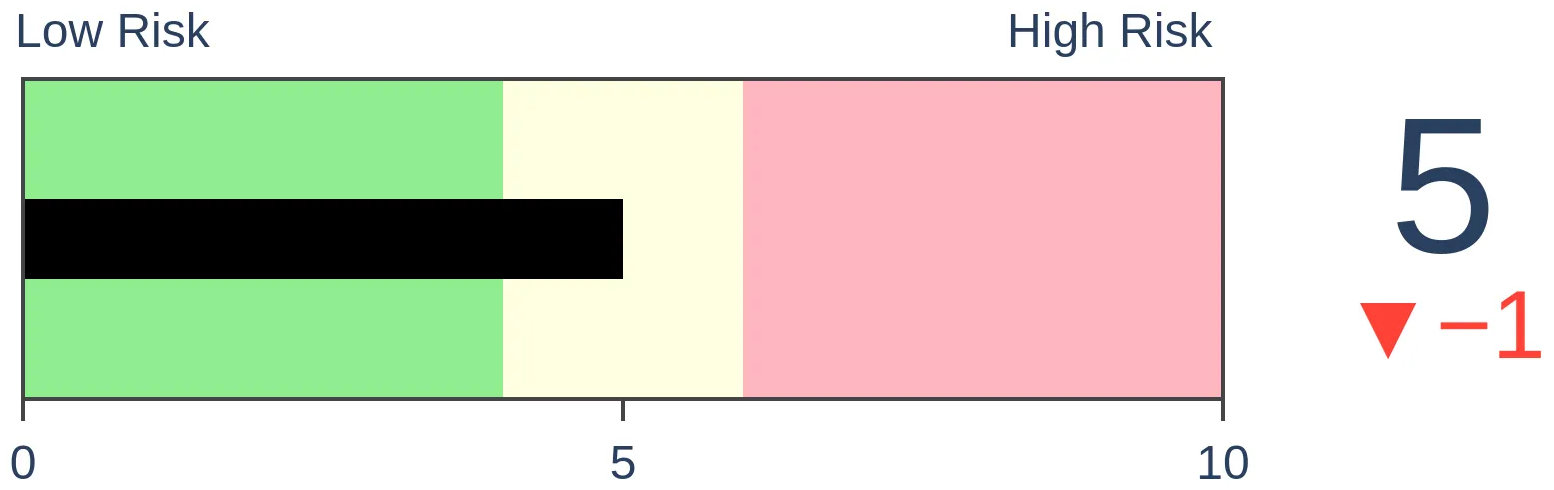
Risk Levels
Stocks Short-Term

|
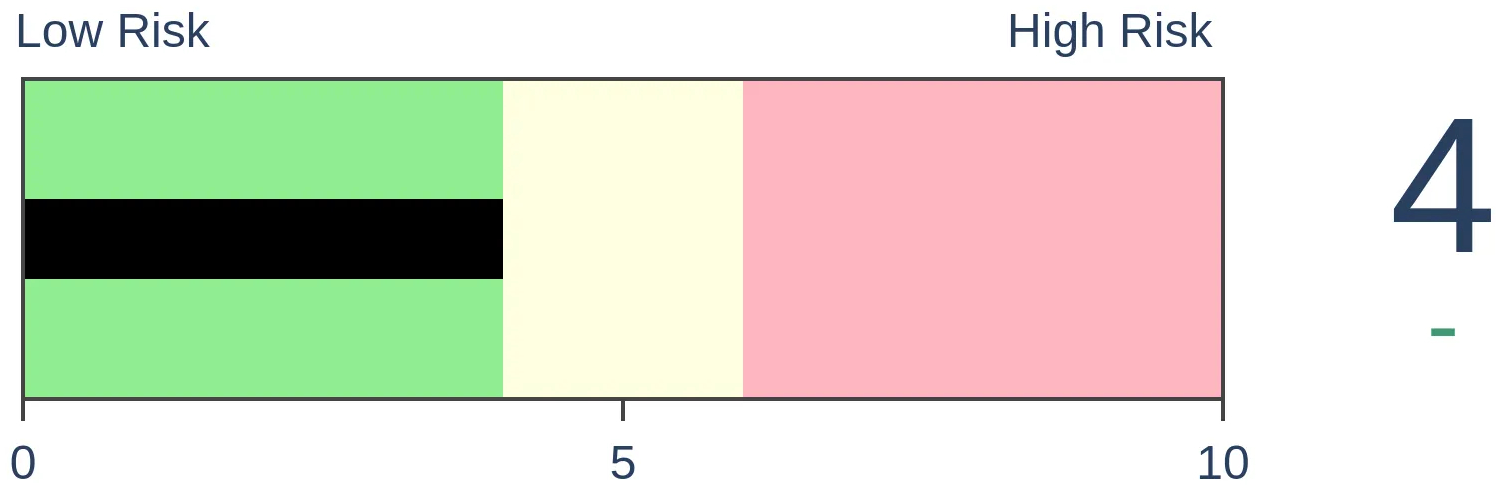
Stocks Medium-Term

|
|
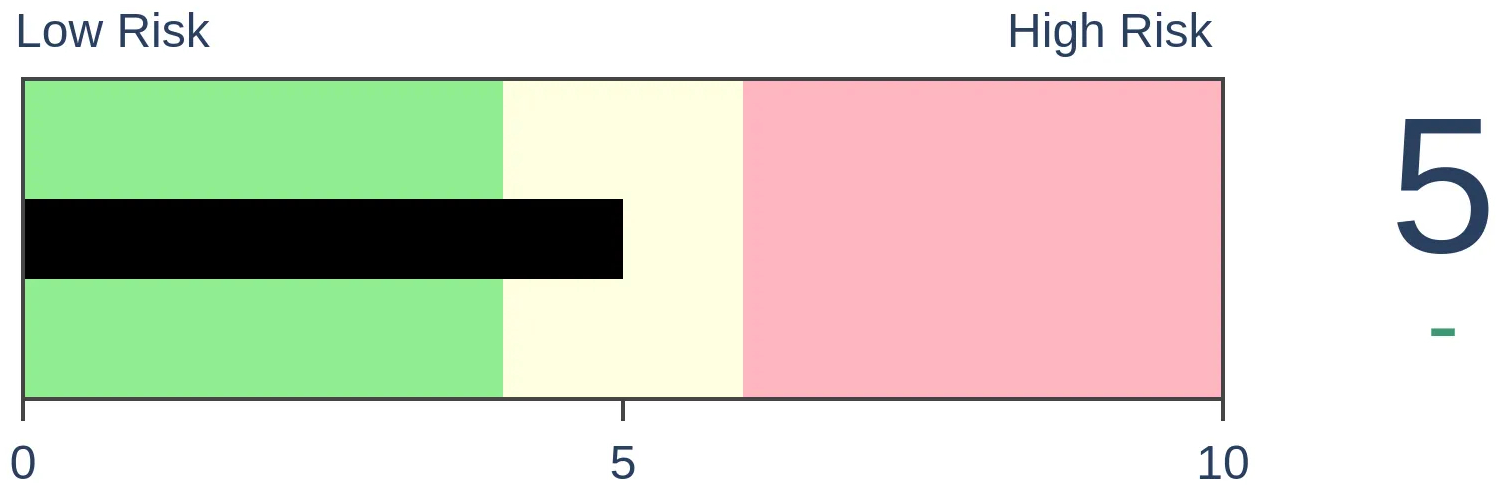
Bonds
|
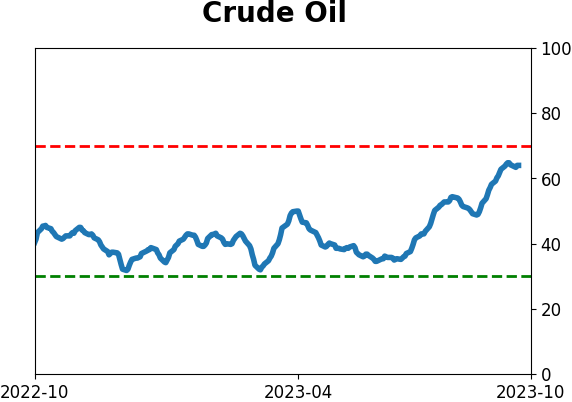
Crude Oil
|
|
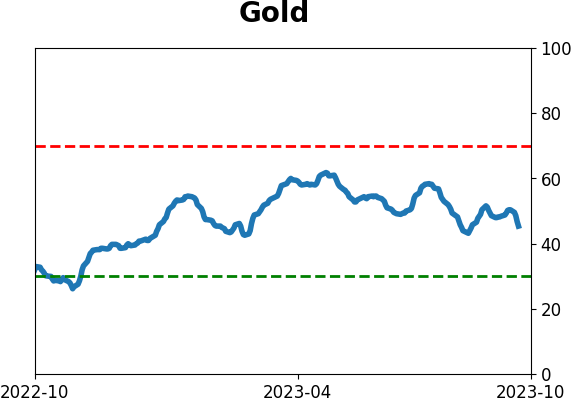
Gold
|
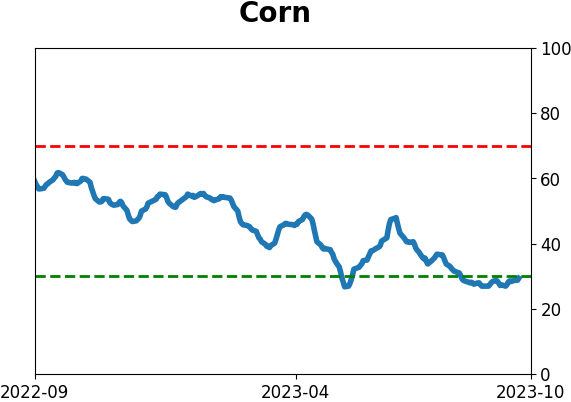
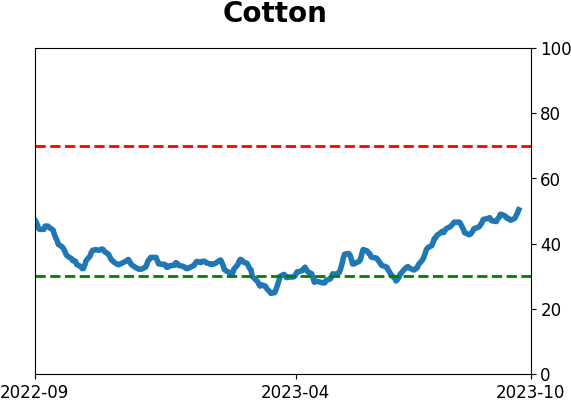
Agriculture
|
|
Research
By Dean Christians
BOTTOM LINE
A trading system that compares high-yield bonds to cash issued a sell signal for riskier corporate bonds. Comparable warnings suggest one should avoid junk bonds. With the new alert, a composite model that measures ten diverse fixed-income ETFs relative to cash fell to 10%, a level associated with an unfavorable outlook for stocks.
FORECAST / TIMEFRAME
None
|
Key points:
- A system that compares high-yield bonds to cash issued a sell signal for the lower-rated corporate bonds
- Periods when the rotation model shifts to cash underperform phases when high-yield bonds are positive
- A composite model that compares ten diverse bond ETFs to cash overwhelmingly favors cash
What's the market message from the bond guys?
In an August research report, I highlighted that Treasury yields across the curve had once again risen to new multi-year highs. This development suggested that interest rates might continue their upward trajectory, potentially leading to a challenging environment for stocks.
With rates looking like they will stay higher for longer and a potential government shutdown on the horizon, a system that compares lower-rated corporate bonds to a cash proxy triggered a sell signal for the junk bond ETF (HYG).
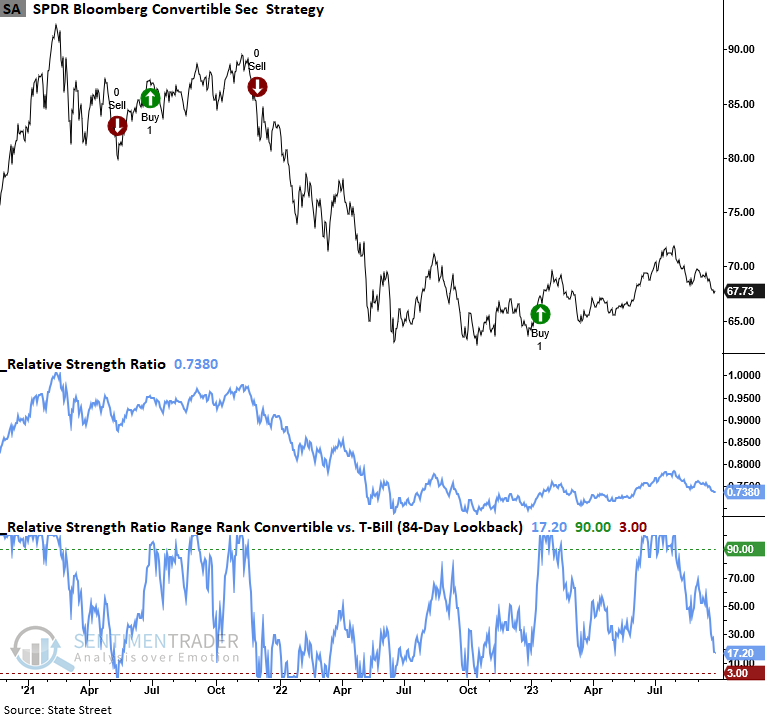
The rotation system applies an 84-day range rank to the ratio of HYG/BIL. When the range rank falls below the 4th percentile, the model shifts out of the junk bond ETF (HYG). Conversely, when it rises above the 99th percentile, it rotates back to the lower-rated corporate bond ETF.
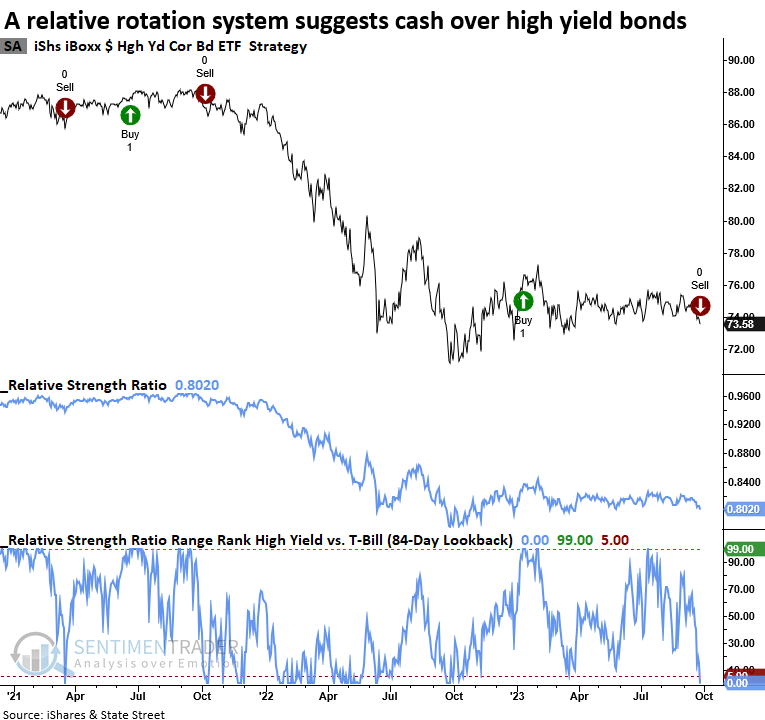
Similar shifts suggest one should avoid high-yield bonds
Employing the range rank rotation model's rules, a $10,000 investment in HYG appreciates to $20,700 when the model prefers high-yield bonds. In contrast, when the system suggests cash is a more favorable holding, an investment in high-yield bonds increases to a mere $10,300.
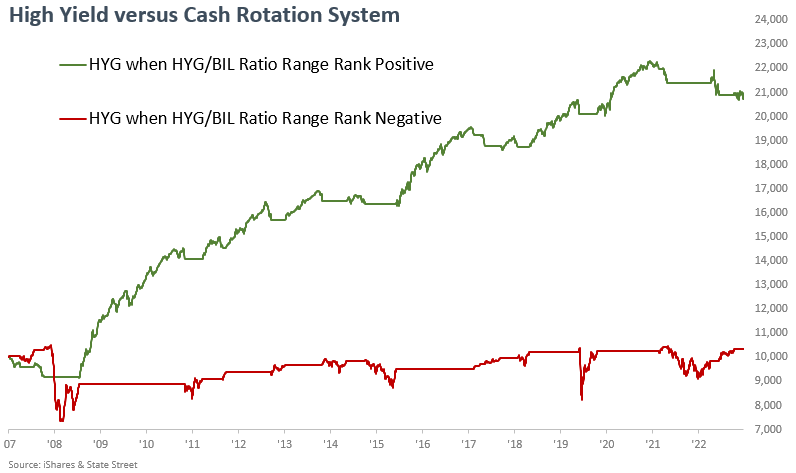
When examining trend-following systems that employ an all-in or all-out approach, assessing the strategy's validity is better achieved by measuring performance through the growth of an initial investment. Due to data limitations, I used the total return for the underlying index instead of the ETF to calculate performance.
Using the bond market to signal risk-on or risk-off for stocks
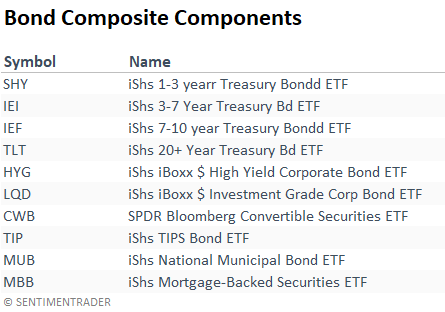
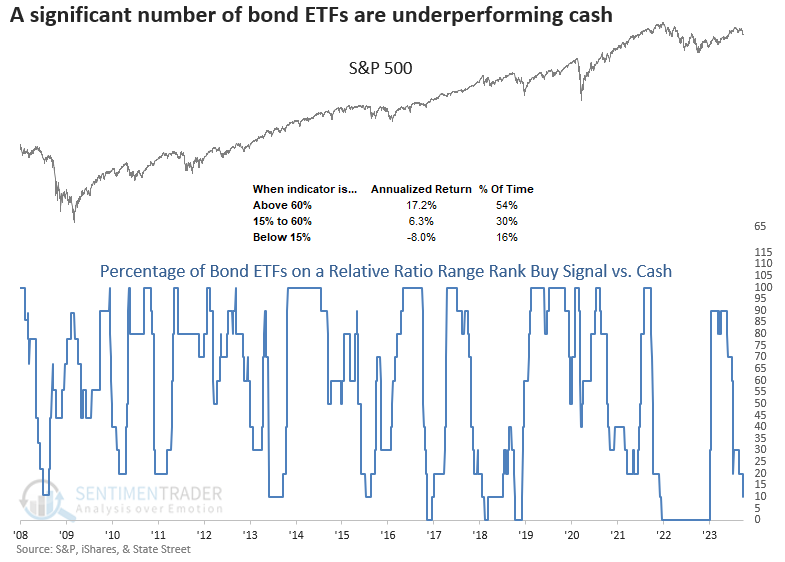
The composite in the chart below applies the same ratio range rank system to ten diverse bond ETFs to measure whether they are on a buy signal relative to a cash proxy. For the composite, I use the 1-3 month T-Bill ETF (BIL), the same as the individual components. With the new high-yield signal, the composite has now fallen to 10%, a level associated with negative annual returns for the S&P 500.
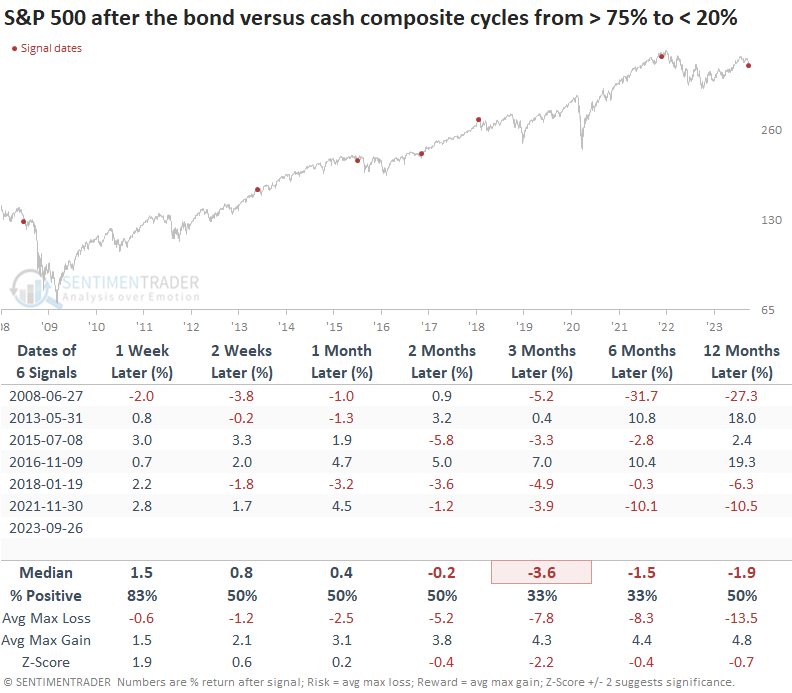
Similar bond composite signals preceded negative returns for the S&P 500
While the sample size is small, when a significant number of bond ETFs fail to outperform cash, all is not well. Over the following three months, the S&P 500 was lower at some point in all but one instance. The one alert that was positive occurred in 2016 and was associated with an event, the presidential election.
It's not uncommon for markets to undergo corrections in anticipation of significant events, resulting in pessimism. It's vital to remember that the current unease regarding a potential government shutdown may soon give way to a reversal in sentiment among stock and bond investors.
The last man standing
The convertible bond ETF (CWB) correlates more closely with equities and is the only bond ETF on a buy signal. However, it's not far from a sell signal.
What the research tells us...
A model that monitors the relationship between high-yield bonds and a cash proxy triggered a sell signal for lower-rated corporate bonds. Similar alerts suggest junk bonds, which are more sensitive to economic conditions and show a higher correlation to stocks, could struggle. With riskier corporate debt and several other fixed-income groups underperforming cash, a composite model that measures when cash is king has fallen to 10%, a level associated with an unfavorable outlook for stocks.
The confluence of rising interest rates, a surging dollar, and soaring crude oil prices has cast a shadow over the stock market. While many indexes and sectors show early signs of oversold conditions, and with the approach of a more favorable seasonal period, there is potential for a Q4 rally. However, bullish stock particiaption will be of utmost importance. Lagging performance among crucial groups may indicate that previously mentioned factors are beginning to impact the business cycle, warranting further attention.
Indicators at Extremes
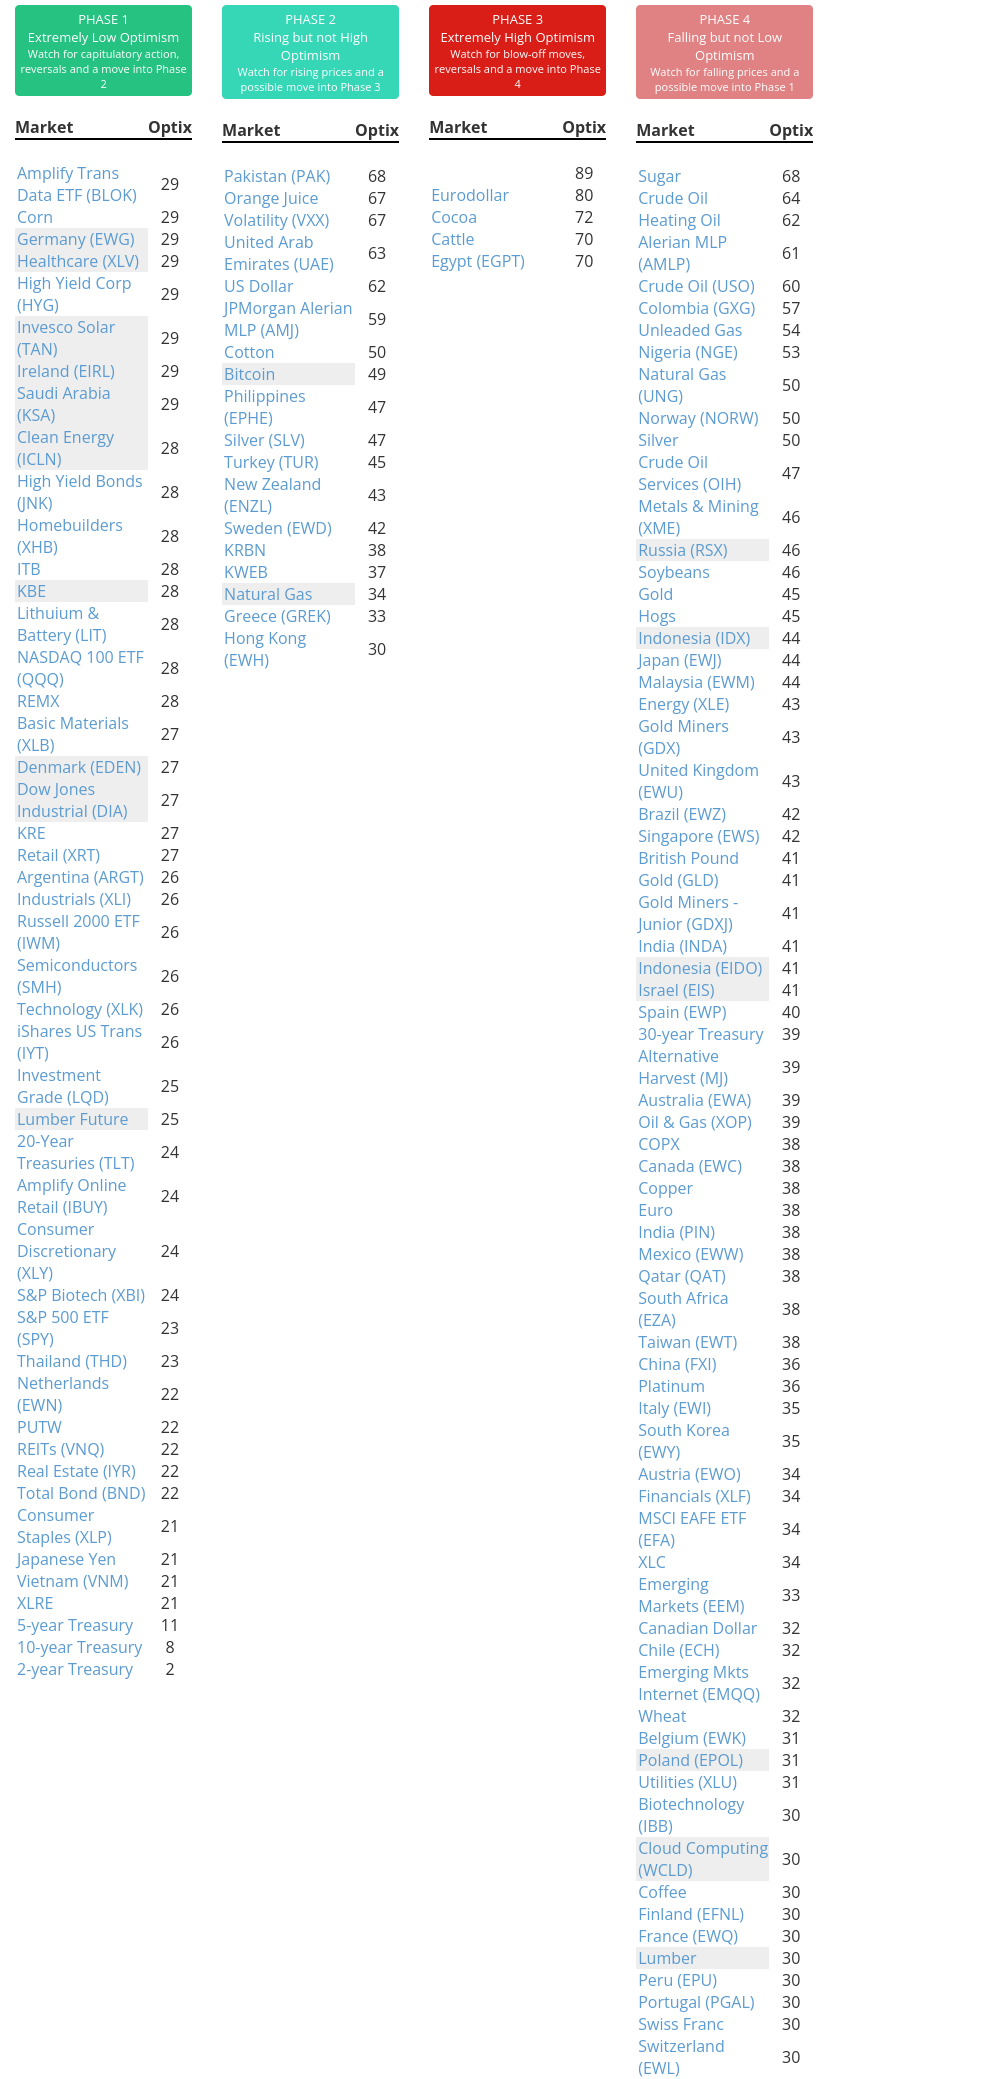
Phase Table
Ranks
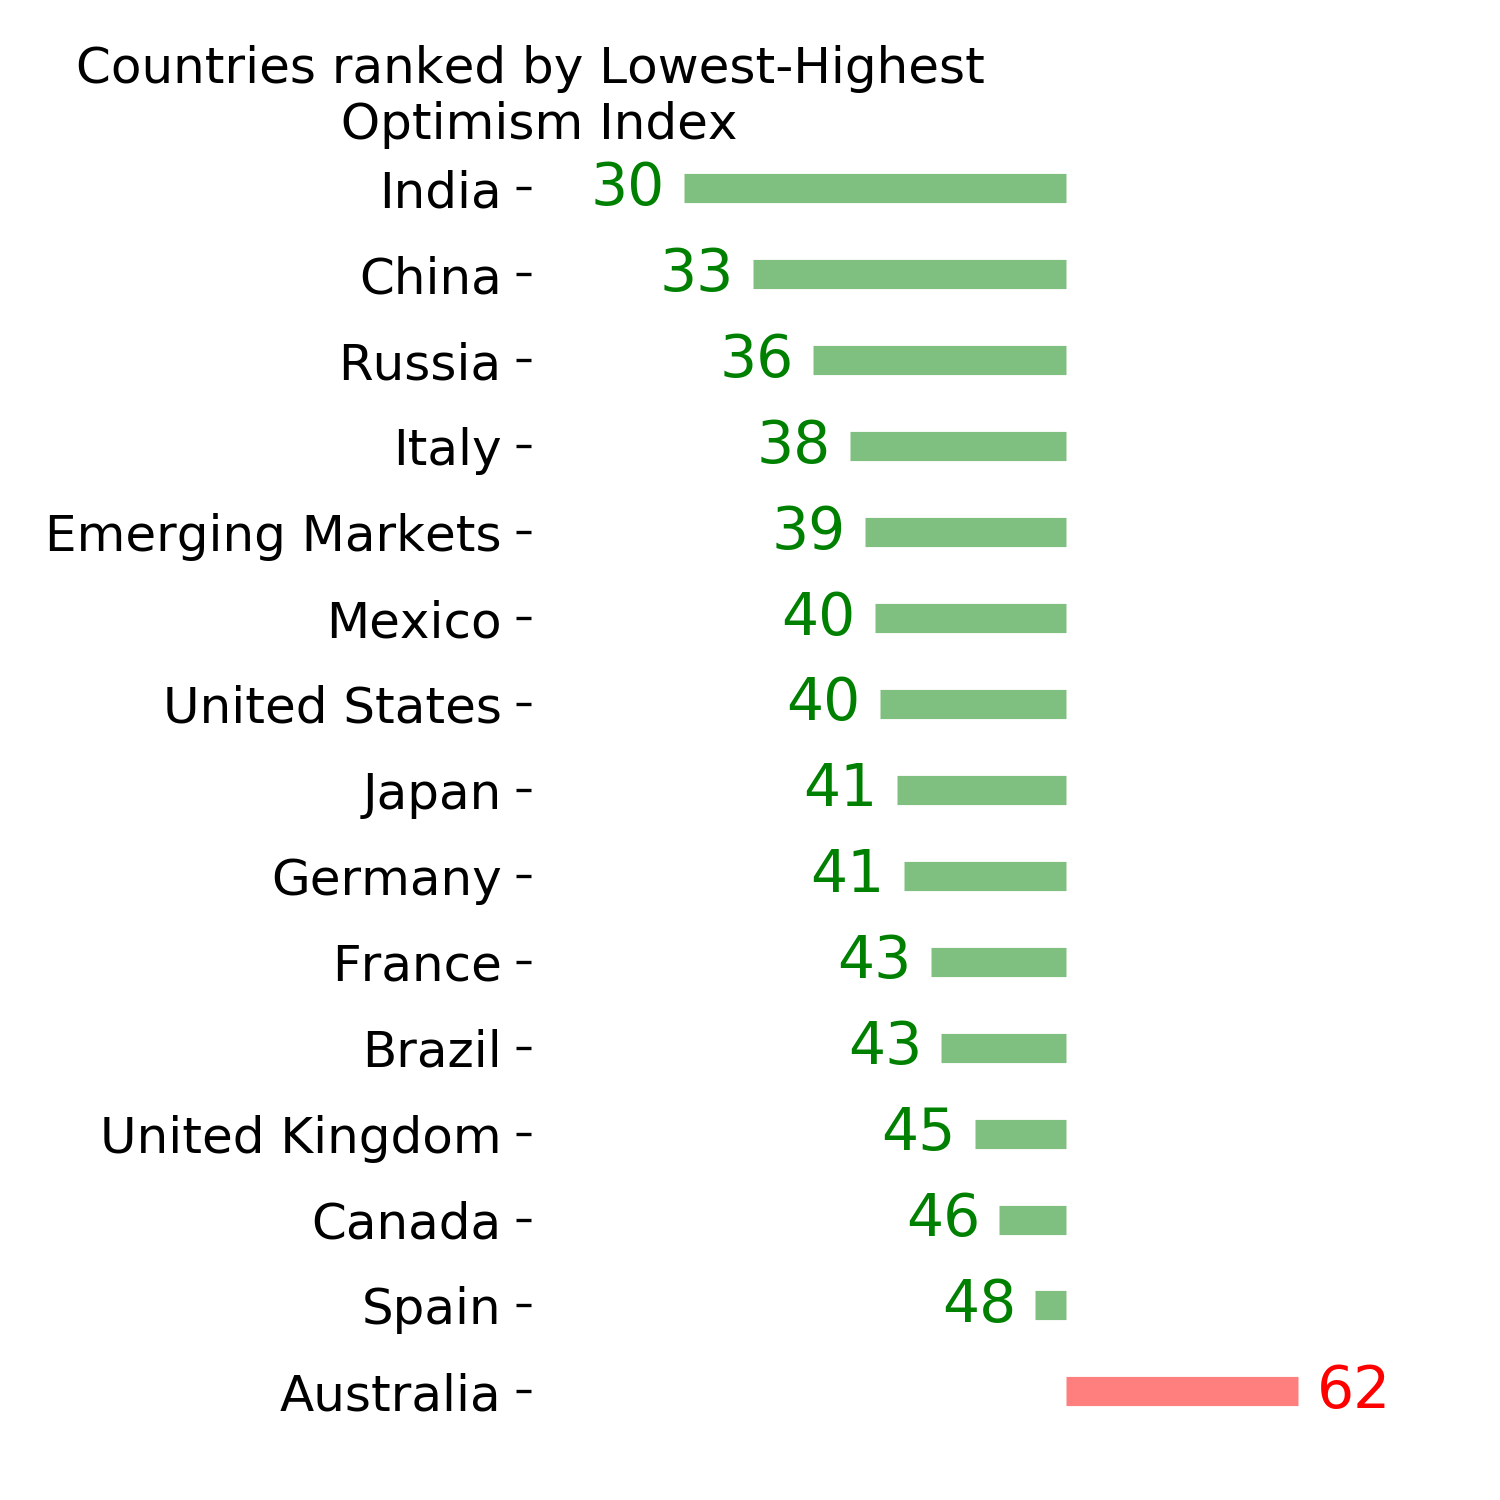
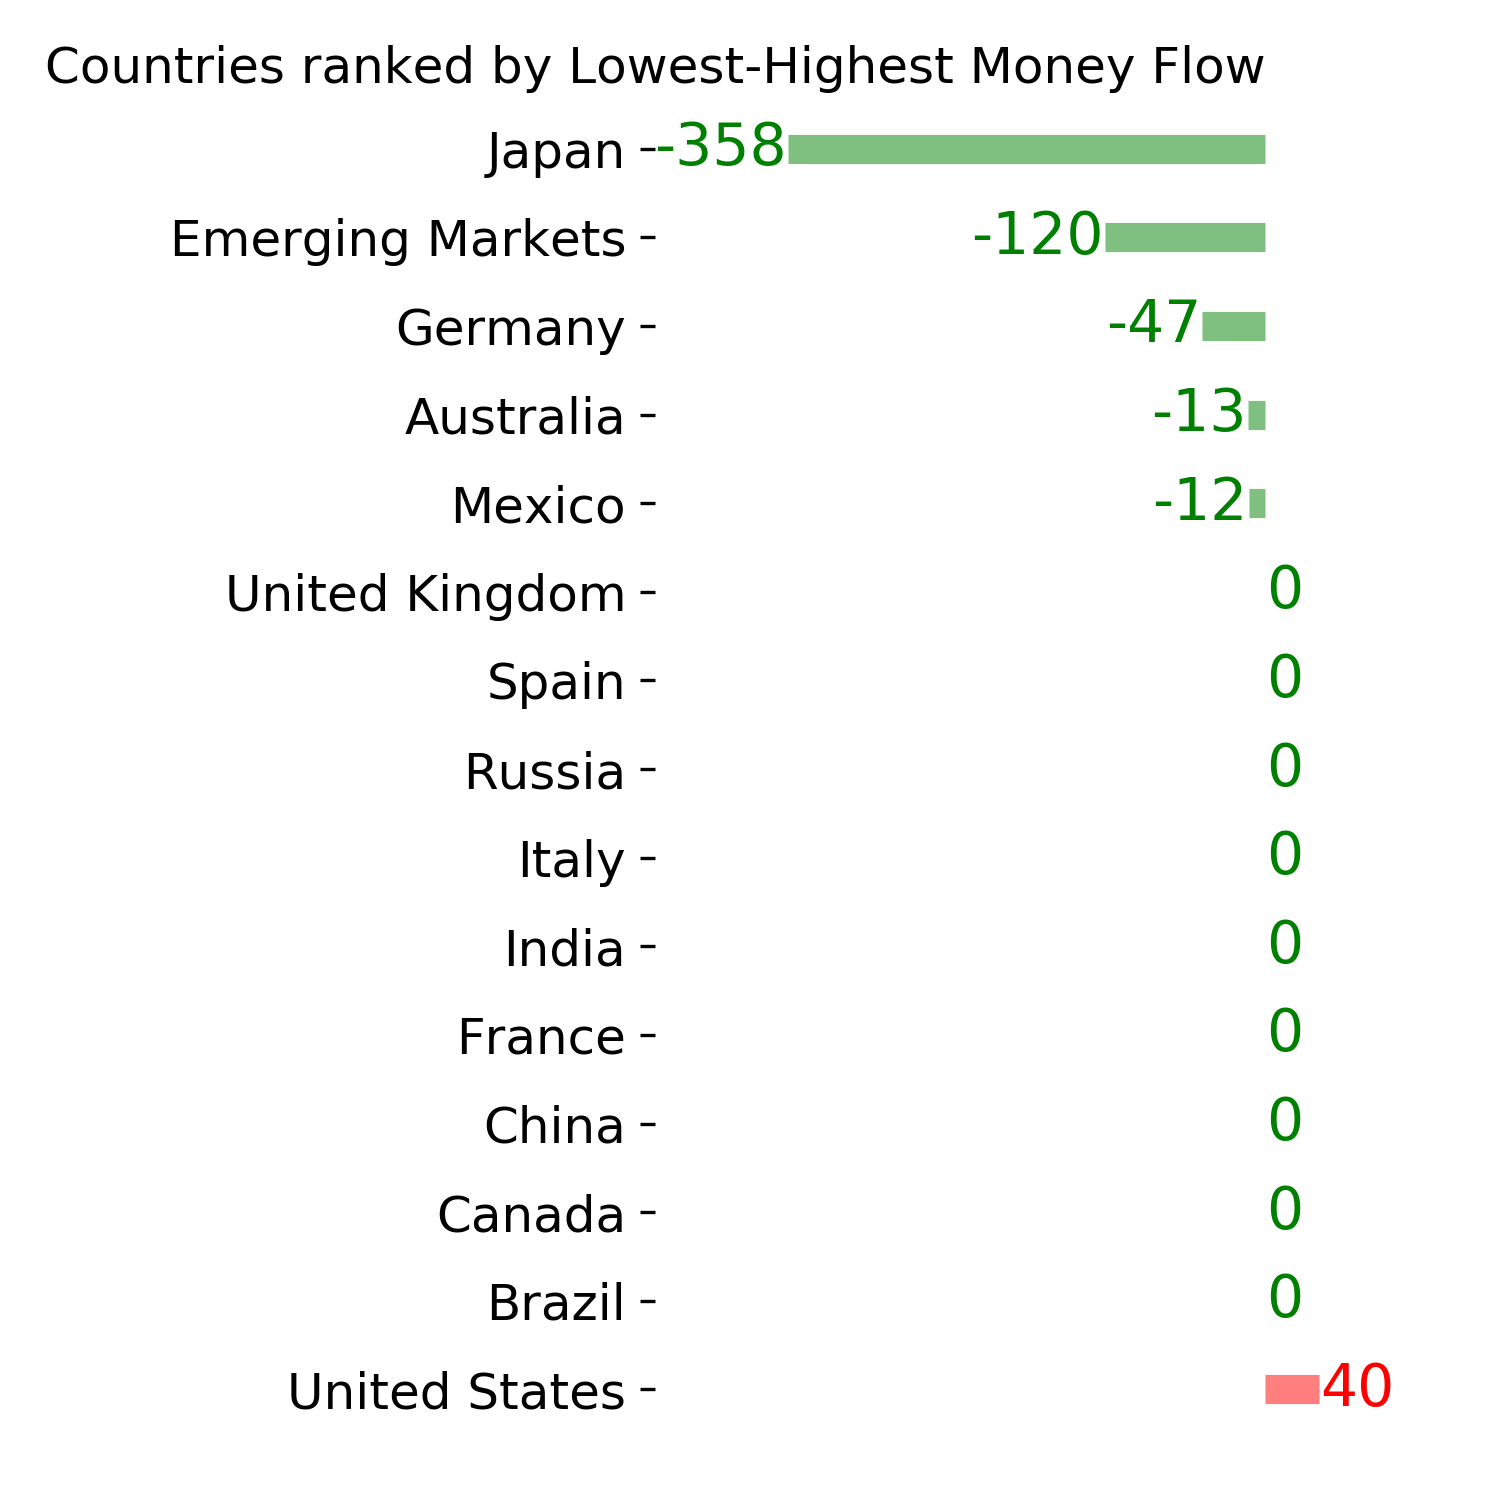
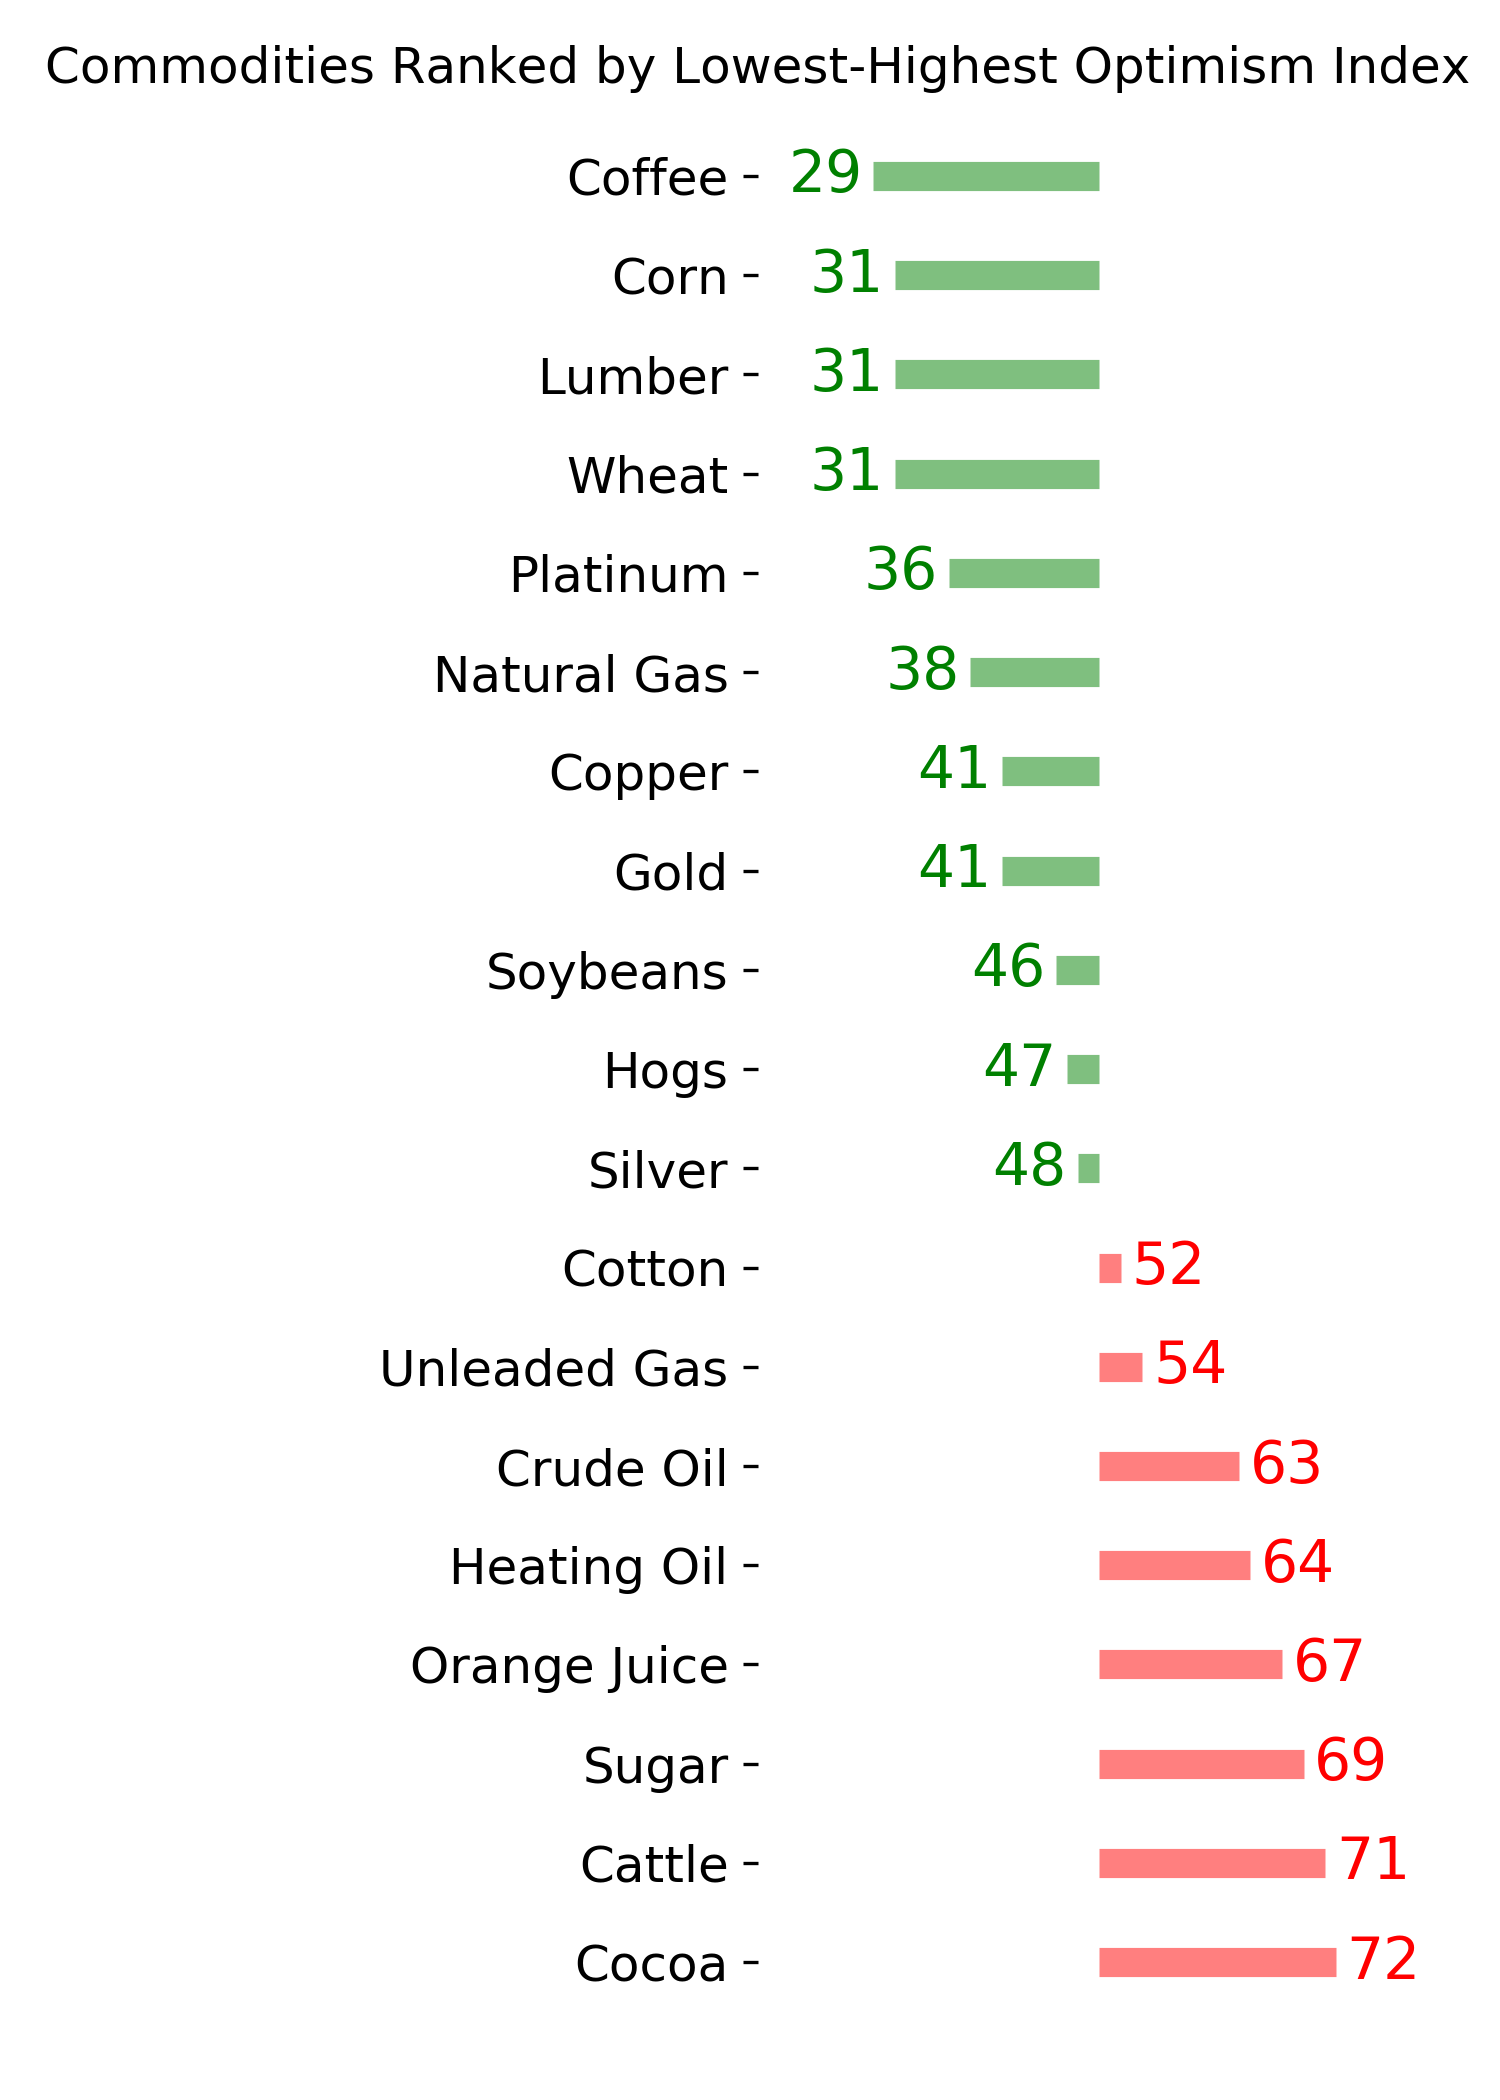
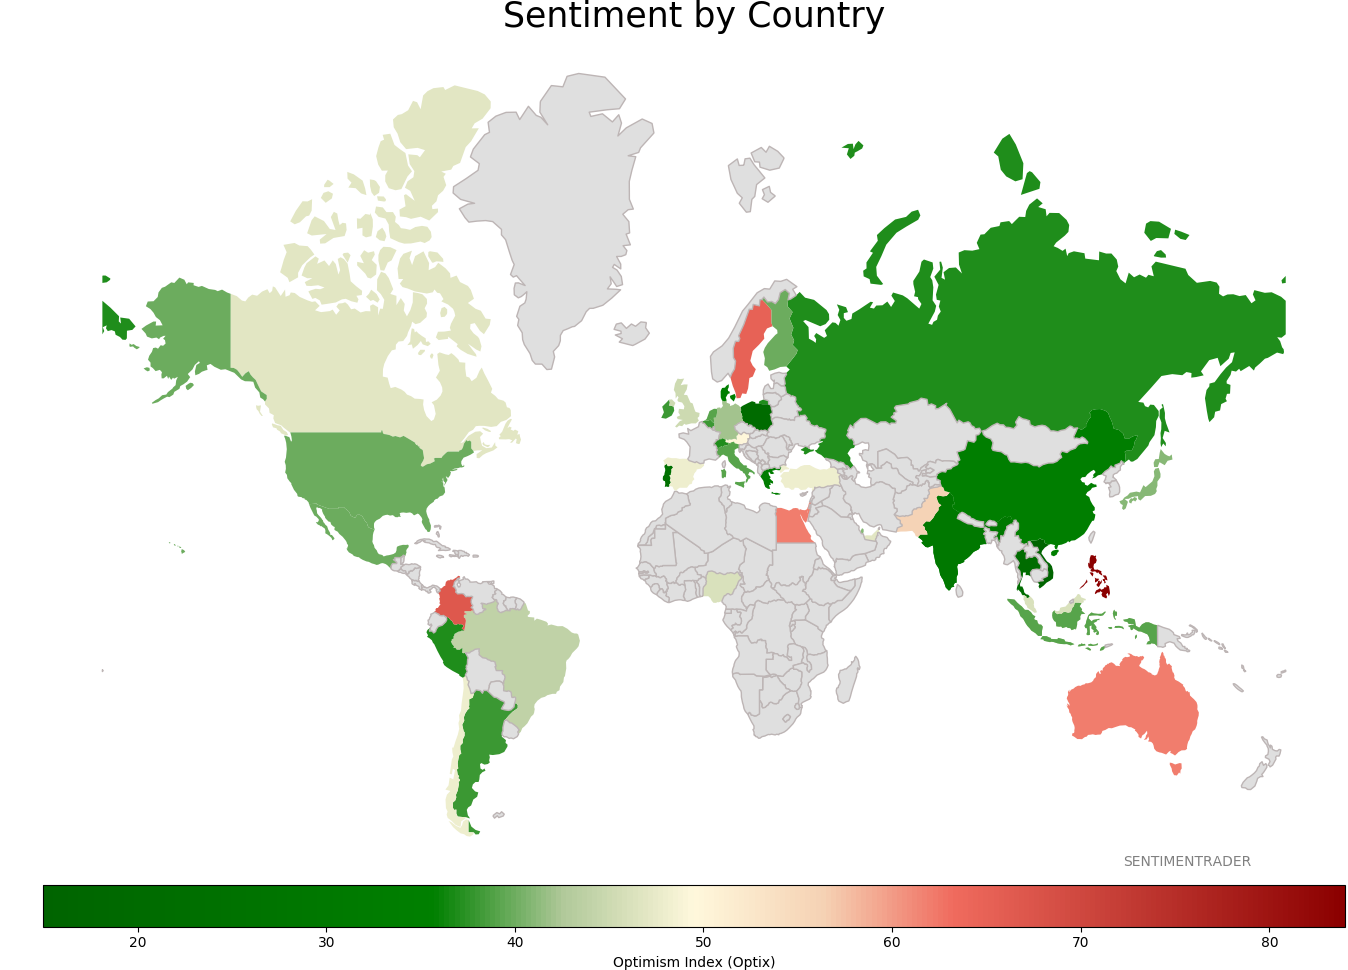
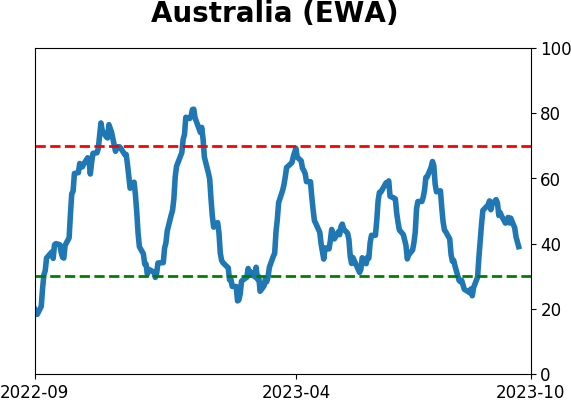
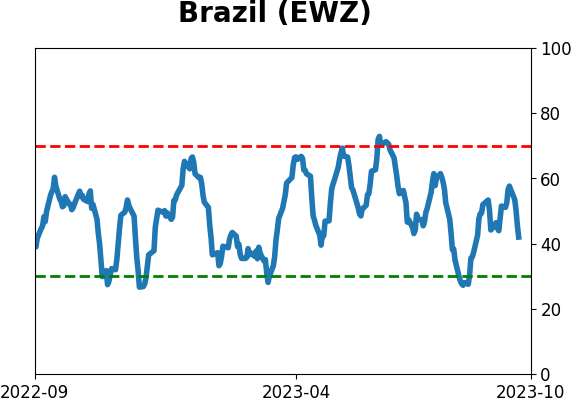
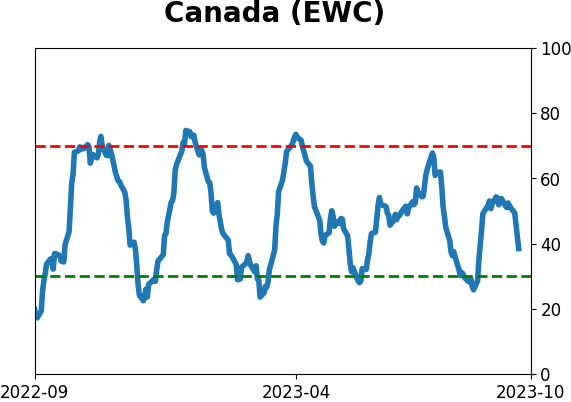
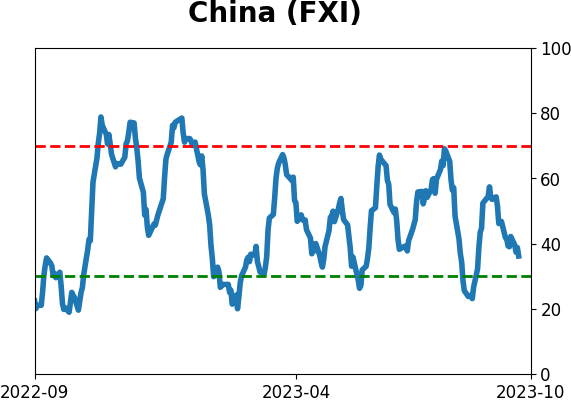
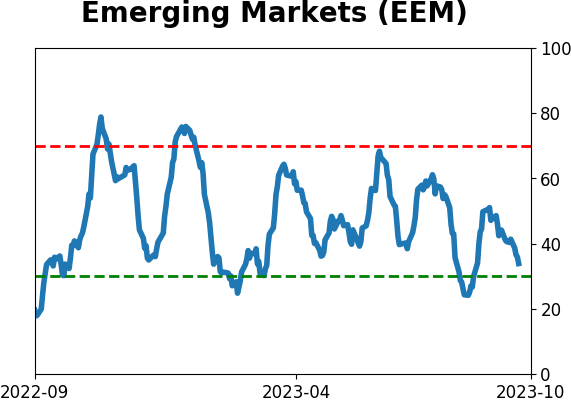
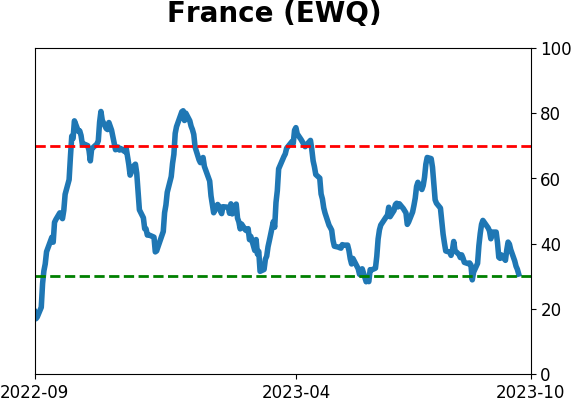
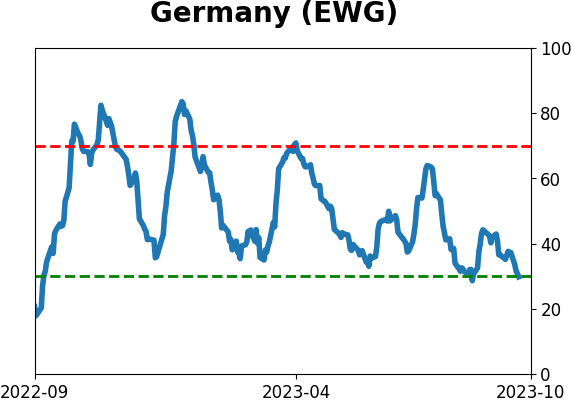
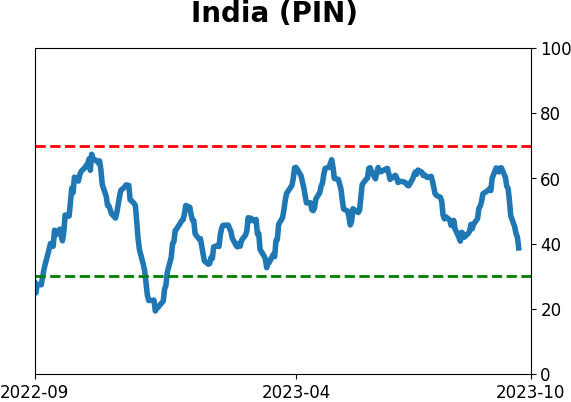
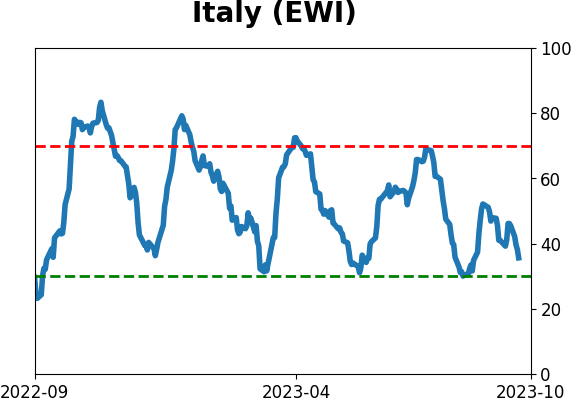
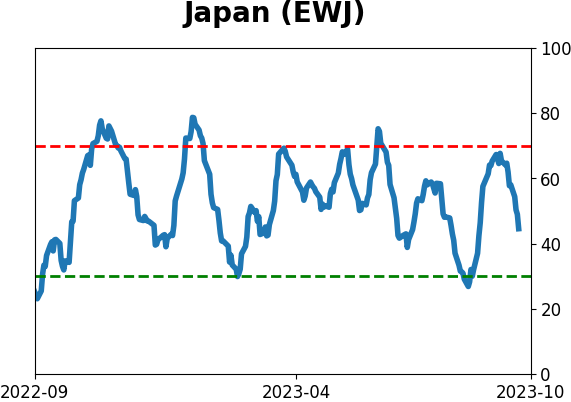
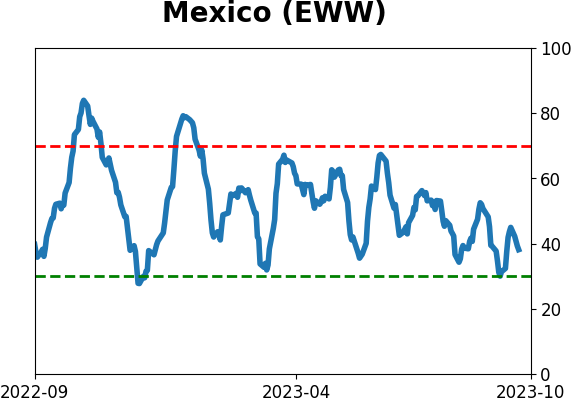
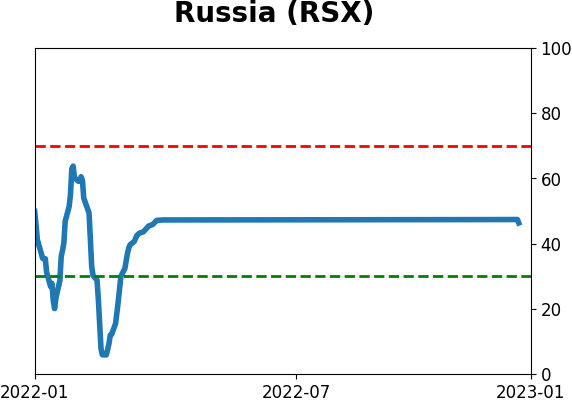
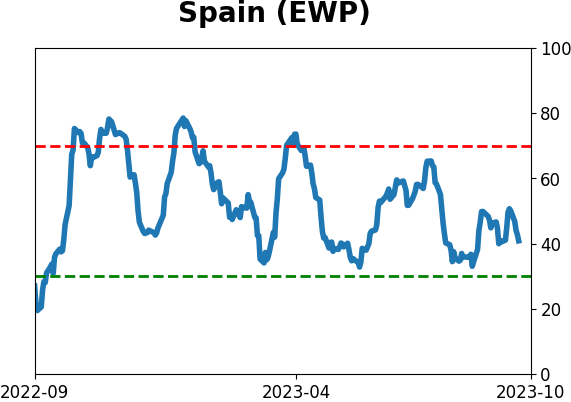
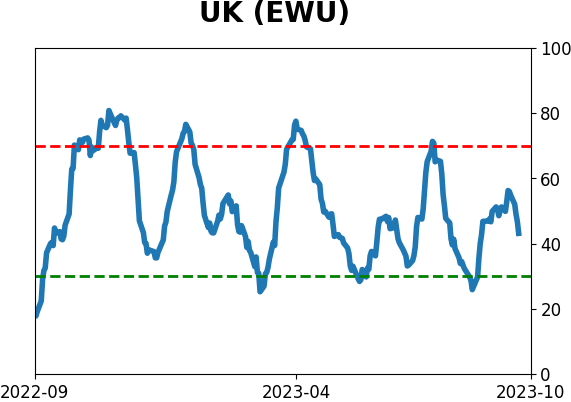
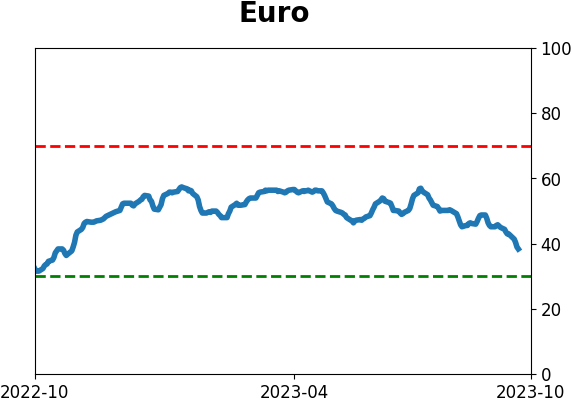
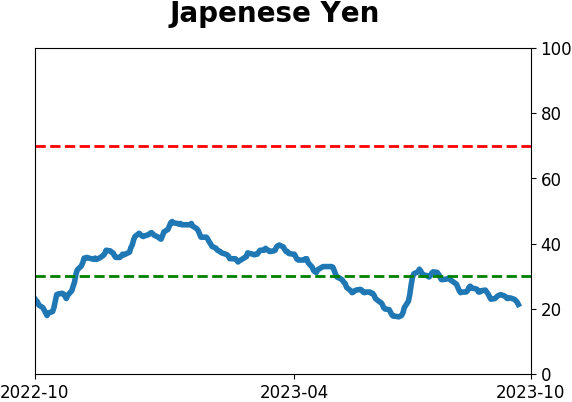
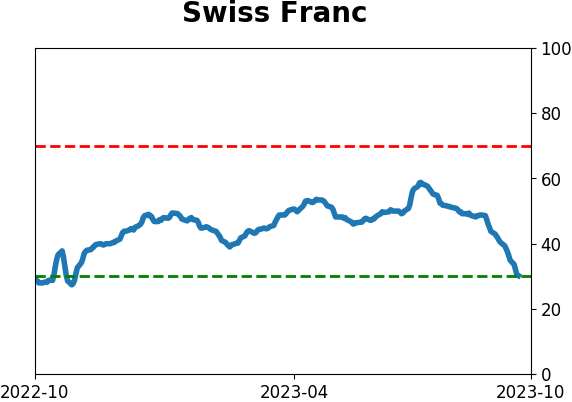
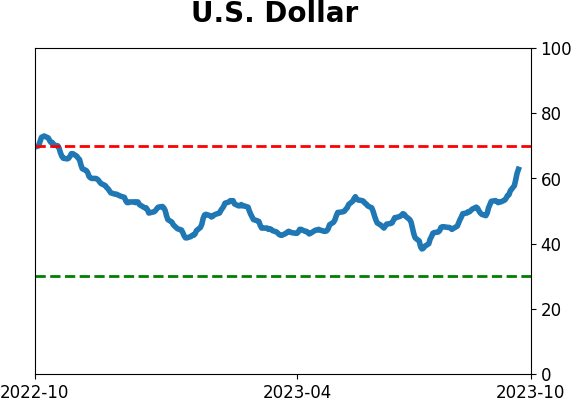
Sentiment Around The World
Optimism Index Thumbnails
|
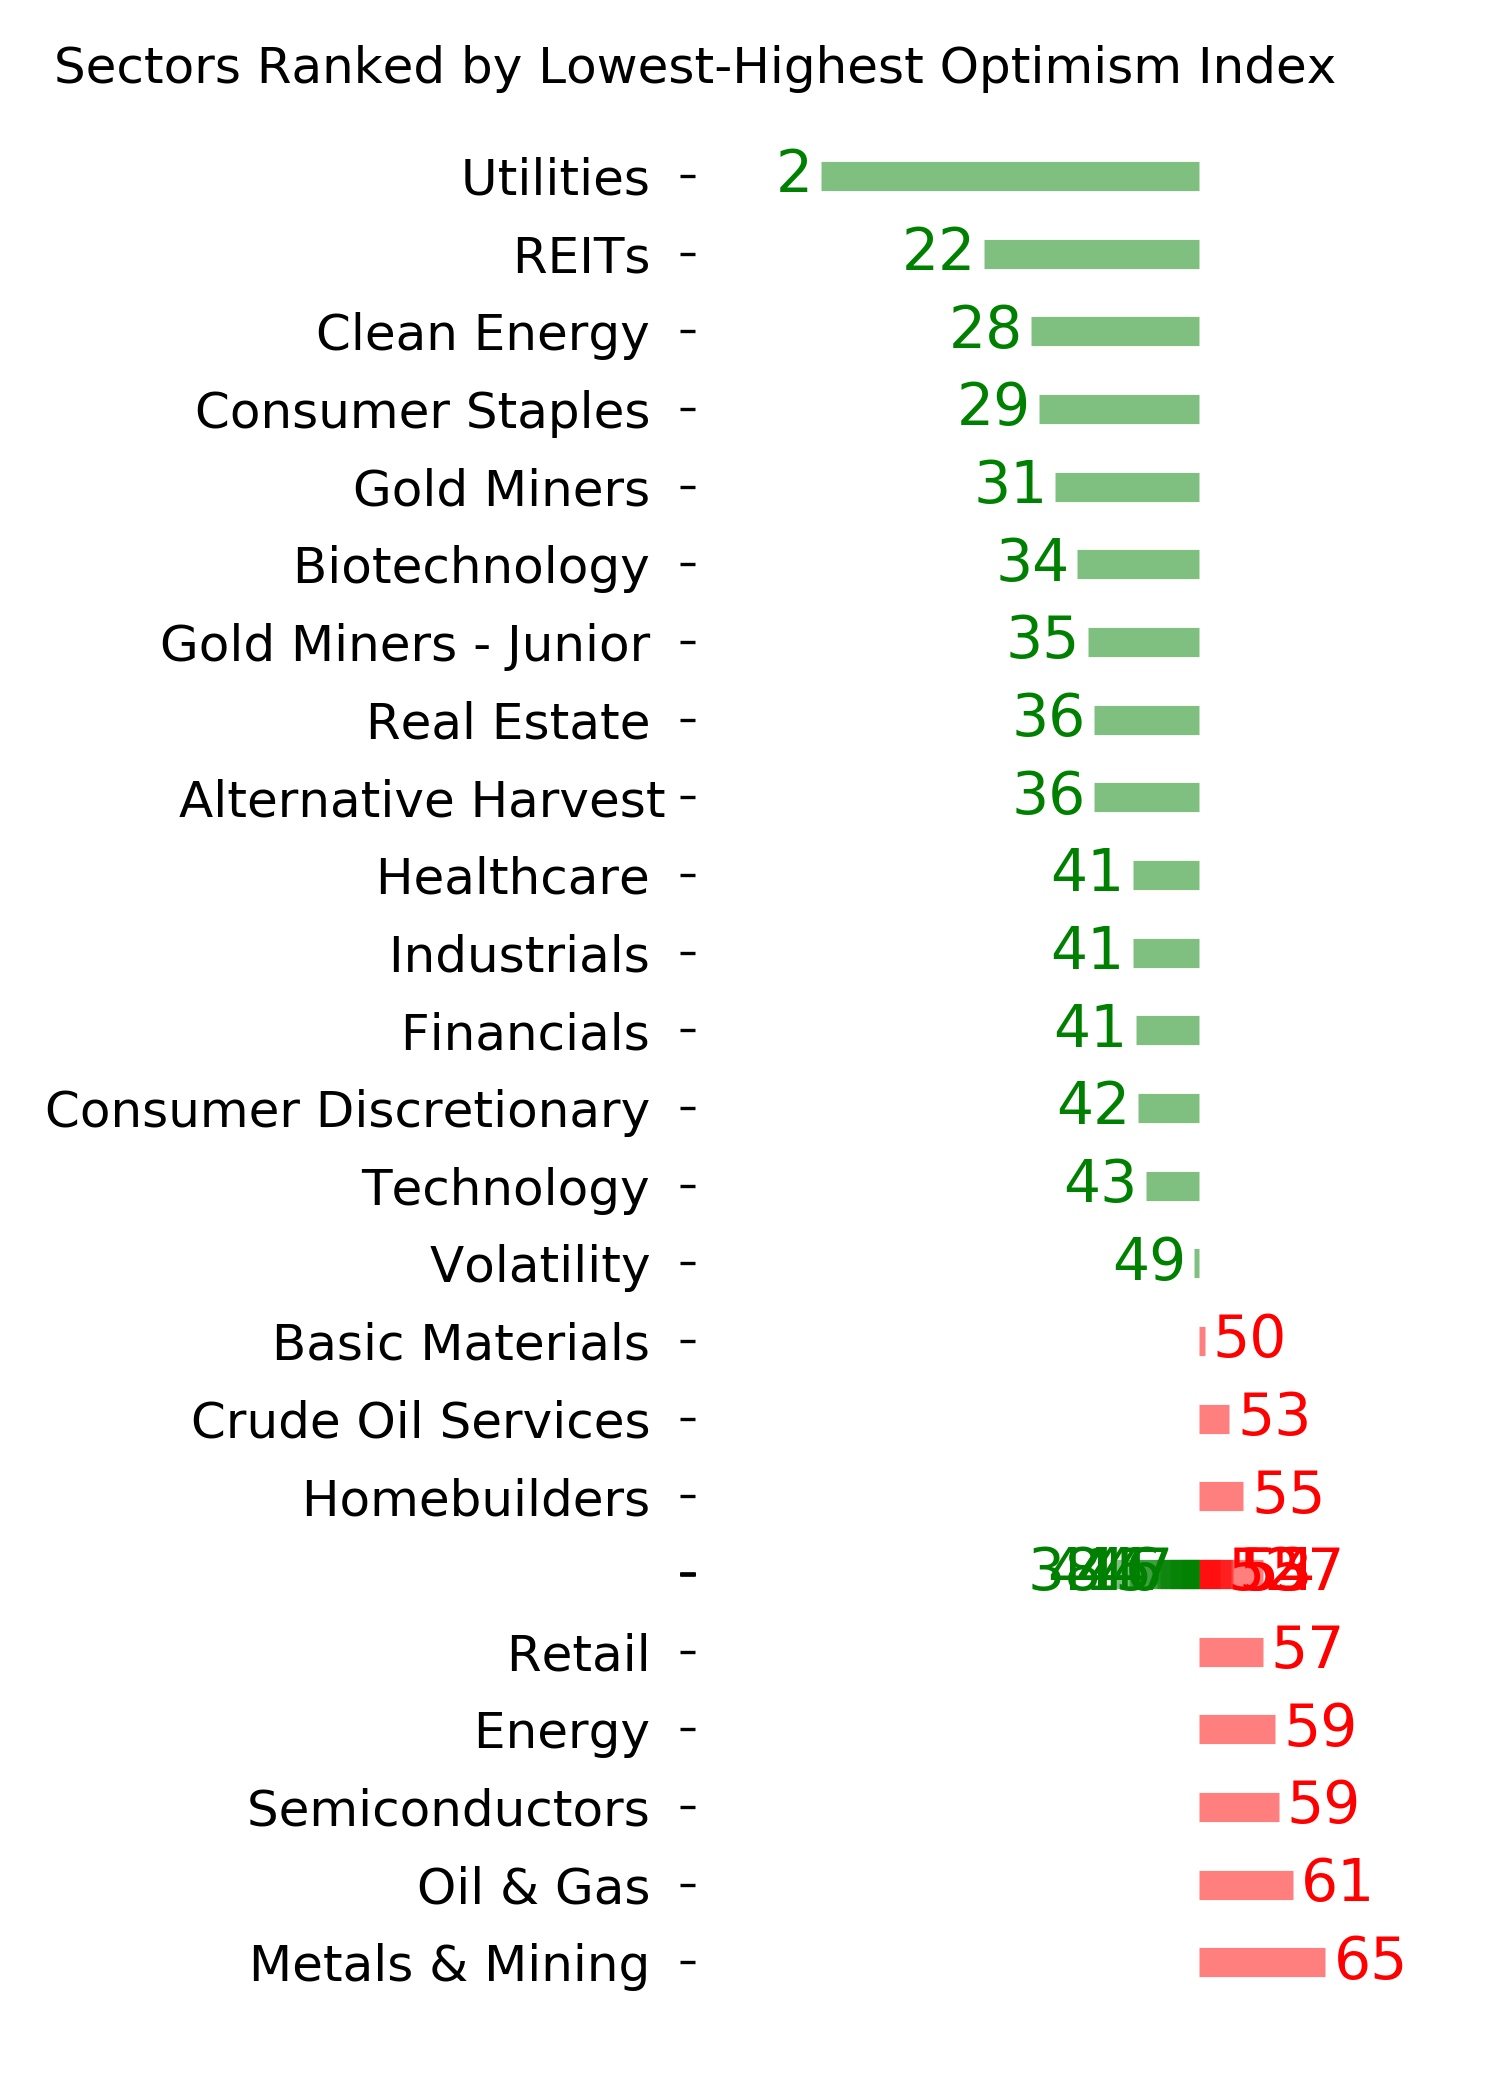
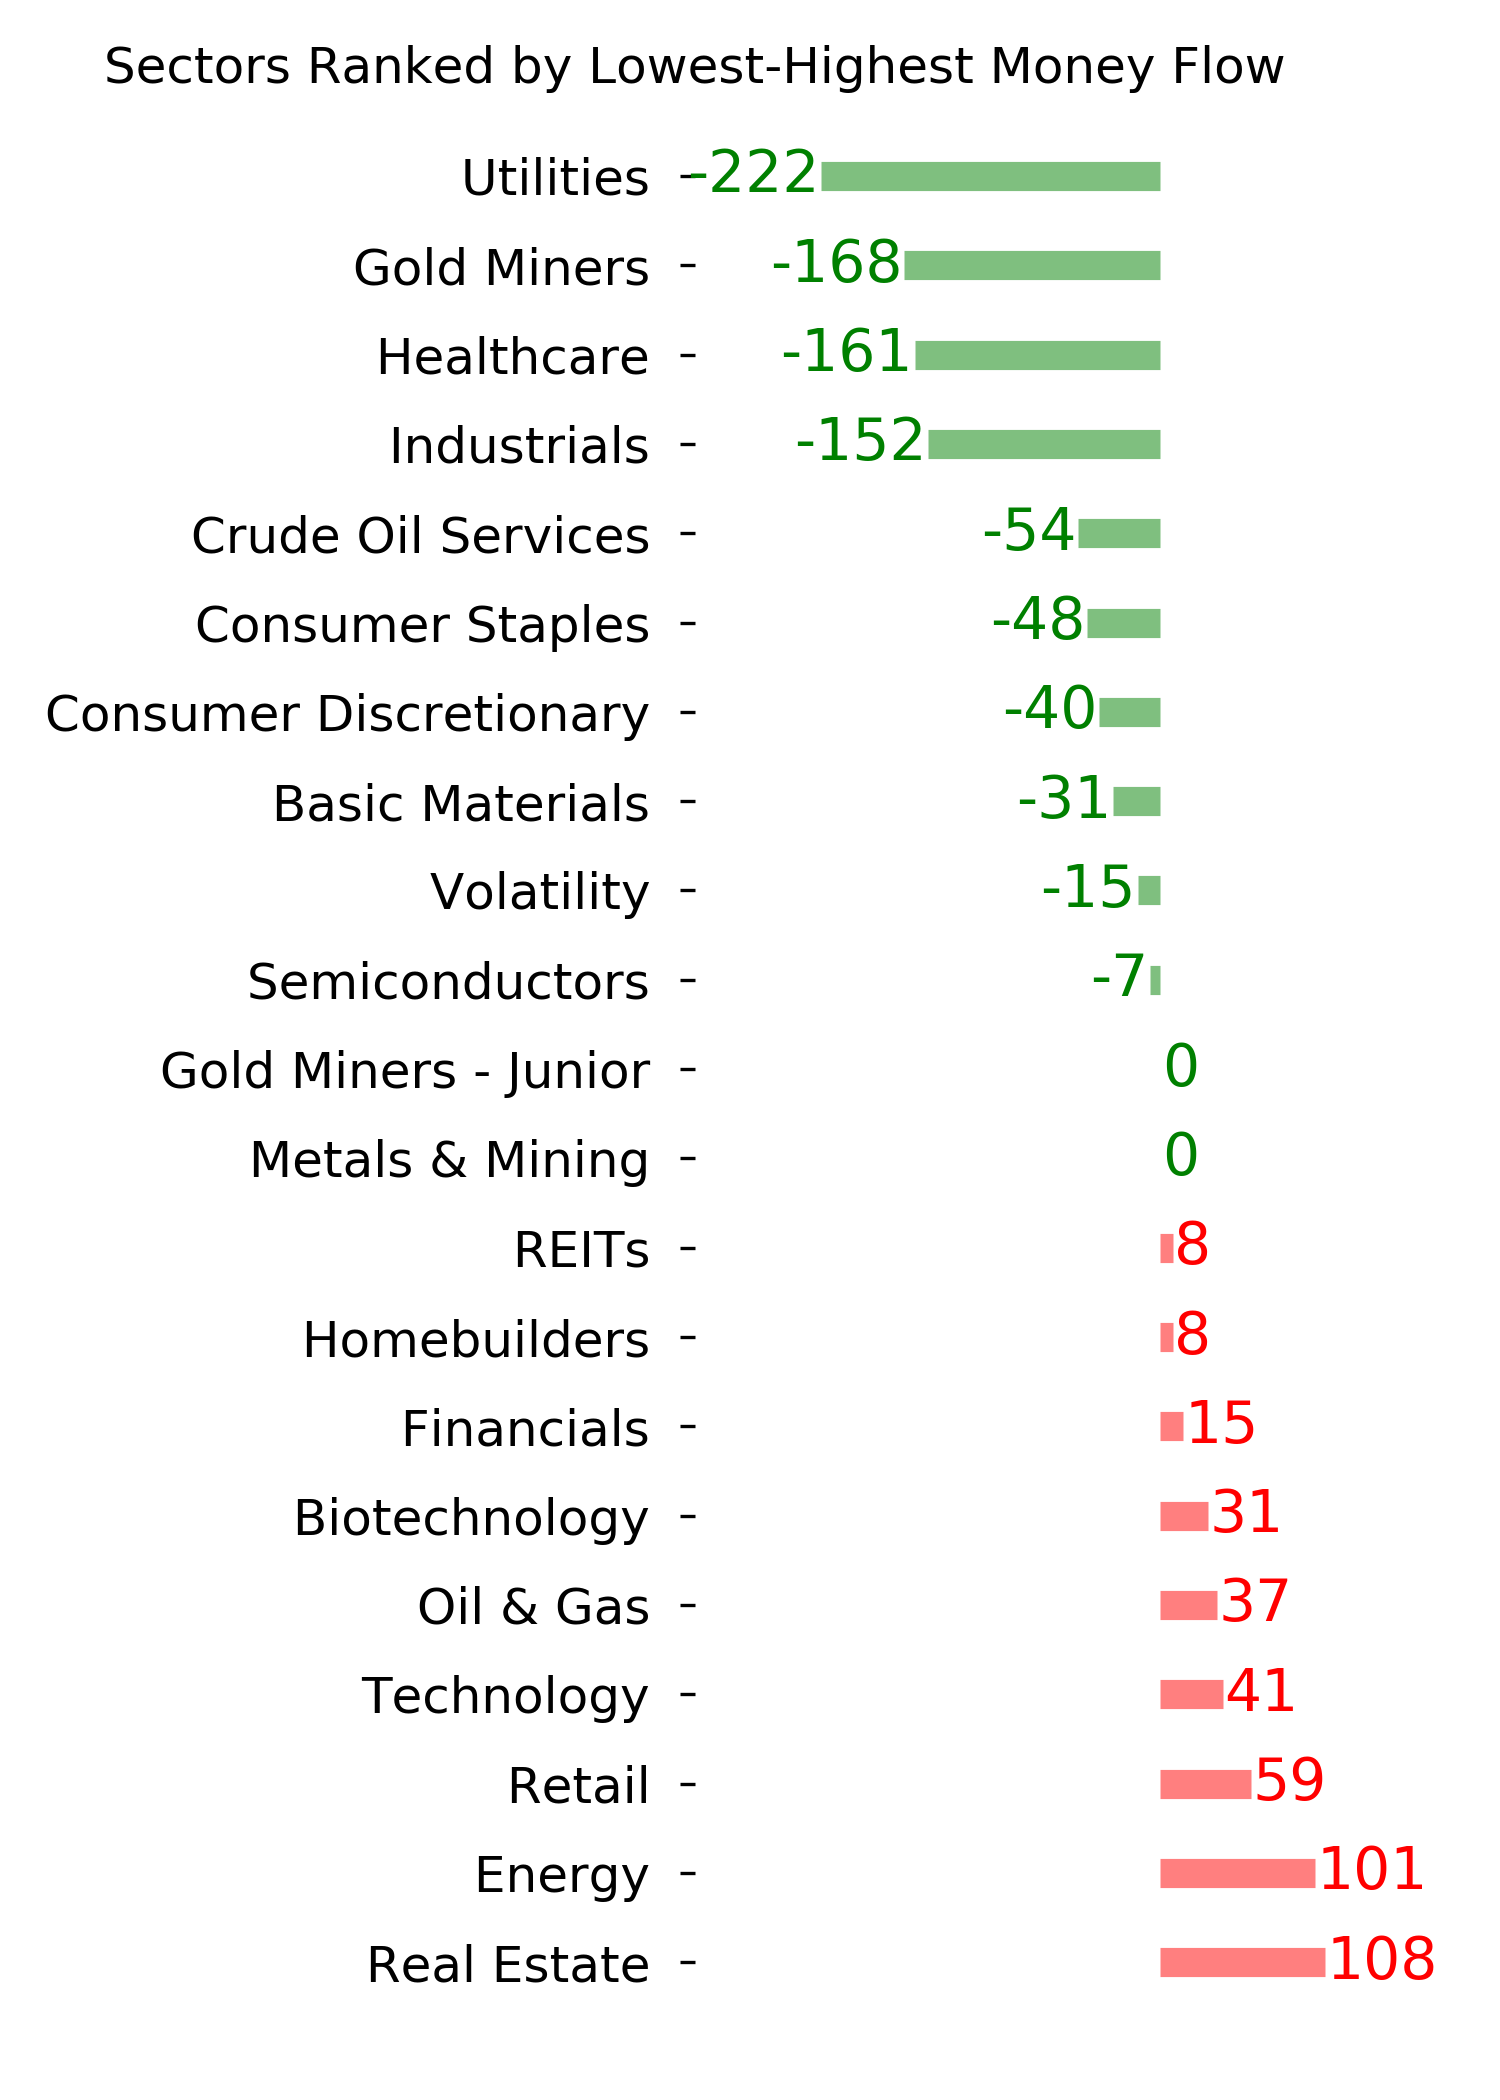
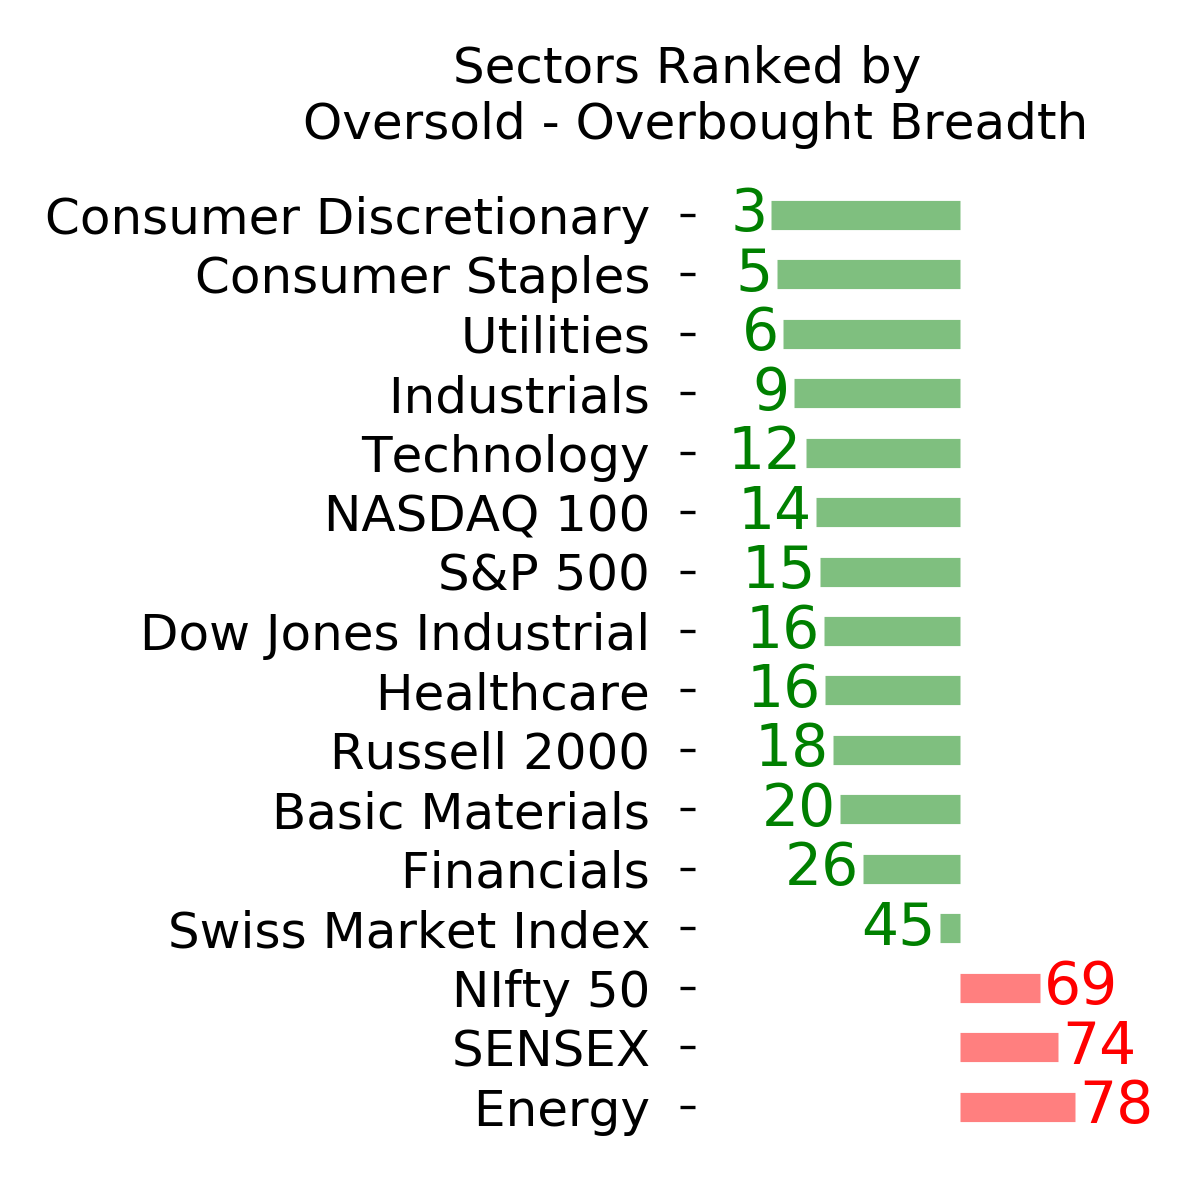
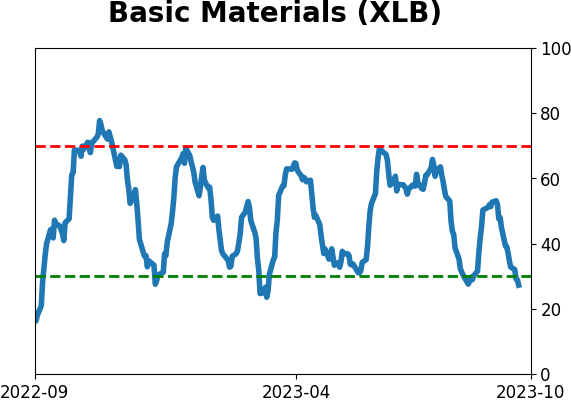
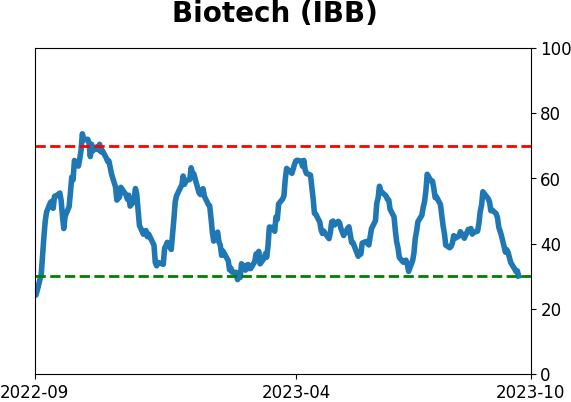
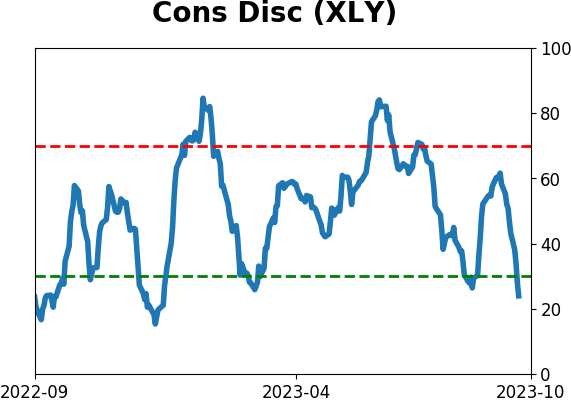
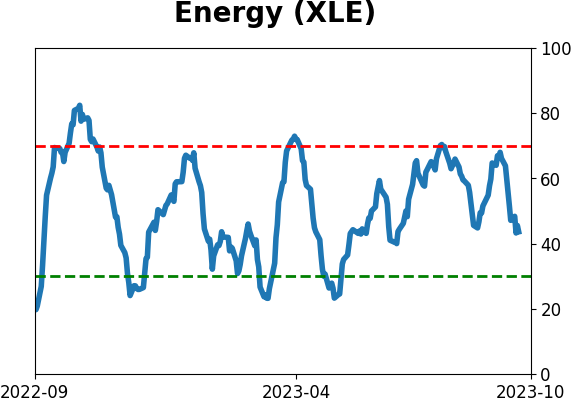
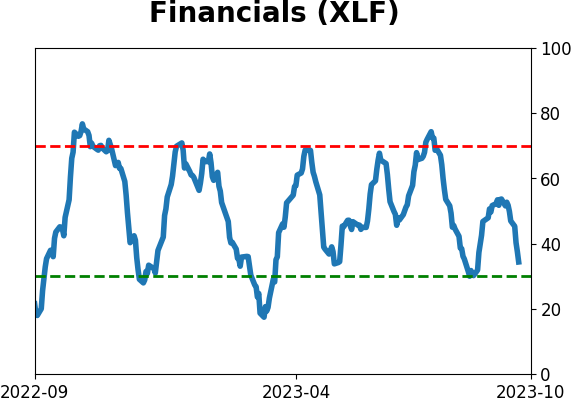
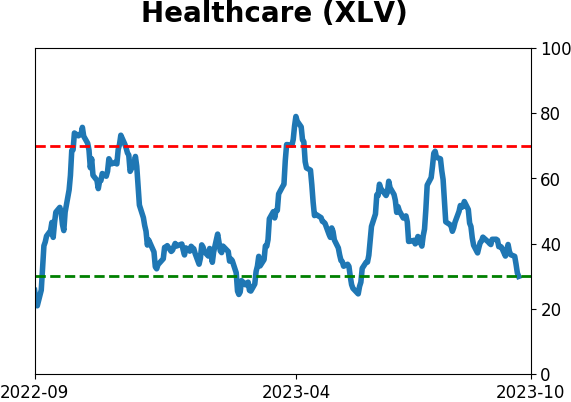
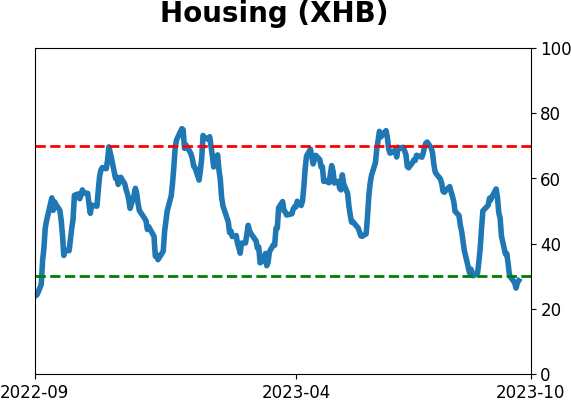
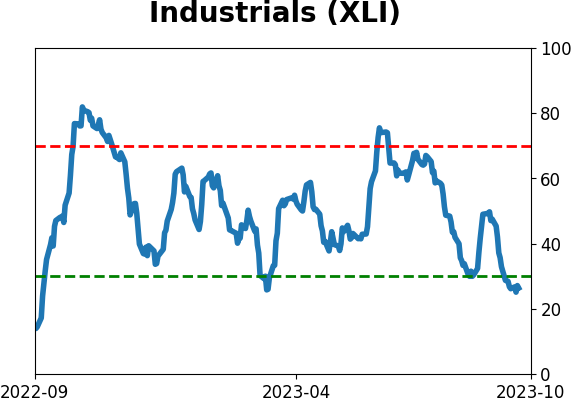
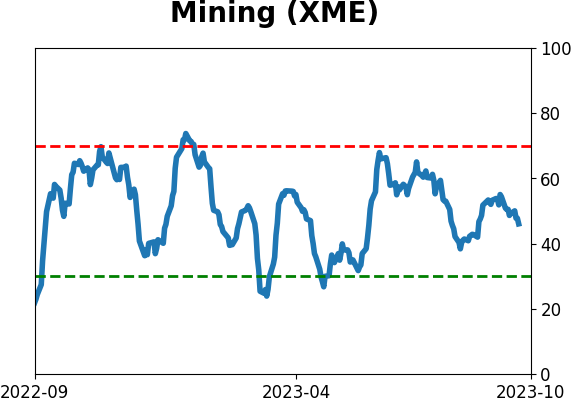
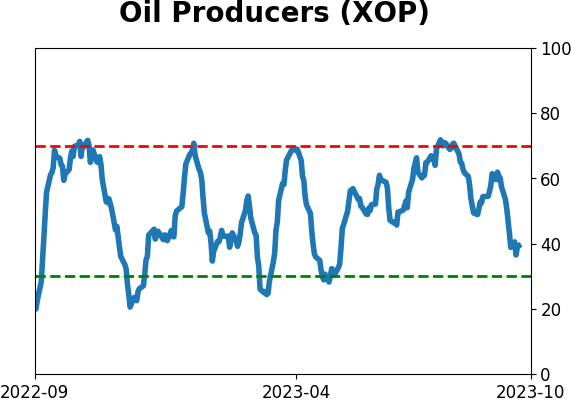
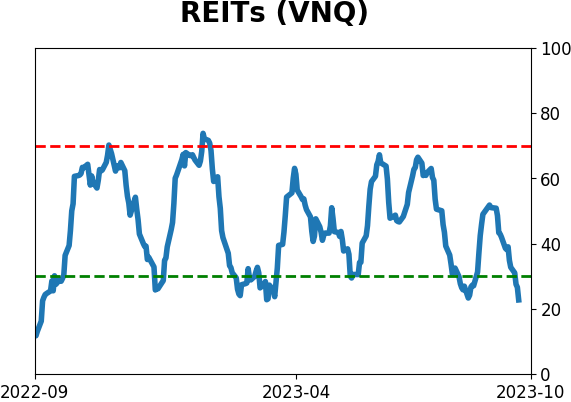
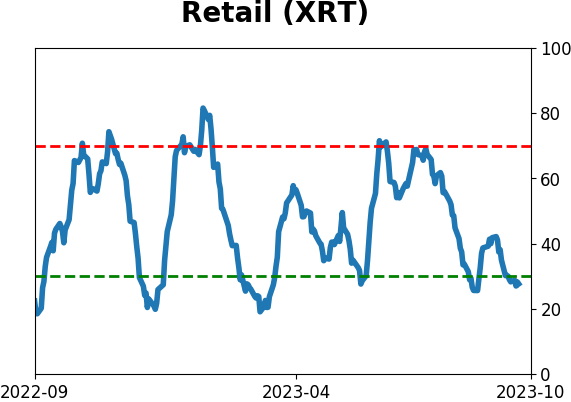
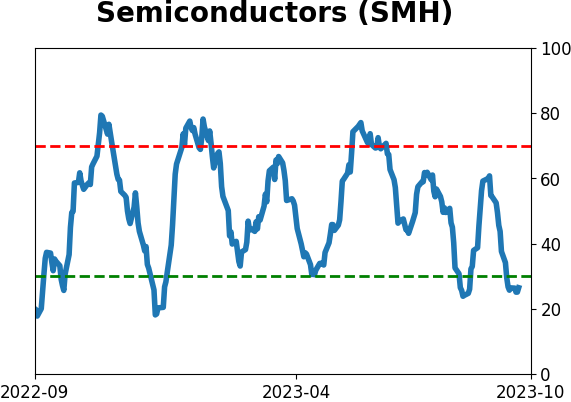
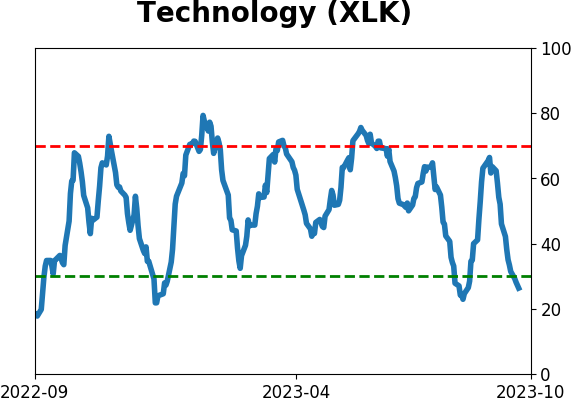
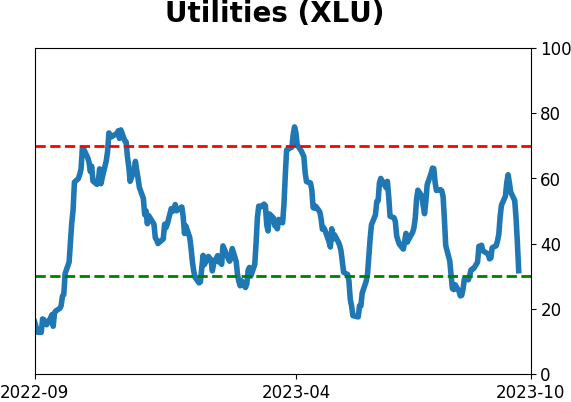
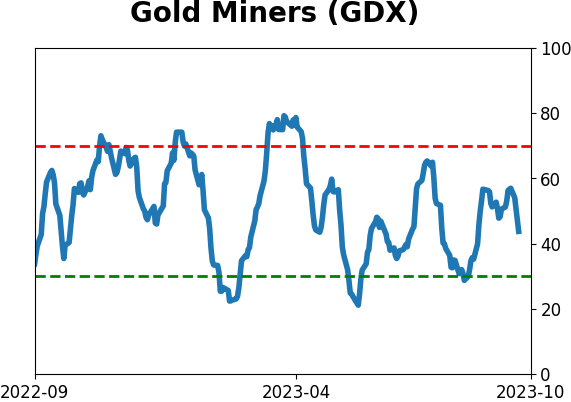
Sector ETF's - 10-Day Moving Average
|
|
|
Country ETF's - 10-Day Moving Average
|
|
|
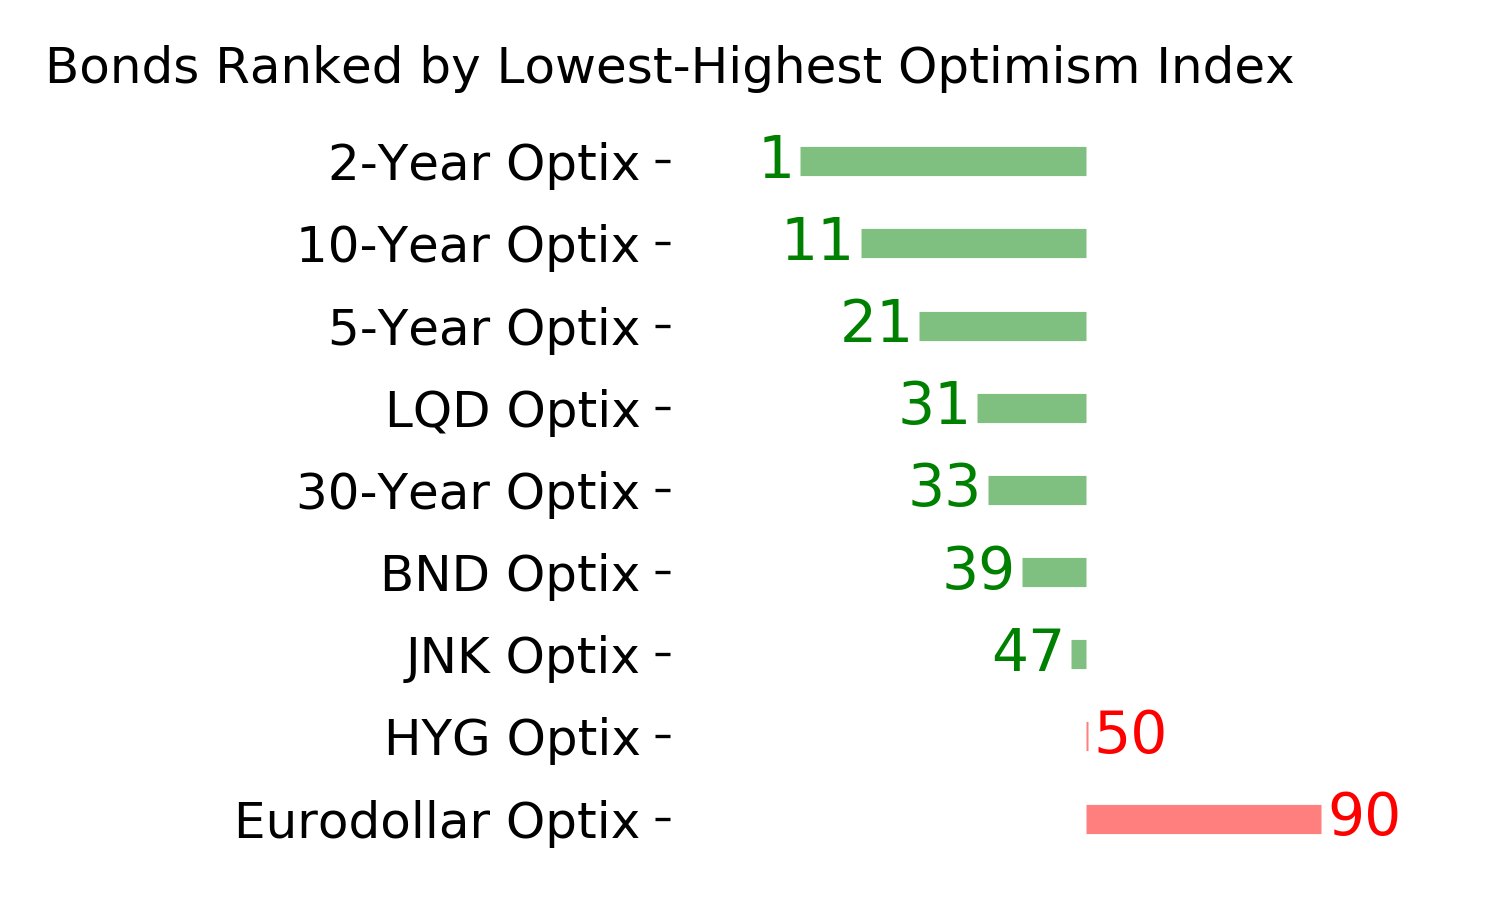
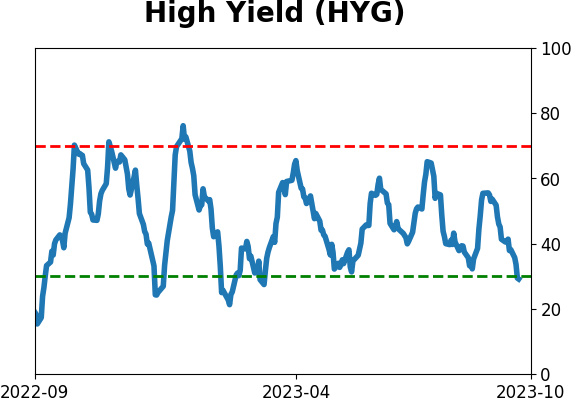
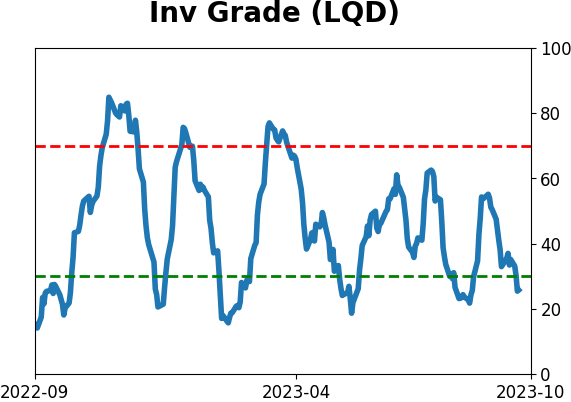
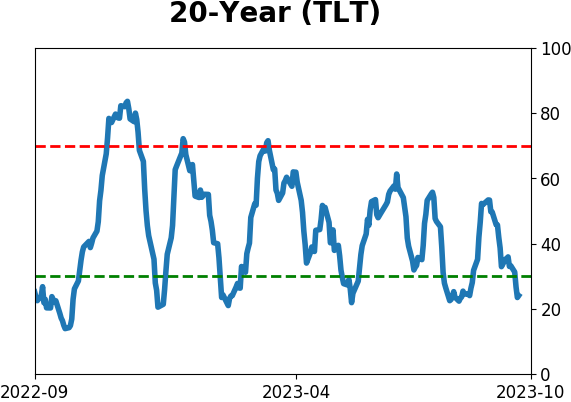
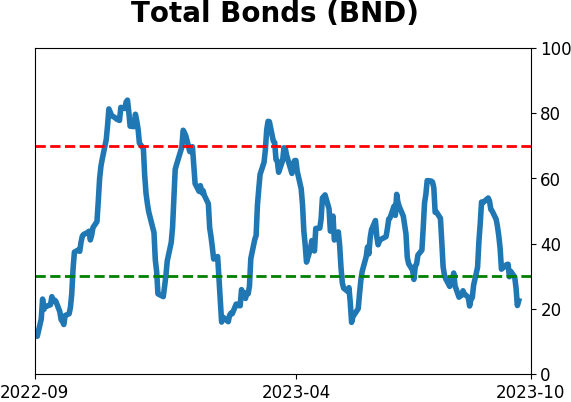
Bond ETF's - 10-Day Moving Average
|
|
|
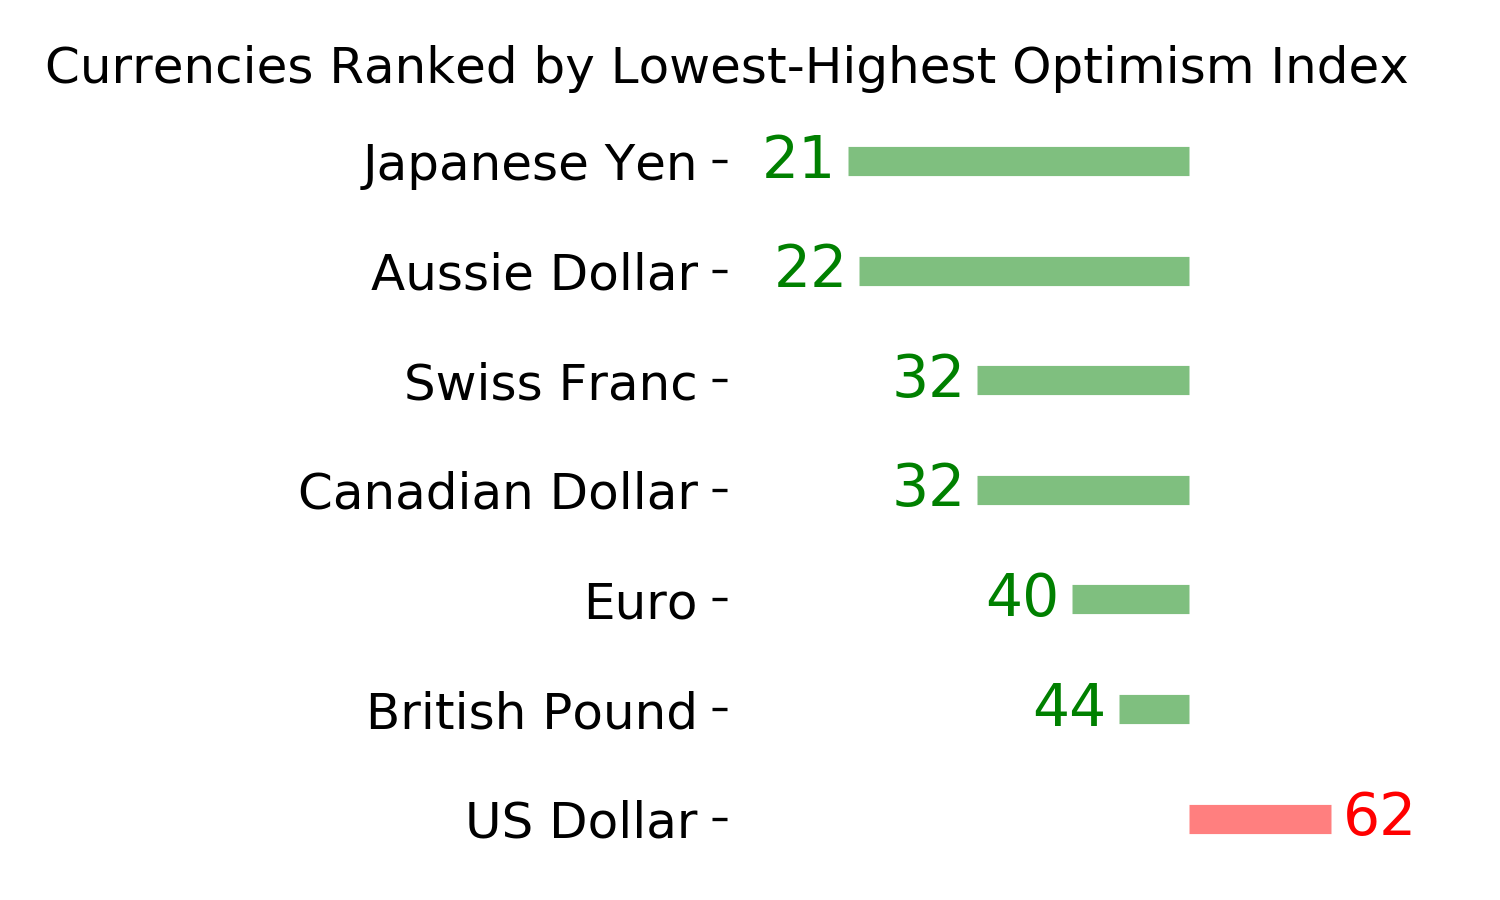
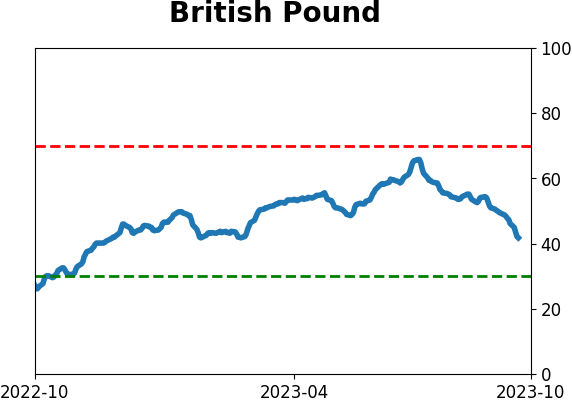
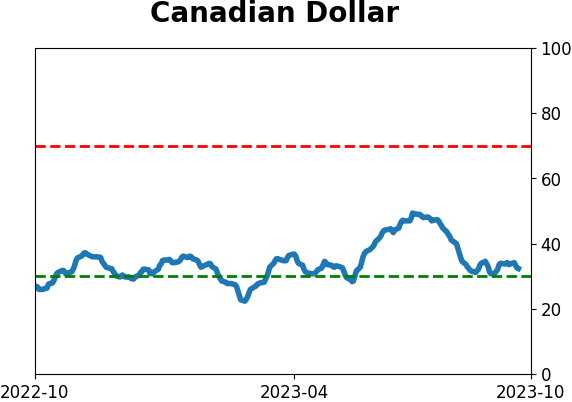
Currency ETF's - 5-Day Moving Average
|
|
|
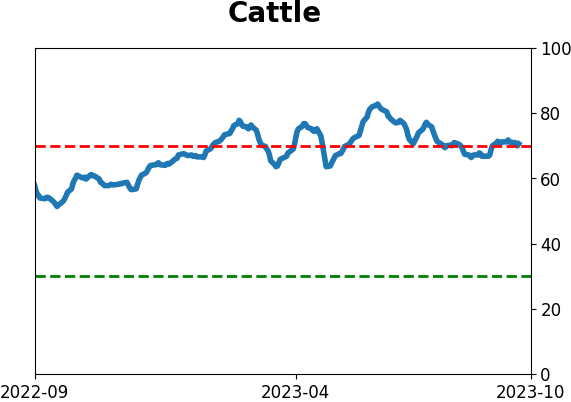
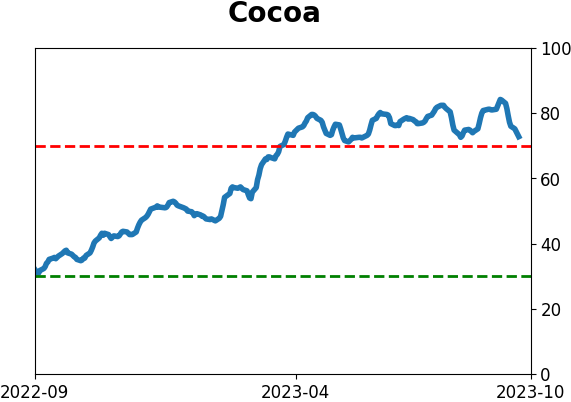
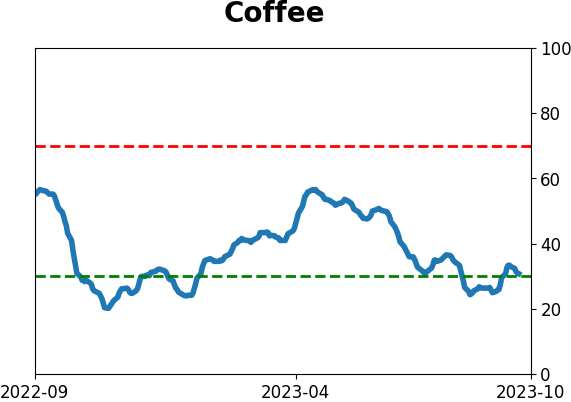
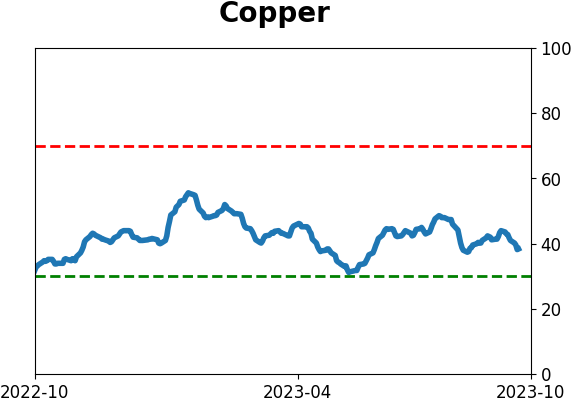
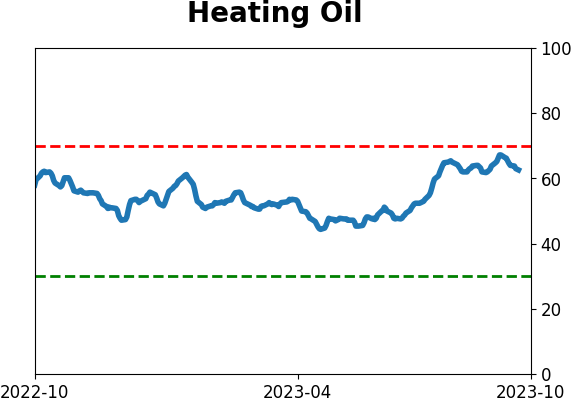
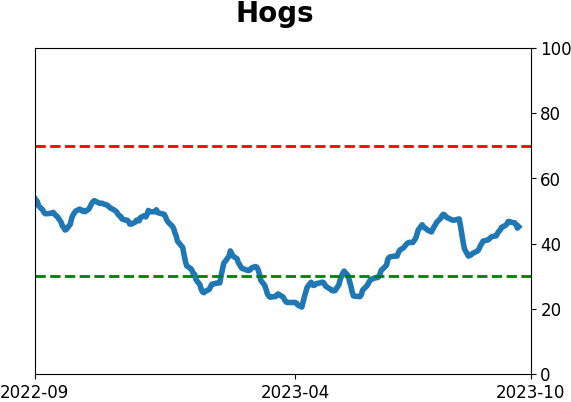
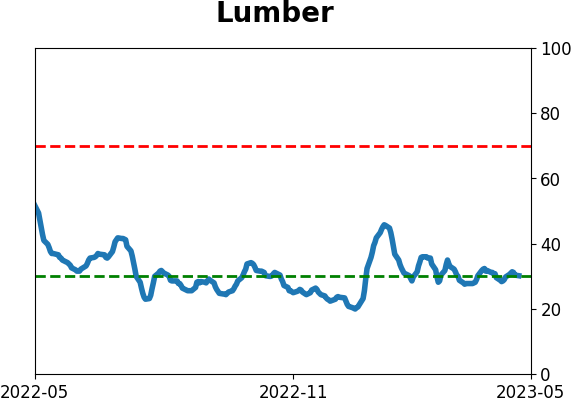
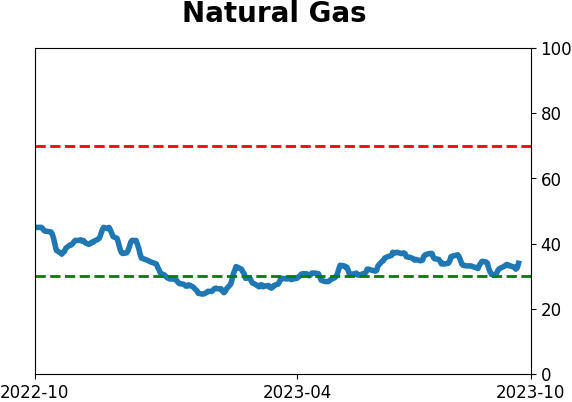
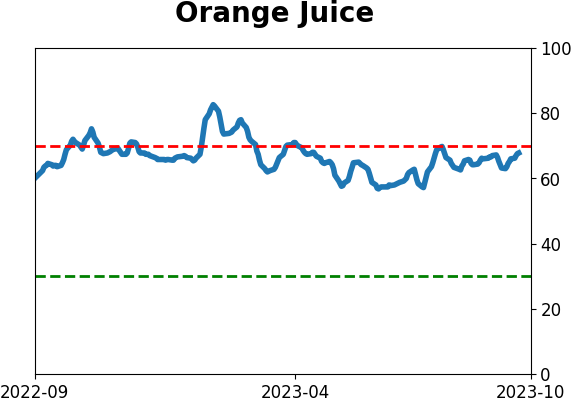
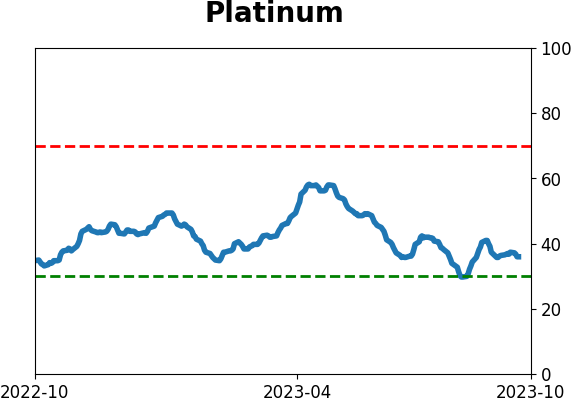
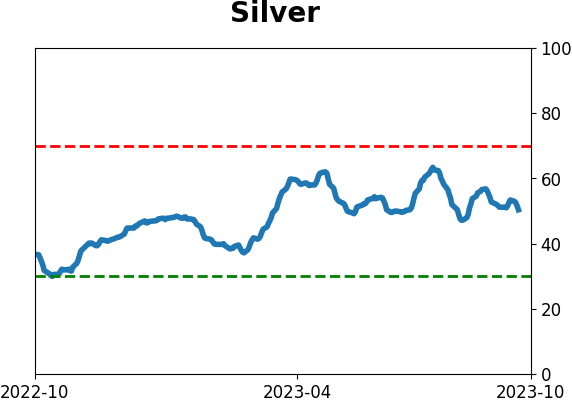
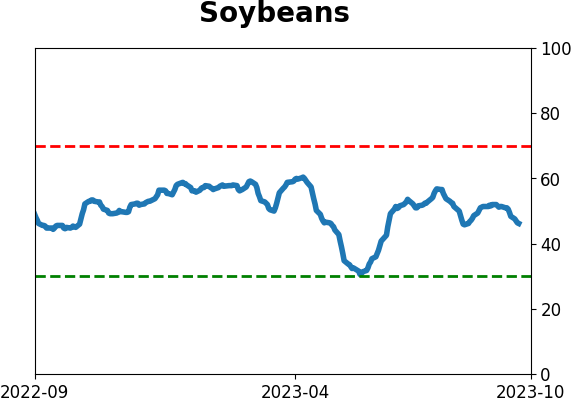
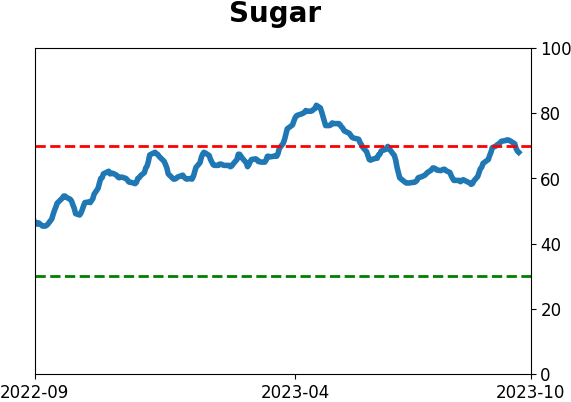
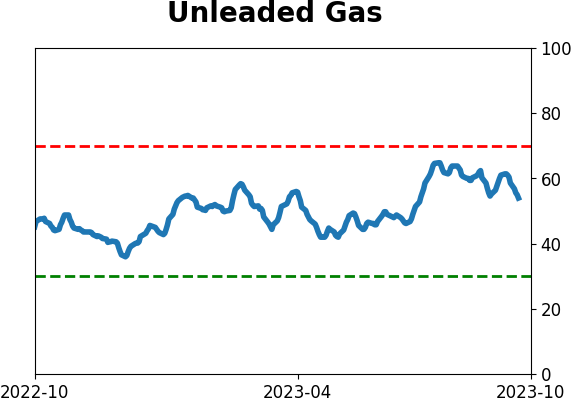
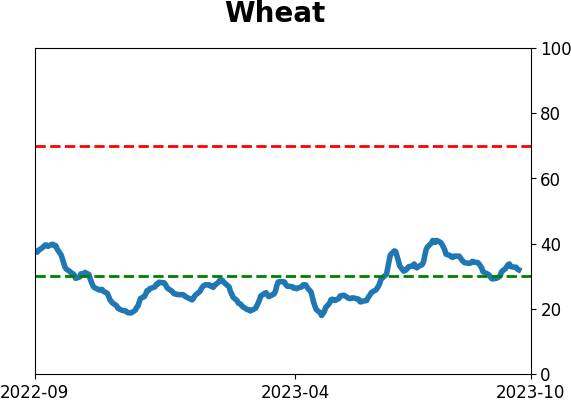
Commodity ETF's - 5-Day Moving Average
|
|