Headlines
|
|
The dollar's massive momentum:
The U.S. dollar has spiked over five different time frames, both on an absolute basis and relative to moving averages. The persistency of its rise against those moving averages is nearing record status. Positioning in futures and panic in options suggest stiff headwinds for the dollar.
|
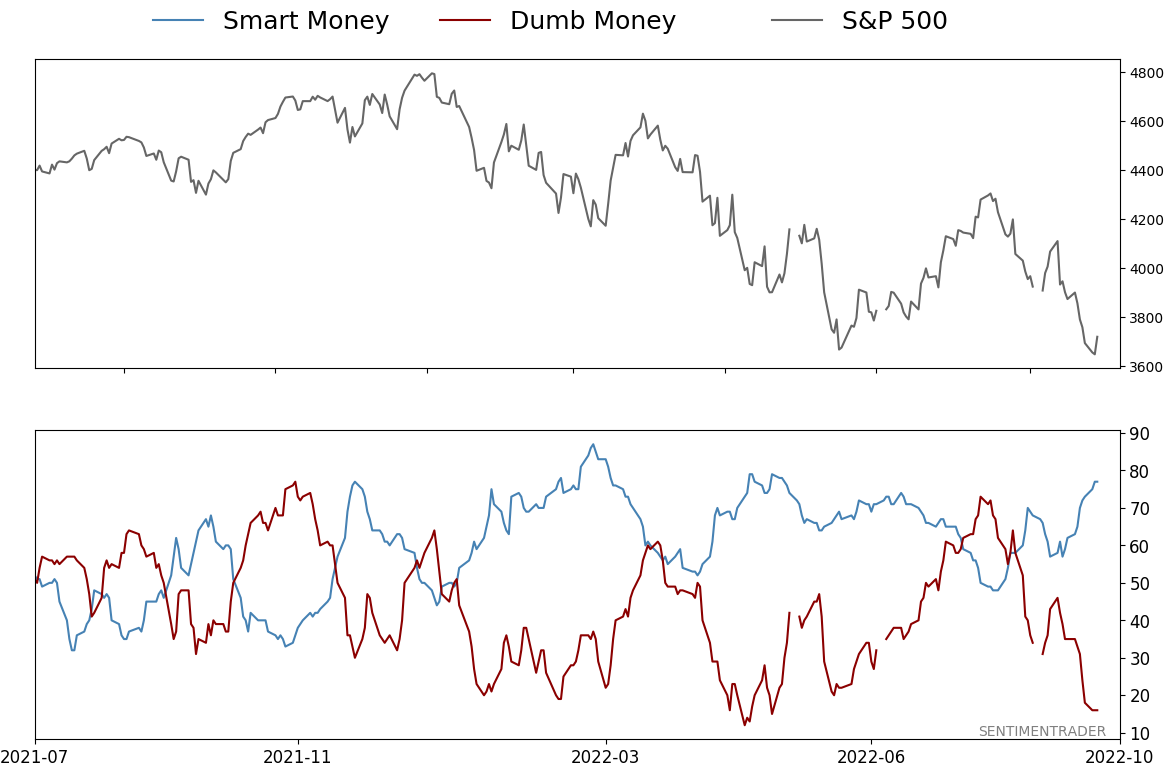
Smart / Dumb Money Confidence
|
Smart Money Confidence: 77%
Dumb Money Confidence: 16%
|
|
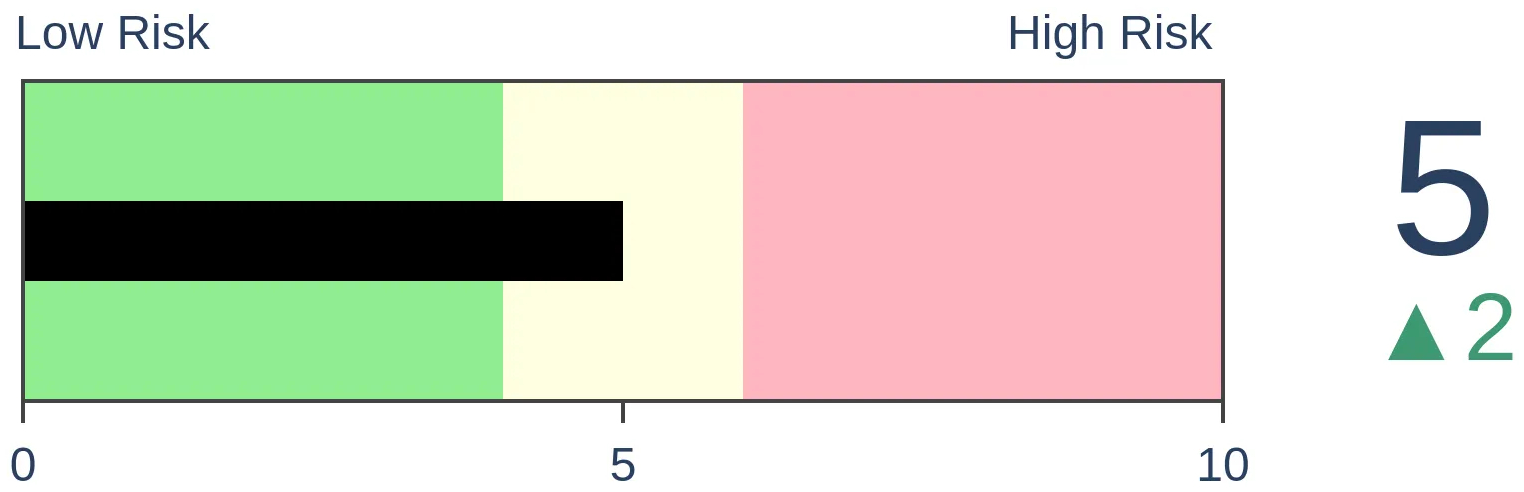
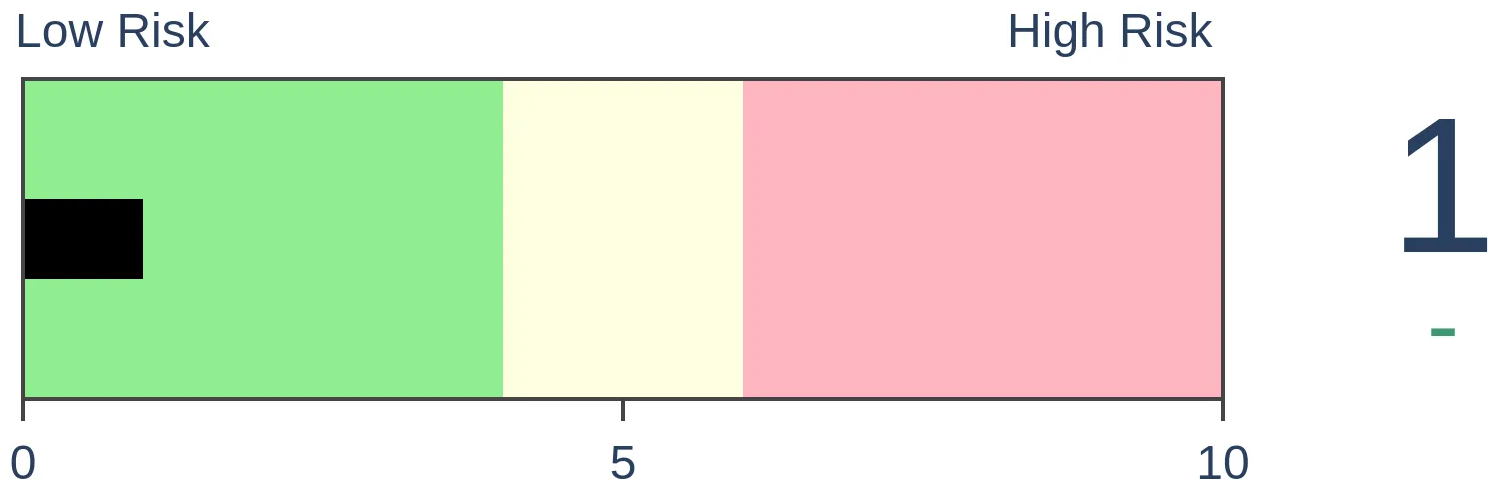
Risk Levels
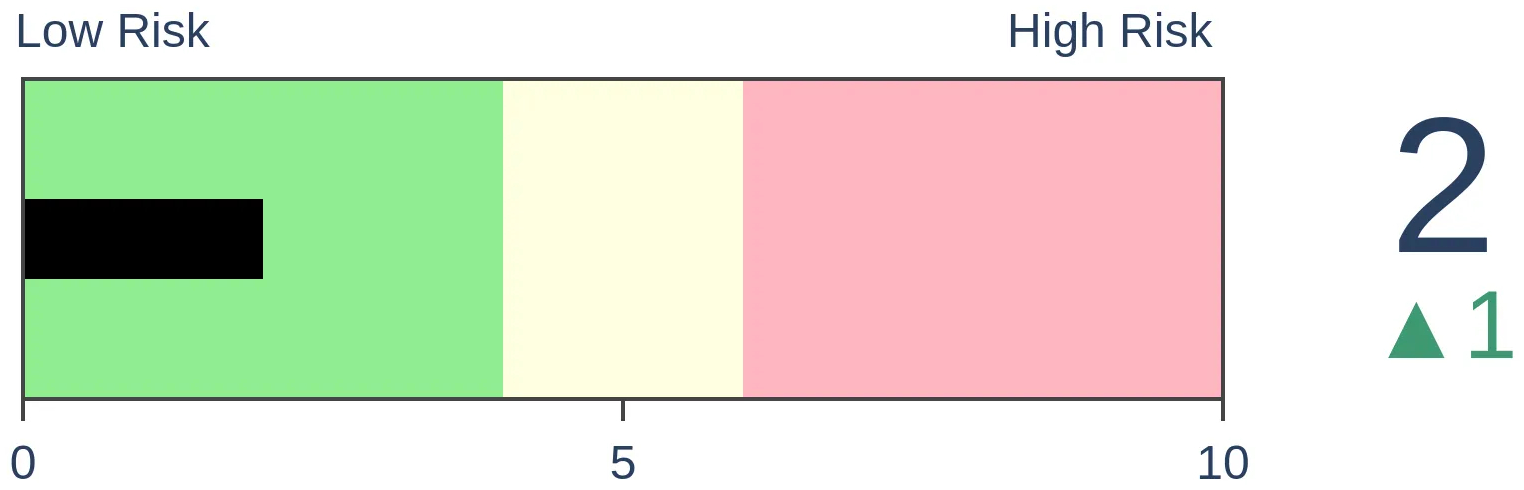
Stocks Short-Term
|
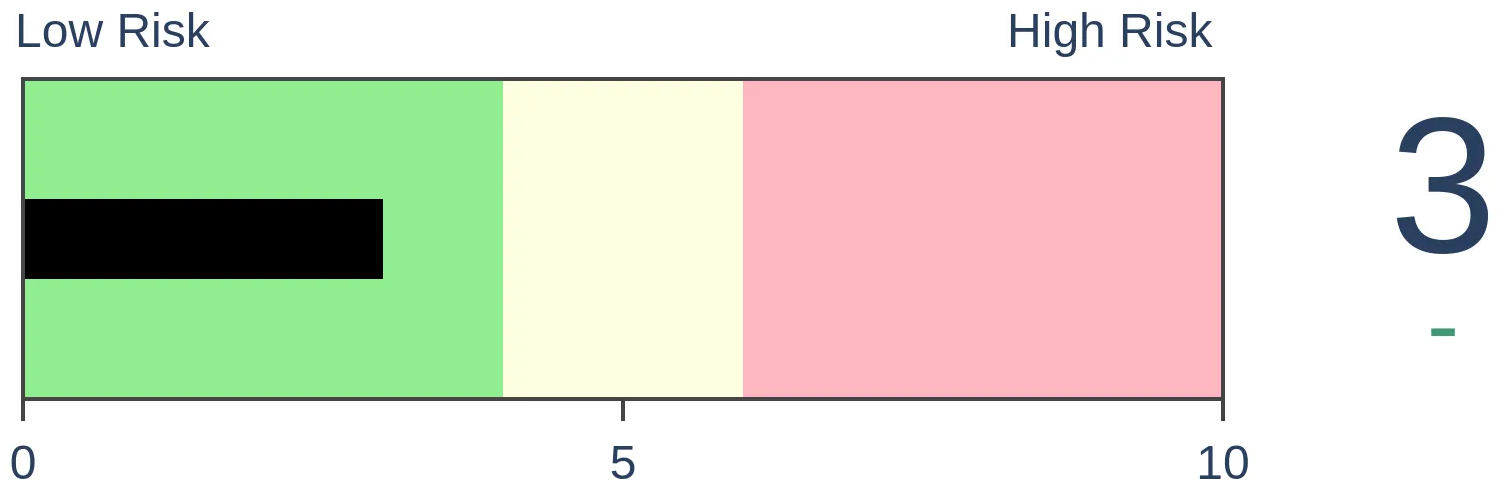
Stocks Medium-Term
|
|
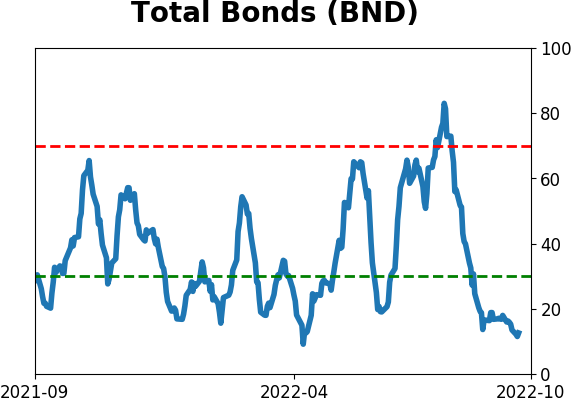
Bonds

|
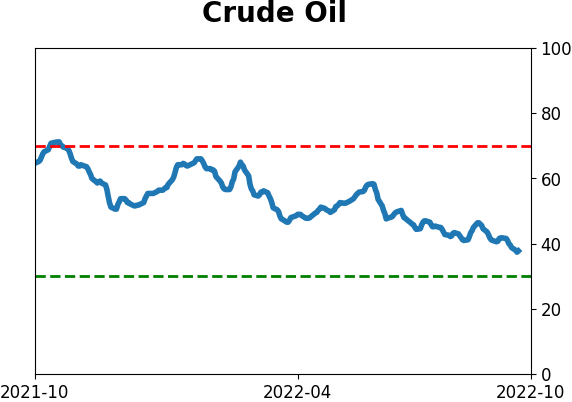
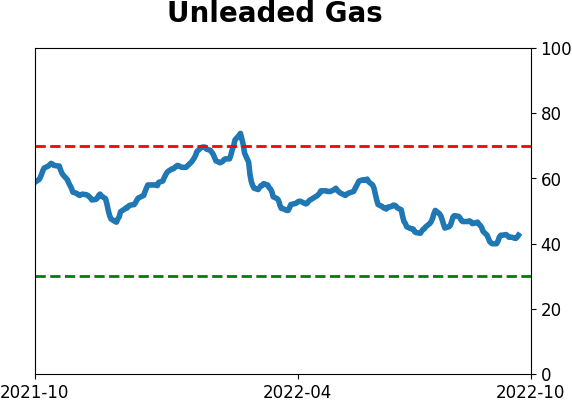
Crude Oil

|
|
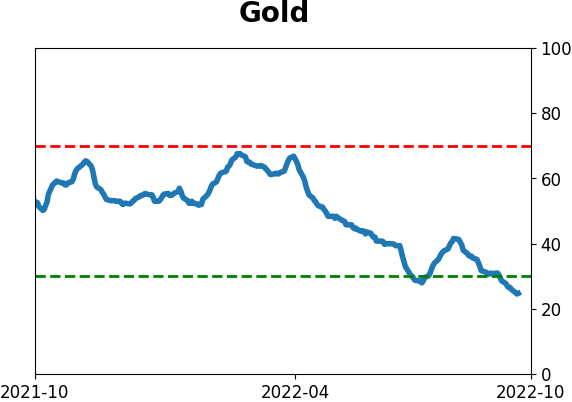
Gold
|
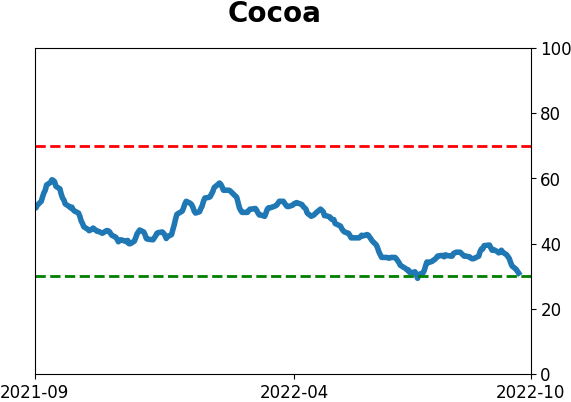
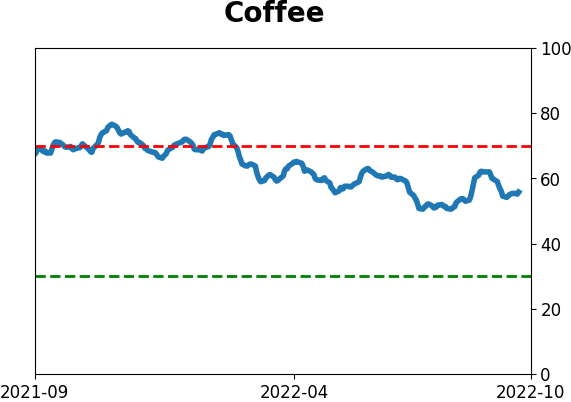
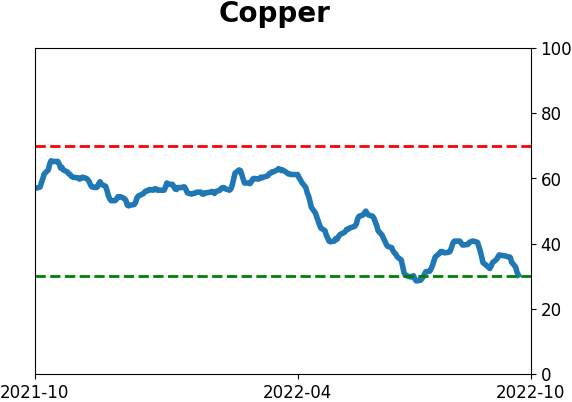
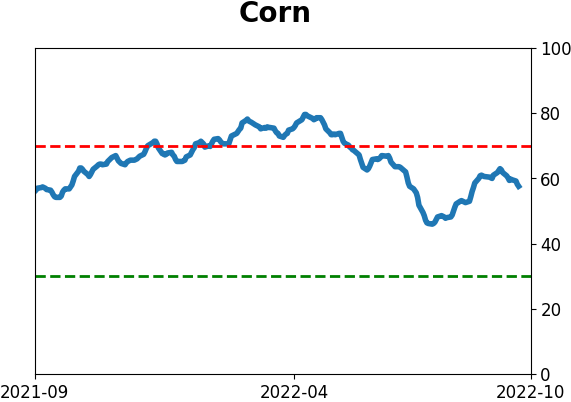
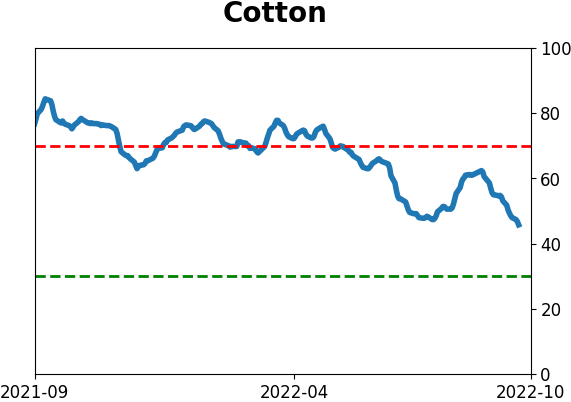
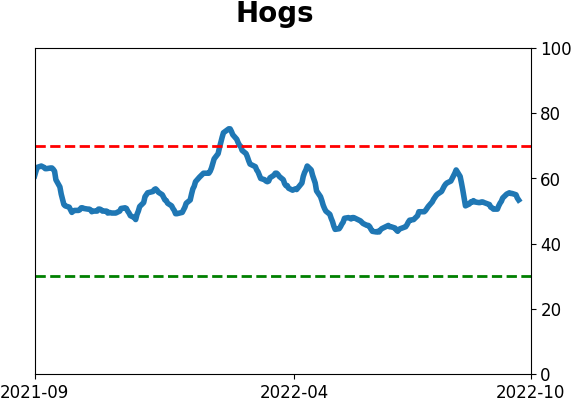
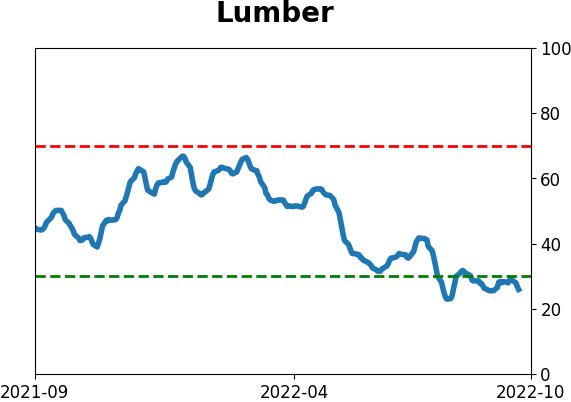
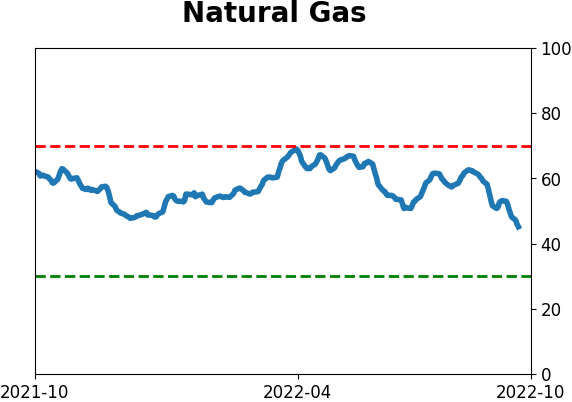
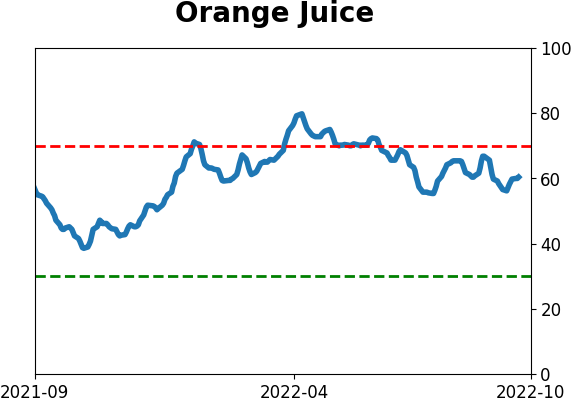
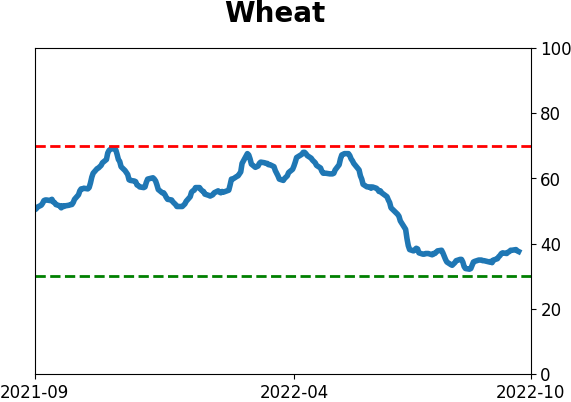
Agriculture
|
|
Research
By Jason Goepfert
BOTTOM LINE
The U.S. dollar has spiked over five different time frames, both on an absolute basis and relative to moving averages. The persistency of its rise against those moving averages is nearing record status. Positioning in futures and panic in options suggest stiff headwinds for the dollar.
FORECAST / TIMEFRAME
None
|
Key points:
- The dollar has spiked over a handful of time frames, nearing 47-year extremes
- Its persistency against five moving averages is approaching a record
- Heavy positioning in futures and panic in options further suggest headwinds for the dollar
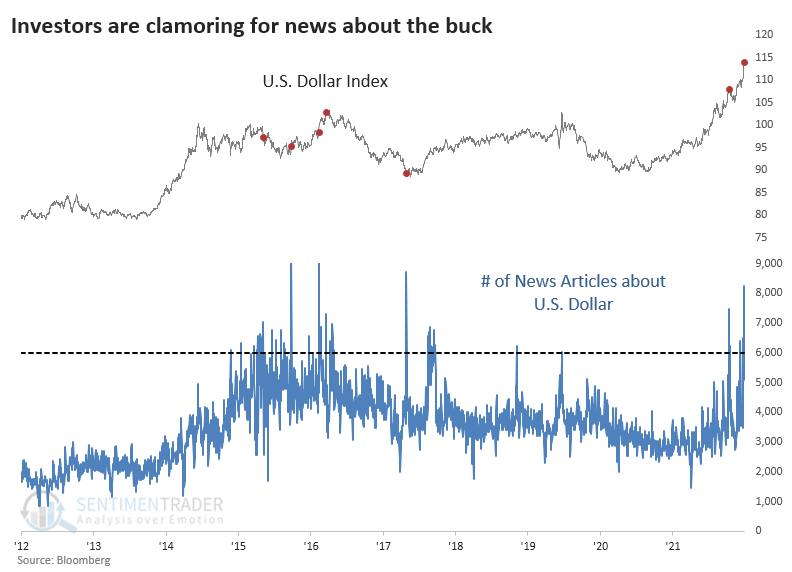
The dollar is getting attention for its historic trendiness
With the U.S. dollar being blamed for asset declines (or credit if you're a short-seller), investors are becoming more tuned to its daily wiggles. The number of daily news articles mentioning the dollar has skyrocketed the most in at least five years.
Almost invariably, those "wiggles" have been to the upside. Over five time periods, the dollar's rate of change has reached rarified air. We're looking at 10, 20, 50, 100, and 200 days for these purposes. The buck has jumped nearly 9% over those time frames.
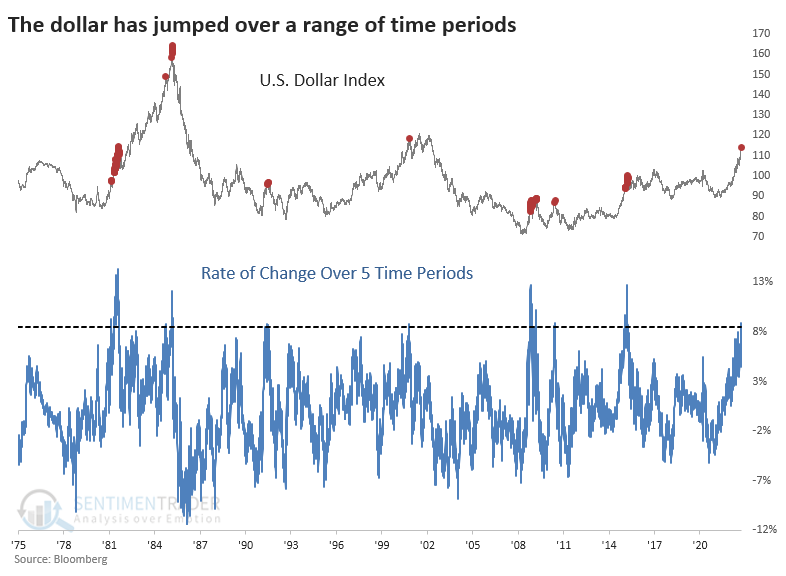
Another slightly different way of looking at this is the dollar's position relative to moving averages over those same time frames. This evens out the extremes somewhat. Even so, the dollar is more than 5% higher than its moving average across those five time frames.
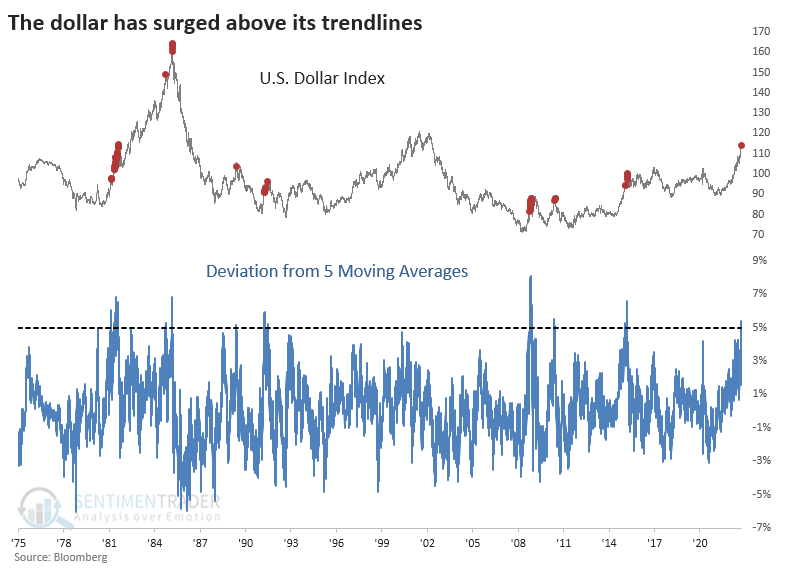
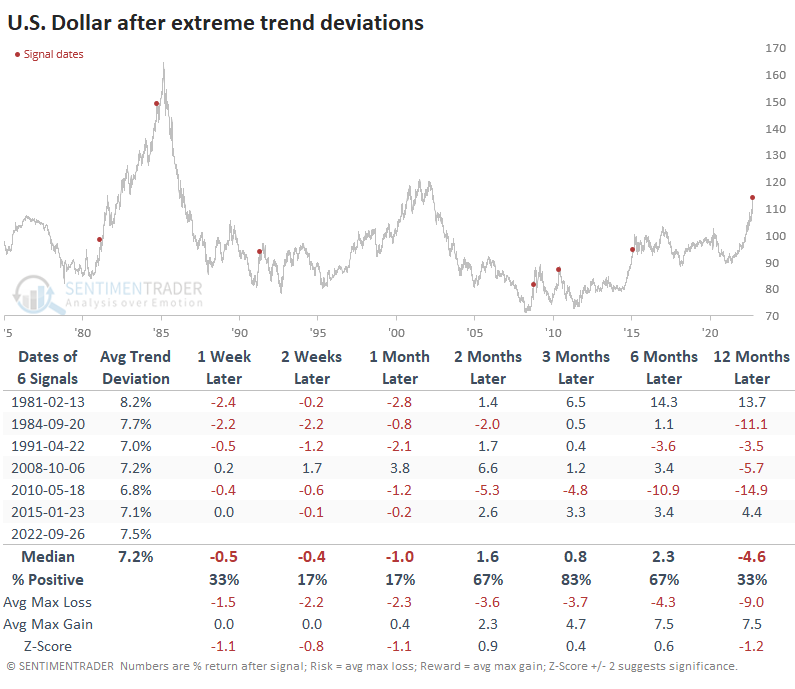
If we average those two studies, we can see how unusual the currency's uptrend has been. It's so rare that there are only six precedents since 1975, shown in the table below.
The dollar didn't have much more room for a rally during the next 2-4 weeks after all but one of those signals, and that one ultimately reversed hard. Momentum doesn't die easily, though, and even though most of these saw some short-term weakness, all but the 2010 signal witnessed a higher dollar three months later.
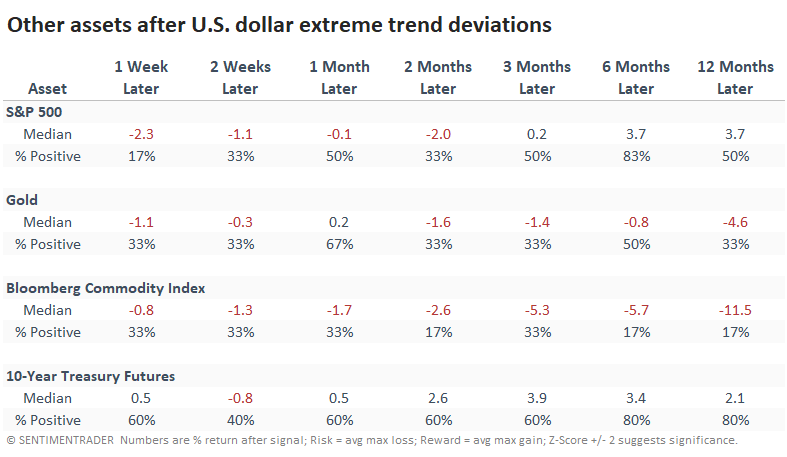
Looking at other asset classes following these signals, the S&P didn't fare very well in the shorter term. Neither did gold or commodities, and that weakness tended to persist for both.
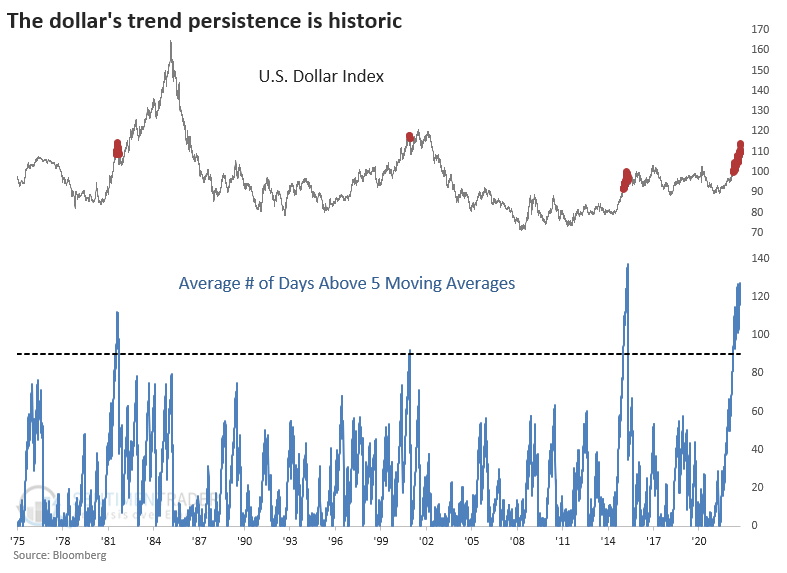
Speaking of persistence, the number of days the dollar has spent above its moving averages is nearing a record. The chart below shows the average number of days the dollar was above its averages, which just passed six months. That's the 2nd-highest persistency in its history.
Positioning points to potential headwinds
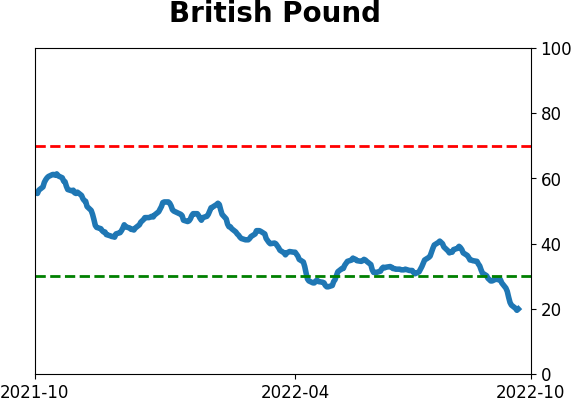
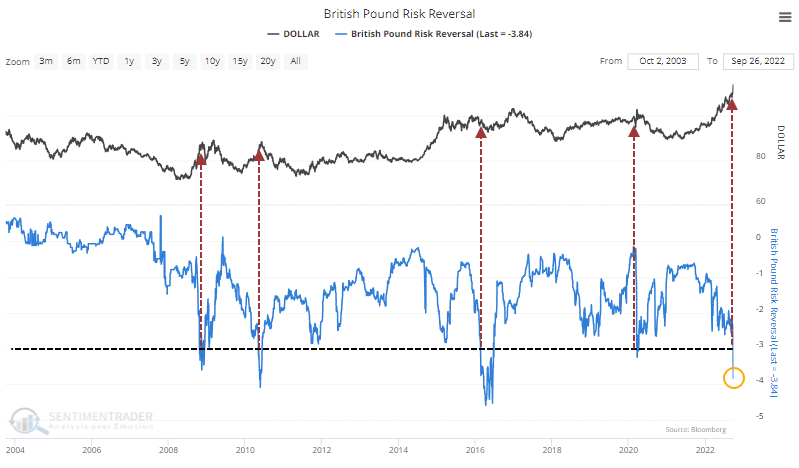
The moves have been so extreme in currencies like the British pound that traders are genuinely panicking. A good way to visualize this is via risk reversals. It shows how much they're paying to protect against extreme moves. The cost of these has spiked in the pound, preceded by declines in the dollar.
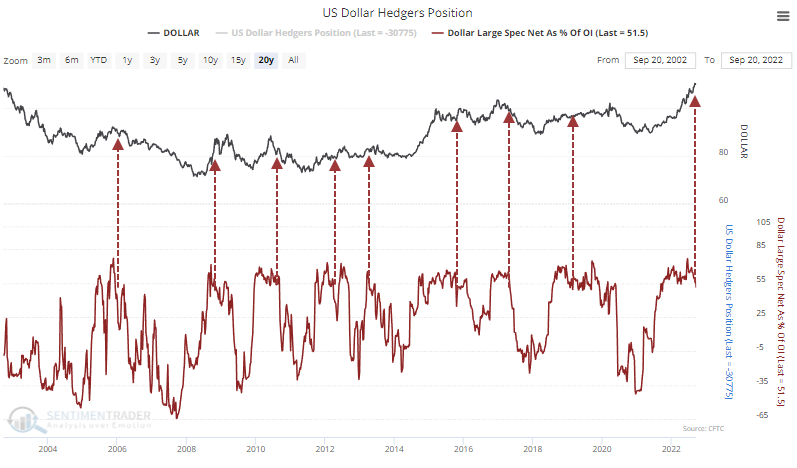
There is a lot of room for the long-dollar trade to unwind. Large speculators in dollar futures are starting to unwind their positions, which have continued for weeks to months, and keep a cap on further rallies.
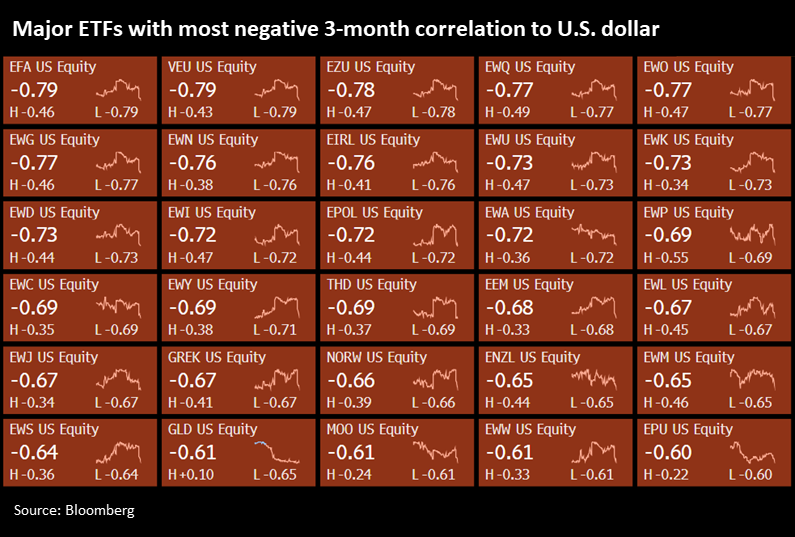
According to Bloomberg data, overseas equity funds should see the biggest tailwind if the dollar takes a break from its massive momentum. Funds EFA, VEU, and EZU have had the most negative 3-month correlation to changes in the dollar lately.
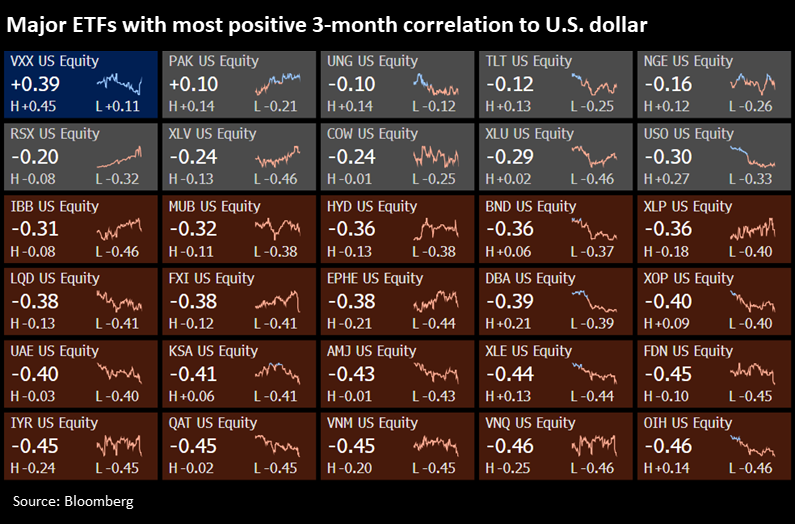
The only two funds with a positive correlation were a volatility fund and Pakistan, of all things. Even the TLT bond fund had a negative correlation.
What the research tells us...
Currencies trend. More than any other market, they are often immune to the whims of sentiment and attempts at fundamental valuations. That's why we don't spend much time on the currency market. When it gets to the point it's at now, though, the dollar has had some difficulty holding its momentum in the short term. But it's folly to think that necessarily means a long-term peak. It would help most asset markets if it were.
Indicators at Extremes
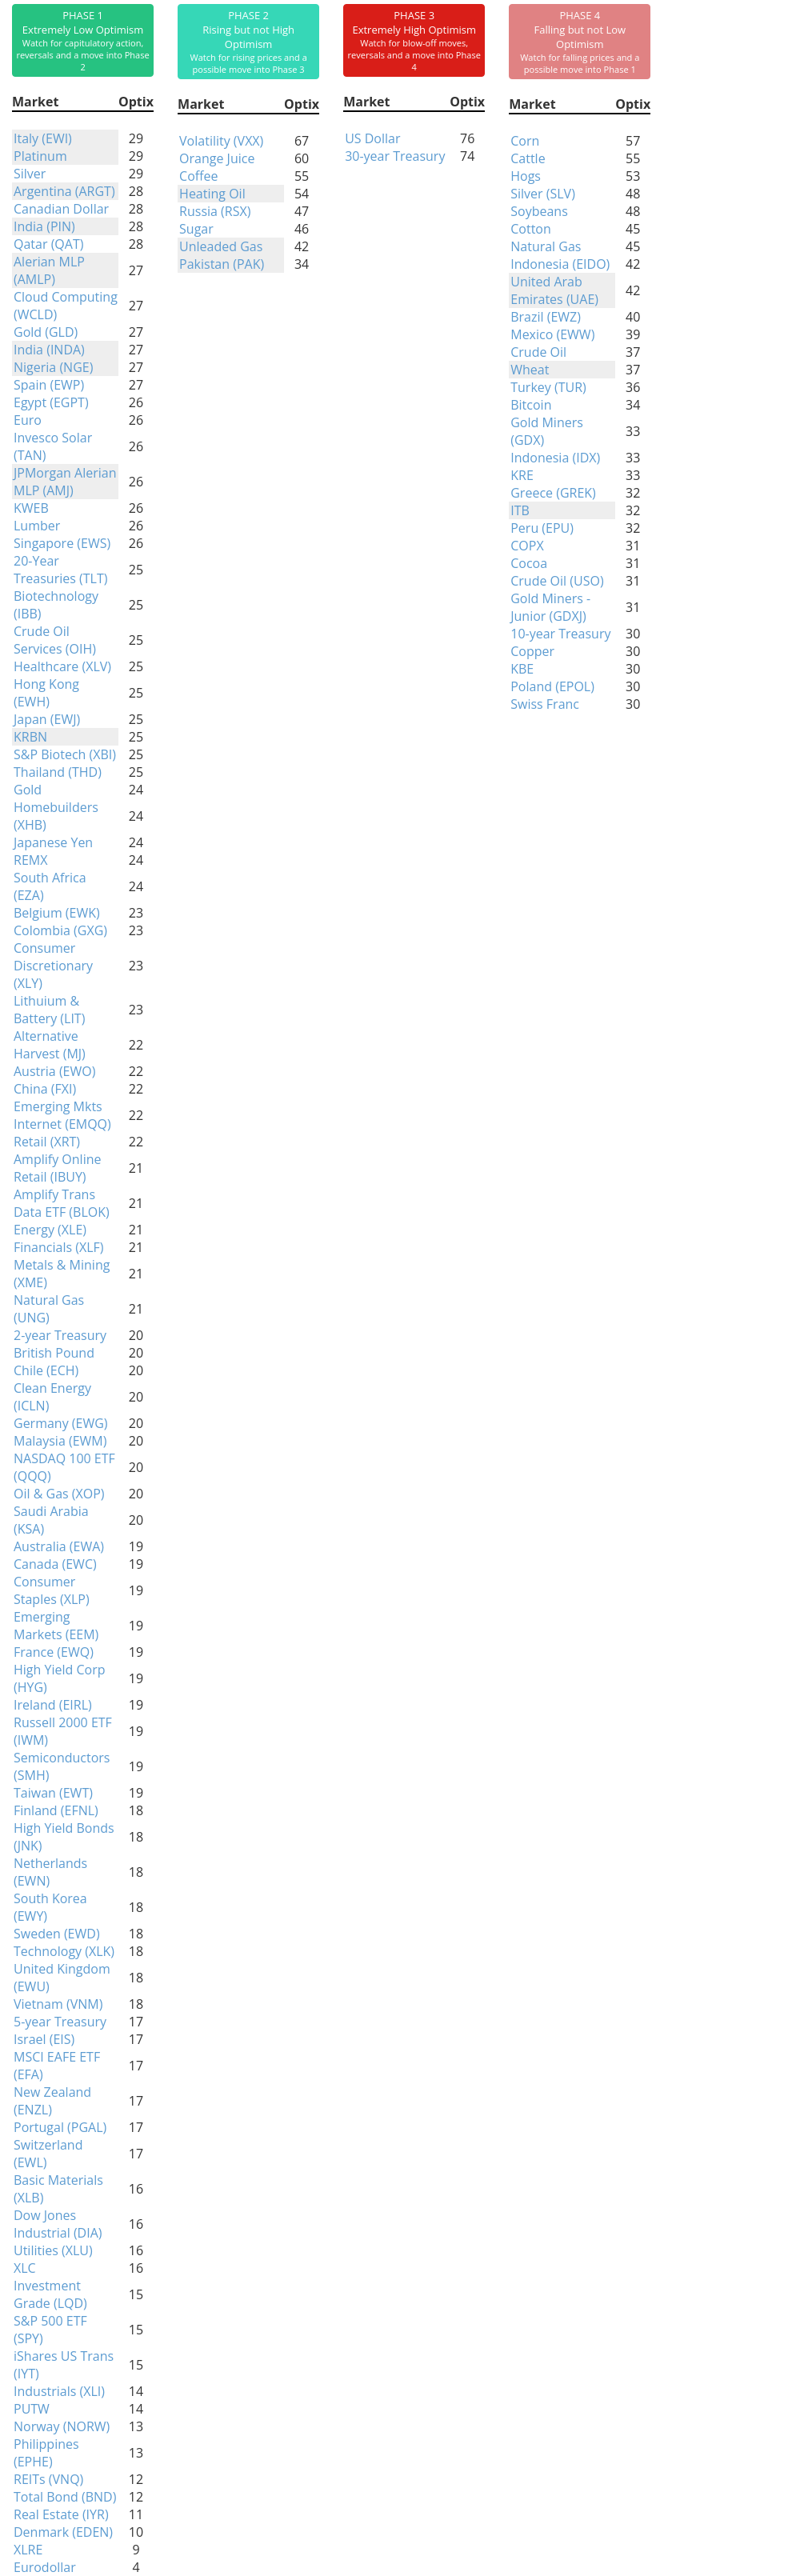
Phase Table
Ranks
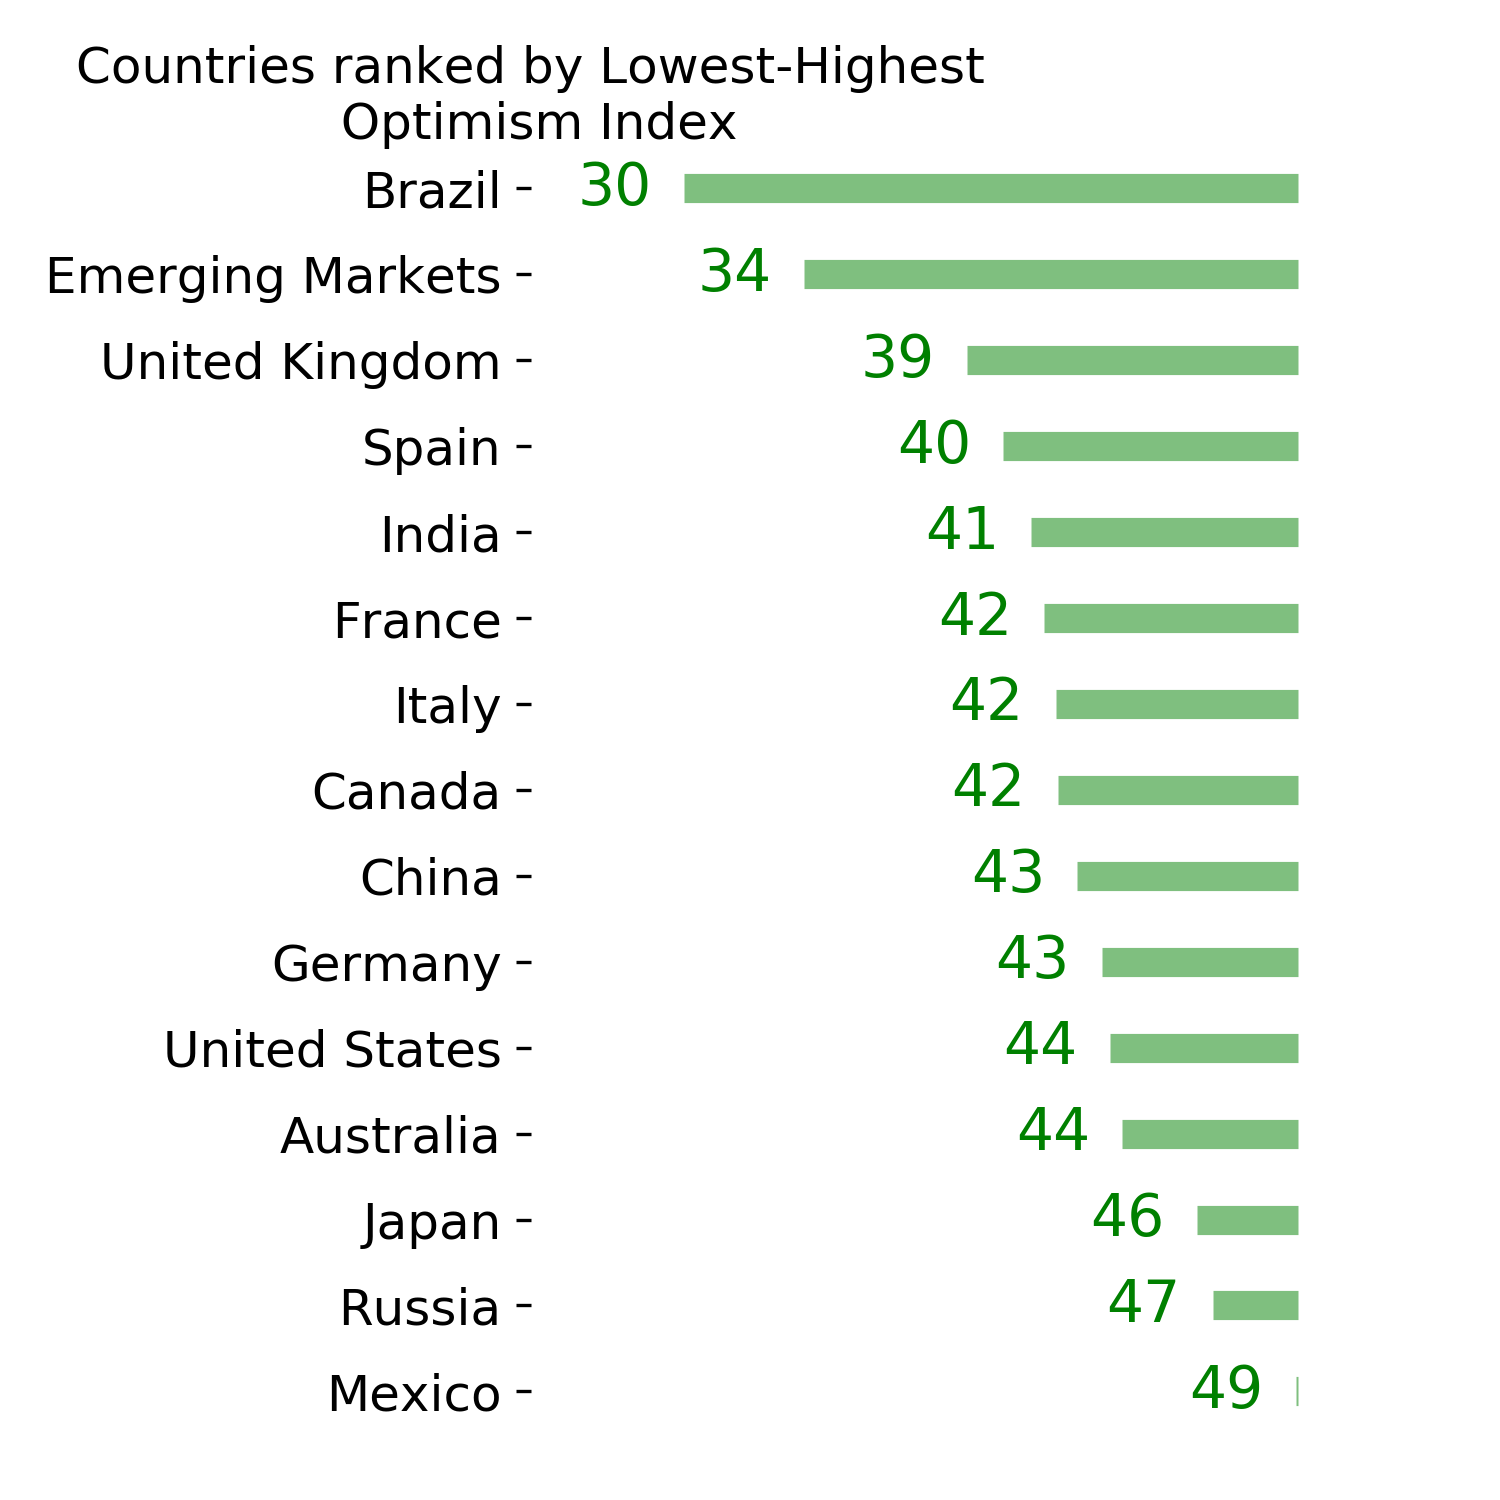
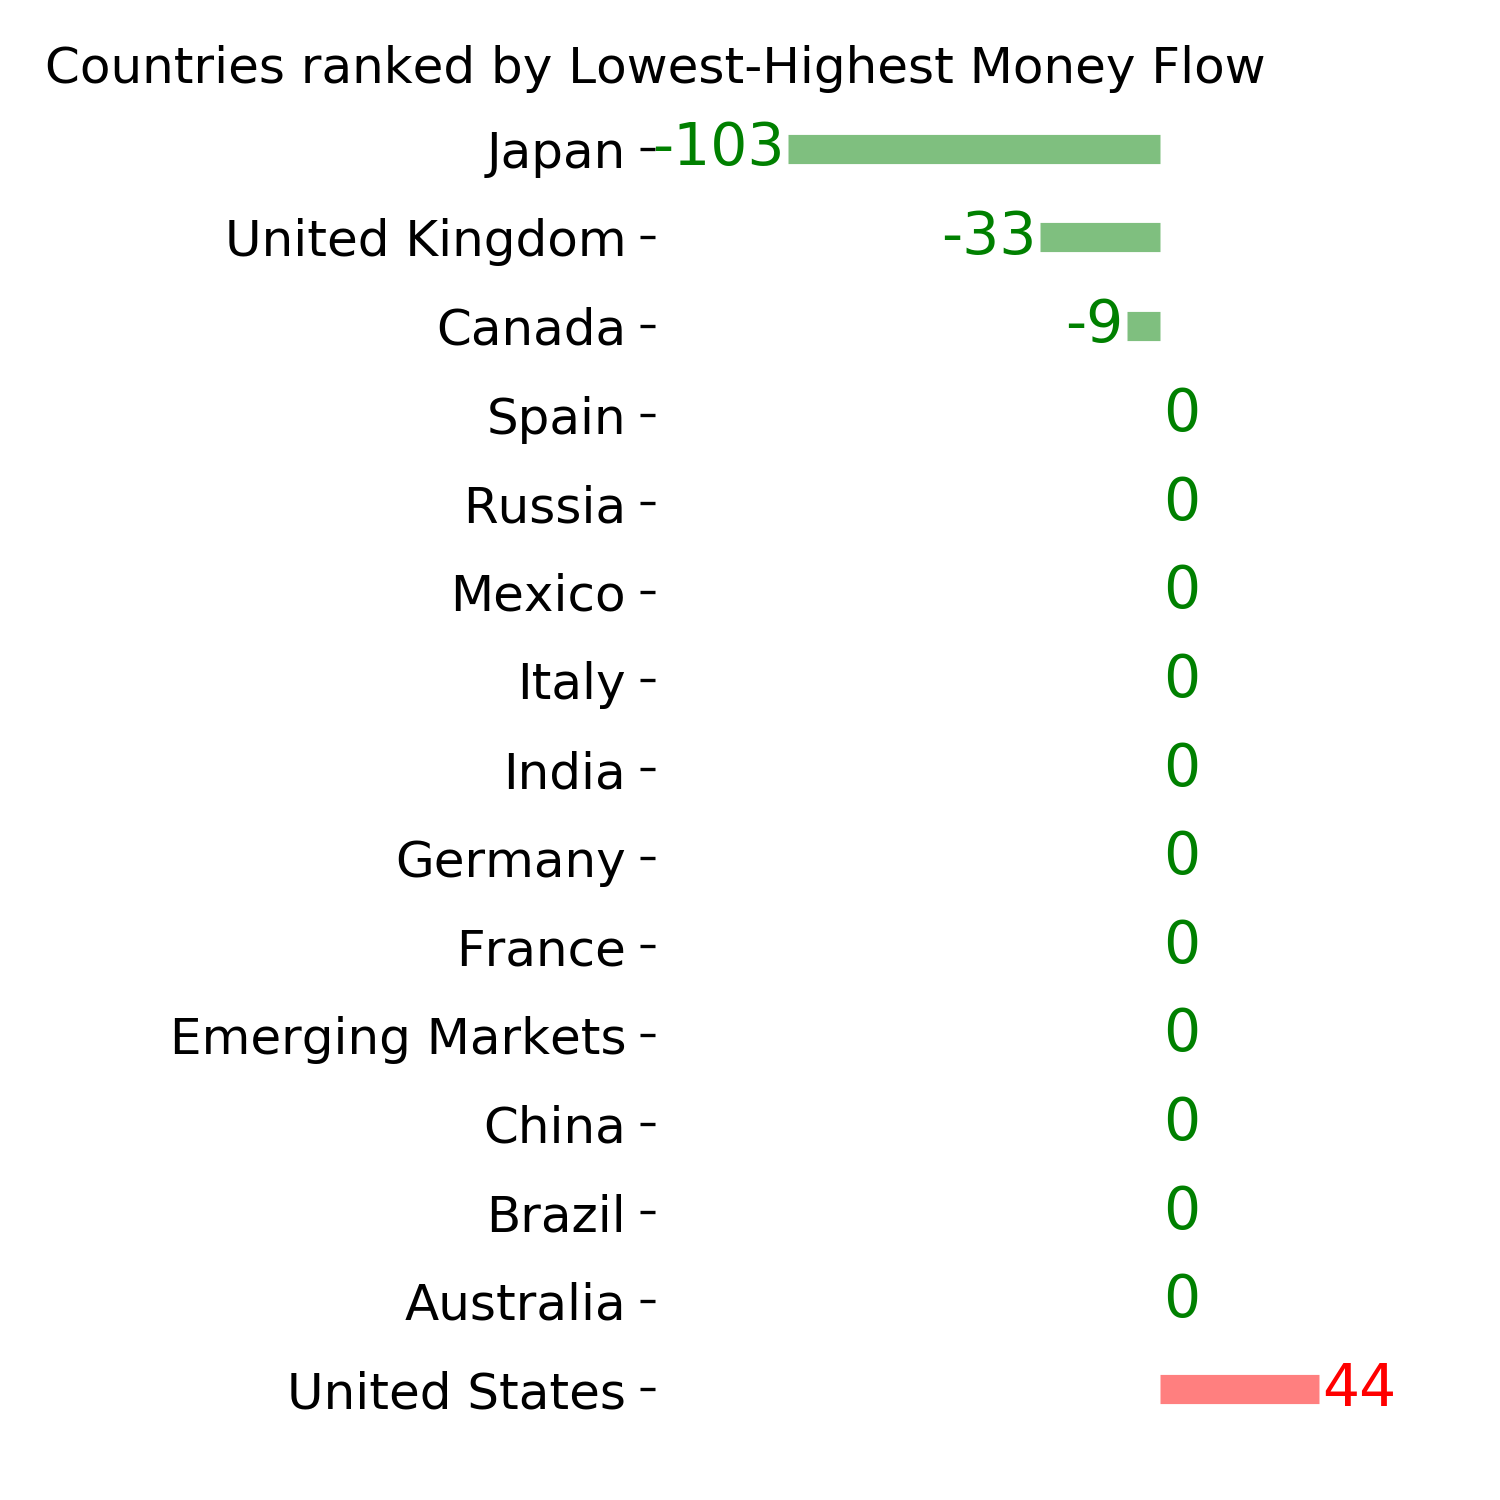
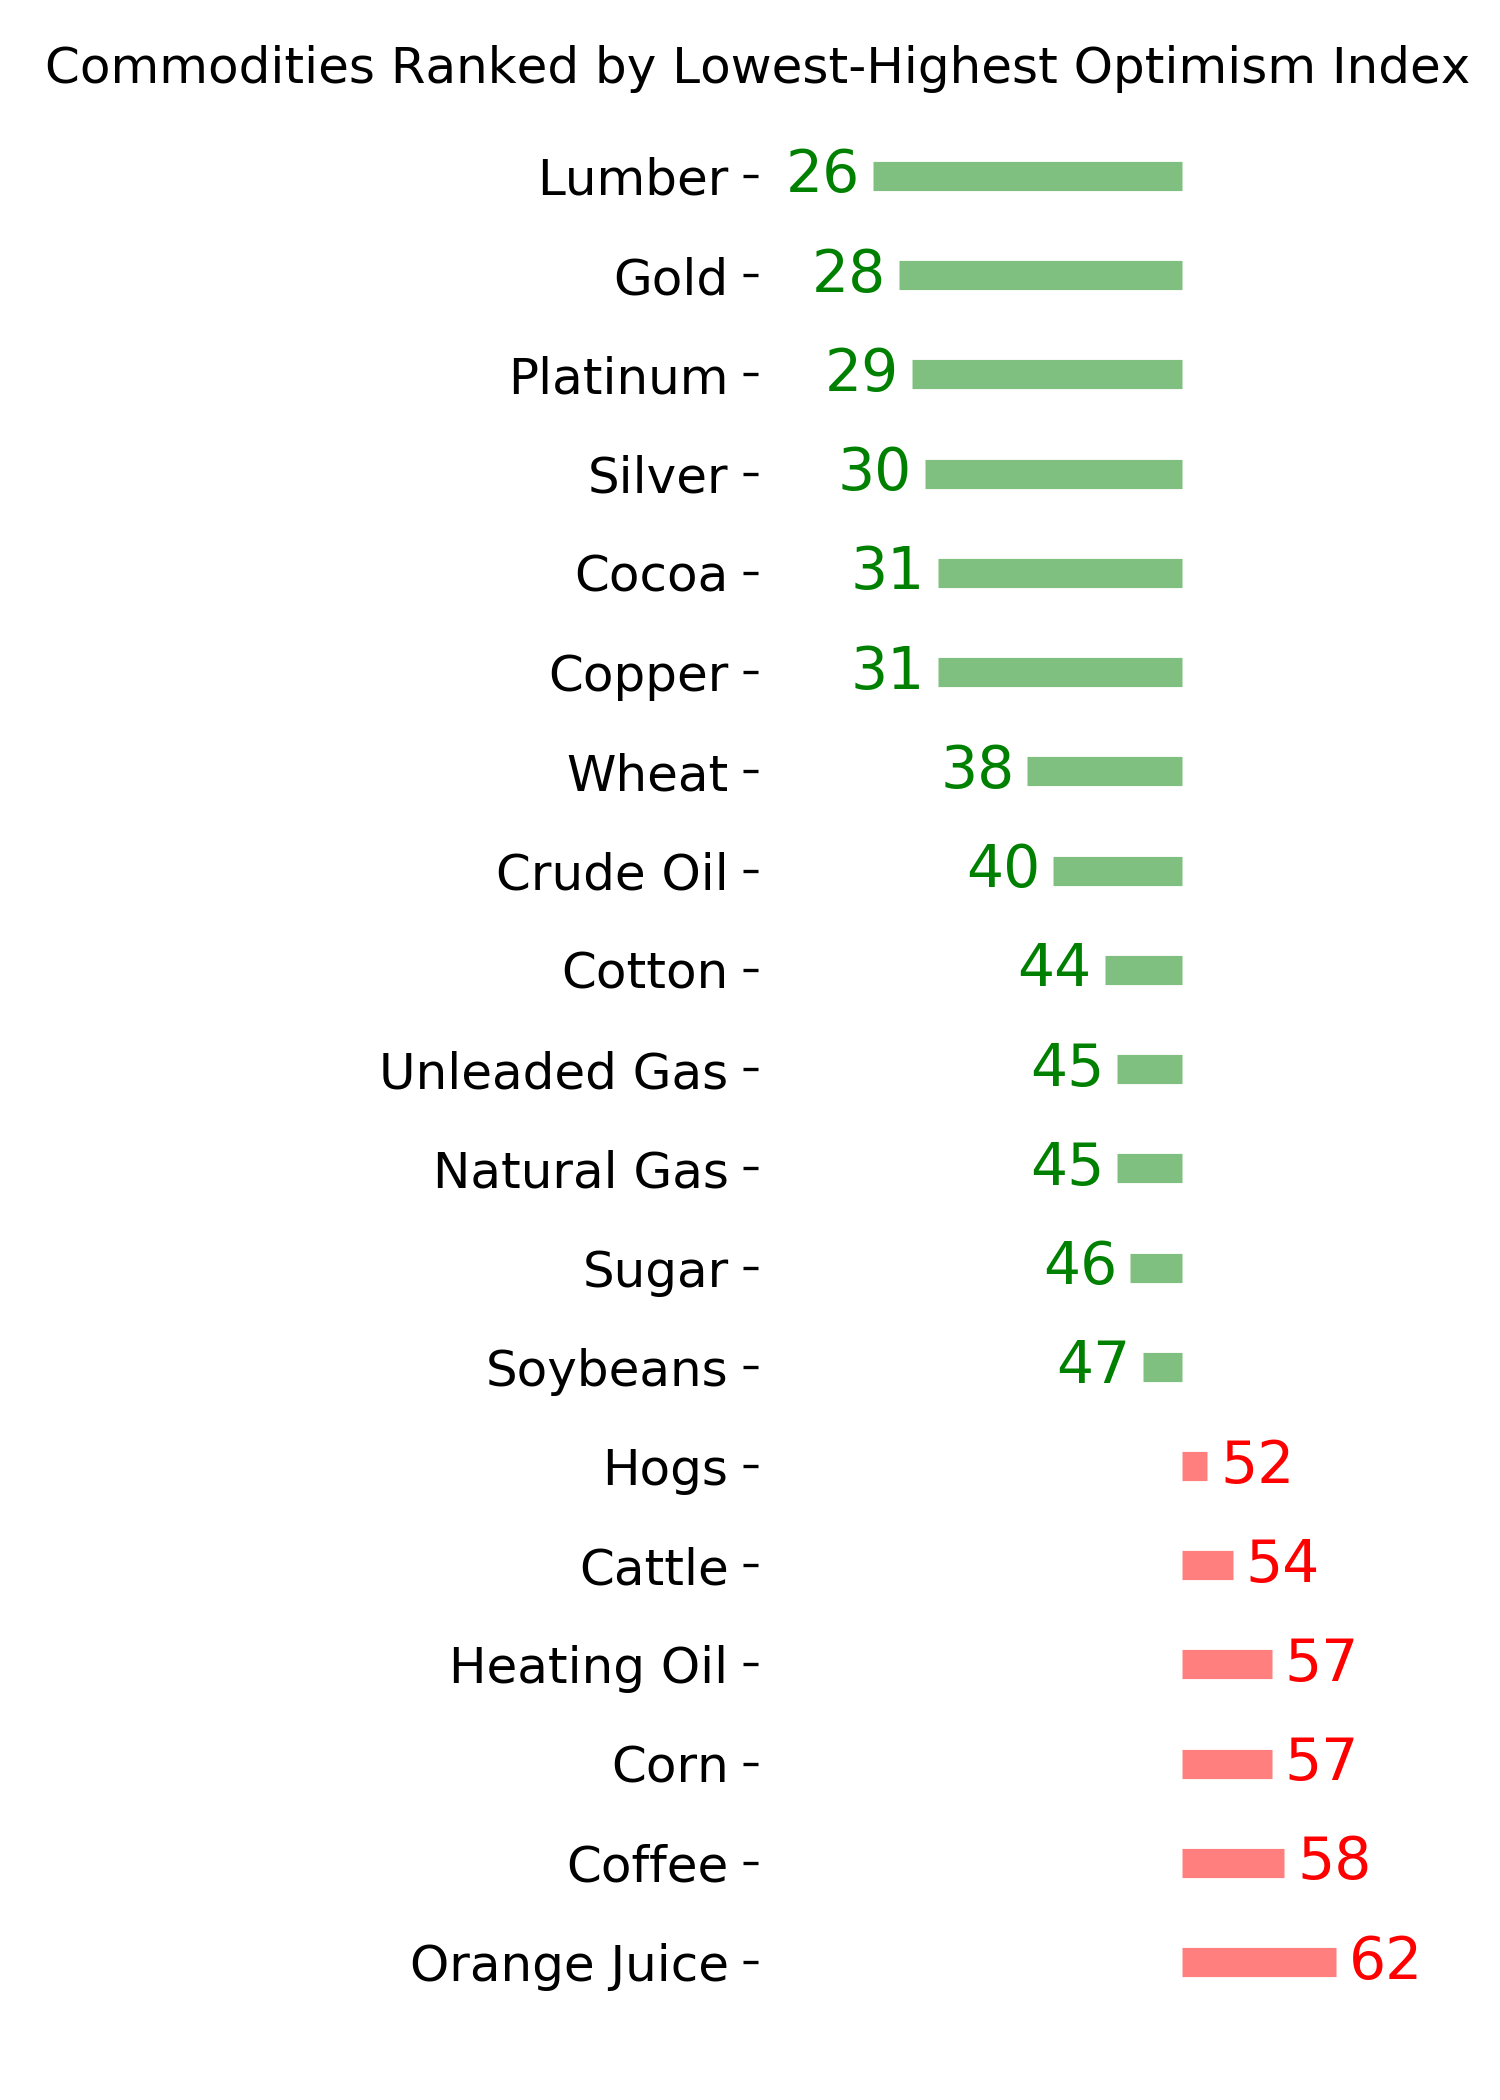
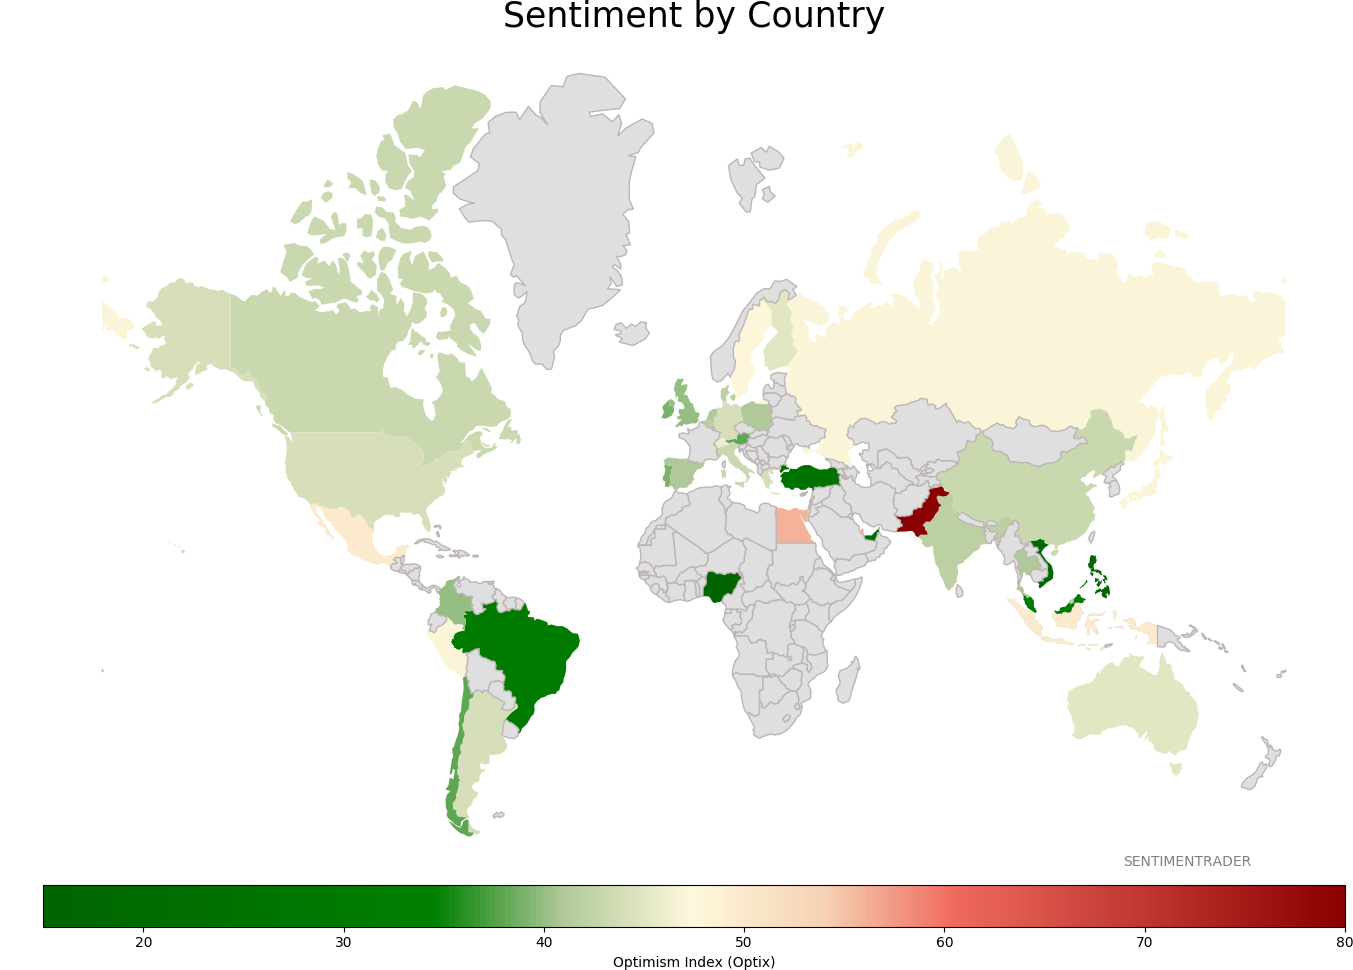
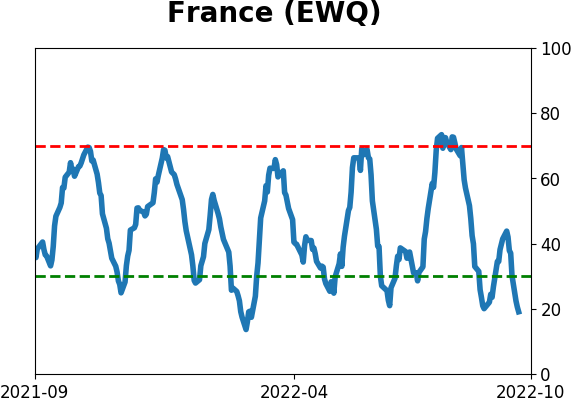
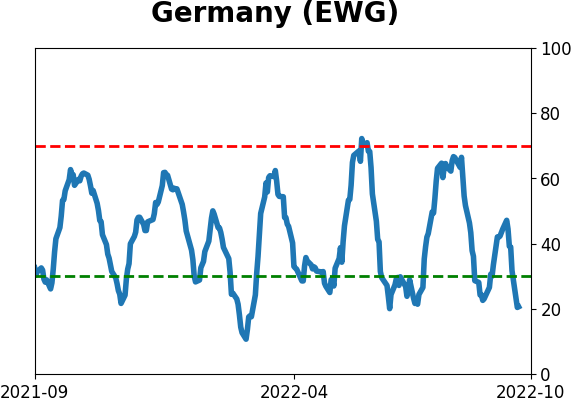
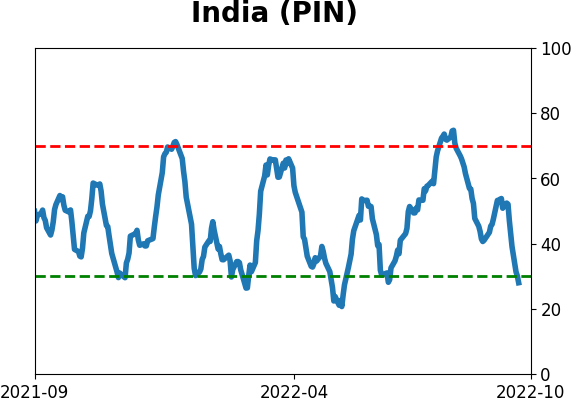
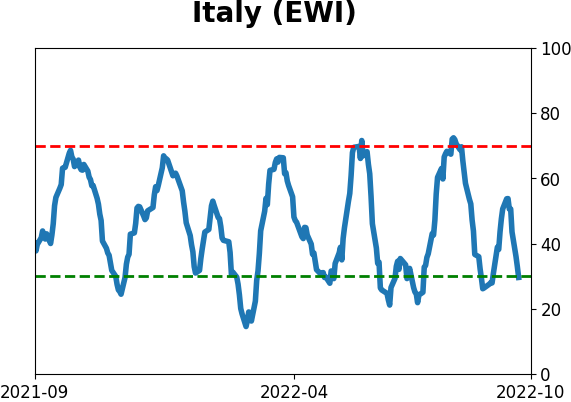
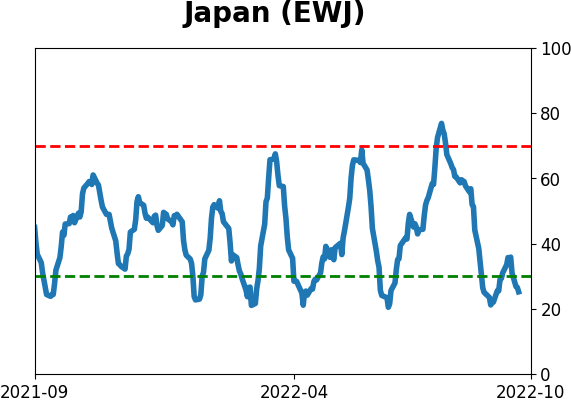
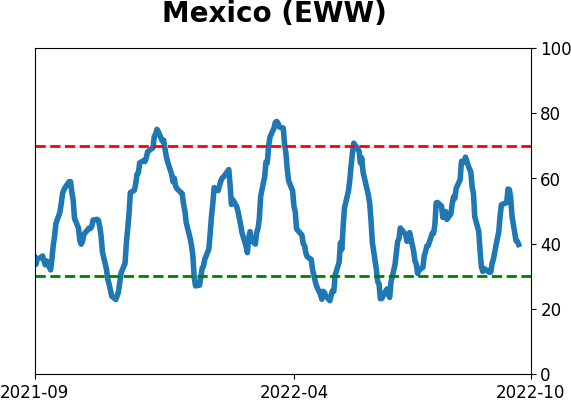
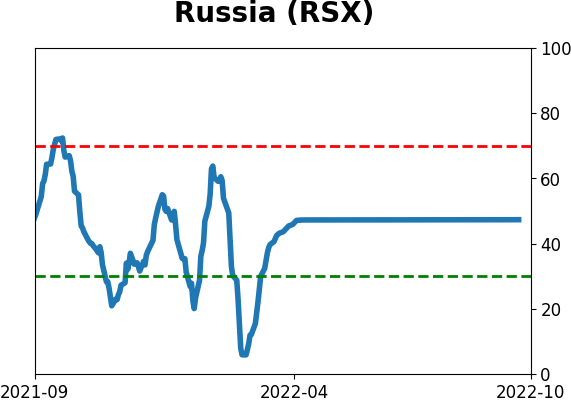
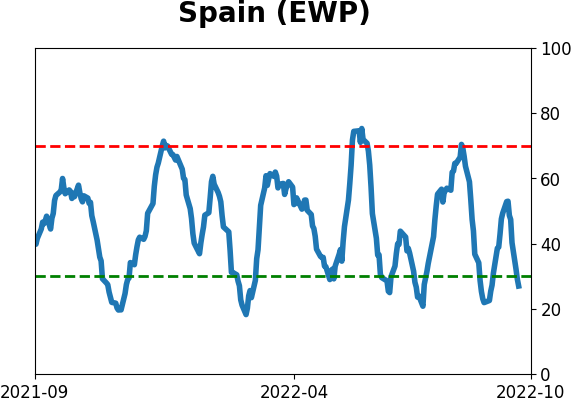
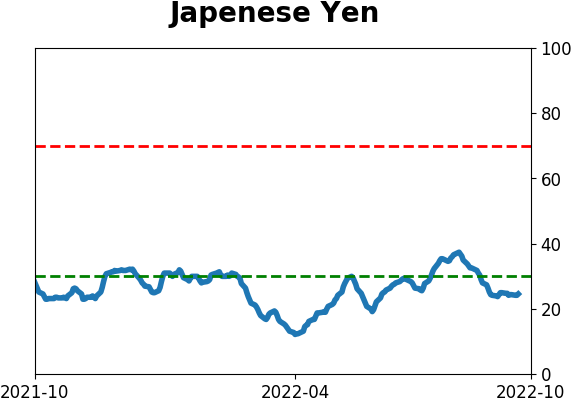
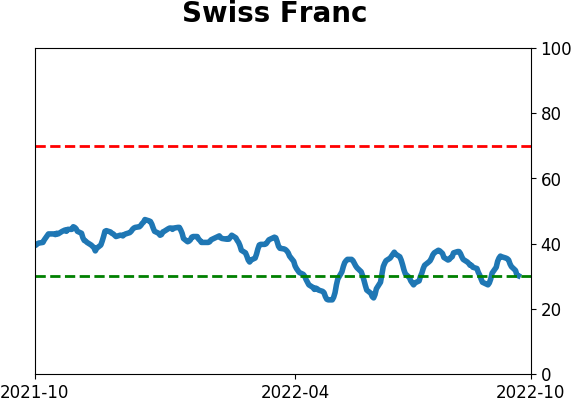
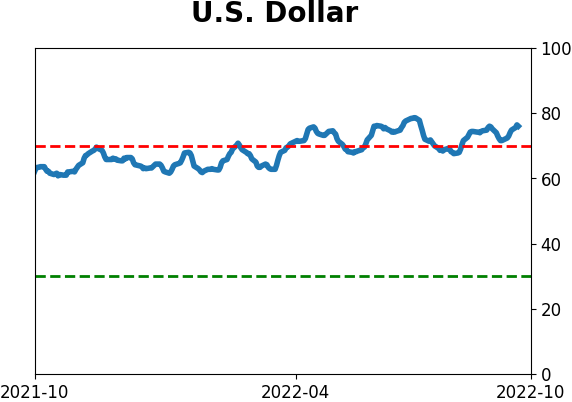
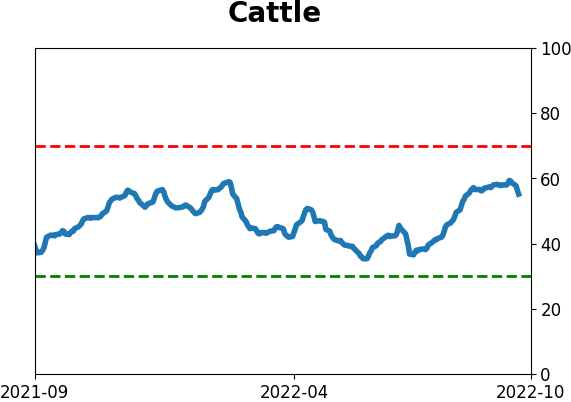
Sentiment Around The World
Optimism Index Thumbnails
|
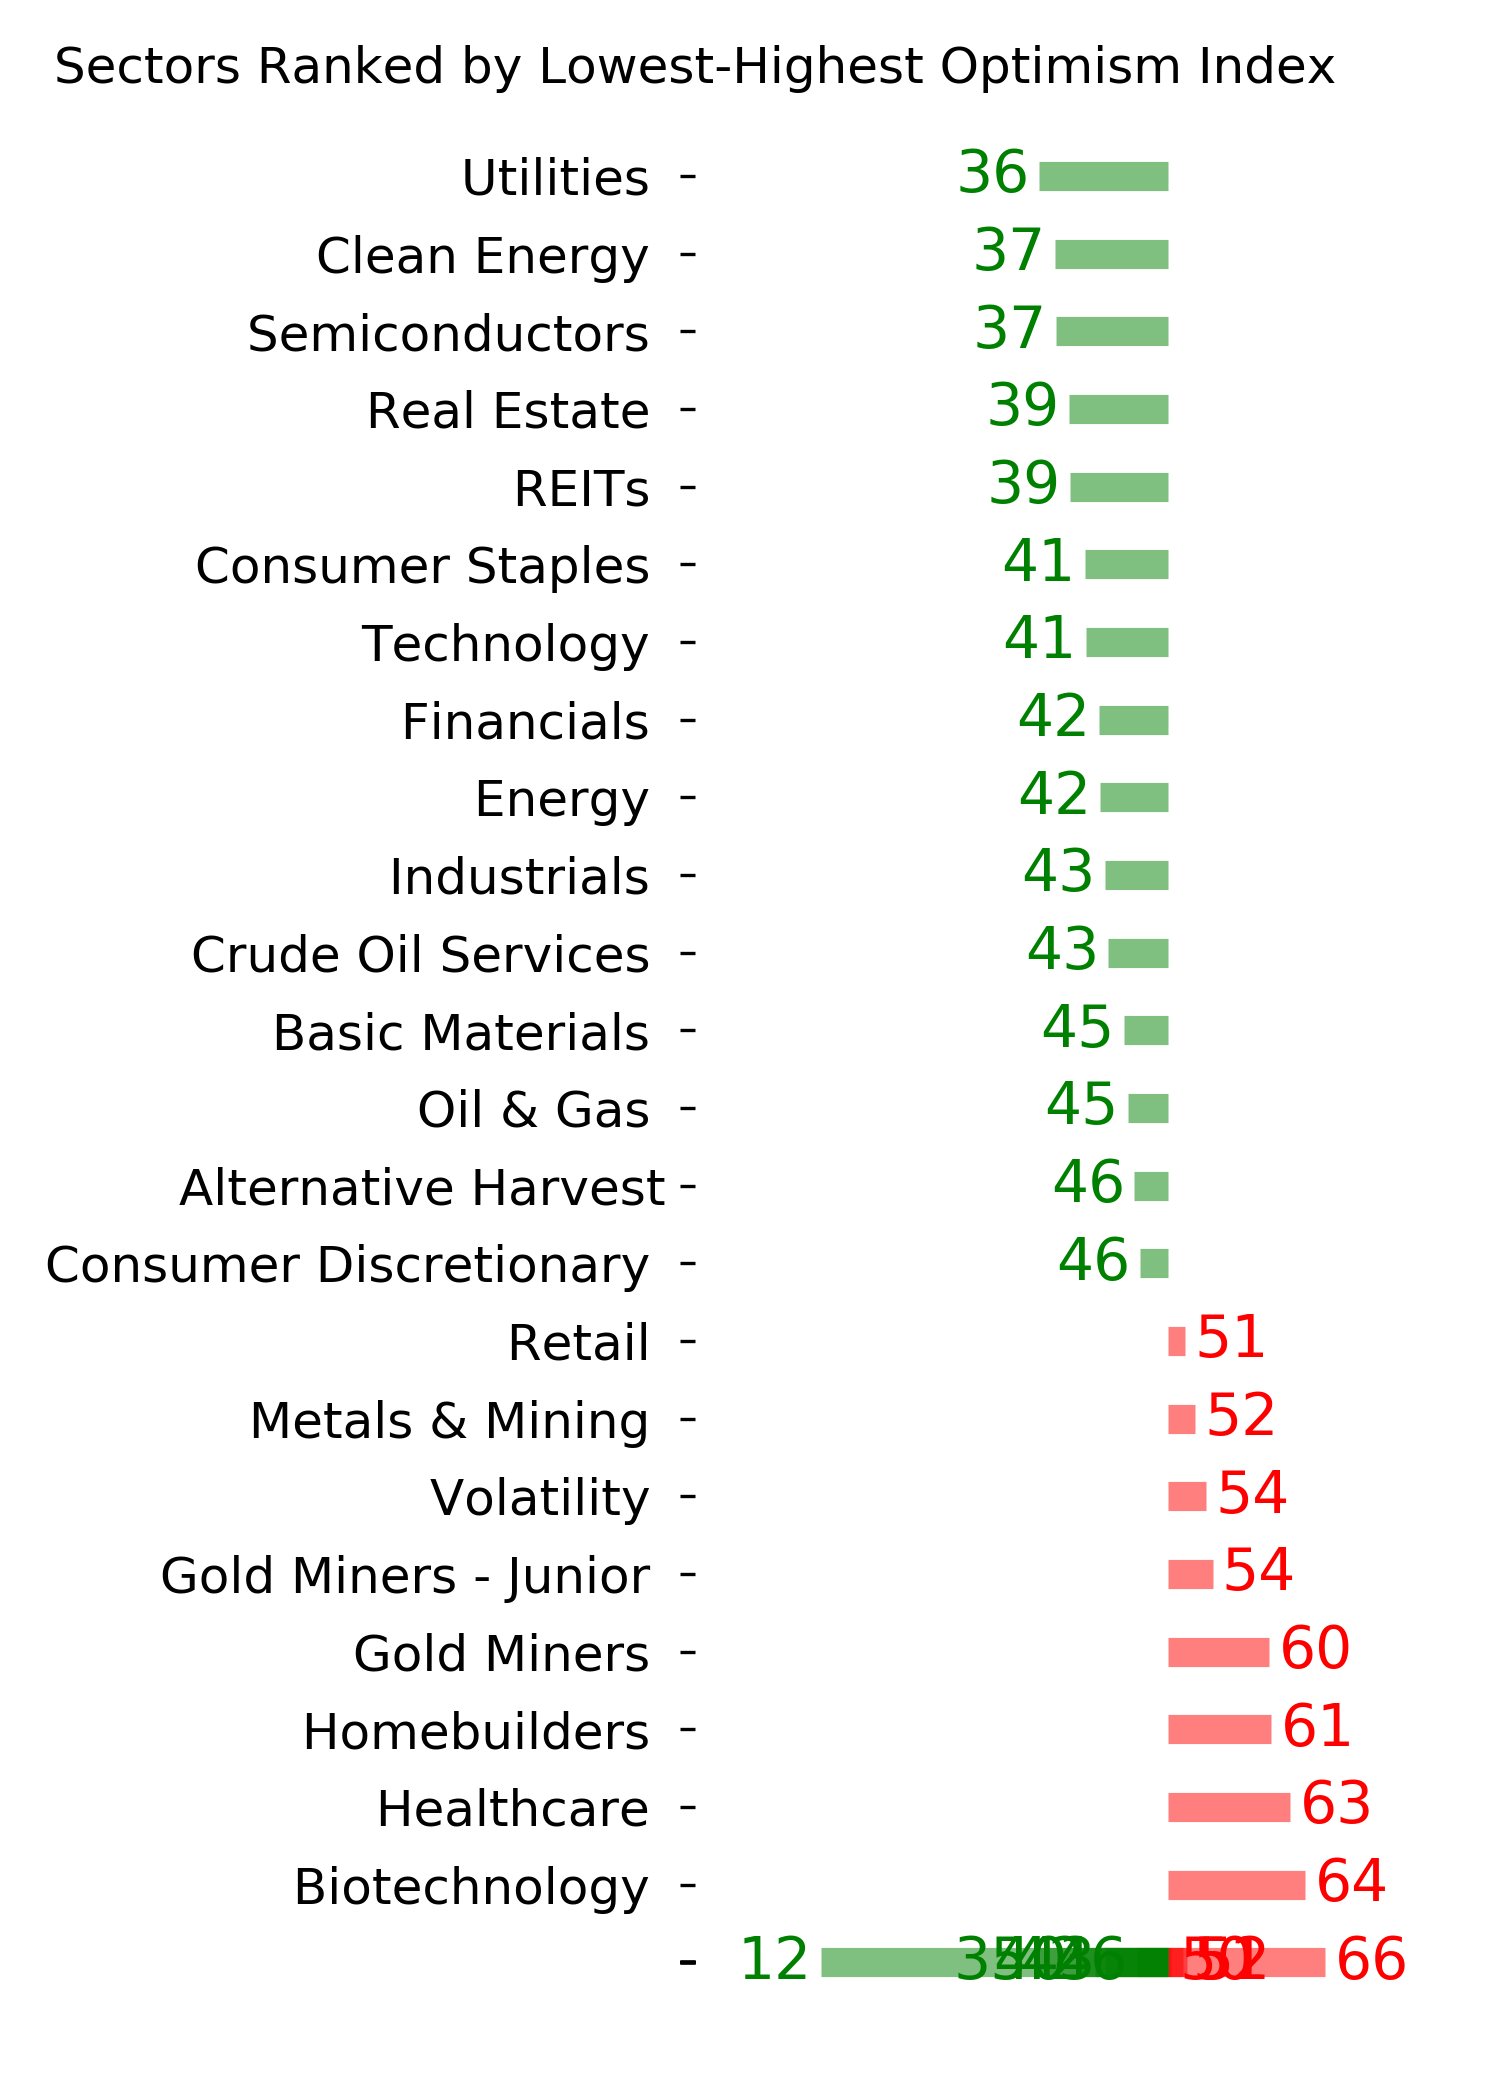
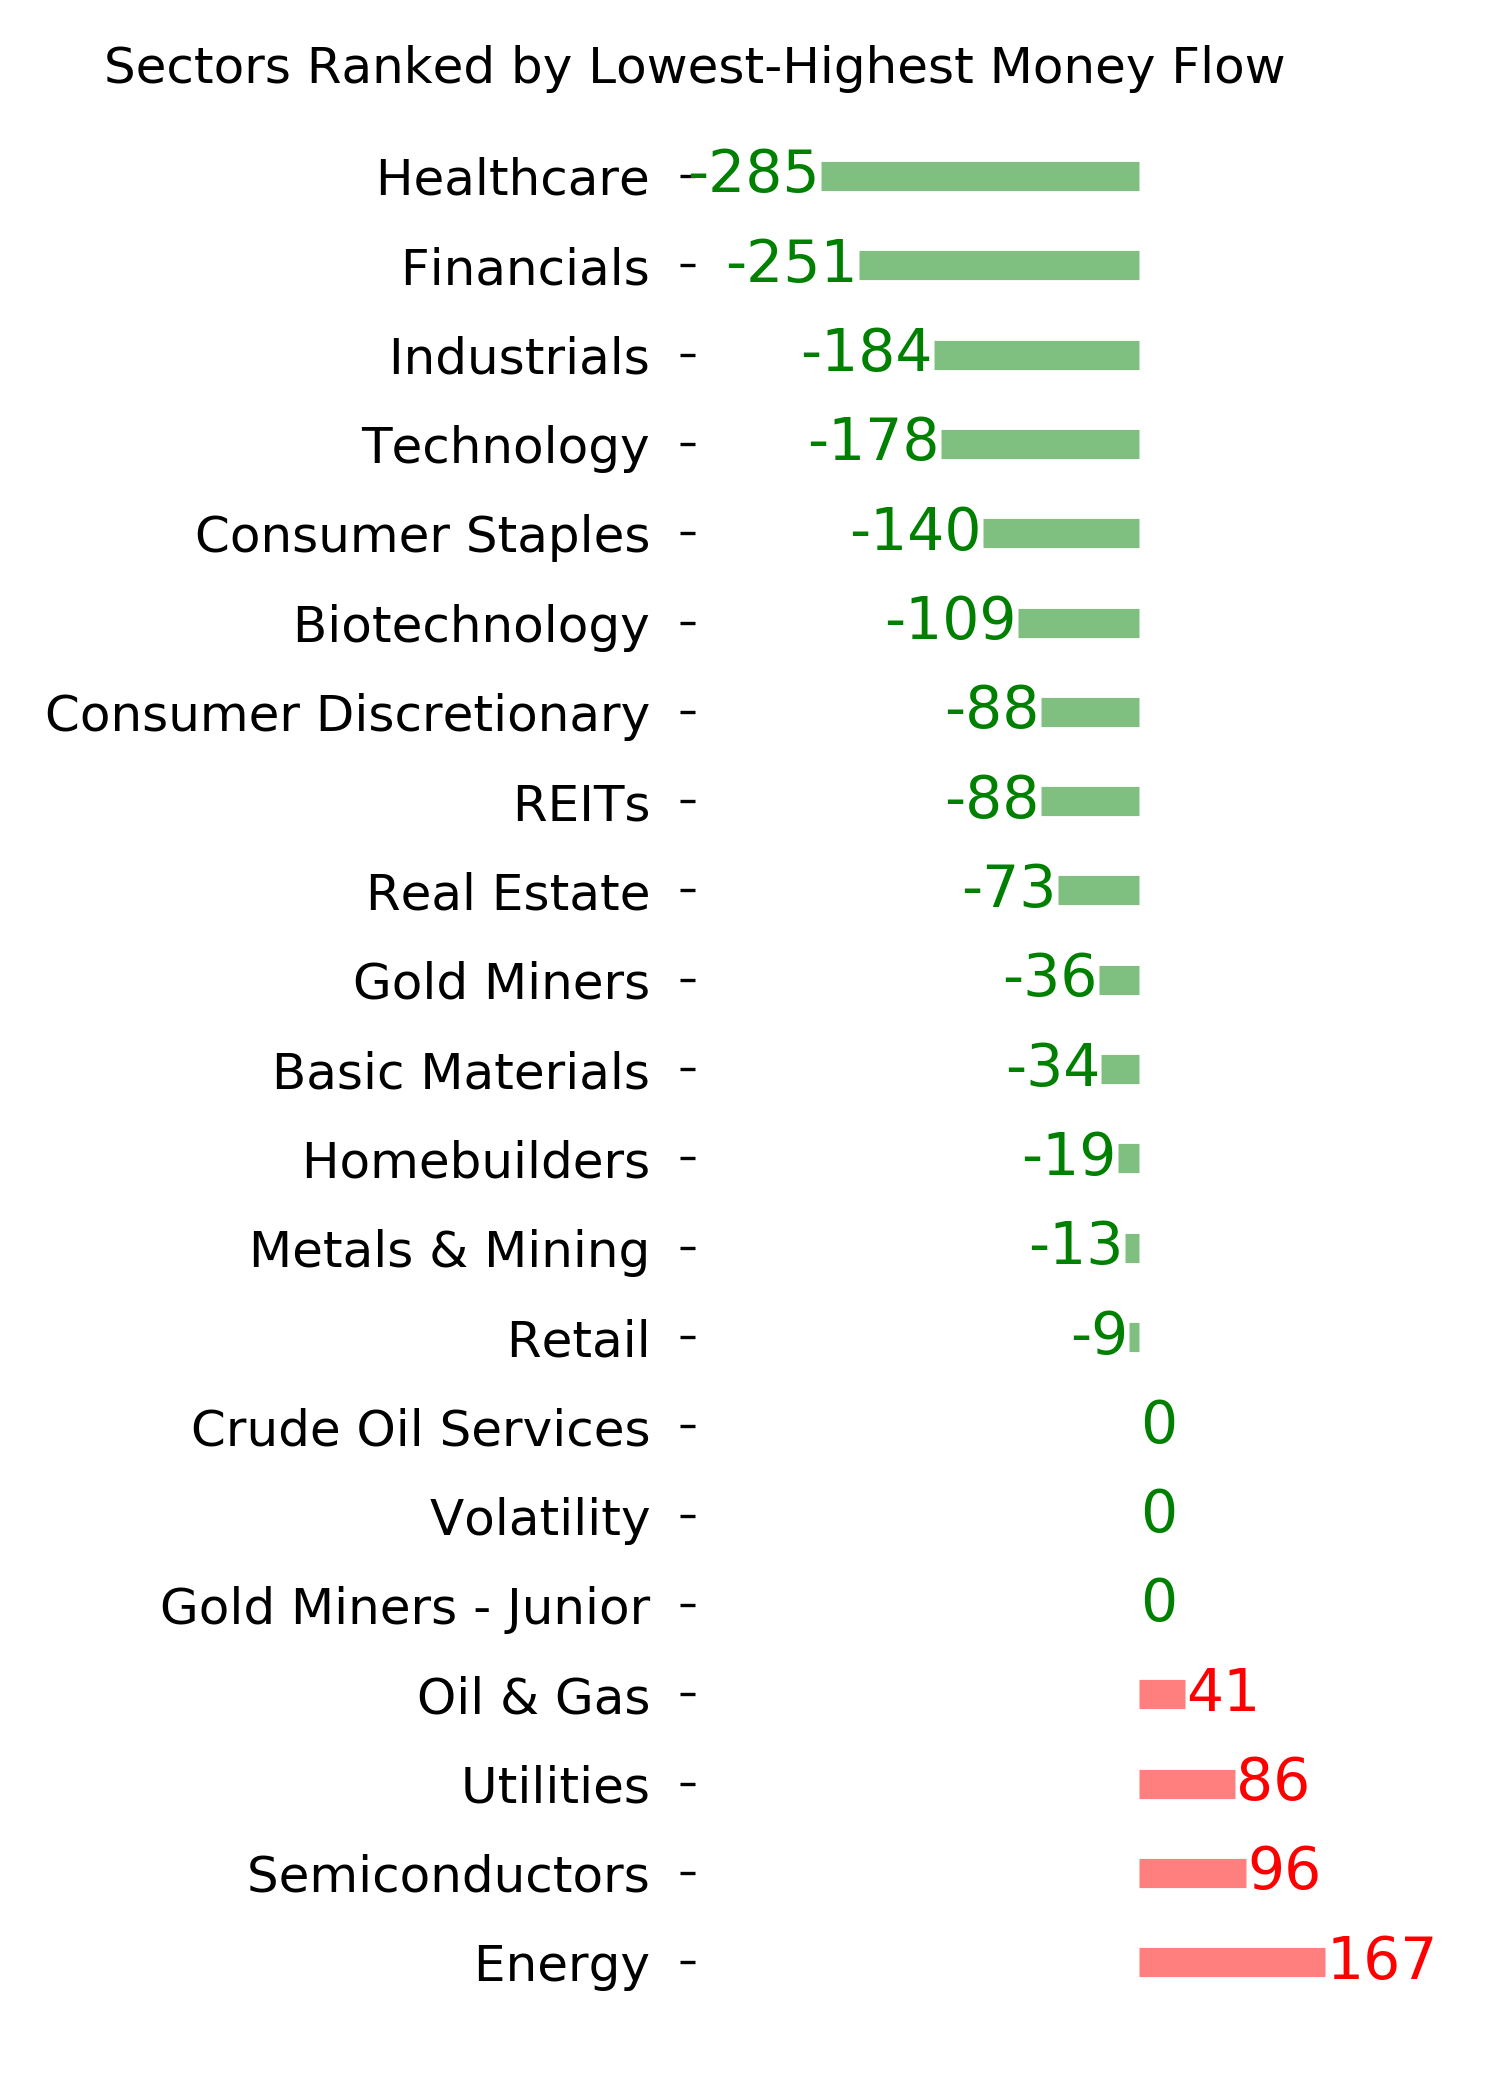
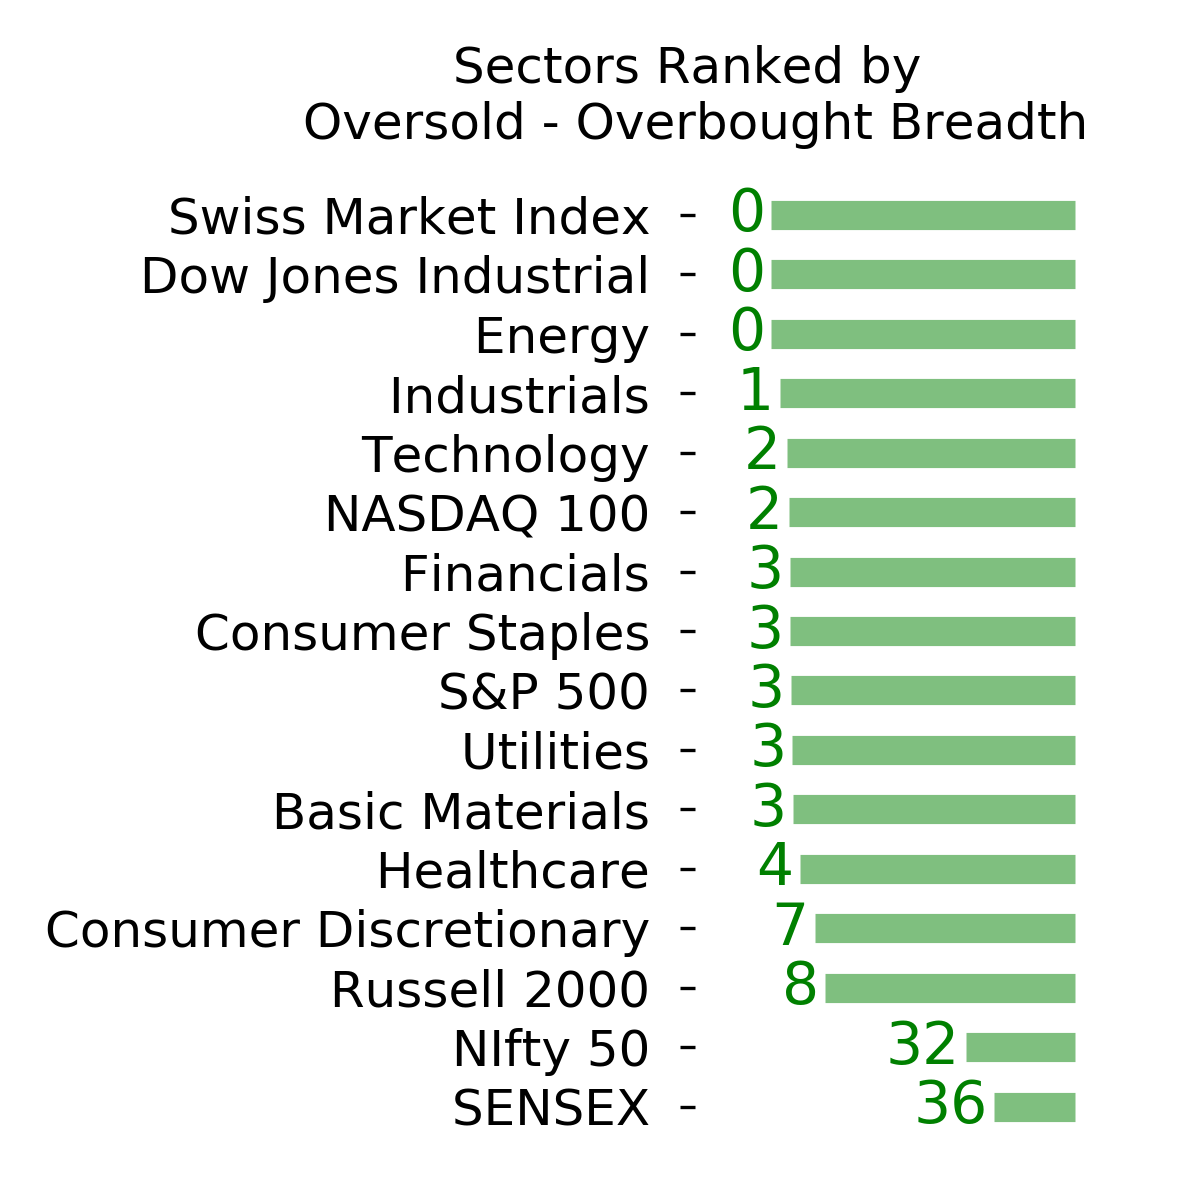
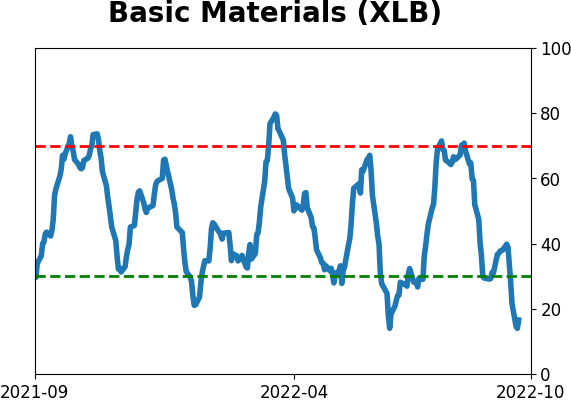
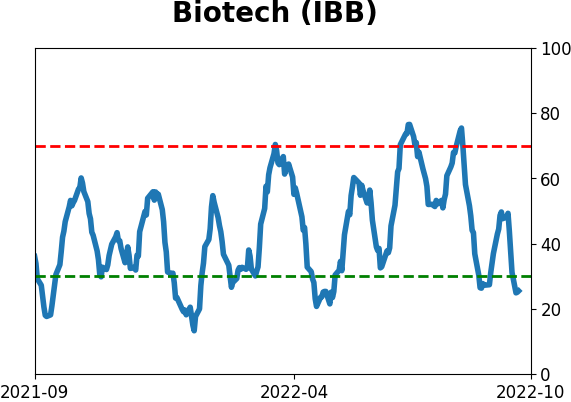
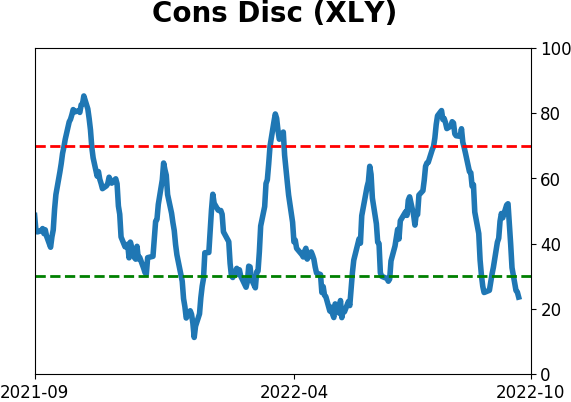
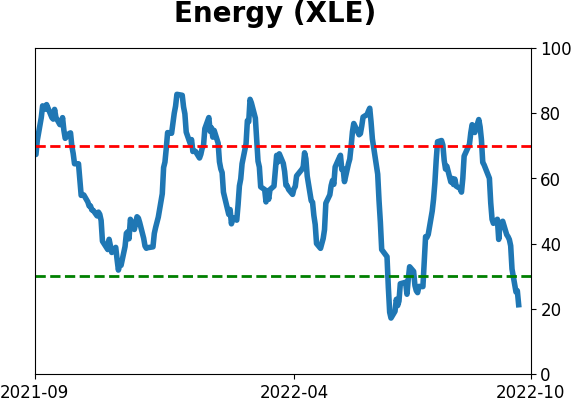
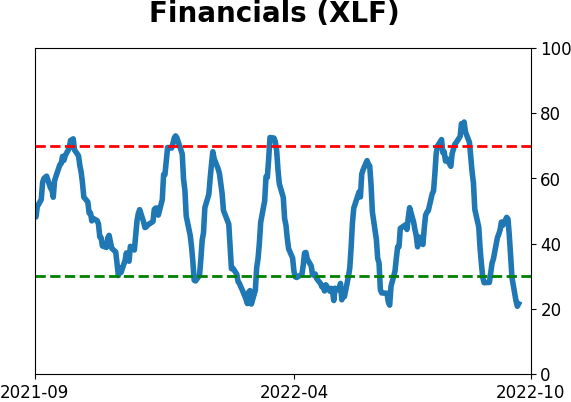
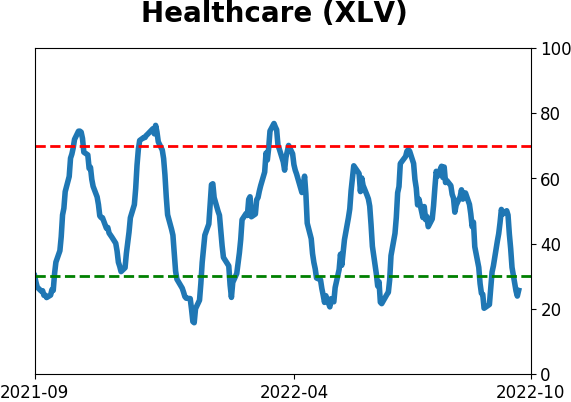
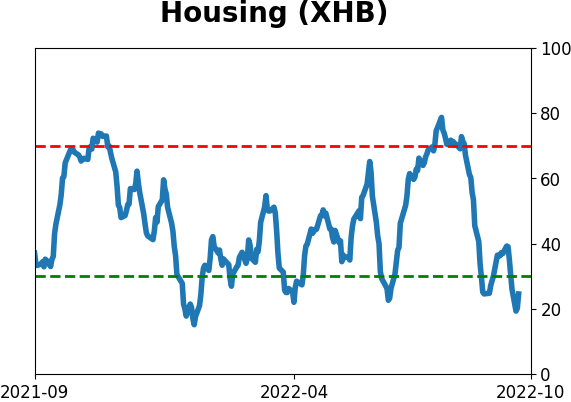
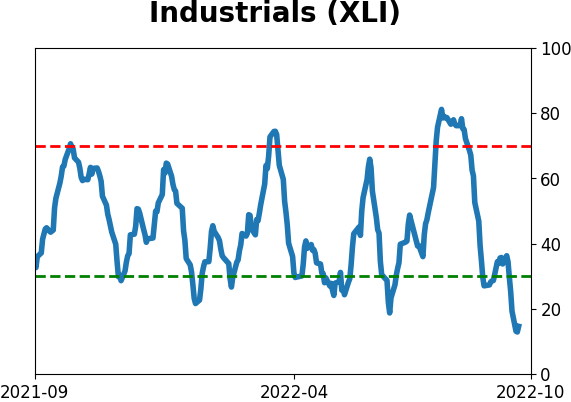
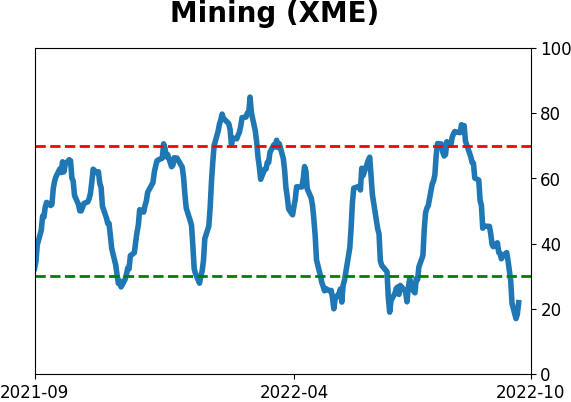
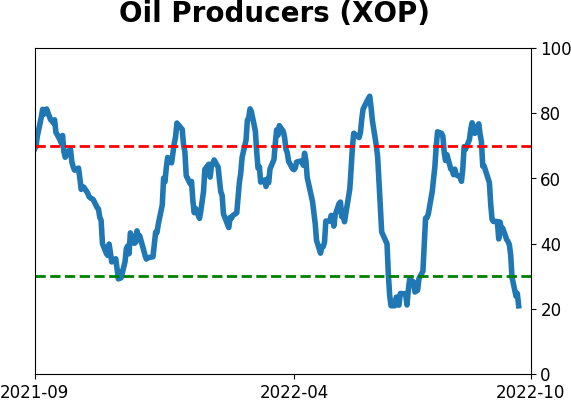
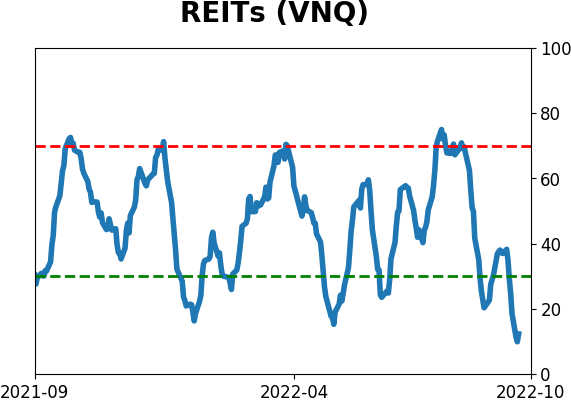
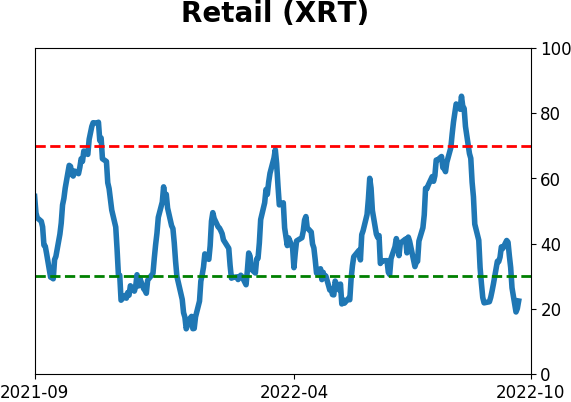
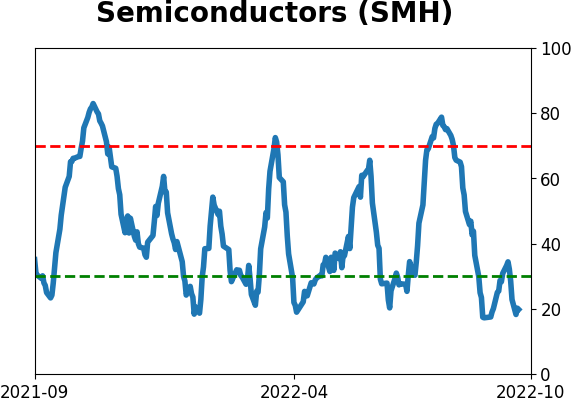
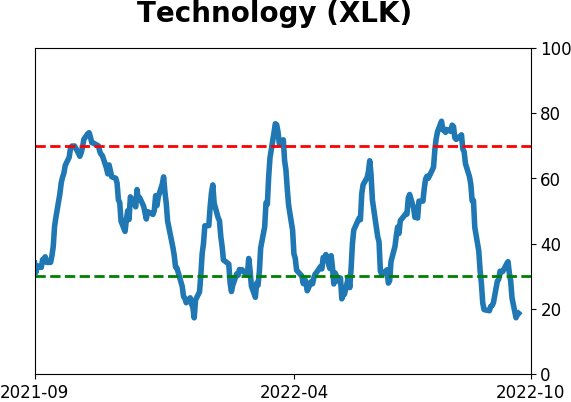
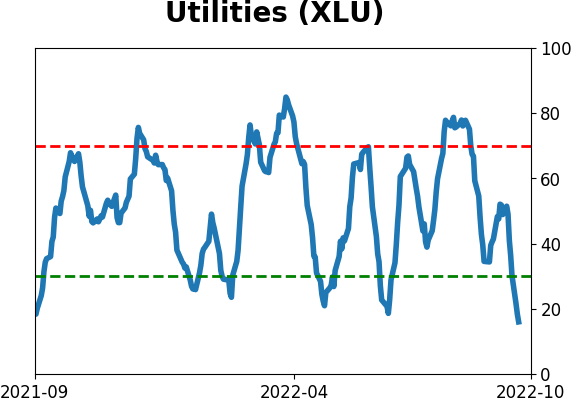
Sector ETF's - 10-Day Moving Average
|
|
|
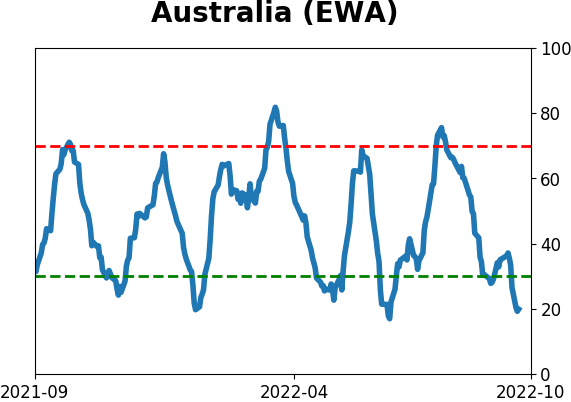
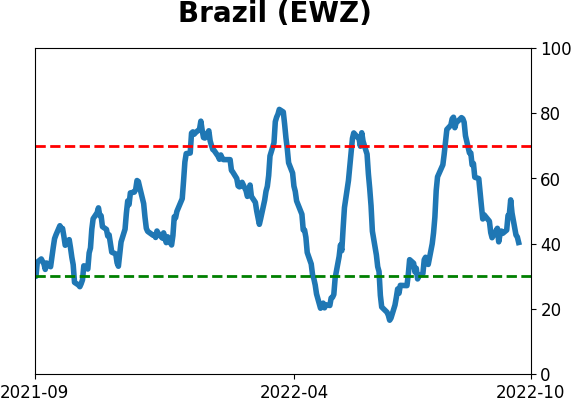
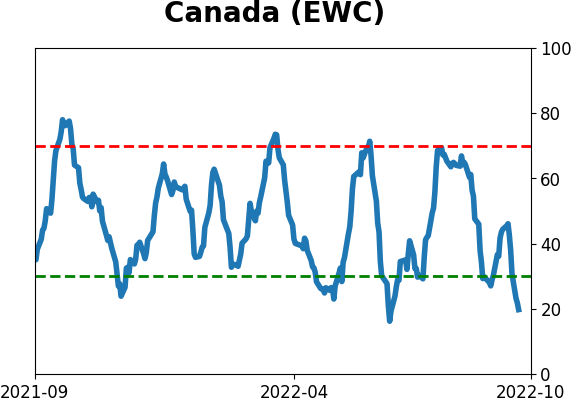
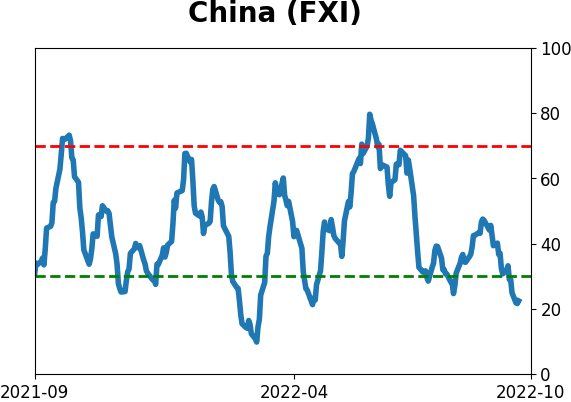
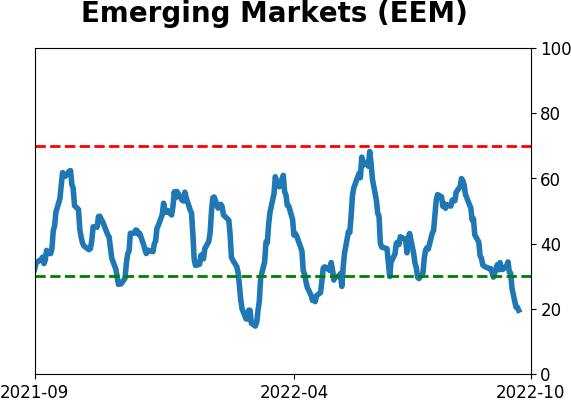
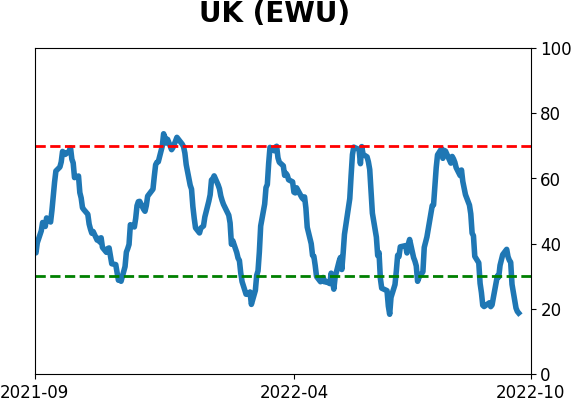
Country ETF's - 10-Day Moving Average
|
|
|
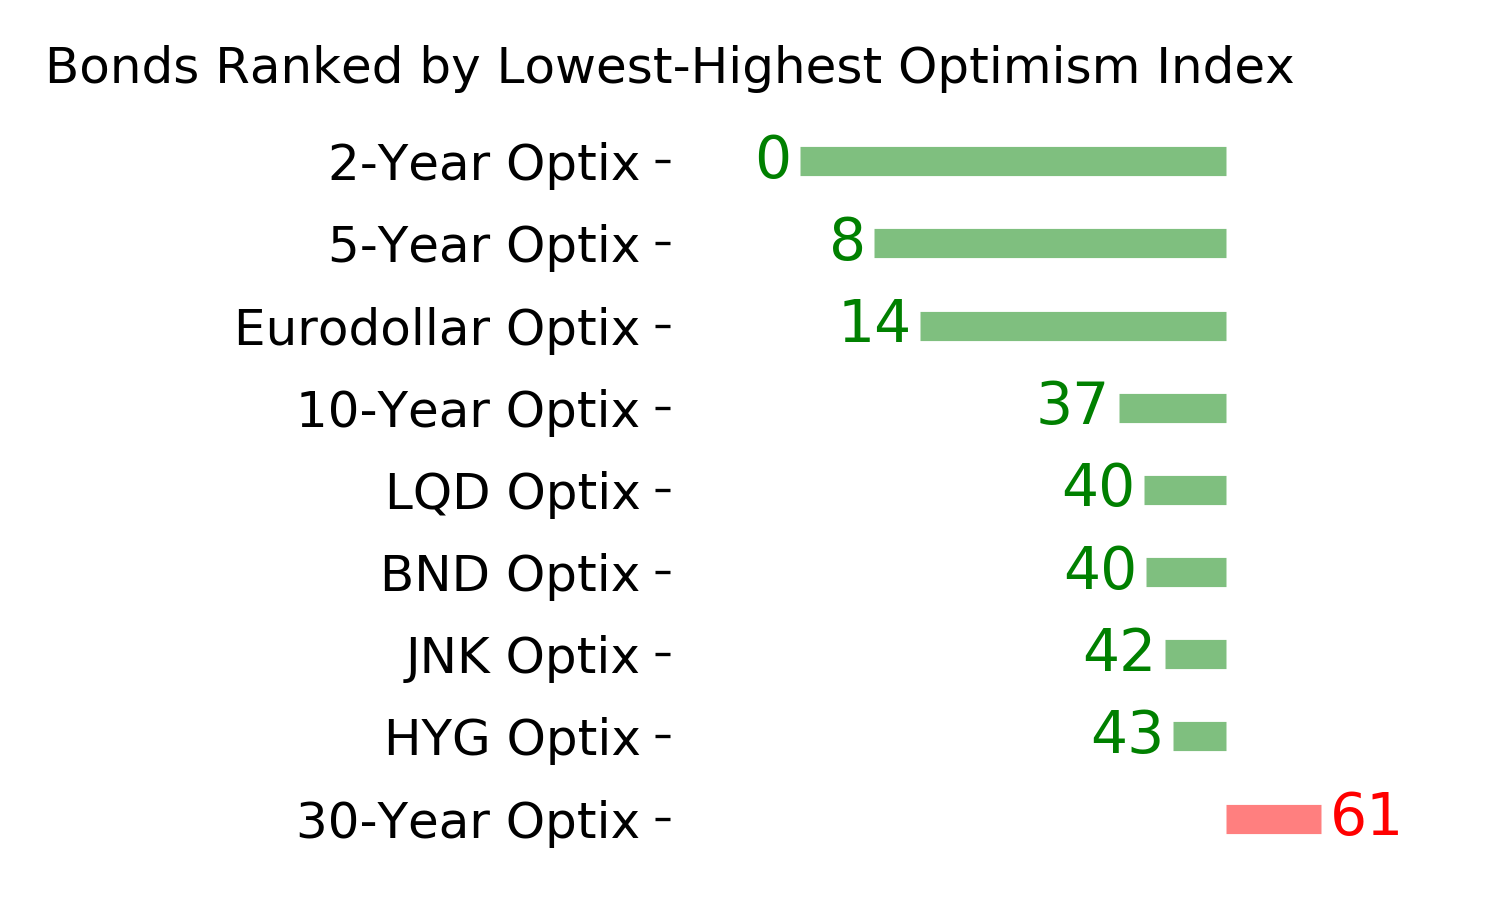
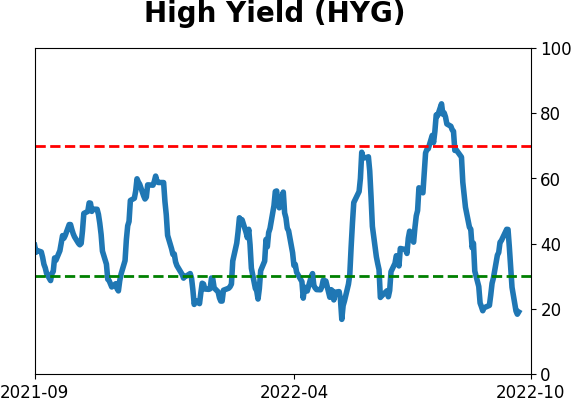
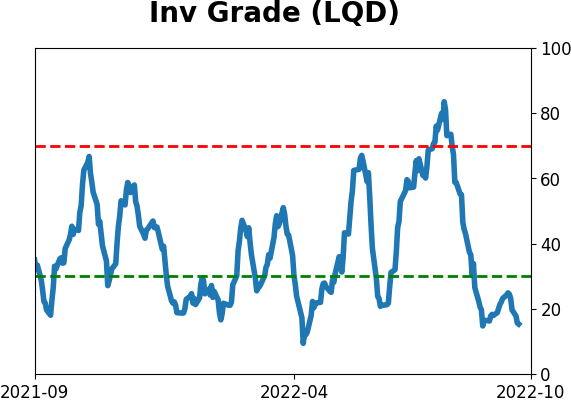
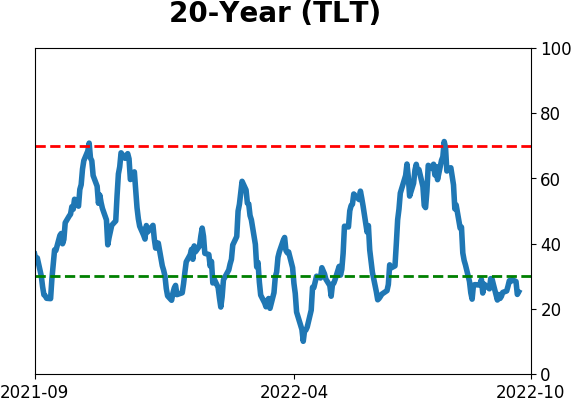
Bond ETF's - 10-Day Moving Average
|
|
|
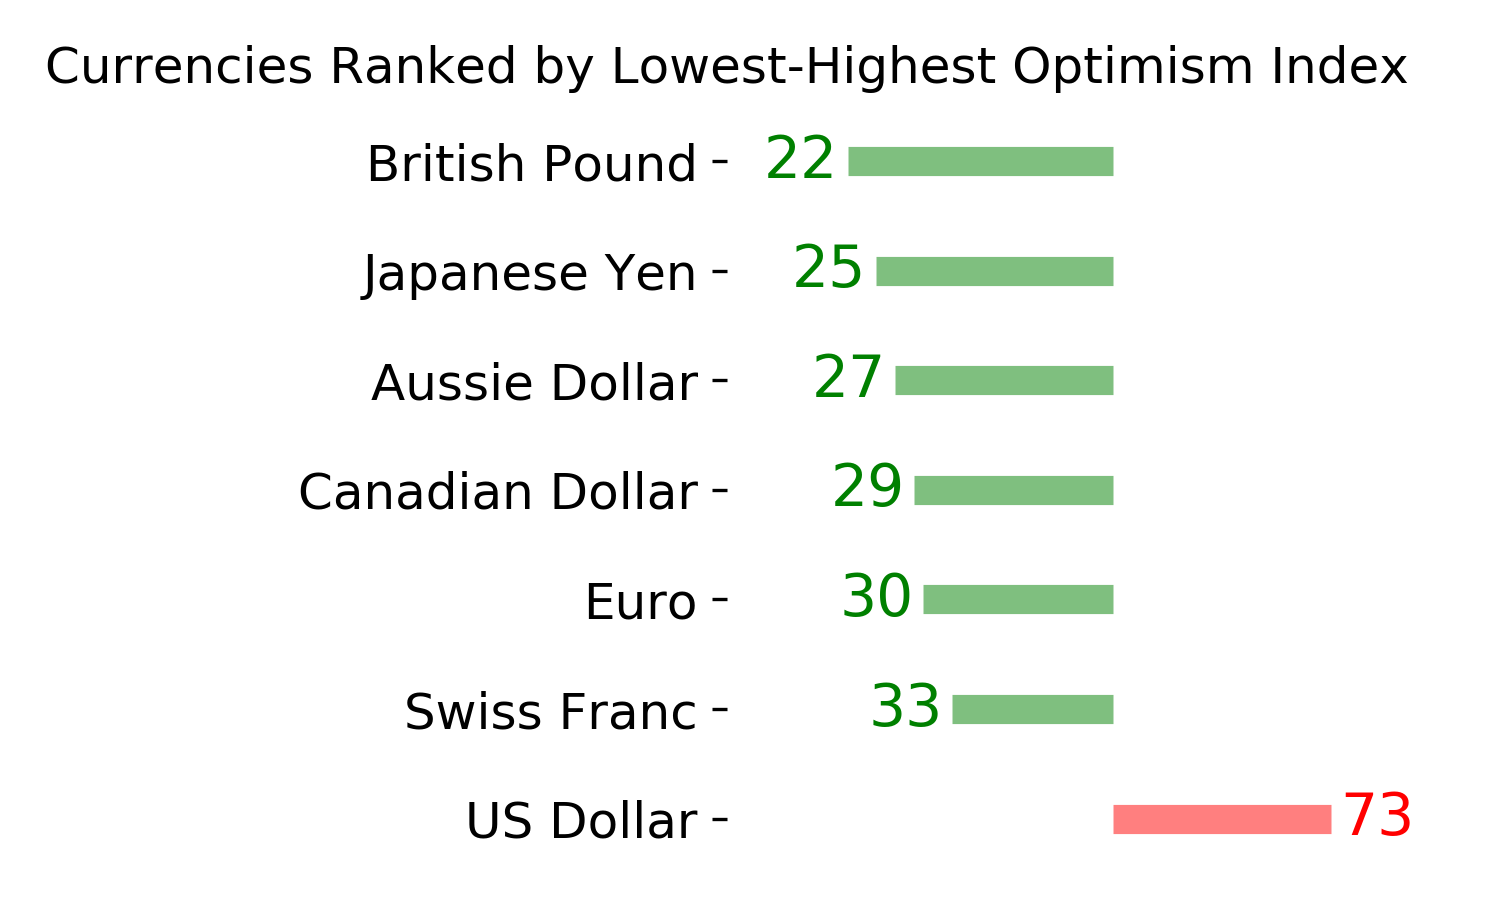
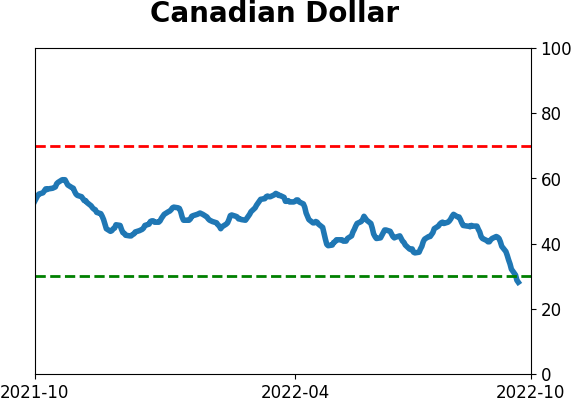
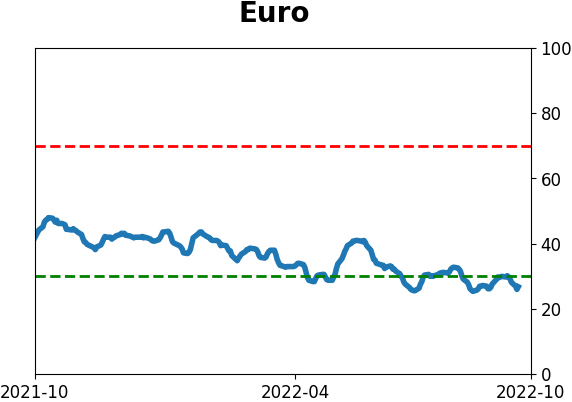
Currency ETF's - 5-Day Moving Average
|
|
|
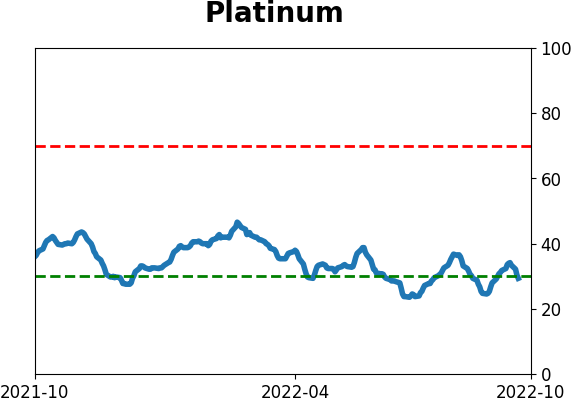
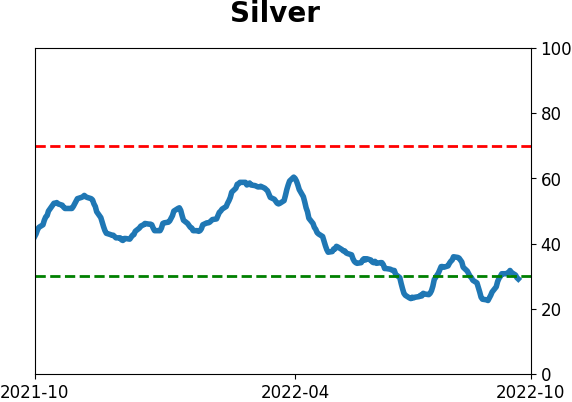
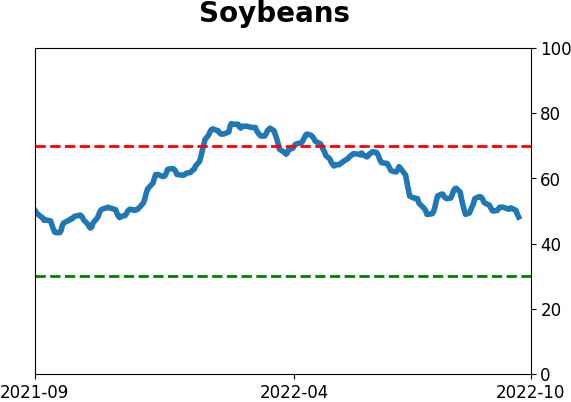
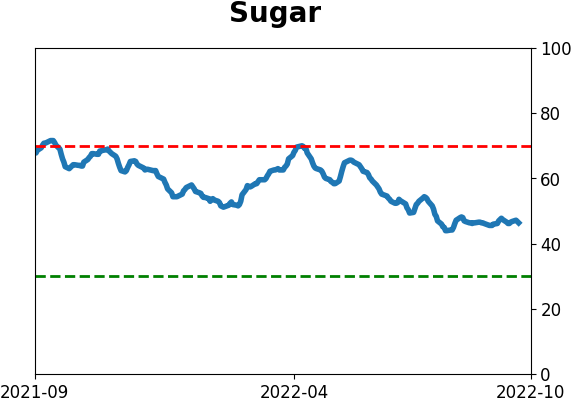
Commodity ETF's - 5-Day Moving Average
|
|