Headlines
|
|
Small-Cap Trading Range Looks Set to Break Soon:
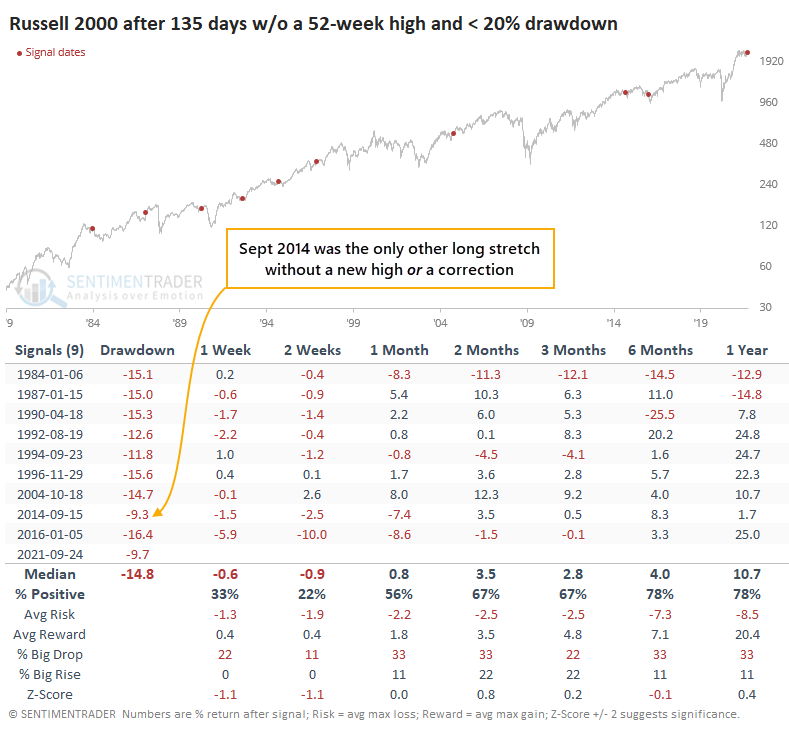
The small-cap Russell 2000 has gone more than 135 days without setting a 52-week high. But it also hasn't fallen into a correction, only the 2nd time in its history it's done both at the same time. There was a positive surge in stocks above their 200-day moving averages; bulls now need to show enough oomph to turn the McClellan Summation Index positive.
Bottom Line:
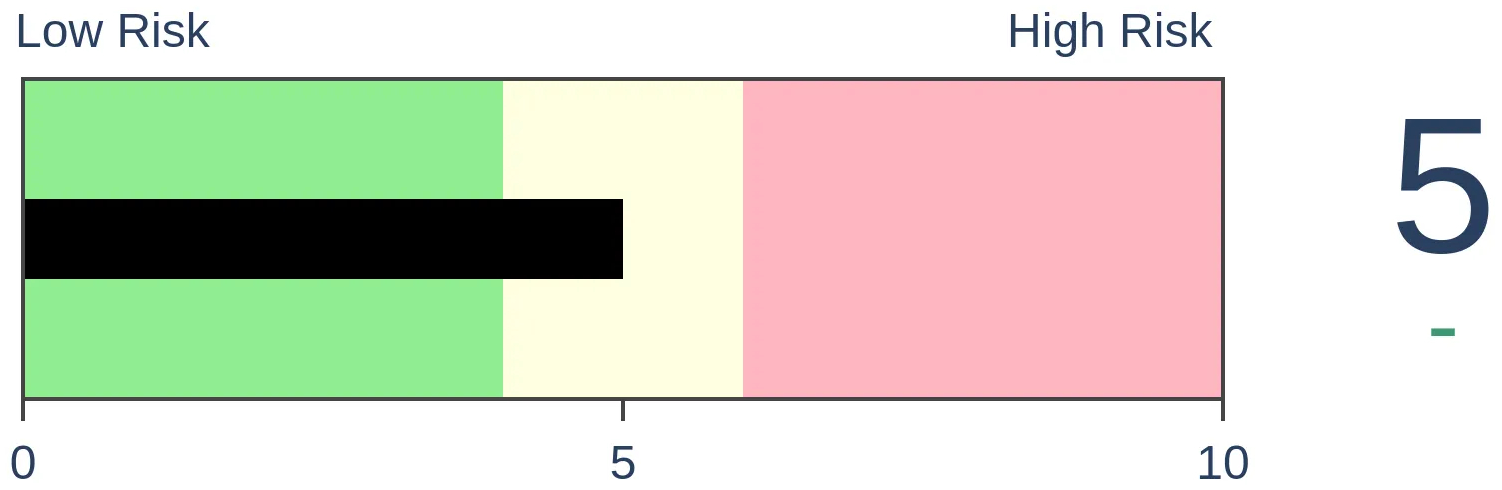
STOCKS: Hold
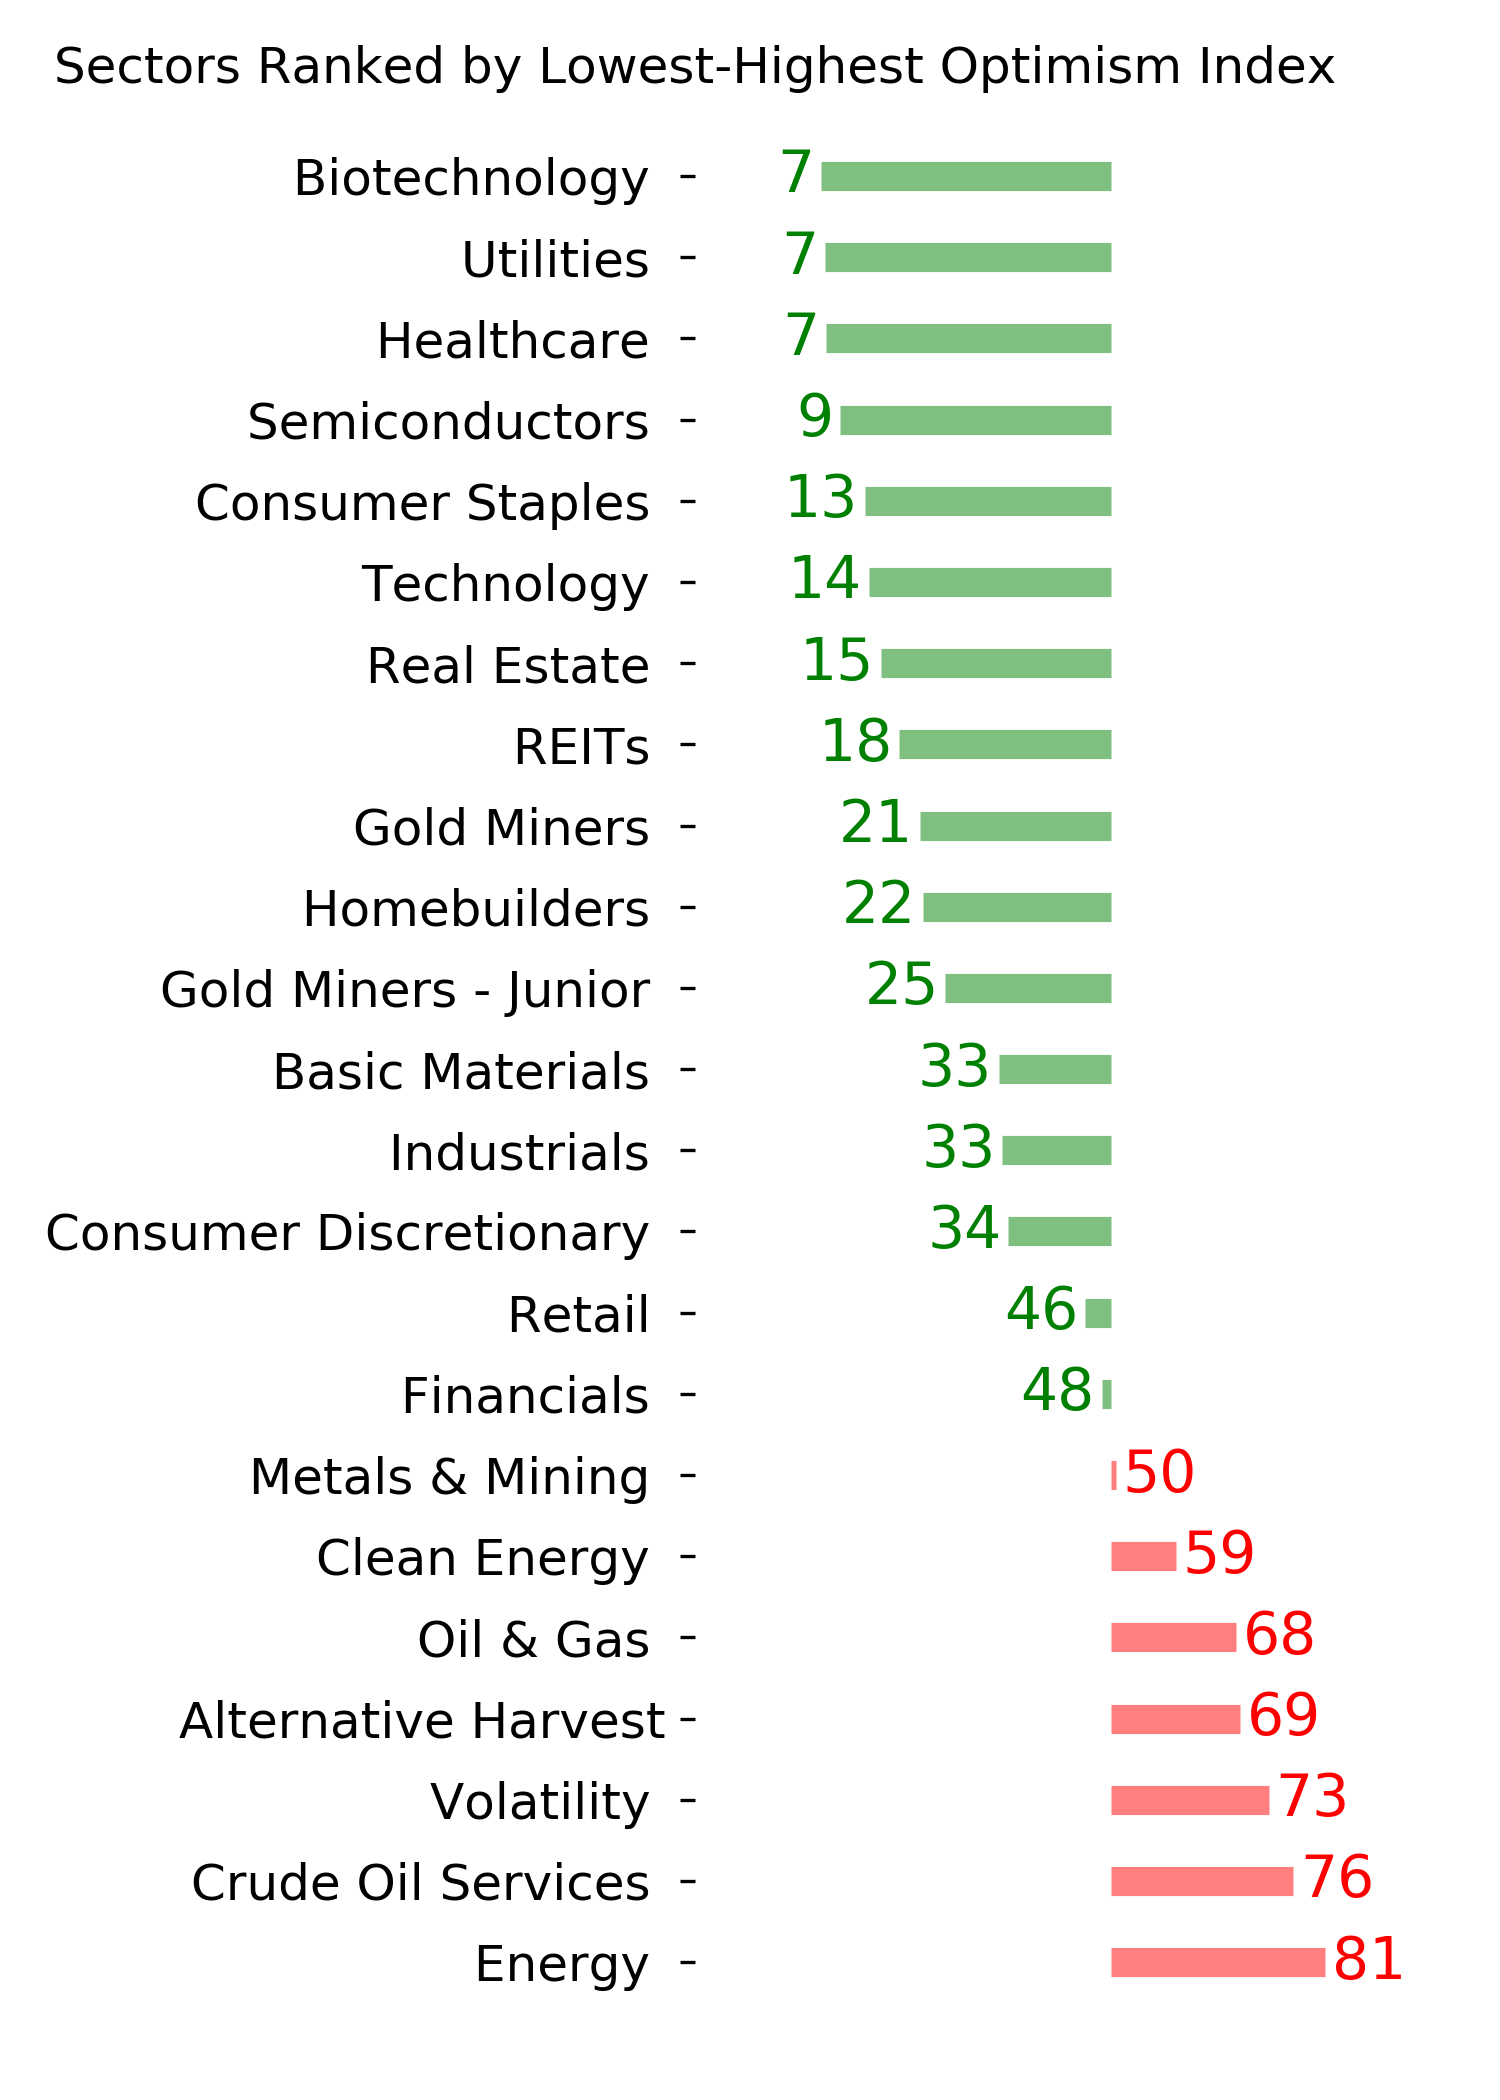
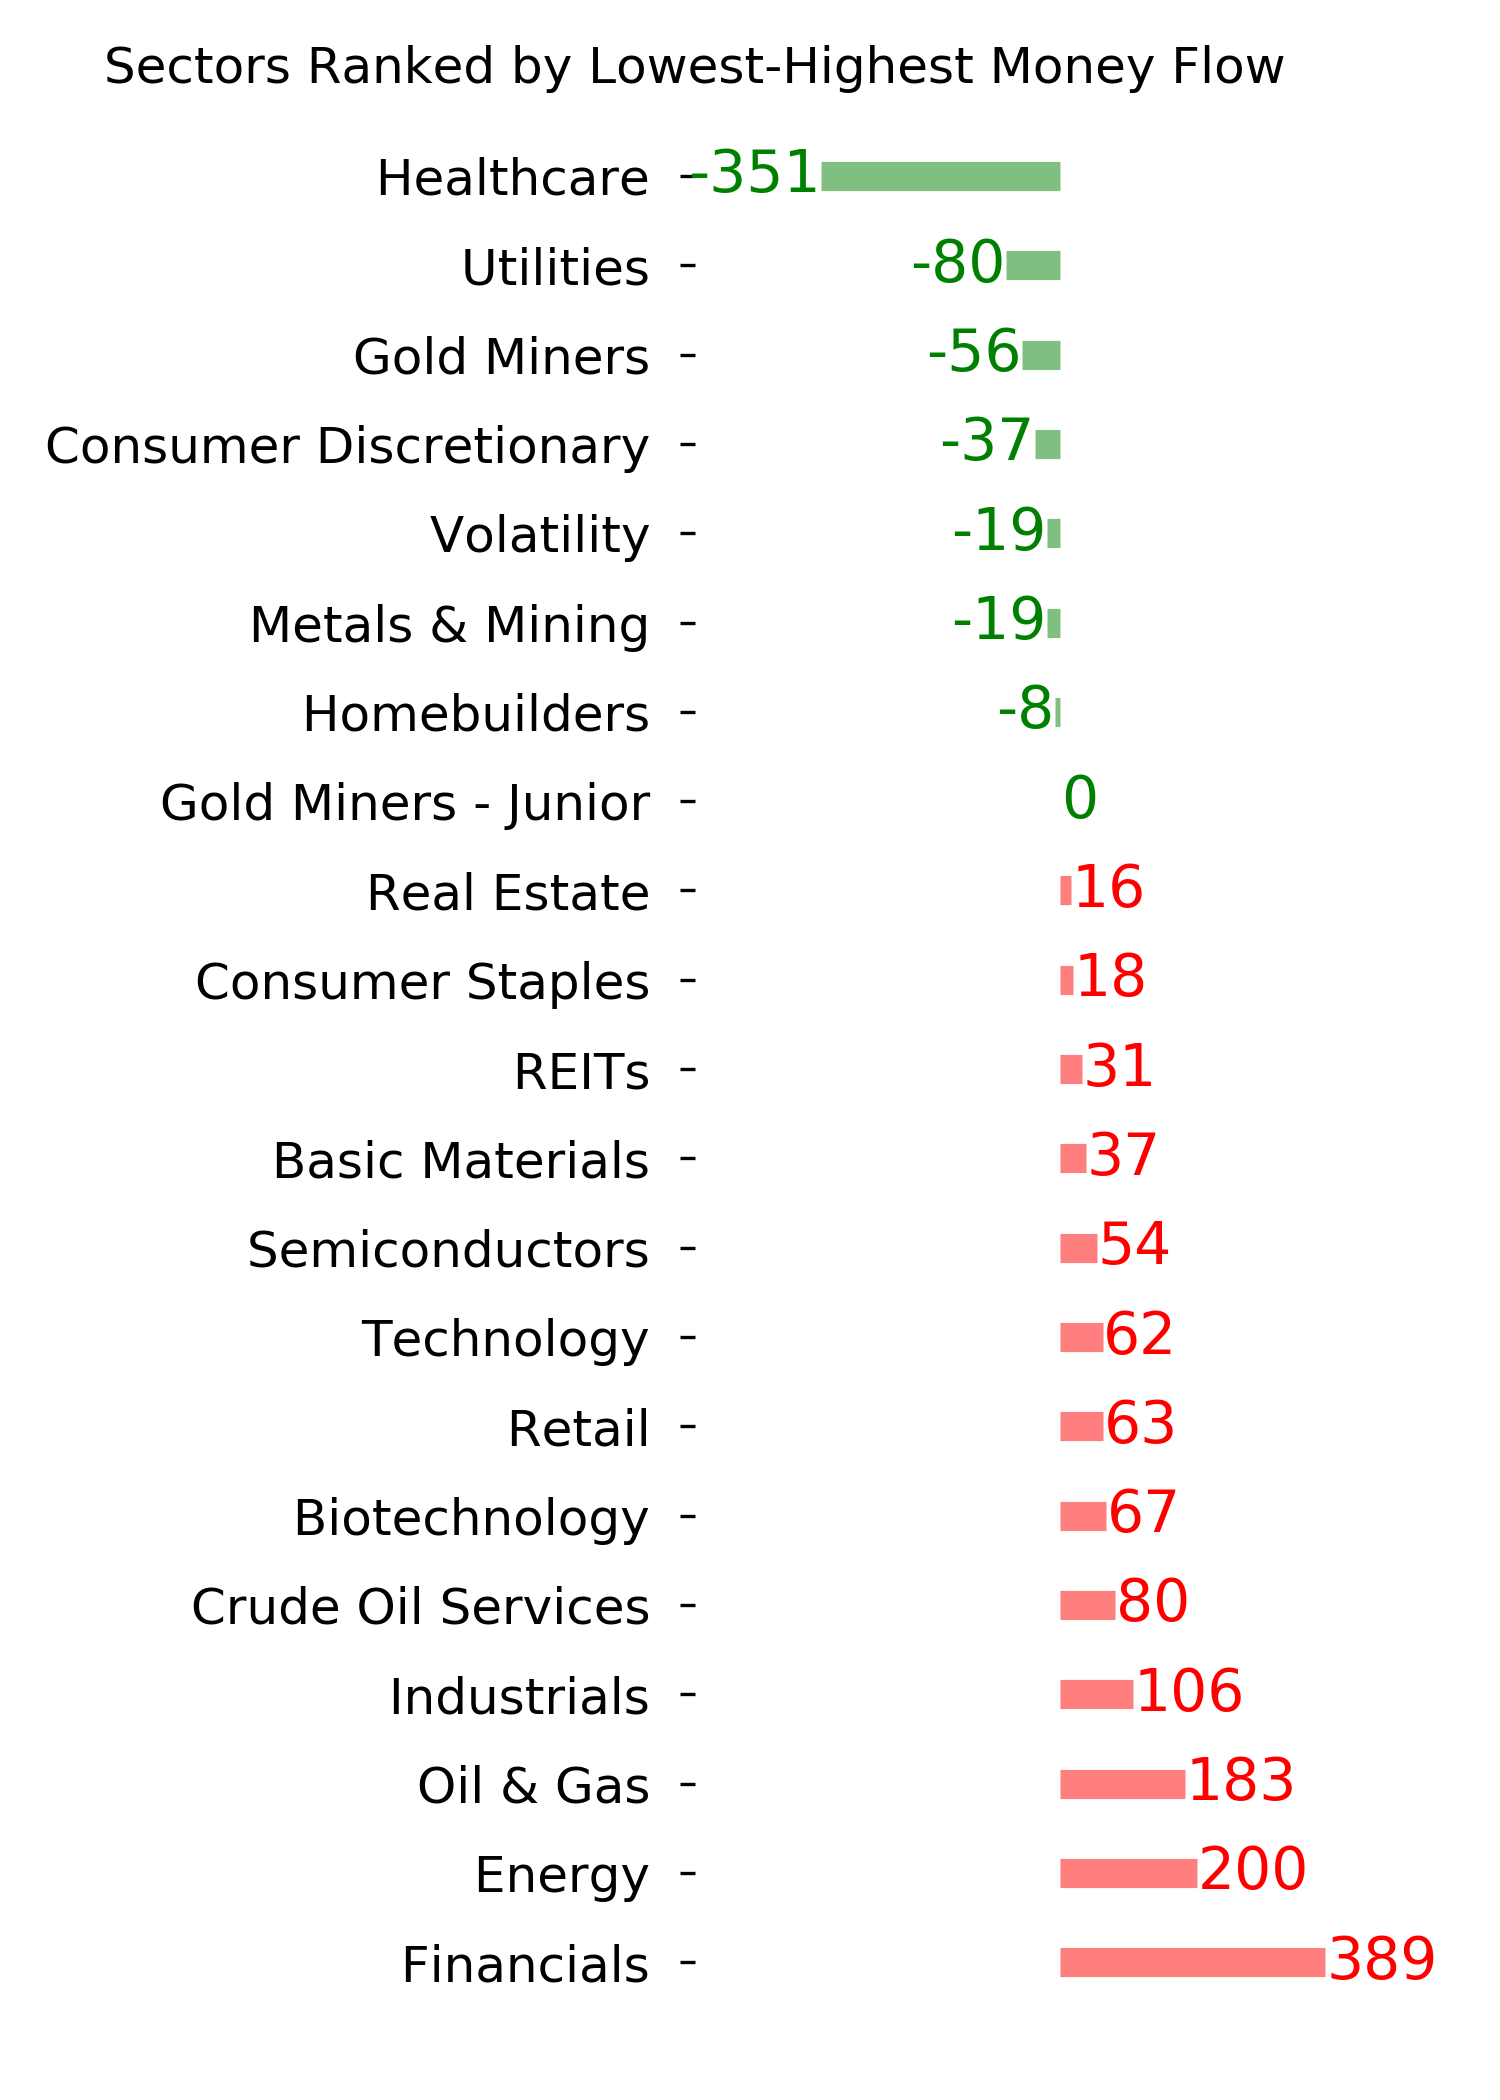
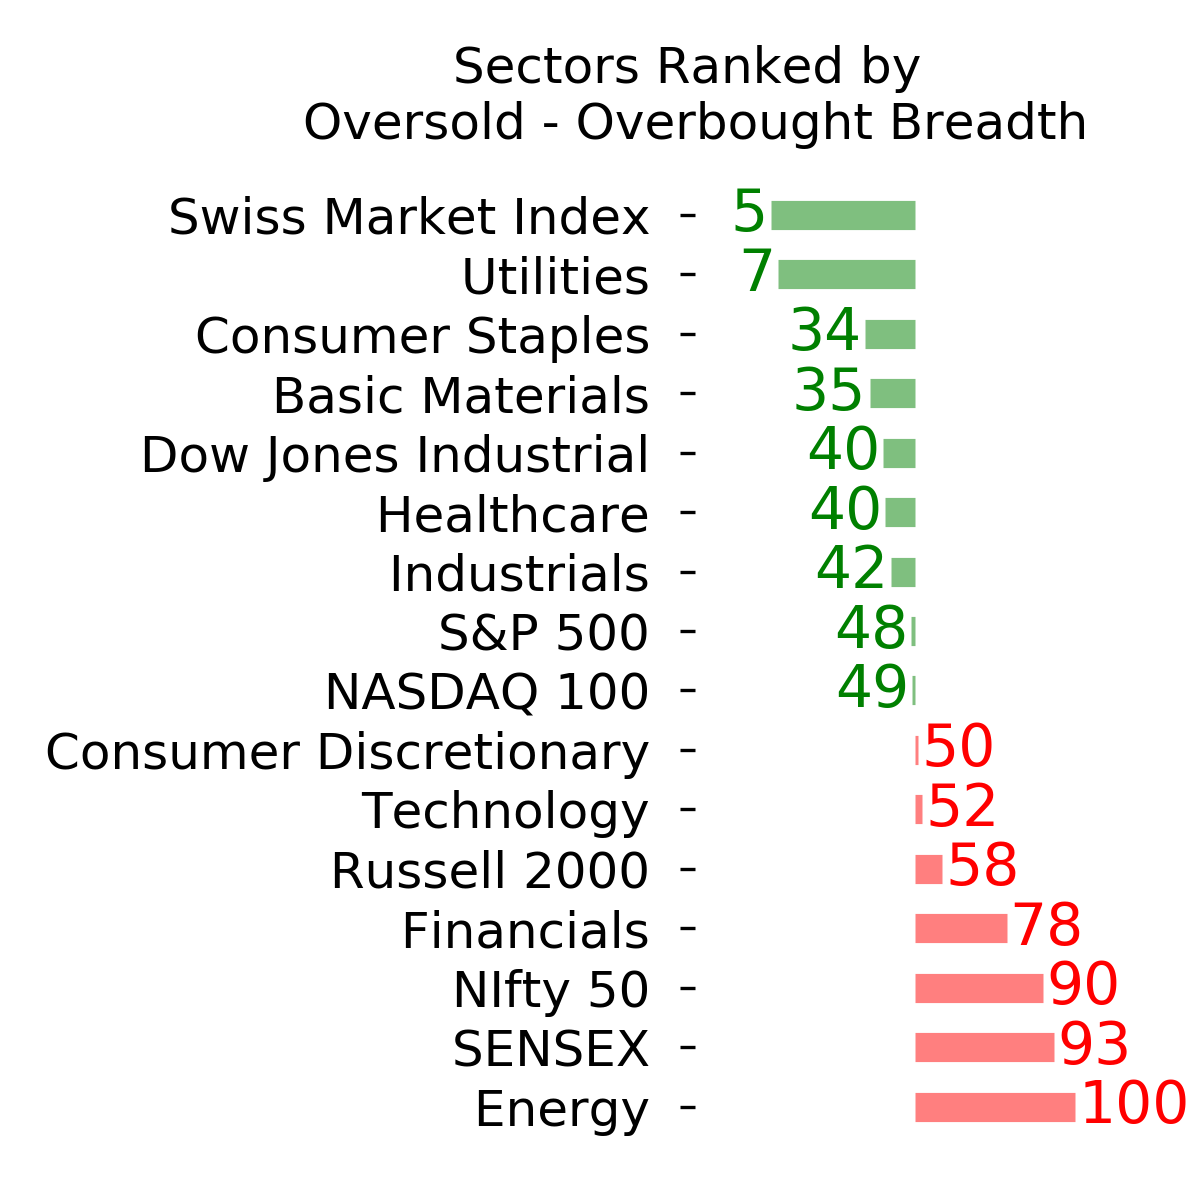
Sentiment continues to decline from the speculative February peak. With deteriorating breadth, this raises the risk of poor short- to medium-term returns until optimism and better breadth returns. See the Outlook & Allocations page for more. BONDS: Hold
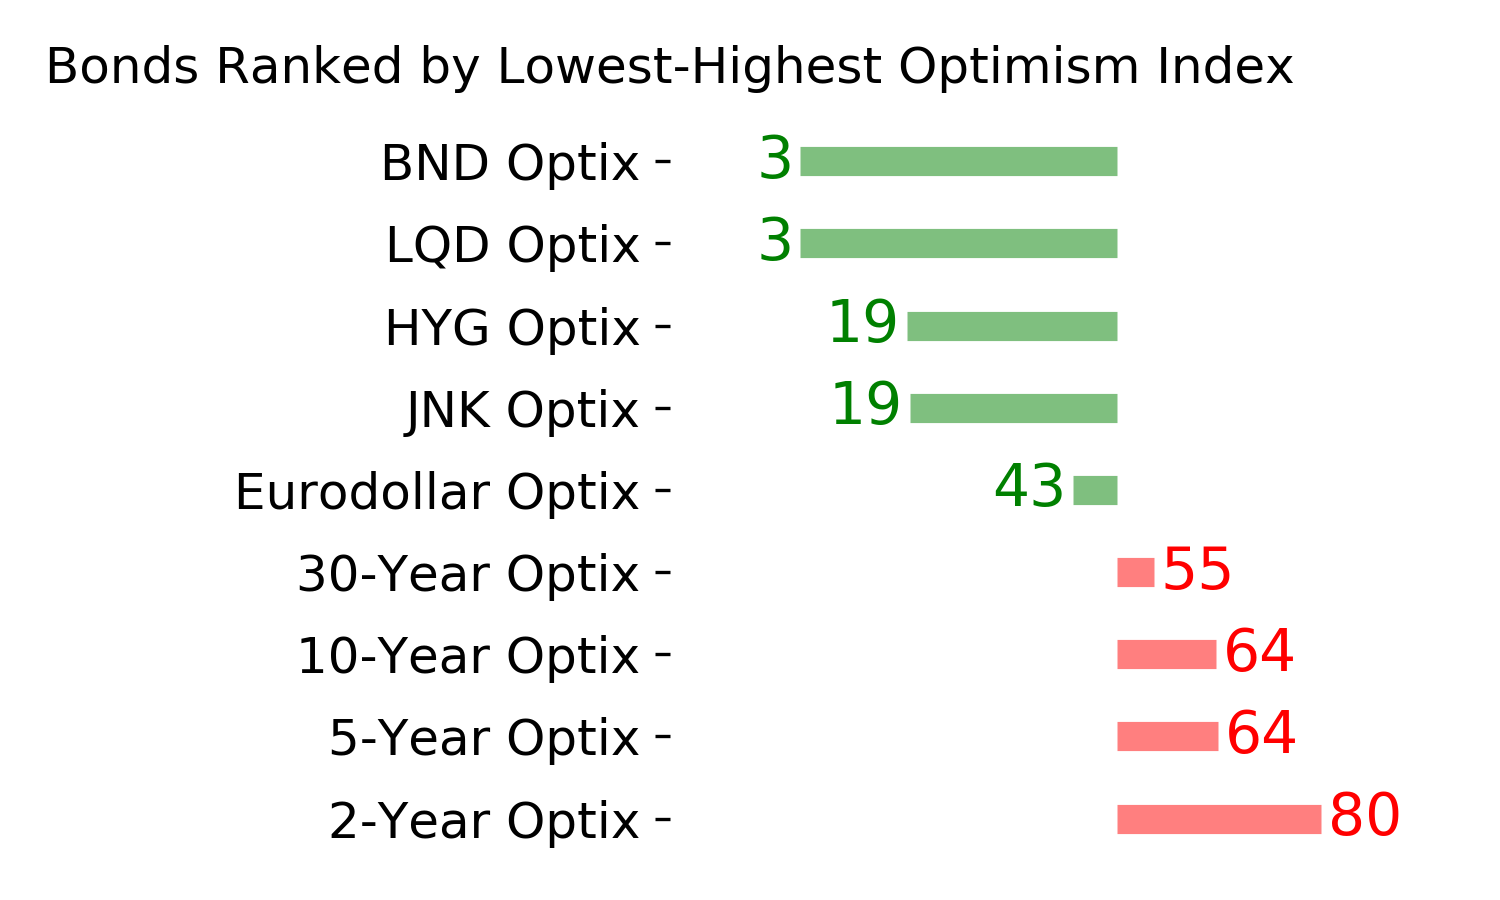
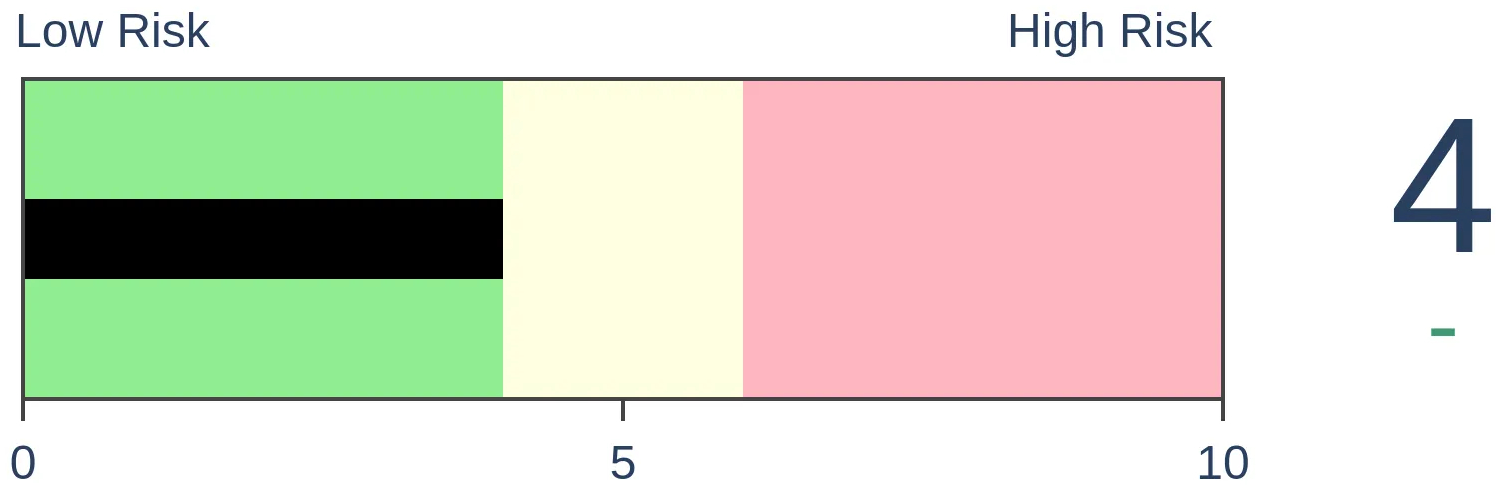
Various parts of the market got hit in March, with the lowest Bond Optimism Index we usually see during healthy environments. Bond prices have modest recovered and there is no edge among the data we follow. GOLD: Hold
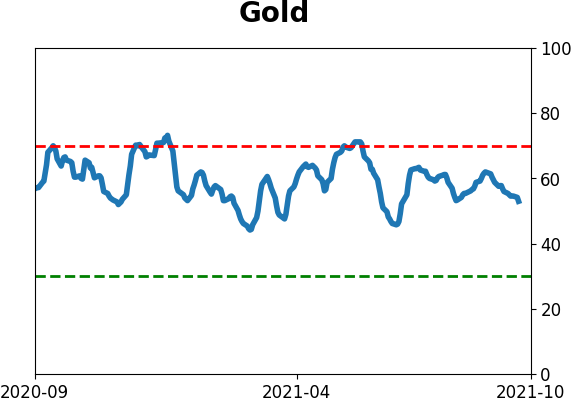
Gold and miners were rejected after trying to recover above their 200-day averages in May. Lately, some medium-term (not long-term) oversold extremes in breadth measures among miners have triggered.
|
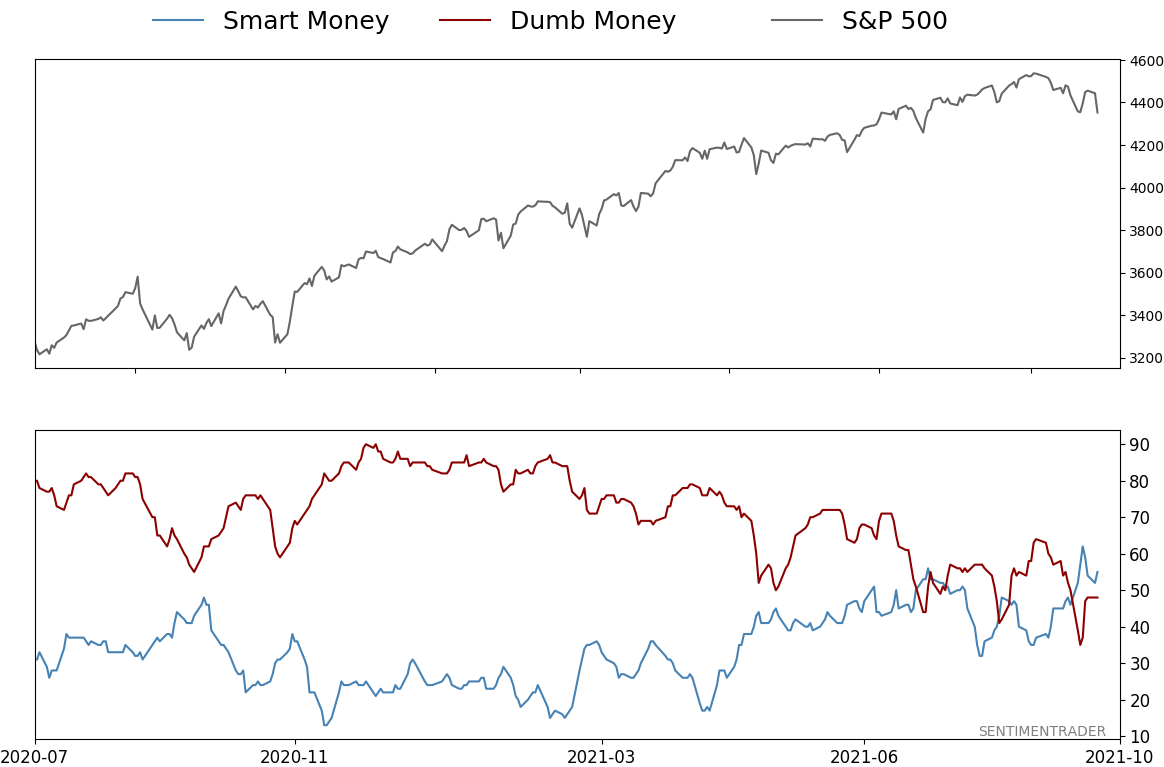
Smart / Dumb Money Confidence
|
Smart Money Confidence: 55%
Dumb Money Confidence: 48%
|
|
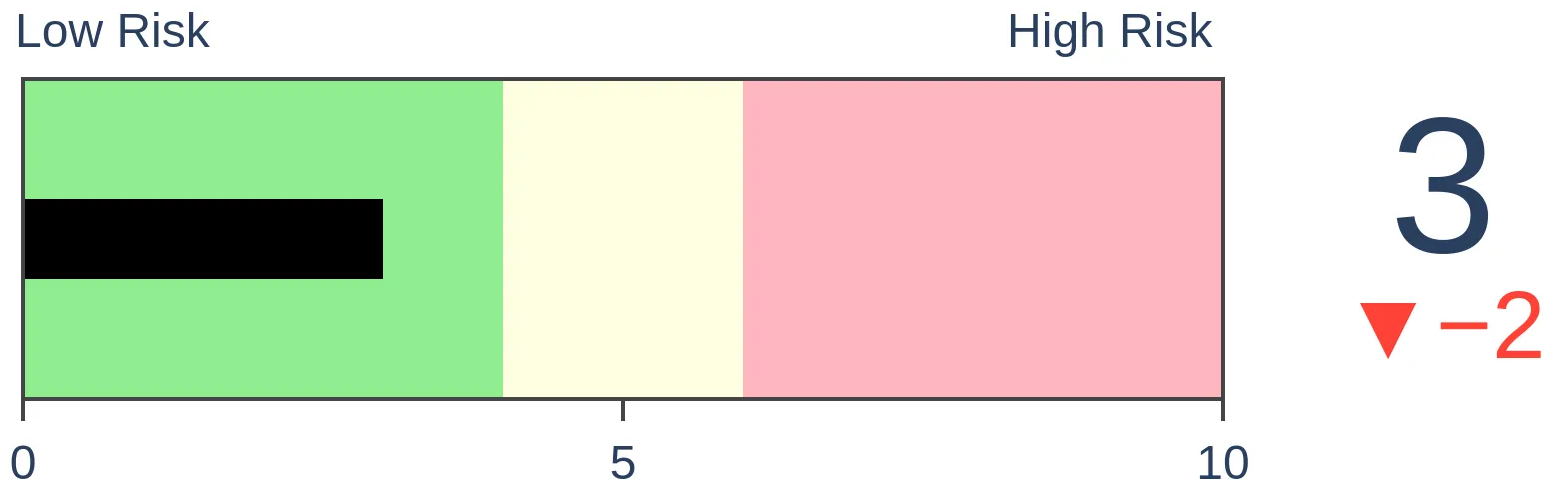
Risk Levels
Stocks Short-Term
|
Stocks Medium-Term

|
|
Bonds

|
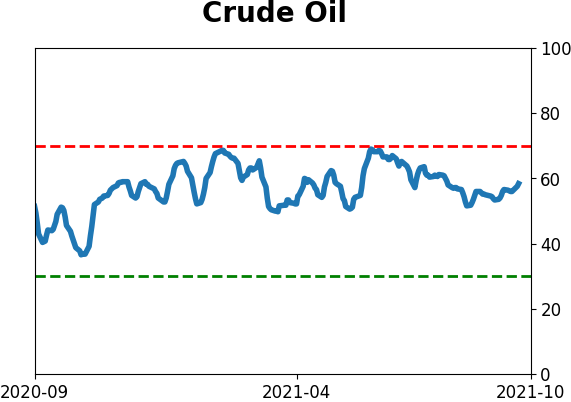
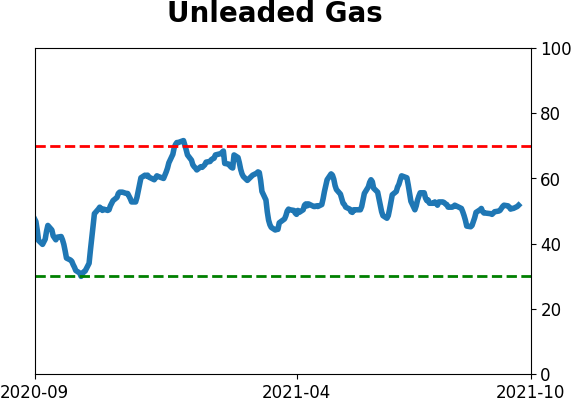
Crude Oil

|
|
Gold
|
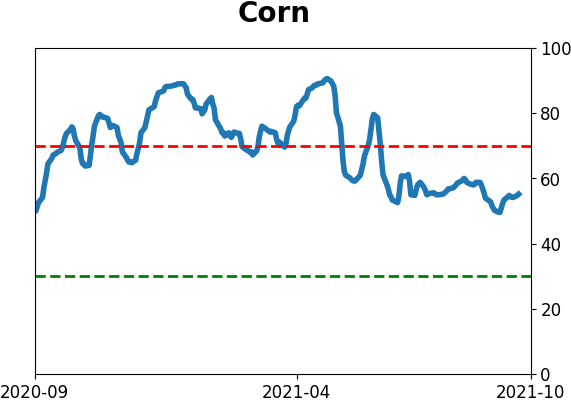
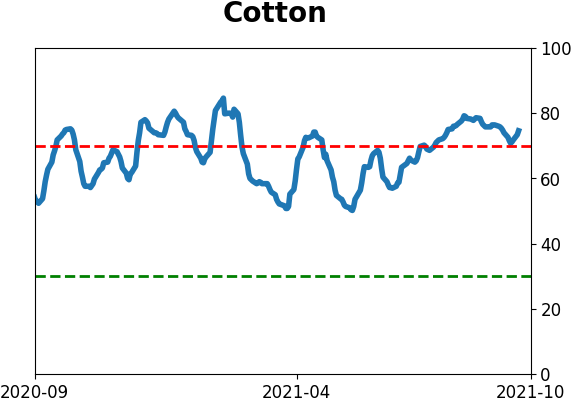
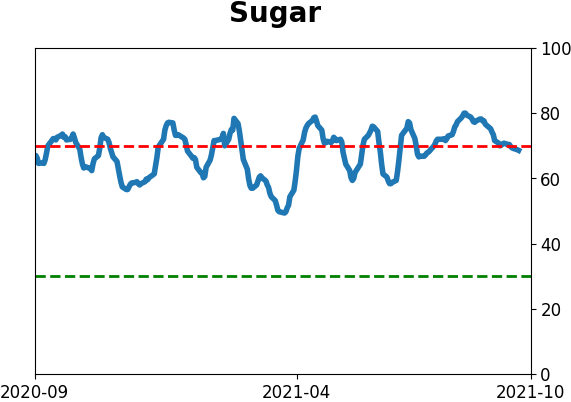
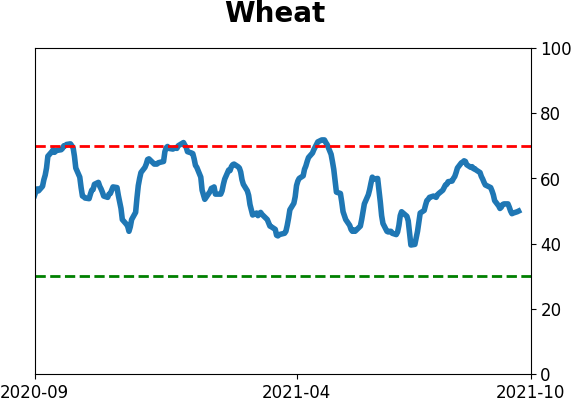
Agriculture
|
|
Research
By Jason Goepfert
BOTTOM LINE
The small-cap Russell 2000 has gone more than 135 days without setting a 52-week high. But it also hasn't fallen into a correction, only the 2nd time in its history it's done both at the same time. There was a positive surge in stocks above their 200-day moving averages; bulls now need to show enough oomph to turn the McClellan Summation Index positive.
FORECAST / TIMEFRAME
None
|
The small-cap Russell 2000 hasn't gone anywhere for six months. On Monday, we noted that these stocks peaked when options traders' speculative fervor did, and these stocks have been trying to shrug off the hangover ever since.
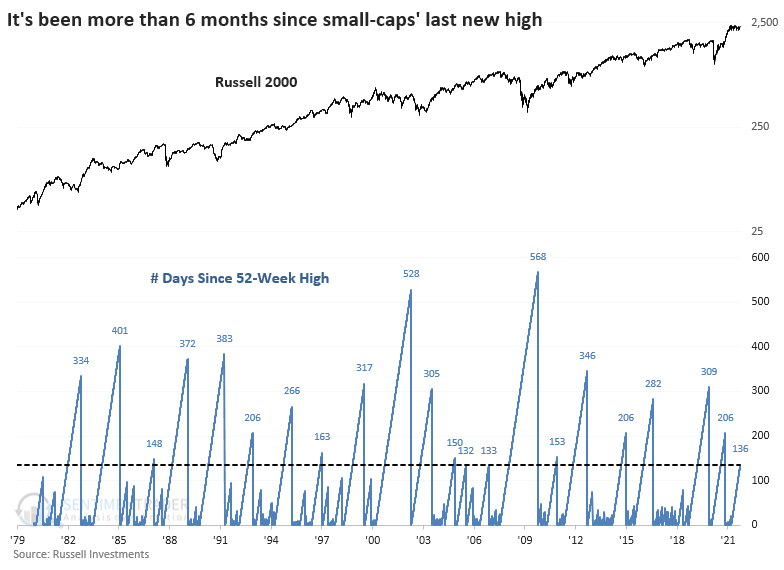
The Russell has gone more than 135 days without a 52-week high, yet it was down less than 10% at its worst point. Even though it's been six months, it hasn't even suffered the standard definition of a correction.
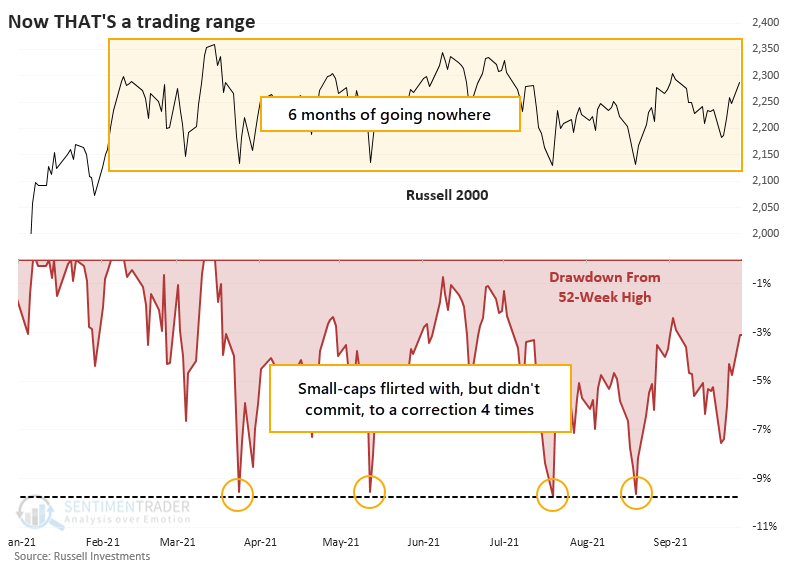
Time-wise, this is one of the longer stretches between 52-week highs, but by no means the longest. It went more than two years without one during the last two protracted bear markets.
LONG TIME, NO CORRECTION
It's unusual that the index has gone so long without a new high but didn't even suffer a 10% pullback along the way. Only one other stretch in the history of the Russell 2000 can claim this. That was almost exactly seven years ago, which quickly saw small-cap stocks lose a lot more in the weeks ahead before popping back up again.
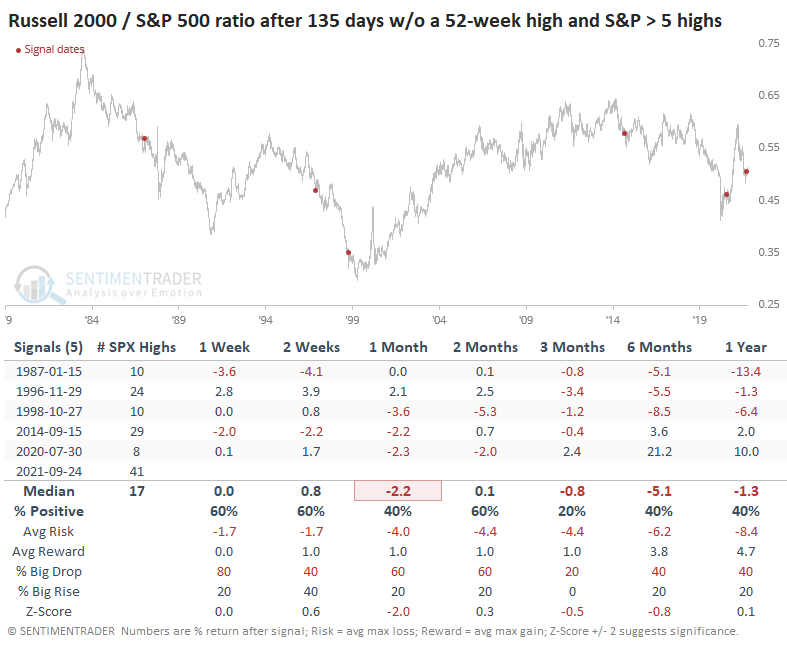
Earlier this summer, we looked at the historic run that the S&P 500 has had in 2021. One of its remarkable feats is a near-record number of days that recorded a new high. When we look at stretches of 135 days when the Russell couldn't set a 52-week high, but during that stretch, the S&P set at least five new highs, the Russell tended to underperform its big brother.
RECOVERING FROM NEAR-RECORD SURGE
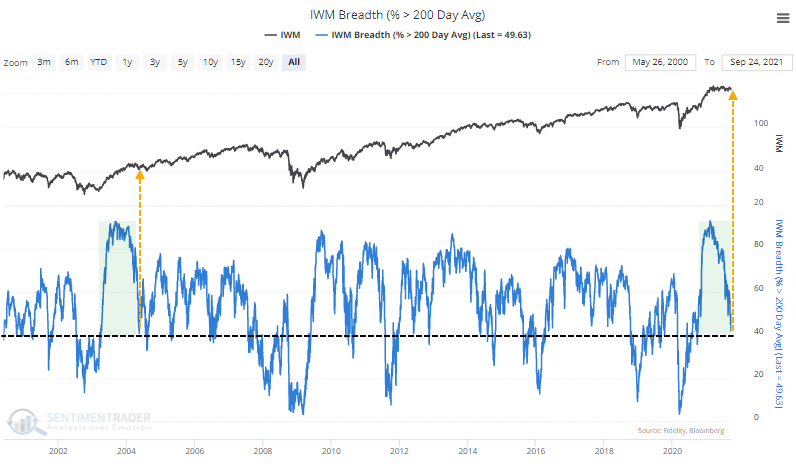
One big check in the bulls' box is that during the surge in small-caps to start the year, more than 93% of Russell 2000 members traded above their 200-day moving averages, the most in more than 20 years. That has since corrected back down toward 40%.
Healthy markets consistently see more than 60% of members above their 200-day averages, with forays toward 40% proving to be buying opportunities. The only other time in 20 years we saw anything similar to the past year in these trends was 2004 during the congestion following the initial thrust off that bear market bottom.
We do need to see better momentum under the surface, though. The setup is there for bulls; now, they need to follow through.
The McClellan Summation Index has been mired below zero since early July. This is not what healthy markets do - it's the kind of activity that small-caps endured during the corrective periods in 2018 and 2020 but hasn't become as oversold as it did then.
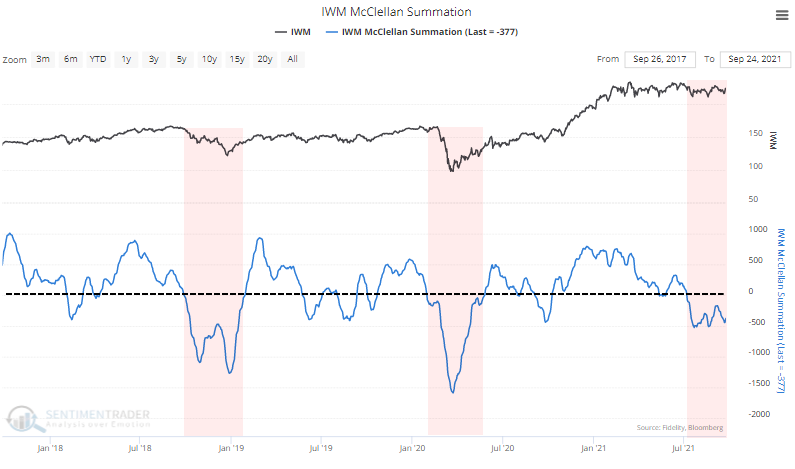
The thrust in positive 200-day moving average trends is a good setup. Now, we need to see better participation during a rally to turn the Oscillator well above zero long enough to turn the Summation Index positive.
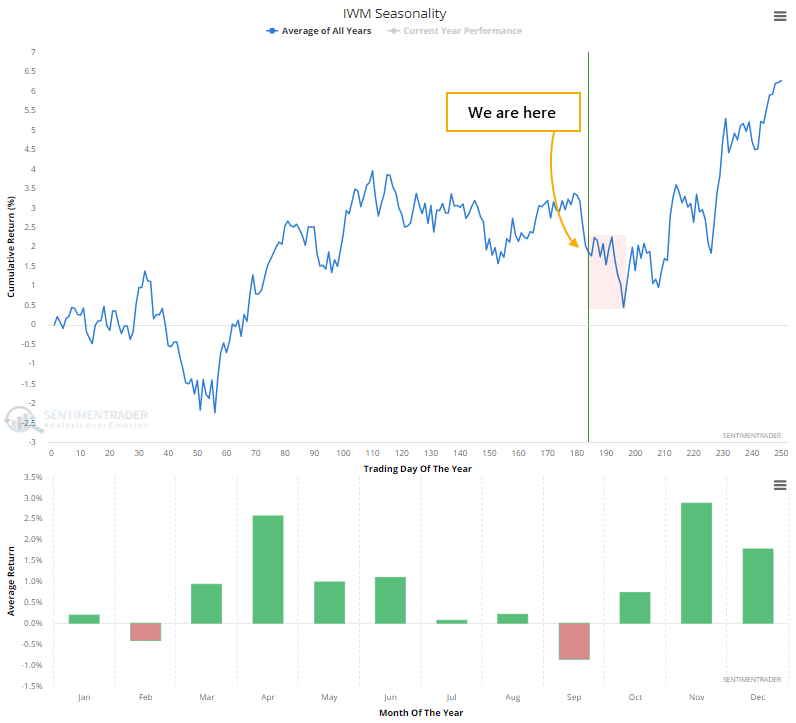
Seasonally, small-caps have a weak spot in the coming weeks, as do stocks in general. That's the well-known September-October spooky stretch, but it's dangerous to get too cute with seasonality, especially considering the strong Q4 that the stocks tend to exhibit.
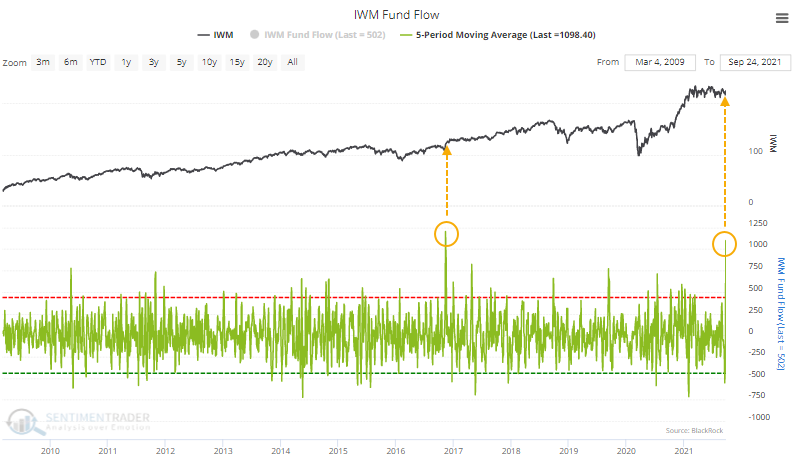
Traders seem to be looking past any potential trouble, with a near-record inflow to the IWM fund over the past five days. The only other time in the past decade that the fund took in an average of more than $1 billion per day for a week was November 2016 following the election.
Over the past 30 years, when the Russell 2000 has gone this long without a 52-week high and without falling into a bear market, it has broken out to the upside every time, with positive returns 12 months later each time (the two signals before that were losers).
It is questionable whether it would be a better bet than the S&P 500 juggernaut, and evidence would suggest it's not. But if small-cap stocks can hold up and see some surges in the coming weeks, enough to turn the Summation Index positive, it should be a good sign for the medium- to long-term.
Active Studies
| Time Frame | Bullish | Bearish | | Short-Term | 0 | 6 | | Medium-Term | 8 | 3 | | Long-Term | 11 | 5 |
|
Indicators at Extremes
Portfolio
| Position | Description | Weight % | Added / Reduced | Date | | Stocks | RSP | 4.1 | Added 4.1% | 2021-05-19 | | Bonds | 23.9% BND, 6.9% SCHP | 30.7 | Reduced 7.1% | 2021-05-19 | | Commodities | GCC | 2.6 | Reduced 2.1%
| 2020-09-04 | | Precious Metals | GDX | 5.6 | Reduced 4.2% | 2021-05-19 | | Special Situations | 4.3% XLE, 2.2% PSCE | 7.6 | Reduced 5.6% | 2021-04-22 | | Cash | | 49.4 | | |
|
Updates (Changes made today are underlined)
Much of our momentum and trend work has remained positive for several months, with some scattered exceptions. Almost all sentiment-related work has shown a poor risk/reward ratio for stocks, especially as speculation drove to record highs in exuberance in February. Much of that has worn off, and most of our models are back toward neutral levels. There isn't much to be excited about here. The same goes for bonds and even gold. Gold has been performing well lately and is back above long-term trend lines. The issue is that it has a poor record of holding onto gains when attempting a long-term trend change like this, so we'll take a wait-and-see approach. RETURN YTD: 8.7% 2020: 8.1%, 2019: 12.6%, 2018: 0.6%, 2017: 3.8%, 2016: 17.1%, 2015: 9.2%, 2014: 14.5%, 2013: 2.2%, 2012: 10.8%, 2011: 16.5%, 2010: 15.3%, 2009: 23.9%, 2008: 16.2%, 2007: 7.8%
|
|
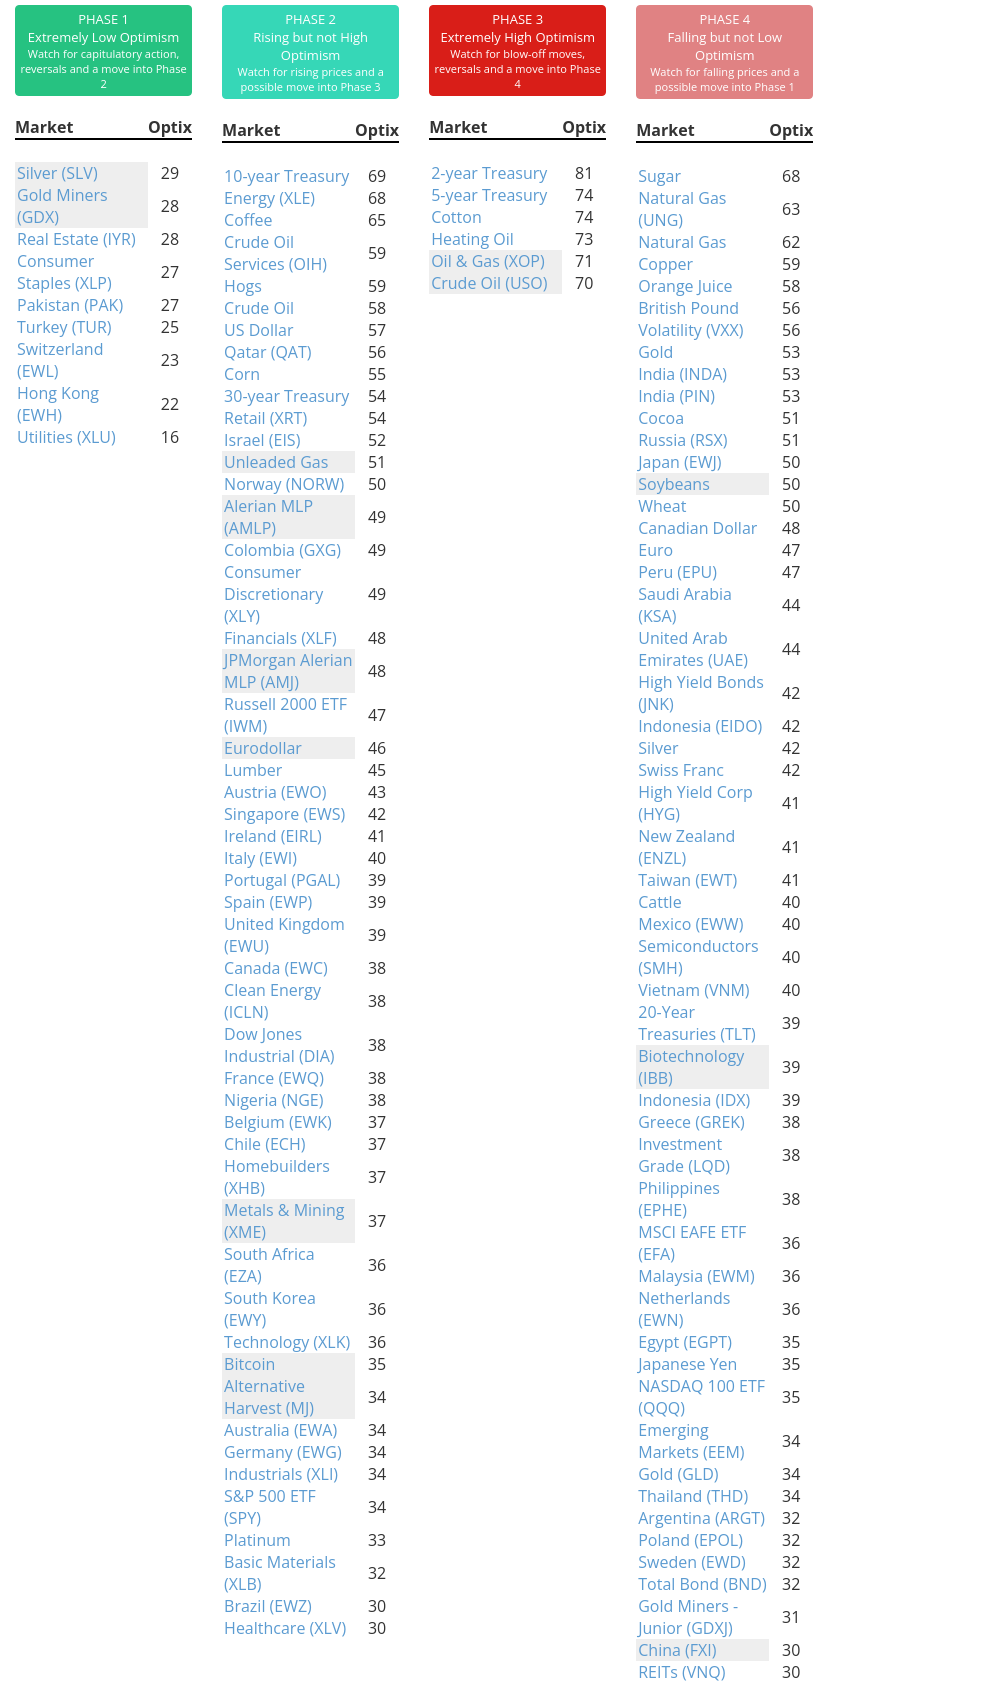
Phase Table
Ranks
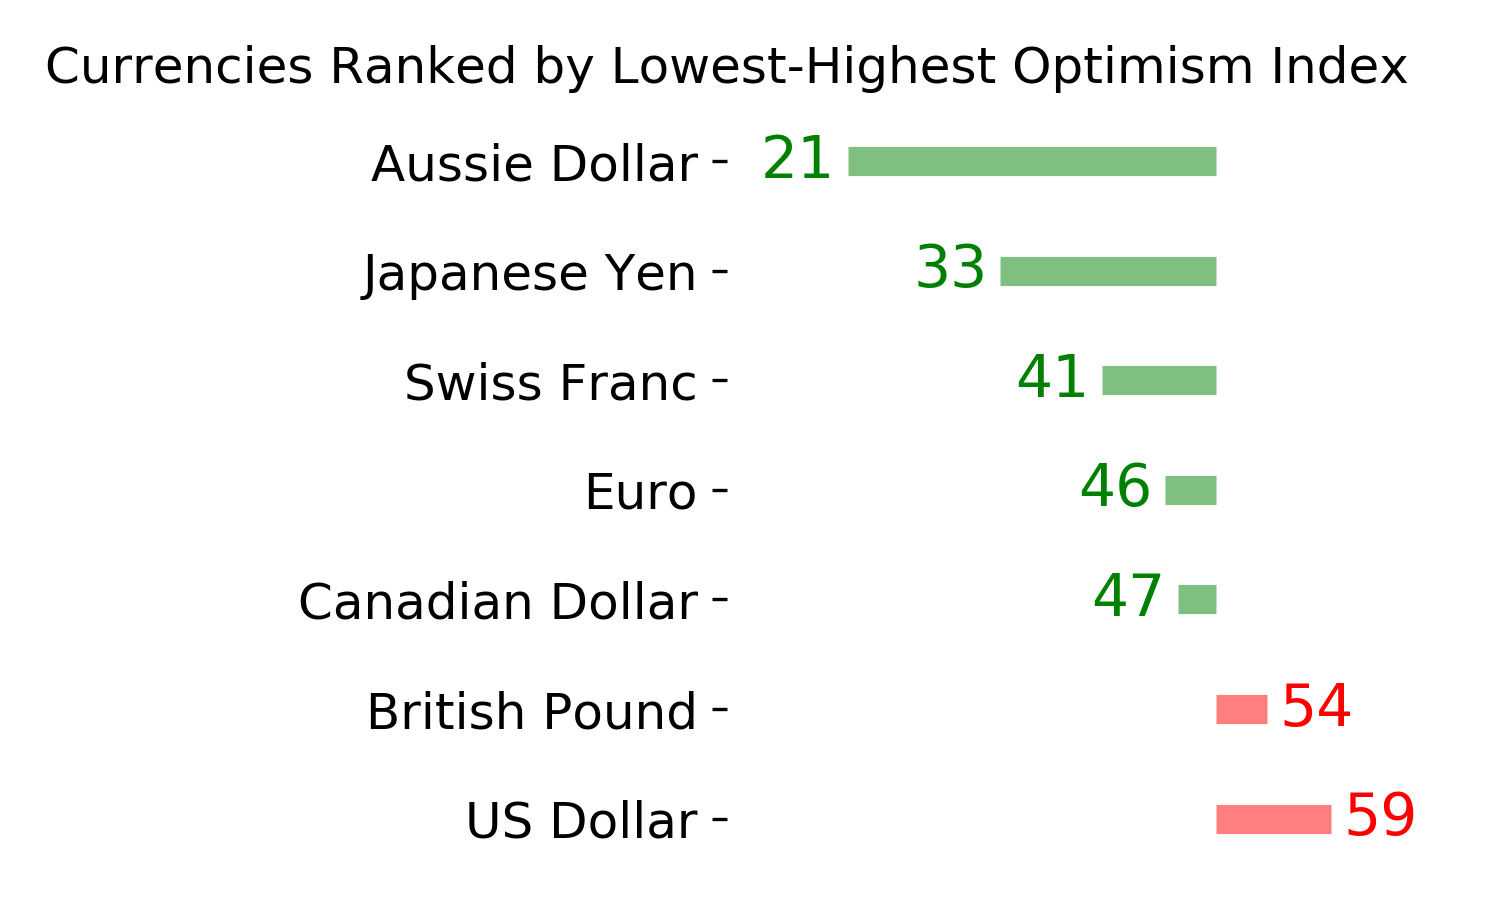
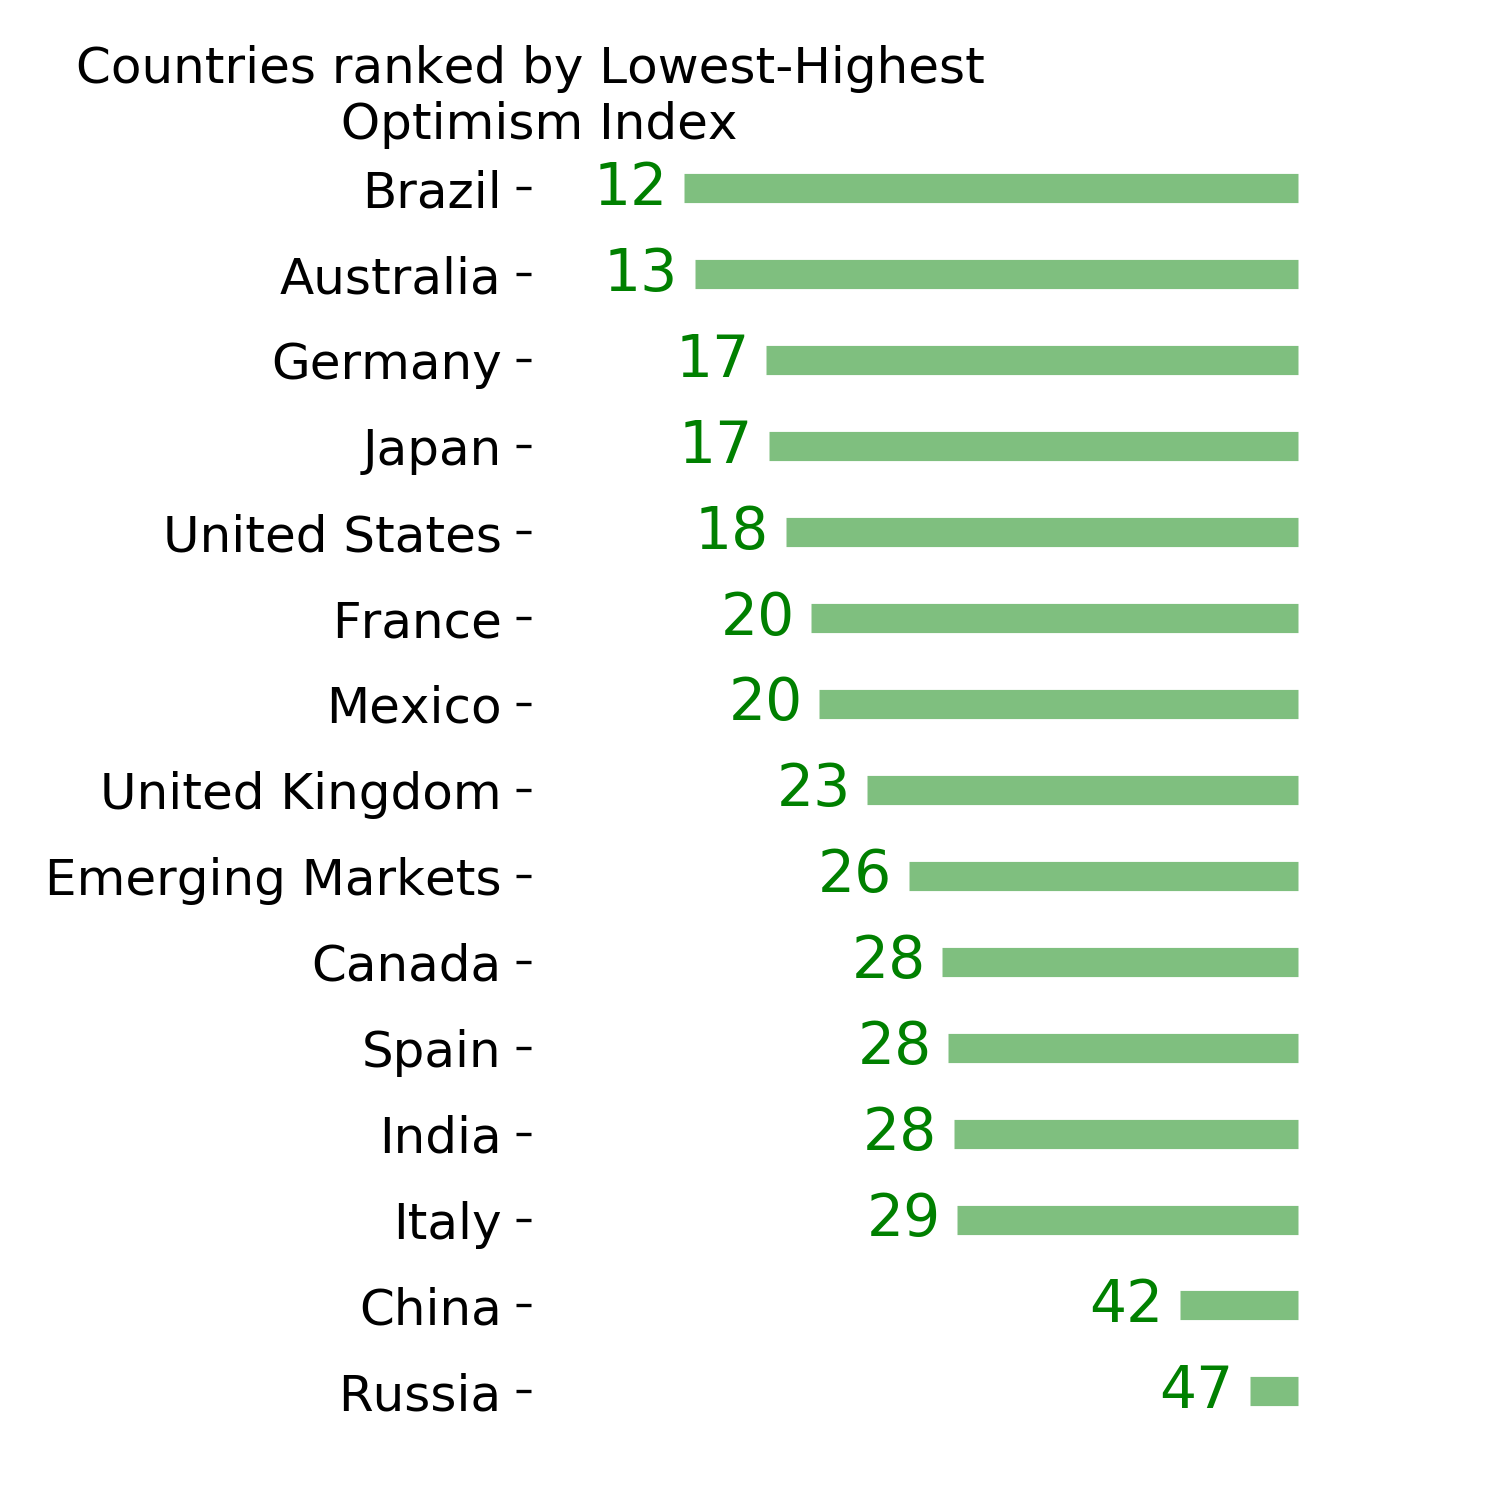
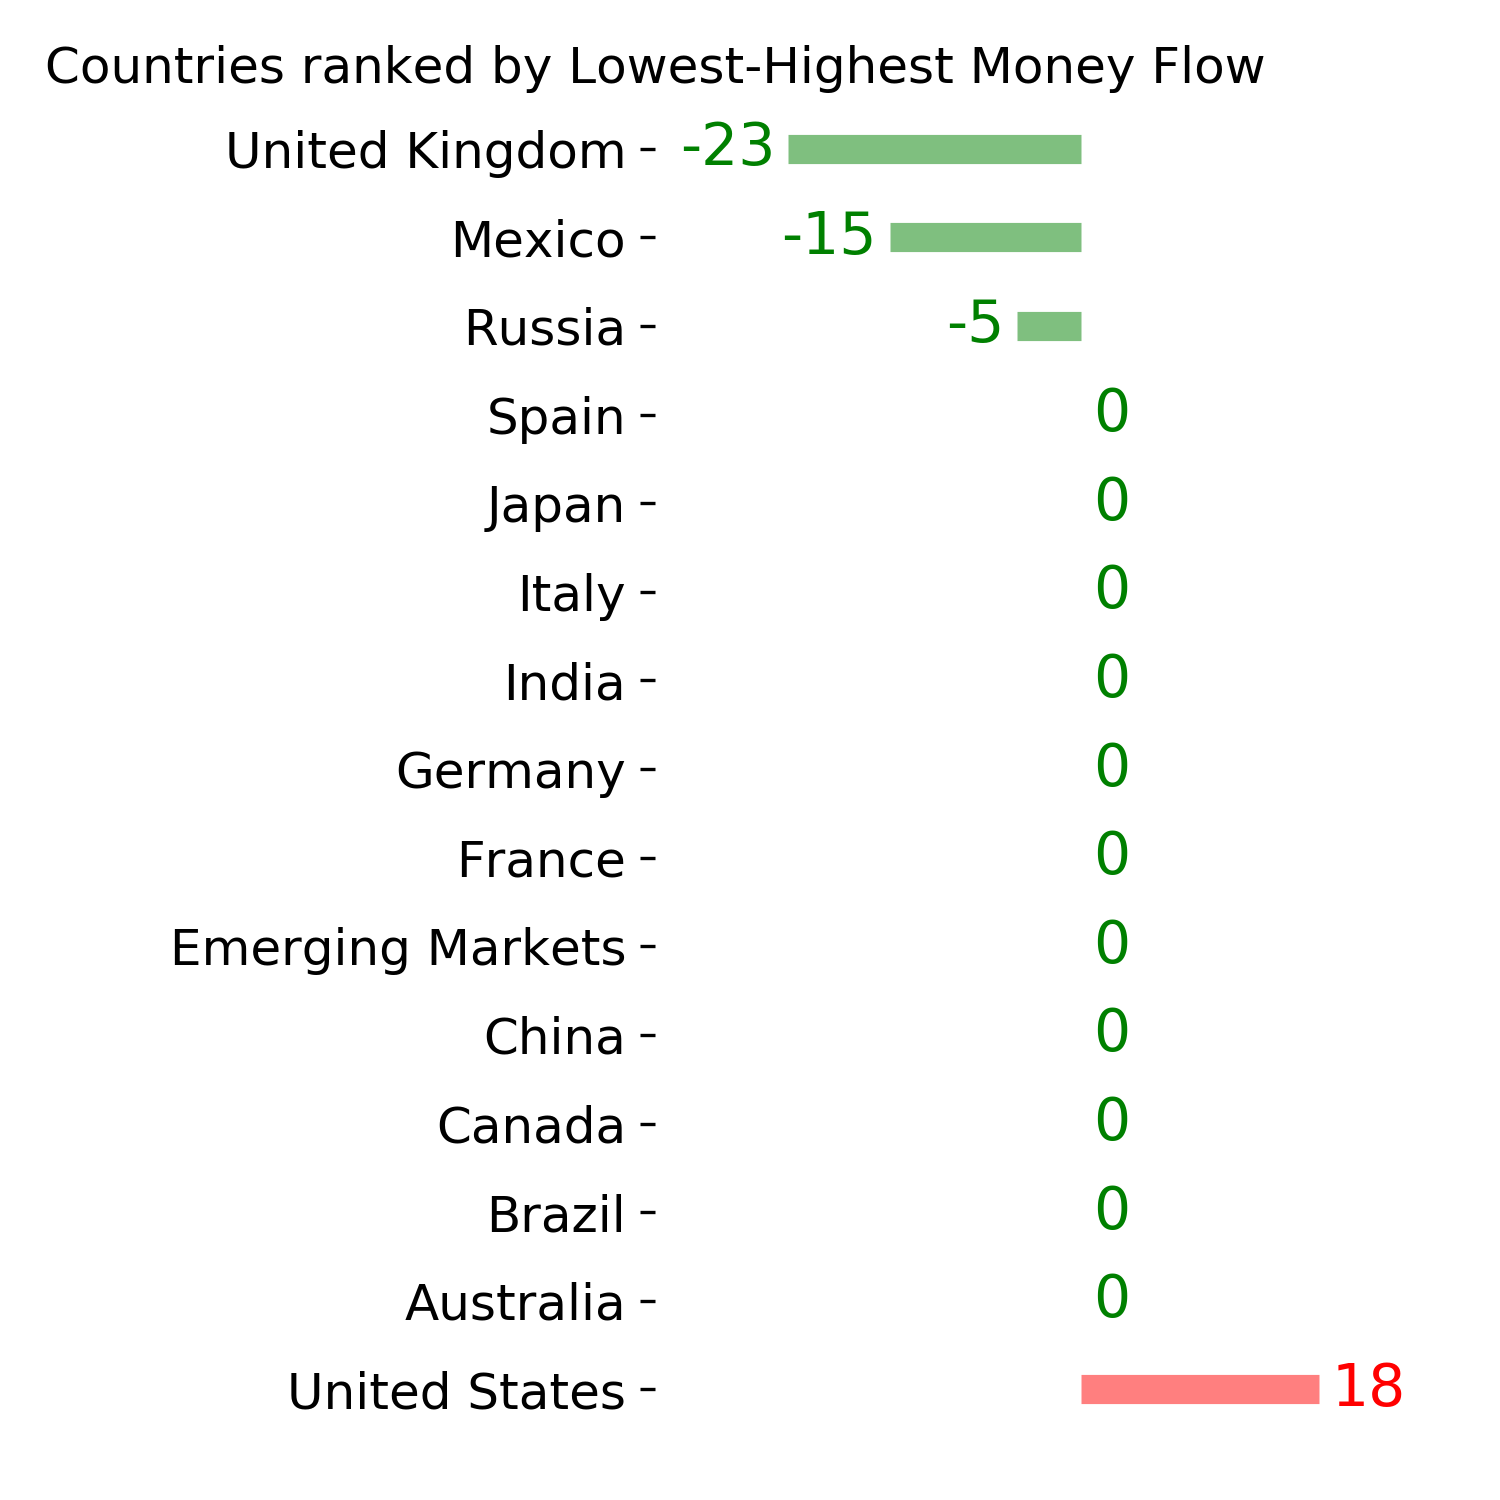
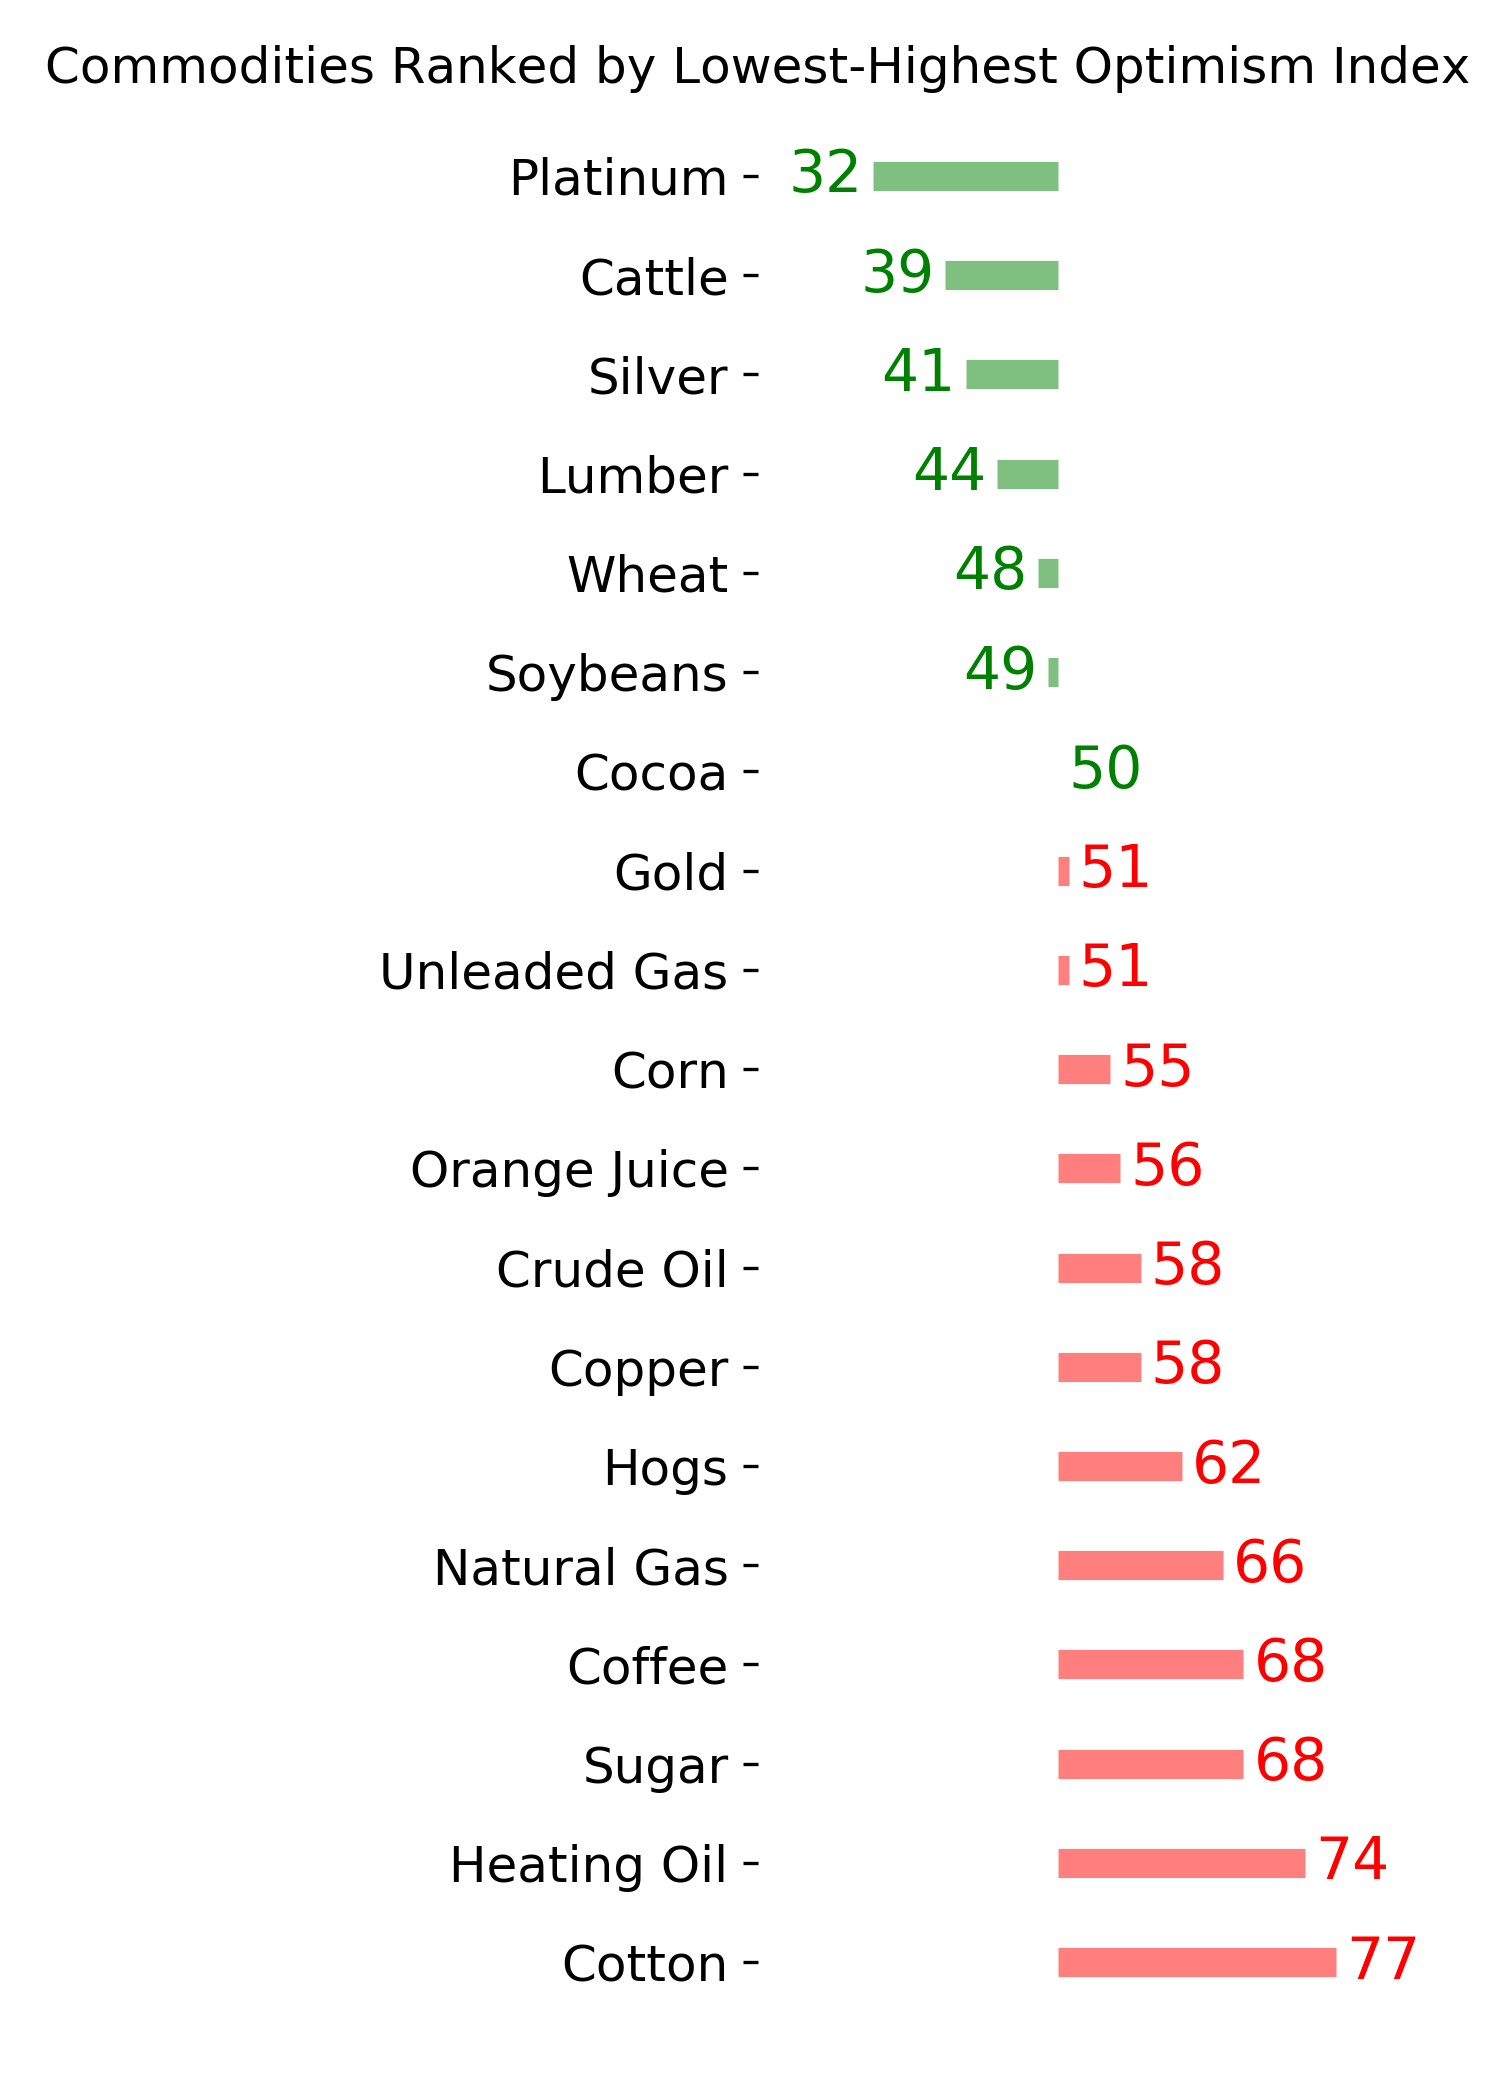
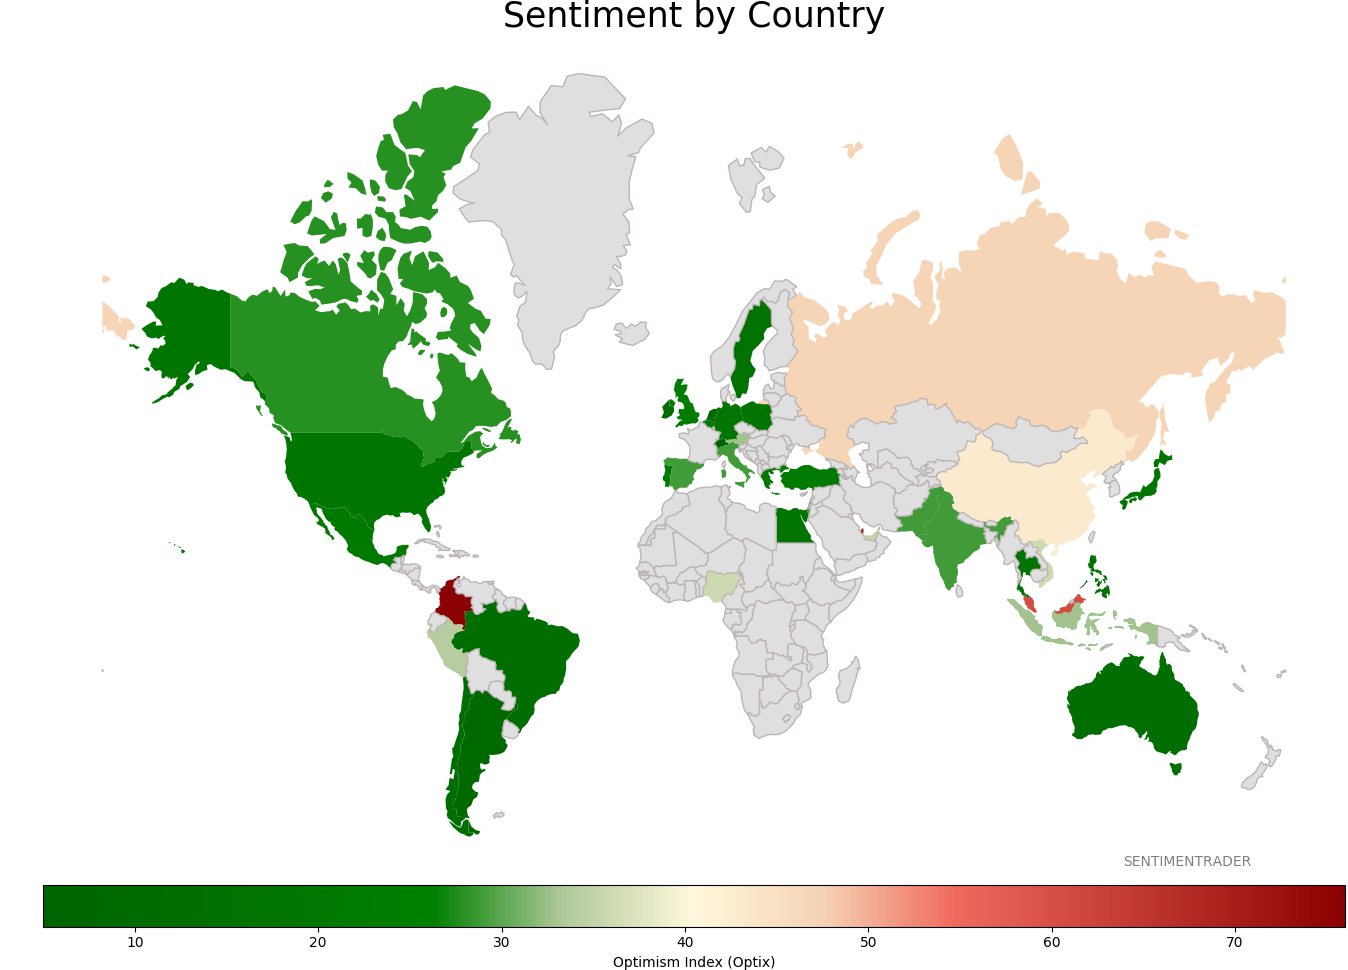
Sentiment Around The World
Optimism Index Thumbnails
|
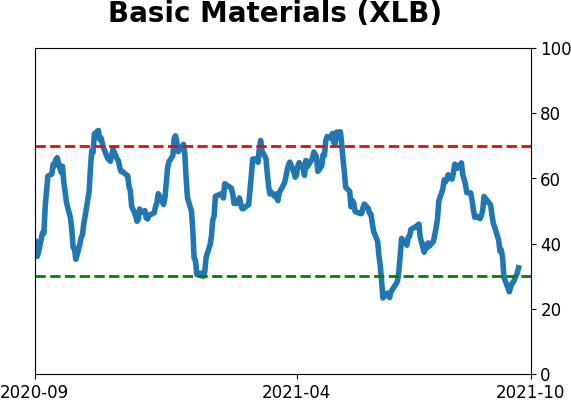
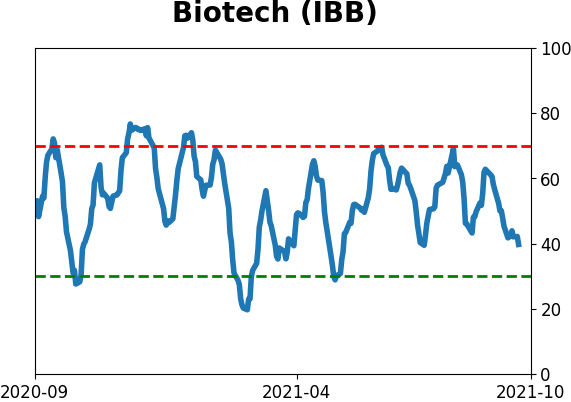
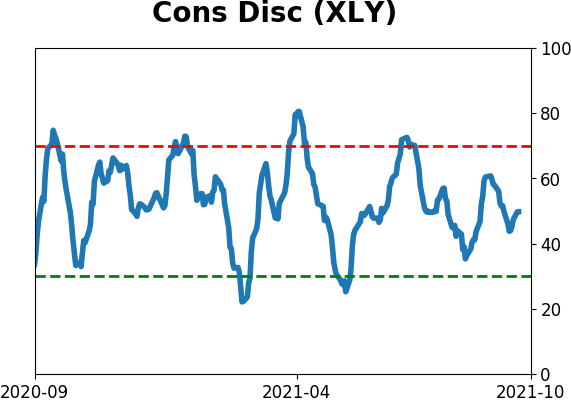
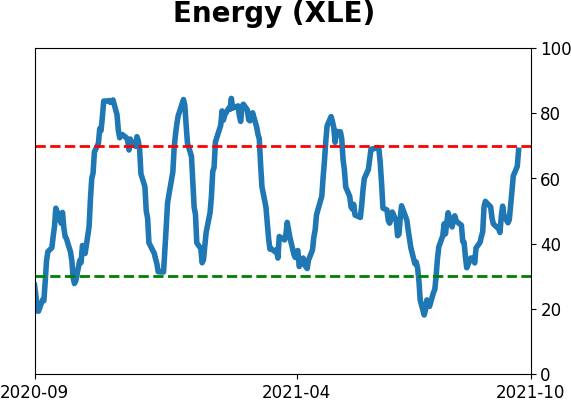
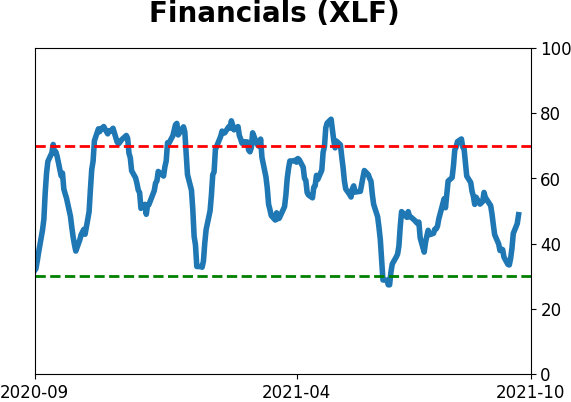
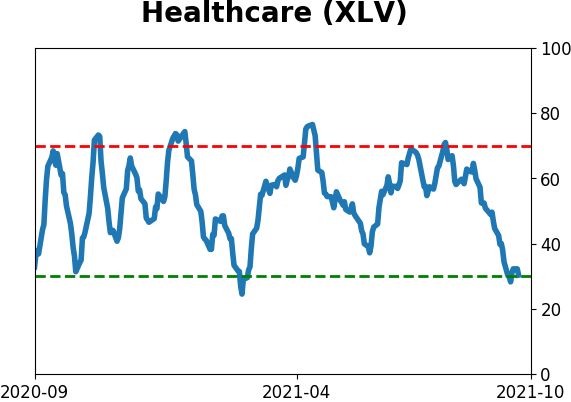
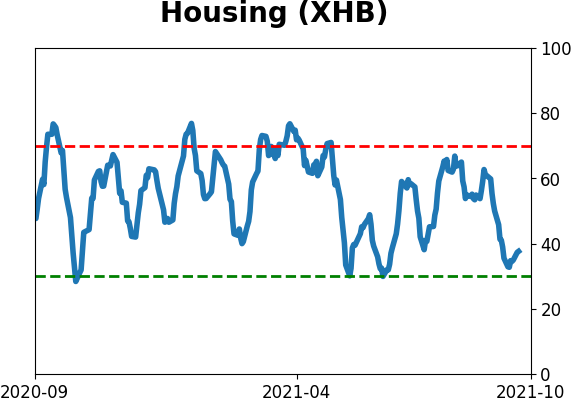
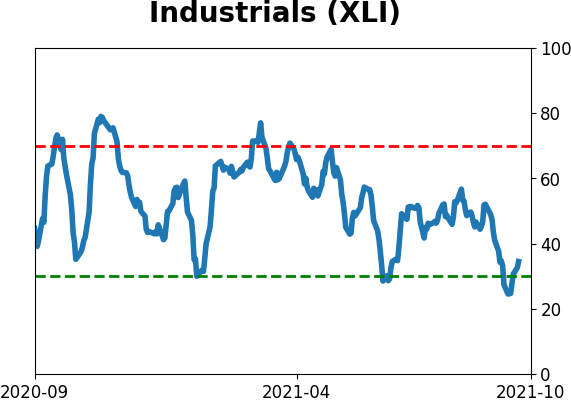
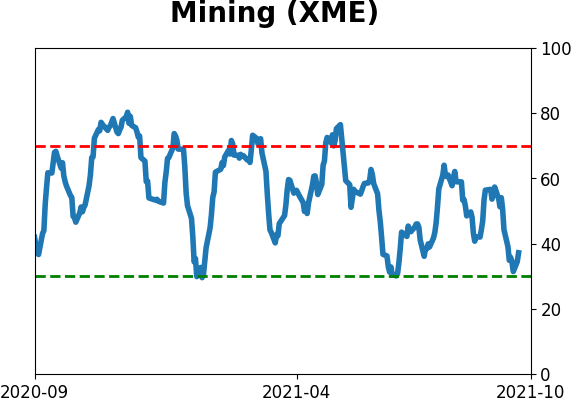
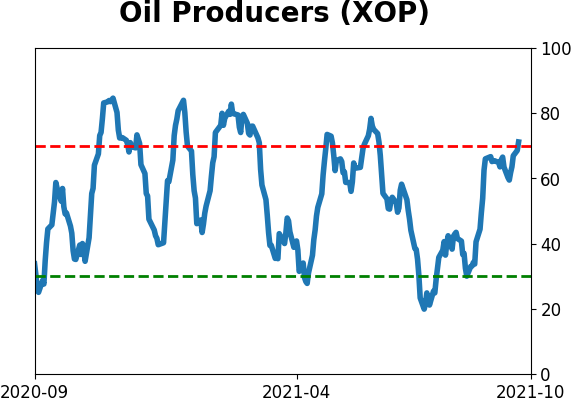
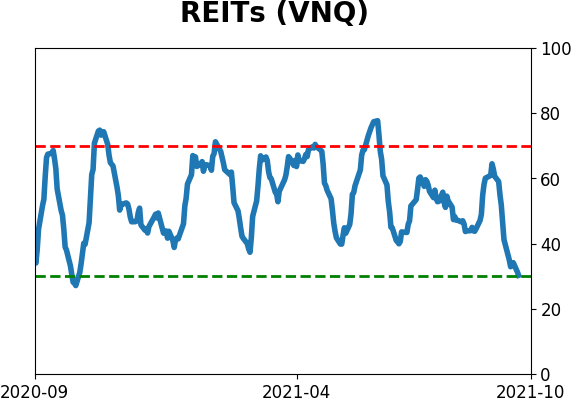
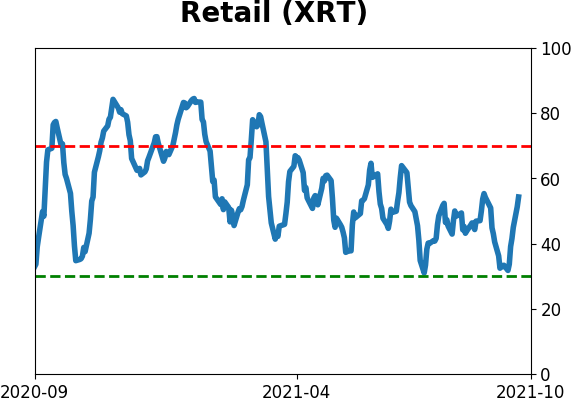
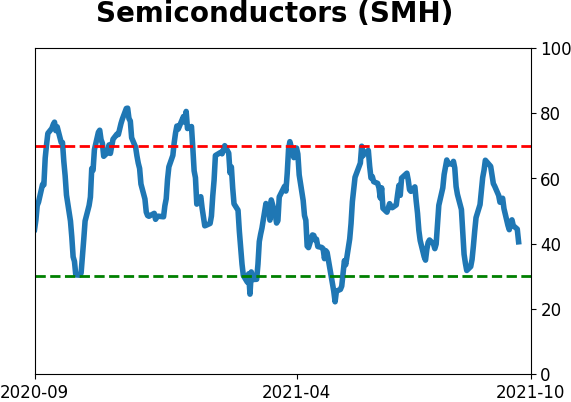
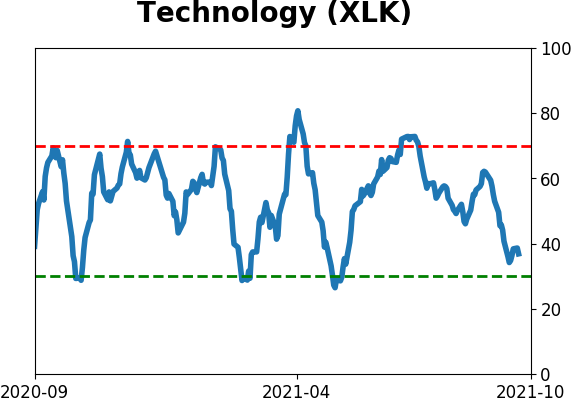
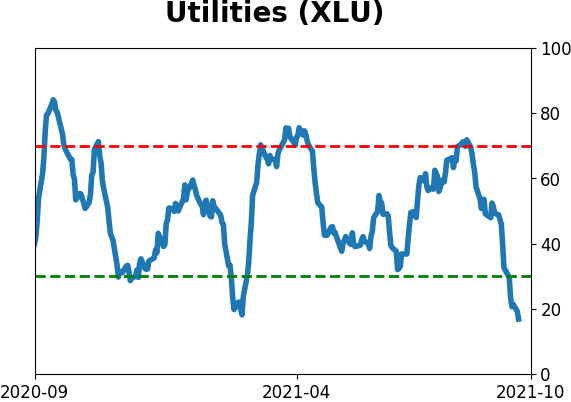
Sector ETF's - 10-Day Moving Average
|
|
|
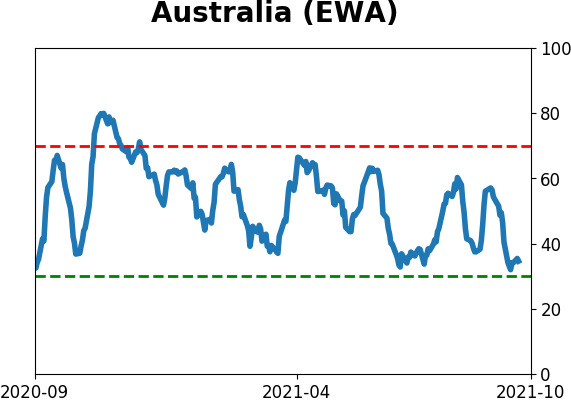
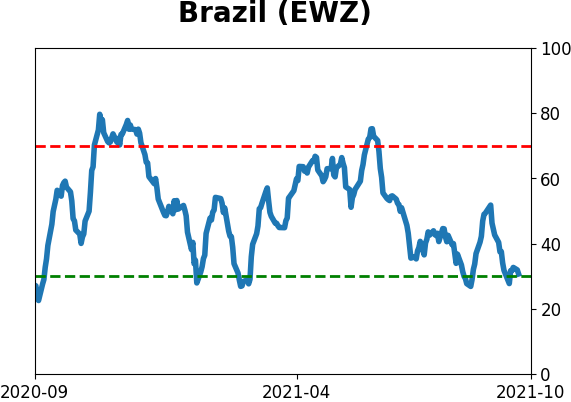
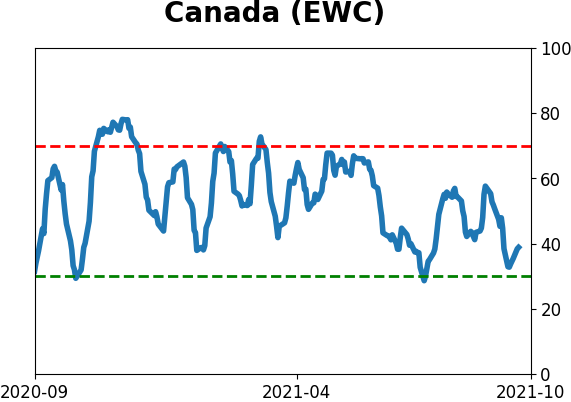
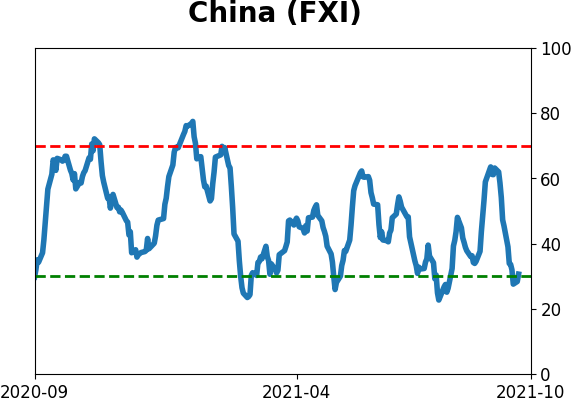
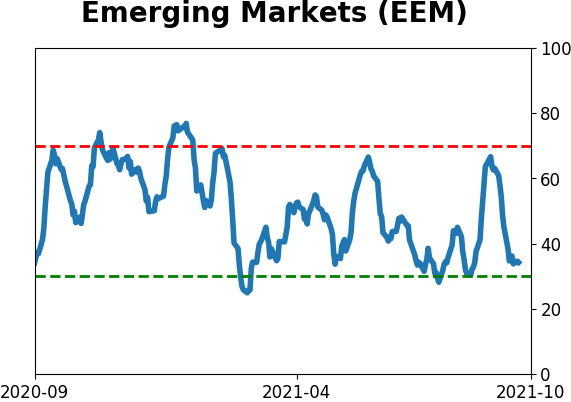
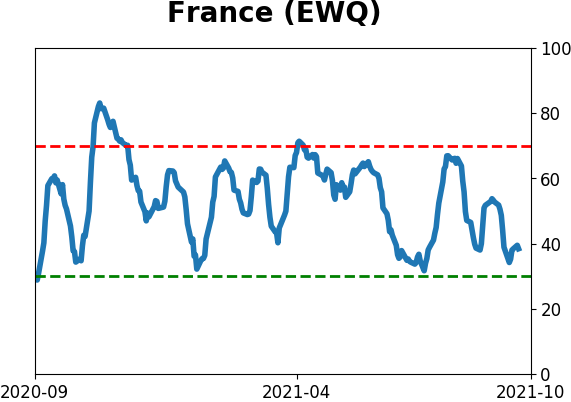
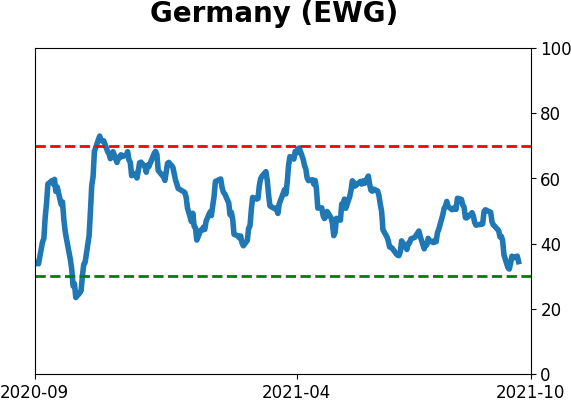
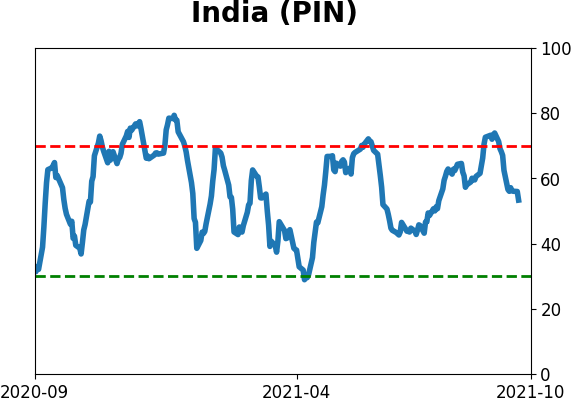
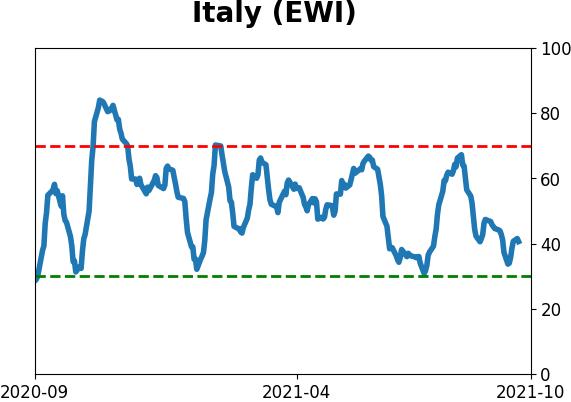
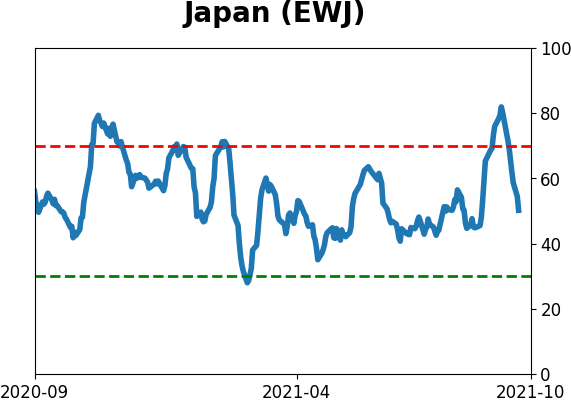
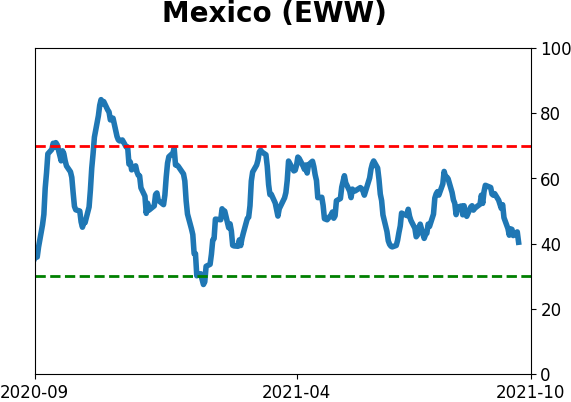
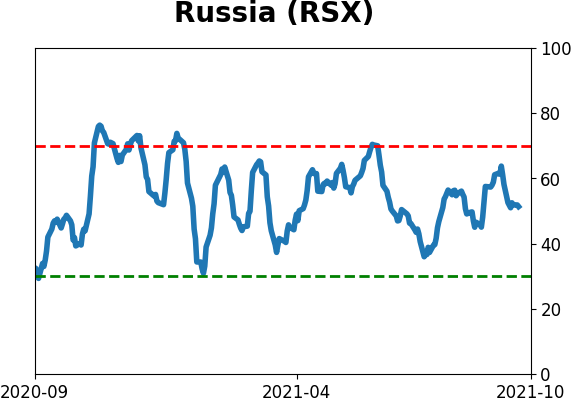
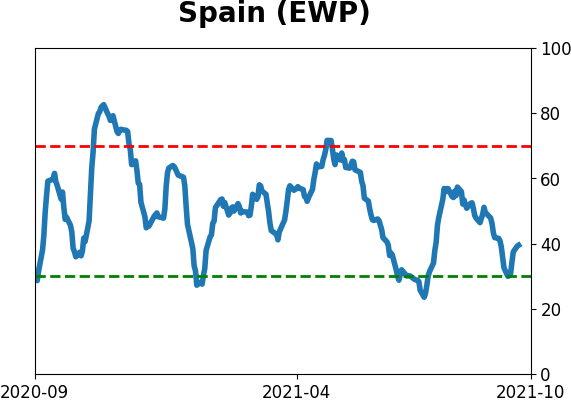
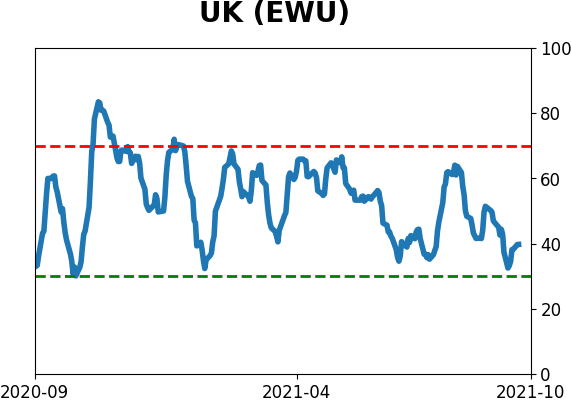
Country ETF's - 10-Day Moving Average
|
|
|
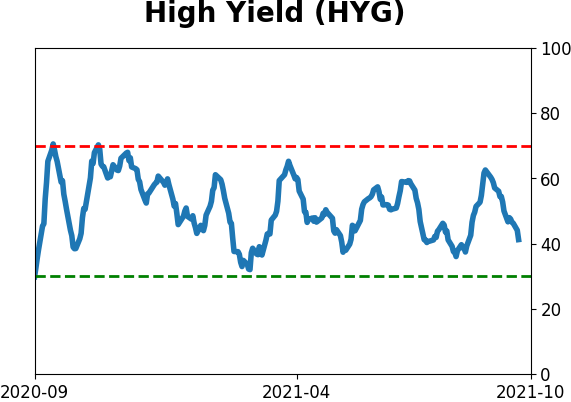
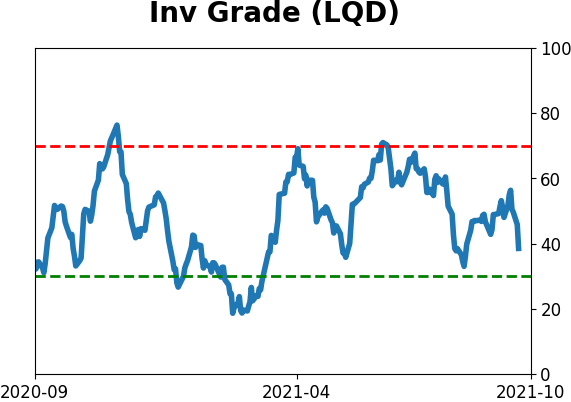
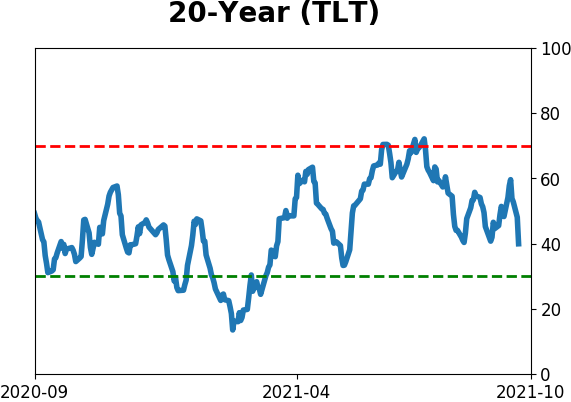
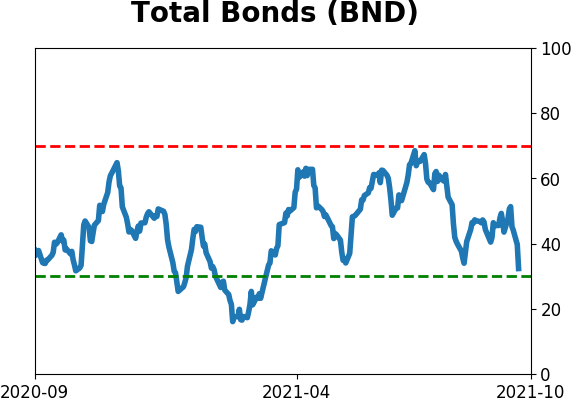
Bond ETF's - 10-Day Moving Average
|
|
|
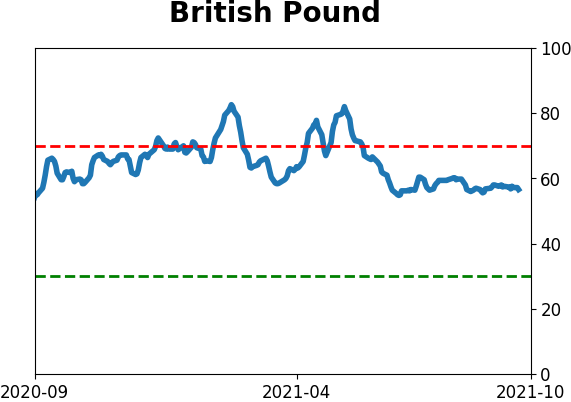
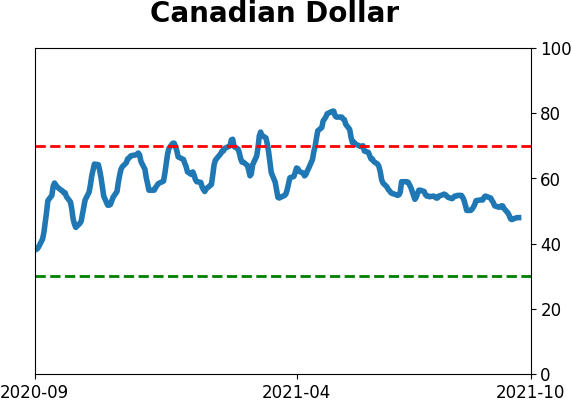
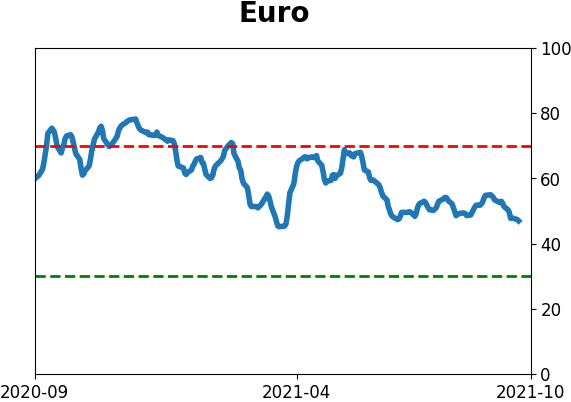
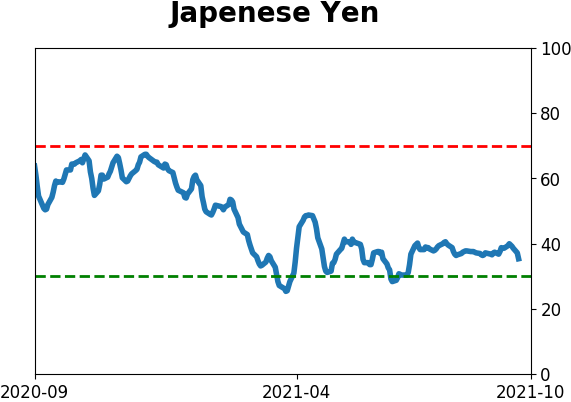
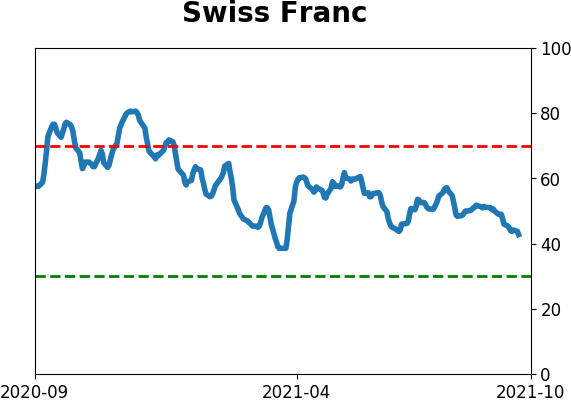
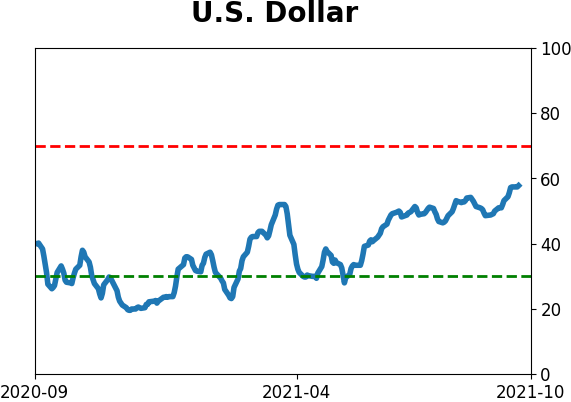
Currency ETF's - 5-Day Moving Average
|
|
|
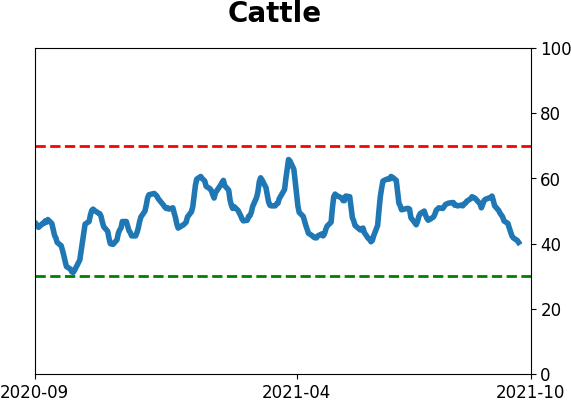
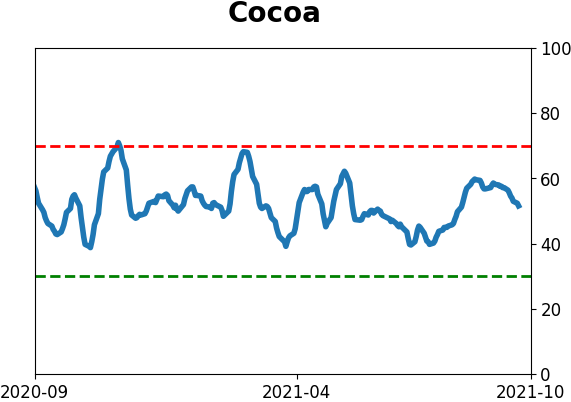
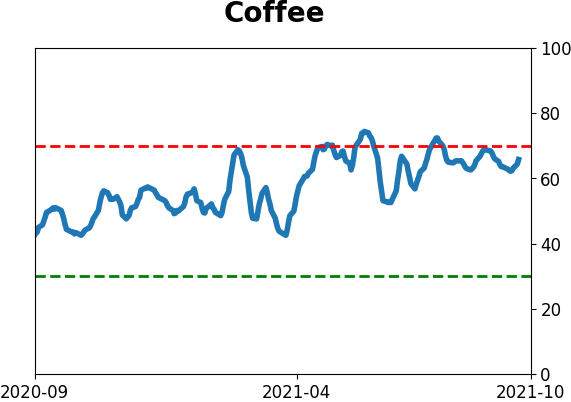
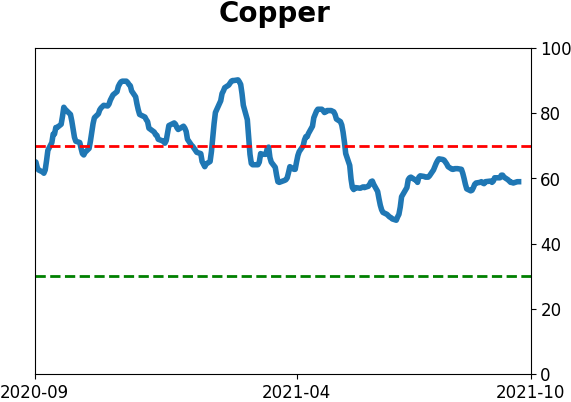
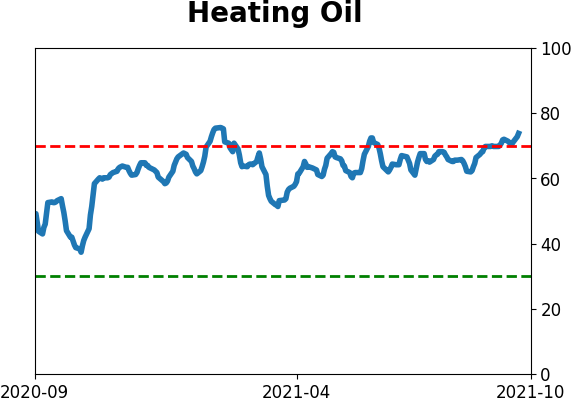
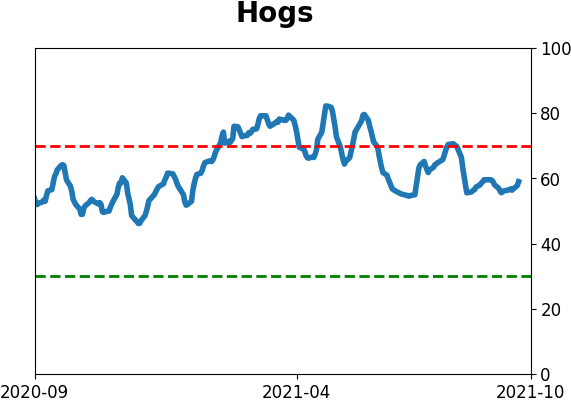
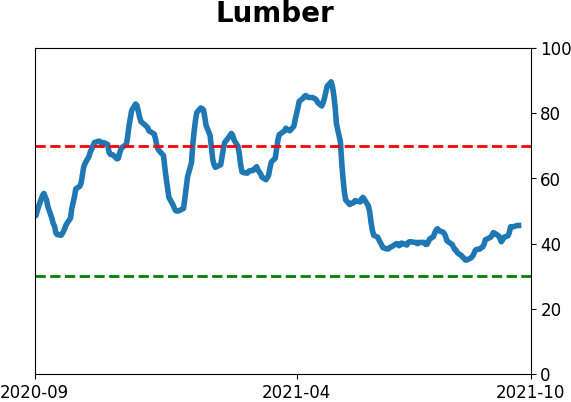
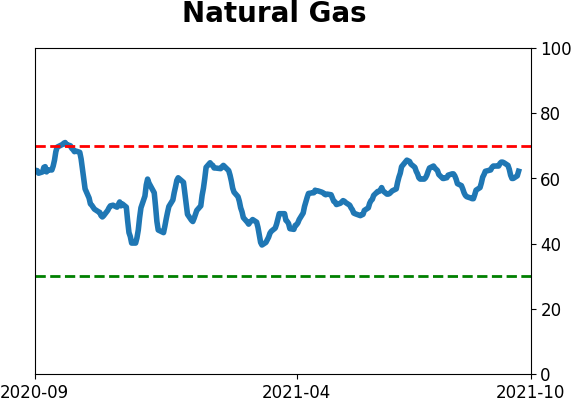
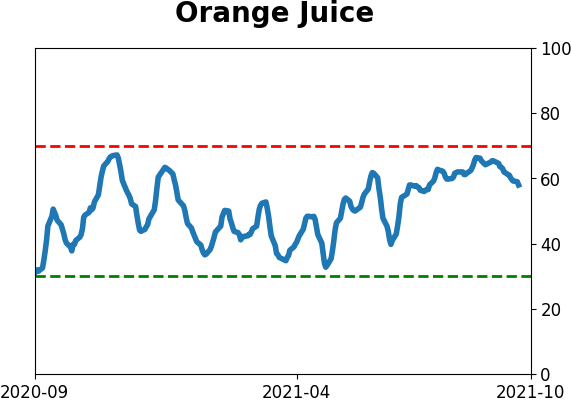
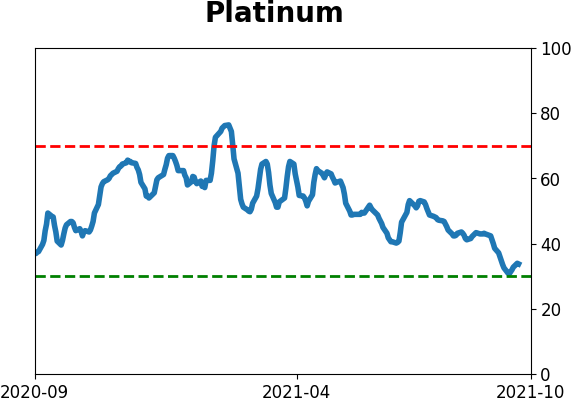
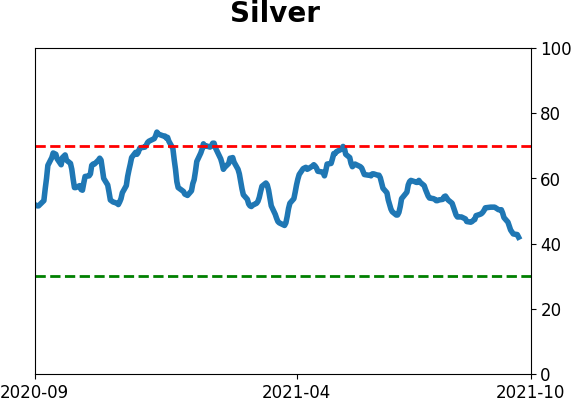
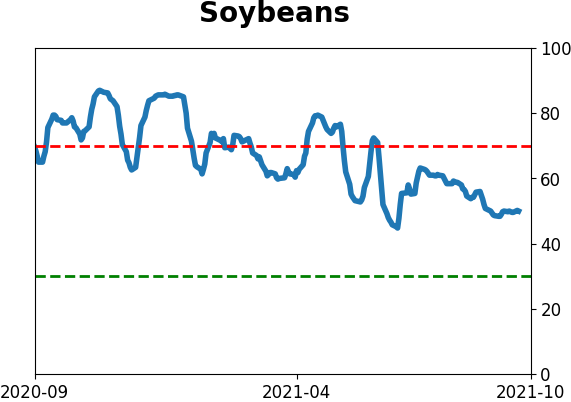
Commodity ETF's - 5-Day Moving Average
|
|