Headlines
|
|
It's getting harder to find soft economic surprises:
Economists have been underestimating how optimistic consumers and executives have been about the economy. At the same time, surprises in "hard" data haven't kept up, so the spread is narrowing and about to flip positive for the first time in six months.
|
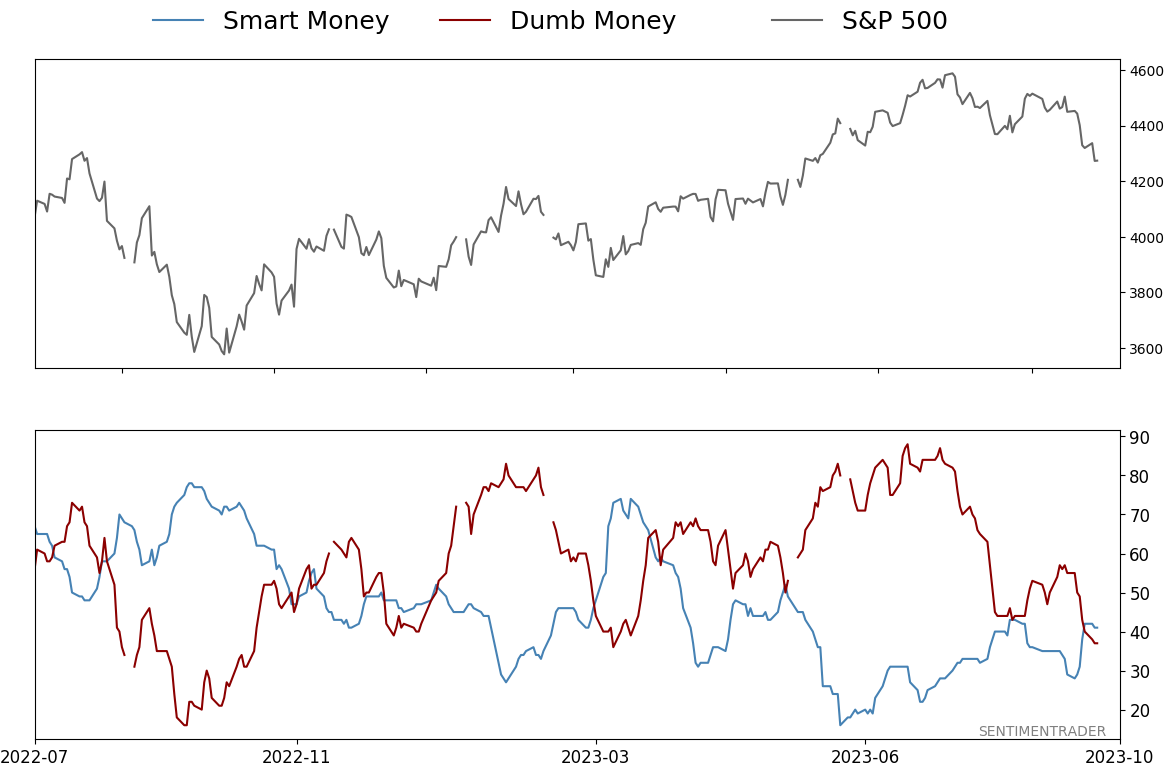
Smart / Dumb Money Confidence
|
Smart Money Confidence: 41%
Dumb Money Confidence: 37%
|
|
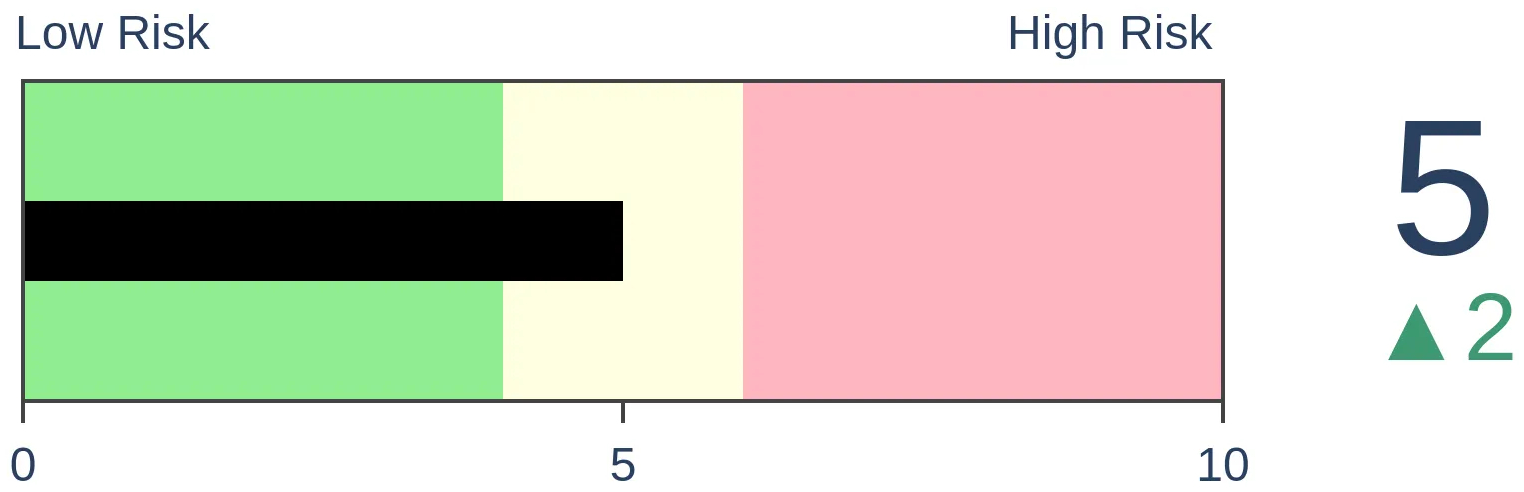
Risk Levels
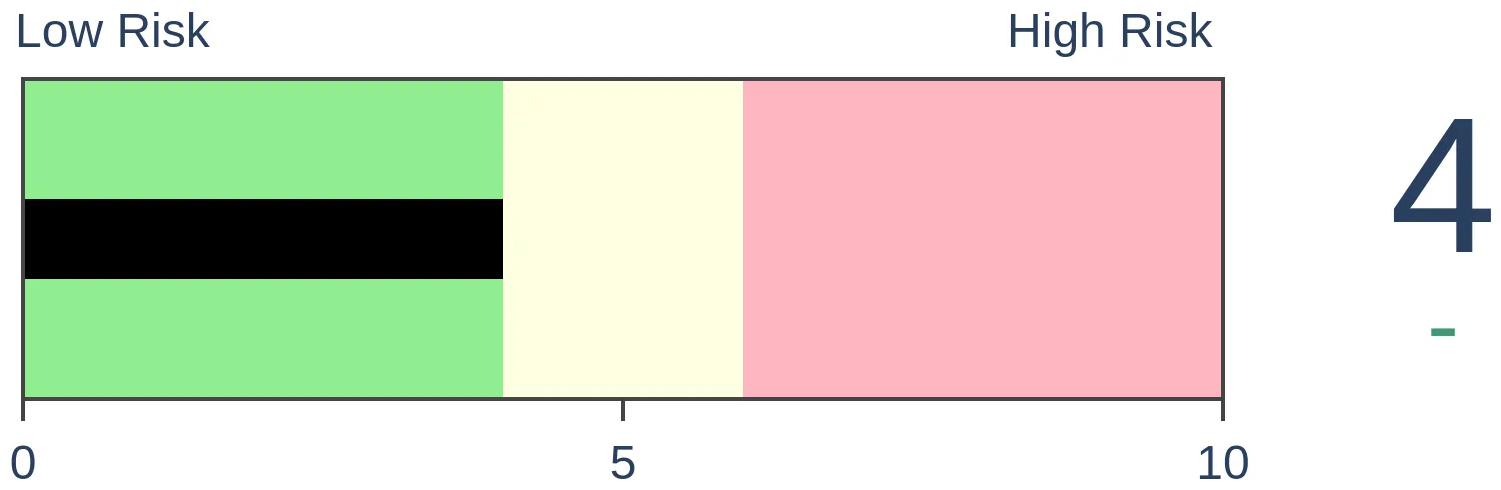
Stocks Short-Term
|
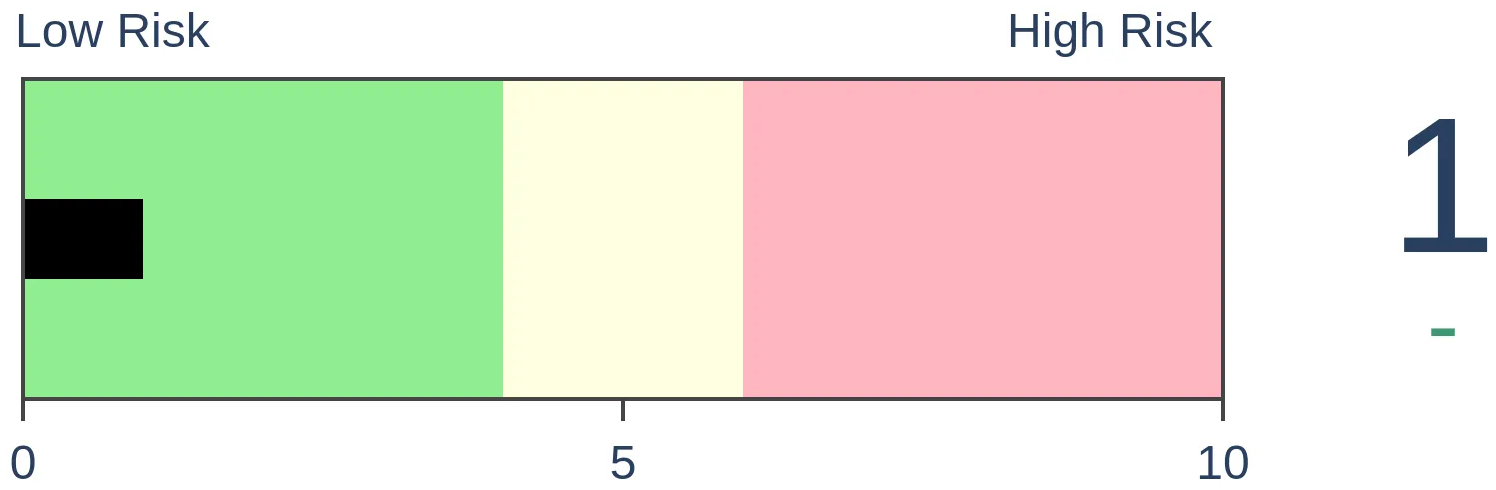
Stocks Medium-Term
|
|
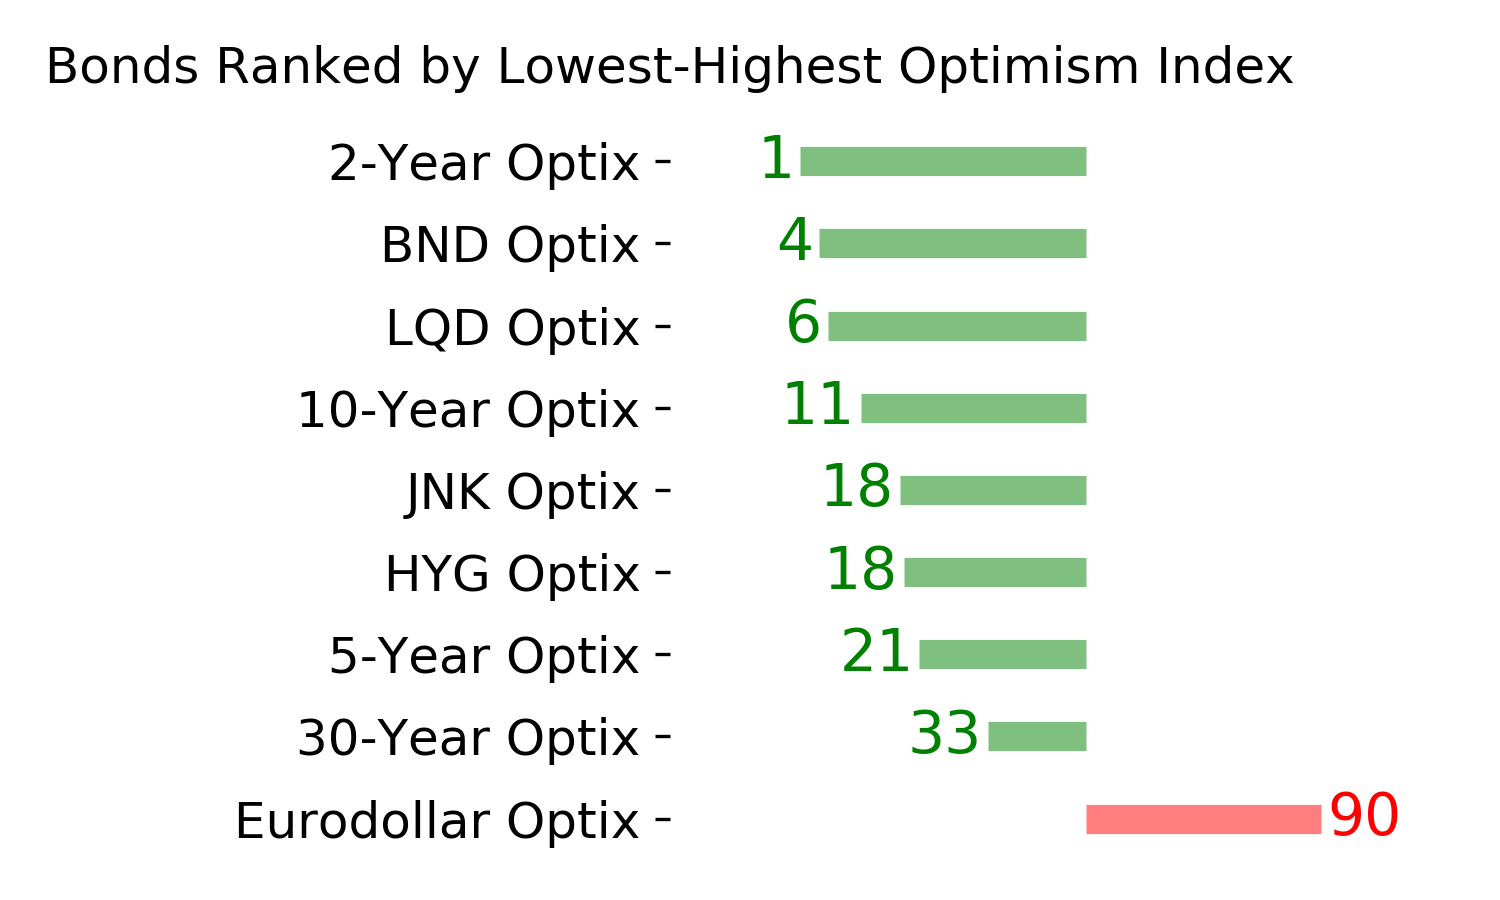
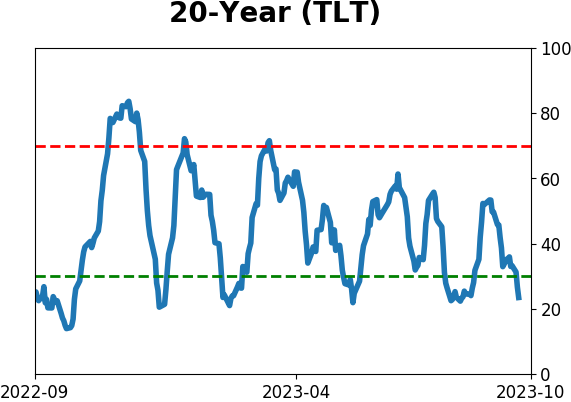
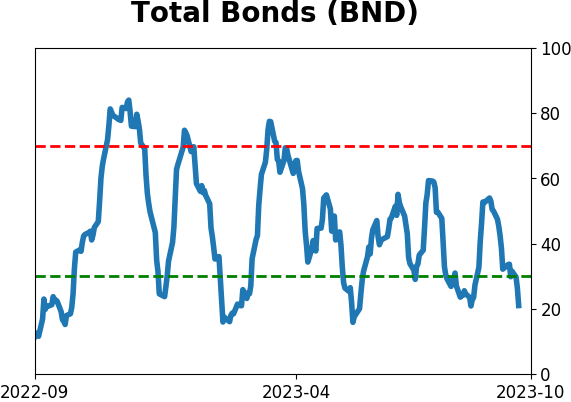
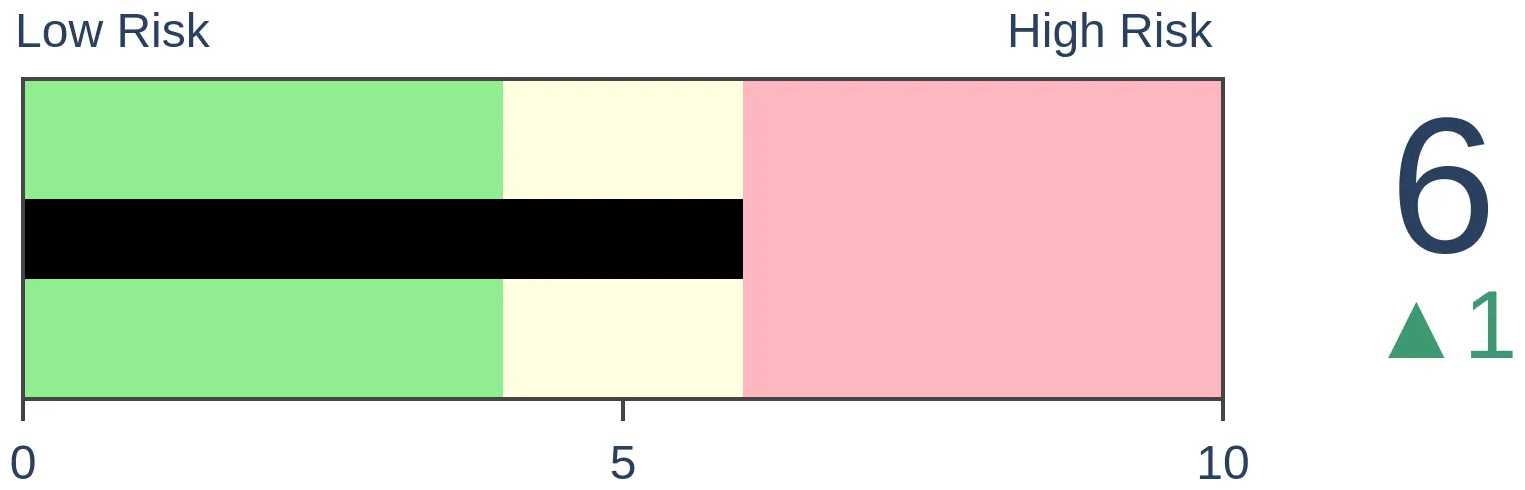
Bonds
|
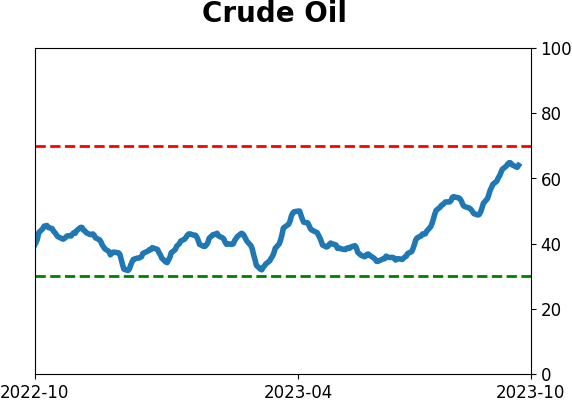
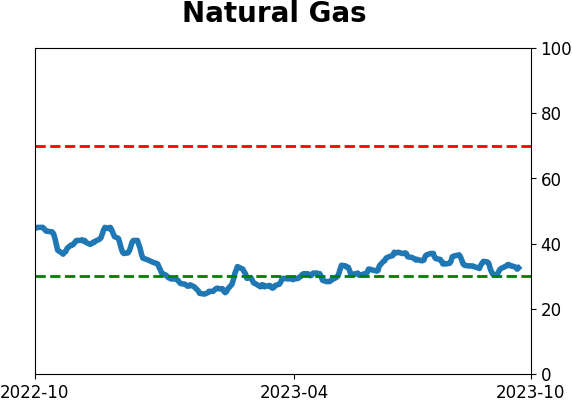
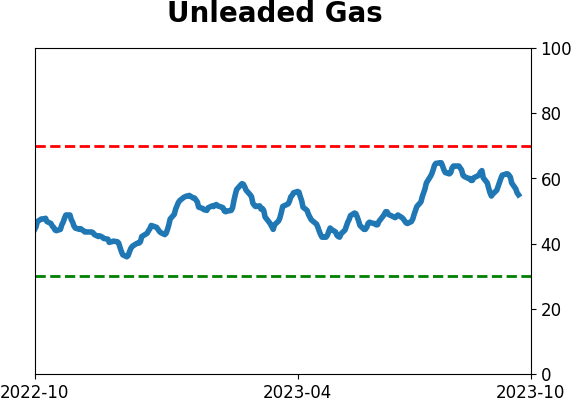
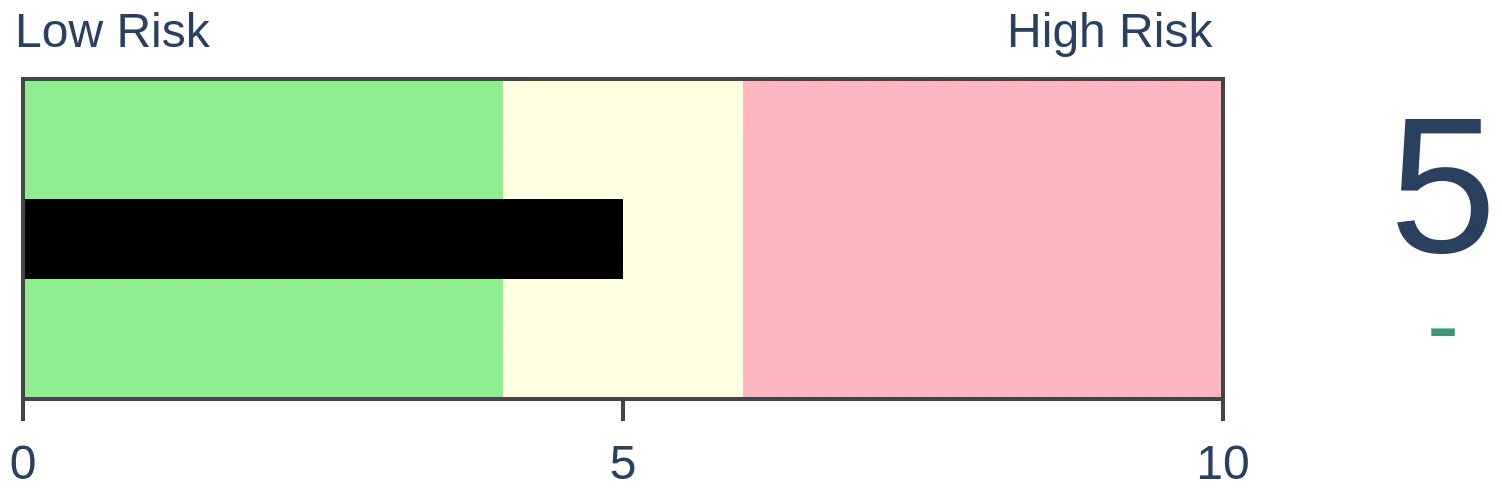
Crude Oil
|
|
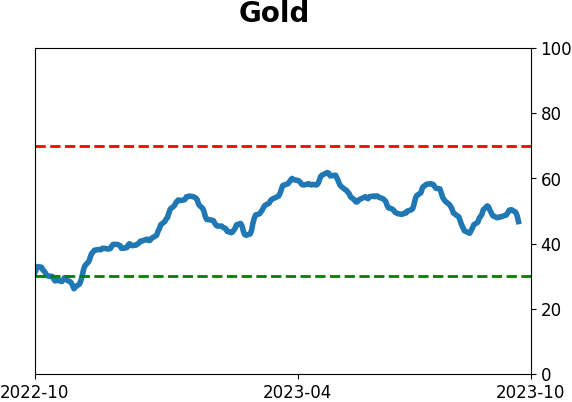
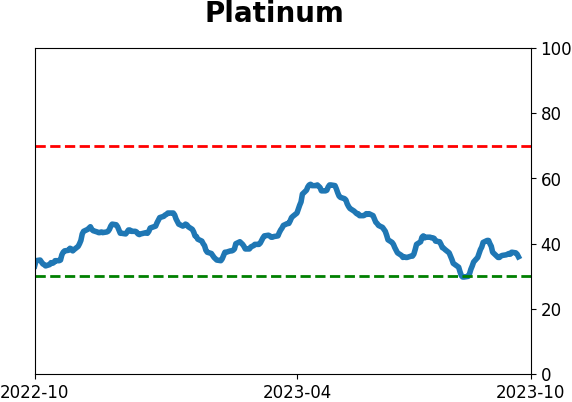
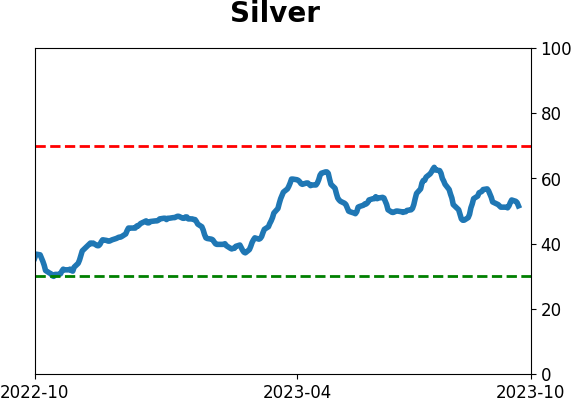
Gold

|
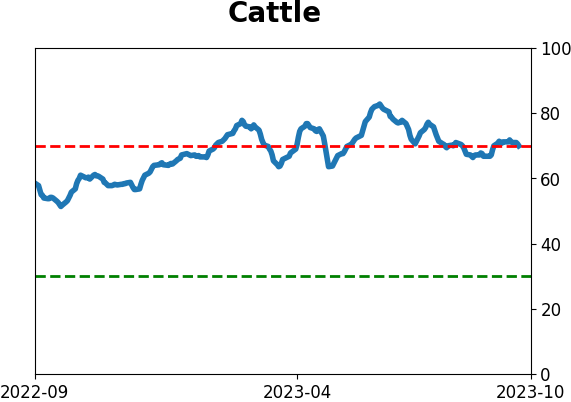
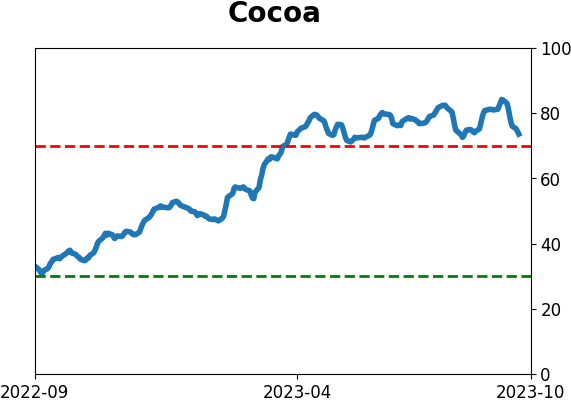
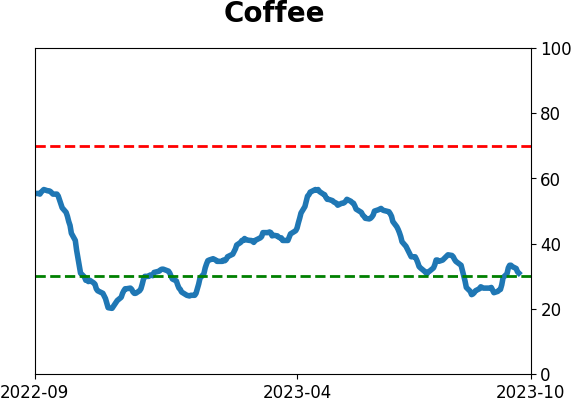
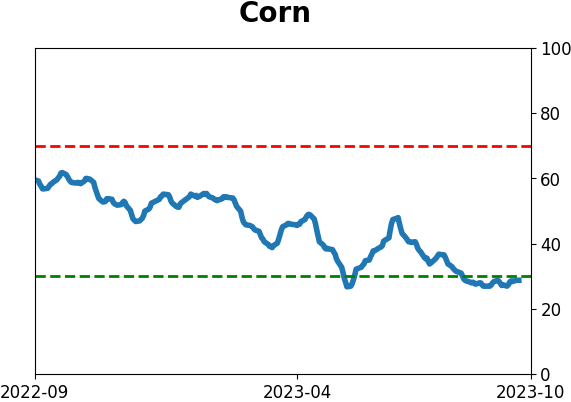
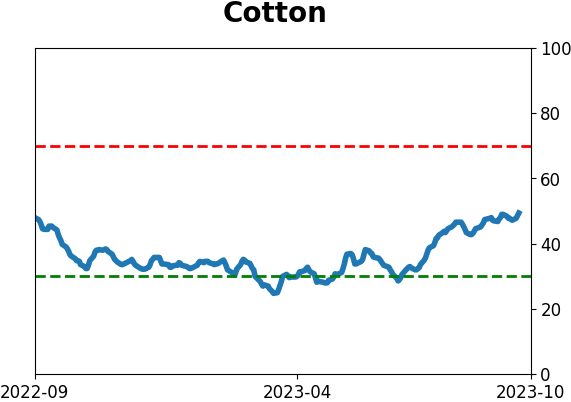
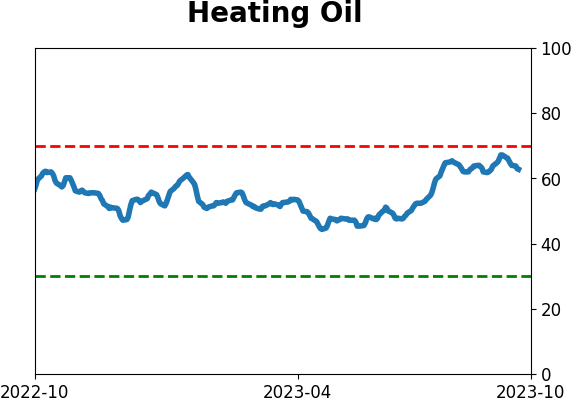
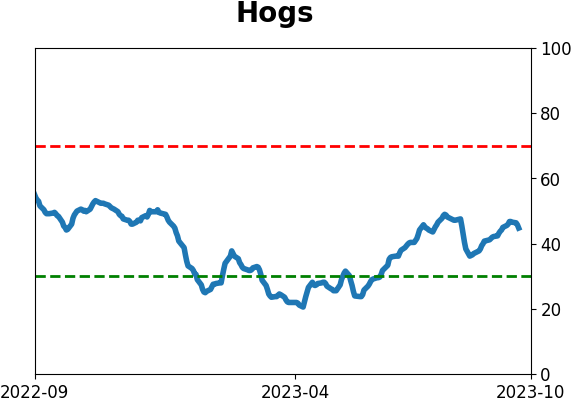
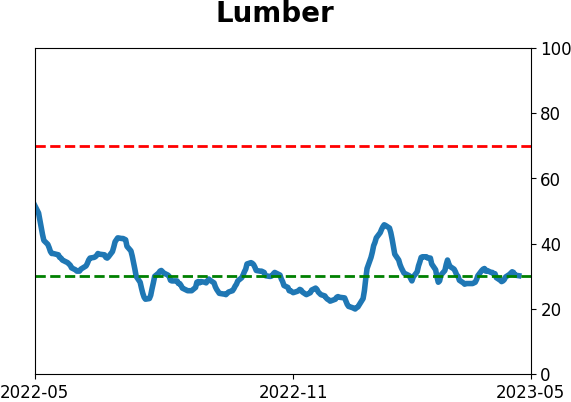
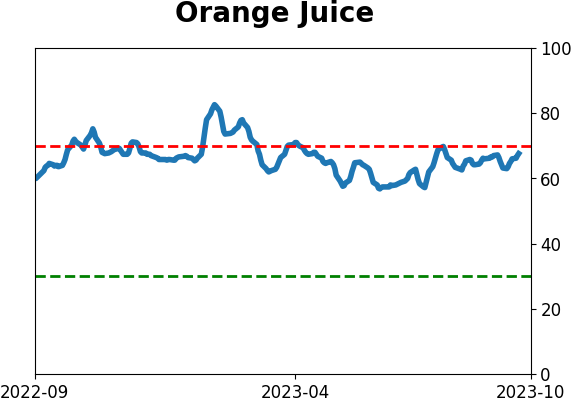
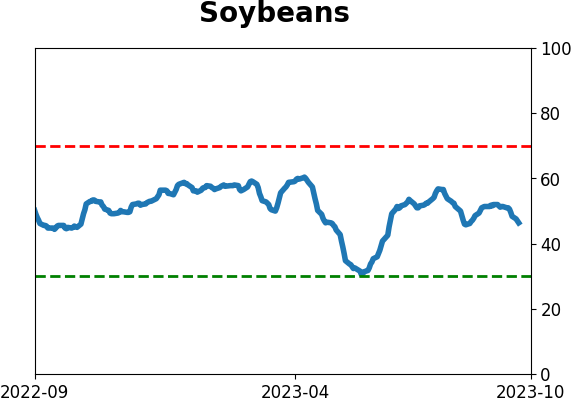
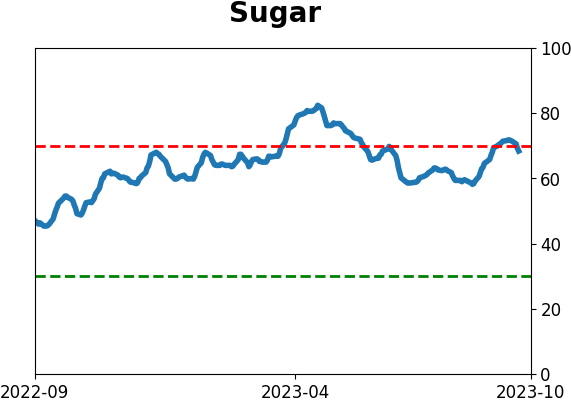
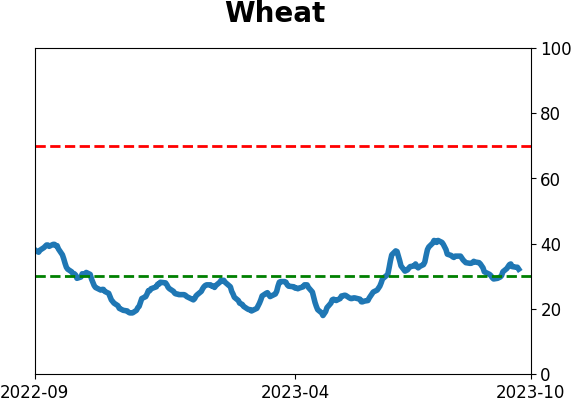
Agriculture
|
|
Research
By Jason Goepfert
BOTTOM LINE
Economists have been underestimating how optimistic consumers and executives have been about the economy. At the same time, surprises in "hard" data haven't kept up, so the spread is narrowing and about to flip positive for the first time in six months.
FORECAST / TIMEFRAME
None
|
Key points:
- Consumers are saying they're more optimistic than economists have been estimating
- Those "soft" surprises are starting to outpace surprises in "hard" data for the first time in six months
- When long streaks like this end, high beta sectors have struggled for a while
Consumer sentiment is perking up, and economists can't catch up
Consumers and business executives are starting to feel more optimistic. After a historic period of being more pessimistic than even economists could guess, sentiment is rebounding.
Bloomberg calculates a measure that looks at "soft" economic releases like surveys of U.S. consumers and manufacturing executives and also "hard" releases like retail sales, jobless claims, and home sales.
During 2022, economists kept missing just how despondent the surveys would become. The surveys would consistently show that consumers and executives were more pessimistic than economists would estimate. They were also a lot more pessimistic than hard data would justify. As a result, the difference between surprises on soft releases plunged to a near-record low versus hard releases.
It has stayed in negative territory for more than six months, the 3rd-longest streak in more than two decades. While it hasn't flipped yet, it's about as close as it can be and any day should revert. This suggests that surveys are showing more positive surprises (consumers are more optimistic than economists guessed they were) than hard surveys.
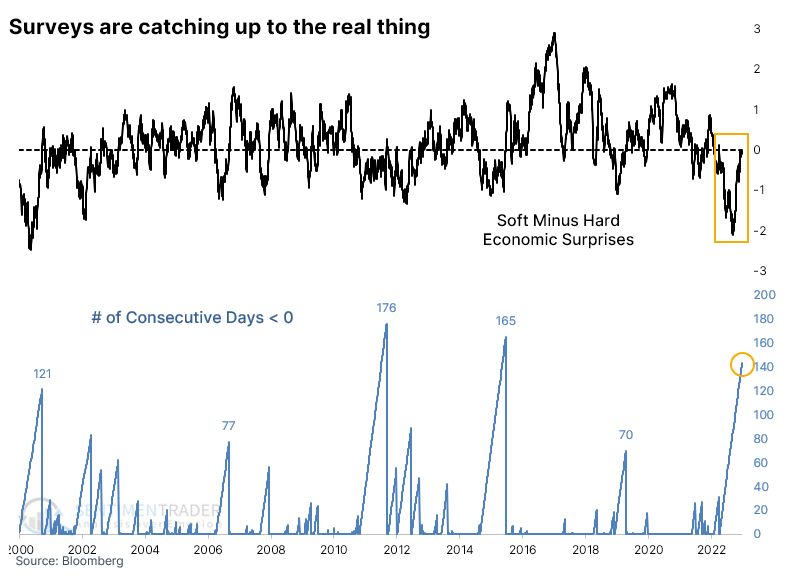
This is not necessarily a good thing. While markets typically react well when investors and consumers are becoming more optimistic, when they consistently exceed economists' expectations, and those surprises are outpacing surprises in hard data, it has preceded some severe declines.
This happened during the 2001 ongoing bear market and even more disastrously, right before peaks in 2007 and 2020. The offset is that it was also triggered before a few sustained rallies following the global financial crisis.
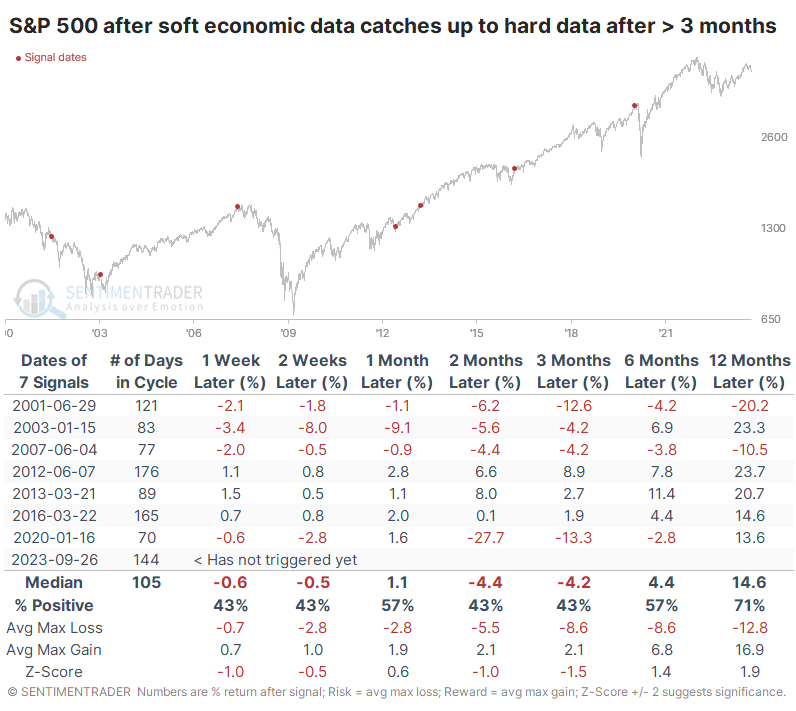
High beta was high-risk for a while before rebounding
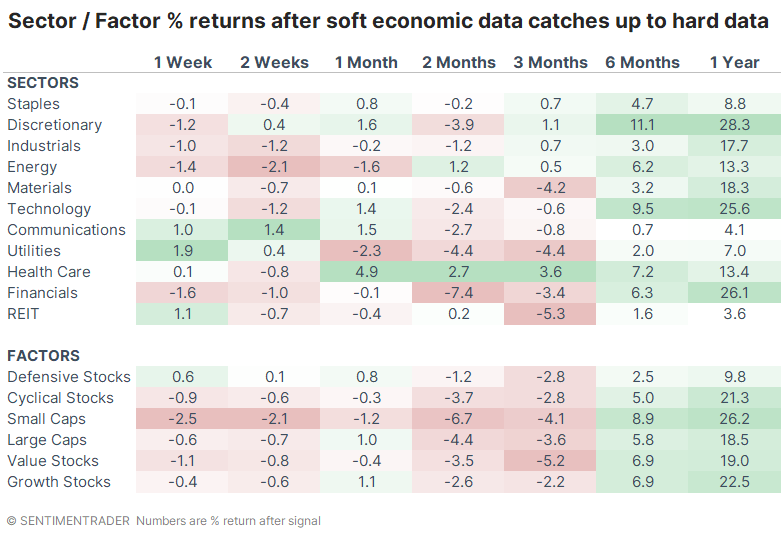
The next few months were not all that great for returns across sectors and factors. Health Care held up quite well, with positive returns six months later after every signal. Small Caps were the most consistently negative, with some of the lowest returns. Because of the timing of the 2001 and 2020 signals, returns were very poor up to three months later, but 6- and 12-month returns were good for some of the higher-beta sectors like Technology, Discretionary, and Small Caps.
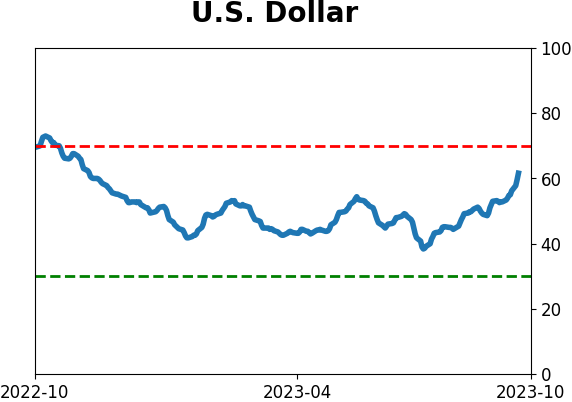
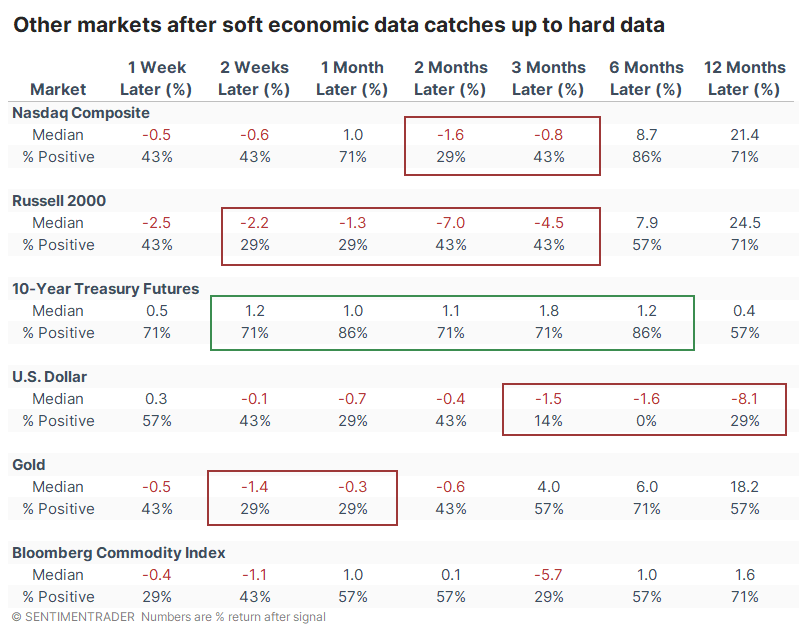
Among other markets, weakness was a common theme. The Nasdaq Composite and Russell 2000 showed poor returns over the medium-term. Gold tended to be weak shorter-term while the dollar was weak longer-term. It sported a negative six-month return after every signal. The sole bullish standout was 10-year Treasury note futures, which rallied over the next one and six months after six of the seven instances.
What the research tells us...
For months following the October low, we couldn't find much that suggested a high likelihood of lower prices. The rally unfolded pretty much in line with historical suggestions, but it has gotten dicier over the past month or so. We're seeing more readings that show a split market, divergences, and weakening momentum.
While those don't necessarily cancel out all the positives, there hasn't been much new that's compelling for bulls. That may change if seasonality continues to play out and we see another week(s) of weakness, generating more compelling readings of pessimism. Based on the improvement in consumer sentiment relative to expectations, further short-term weakness would be more the norm than the exception.
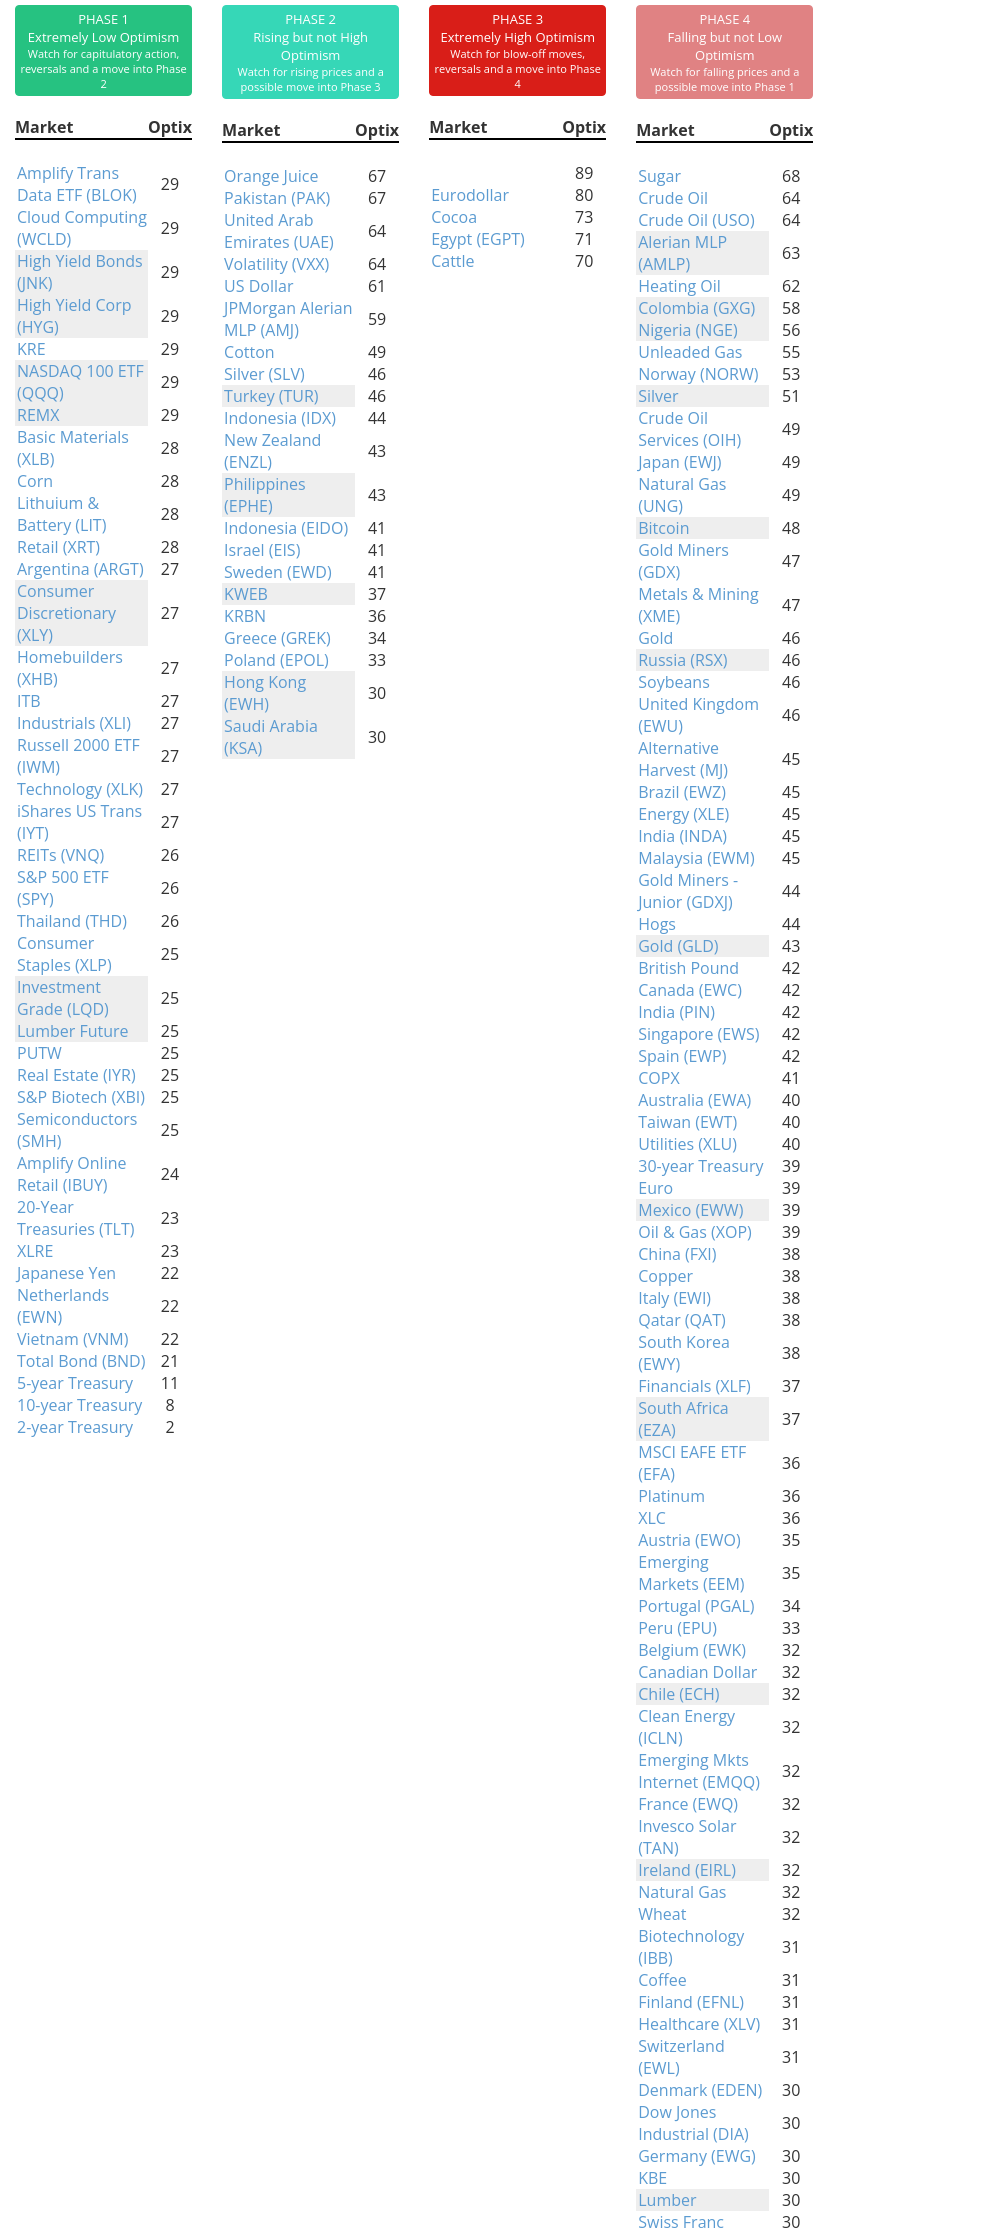
Indicators at Extremes
Phase Table
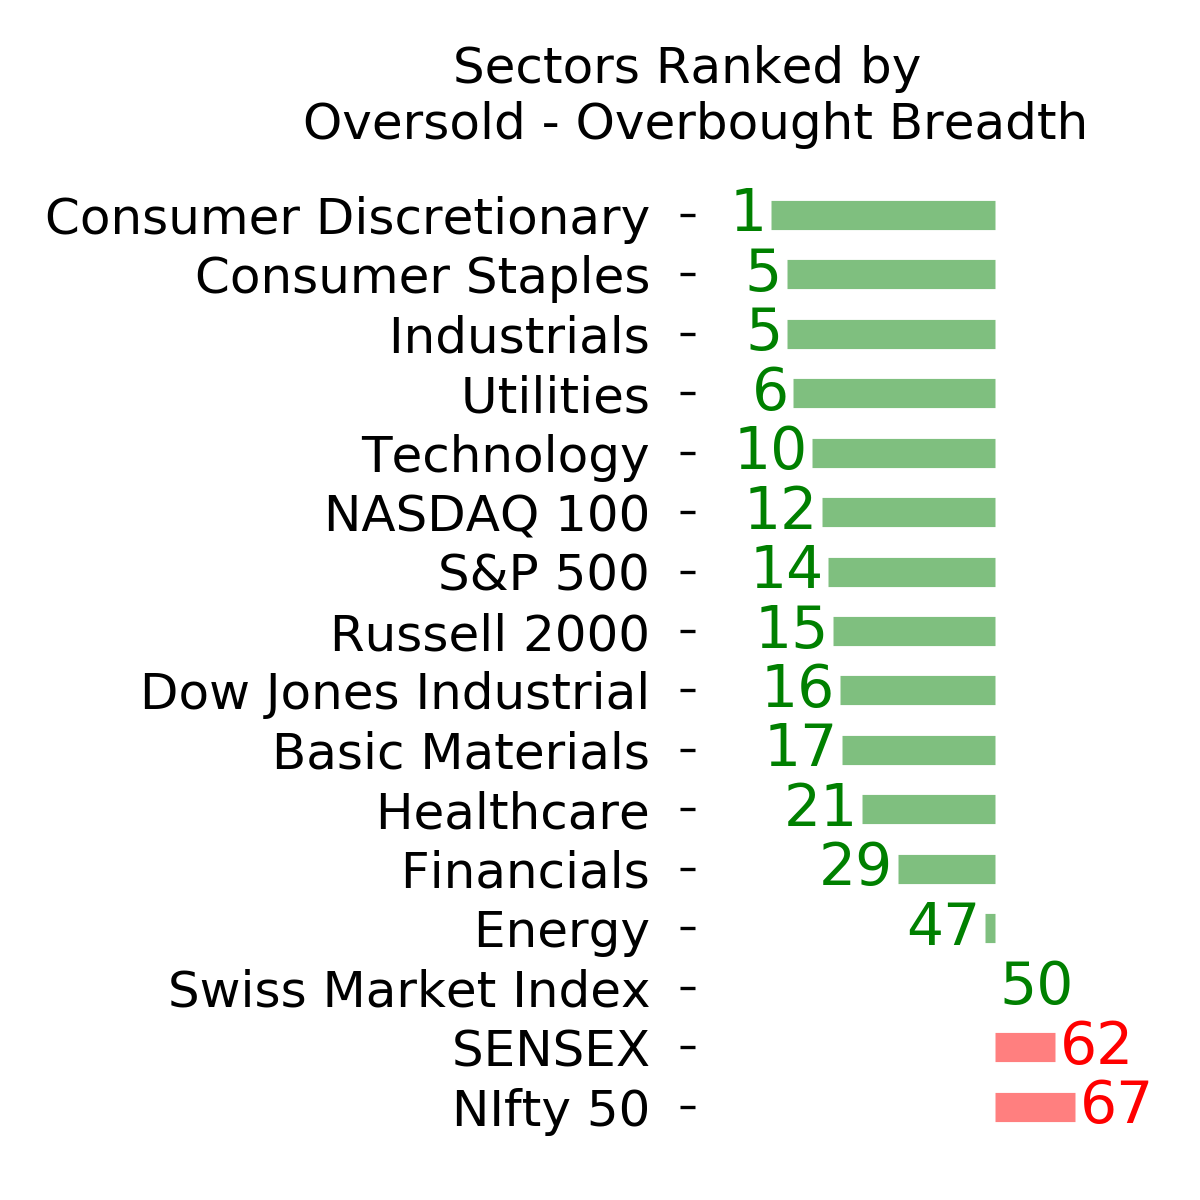
Ranks
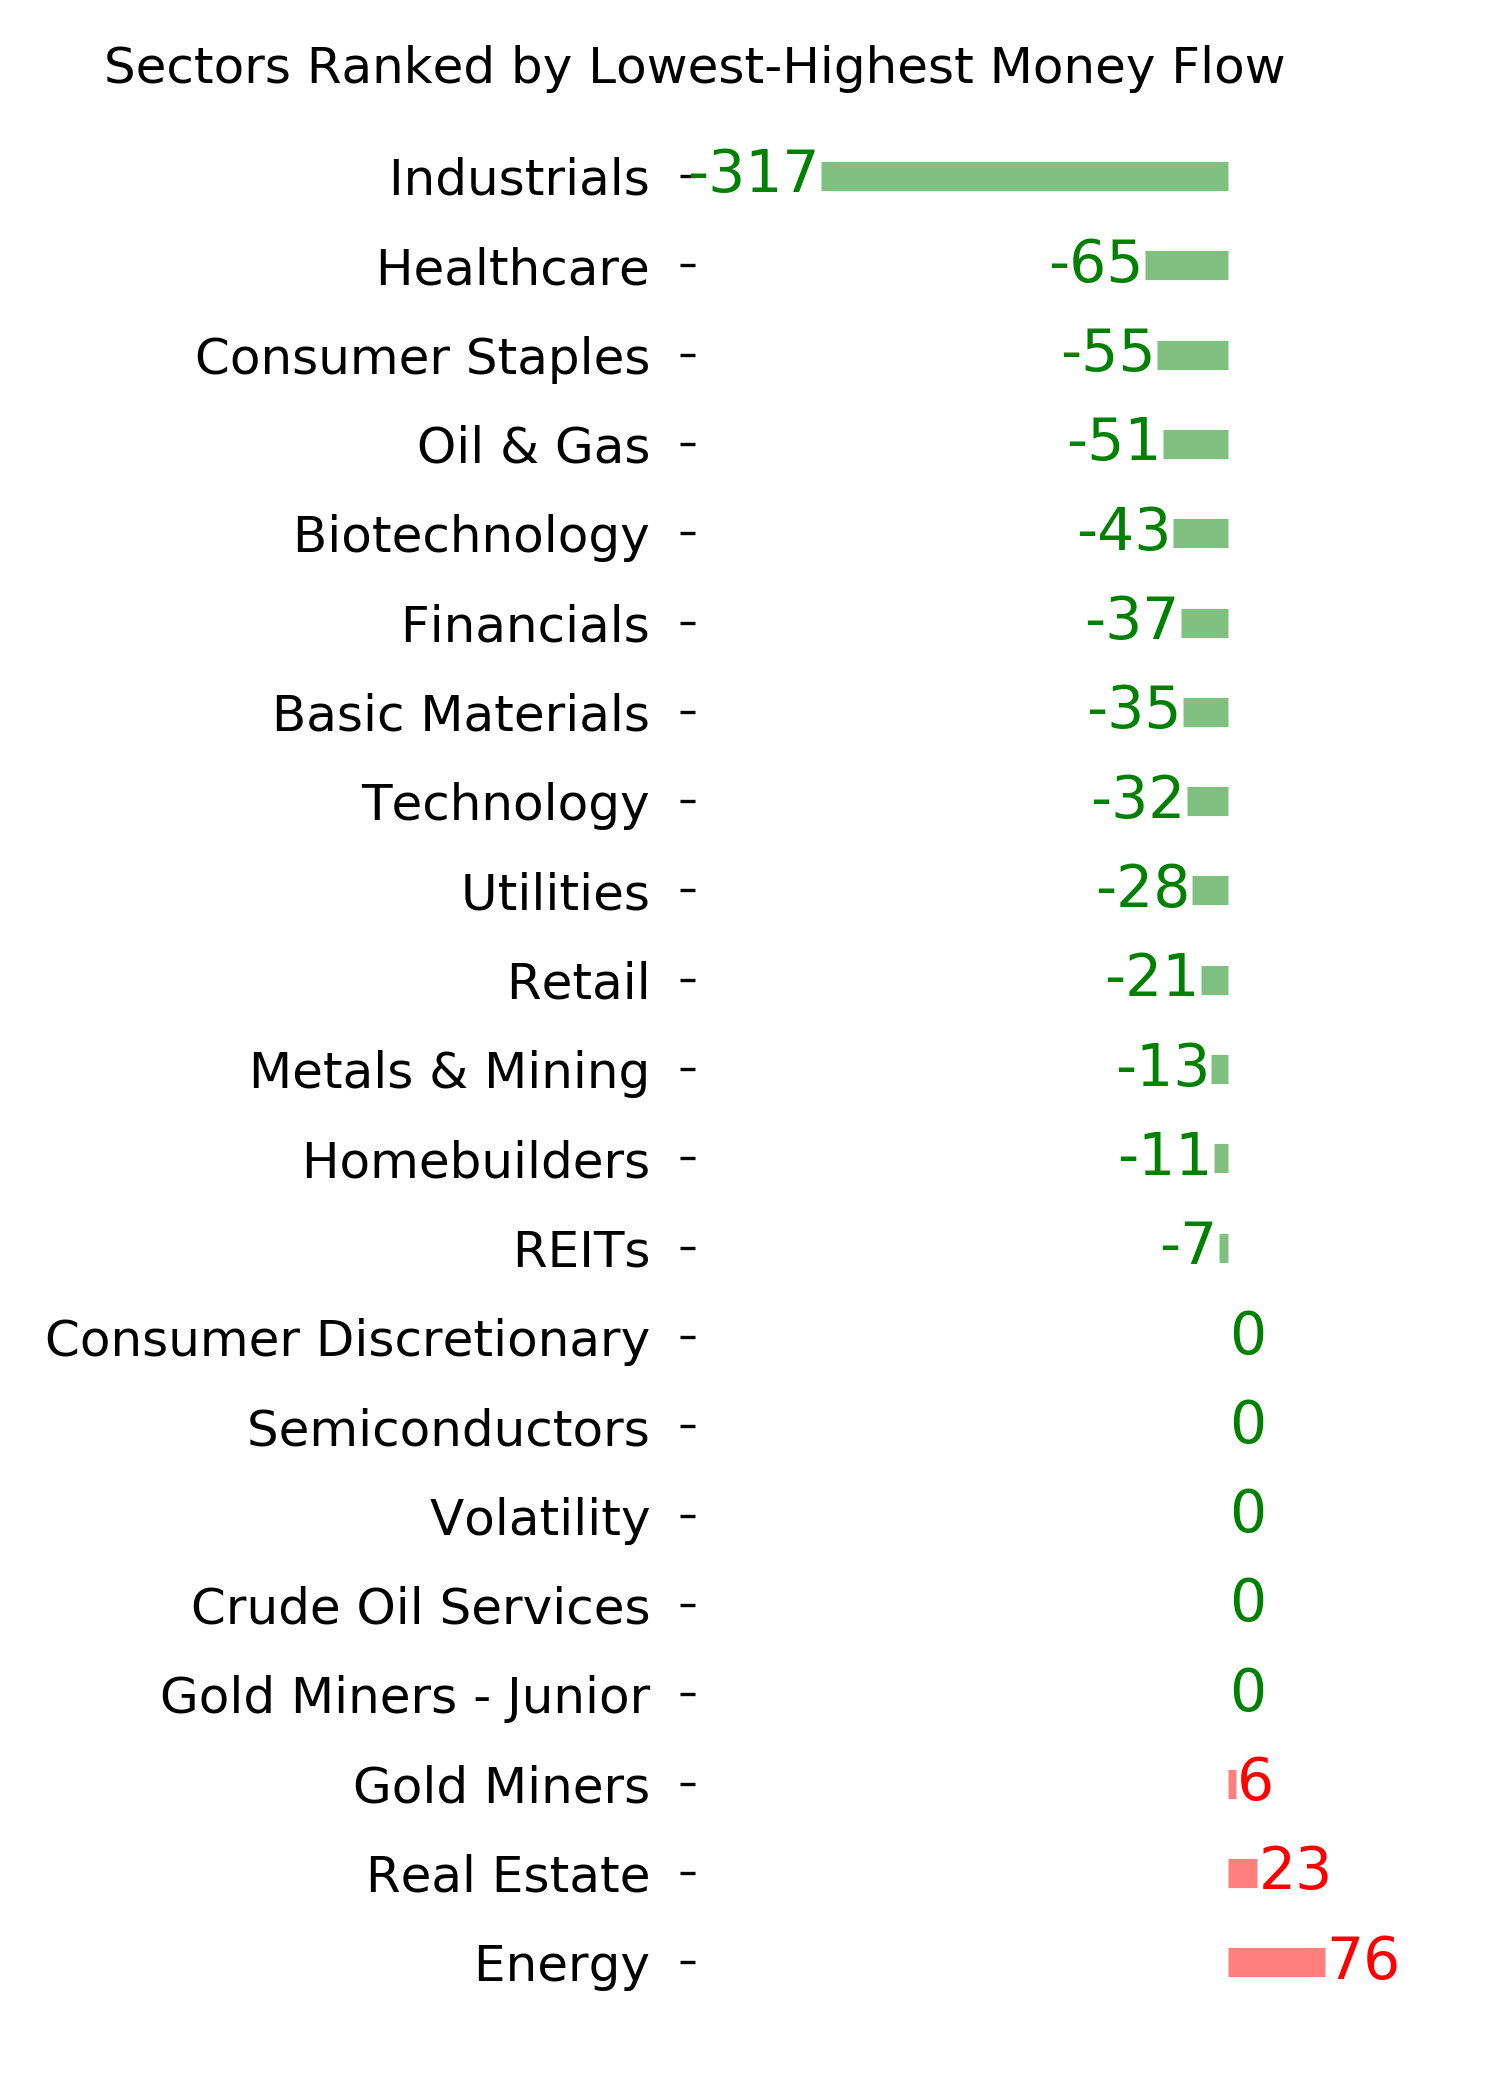
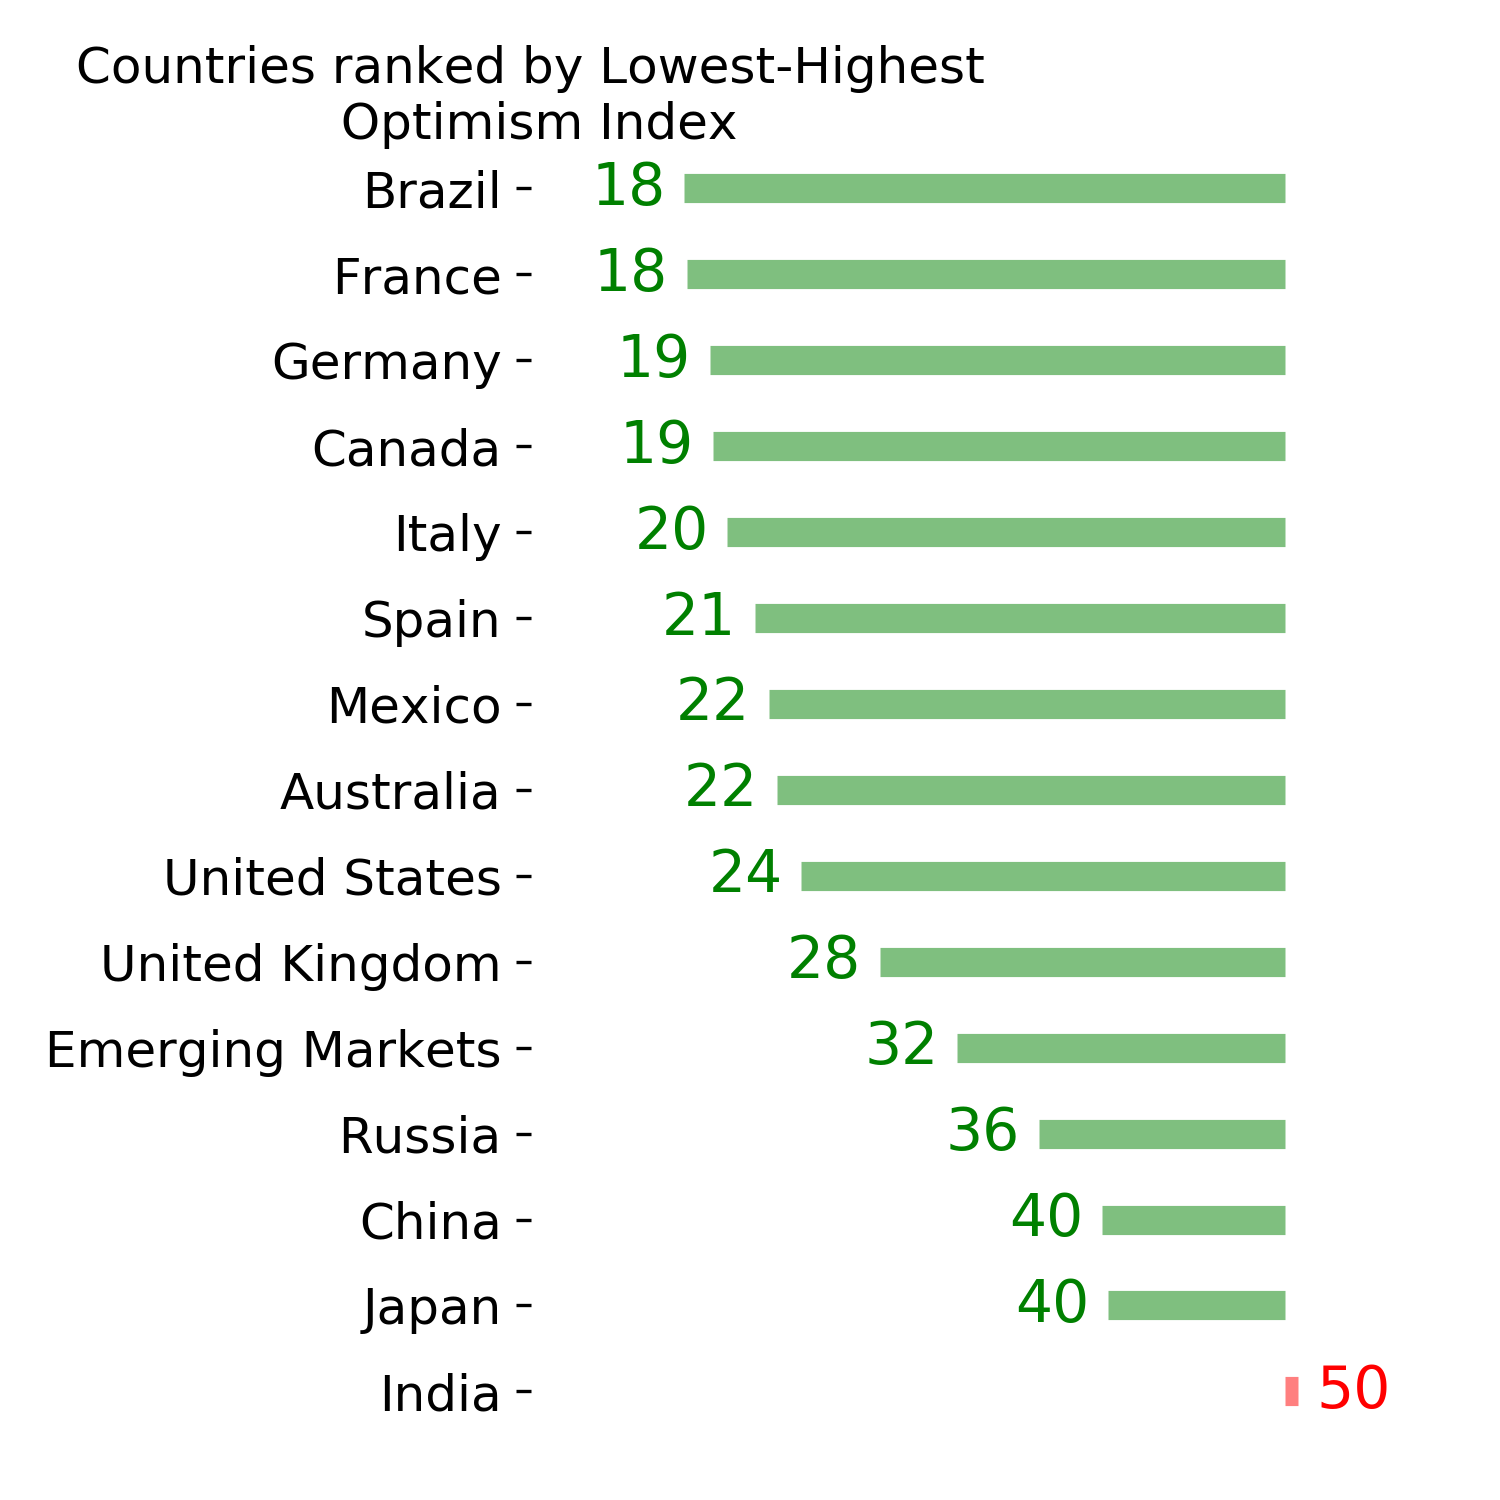
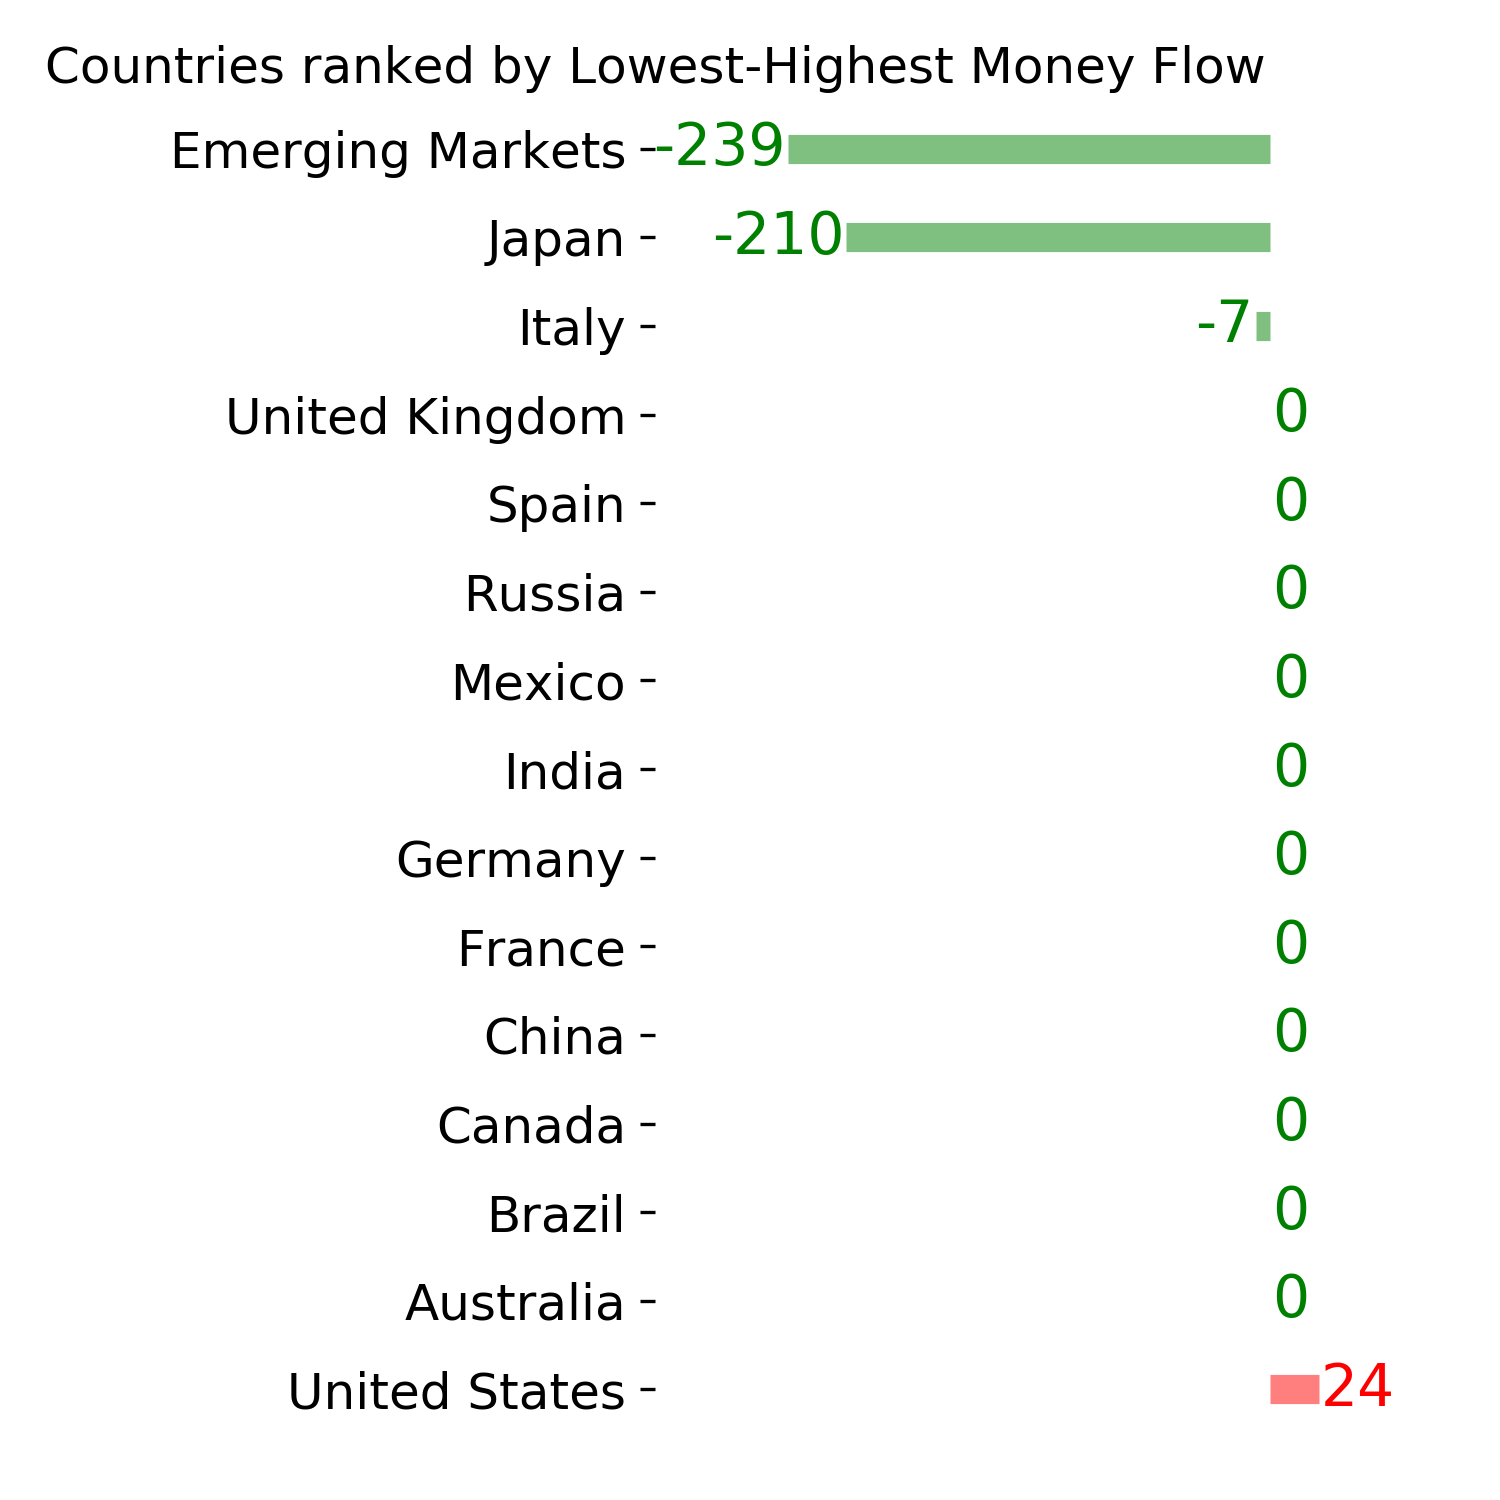
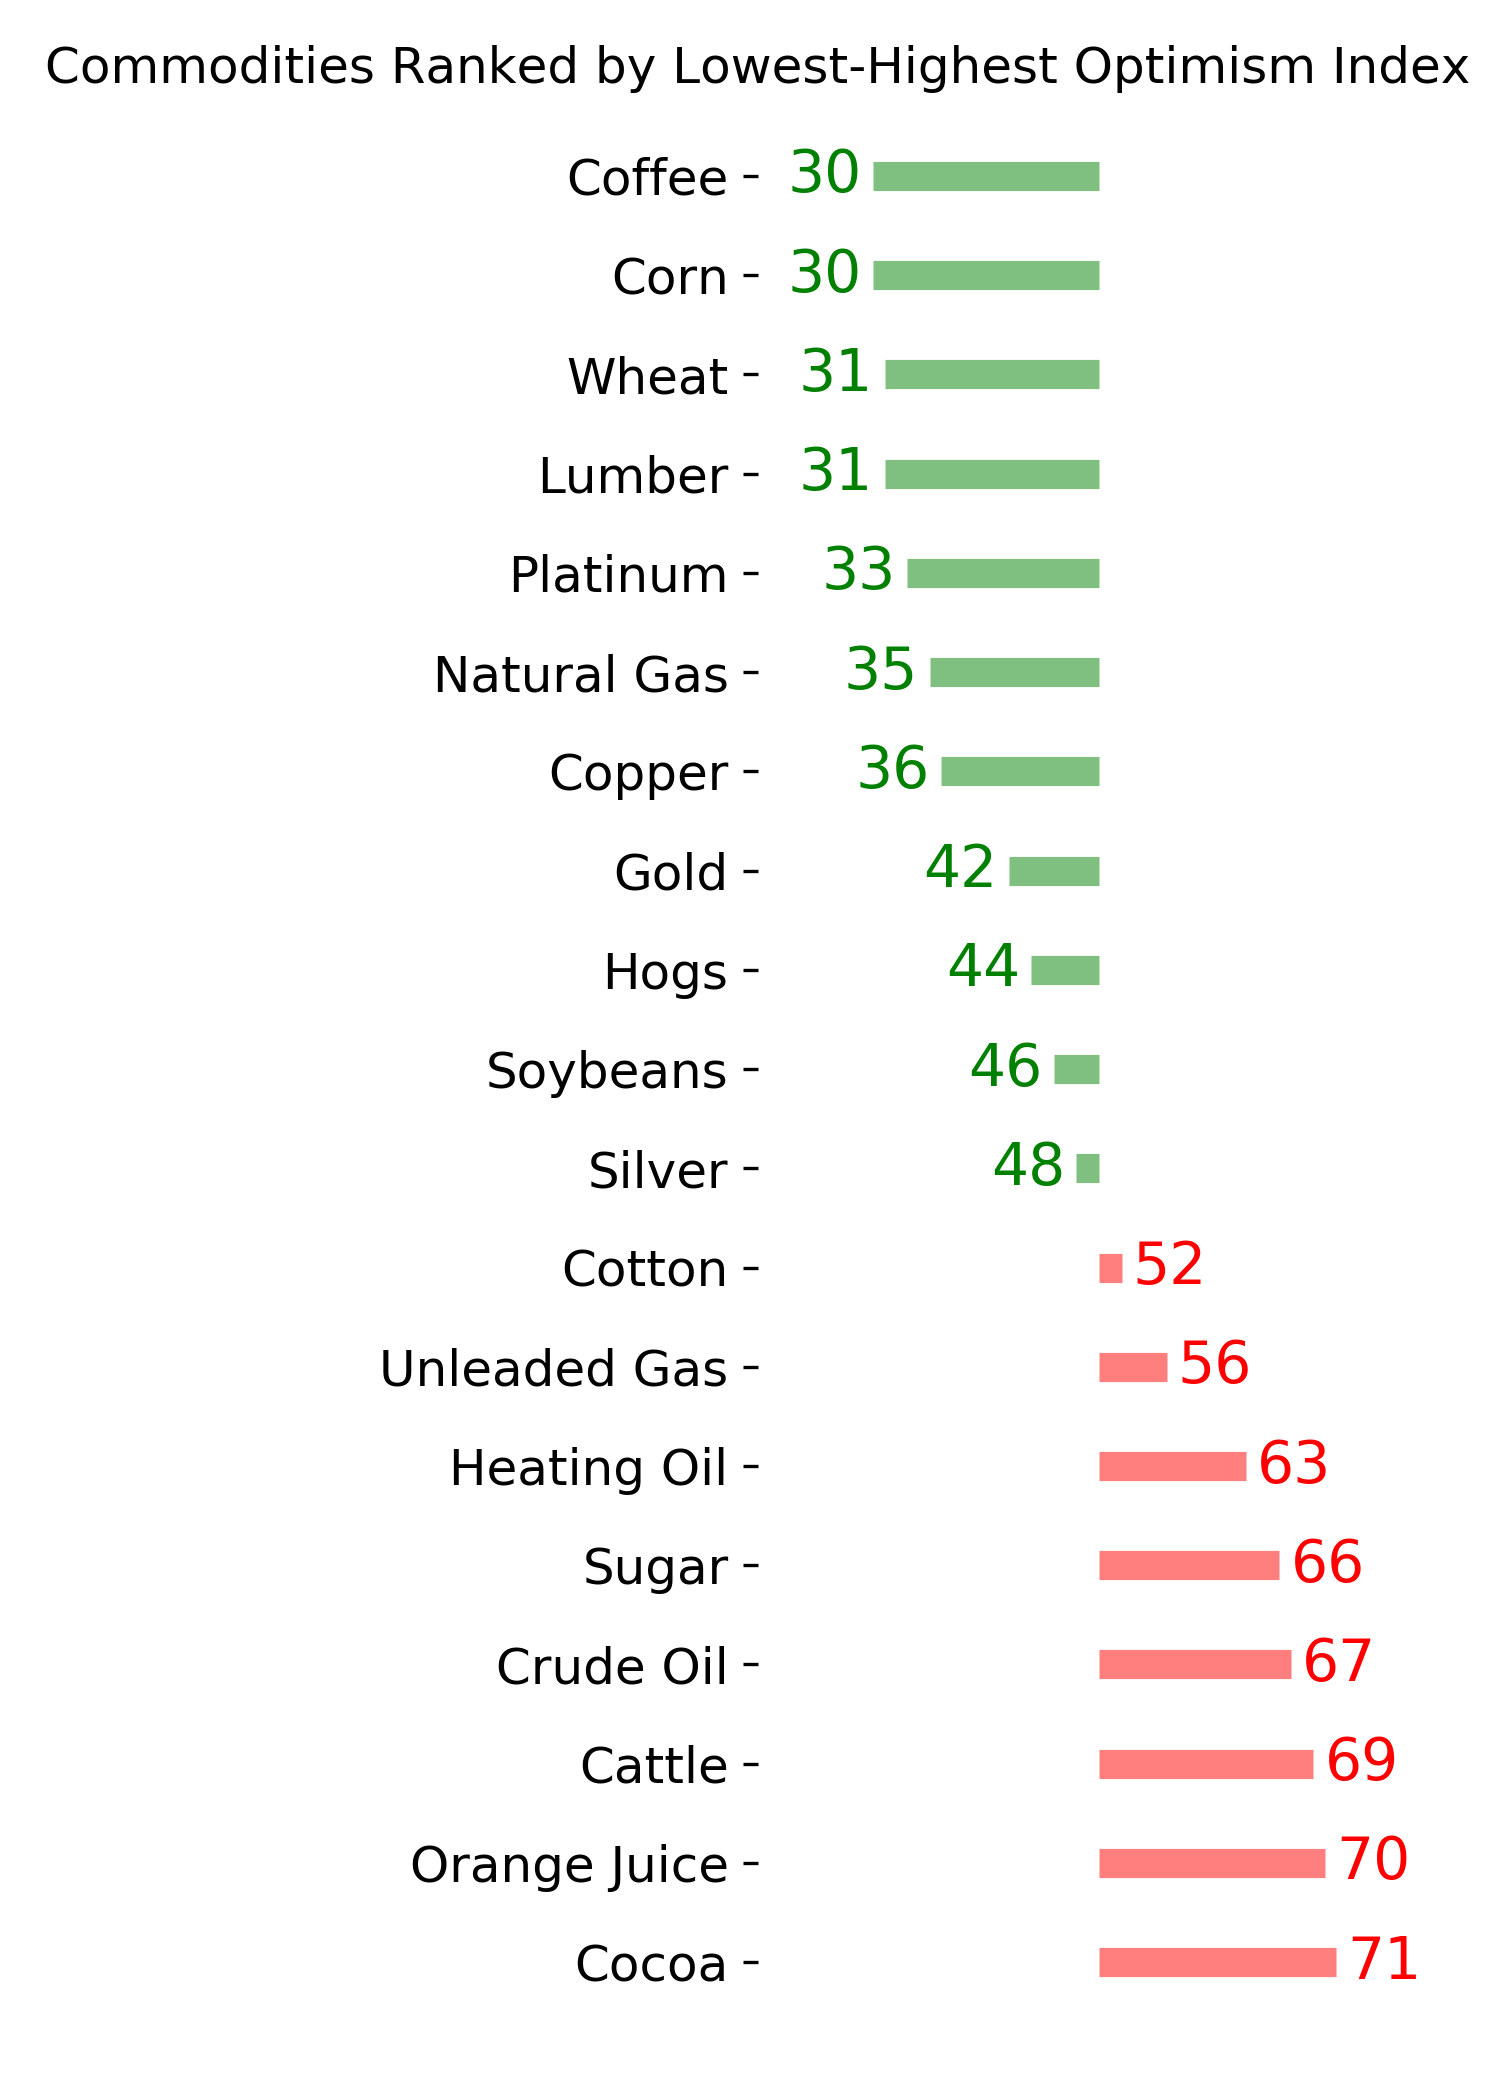
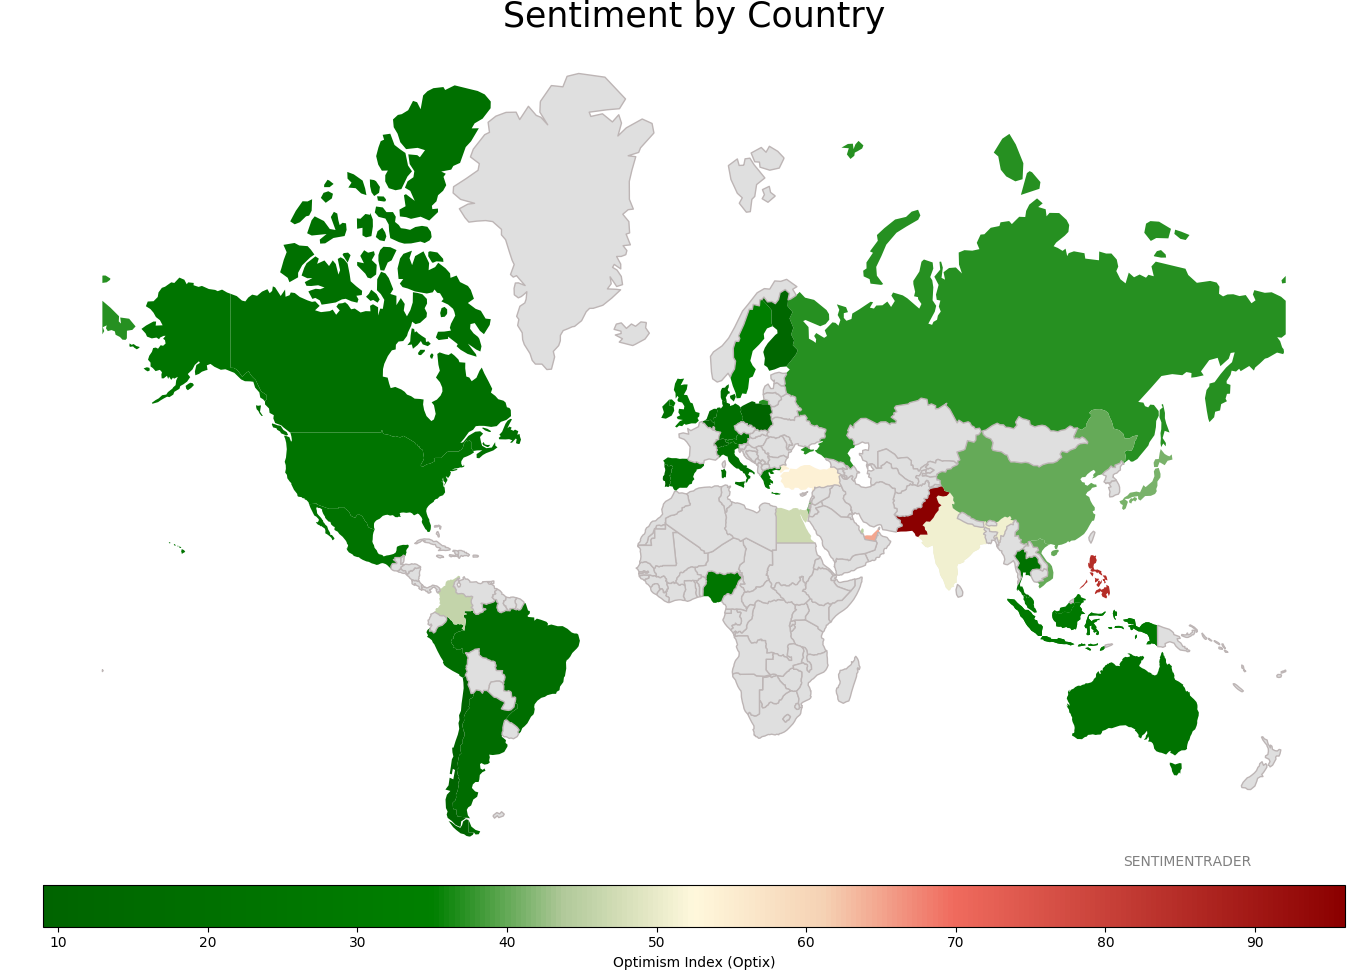
Sentiment Around The World
Optimism Index Thumbnails
|
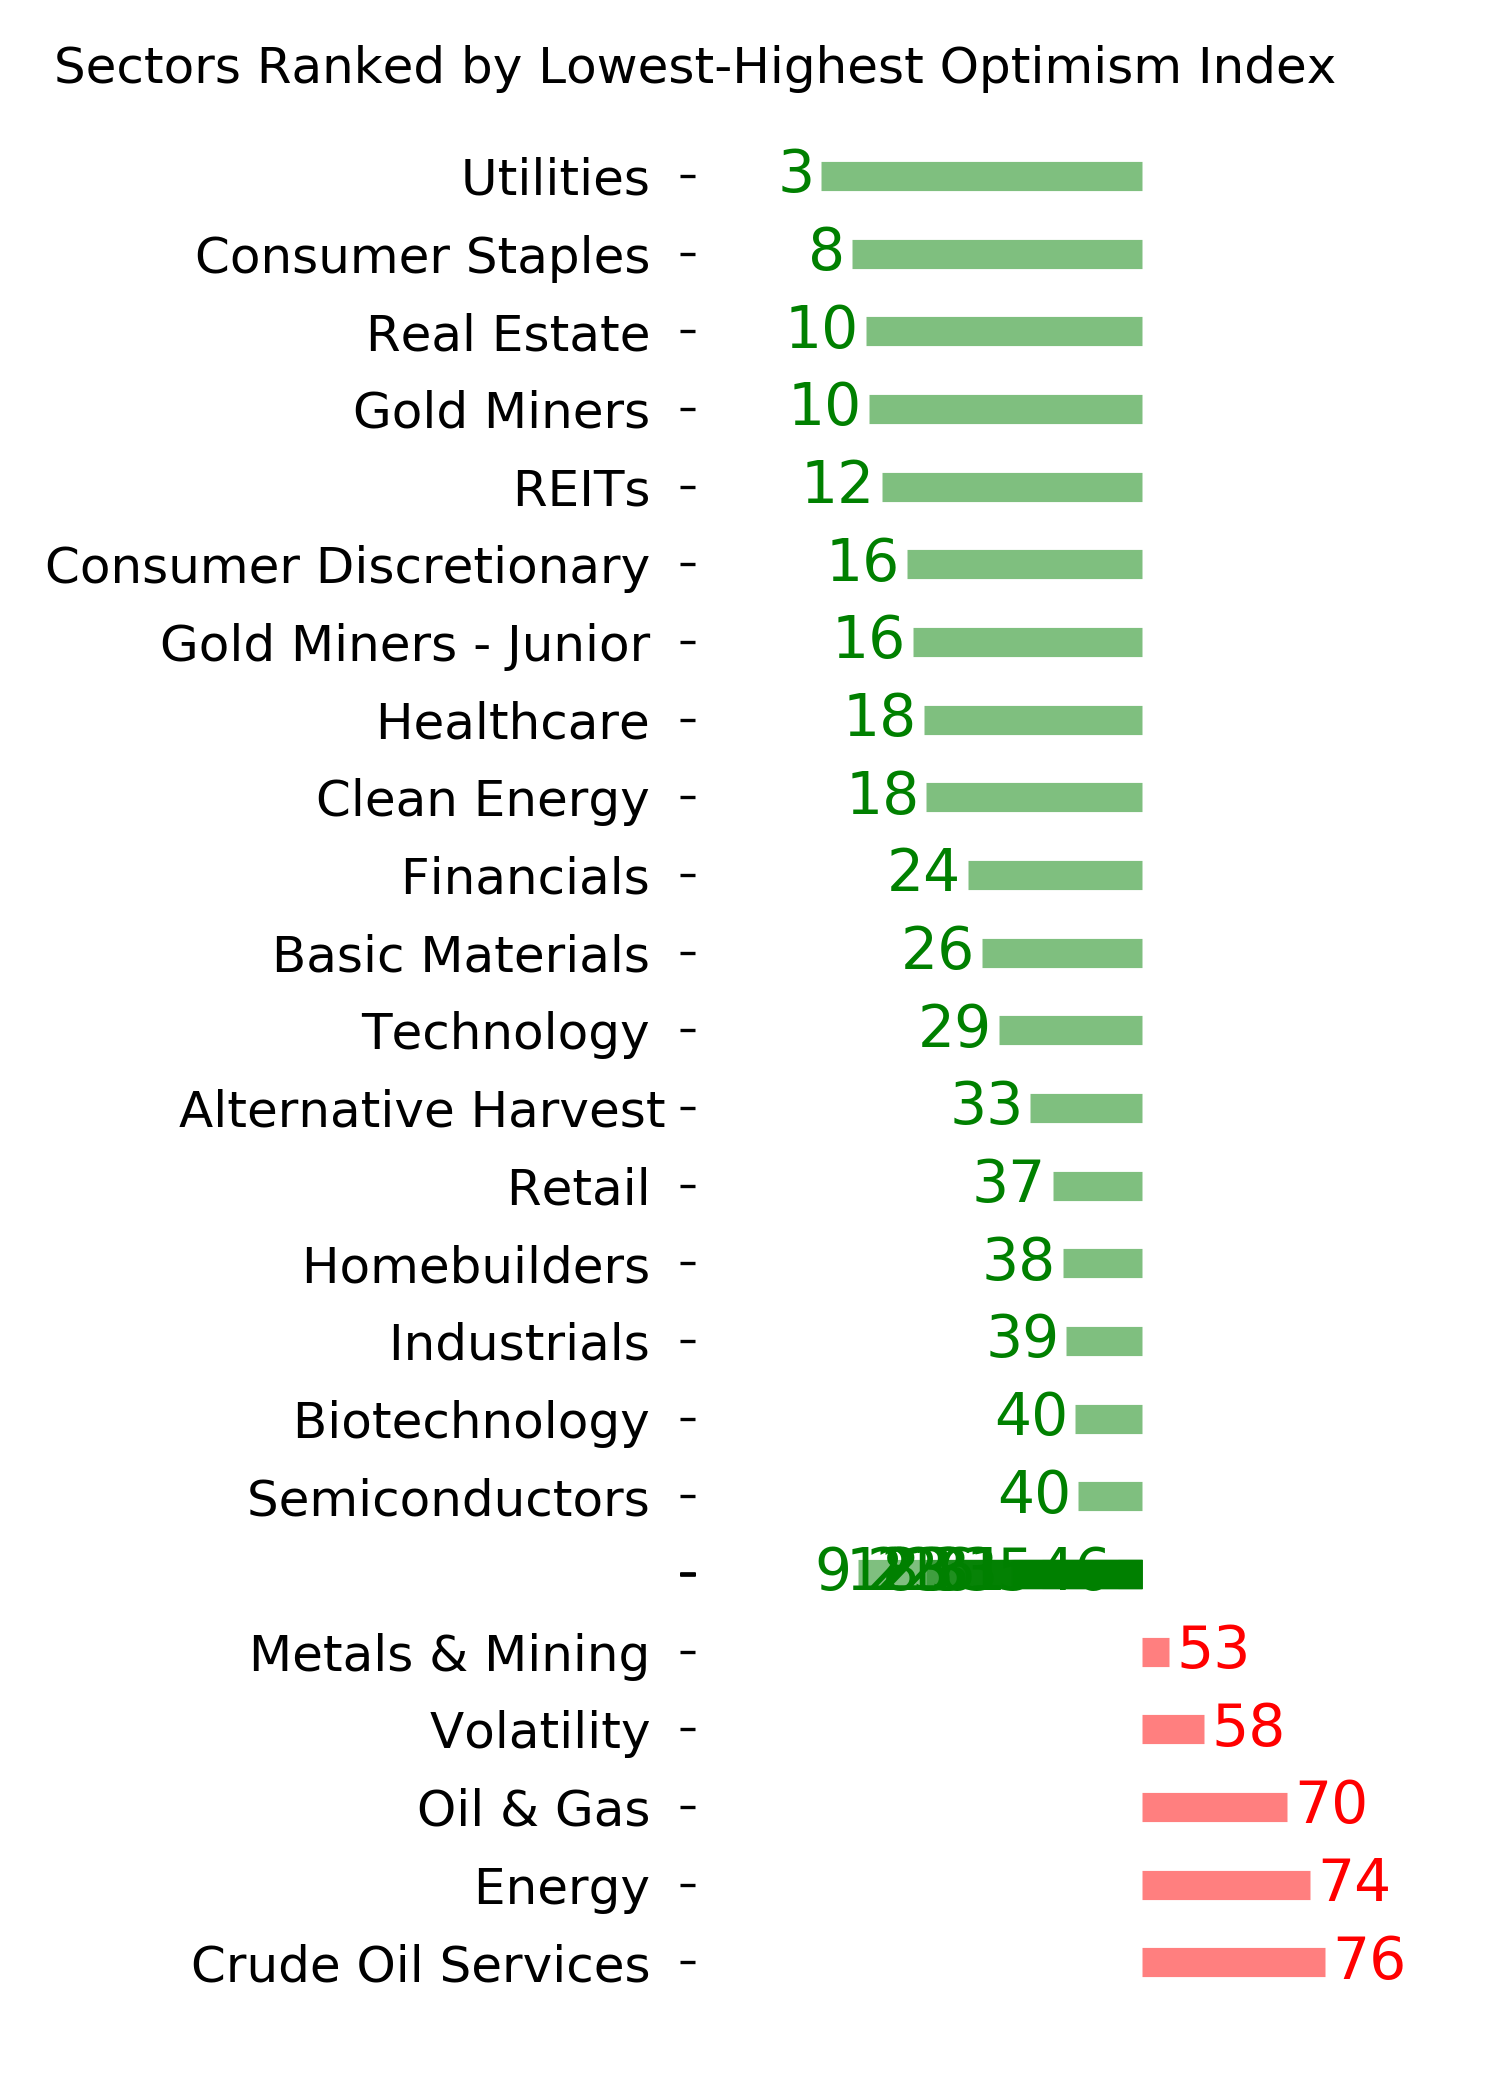
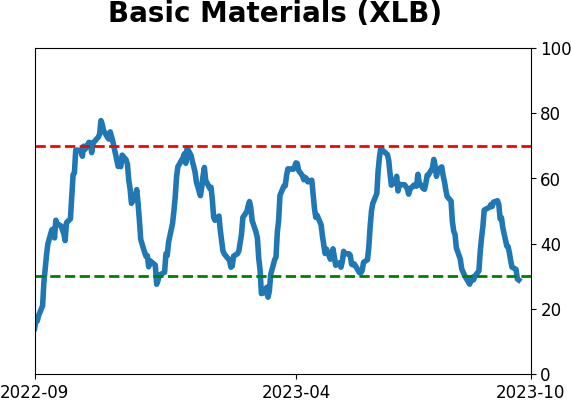
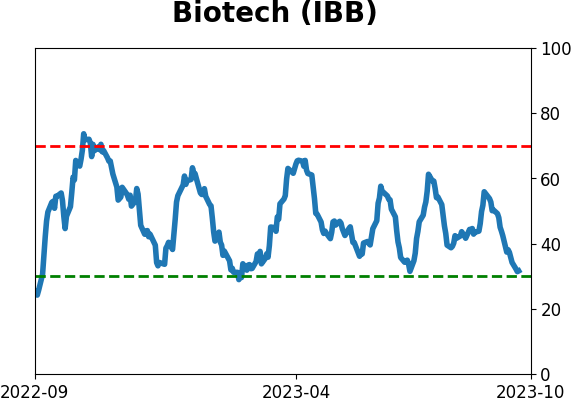
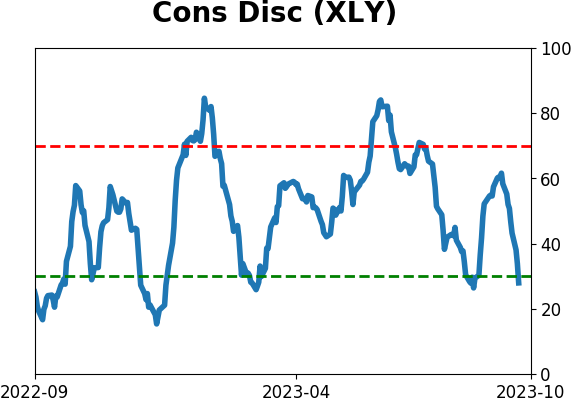
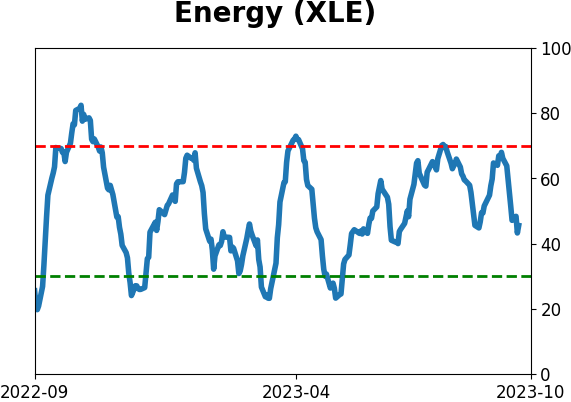
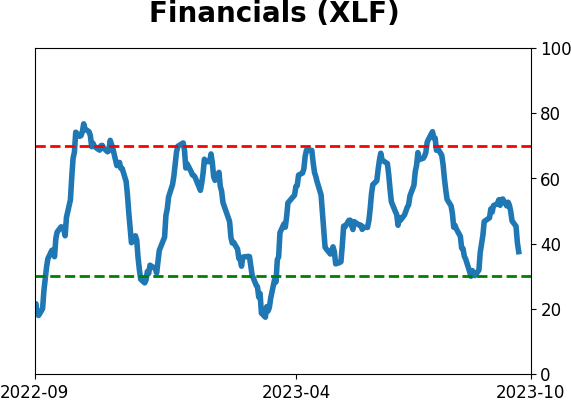
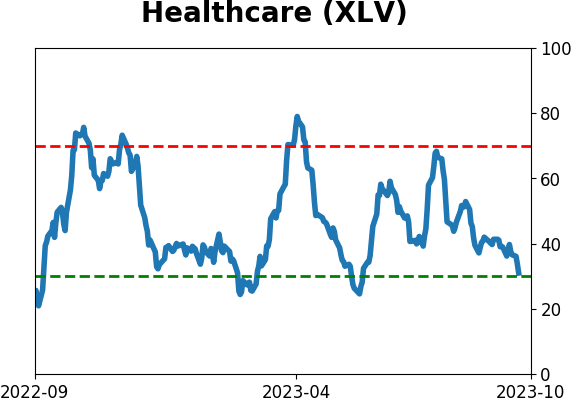
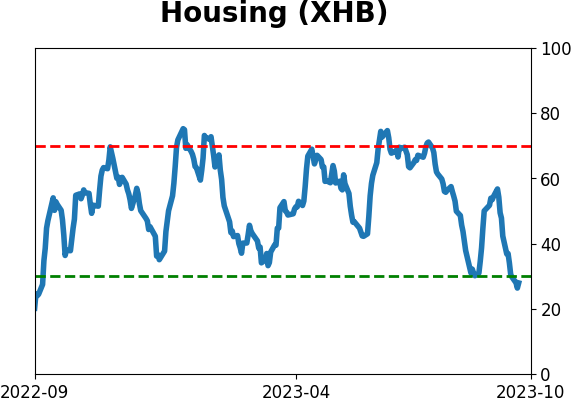
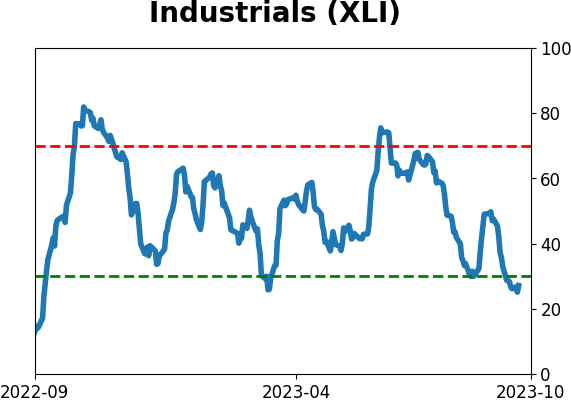
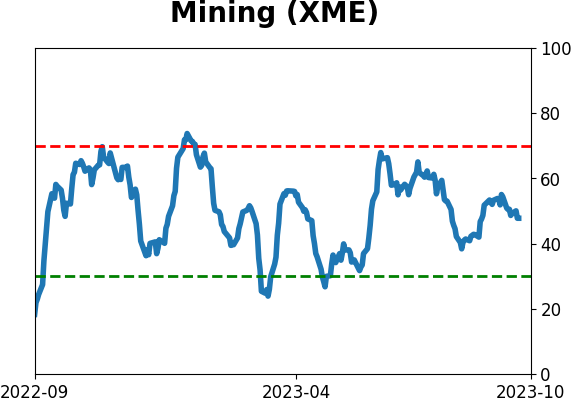
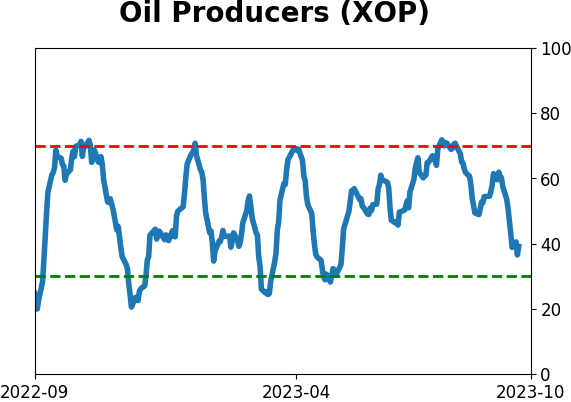
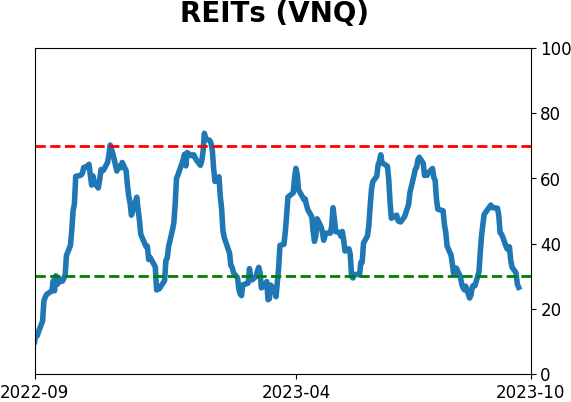
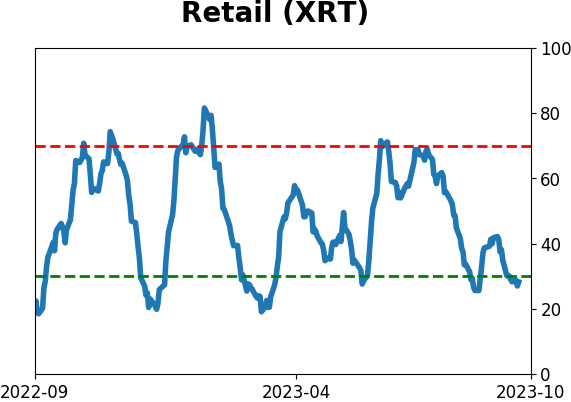
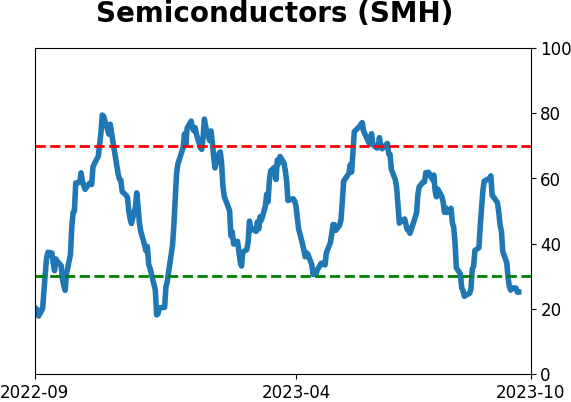
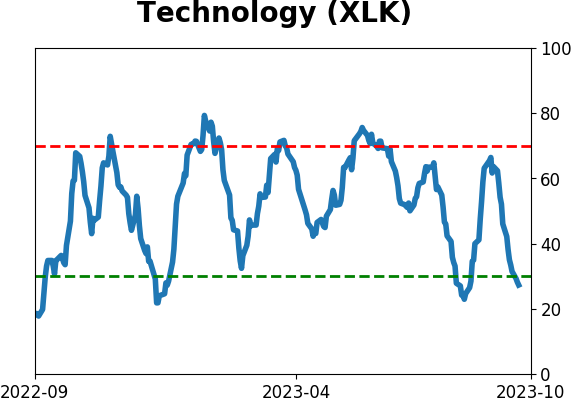
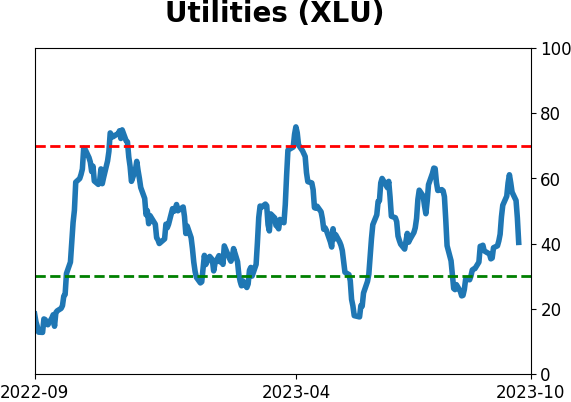
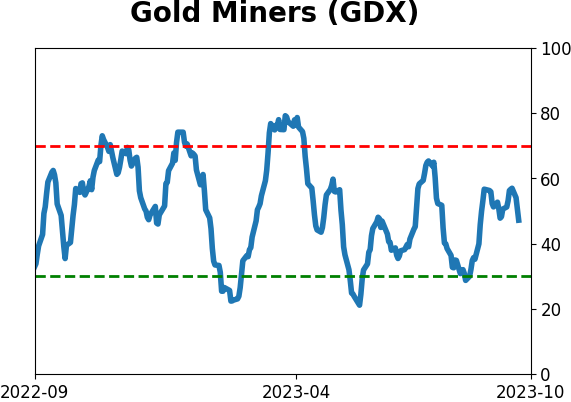
Sector ETF's - 10-Day Moving Average
|
|
|
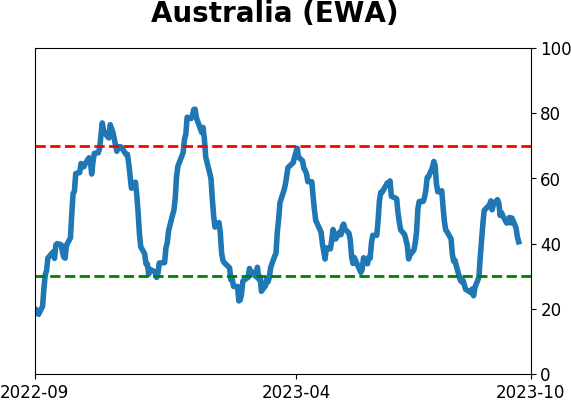
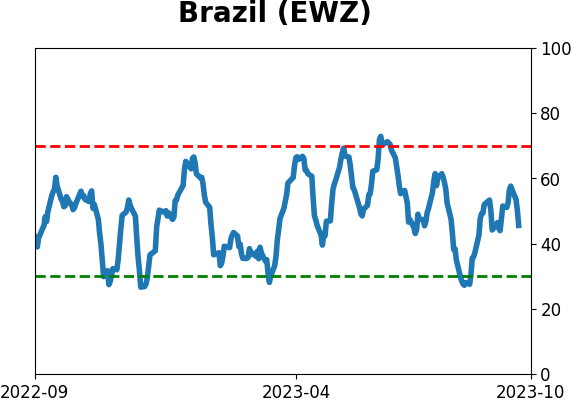
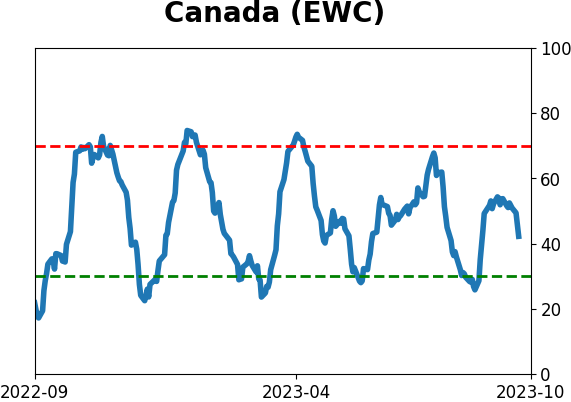
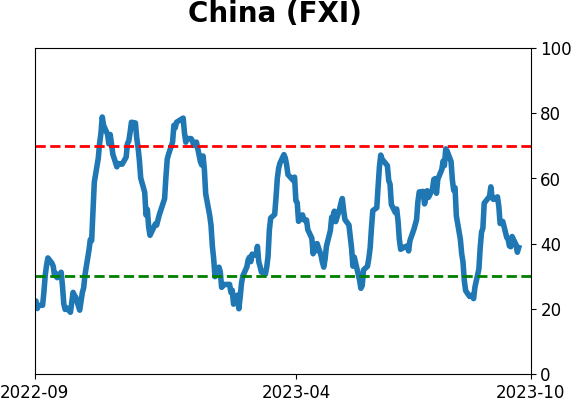
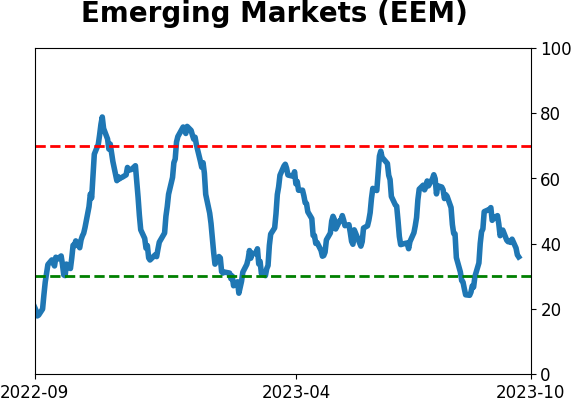
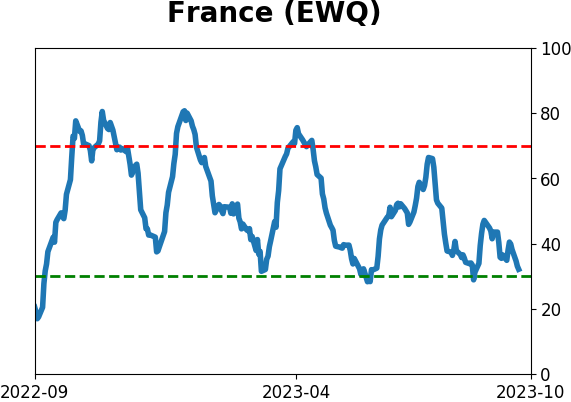
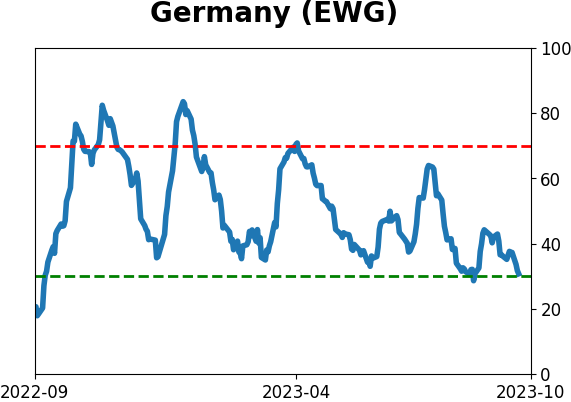
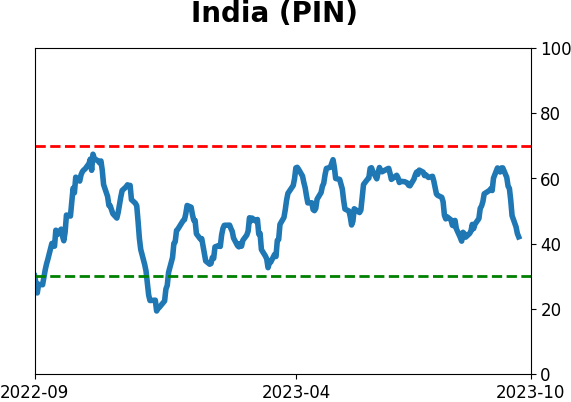
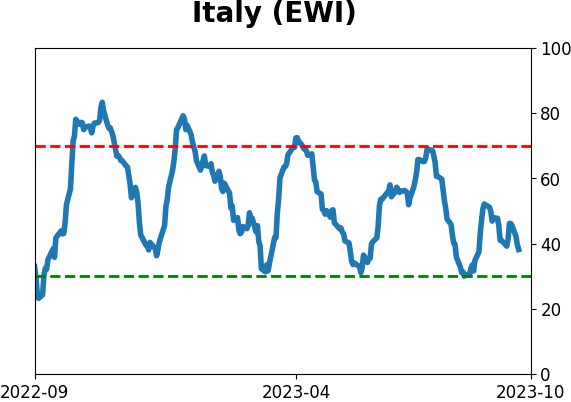
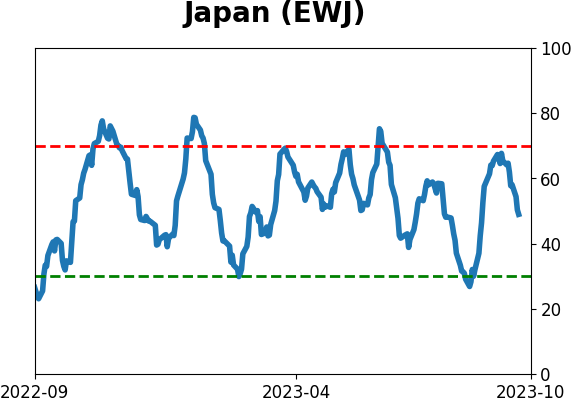
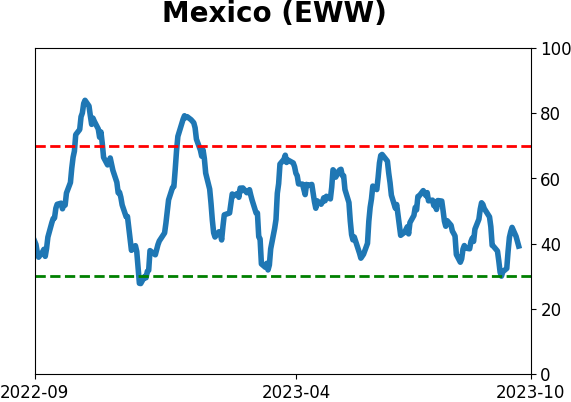
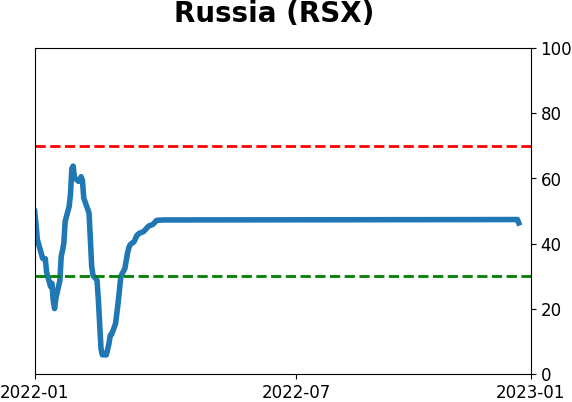
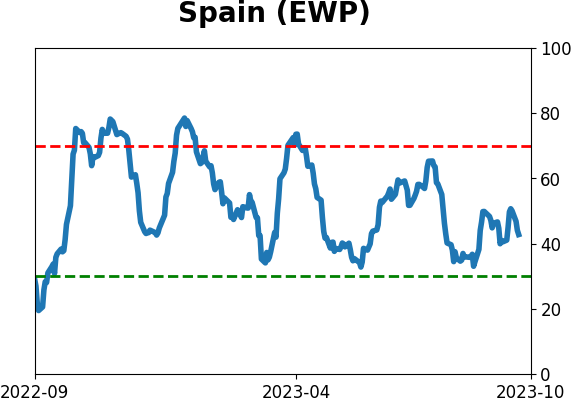
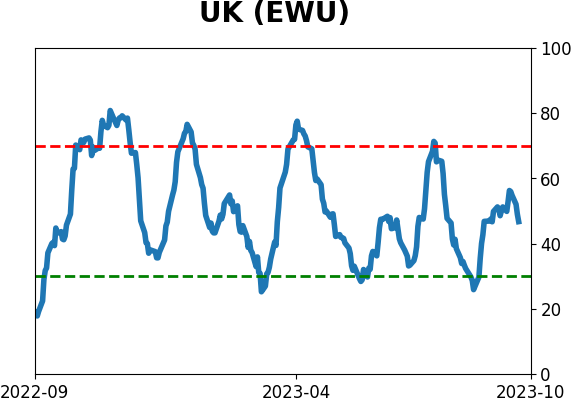
Country ETF's - 10-Day Moving Average
|
|
|
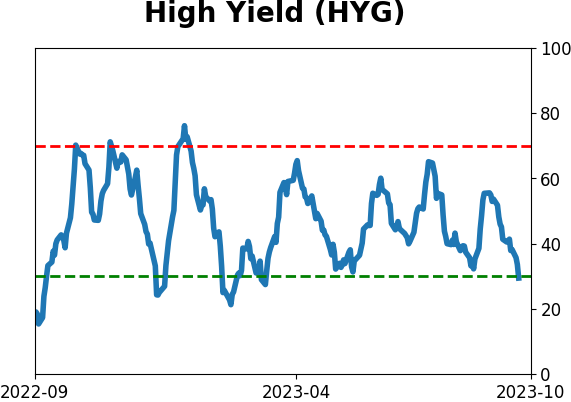
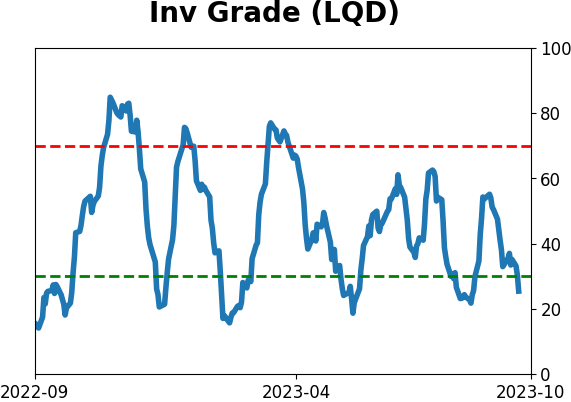
Bond ETF's - 10-Day Moving Average
|
|
|
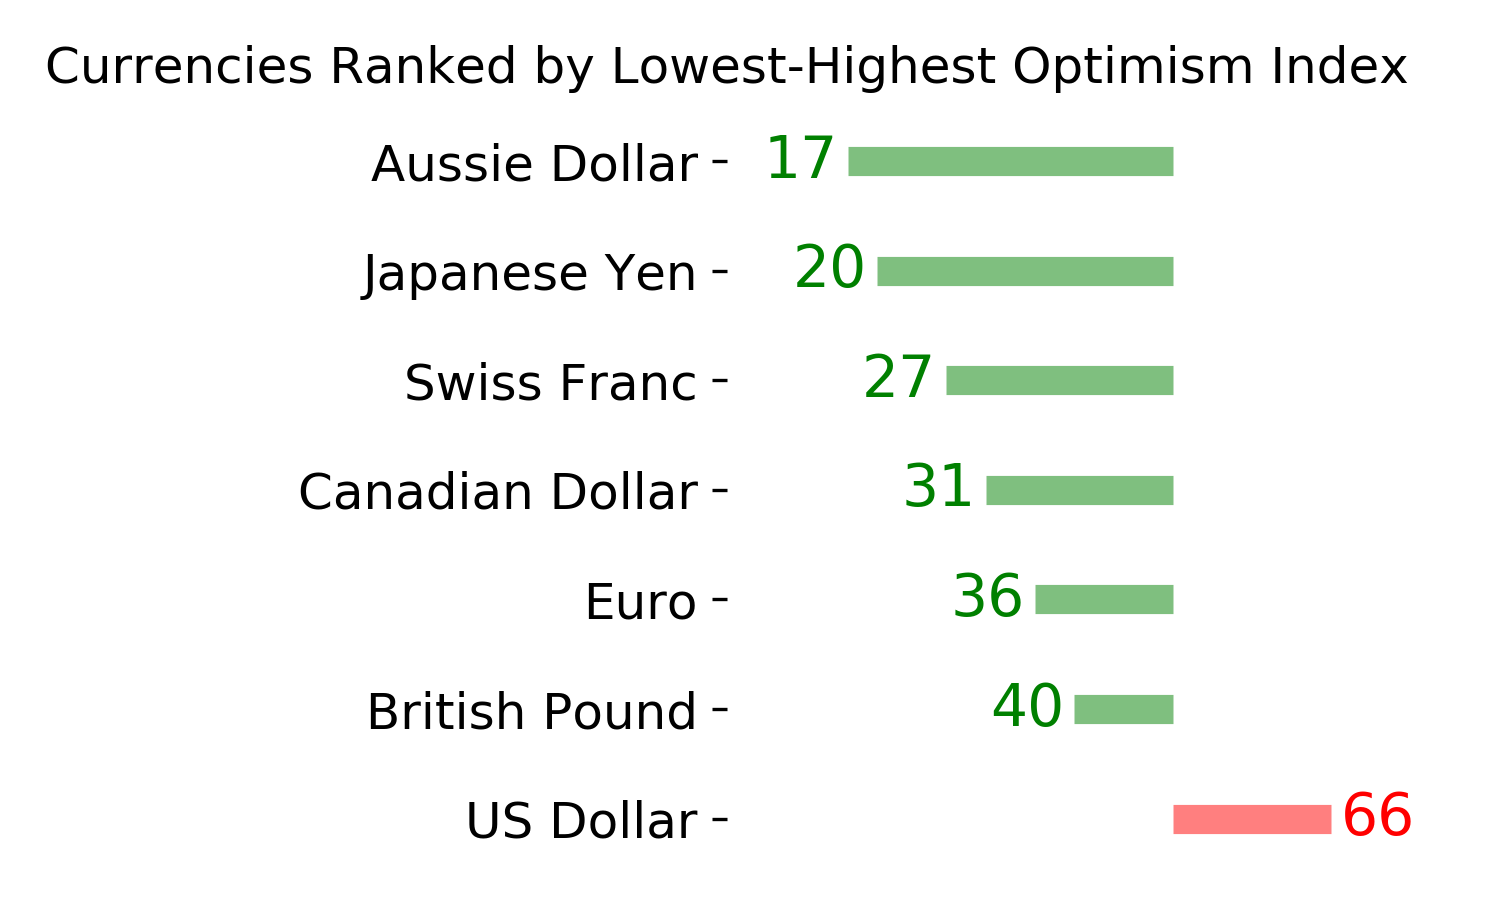
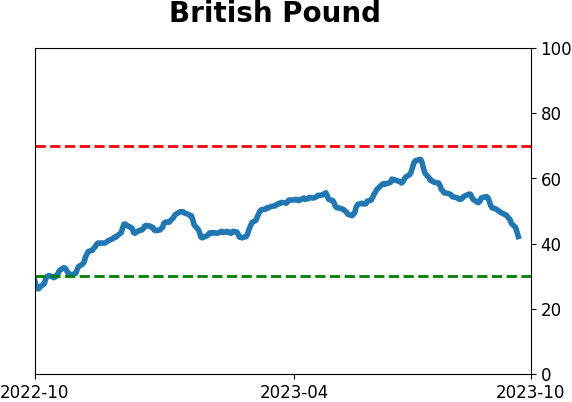
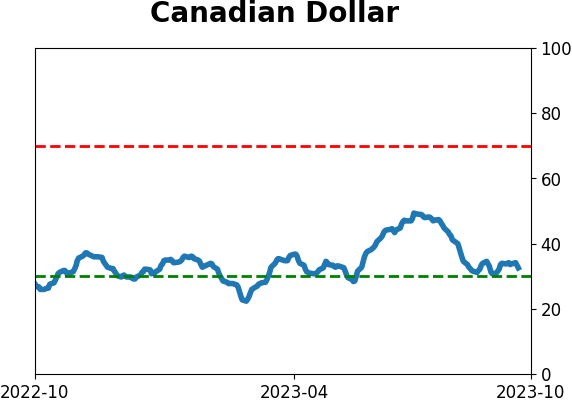
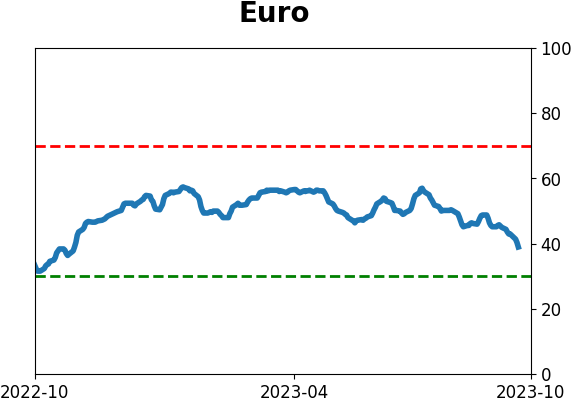
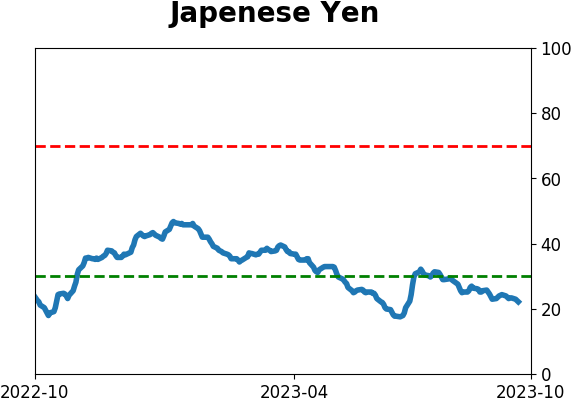
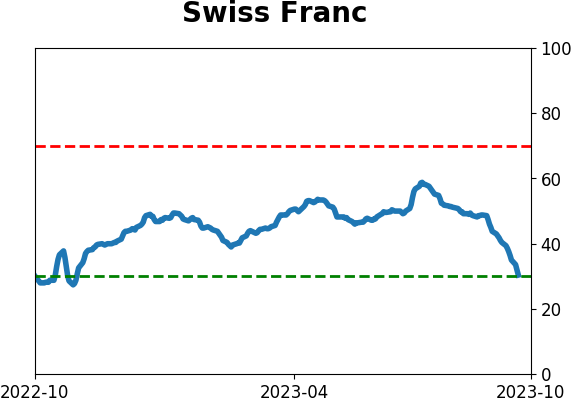
Currency ETF's - 5-Day Moving Average
|
|
|
Commodity ETF's - 5-Day Moving Average
|
|