Headlines
|
|
Options Traders Near Post-Pandemic Pessimistic Extreme:
Small traders pulled back on their speculation options activity last week. Overall options activity was among the least optimistic since the initial thrust off the pandemic low. If we're still in the same kind of market environment, then this should be a good sign for stocks.
Bottom Line:
STOCKS: Hold
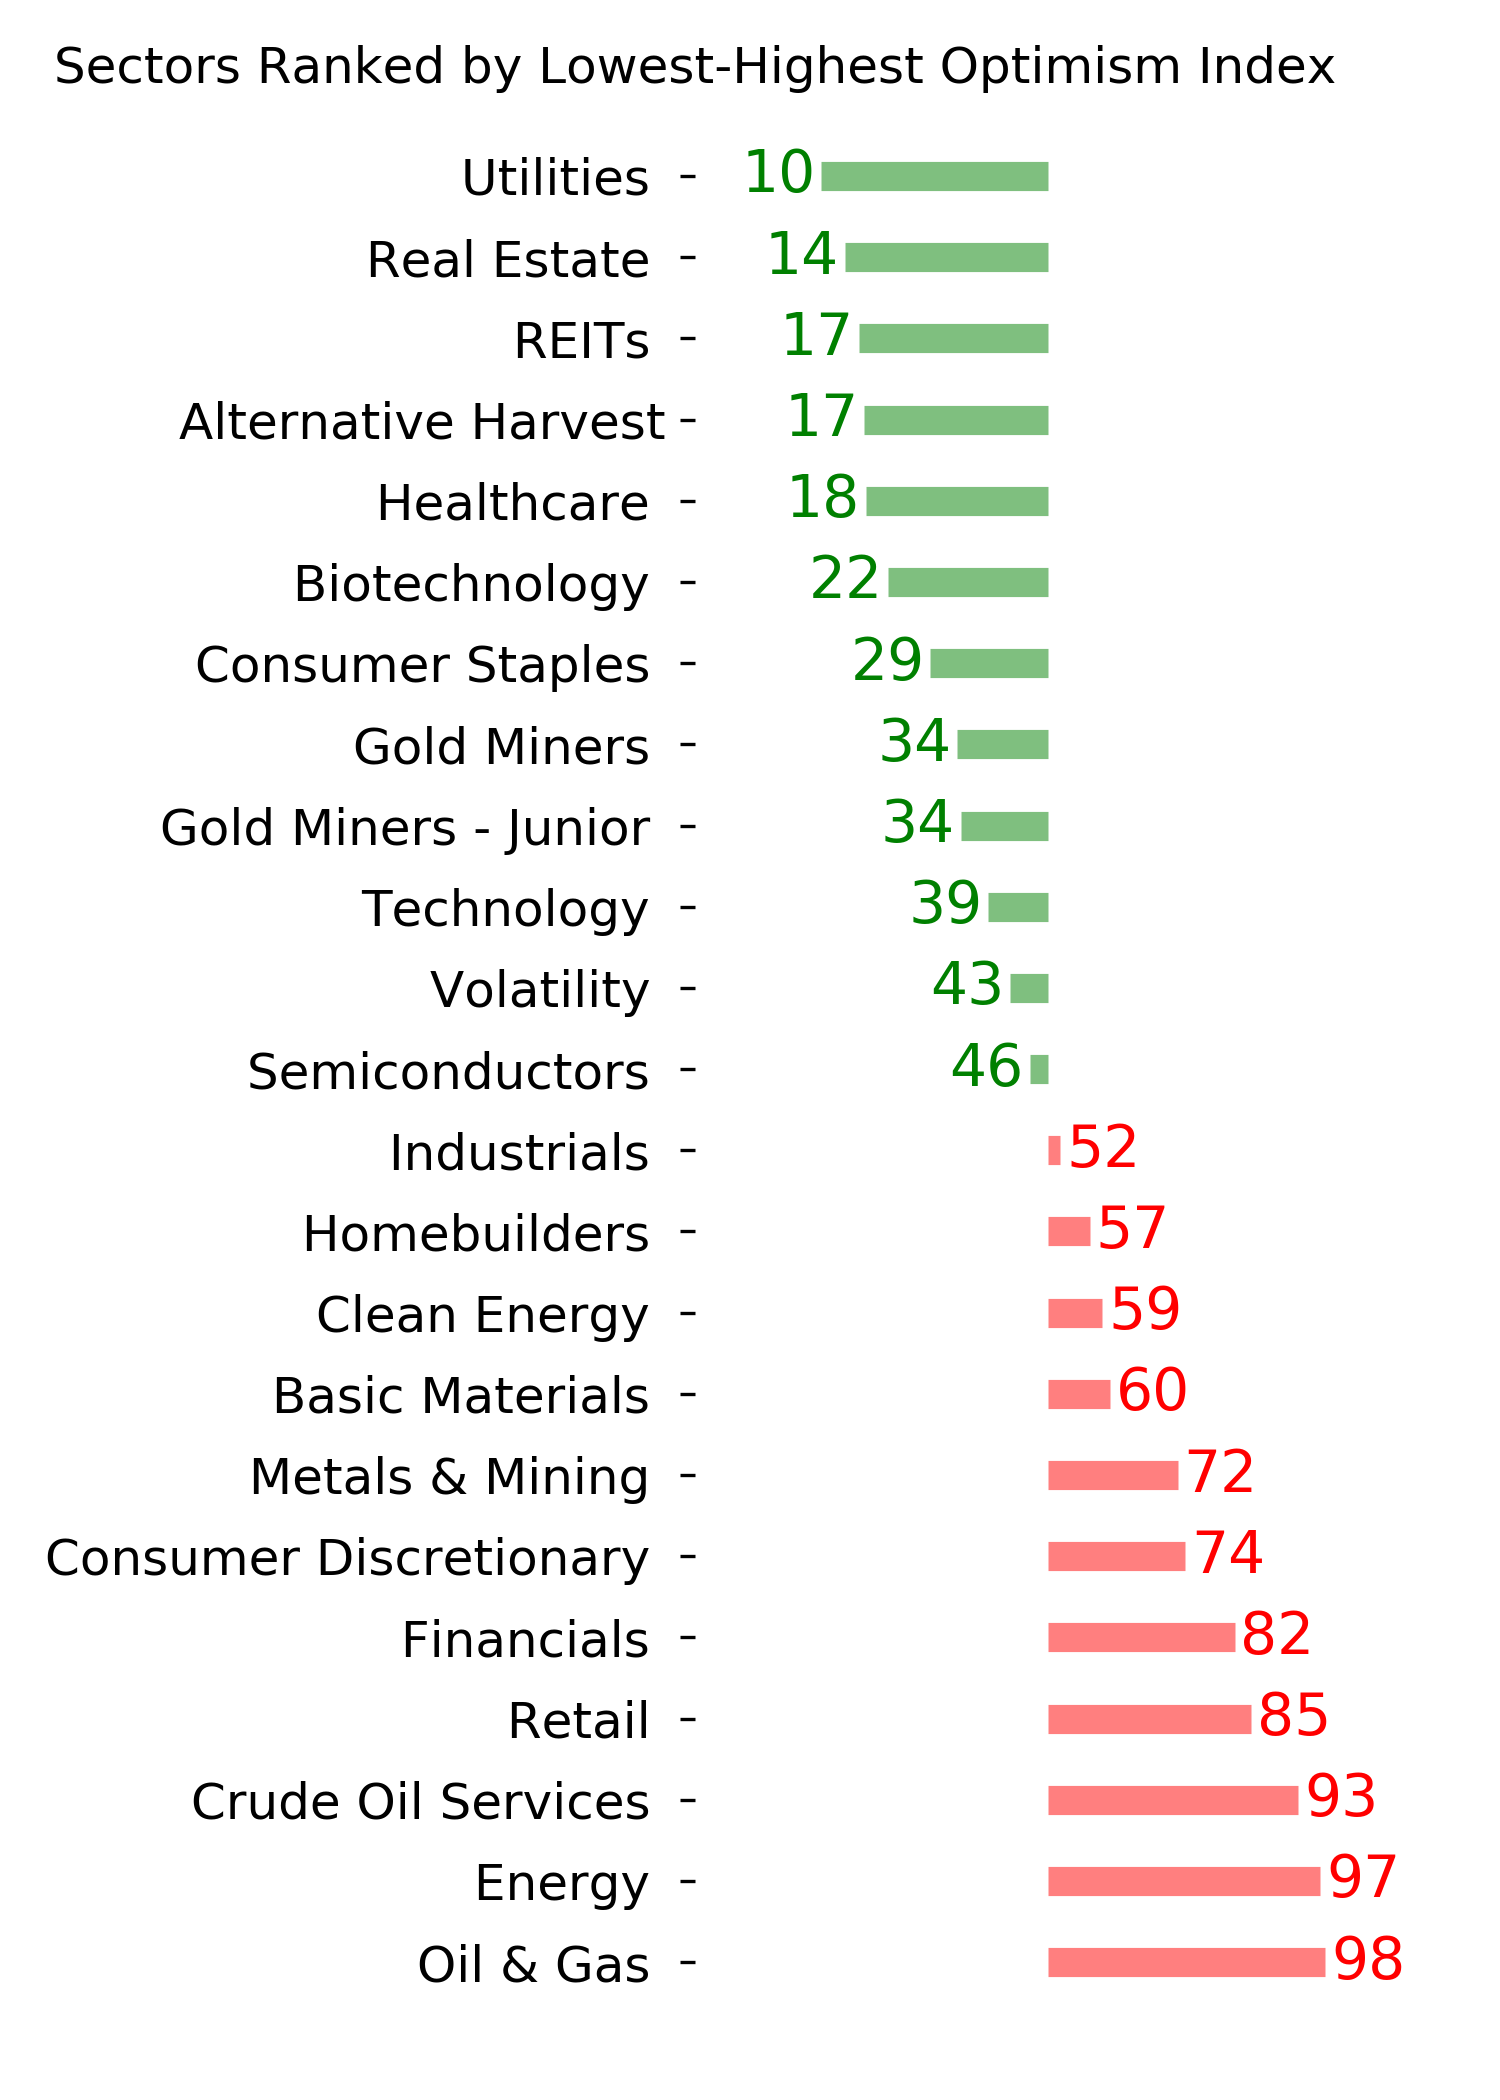
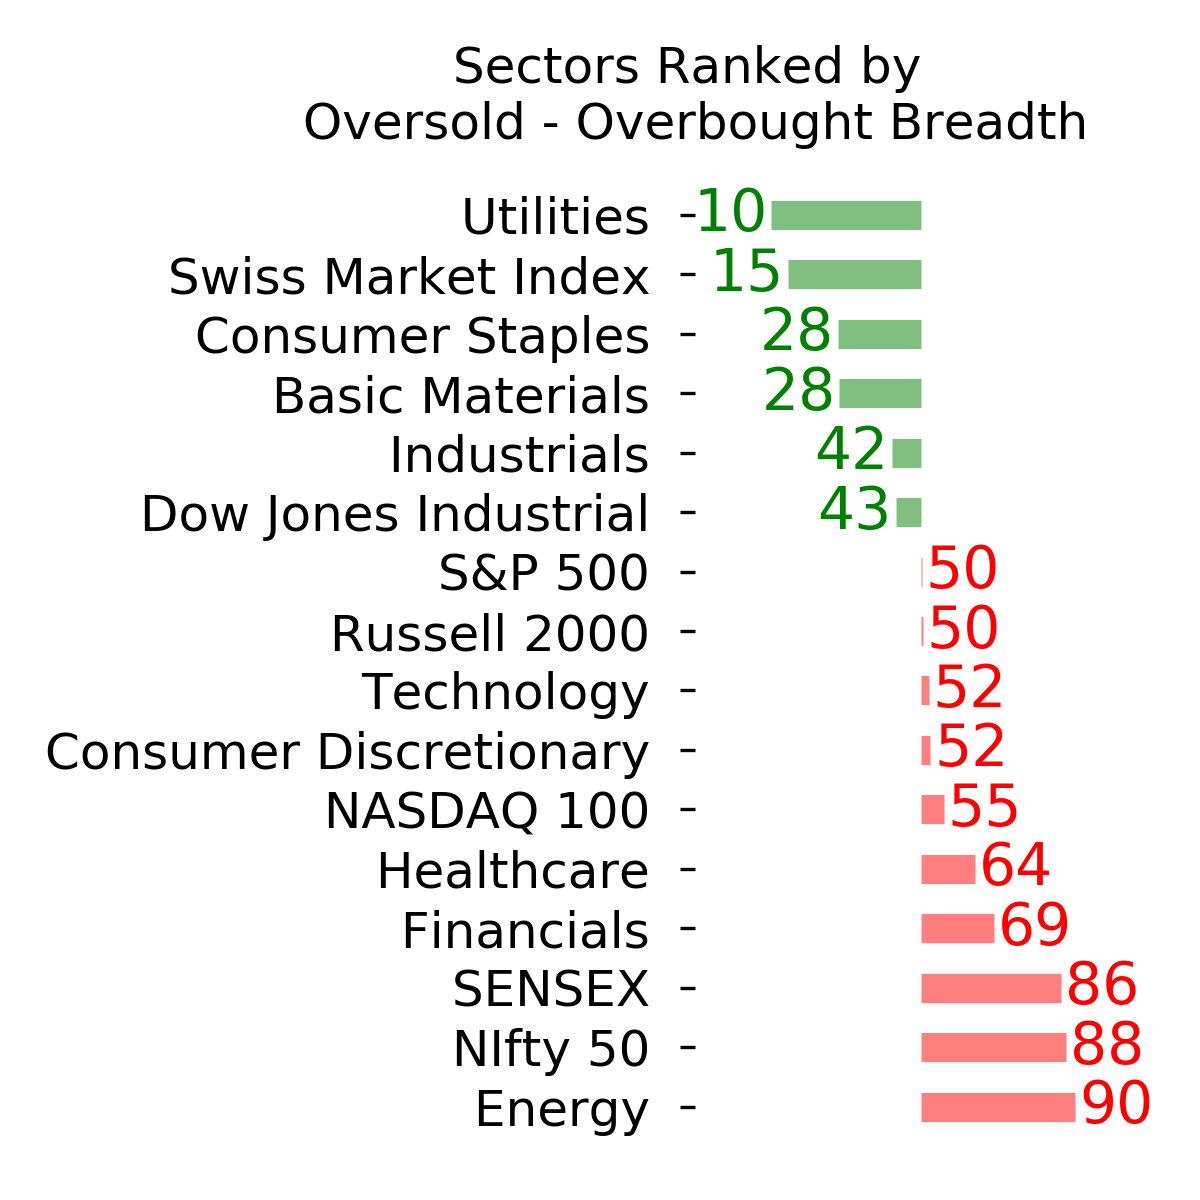
Sentiment continues to decline from the speculative February peak. With deteriorating breadth, this raises the risk of poor short- to medium-term returns until optimism and better breadth returns. See the Outlook & Allocations page for more. BONDS: Hold
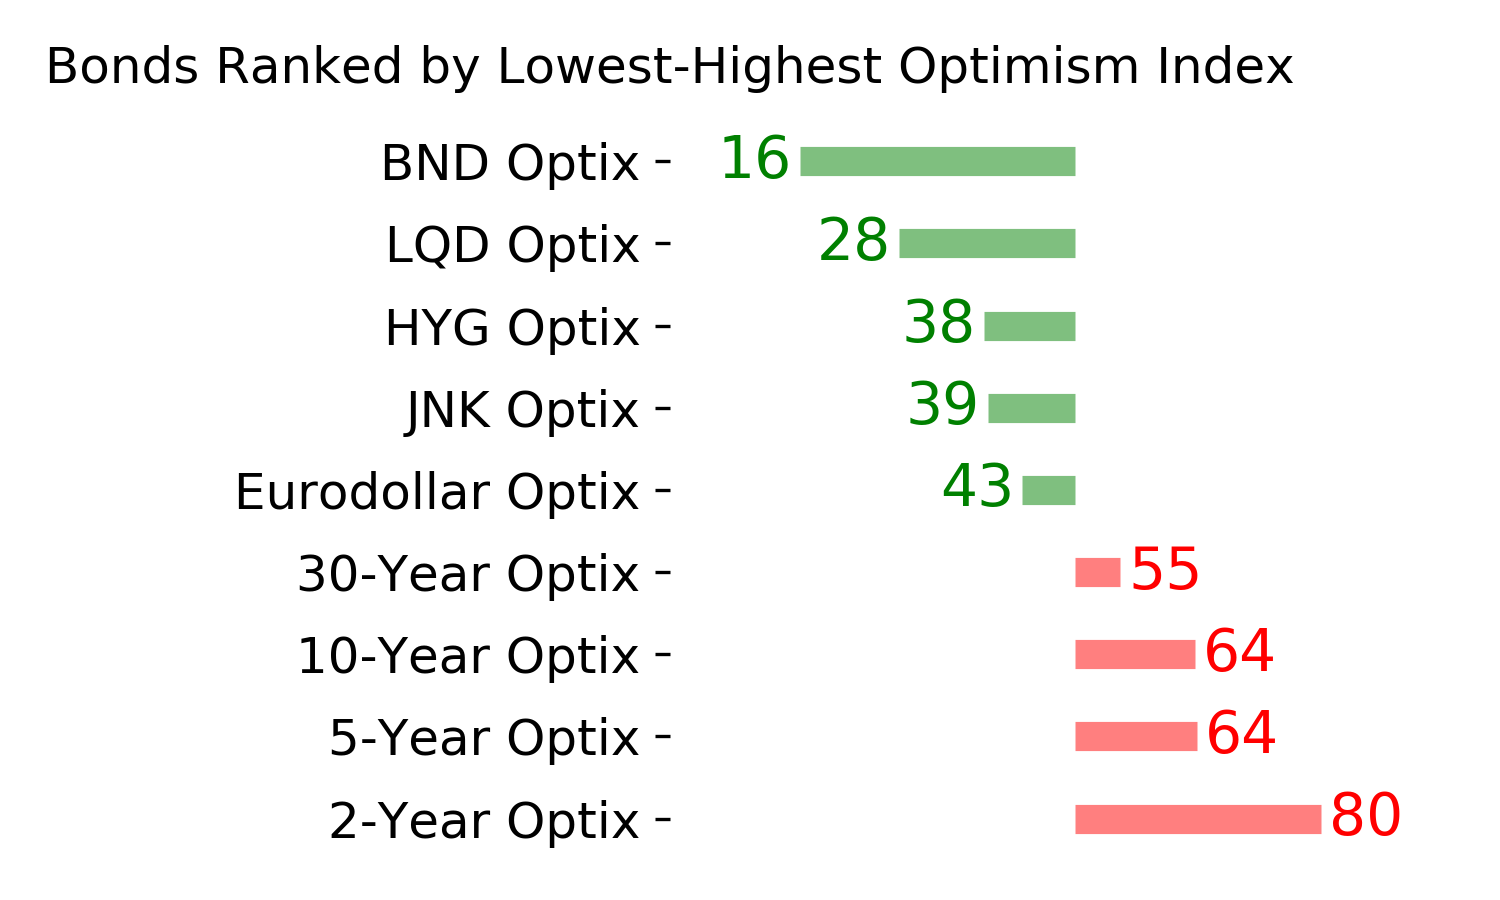
Various parts of the market got hit in March, with the lowest Bond Optimism Index we usually see during healthy environments. Bond prices have modest recovered and there is no edge among the data we follow. GOLD: Hold
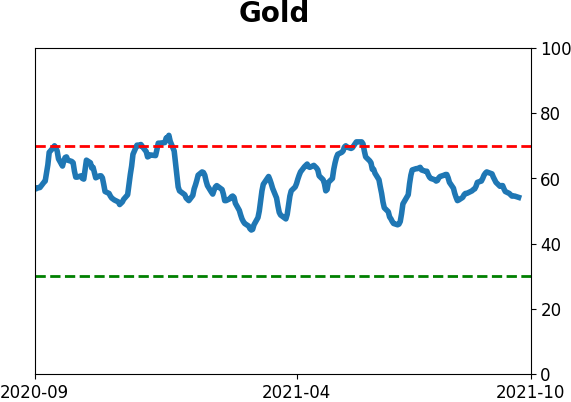
Gold and miners were rejected after trying to recover above their 200-day averages in May. Lately, some medium-term (not long-term) oversold extremes in breadth measures among miners have triggered.
|
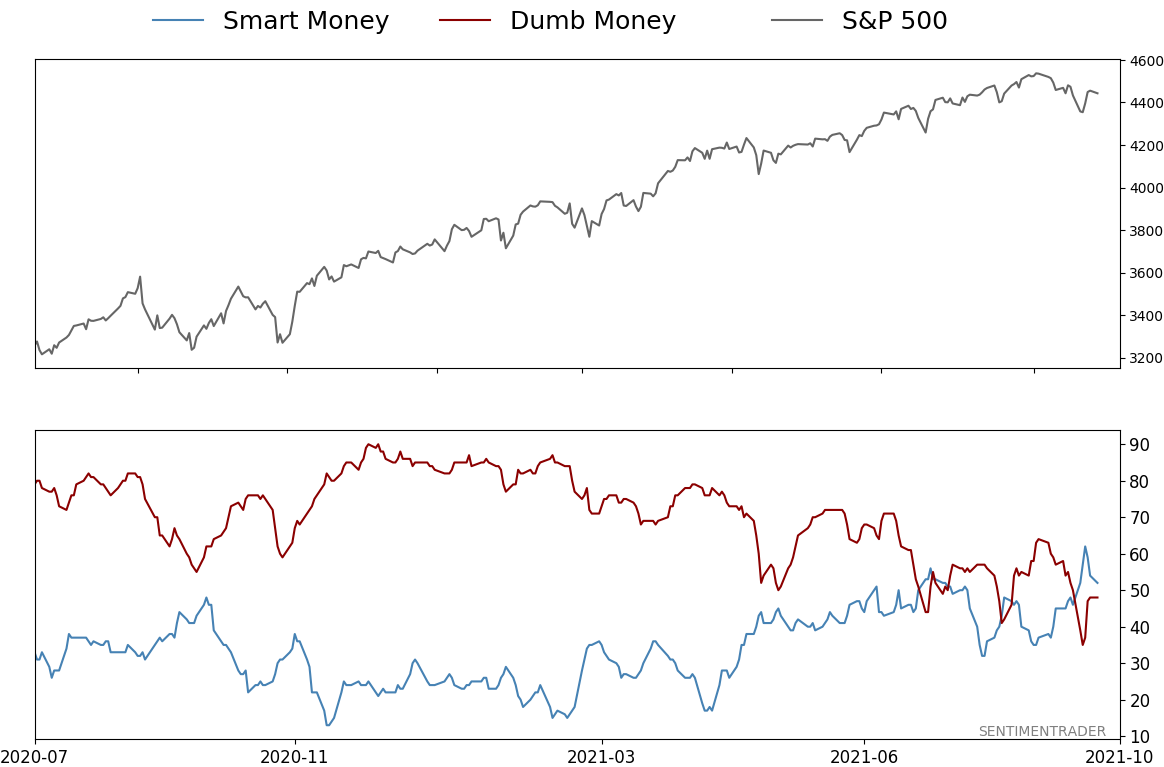
Smart / Dumb Money Confidence
|
Smart Money Confidence: 52%
Dumb Money Confidence: 48%
|
|
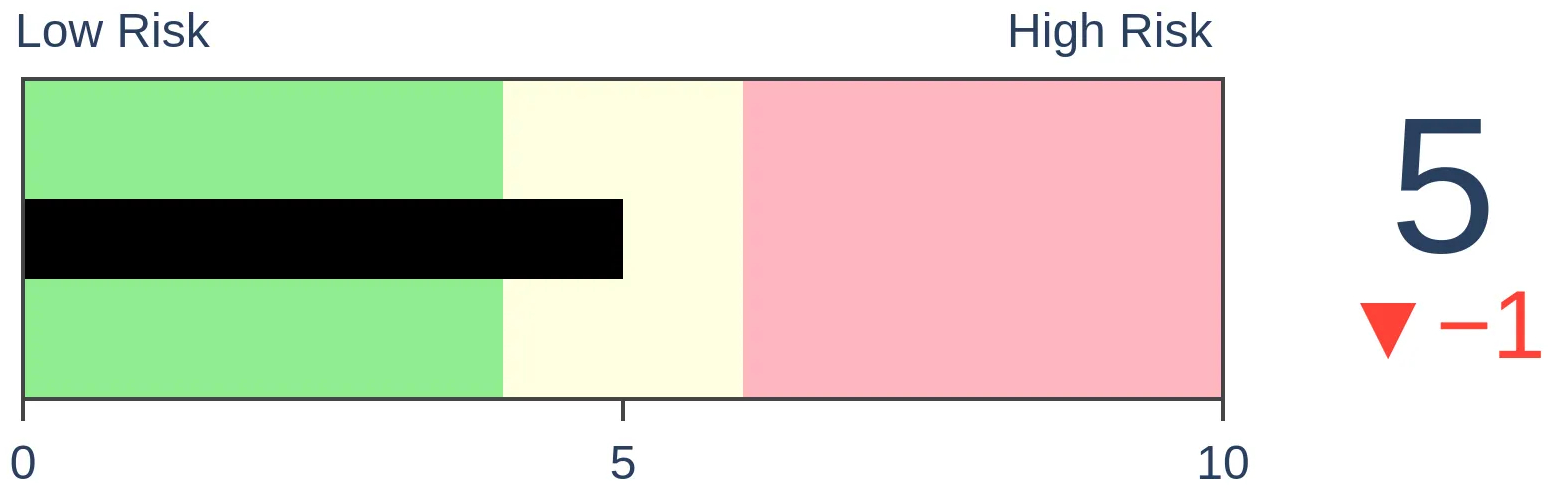
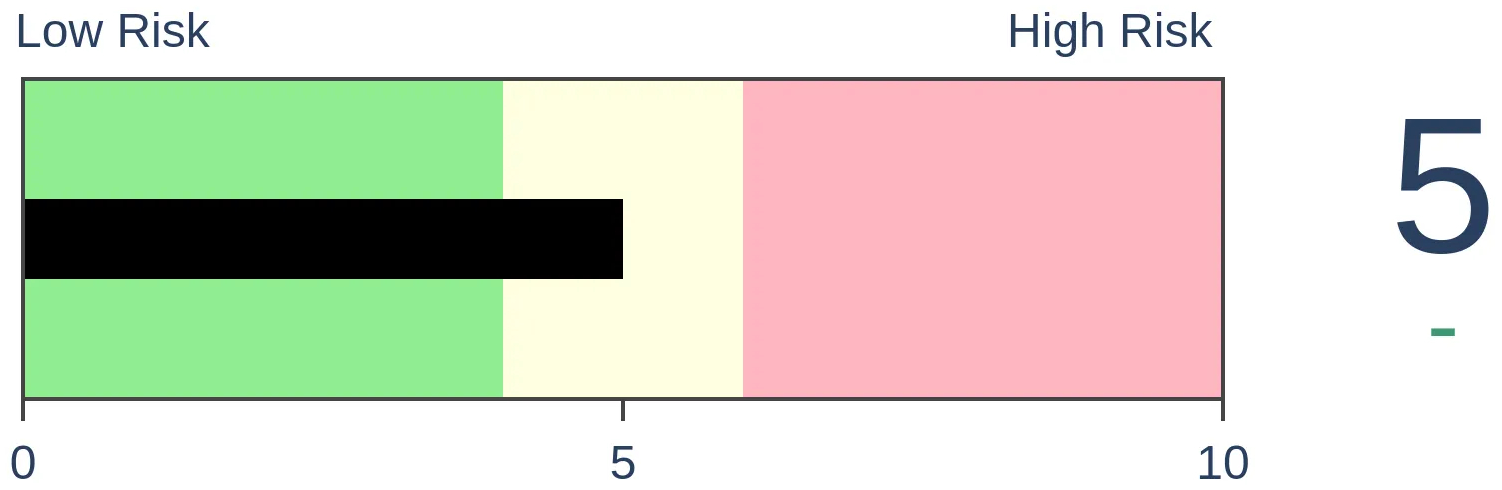
Risk Levels
Stocks Short-Term
|
Stocks Medium-Term

|
|
Bonds

|
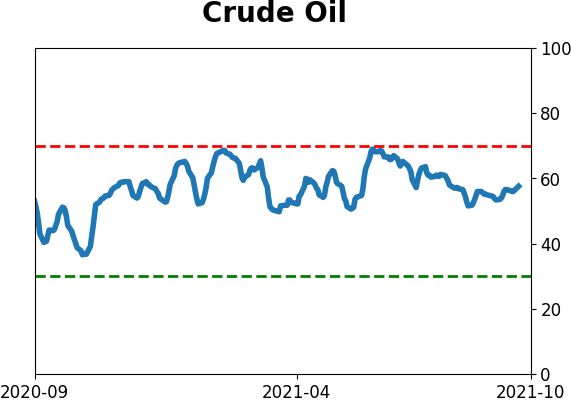
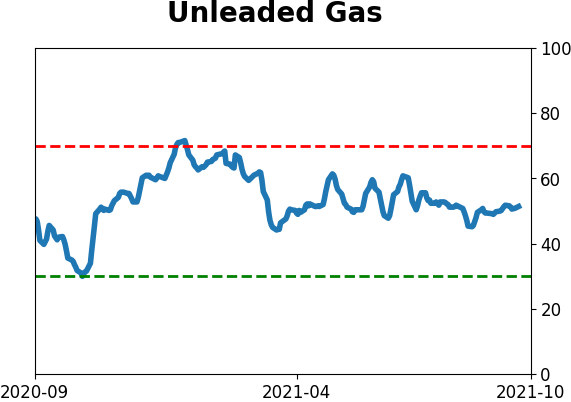
Crude Oil

|
|
Gold
|
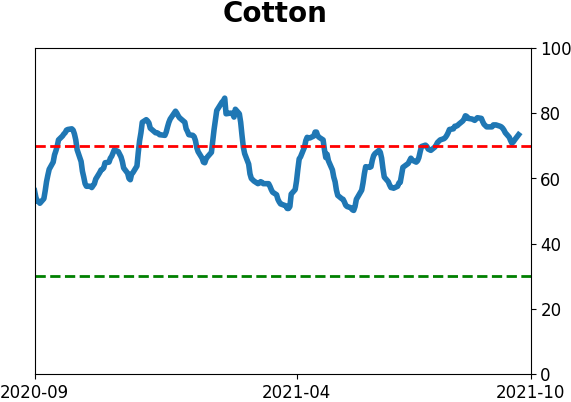
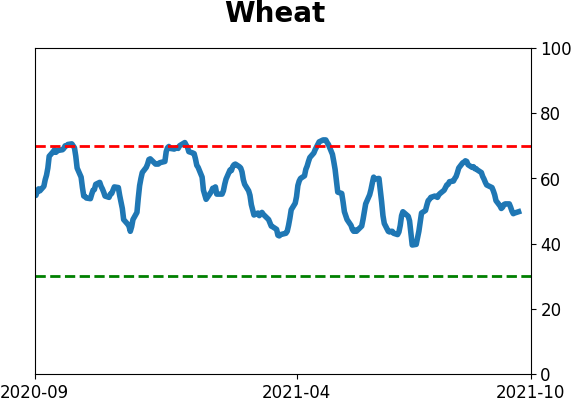
Agriculture
|
|
Research
By Jason Goepfert
BOTTOM LINE
Small traders pulled back on their speculation options activity last week. Overall options activity was among the least optimistic since the initial thrust off the pandemic low. If we're still in the same kind of market environment, then this should be a good sign for stocks.
FORECAST / TIMEFRAME
SPY -- Up, Medium-Term
|
In January and February, sentiment was driven to a frenzy, primarily on the backs of wild-eyed options traders. YOLO mentality was in full effect, and options indicators were hitting records.
That didn't have much impact on the broader market. Even though tech stocks took a breather, and small-caps peaked for the year right about then, widely-followed indexes like the S&P 500 kept setting record highs. There was a rebound of speculative activity in June, and hedging activity all but disappeared. That's about when the NYSE Advance/Decline Line peaked, though yet again, it had no impact on the broader equity indexes.
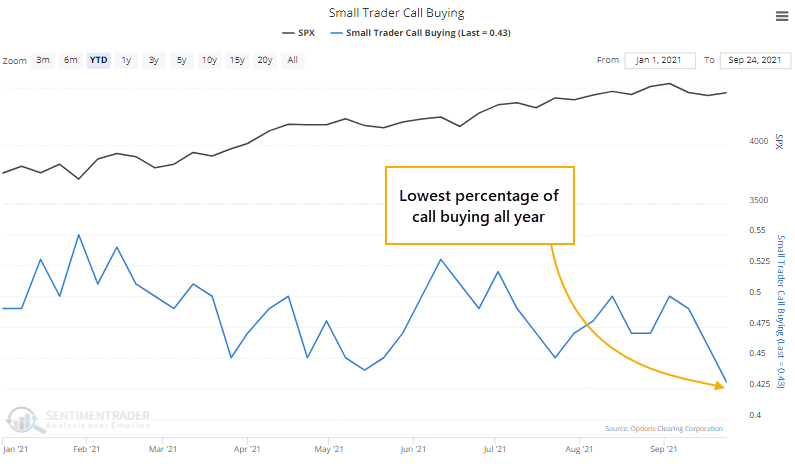
Deterioration under the surface of those indexes has dented investors' optimism, and many of the indicators we follow have moved back into neutral, or even slightly pessimistic, territory. Among options traders, that internal choppiness has led the smallest of traders to pull back significantly on their bullish bets.
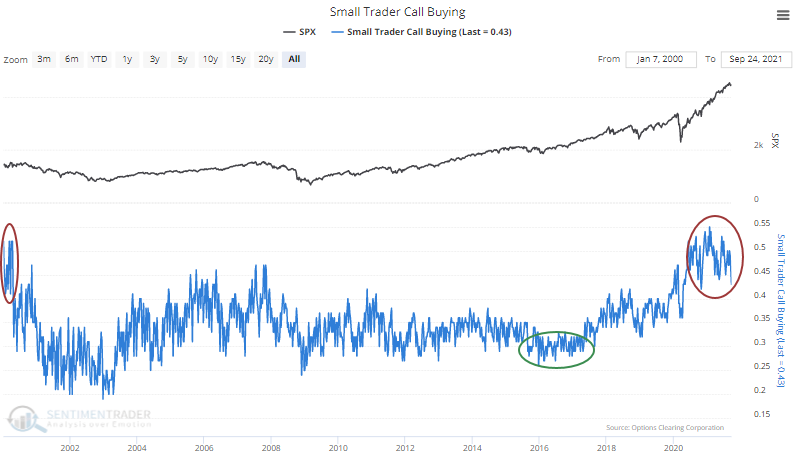
Last week, these small traders spent only 43% of their volume buying speculative call options to open. That's the least concentration on outright bullish bets so far in 2021.
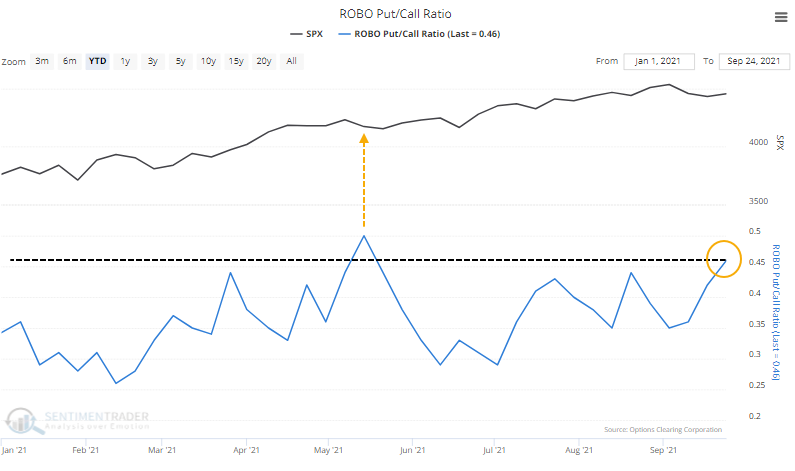
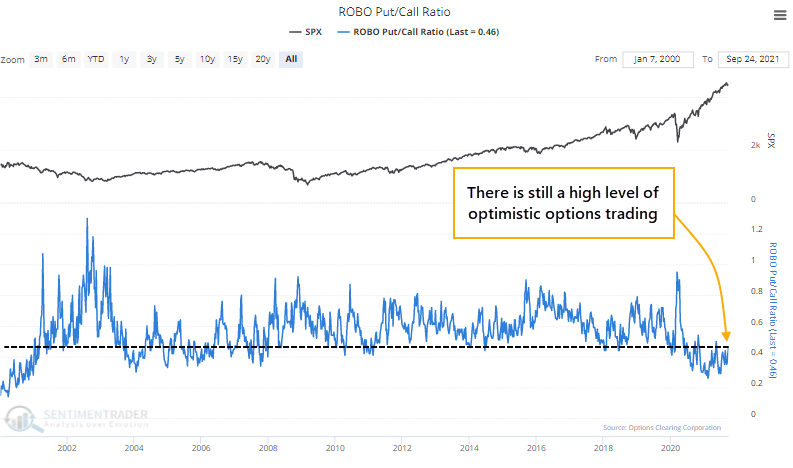
While less dramatic, they also increased their protective put buying. That caused the ROBO Put/Call Ratio to rise to the 2nd-highest level of the year, next to the week ending May 14.
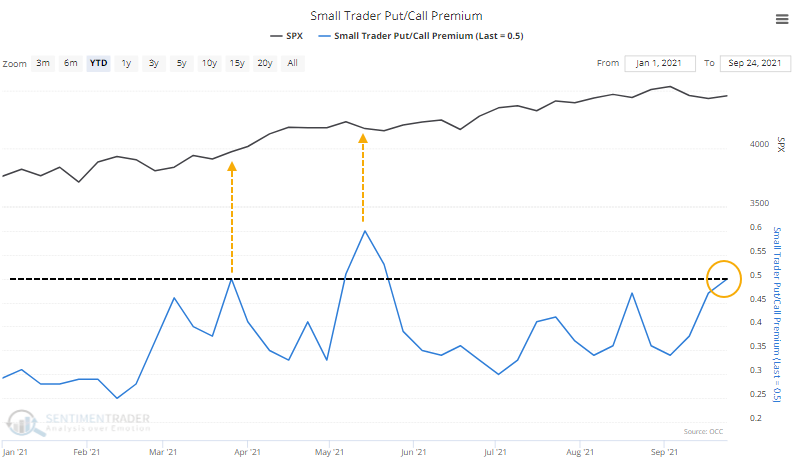
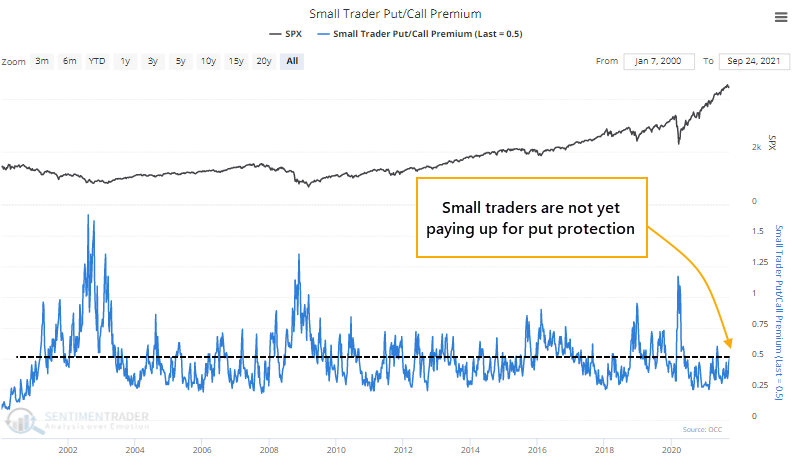
Due to a spike in implied volatility, they were also paying up a bit more for those put options relative to calls. The Small Trader Put/Call Premium indicator shows that they spent about half as much on puts as calls, the 3rd-highest ratio of the year.
So, based on very recent history, we could make an argument that speculative activity has been wrung out among the traders most likely to show emotional extremes, and that should be good for stocks going forward. If we're still in the same environment that we've been in all year, then sure, that's valid.
STILL IN A HISTORICALLY SPECULATIVE ENVIRONMENT
While it hasn't seemed to matter one whit, we should at least zoom out and put this year in perspective. There has been no year like this since 1999 when small traders were buying so many speculative call options, so persistently. It's been the exact opposite from 2016 when small traders had no interest in buying calls after a choppy 2015.
This focus on call buying and aversion to wasting money on put protection has caused the ROBO ratio to be mired in its lowest range since 2000. Even the uptick last week barely registers on the long-term chart.
And that rise in money they've shelled out for puts in recent weeks is tiny compared to past evidence of real pessimism. When these traders have spent at least 75% as much on puts as calls, it indicated high pessimism; when they spent more on puts than calls, they were in outright panic mode. We're far from anything like that.
AMONG THE FEWEST BULLISH BETS IN 15 MONTHS
Looking at the broader universe of traders, the Options Speculation Index (OSI) shows us that there was only 30% more volume in bullish options strategies than bearish strategies last week. That's among the lowest levels since the initial recovery from the pandemic panic last spring.
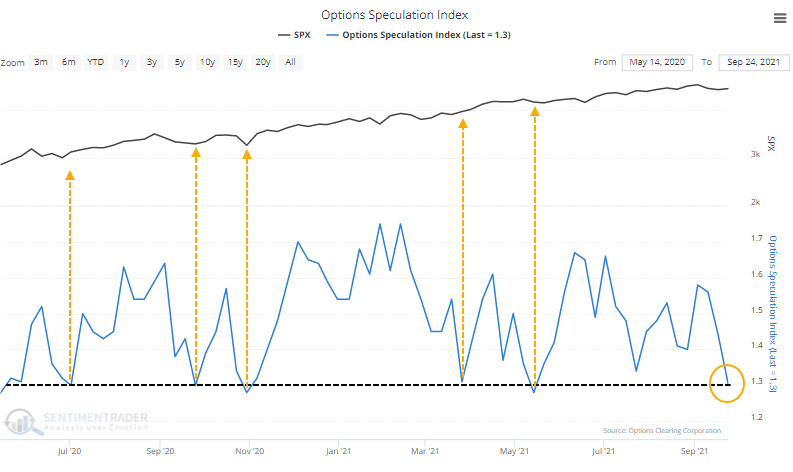
Again, if we zoom out to the full history, we see that the current level is nowhere near pessimism. We're only talking about the post-pandemic free-for-all here. And if we're still in that kind of environment, then risk in the weeks ahead is small. The table below shows the S&P 500's returns in the days and weeks following an OSI reading below 1.35 since June 2020.
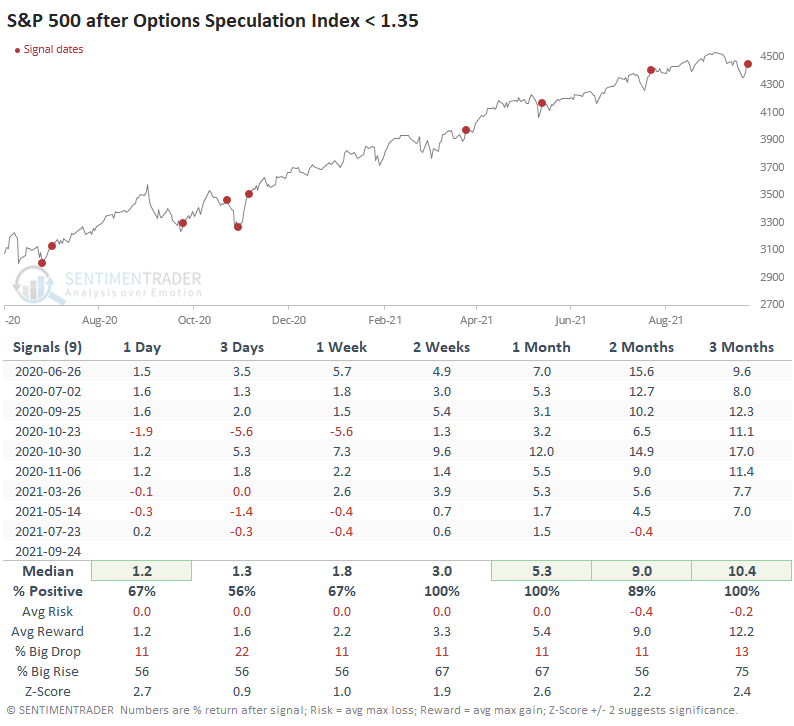
Clearly, it's been a good idea to bet against options traders' "pessimism", with only one real loss of any magnitude, and that was quickly erased. The Risk/Reward Table shows just how little risk buyers suffered at any point by fading this relative pessimism.
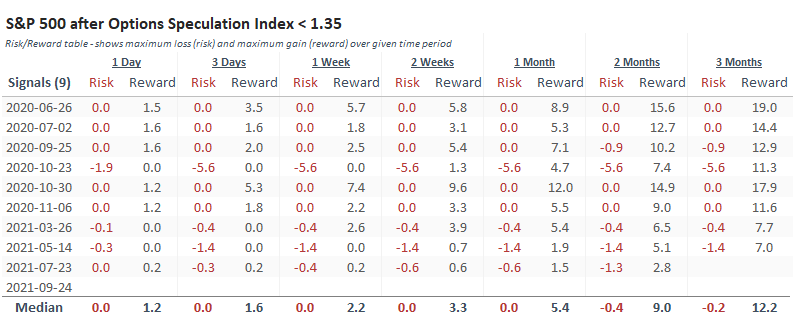
The suggestion would be that if we're still in the post-pandemic lala land, then we should expect higher stock prices pretty much immediately. There was an ounce of pessimism evident last week, and since the thrust from the spring 2020 low, that's been all that's required to bring in bargain hunters and drive the indexes to new highs.
As always, what we're more interested in looking for is deviations from recent behavior. Based on that table above, almost any loss of more than 1% over any time frame would be the first hint that something has changed.
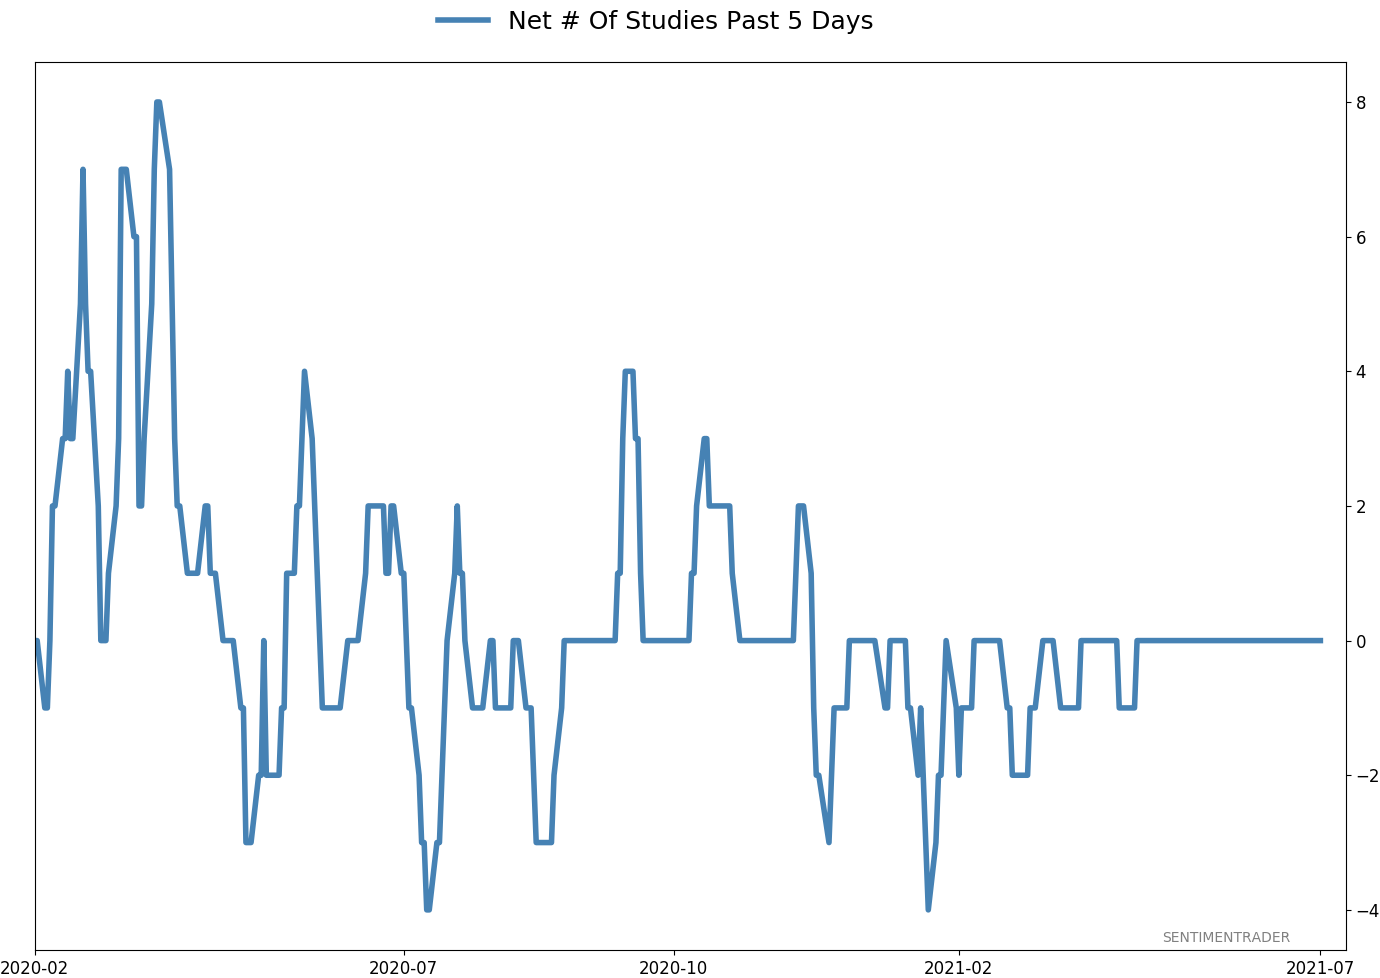
Active Studies
| Time Frame | Bullish | Bearish | | Short-Term | 0 | 6 | | Medium-Term | 8 | 3 | | Long-Term | 11 | 5 |
|
Indicators at Extremes
Portfolio
| Position | Description | Weight % | Added / Reduced | Date | | Stocks | RSP | 4.1 | Added 4.1% | 2021-05-19 | | Bonds | 23.9% BND, 6.9% SCHP | 30.7 | Reduced 7.1% | 2021-05-19 | | Commodities | GCC | 2.6 | Reduced 2.1%
| 2020-09-04 | | Precious Metals | GDX | 5.6 | Reduced 4.2% | 2021-05-19 | | Special Situations | 4.3% XLE, 2.2% PSCE | 7.6 | Reduced 5.6% | 2021-04-22 | | Cash | | 49.4 | | |
|
Updates (Changes made today are underlined)
Much of our momentum and trend work has remained positive for several months, with some scattered exceptions. Almost all sentiment-related work has shown a poor risk/reward ratio for stocks, especially as speculation drove to record highs in exuberance in February. Much of that has worn off, and most of our models are back toward neutral levels. There isn't much to be excited about here. The same goes for bonds and even gold. Gold has been performing well lately and is back above long-term trend lines. The issue is that it has a poor record of holding onto gains when attempting a long-term trend change like this, so we'll take a wait-and-see approach. RETURN YTD: 8.9% 2020: 8.1%, 2019: 12.6%, 2018: 0.6%, 2017: 3.8%, 2016: 17.1%, 2015: 9.2%, 2014: 14.5%, 2013: 2.2%, 2012: 10.8%, 2011: 16.5%, 2010: 15.3%, 2009: 23.9%, 2008: 16.2%, 2007: 7.8%
|
|
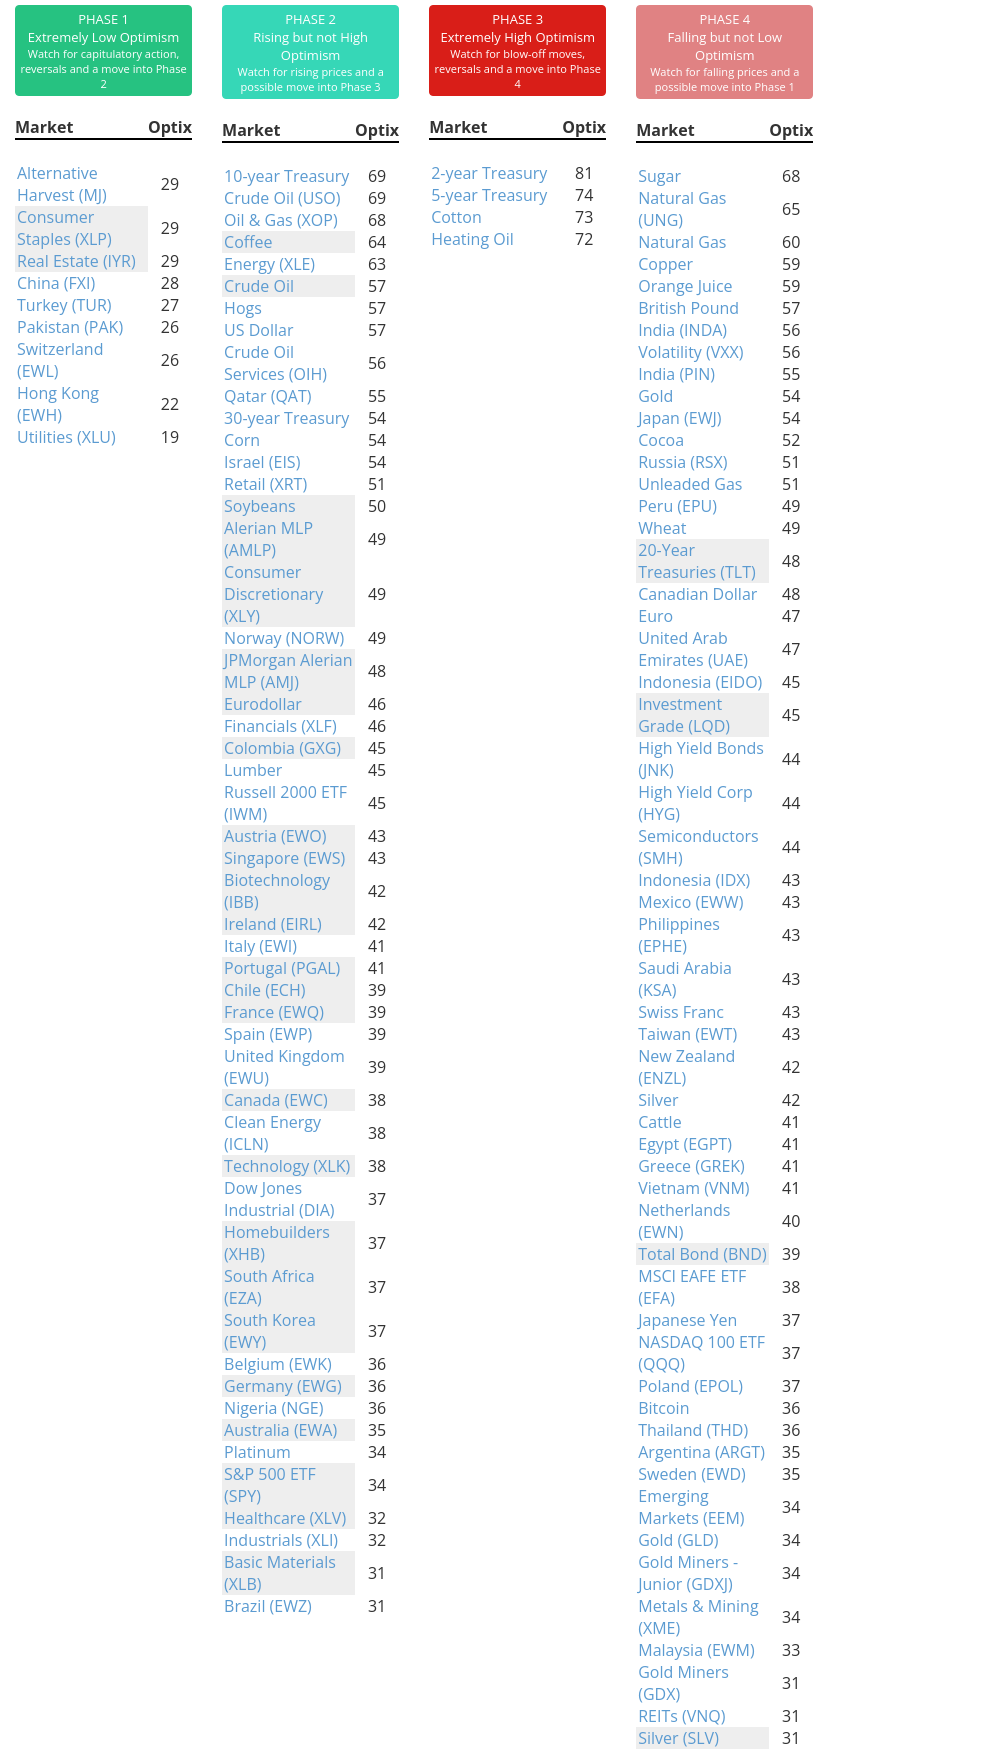
Phase Table
Ranks
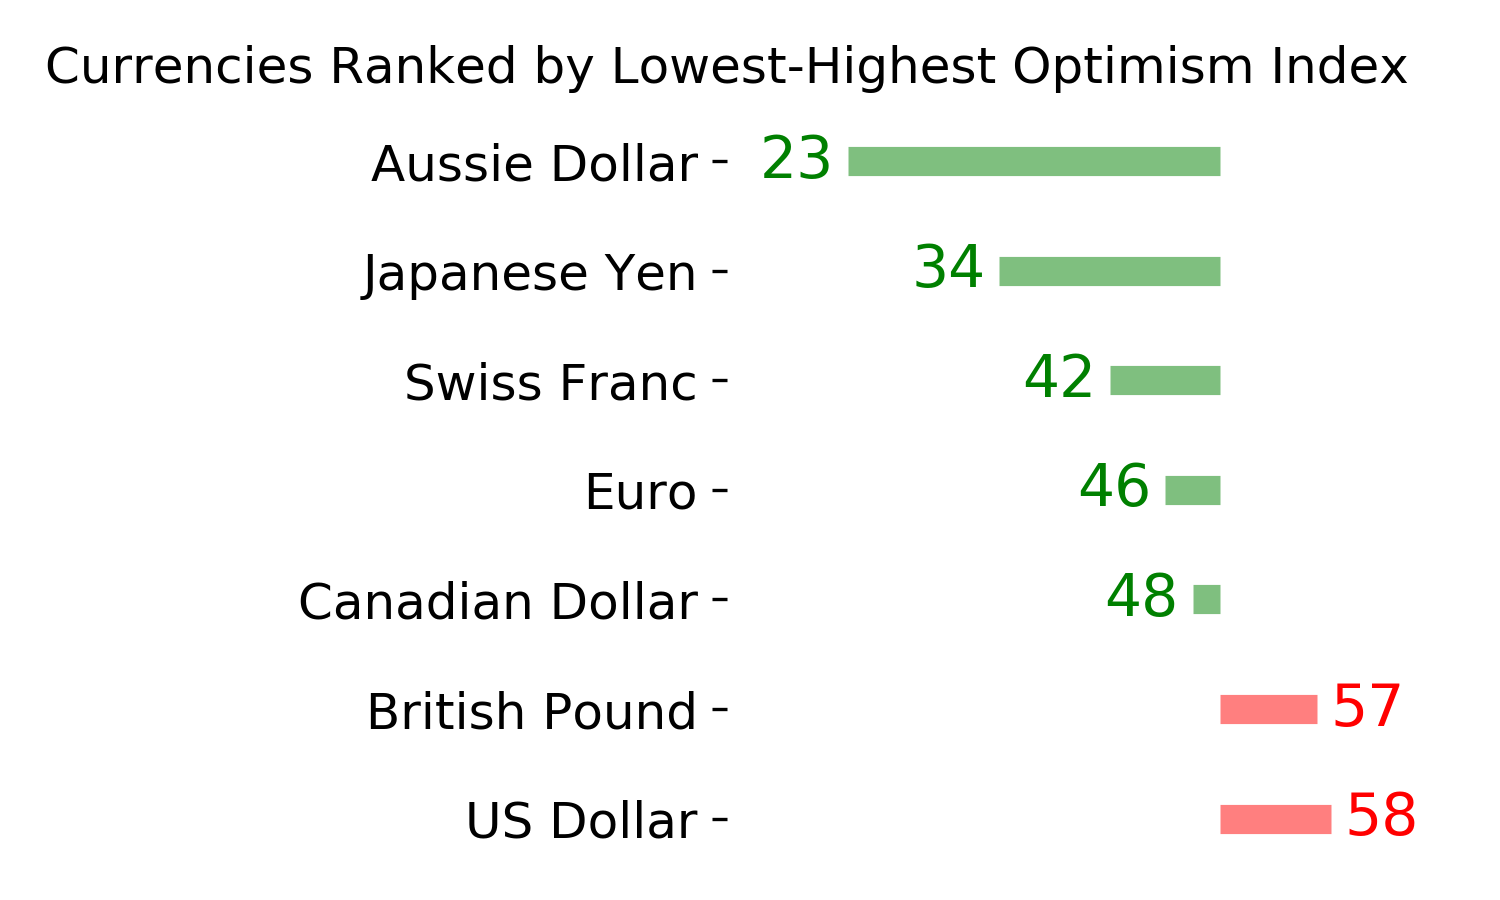
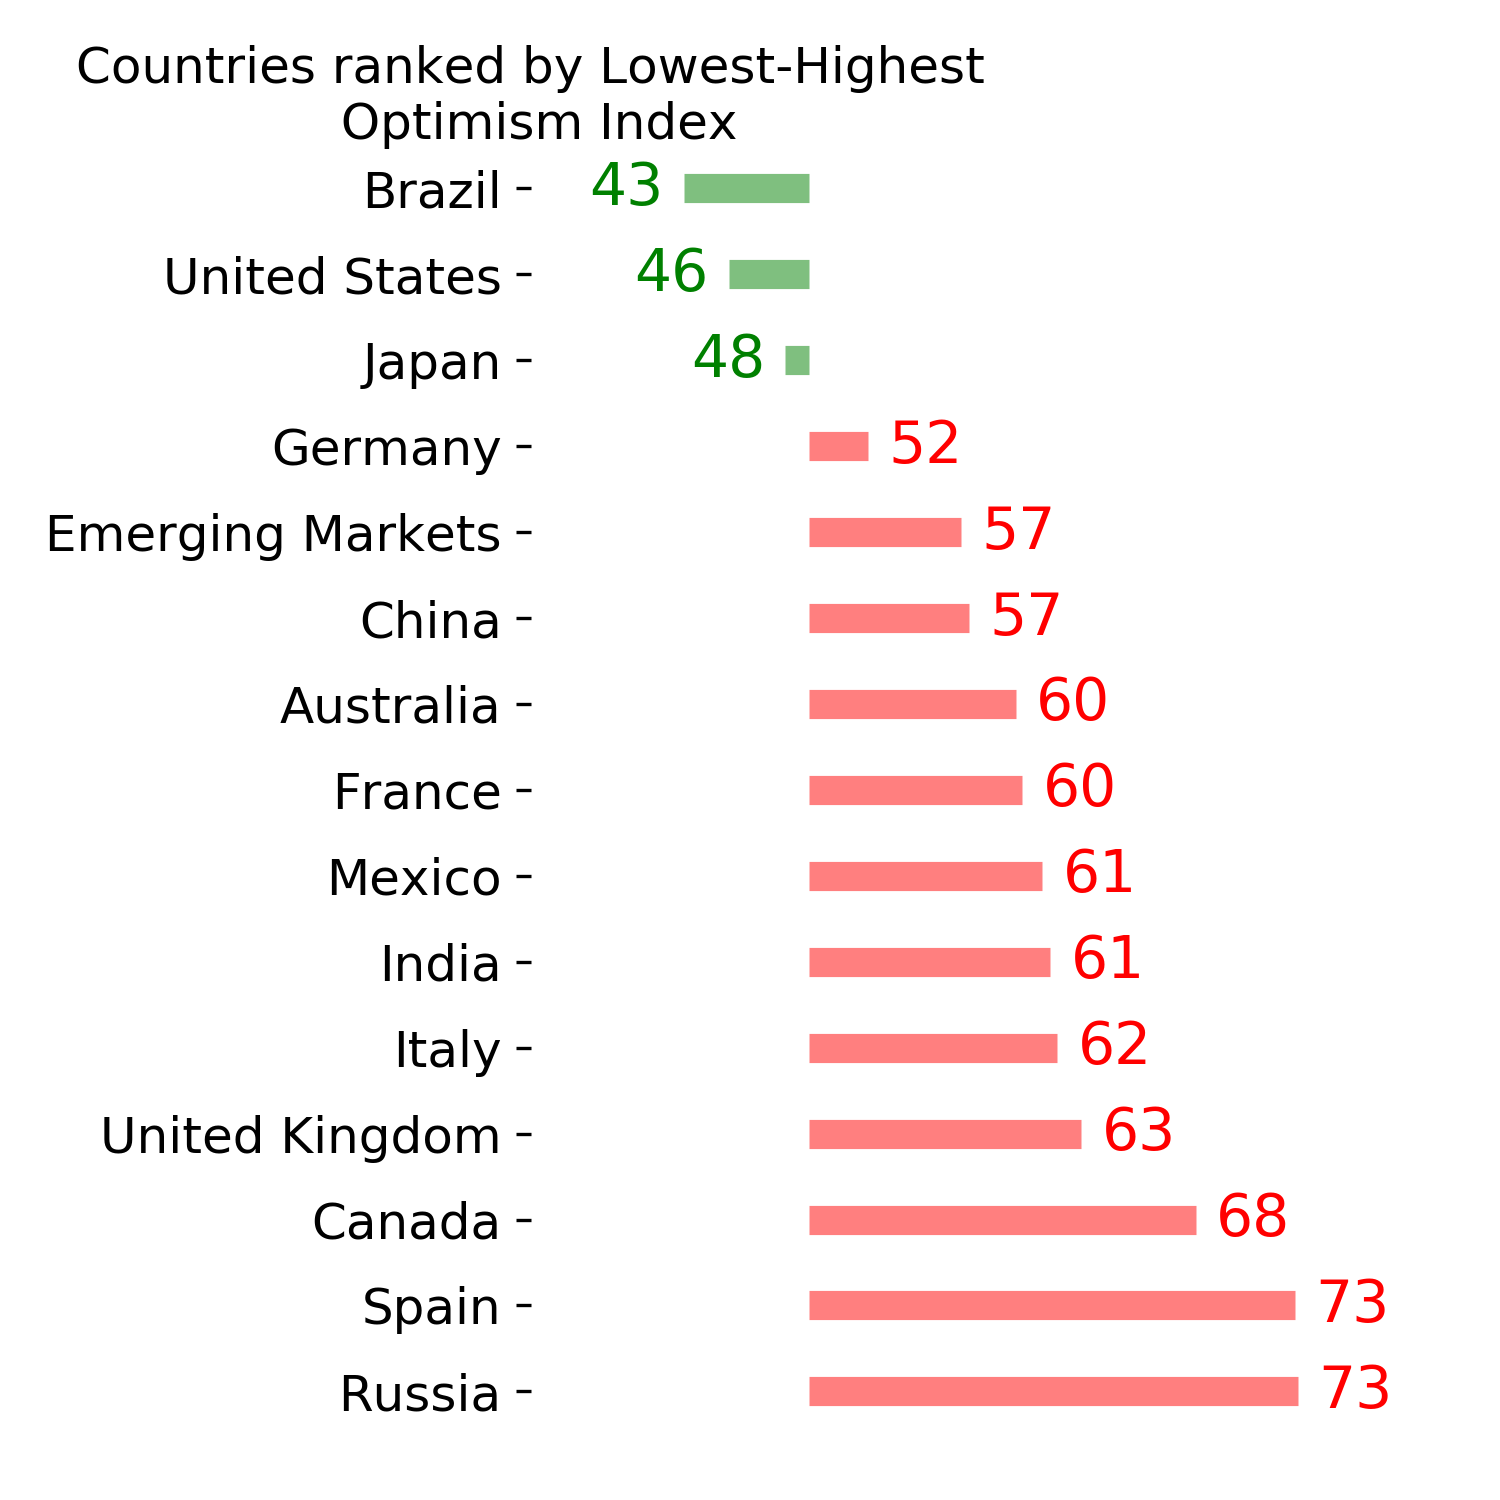
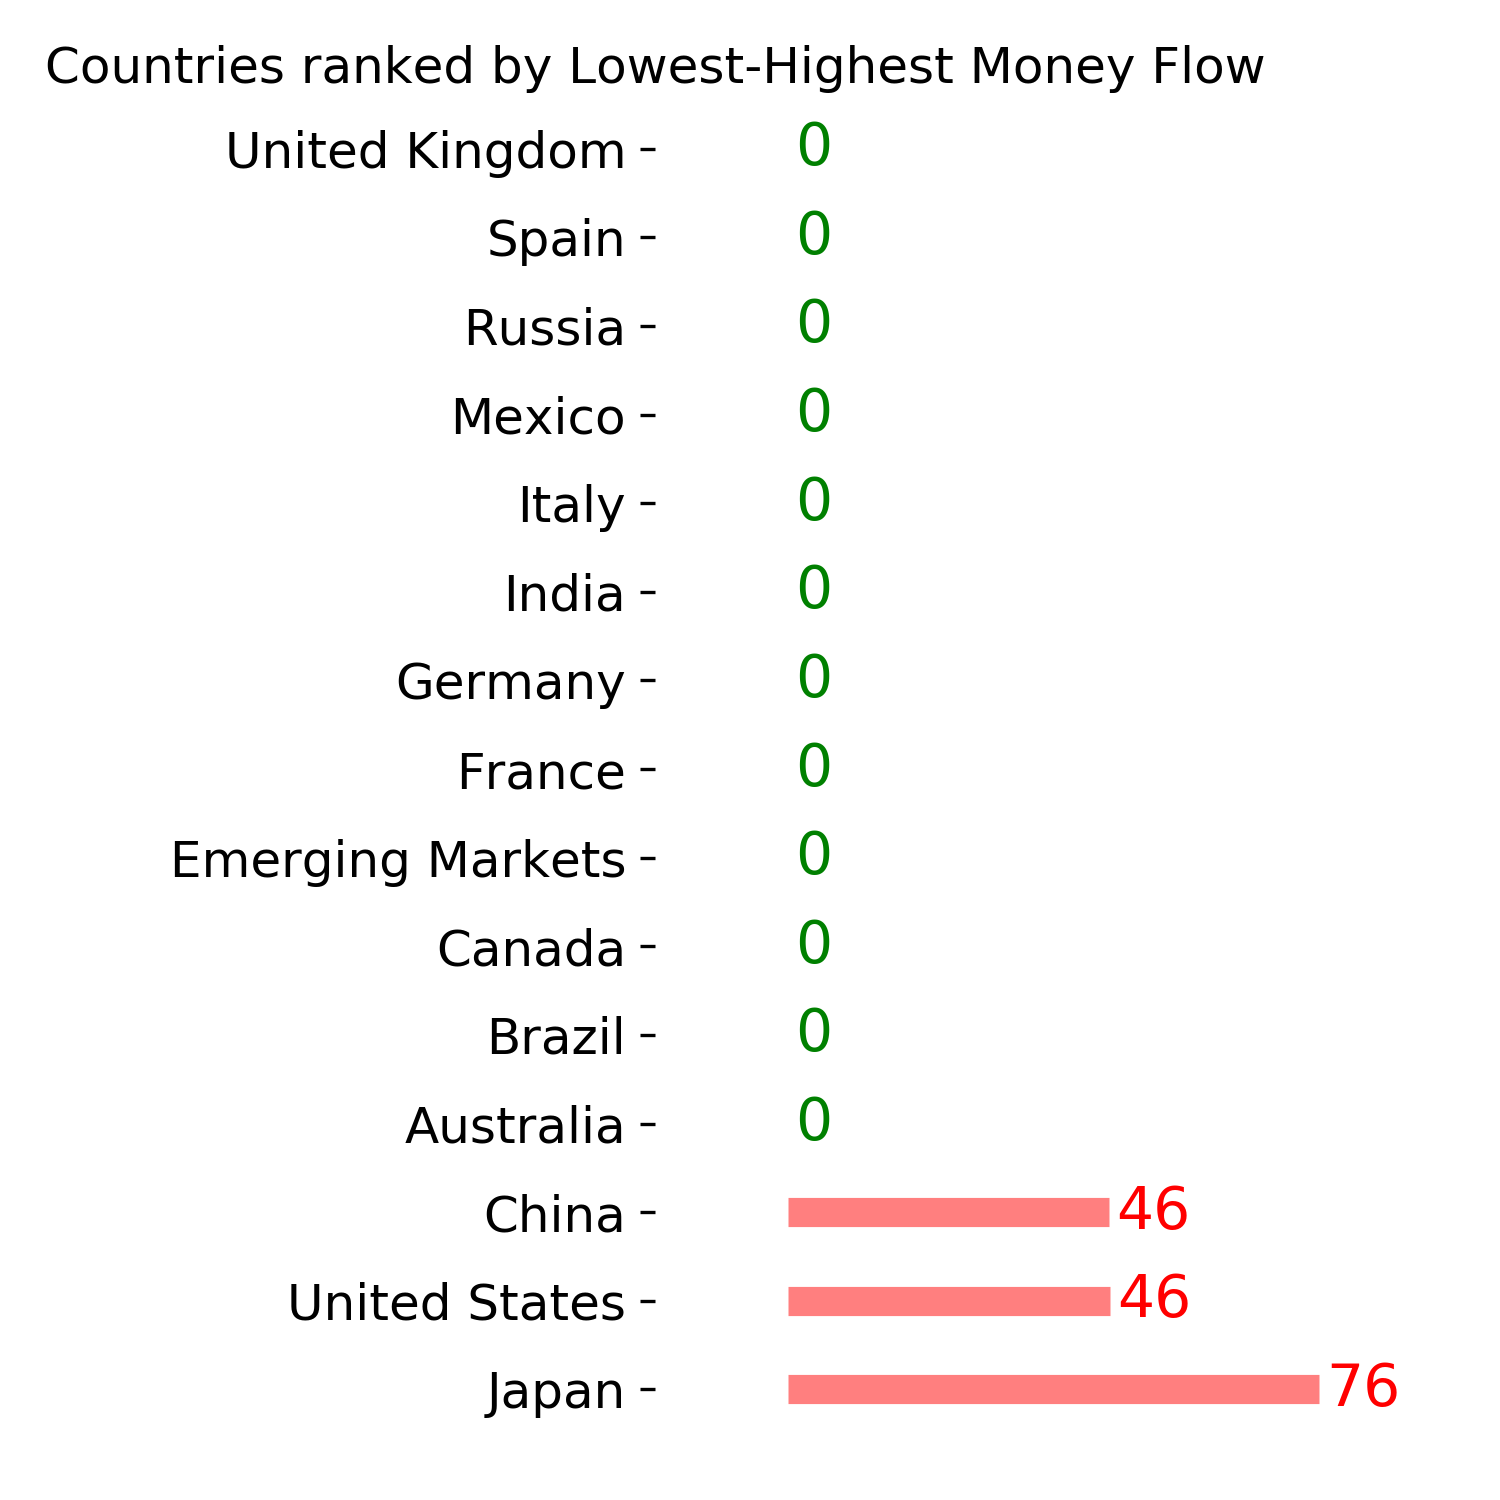
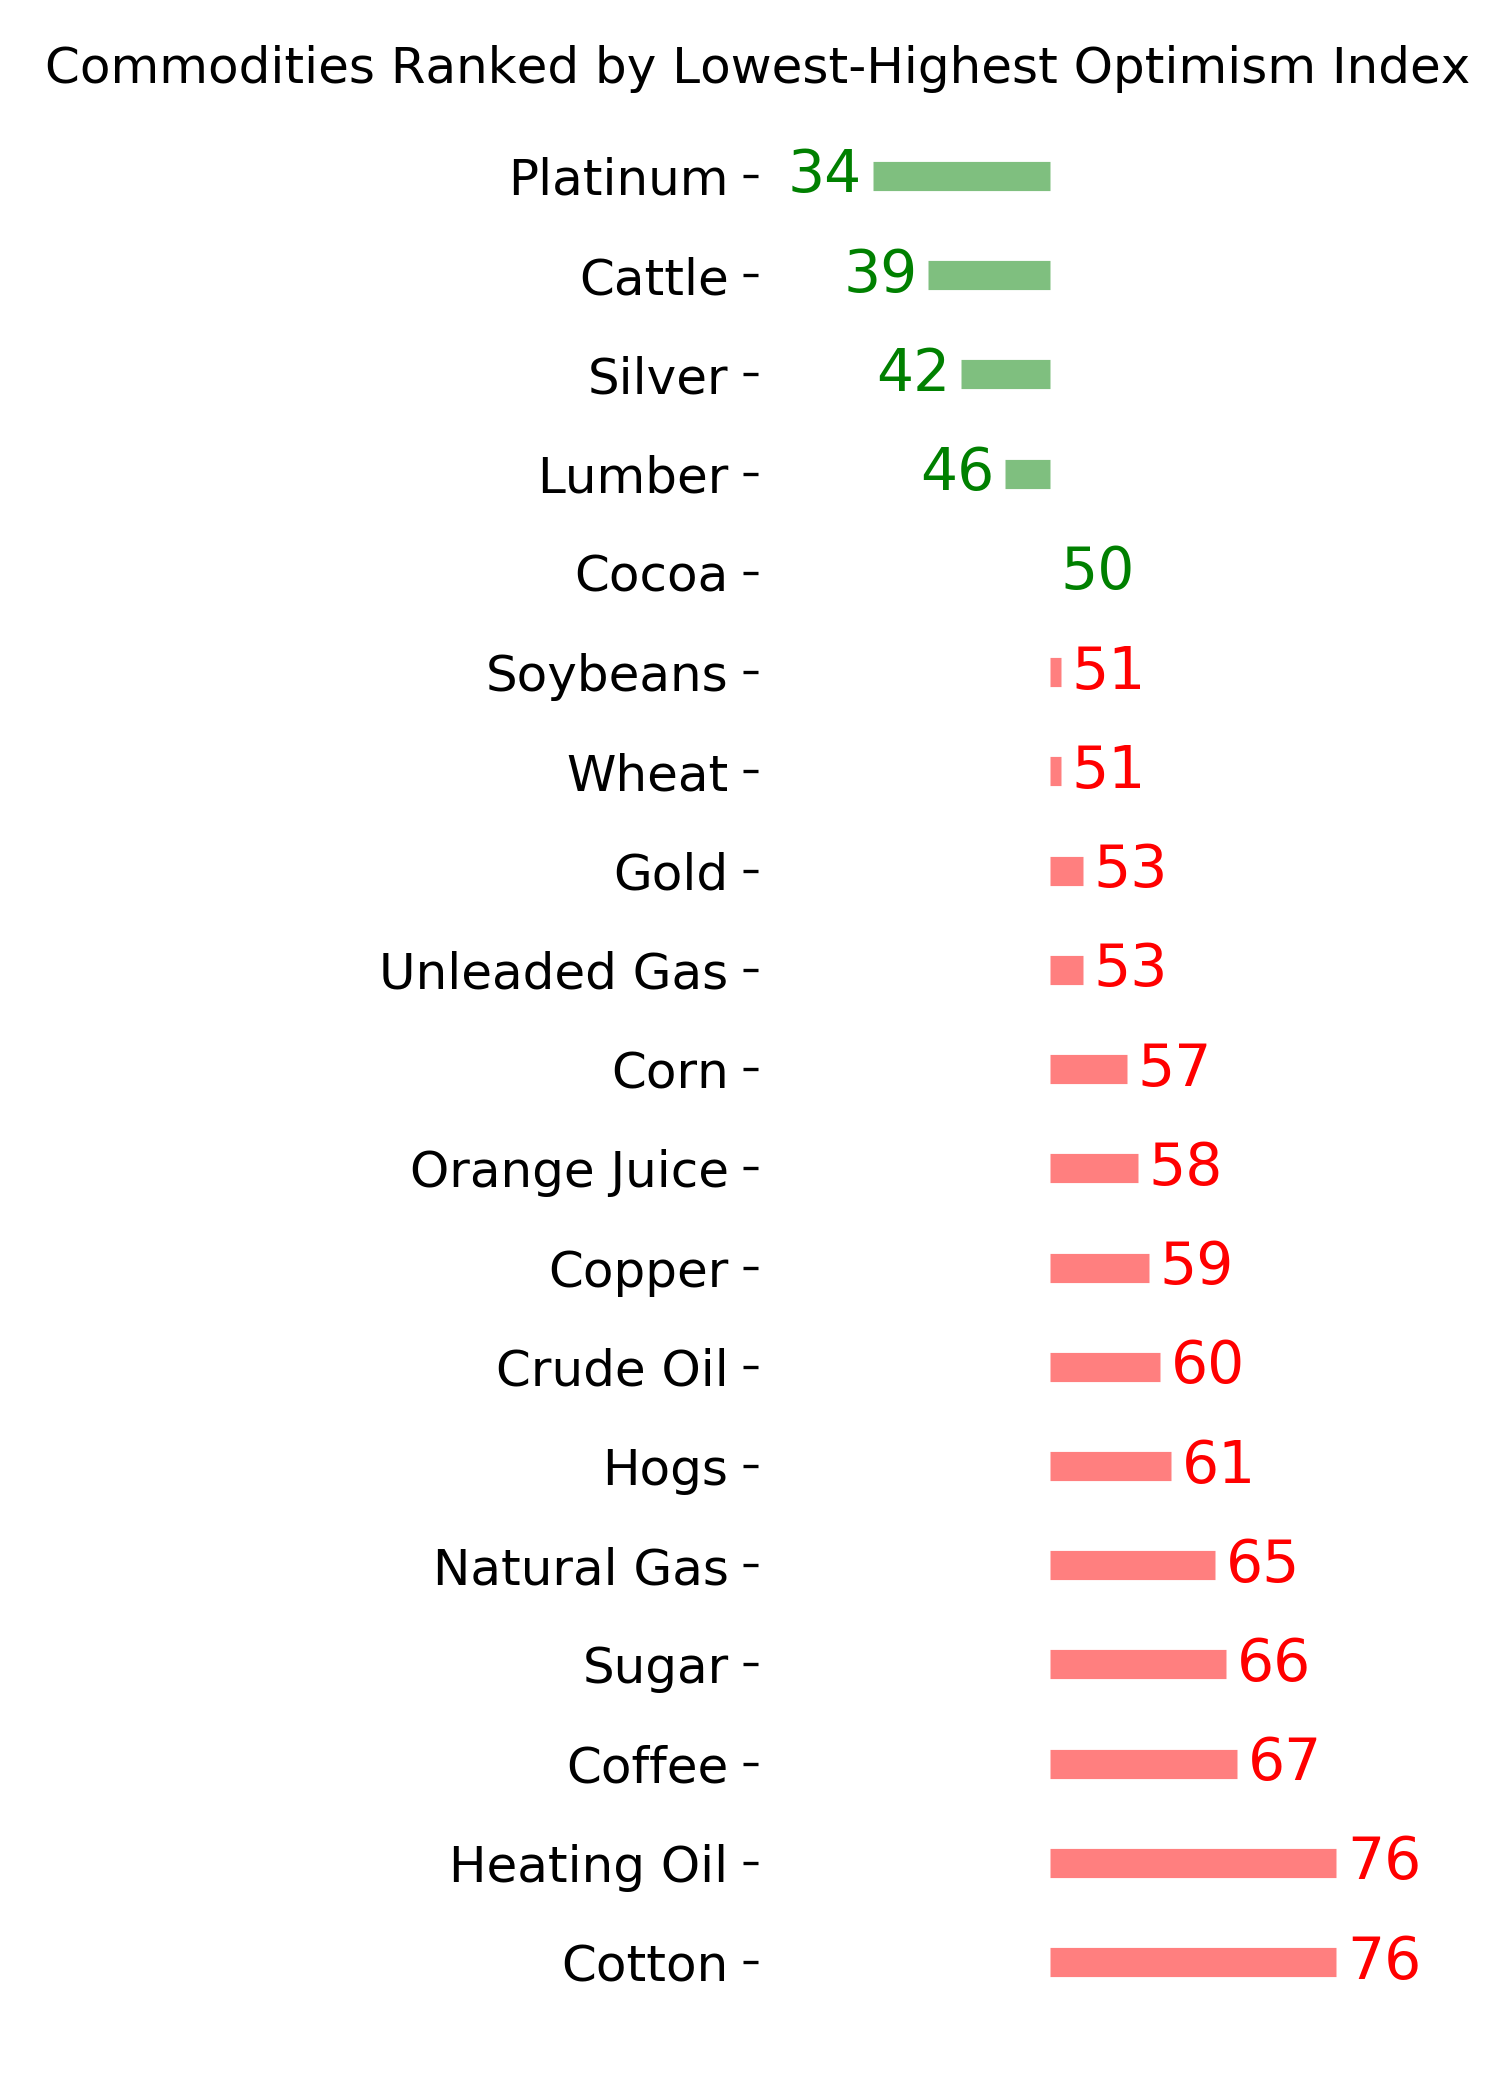
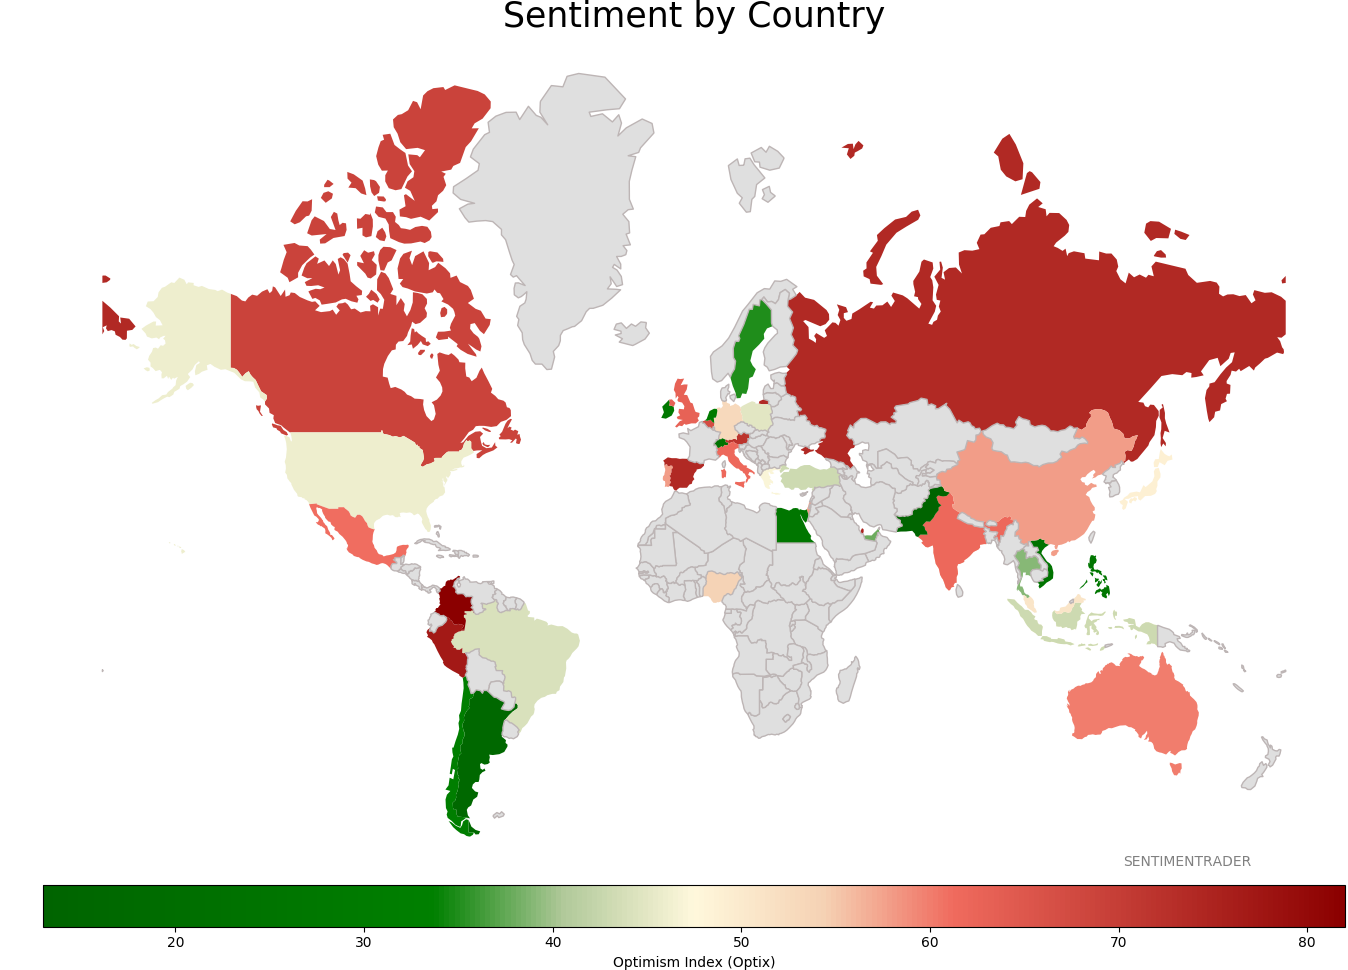
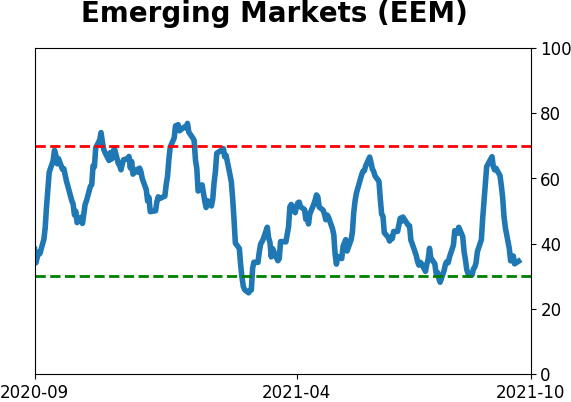
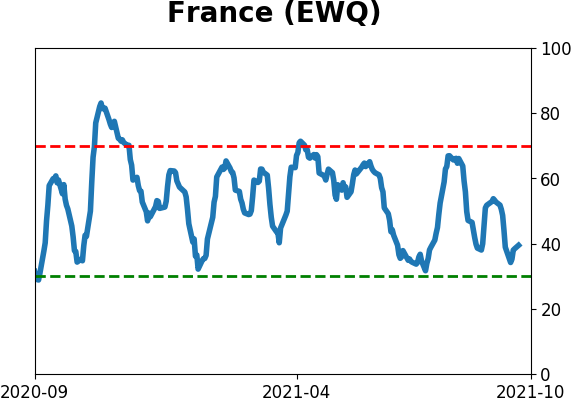
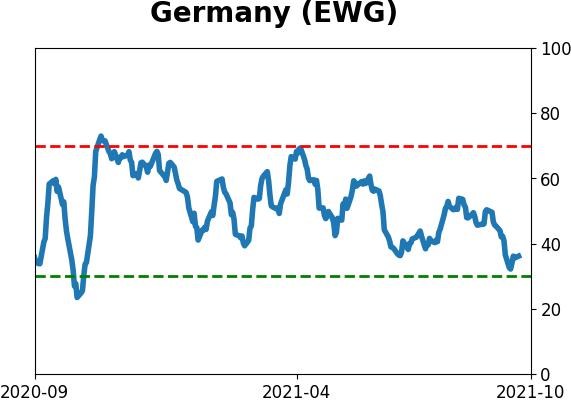
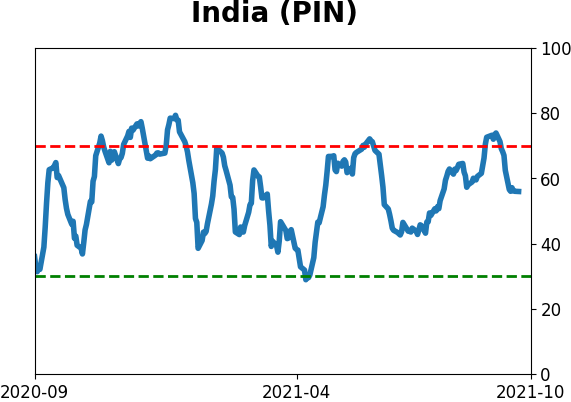
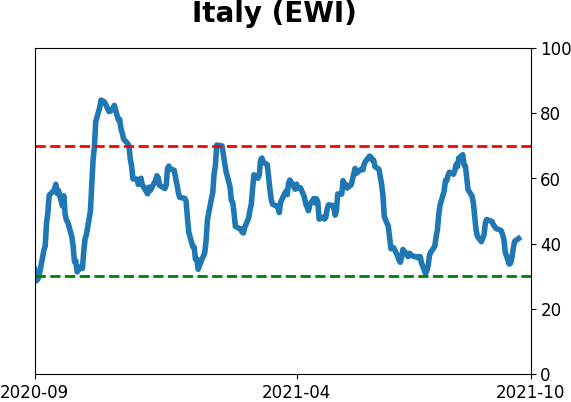
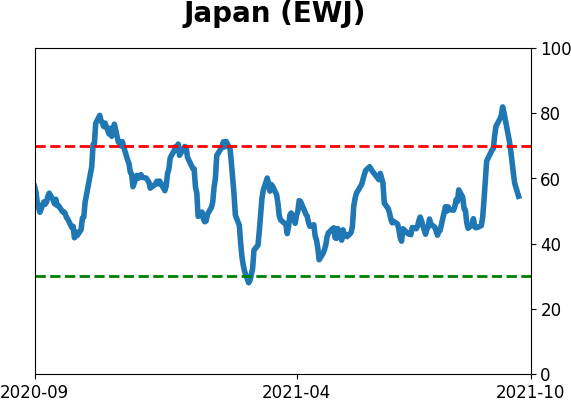
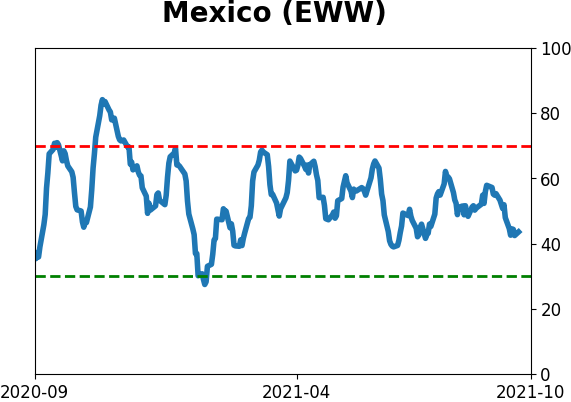
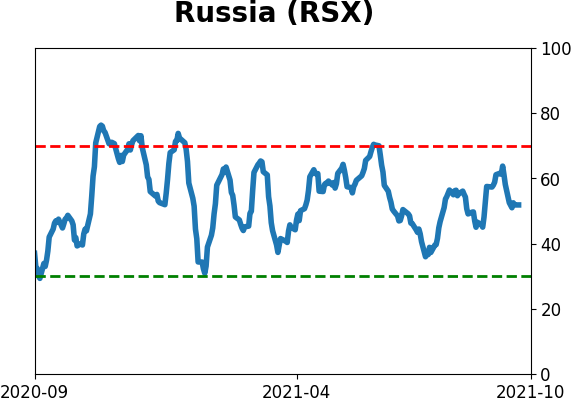
Sentiment Around The World
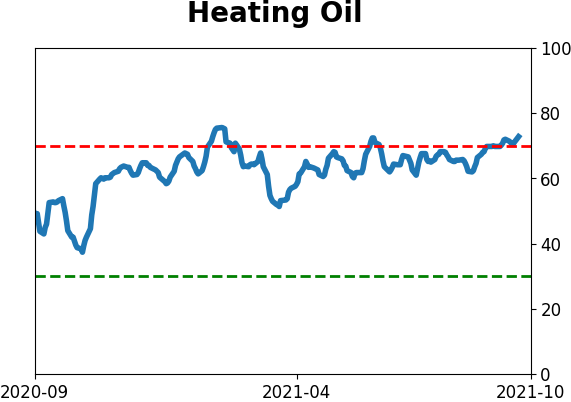
Optimism Index Thumbnails
|
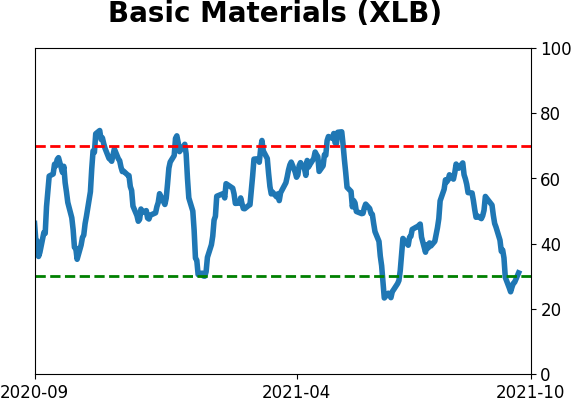
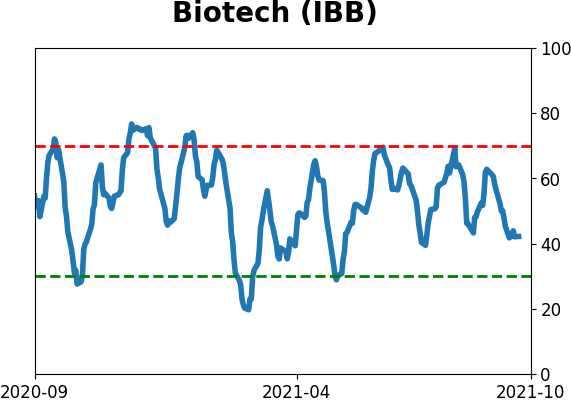
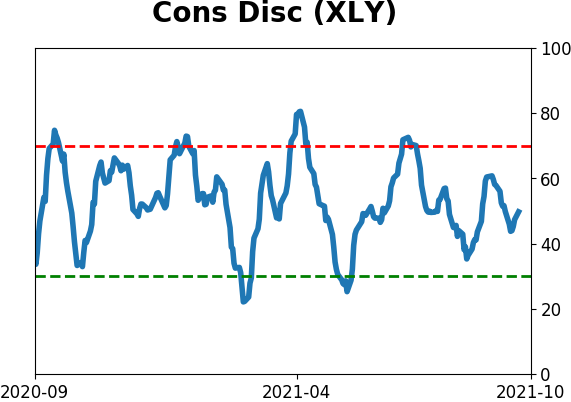
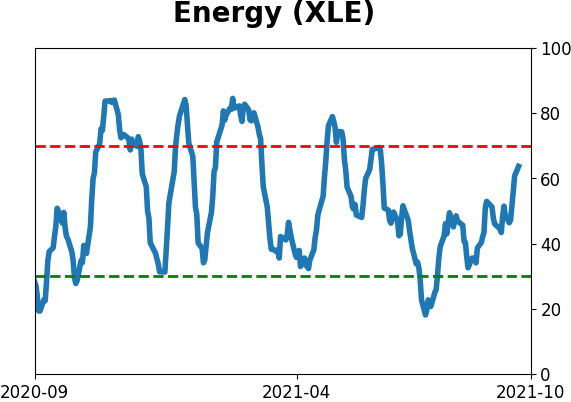
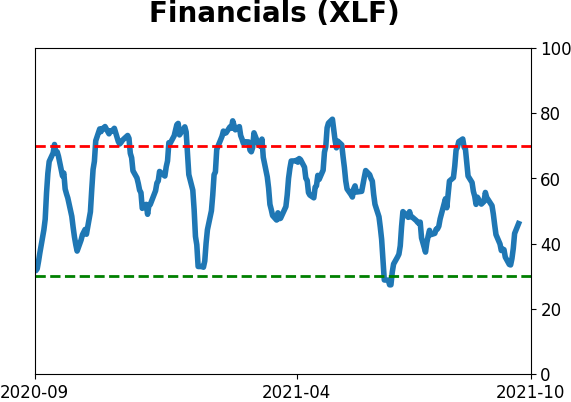
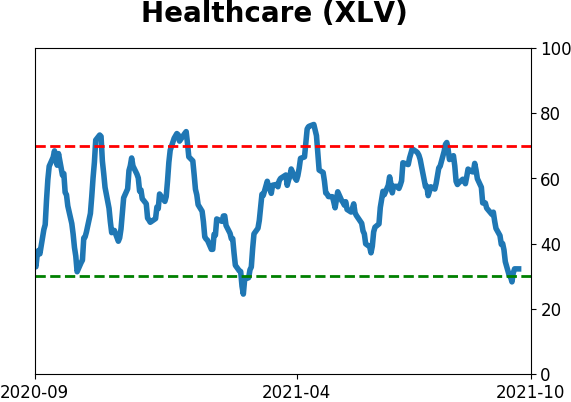
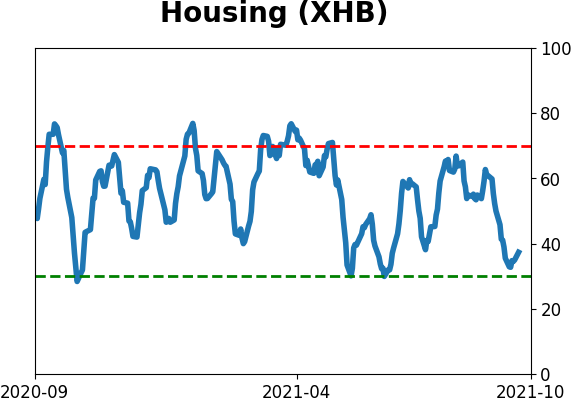
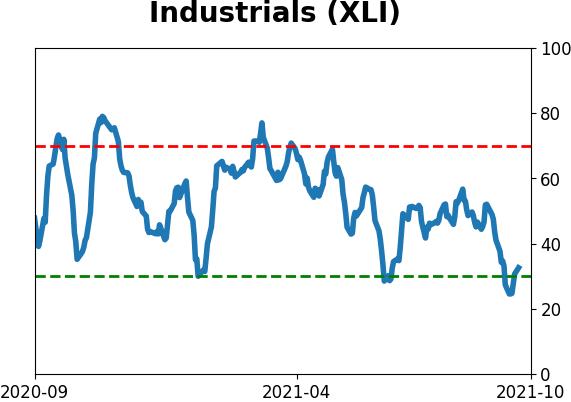
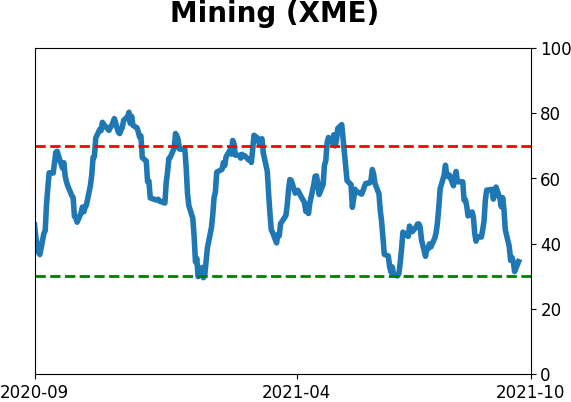
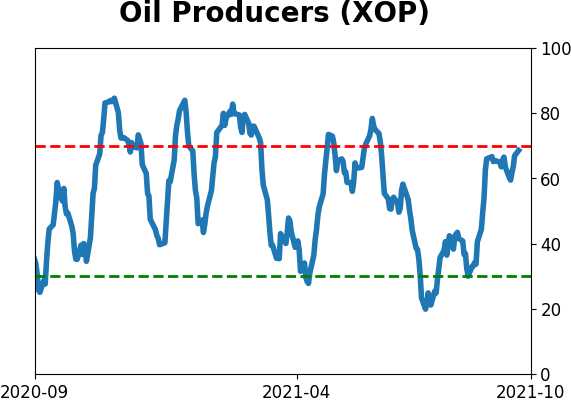
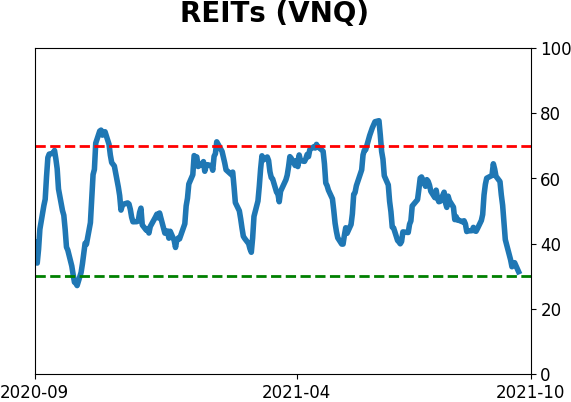
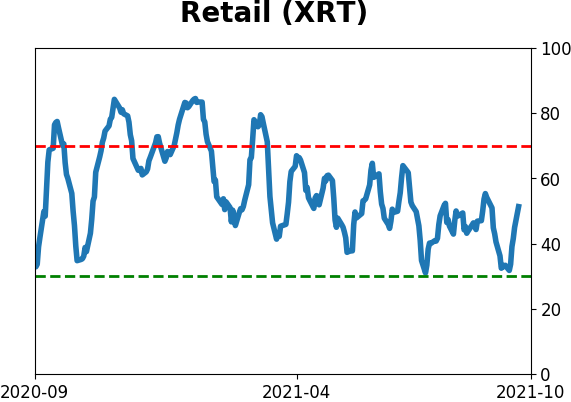
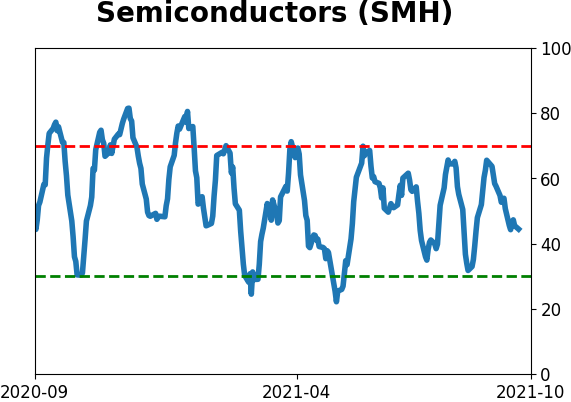
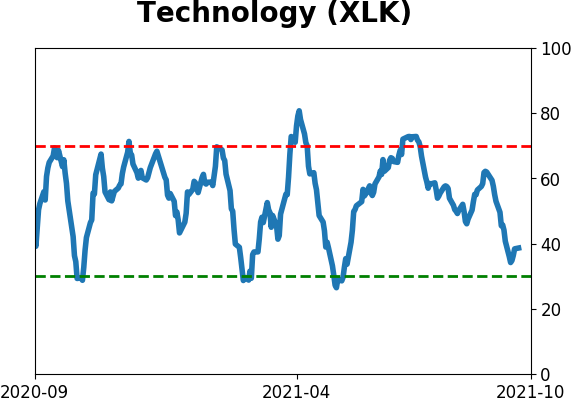
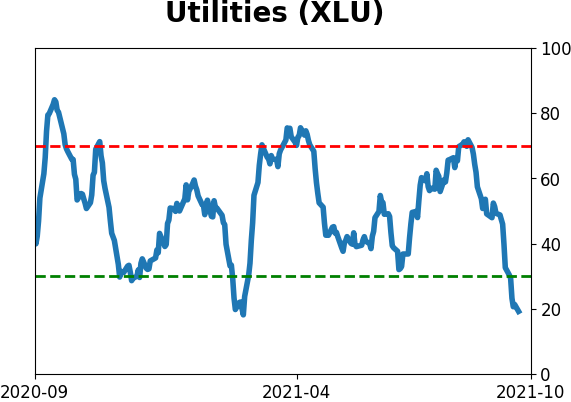
Sector ETF's - 10-Day Moving Average
|
|
|
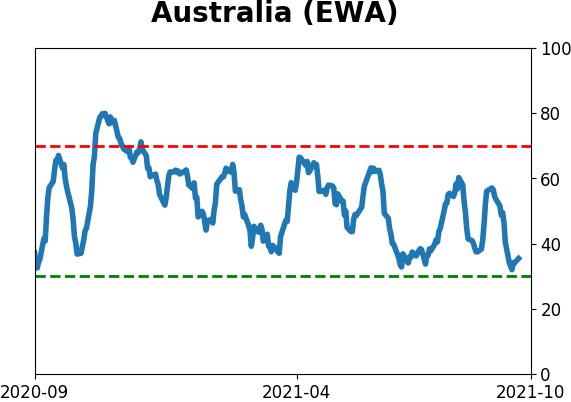
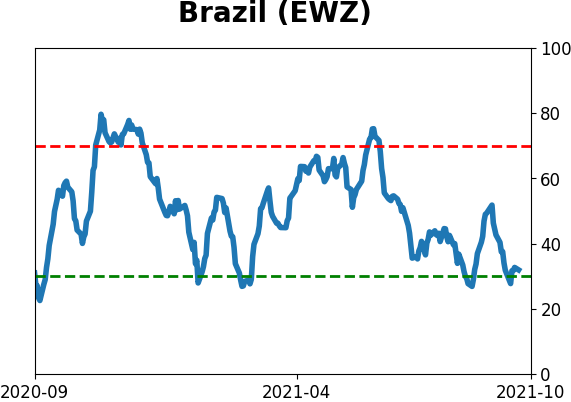
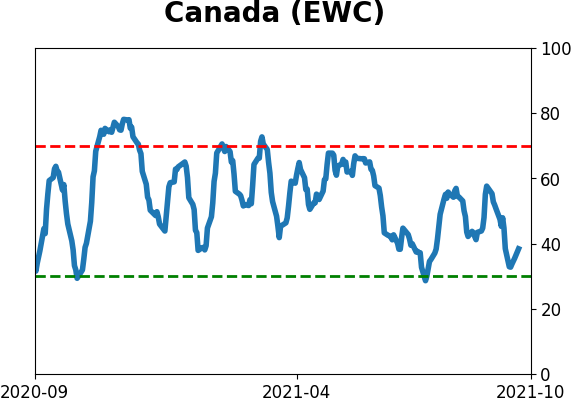
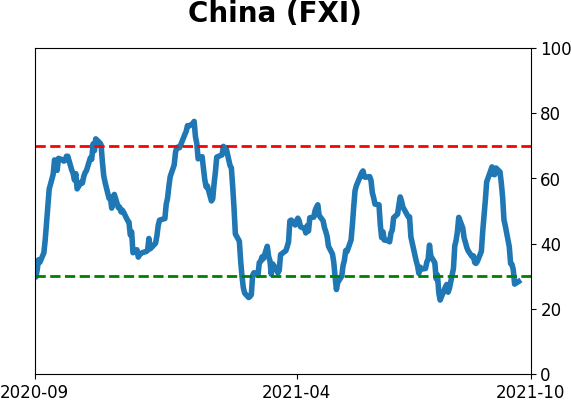
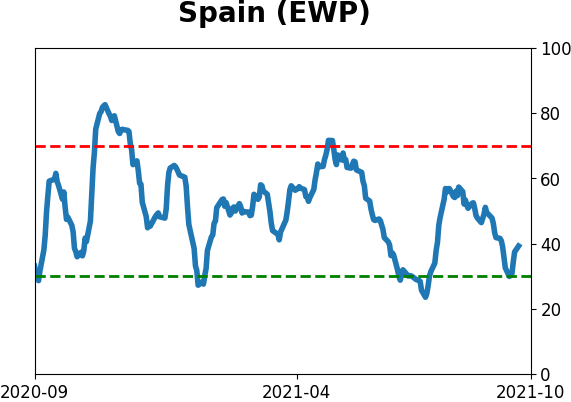
Country ETF's - 10-Day Moving Average
|
|
|
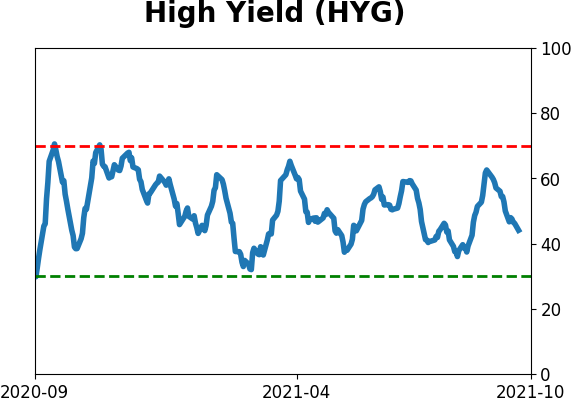
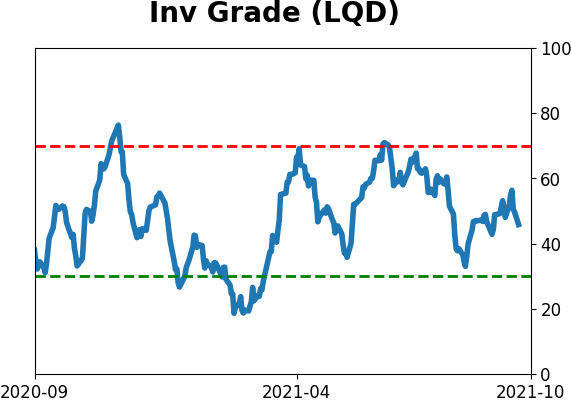
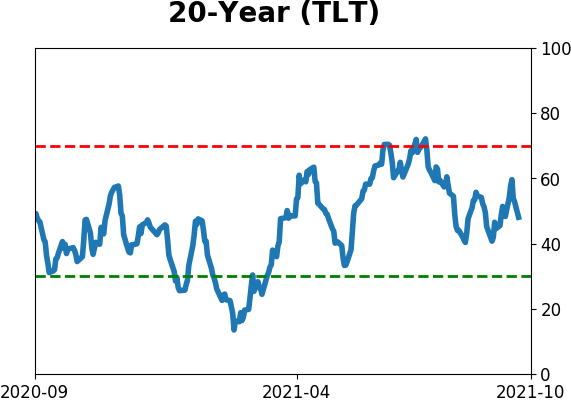
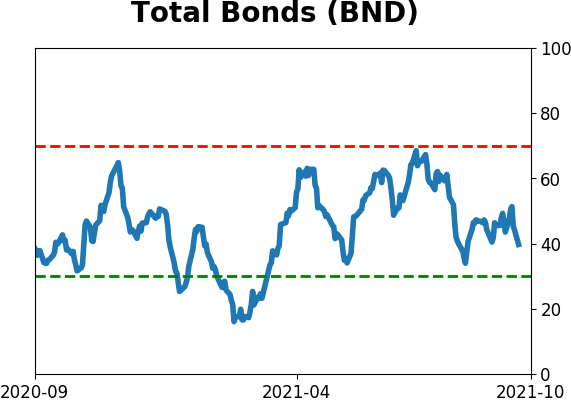
Bond ETF's - 10-Day Moving Average
|
|
|
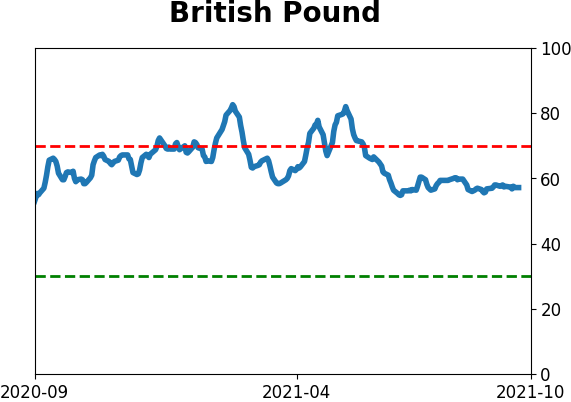
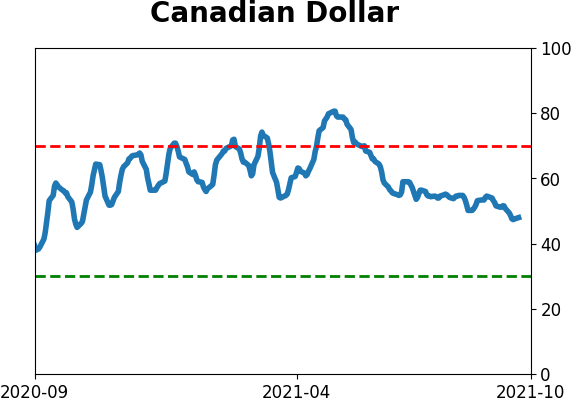
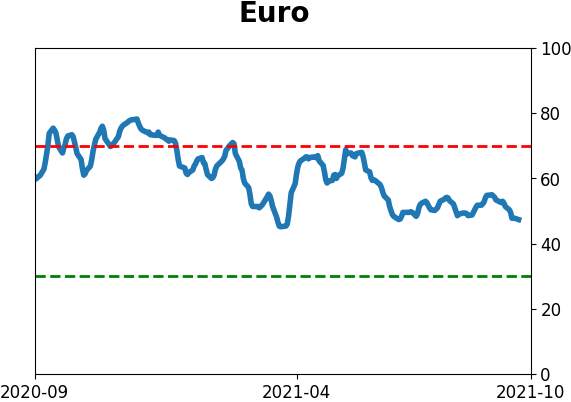
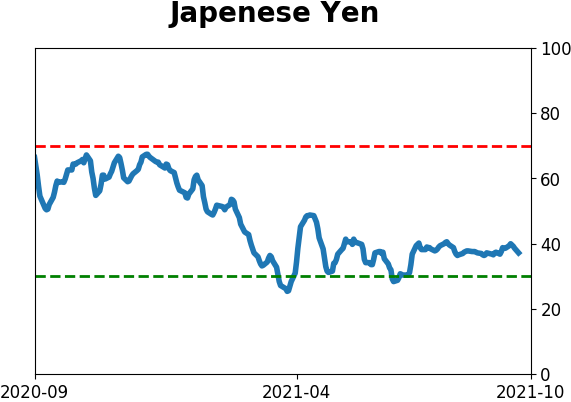
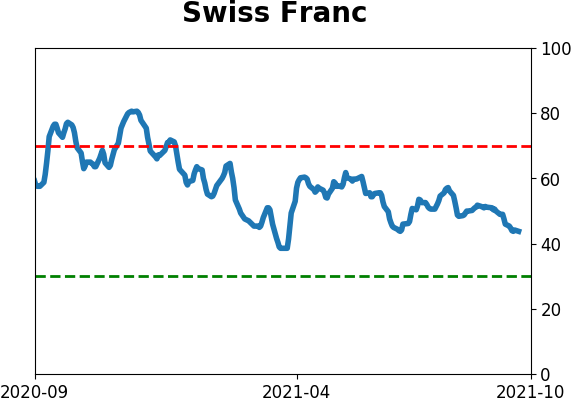
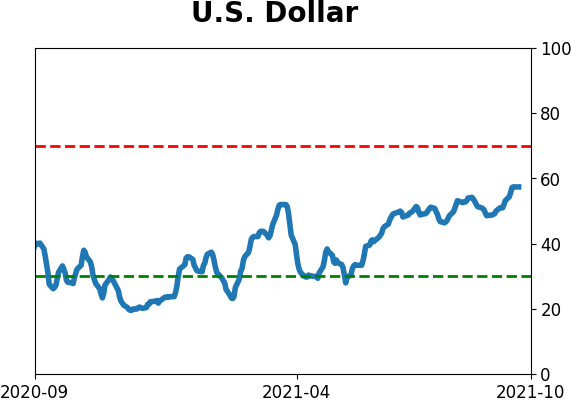
Currency ETF's - 5-Day Moving Average
|
|
|
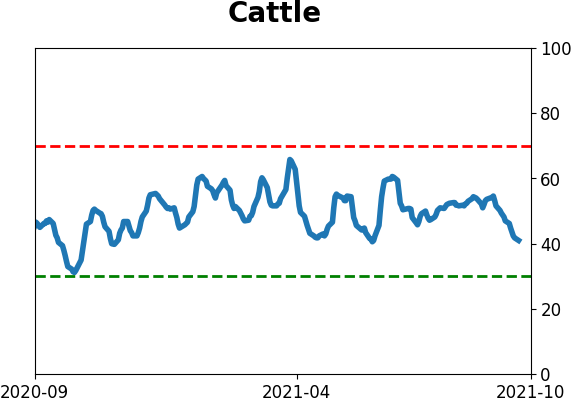
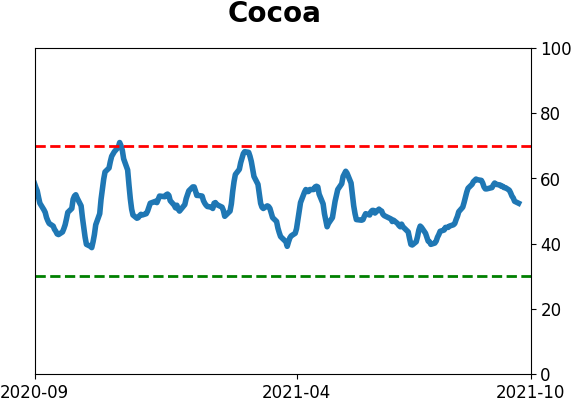
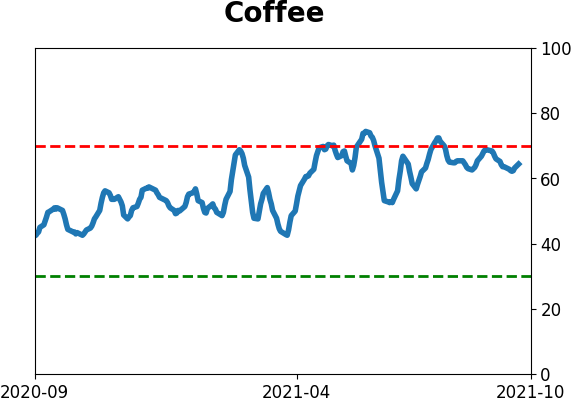
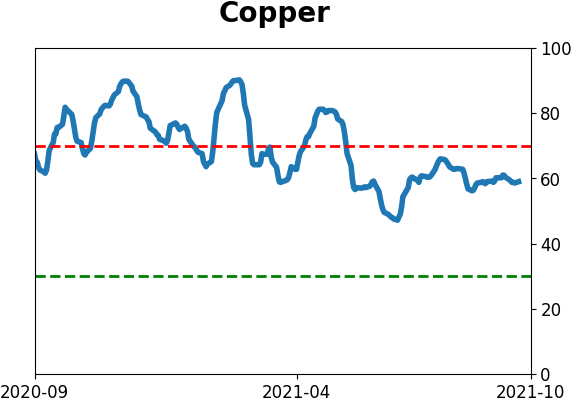
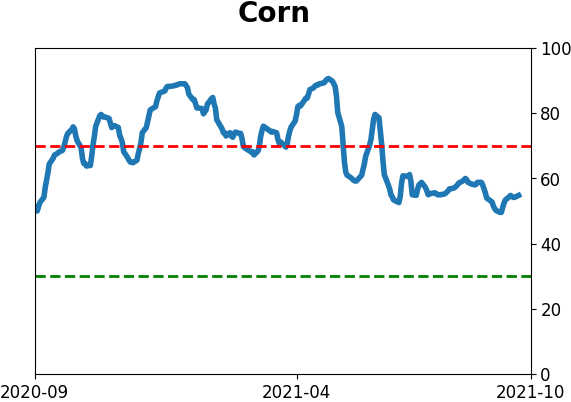
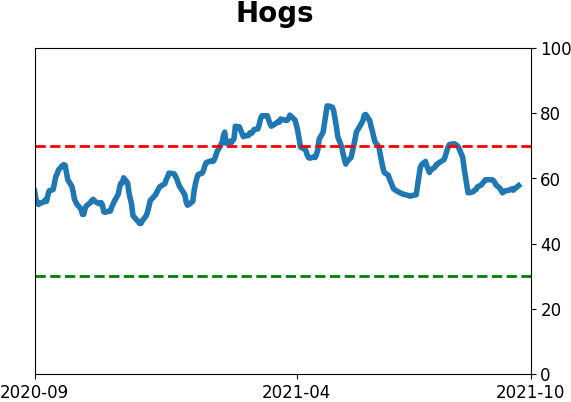
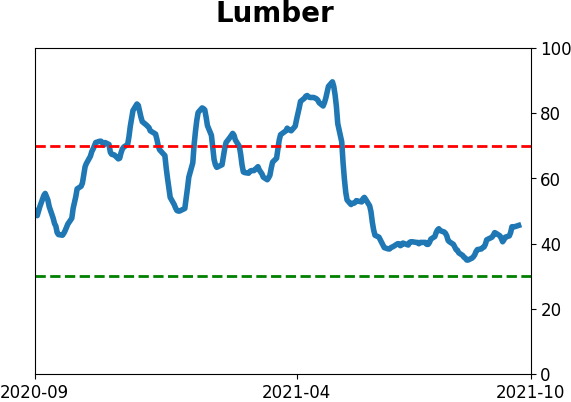
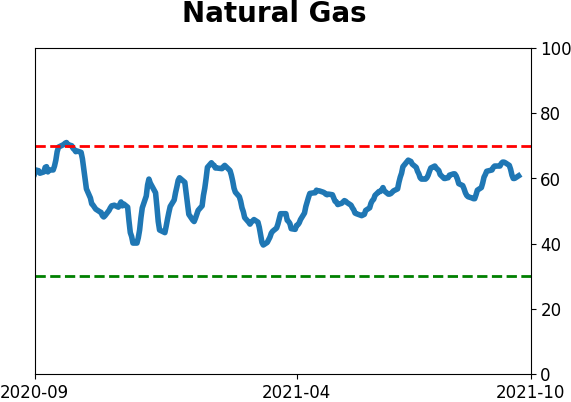
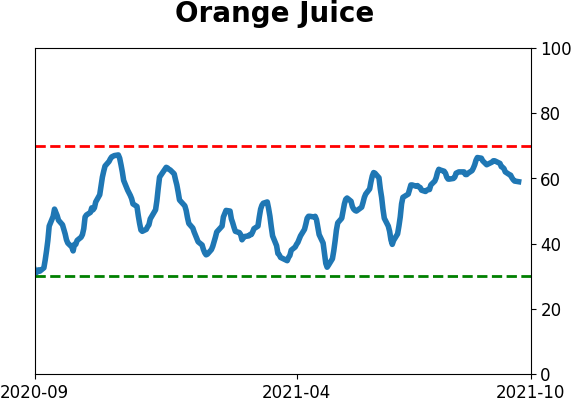
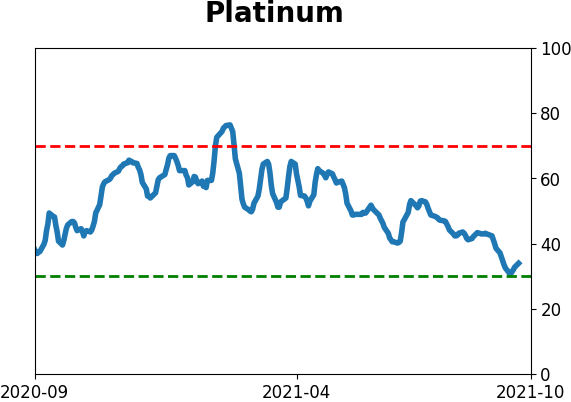
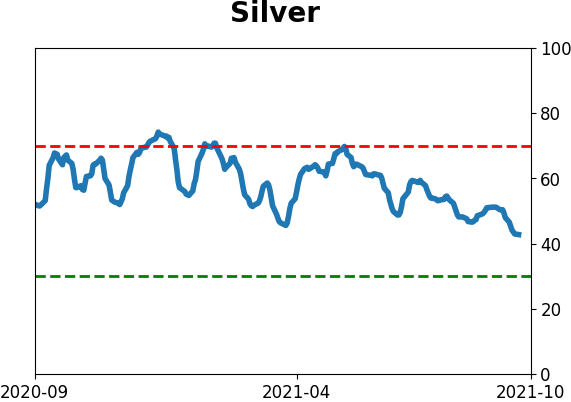
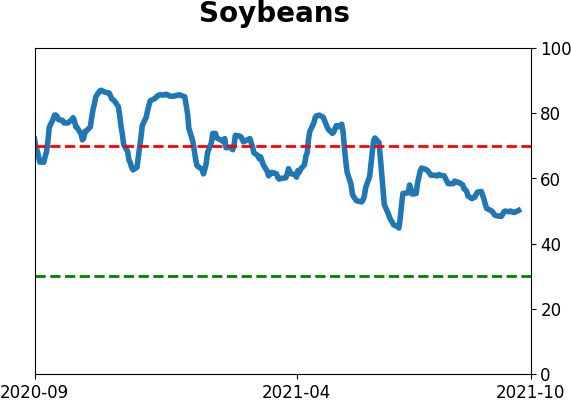
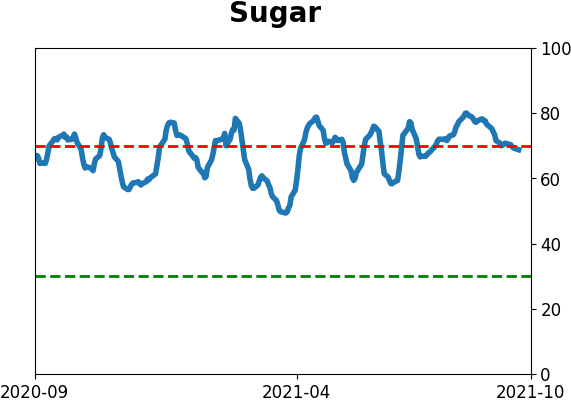
Commodity ETF's - 5-Day Moving Average
|
|