Headlines
|
|
Using Small Caps and Industrials as a recession predictor:
Since they peaked about two months ago, Small Caps and Industrials have both declined more than -7.5%. Some fear that weakness in these sensitive sectors portends an economic recession, but it's impossible to support that by looking at similar behavior over nearly 100 years.
|
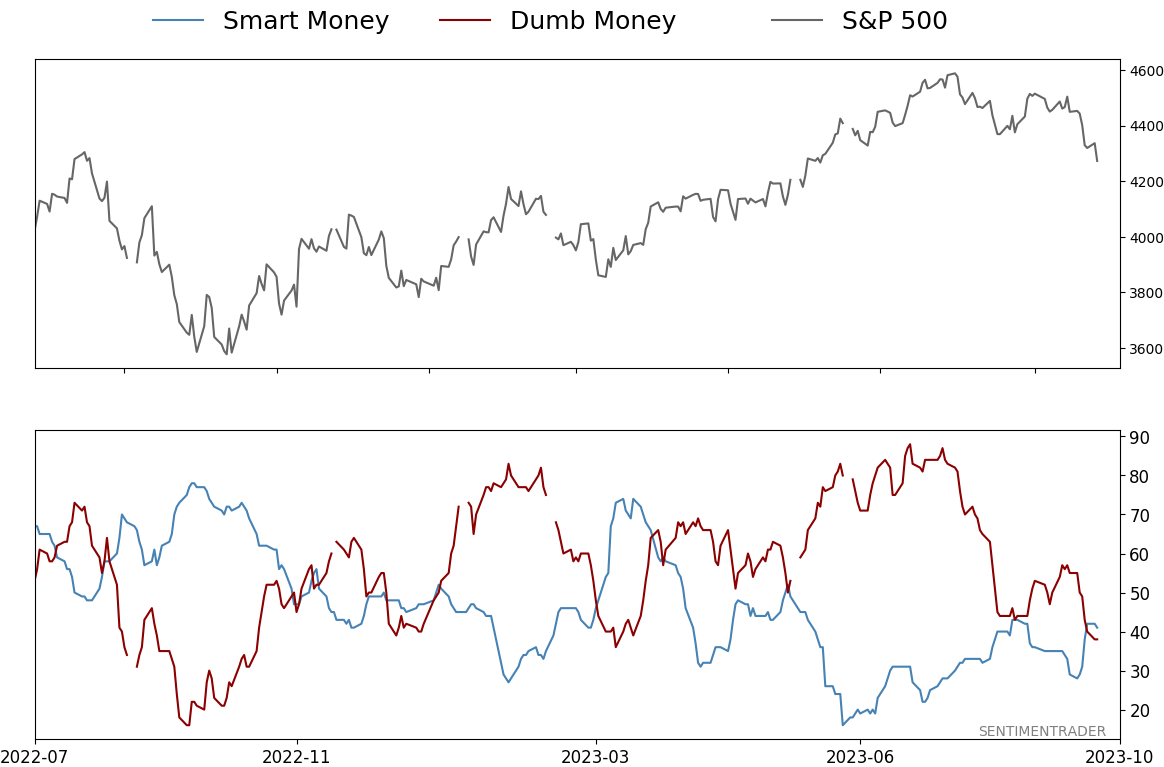
Smart / Dumb Money Confidence
|
Smart Money Confidence: 41%
Dumb Money Confidence: 38%
|
|
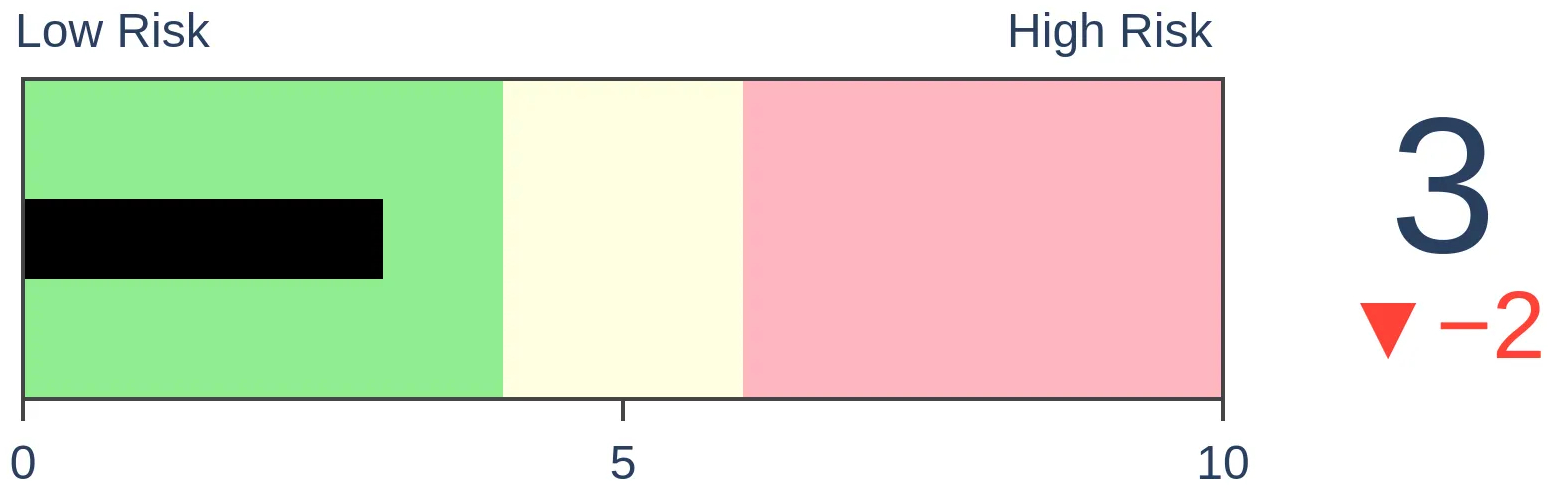
Risk Levels
Stocks Short-Term
|
Stocks Medium-Term
|
|
Bonds
|
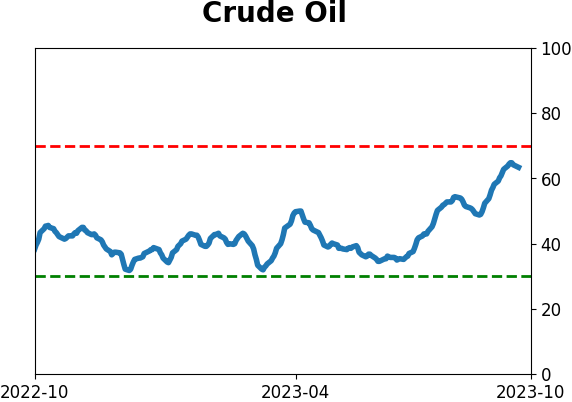
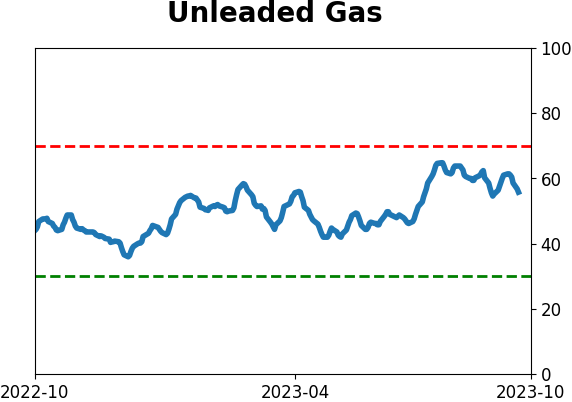
Crude Oil
|
|
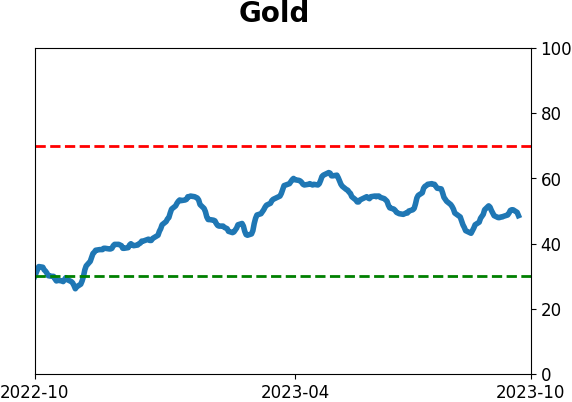
Gold

|
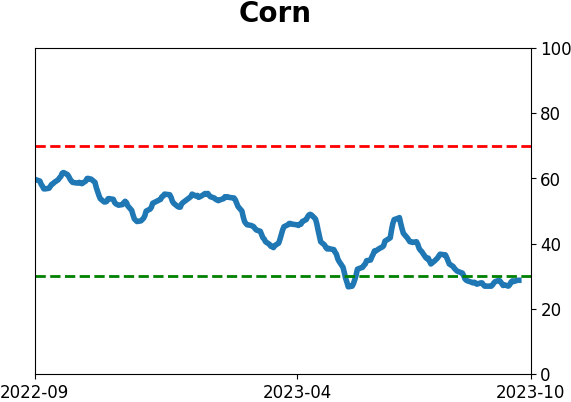
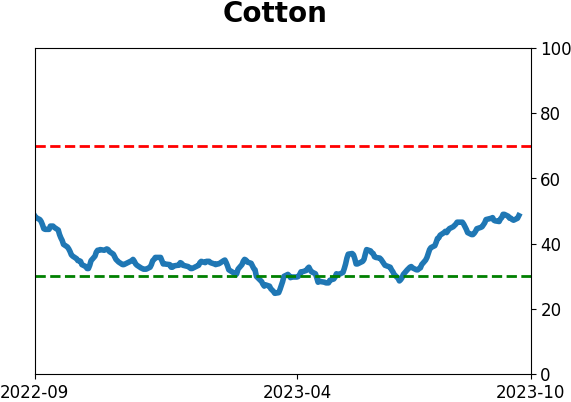
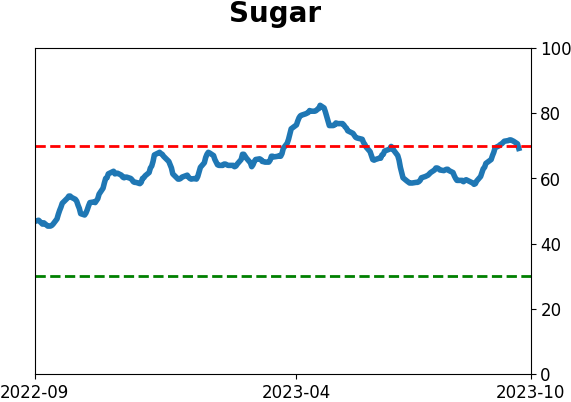
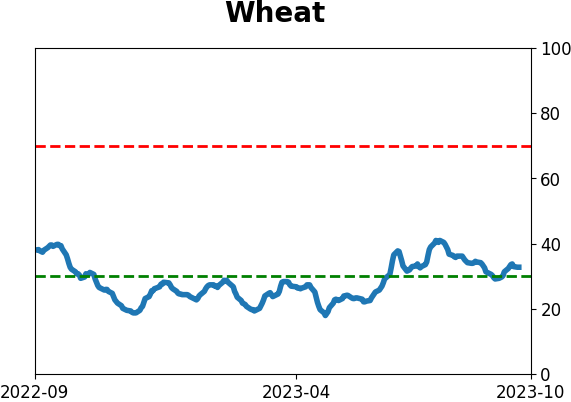
Agriculture

|
|
Research
By Jason Goepfert
BOTTOM LINE
Since they peaked about two months ago, Small Caps and Industrials have both declined more than -7.5%. Some fear that weakness in these sensitive sectors portends an economic recession, but it's impossible to support that by looking at similar behavior over nearly 100 years.
FORECAST / TIMEFRAME
None
|
Key points:
- Small Caps and Industrials have both dropped by more than -7.5% from their recent peaks
- Weakness in those sensitive stocks has raised some fears about an imminent recession
- Historically, big declines in those groups have not preceded recessions or broad market weakness
Sensitive sectors struggle, raising recession fears
Stocks have been struggling for weeks. So have Treasury bonds, which isn't something we'd expect to see if the economy were heading into a recession. Within the weakness in stocks, a couple of sectors and factors indicate economic weakness.
As Bloomberg notes (emphasis added):
The S&P 500 Industrials index peaked on Aug. 1 and is down about 8% since then, teetering on a correction after several major US carriers cut their profit outlooks for the third quarter on a sudden jump in oil prices. The small-cap Russell 2000 Index has lost more than 11% from its July 31 closing high, roughly twice the decline in the S&P 500 Index over the same time. Steep drops in small-cap and industrial stocks typically occur when the economy is in a recession.
To check, we looked for every time both Small Caps and Industrials had set a 52-week high within the past two months, then both suffered declines of at least -7.5% from those highs. Both of them must have suffered declines that were larger than that in the S&P 500.
The table below shows whether these signals preceded U.S. economic recessions. It looks at any day within the given time period and determines whether that day was in a recessionary period as defined by the National Bureau of Economic Research (NBER).
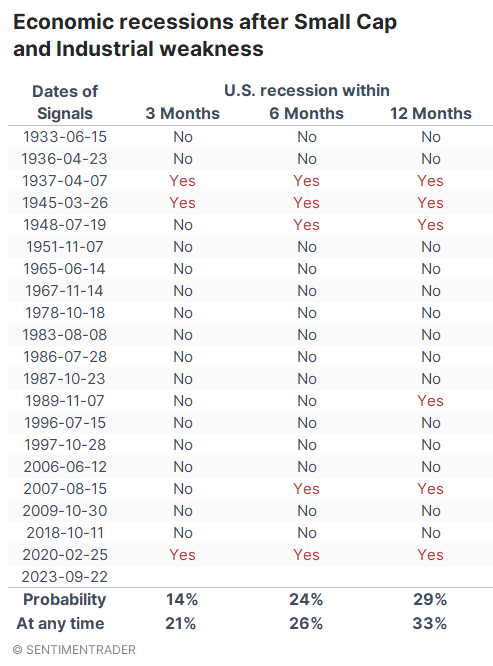
In a word, no.
There was only a 14% probability that a recession would occur within three months, which was a significantly smaller probability than any random day. Even within the next year, there was less than a 30% chance, again less likely than random.
Sector weakness hasn't led to stock market weakness
Most of us are less concerned about subjective interpretations of economic metrics and more concerned about actual investments. Maybe stocks would struggle after this behavior even if the economy didn't consistently tip into recession.
Again, no.
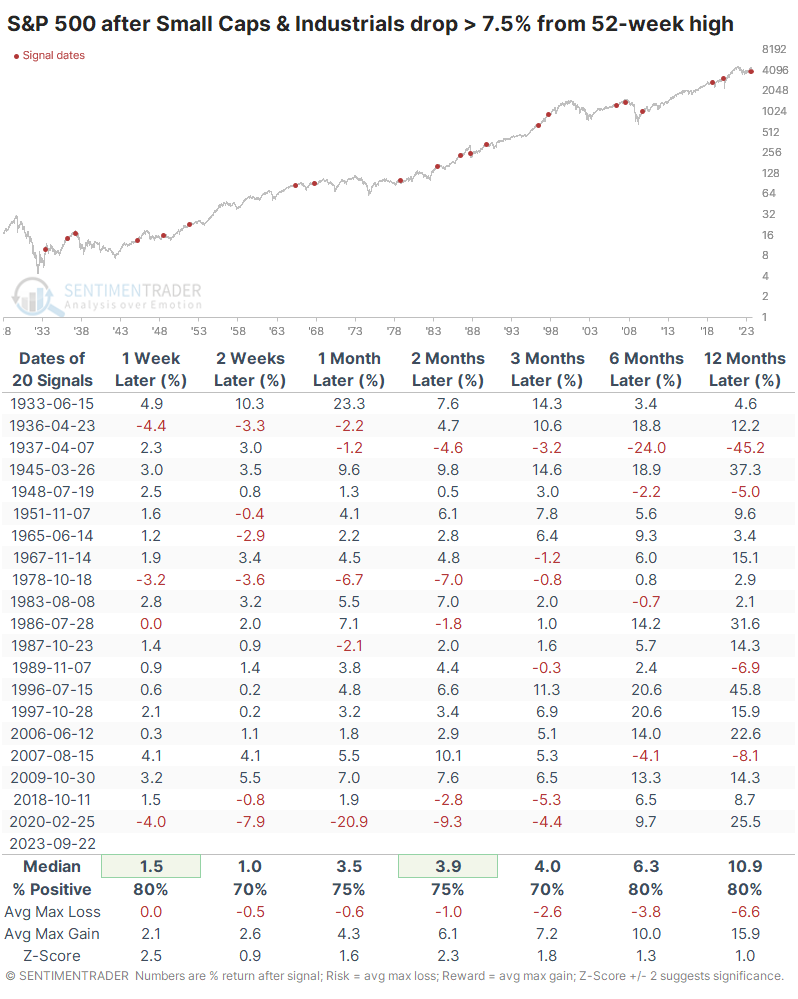
The table below shows returns in the S&P 500 after sharp, sudden weakness in Small Caps and Industrials. The signals preceded two significant declines in 1937 and 2020, which just happened to be two signals that also preceded imminent and violent recessions. Outside of those exceptions, the S&P's returns were quite good, and six months later, there was only one decline larger than -4.1%.
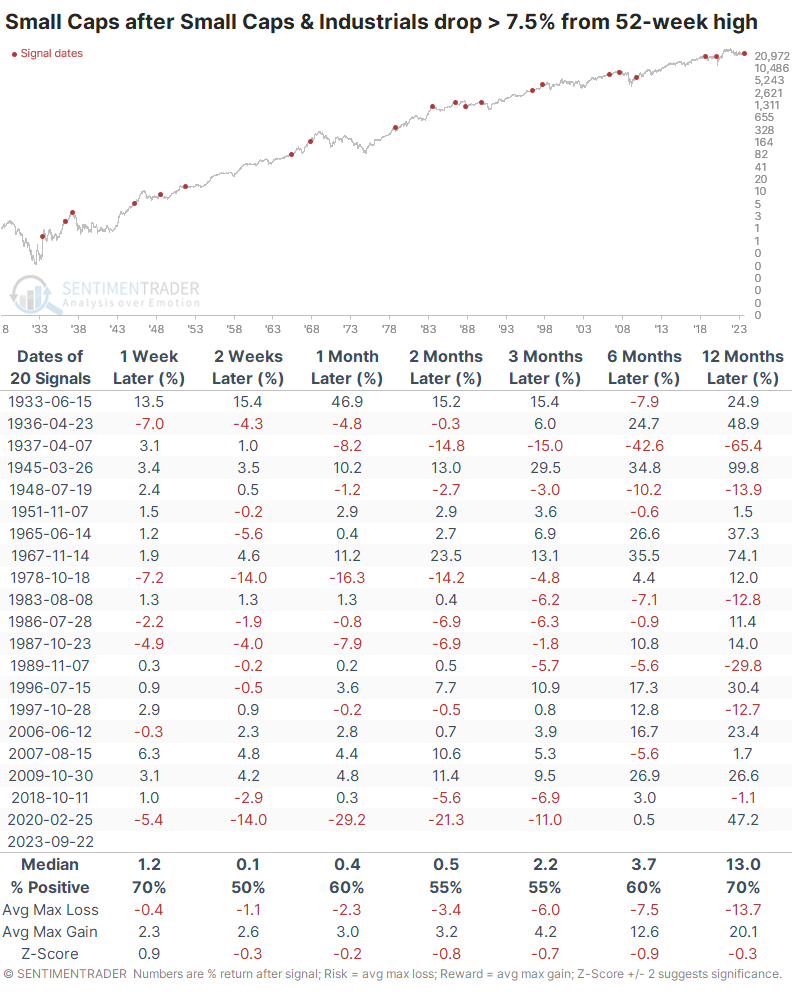
Small Caps themselves showed less impressive returns. Up to three months later, smaller stocks had about an even chance of showing a positive return, and their median across almost all time frames was below random. Three months later, the average risk remained larger than the average reward.
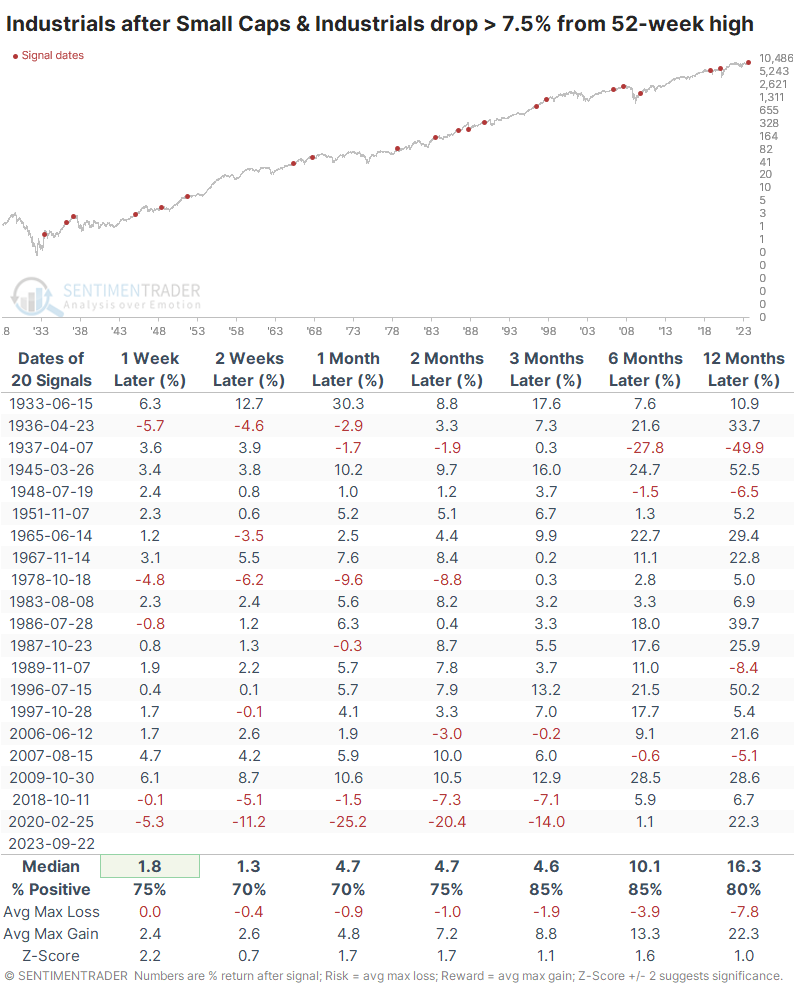
Industrials held up much better than Small Caps and even somewhat better than the S&P 500. Over the next 3-6 months, the sector showed losses only three times. Six months later, there was only one loss larger than -1.5% and the risk/reward was skewed impressively to the reward side.
What the research tells us...
It's almost always dangerous to apply stock market signals to the broader economy and vice-versa. That's especially the case when considering relatively short time frames. When it comes to weakness in Small Caps and Industrials leading to weakness in the broader stock market or the economy, there is little to no evidence.
While they might have been valuable predictors a couple of times, we would have to cherry-pick only those instances and assume they apply to our current situation. Maybe they do; I don't know - I'm not smart enough to guess. Based on a long history and relatively robust sample size, it's hard to support that argument.
Indicators at Extremes
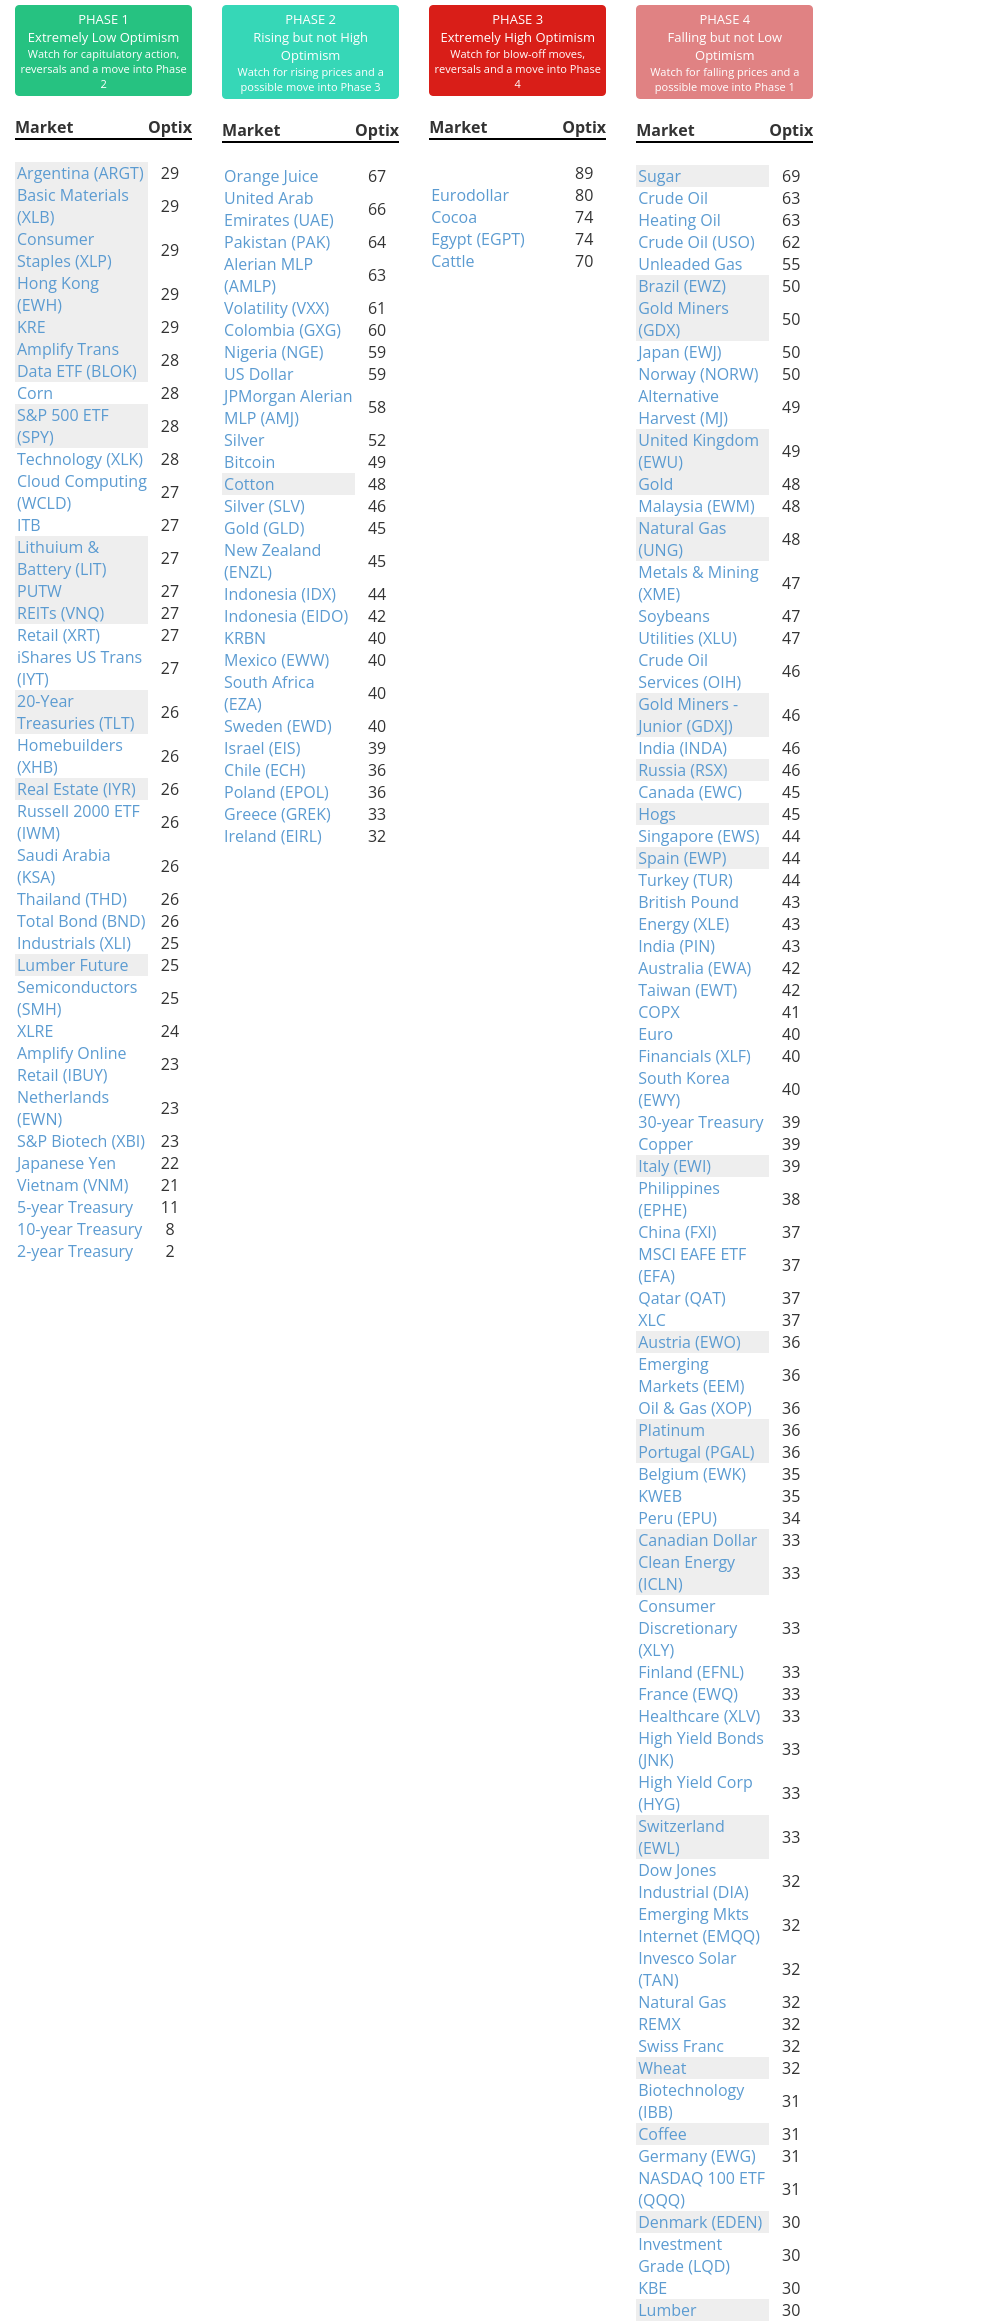
Phase Table
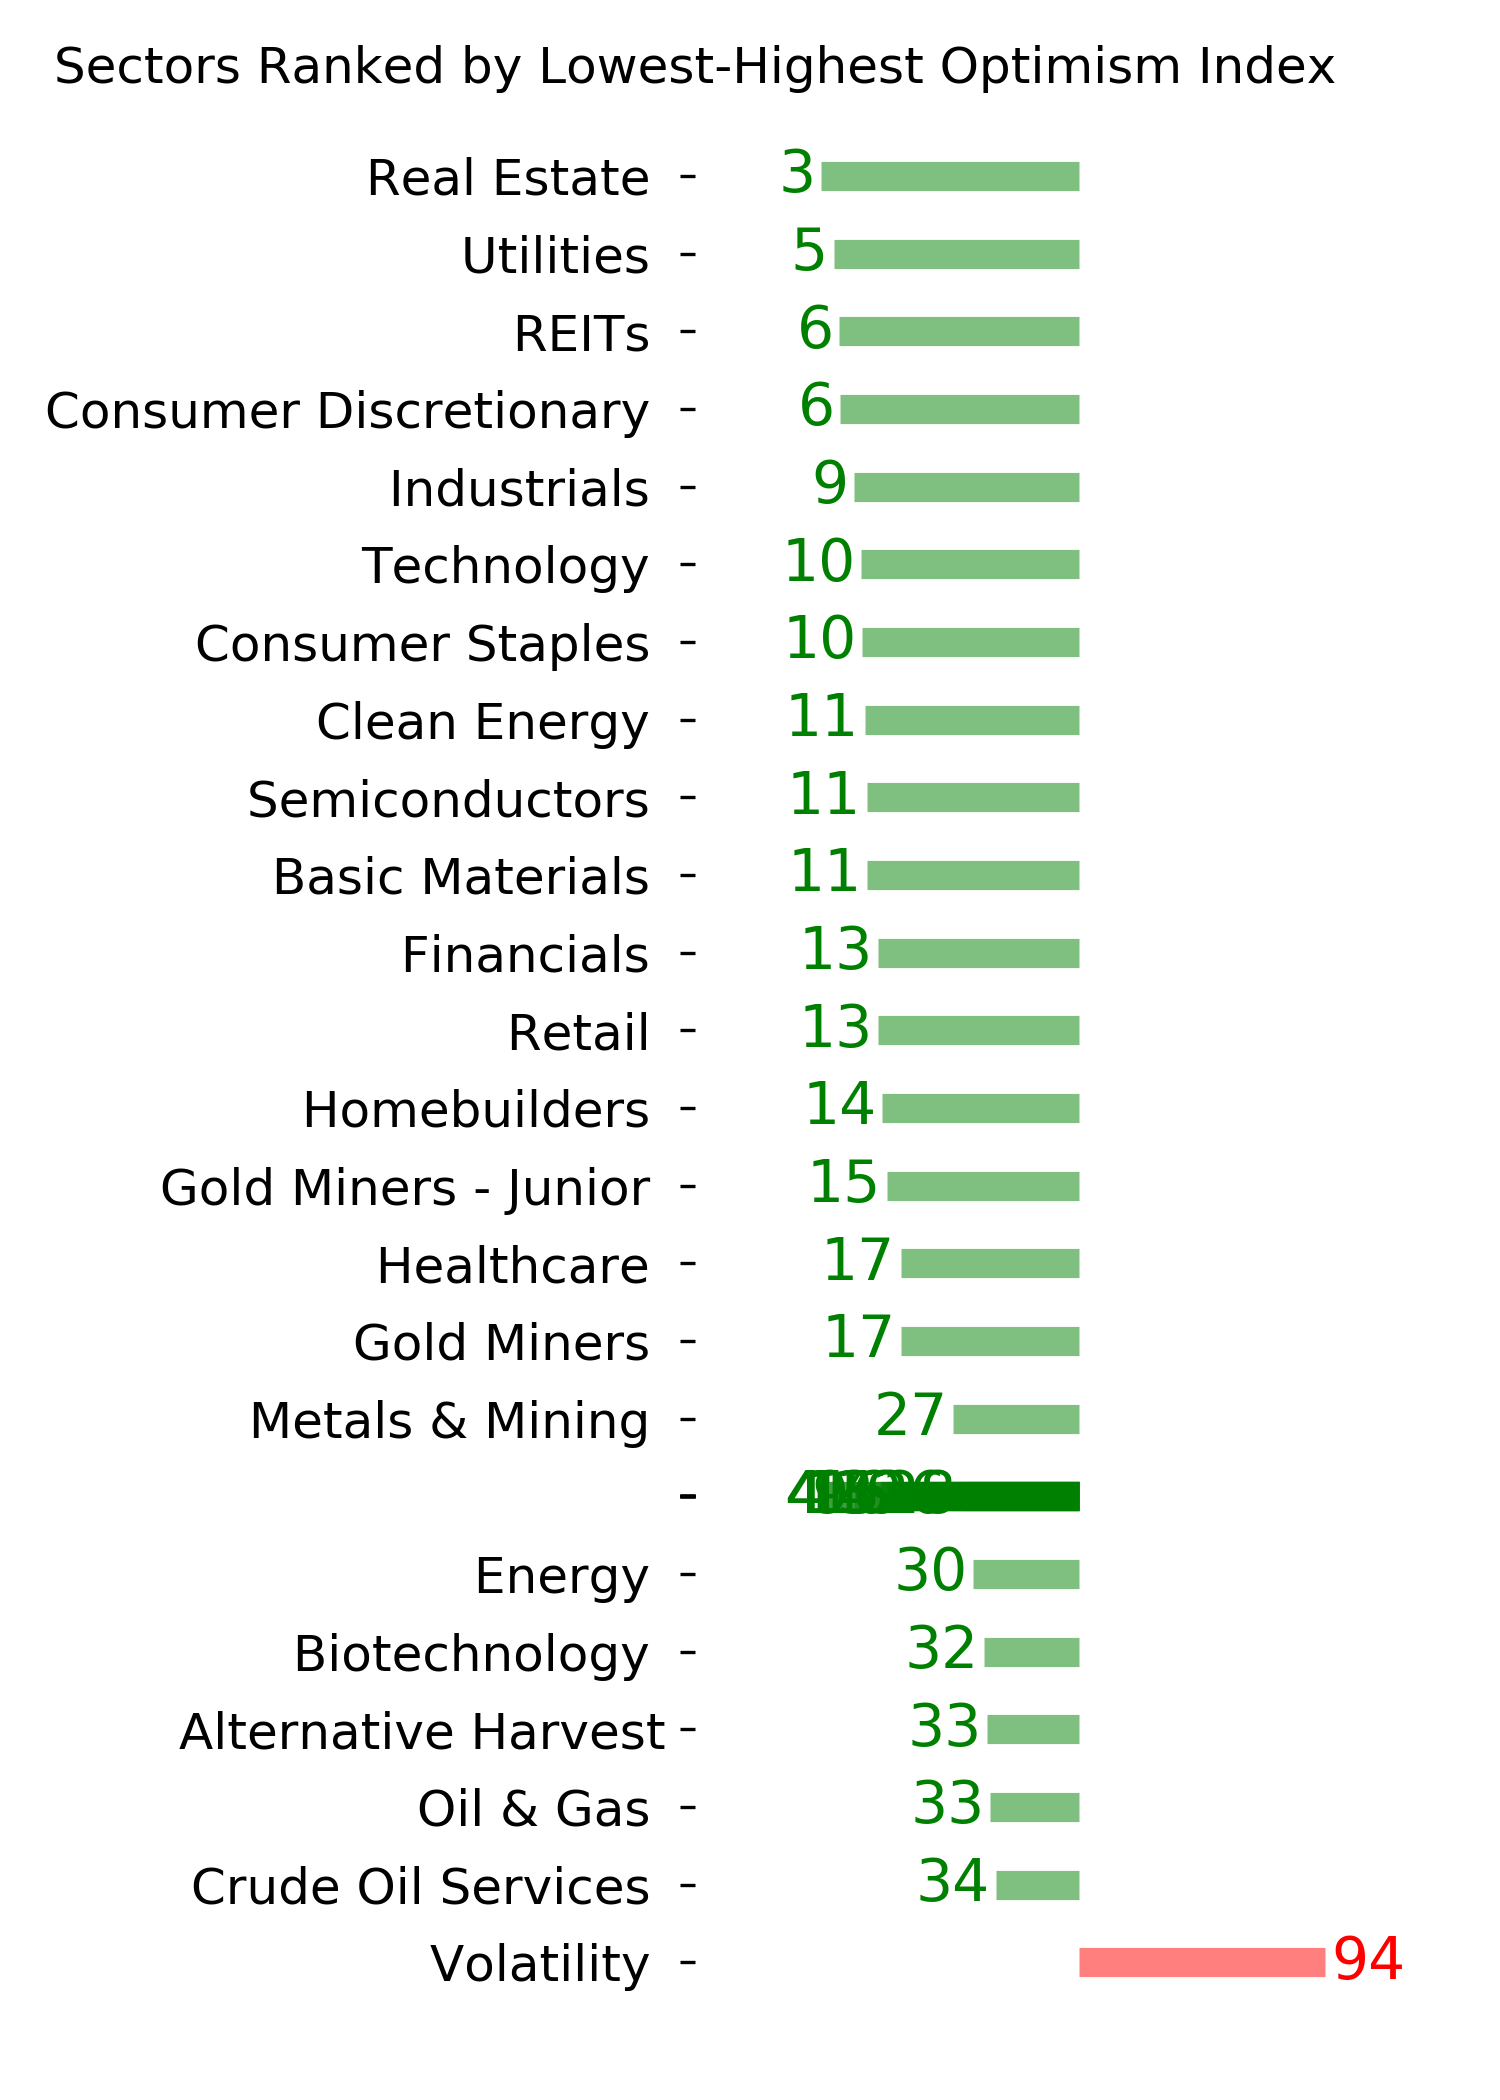
Ranks
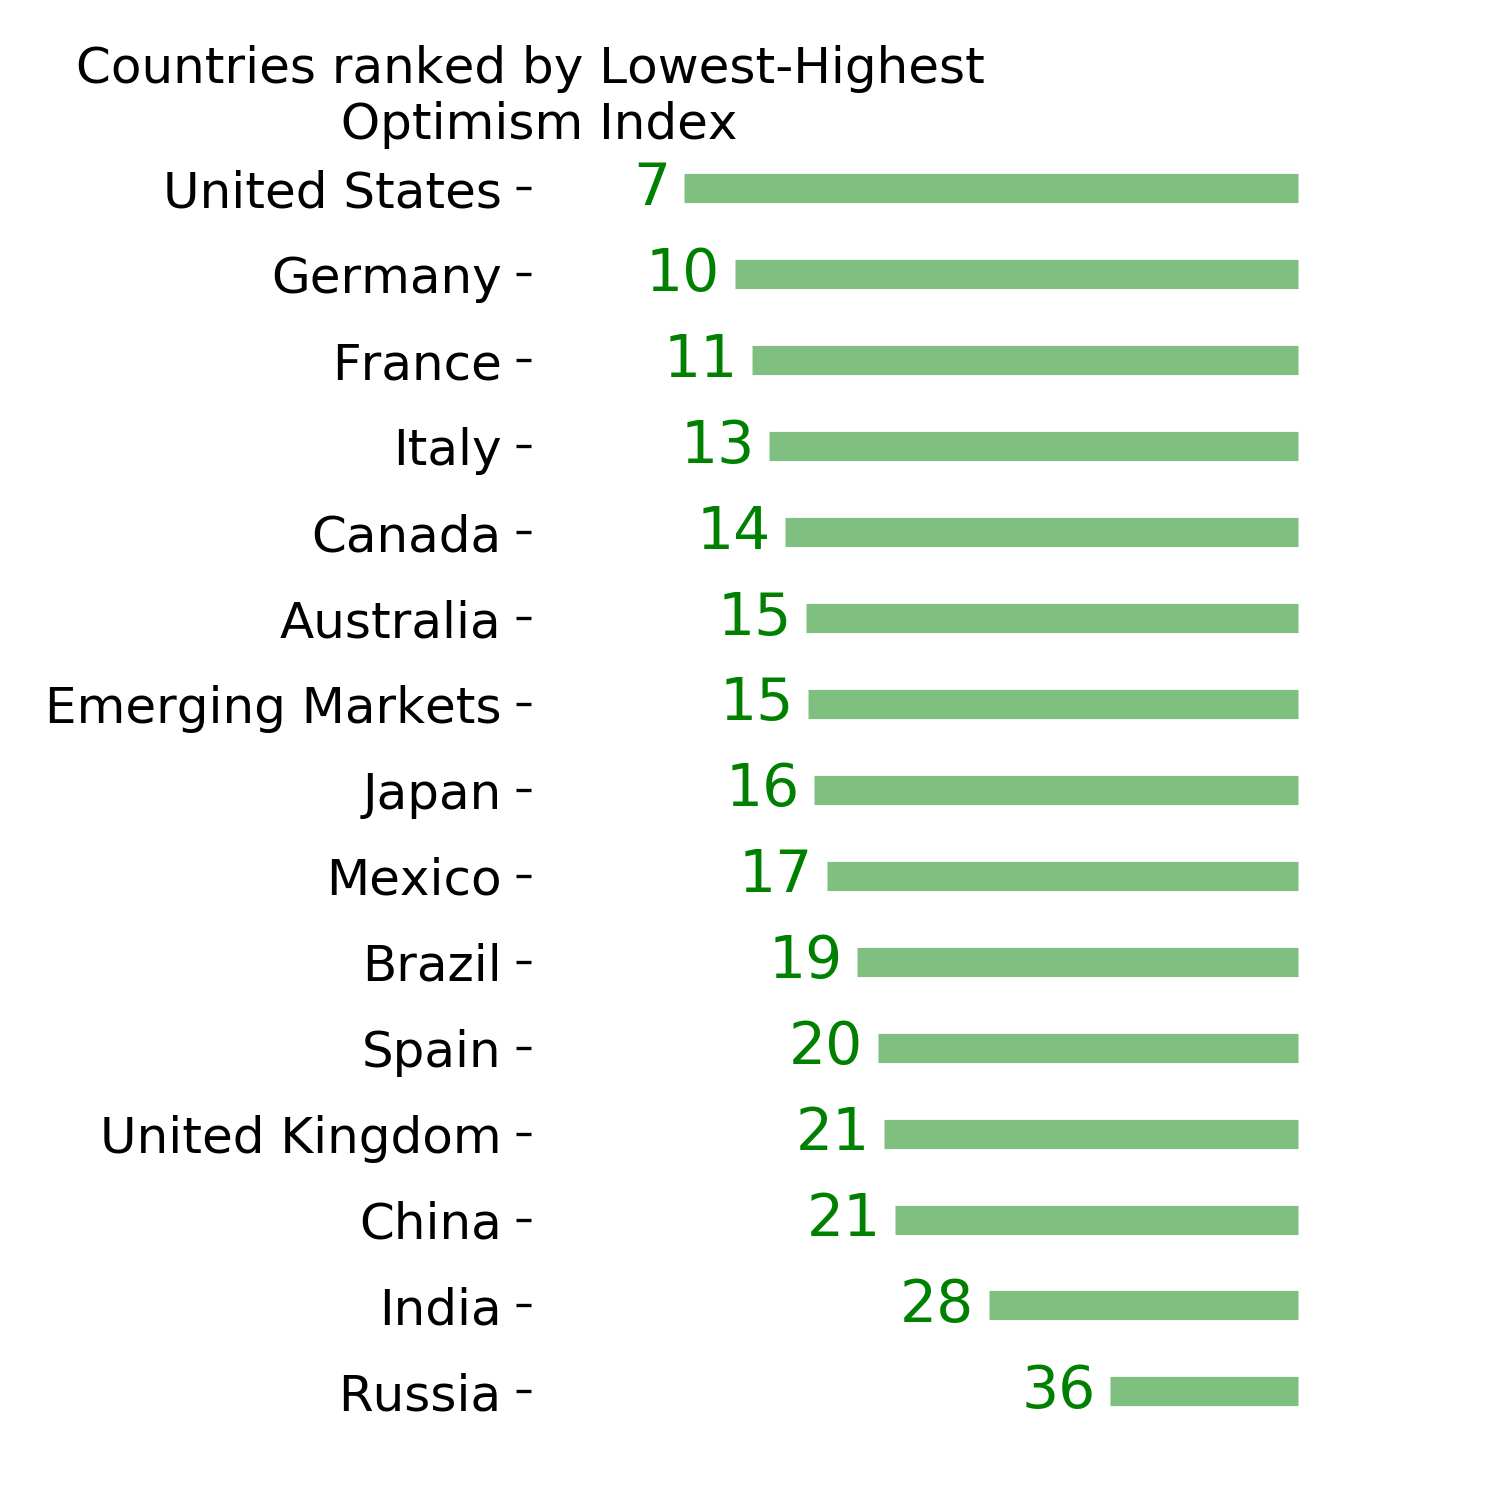
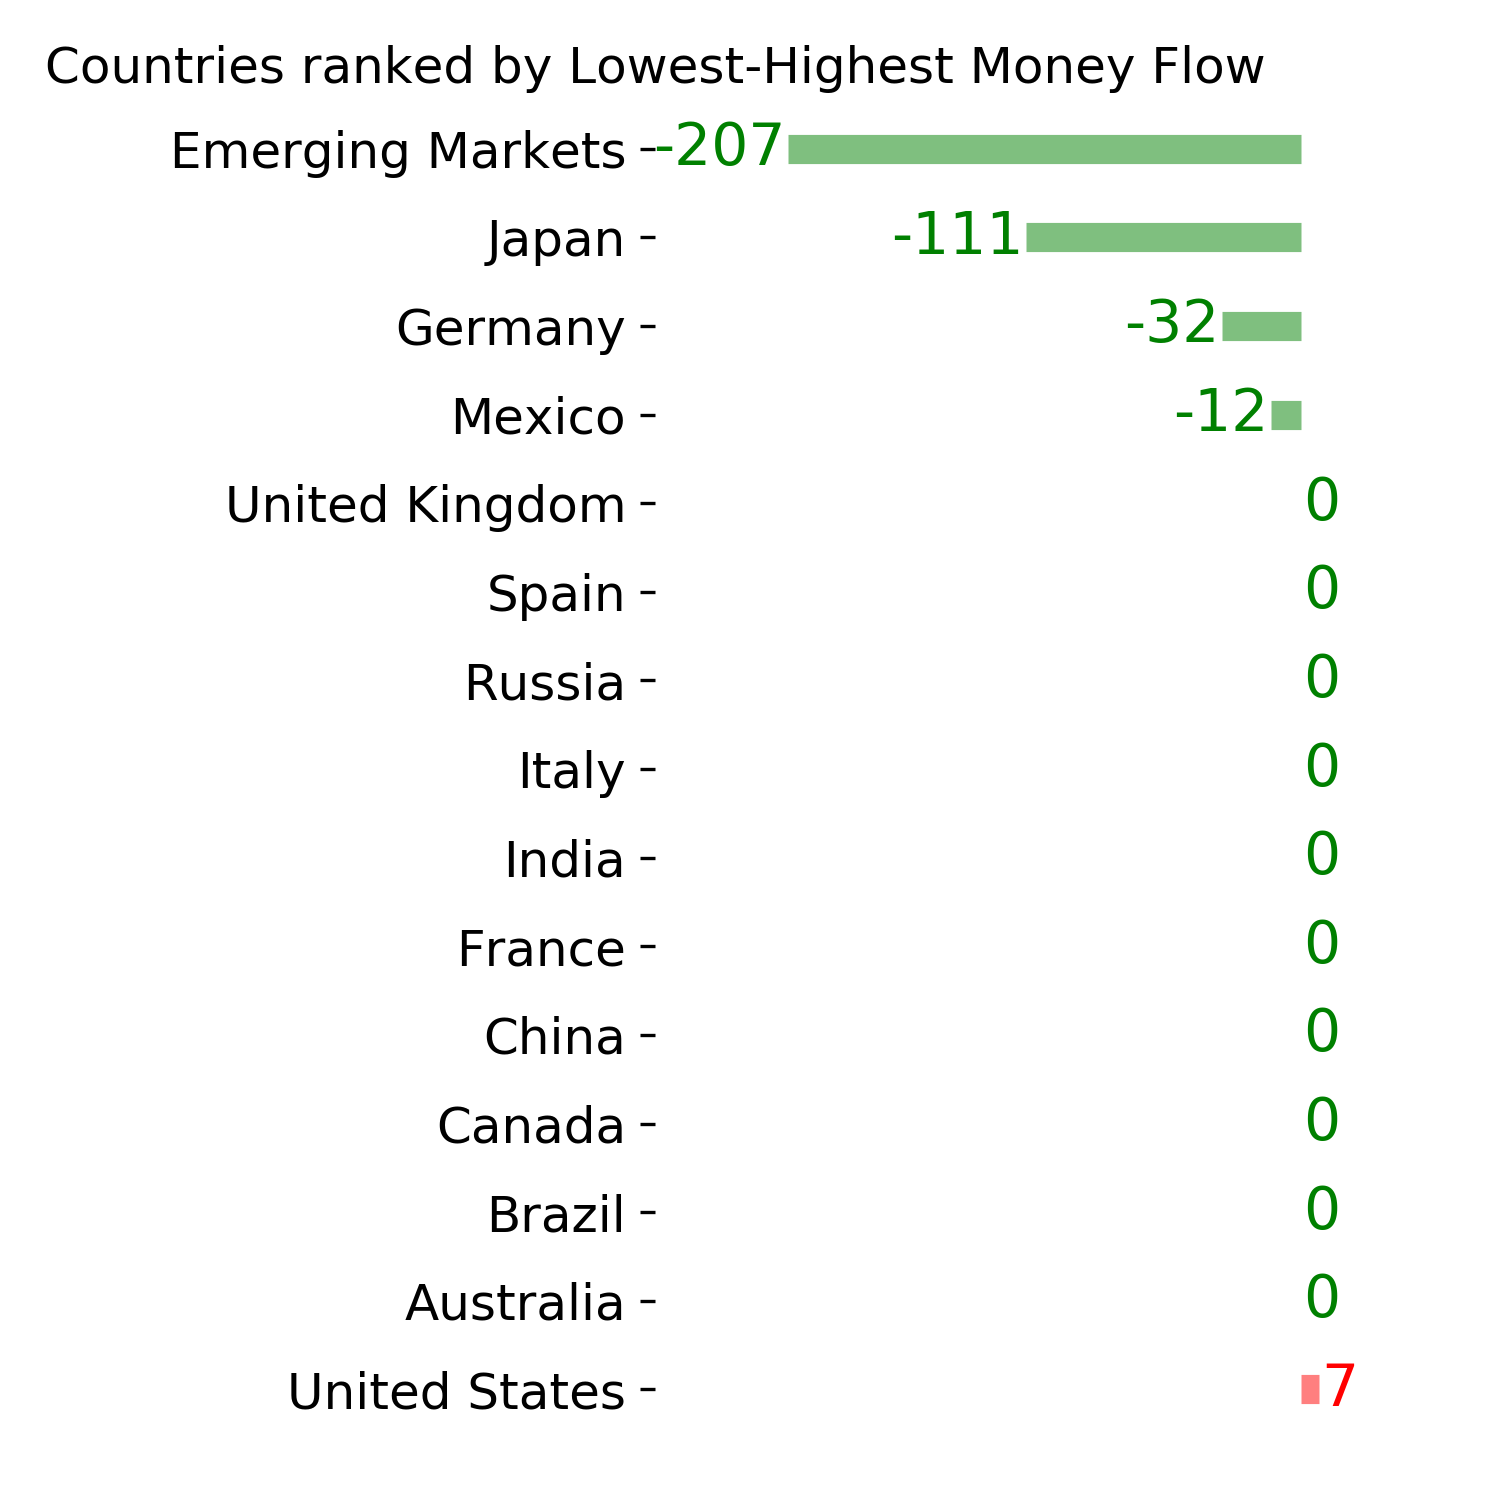
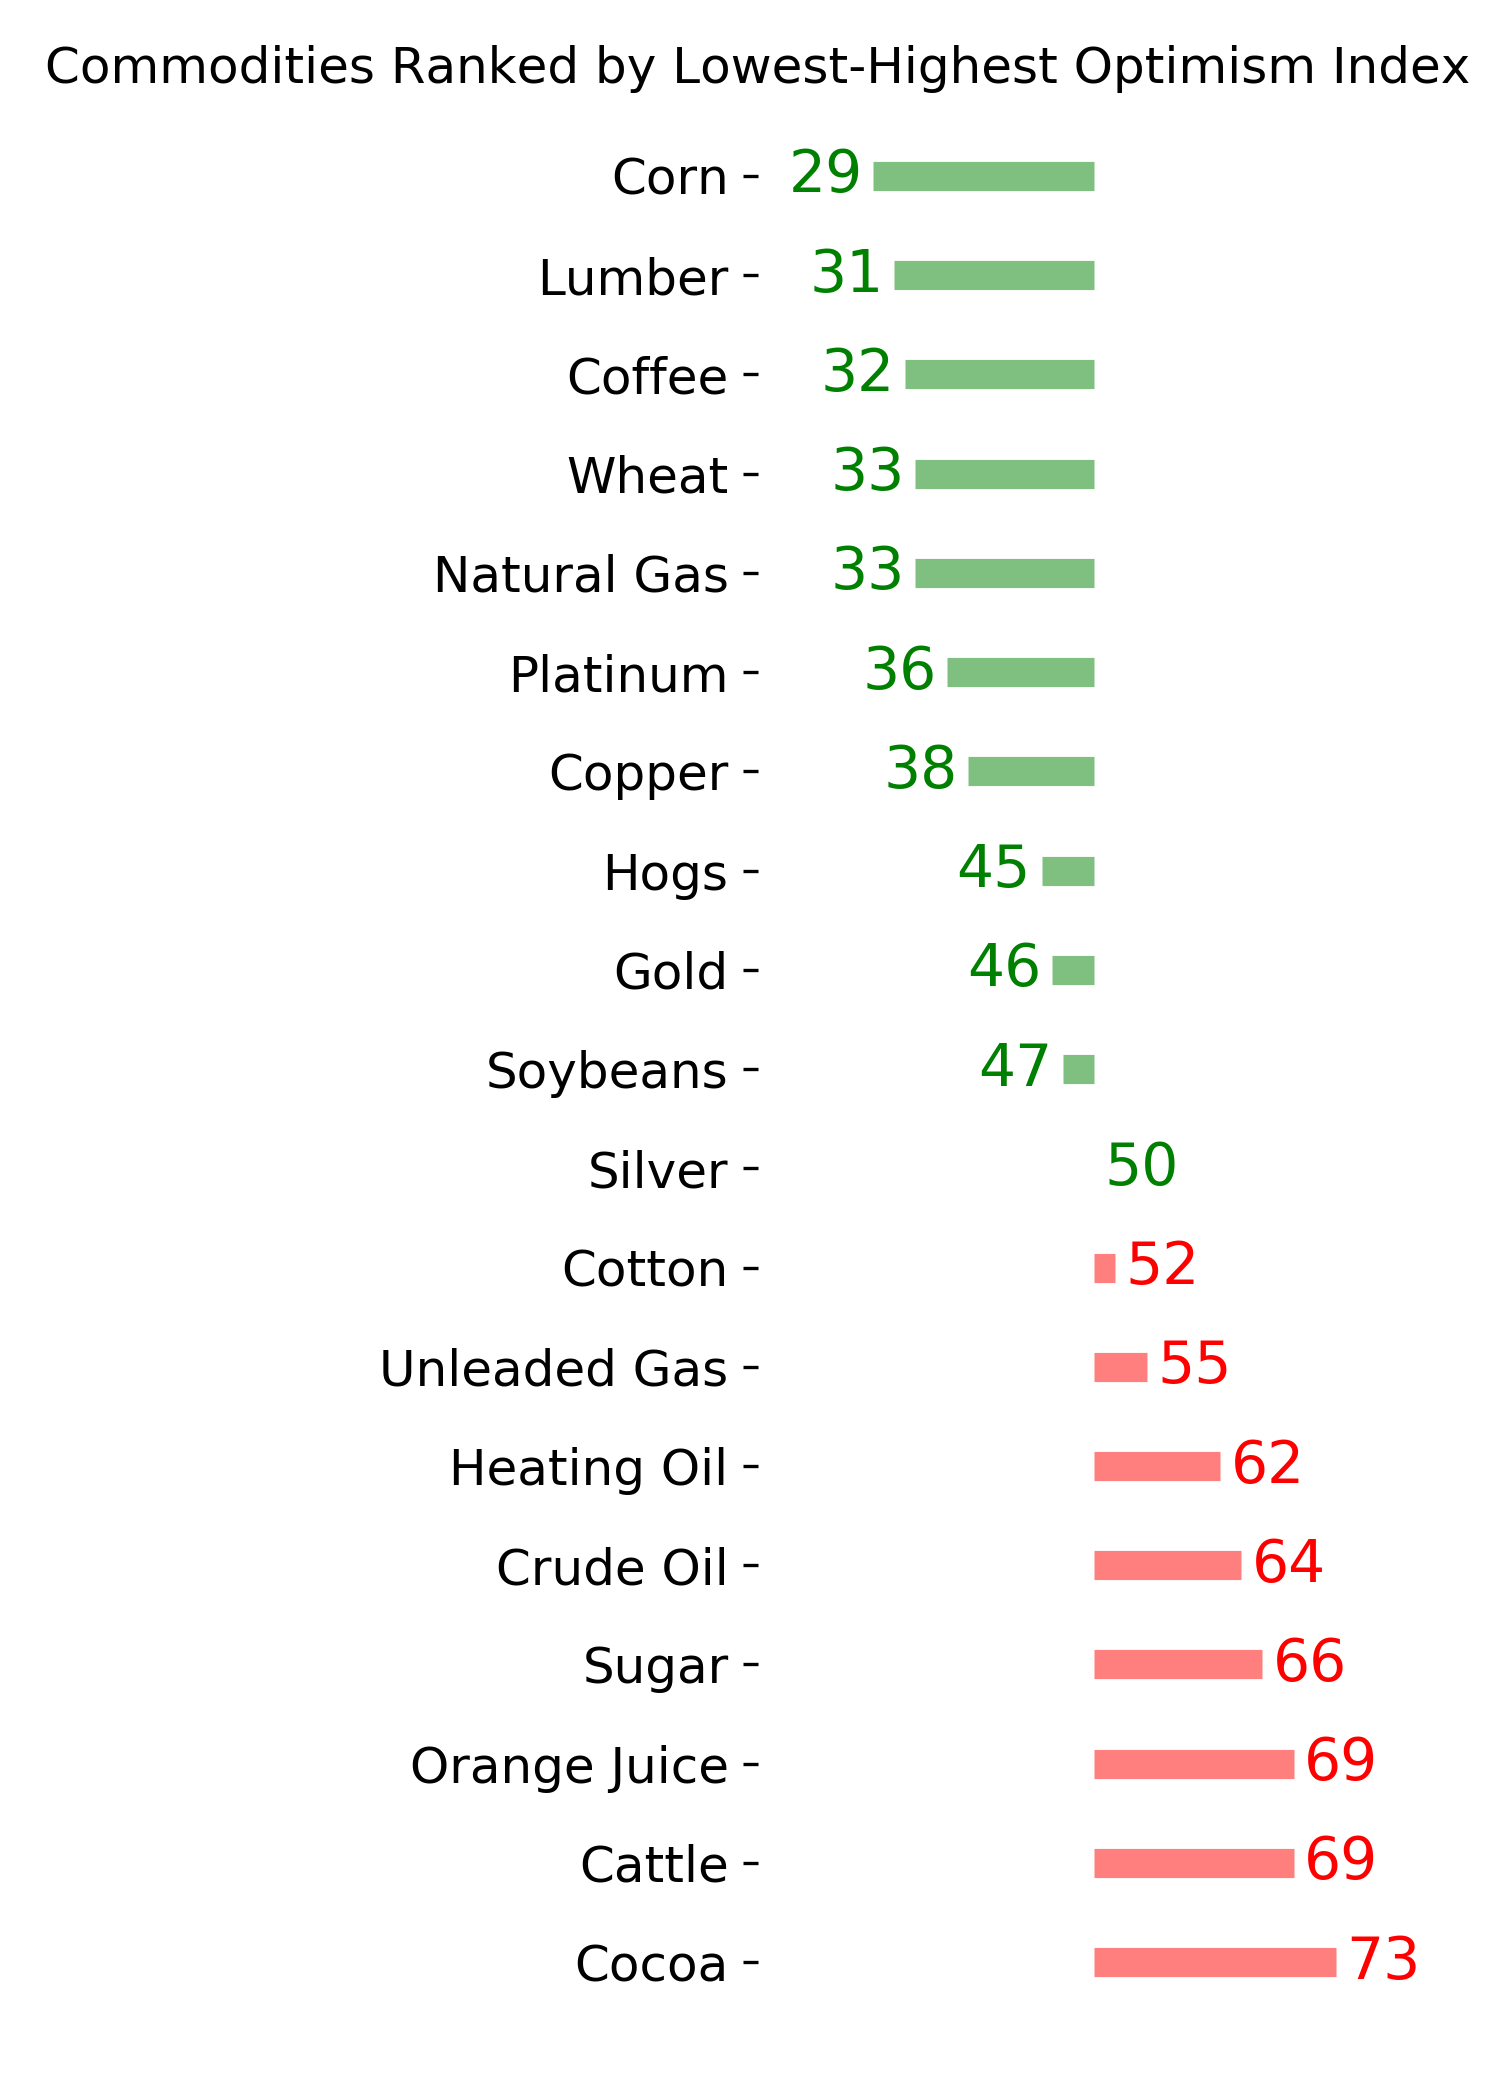
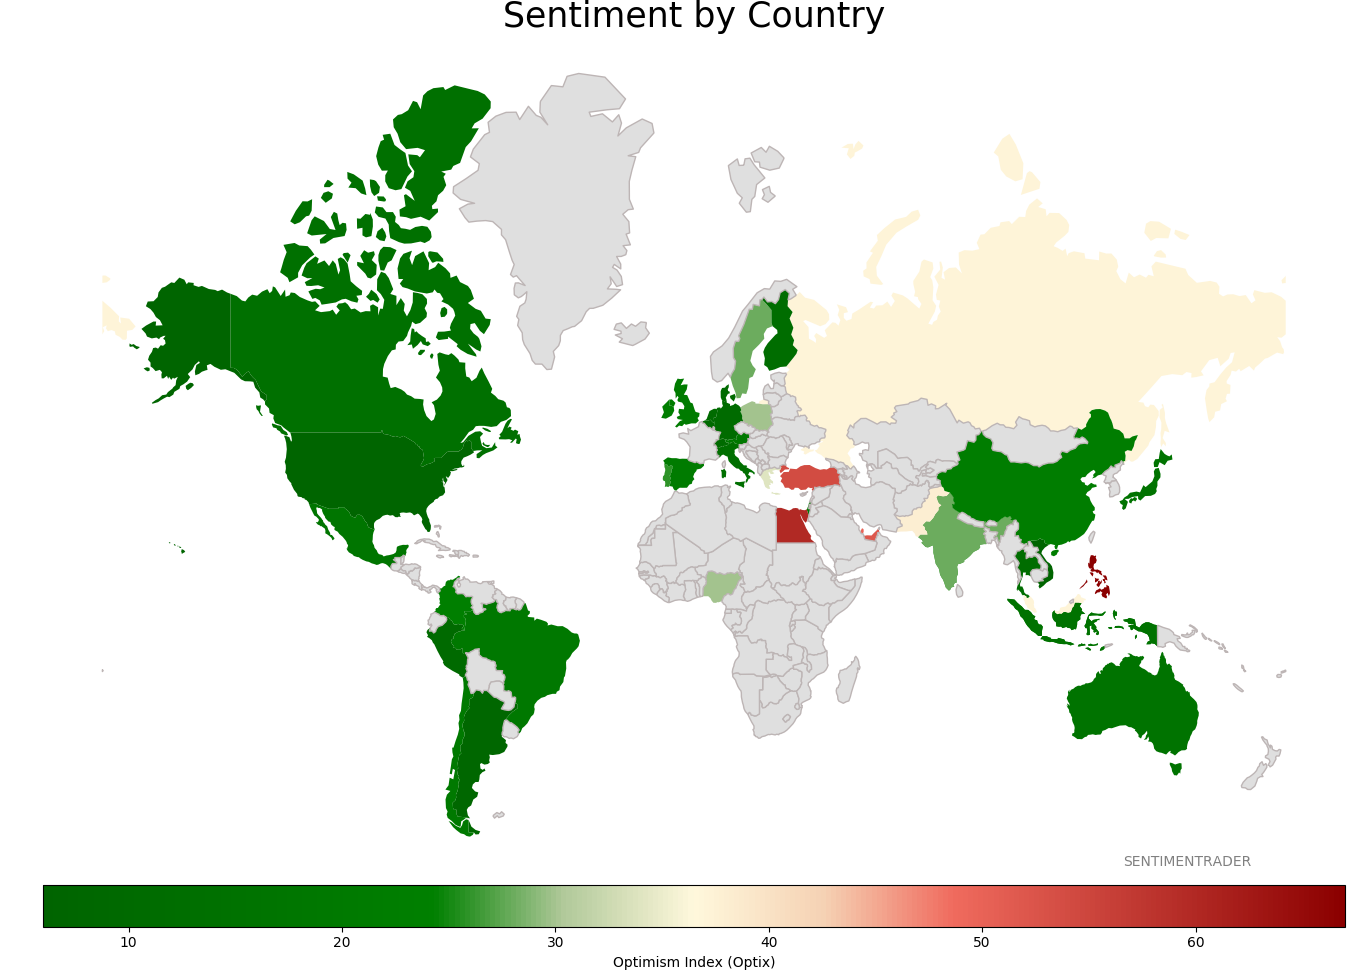
Sentiment Around The World
Optimism Index Thumbnails
|
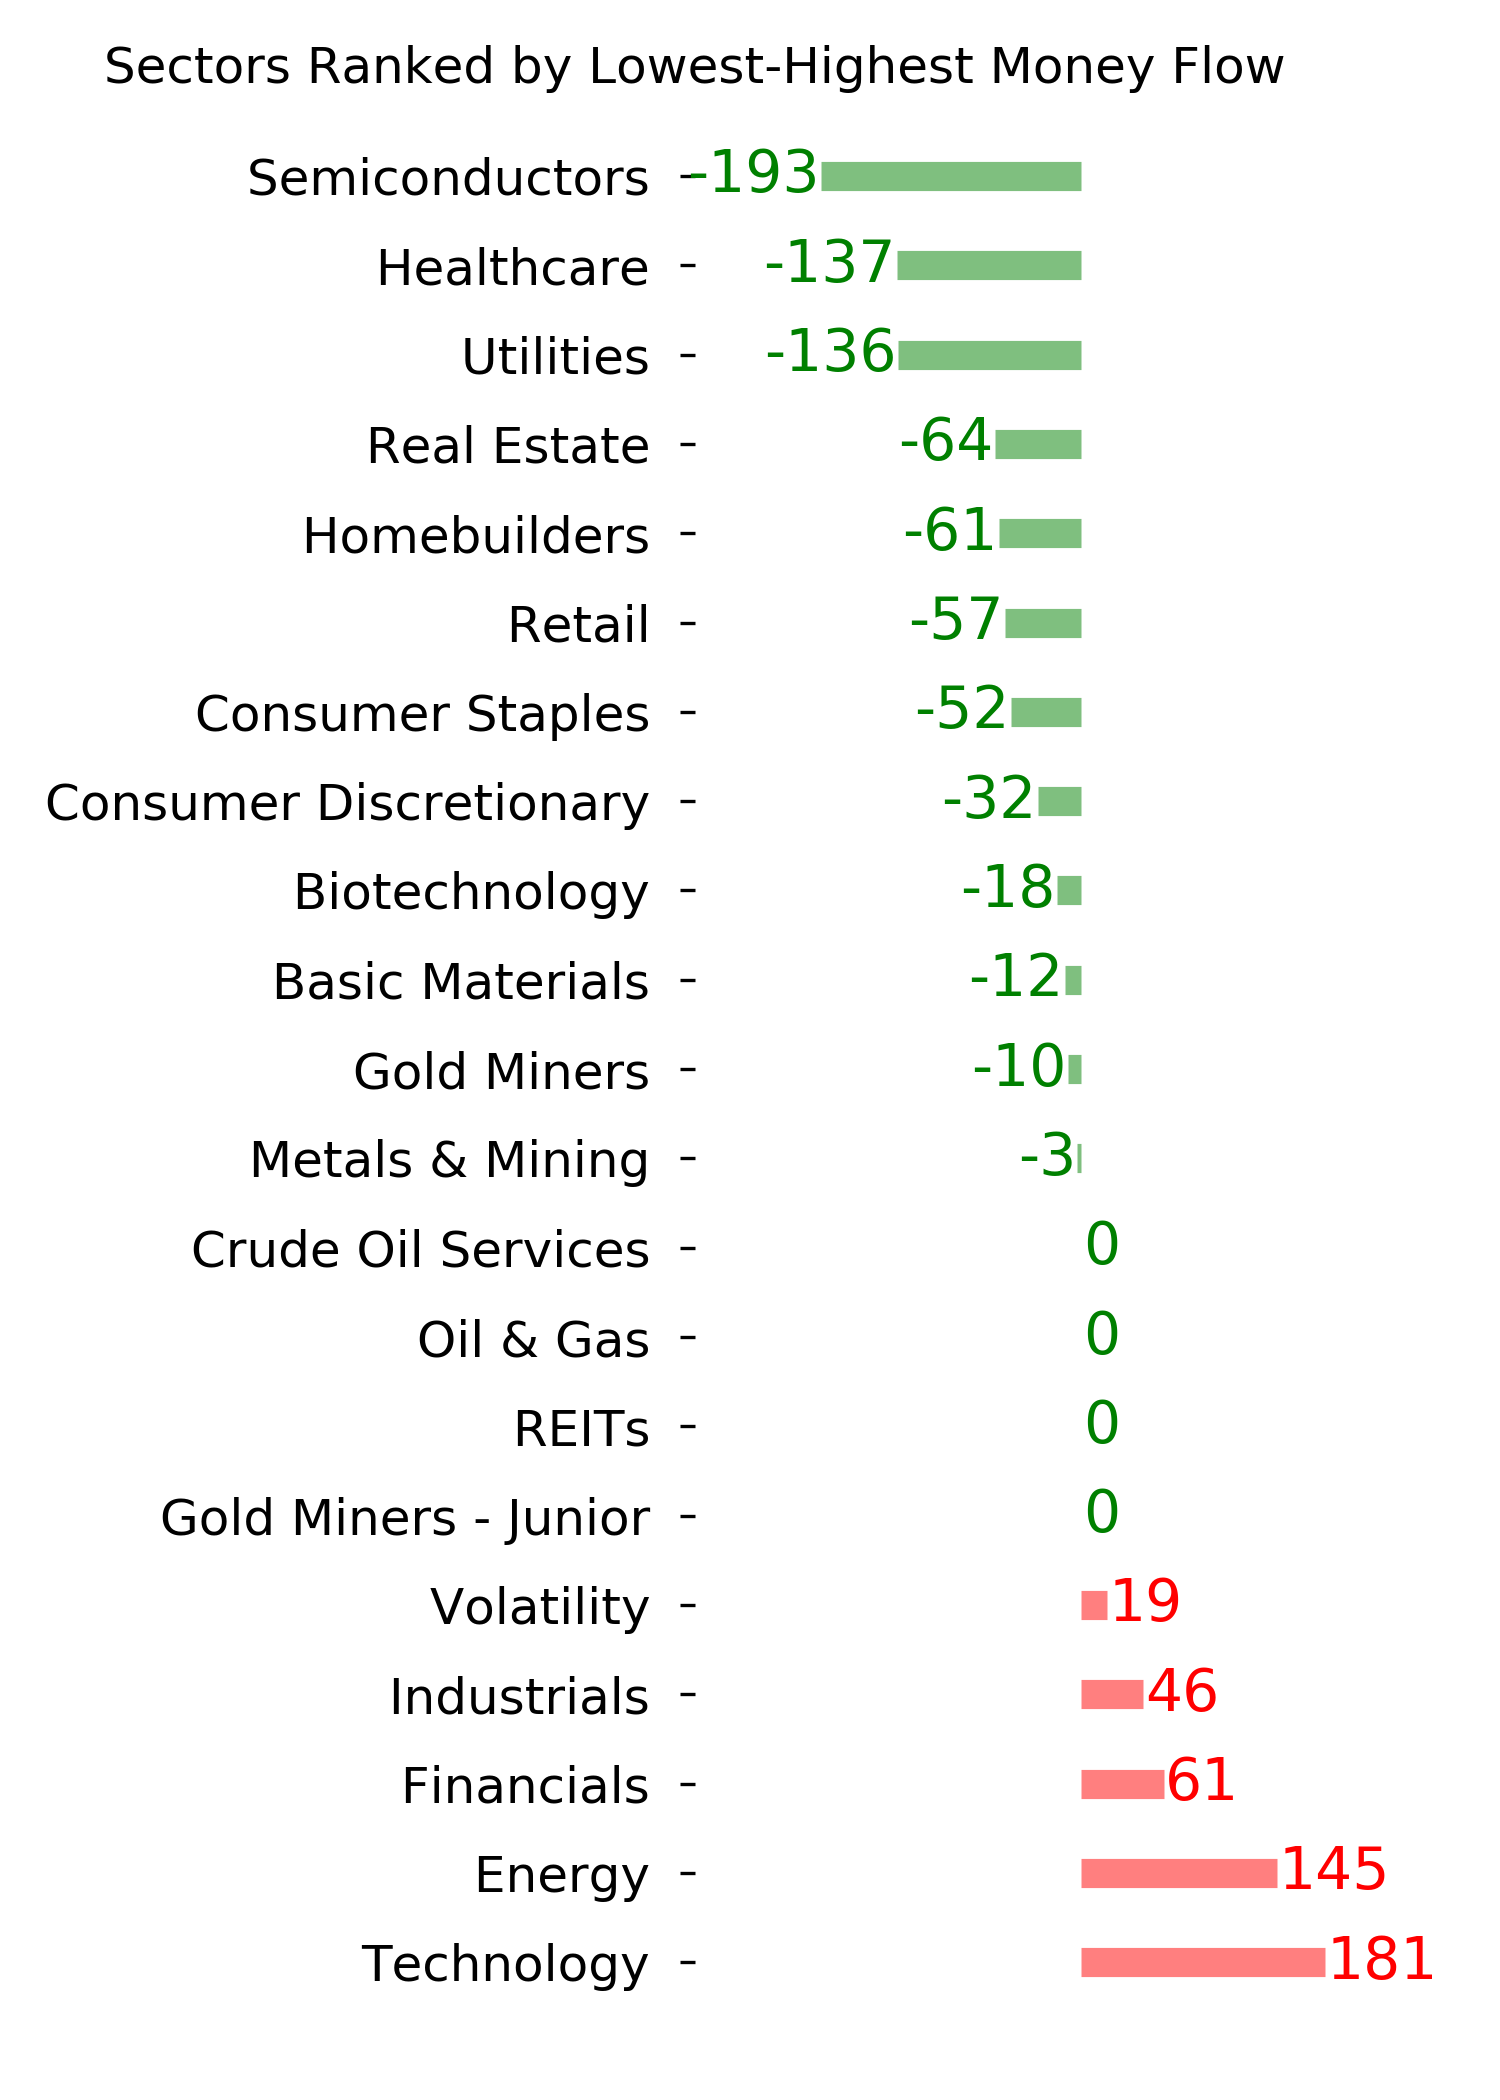
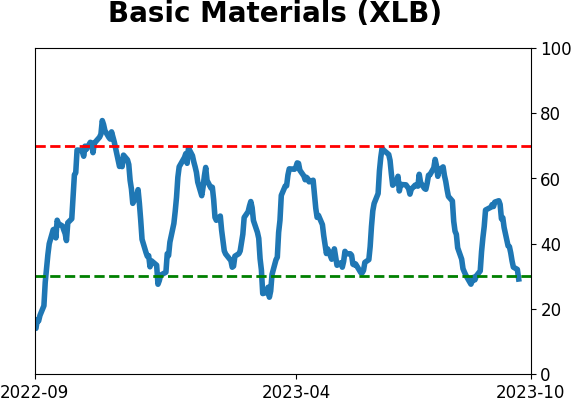
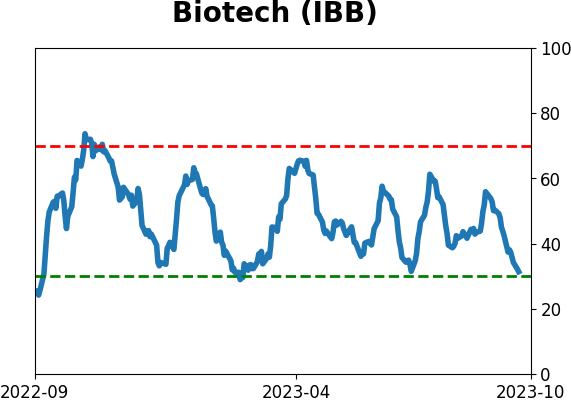
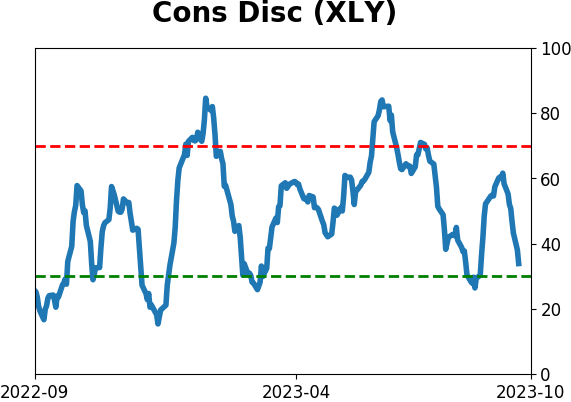
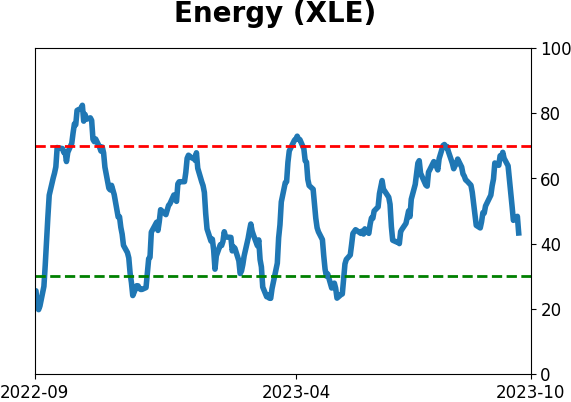
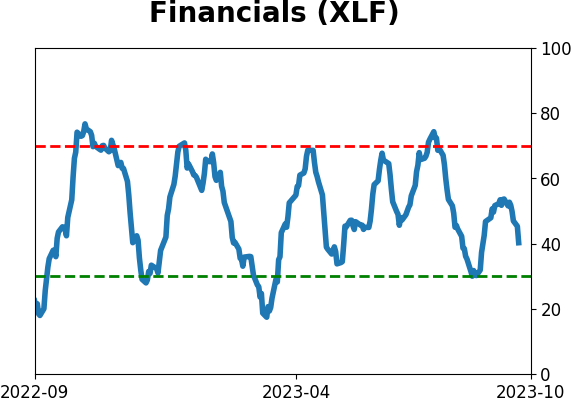
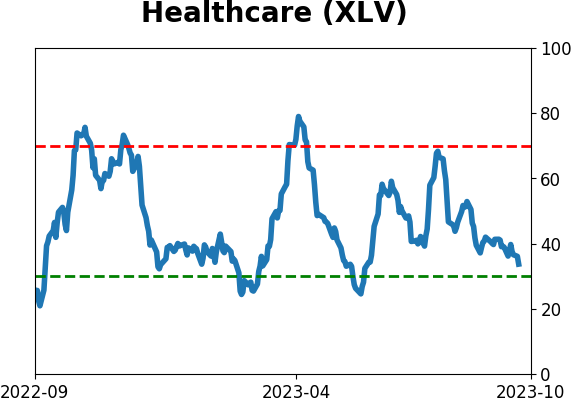
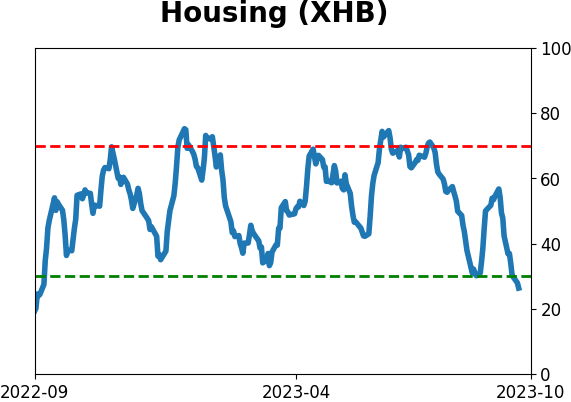
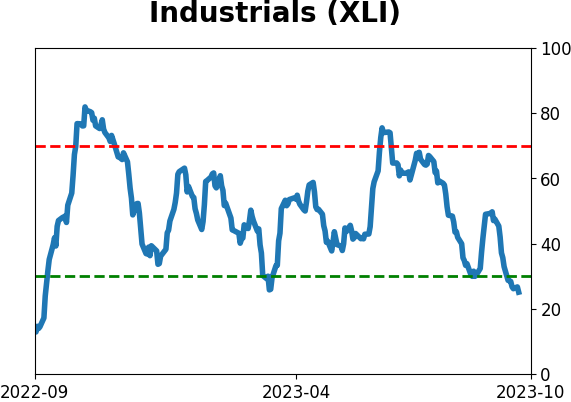
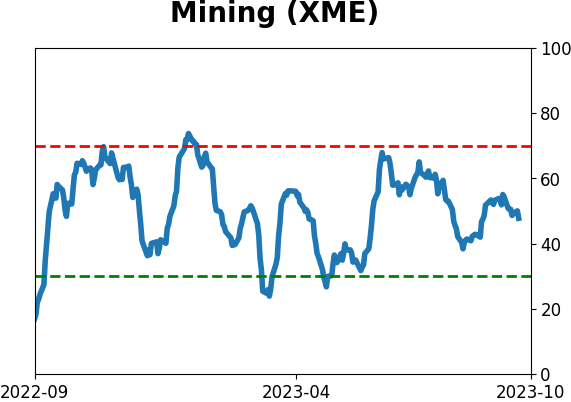
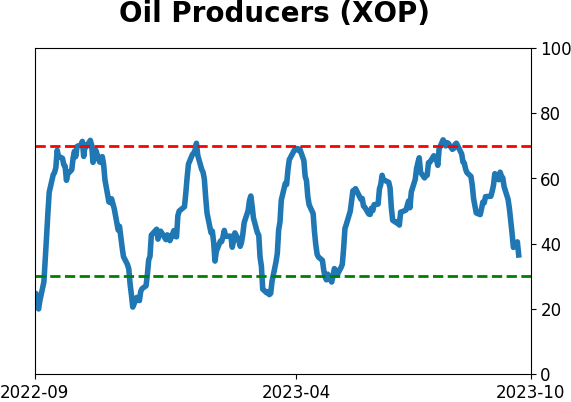
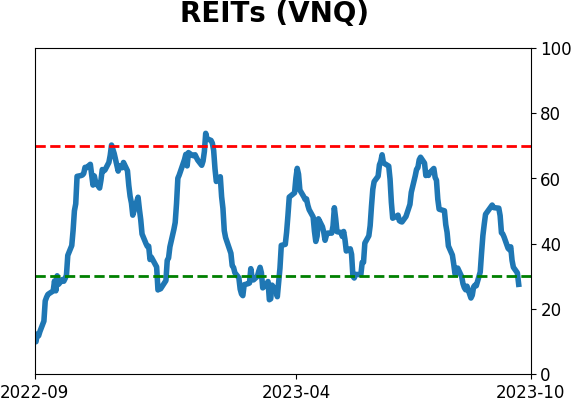
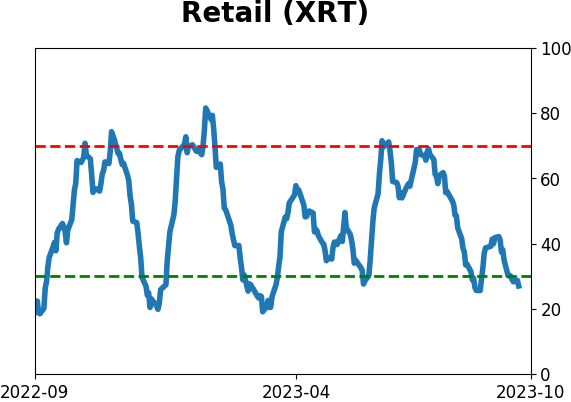
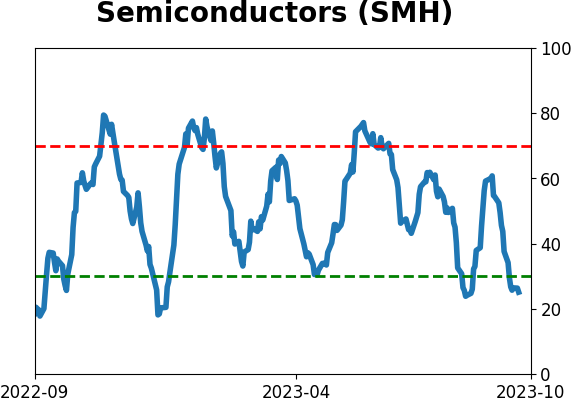
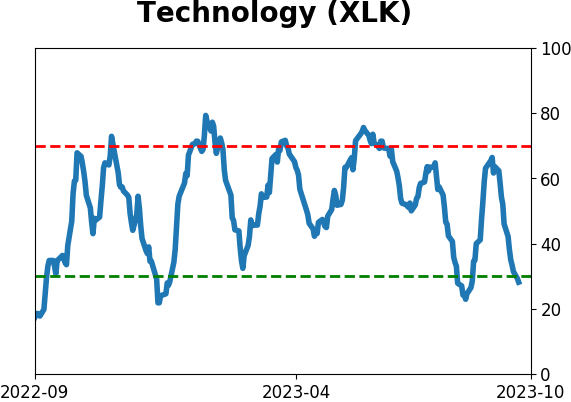
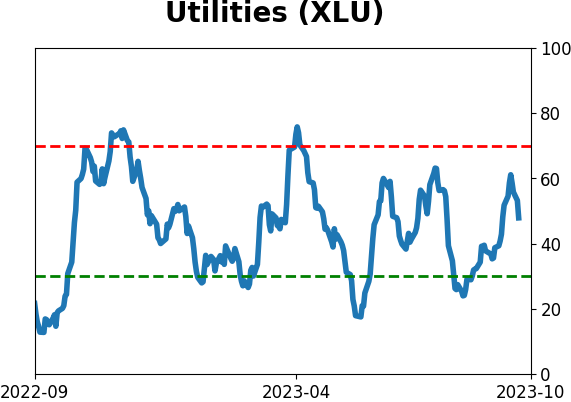
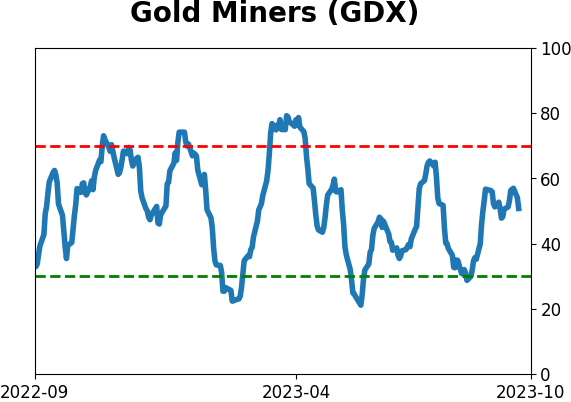
Sector ETF's - 10-Day Moving Average
|
|
|
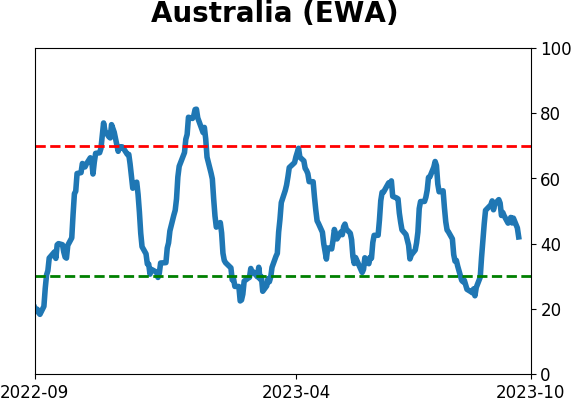
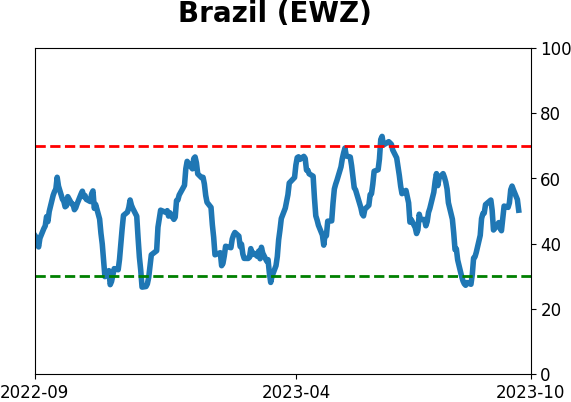
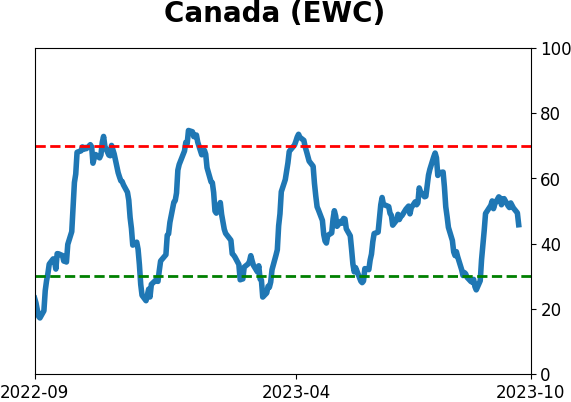
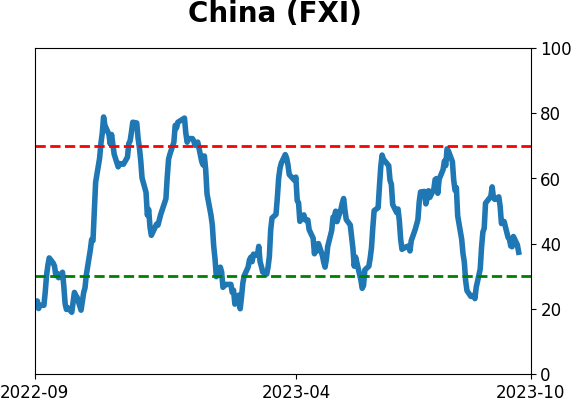
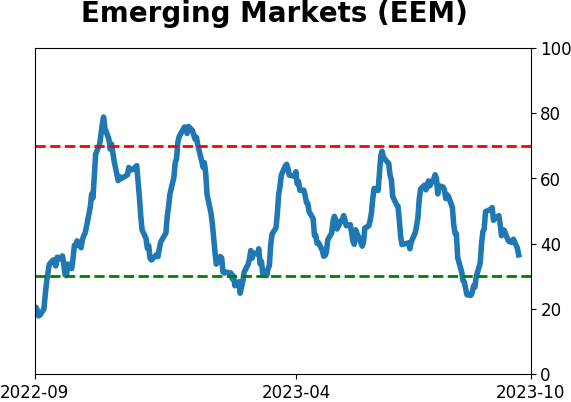
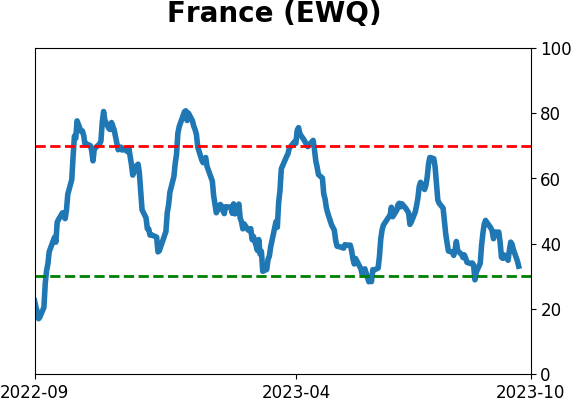
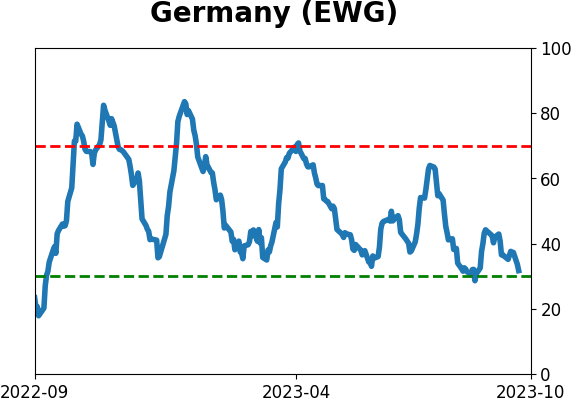
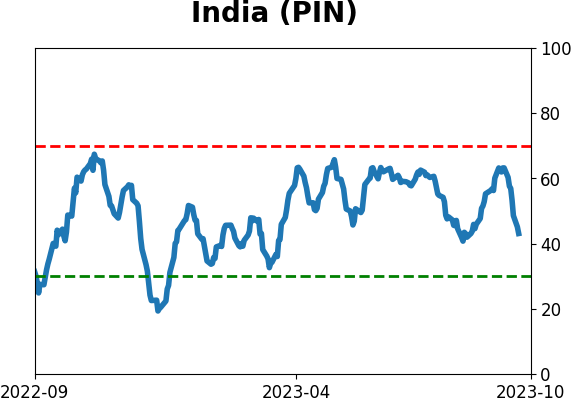
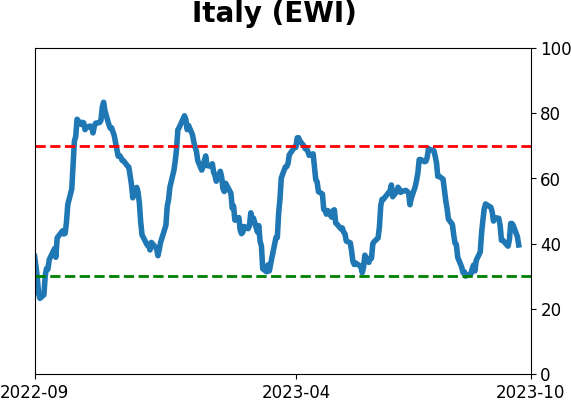
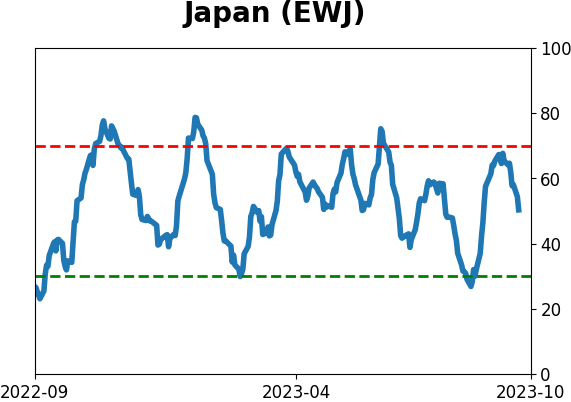
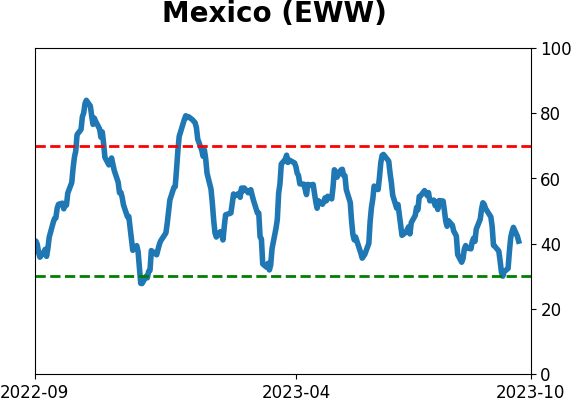
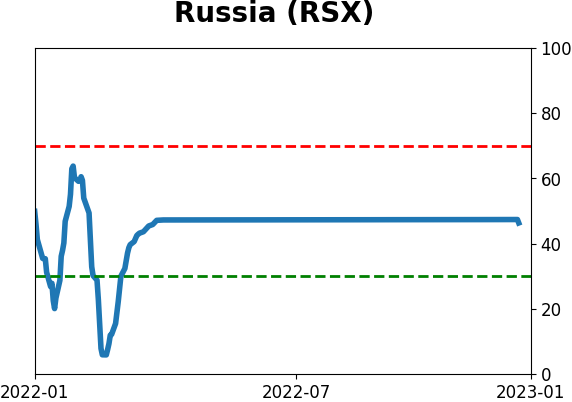
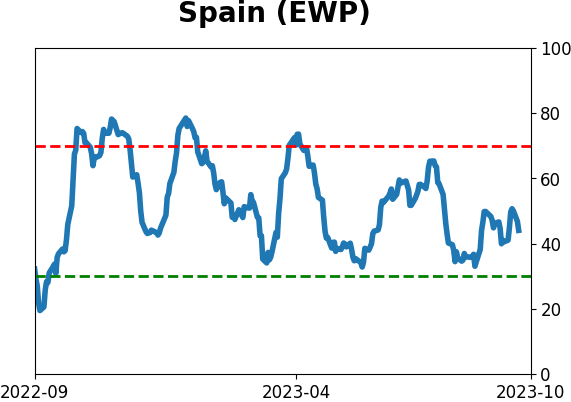
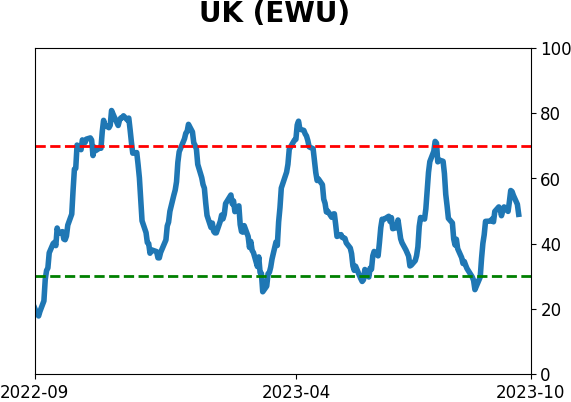
Country ETF's - 10-Day Moving Average
|
|
|
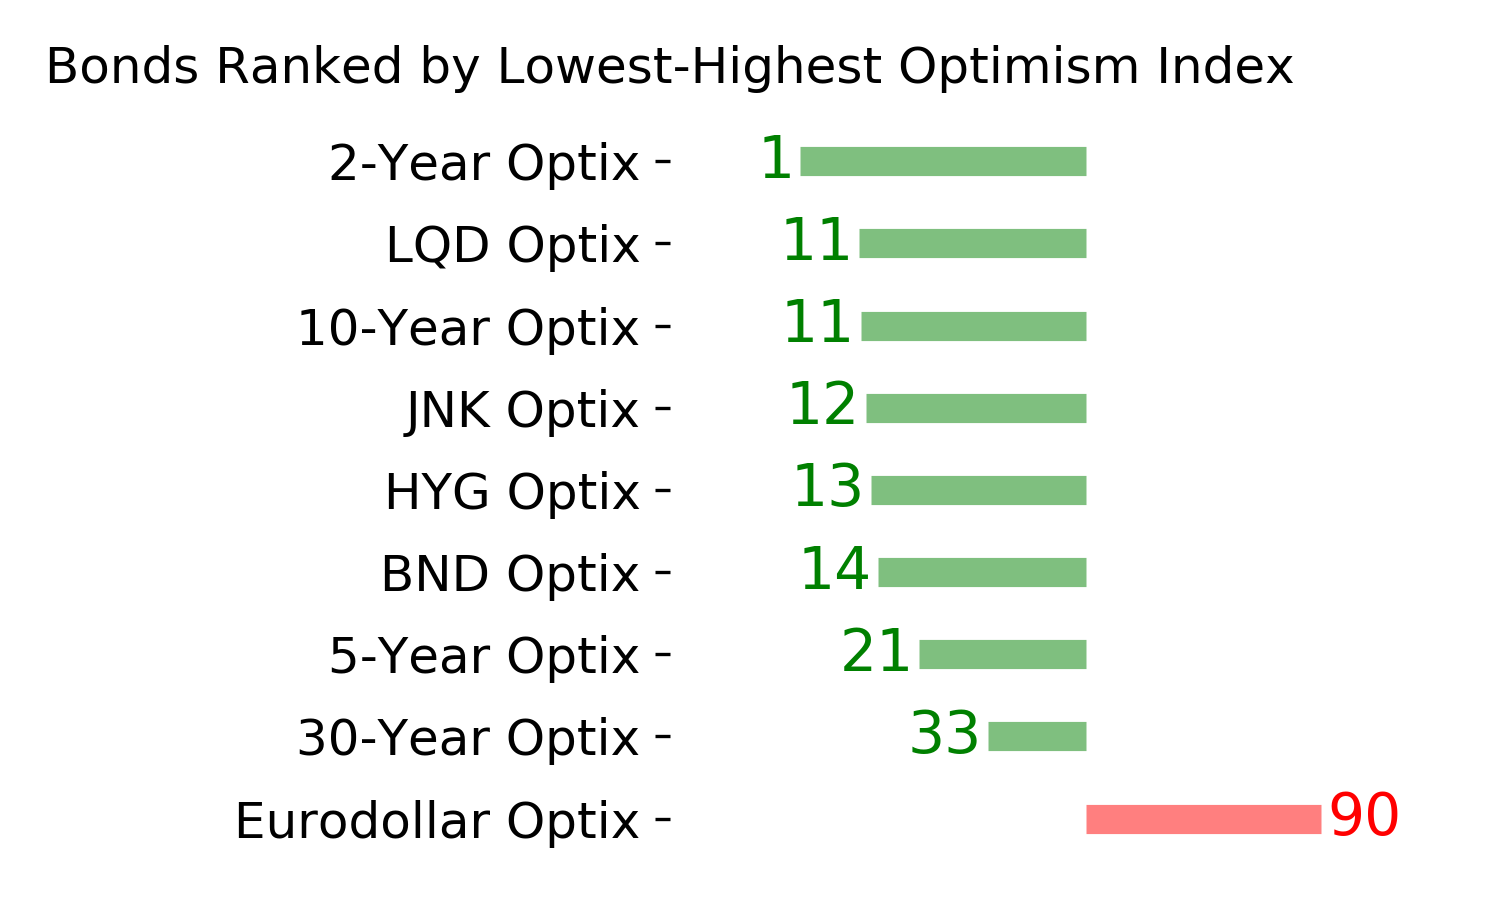
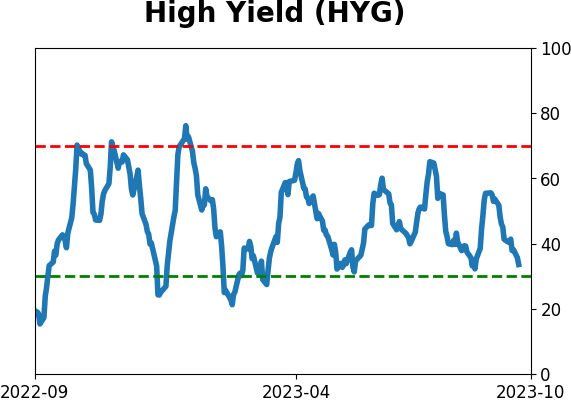
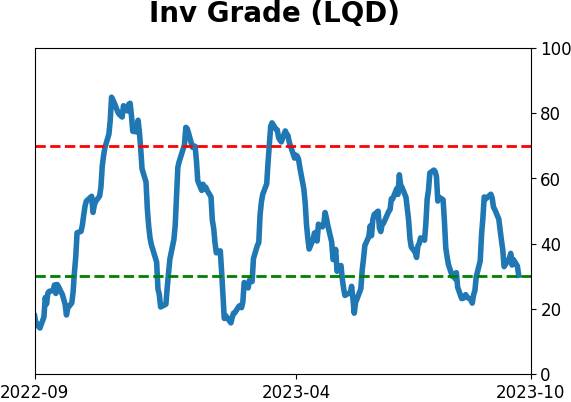
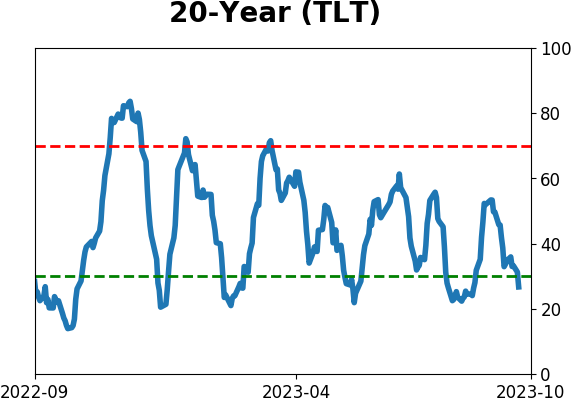
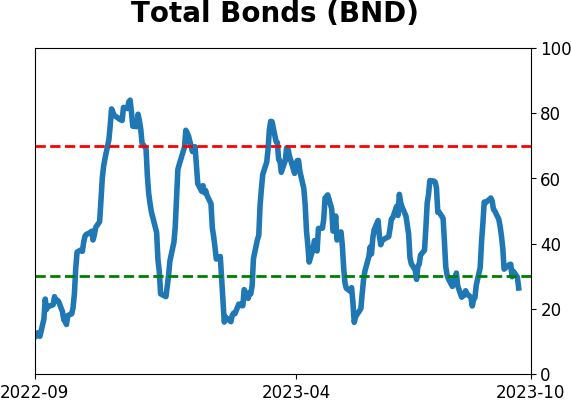
Bond ETF's - 10-Day Moving Average
|
|
|
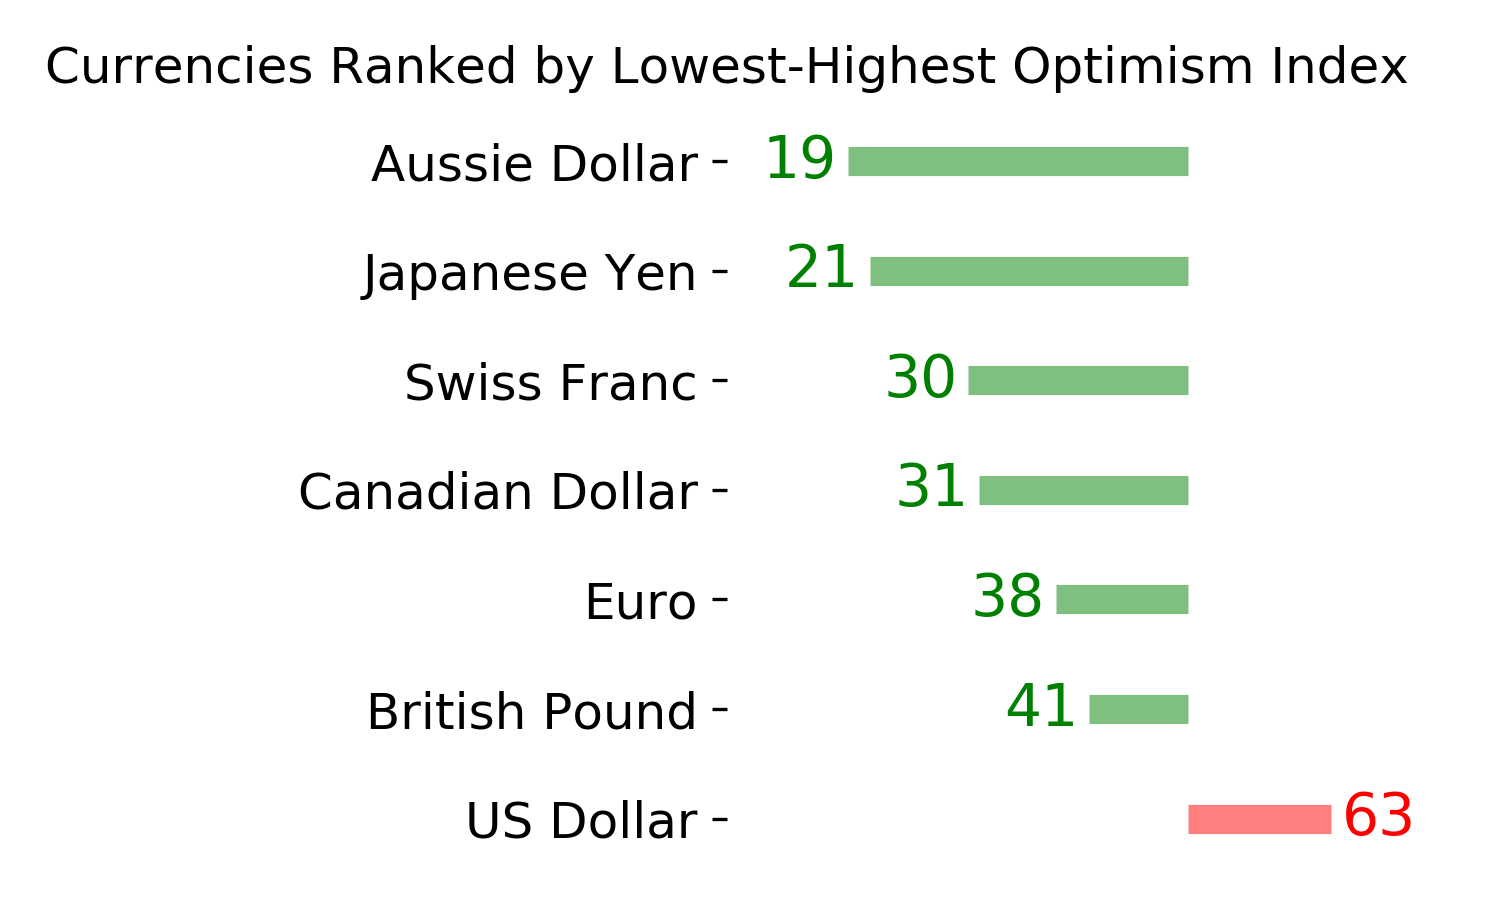
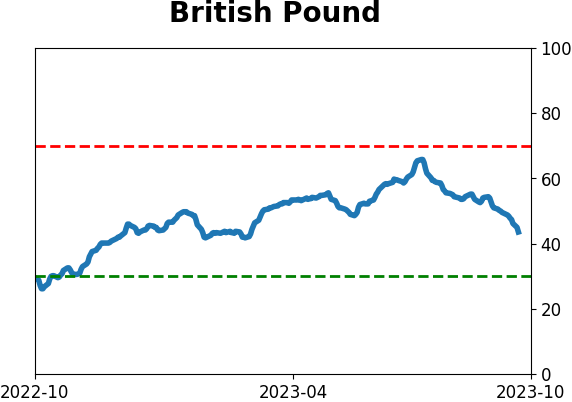
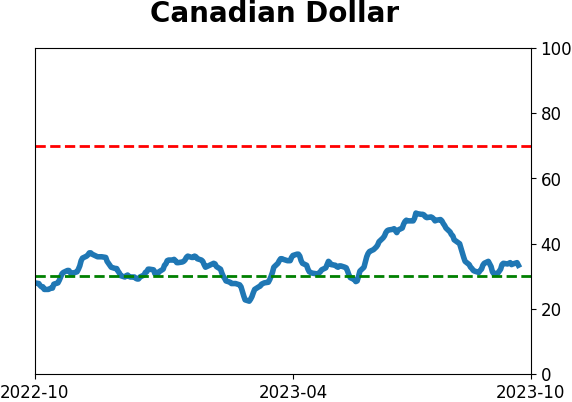
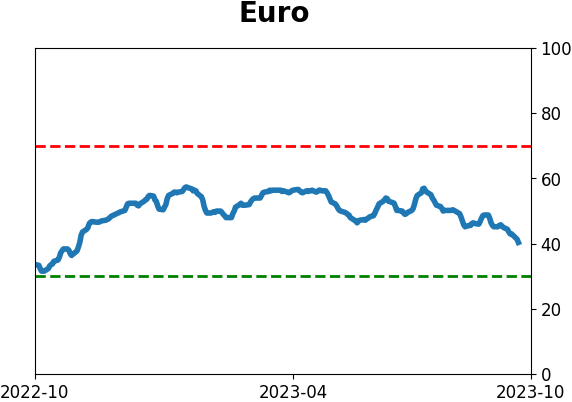
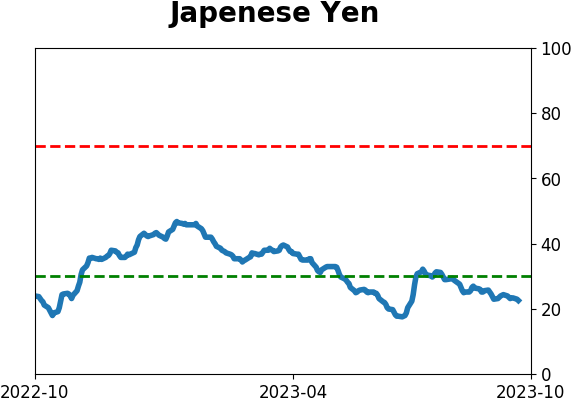
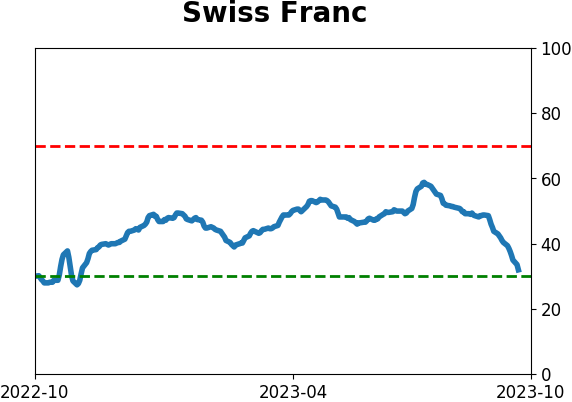
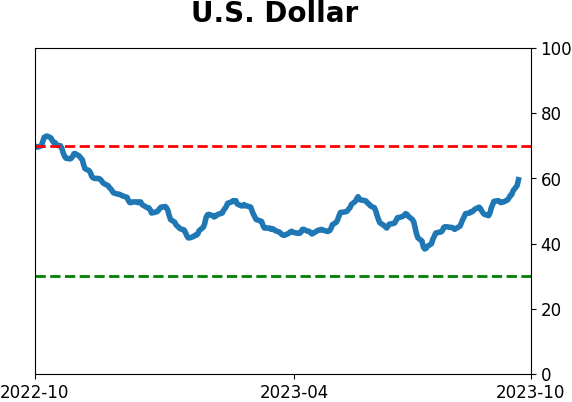
Currency ETF's - 5-Day Moving Average
|
|
|
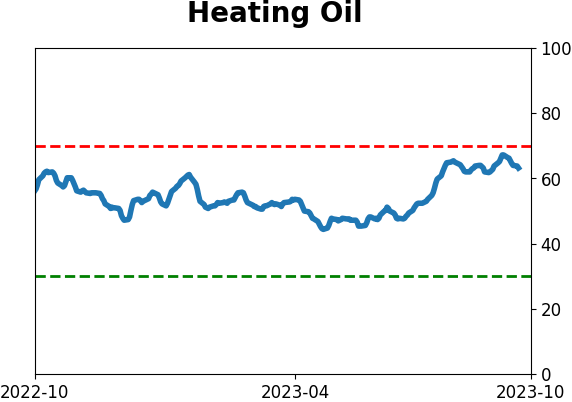
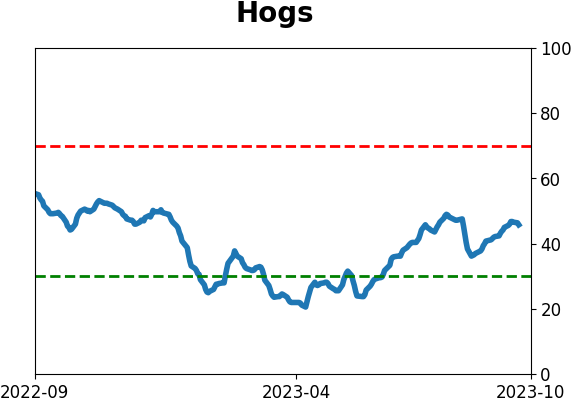
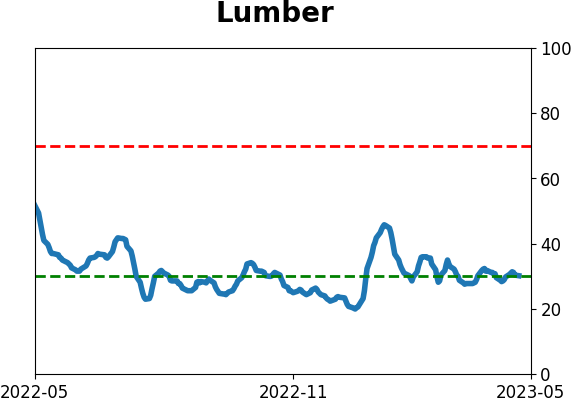
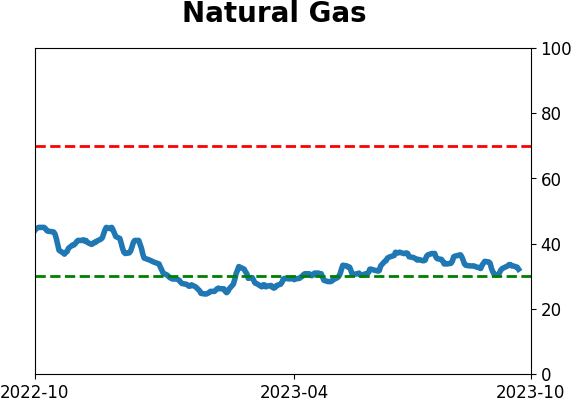
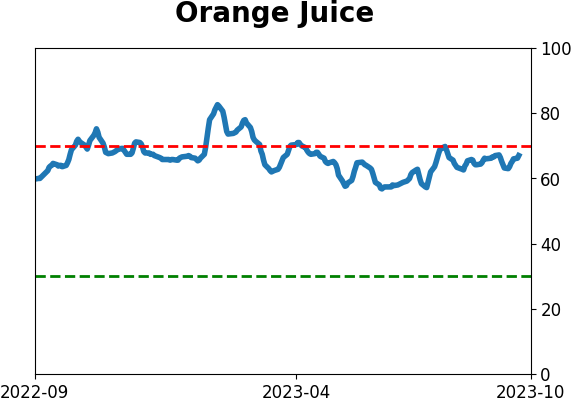
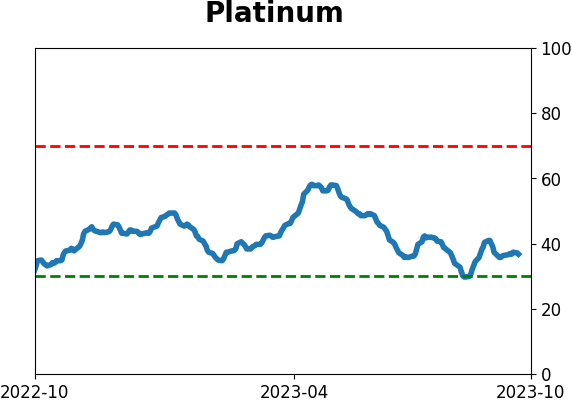
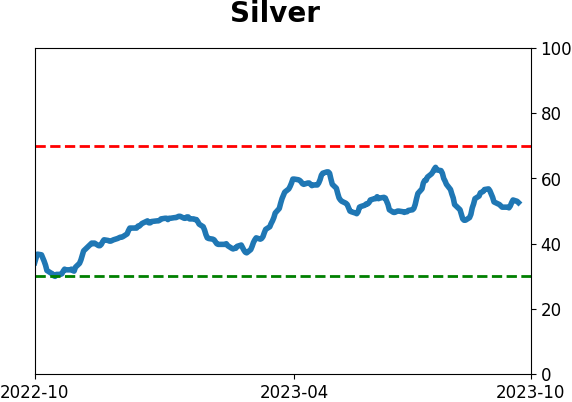
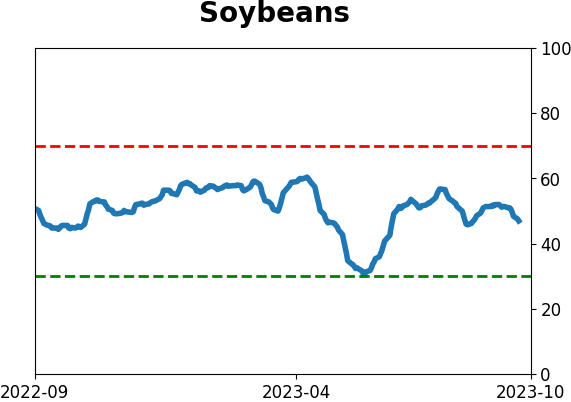
Commodity ETF's - 5-Day Moving Average
|
|