Headlines
|
|
Investors give up on big tech:
Big tech stocks have been hammered in recent weeks. The percentage of stocks in the Nasdaq 100 in short-, medium- and long-term uptrends has plummeted to one of the lowest readings since 1985. All similar periods preceded gains over the following year. Other signs have emerged that investors are panicking.
|
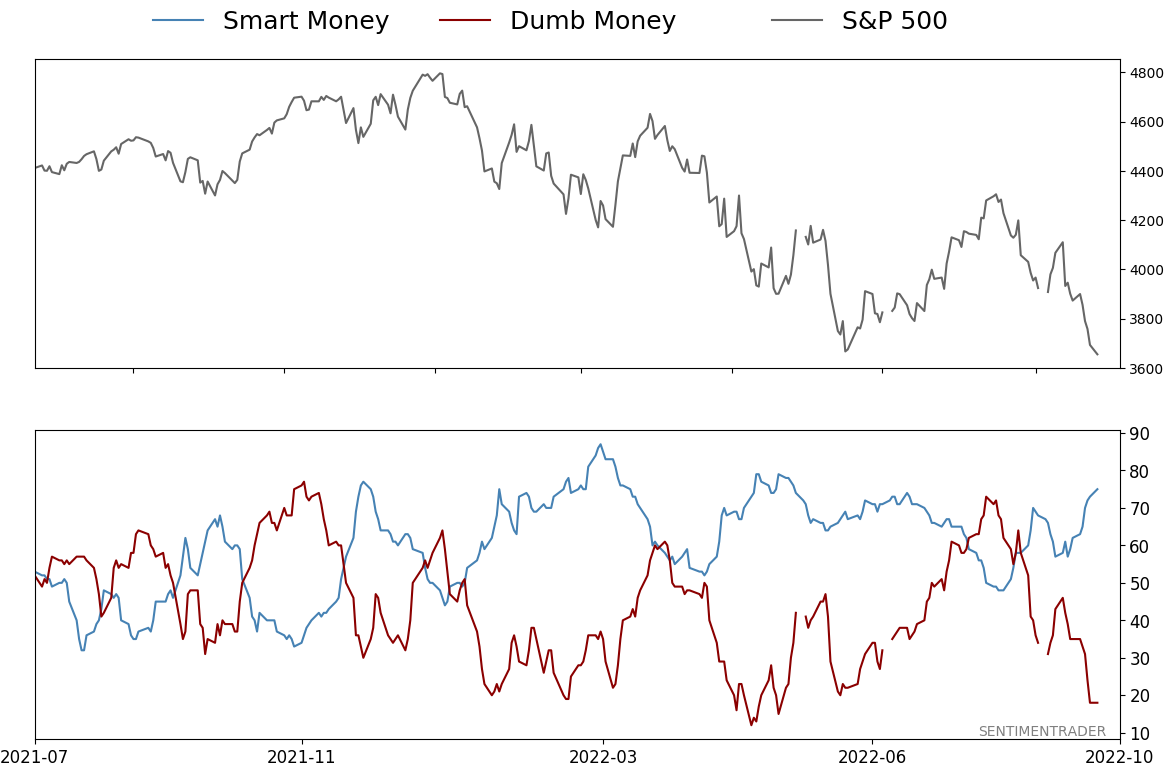
Smart / Dumb Money Confidence
|
Smart Money Confidence: 75%
Dumb Money Confidence: 18%
|
|
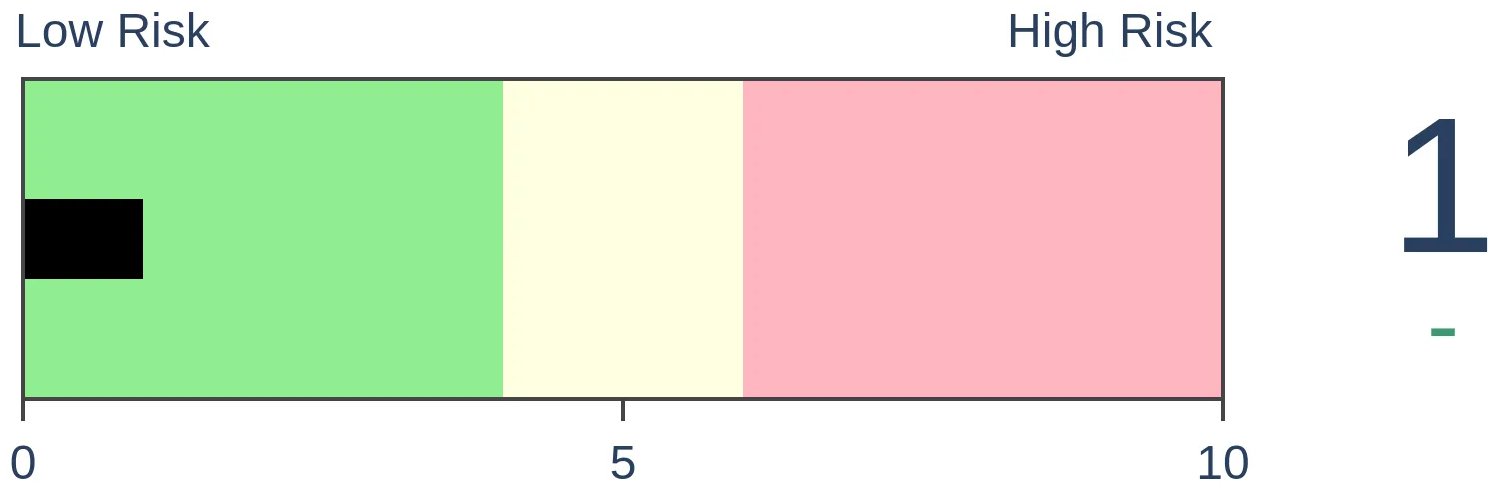
Risk Levels
Stocks Short-Term
|
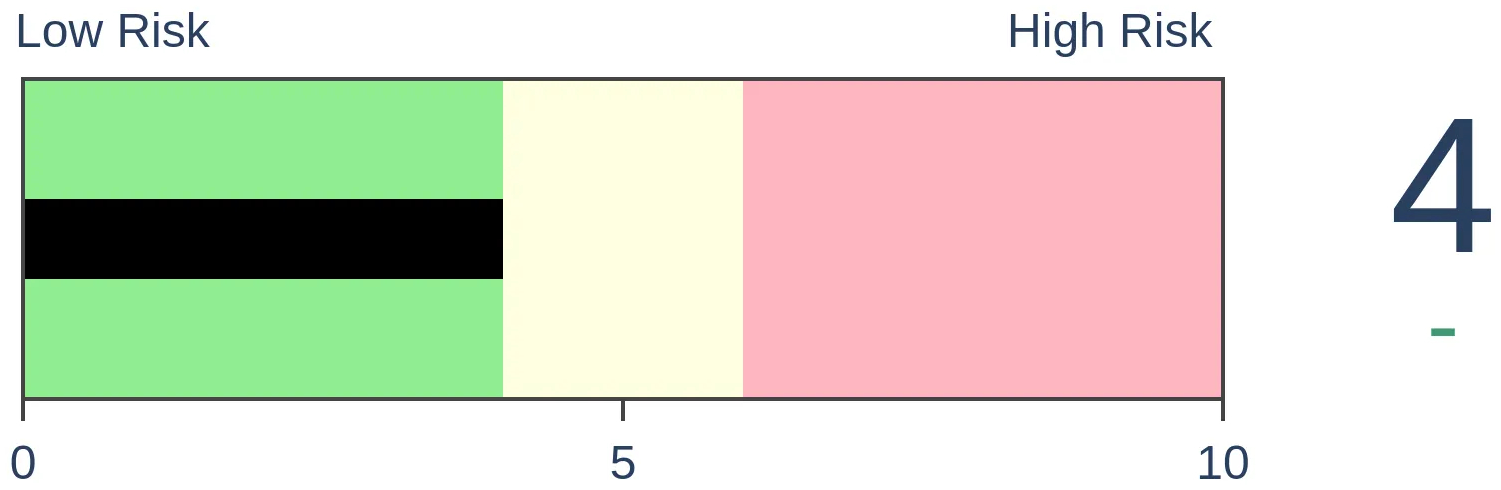
Stocks Medium-Term

|
|
Bonds

|
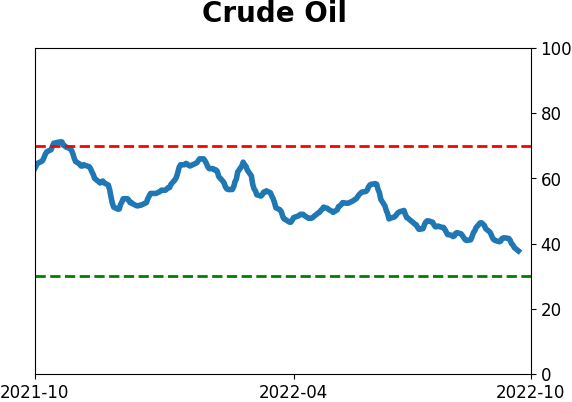
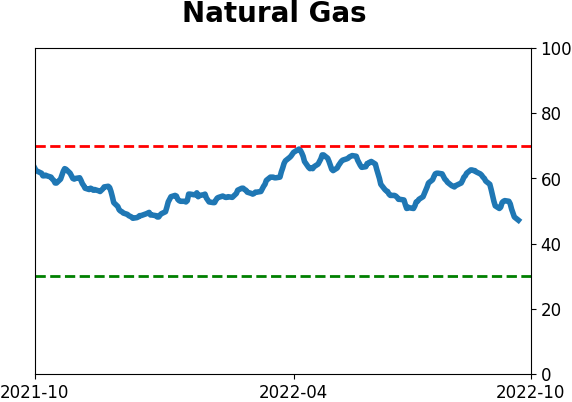
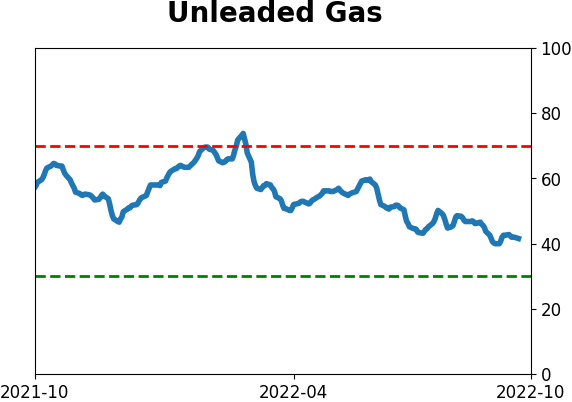
Crude Oil
|
|
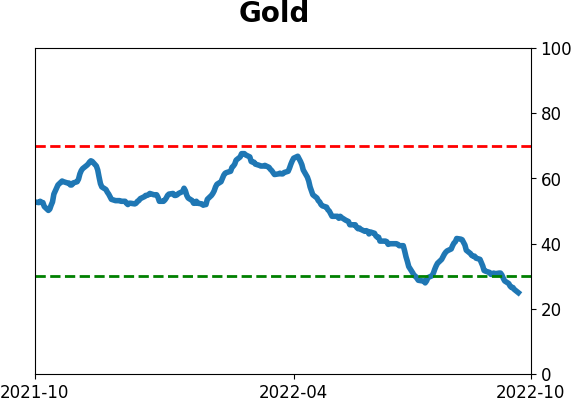
Gold

|
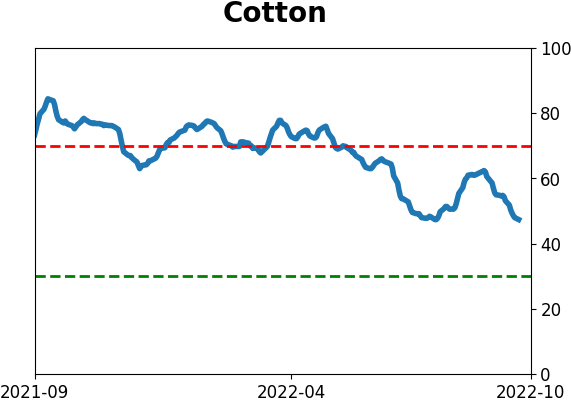
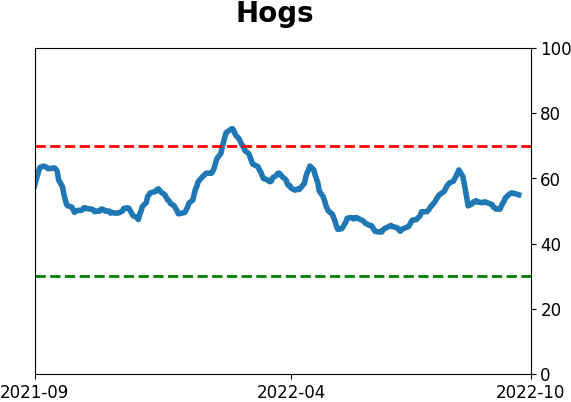
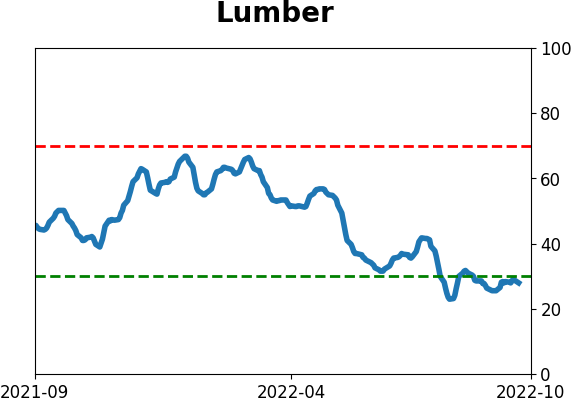
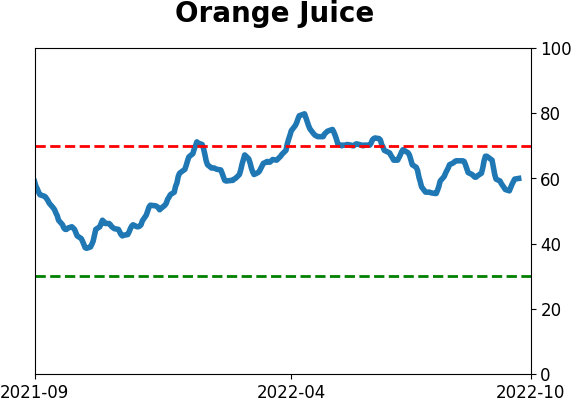
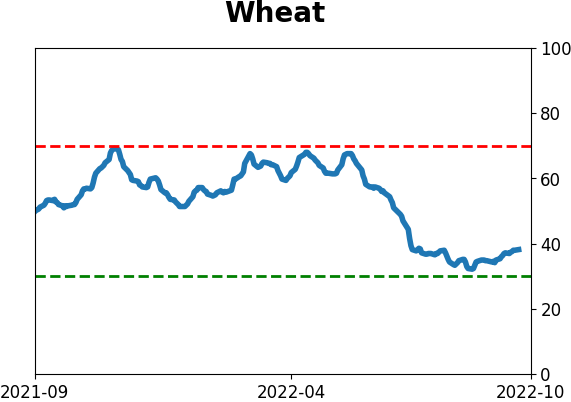
Agriculture
|
|
Research
By Jason Goepfert
BOTTOM LINE
Big tech stocks have been hammered in recent weeks. The percentage of stocks in the Nasdaq 100 in short-, medium- and long-term uptrends has plummeted to one of the lowest readings since 1985. All similar periods preceded gains over the following year. Other signs have emerged that investors are panicking.
FORECAST / TIMEFRAME
QQQ -- Up, Long-Term
|
Key points:
- So few Nasdaq 100 stocks are in uptrends that it compares with the worst selling in nearly 30 years
- Signs of panic have increased, including high correlations and high put option activity
- Corporate insiders have pulled back on buying, but that's from a record level
Uptrends go "poof" as selling accelerates
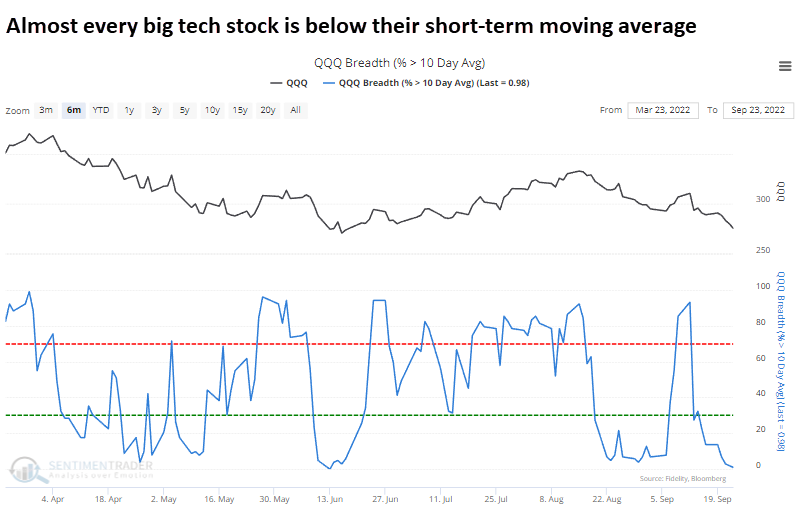
Big tech stocks keep getting slammed, and uptrends on any time frame are becoming scarce.
Among stocks in the Nasdaq 100 index (NDX), almost all are below their 10-day moving average.
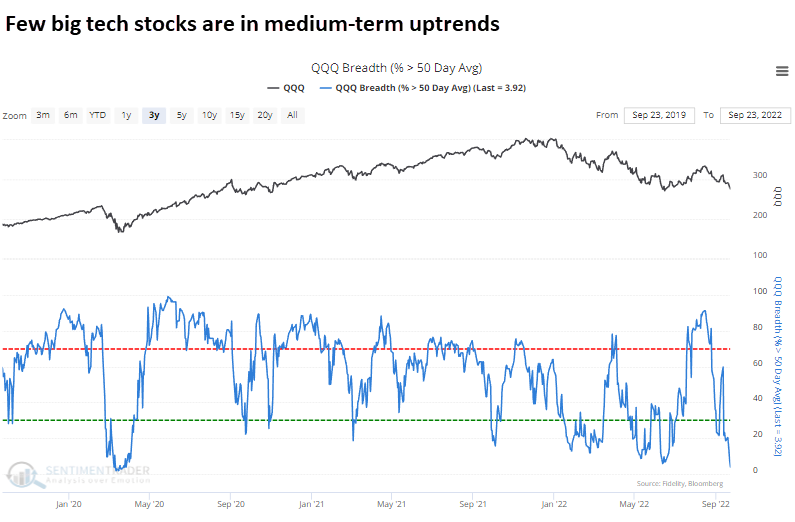
Virtually all have also dropped below their 50-day moving average.
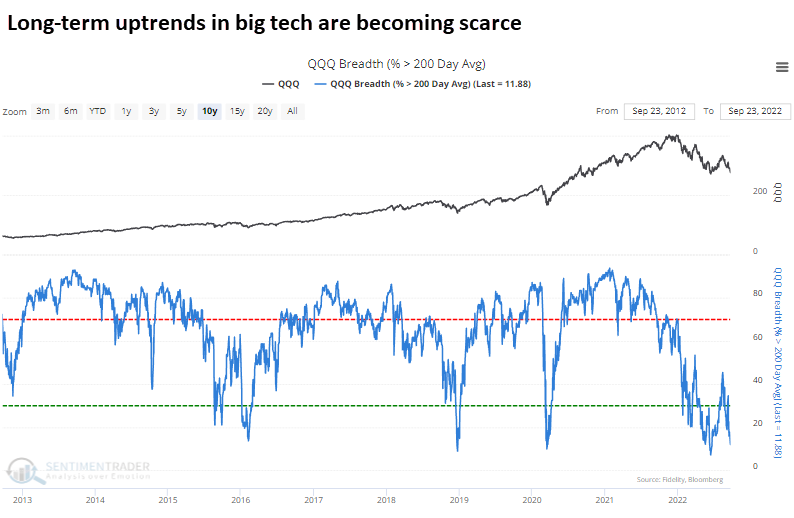
Even long-term uptrends have reversed strongly, with fewer than 15% of stocks above their 200-day average.
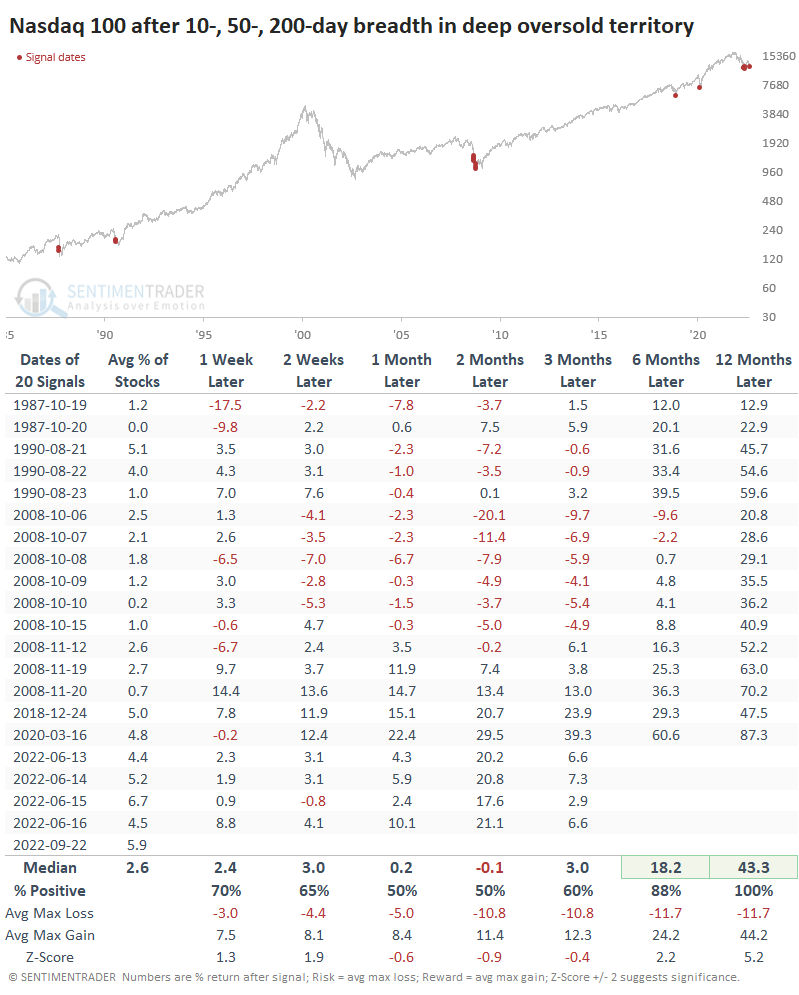
We use various data sources to compile our data, particularly in earlier periods. If we average them together, we can better understand how extreme this selling pressure is. And it's genuinely extreme.
Since the inception of the NDX in 1985, there have only been 20 other days with readings this low across all three breadth metrics. Following the others, big tech stocks suffered wild swings in the weeks and months ahead, with both large gains and losses.
Every instance, however, was the beginning of a significant bottom. Over the next year, the NDX showed a positive return every time, with a minimum gain of about 13% and an average of more than 43% (!).
Signs of panic as investors sell stocks en masse, buy puts, and are generally miserable
As the selling accelerated to end the week, more than 90% of big tech stocks in the NDX fell back into a correction, down more than 10% from their peak.
The Backtest Engine shows that this mainly occurred during the worst markets of the past 22+ years, but returns in the index over the next 3-6 months were still positive more than 80% of the time.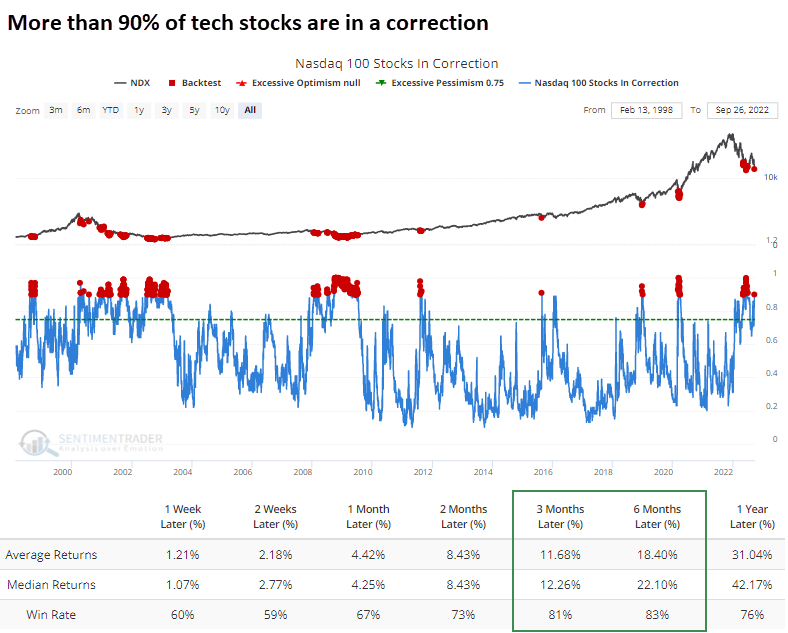
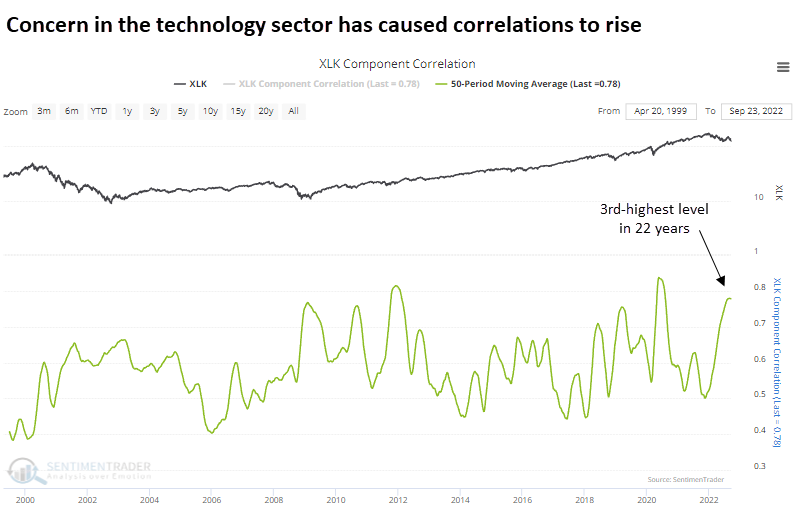
When people panic, they sell everything simultaneously, regardless of the merits of the individual stocks. Within the broader tech universe, the average correlation among stocks has averaged 0.78 over the past 50 days, the 3rd-highest in 22 years. The only other times with a higher correlation were the fall of 2011 and spring of 2020.
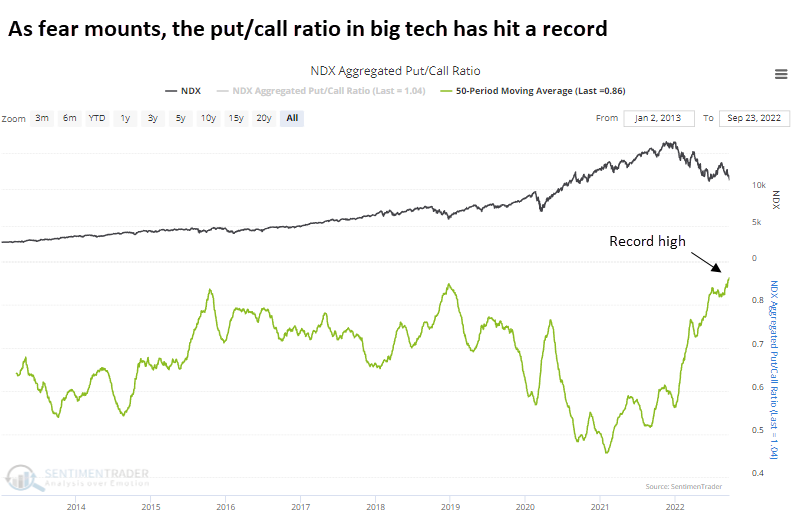
Of course, panicking traders also buy put options to protect their portfolios or speculate on further downside. And among big tech stocks, the 50-day average put/call ratio has now climbed above 0.85, the highest since we have data back to 2013.
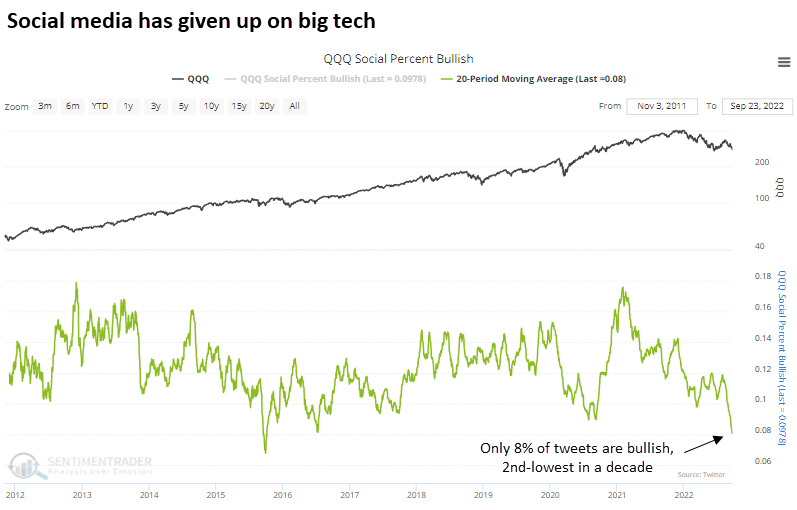
Within the chaotic maelstrom of social media, only 8% of postings about the Invesco QQQ Trust (QQQ), which tracks the Nasdaq 100, have had a bullish tilt over the past 20 days. That's the 2nd-lowest amount in a decade, next to September 2015.
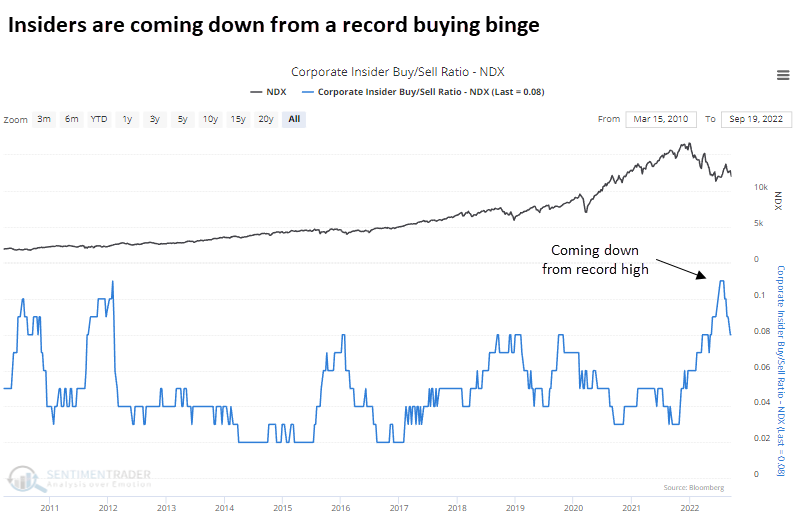
About the only people not panicking are corporate insiders. We've been showing this data for months because it's notable. Among stocks in the Nasdaq 100 index, the number of insiders buying their own shares versus selling hit a record high in July and has come down a bit since then.
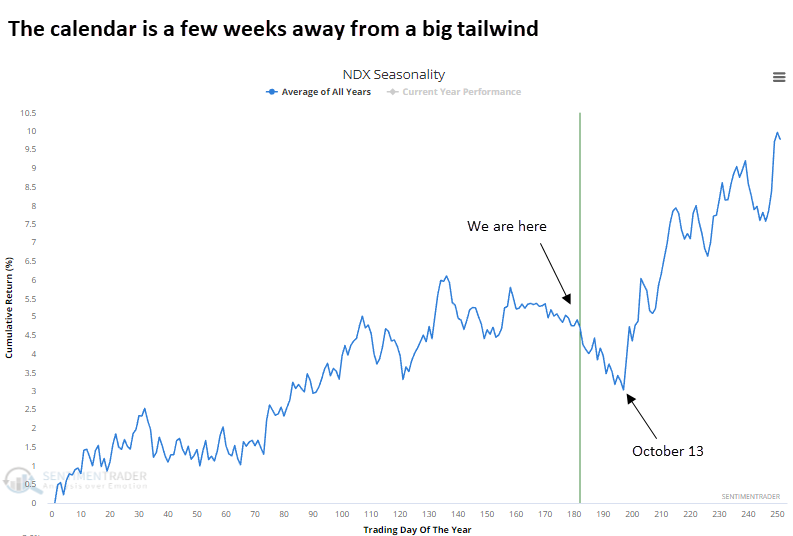
On a shorter-term basis, the tendency for volatility and extreme uncertainty in late September and early October is well-documented. So, the calendar for the NDX remains rocky for a few weeks before turning sharply higher around October 13.
What the research tells us...
During bear markets, there is a near-constant chorus of sirens singing songs about "oversold." It's so compelling that it lures investors into ignoring the potential rocks under the surface of the rolling waves. We're at such a place again, as the evidence of extremes has become compelling again. For risk-averse investors, especially those with shorter time frames, it's a hazardous environment because there is just as much risk of a vicious snap-back rally as a steep decline. While missing the low, waiting for signs of stabilization is often a better course from a risk/reward perspective.
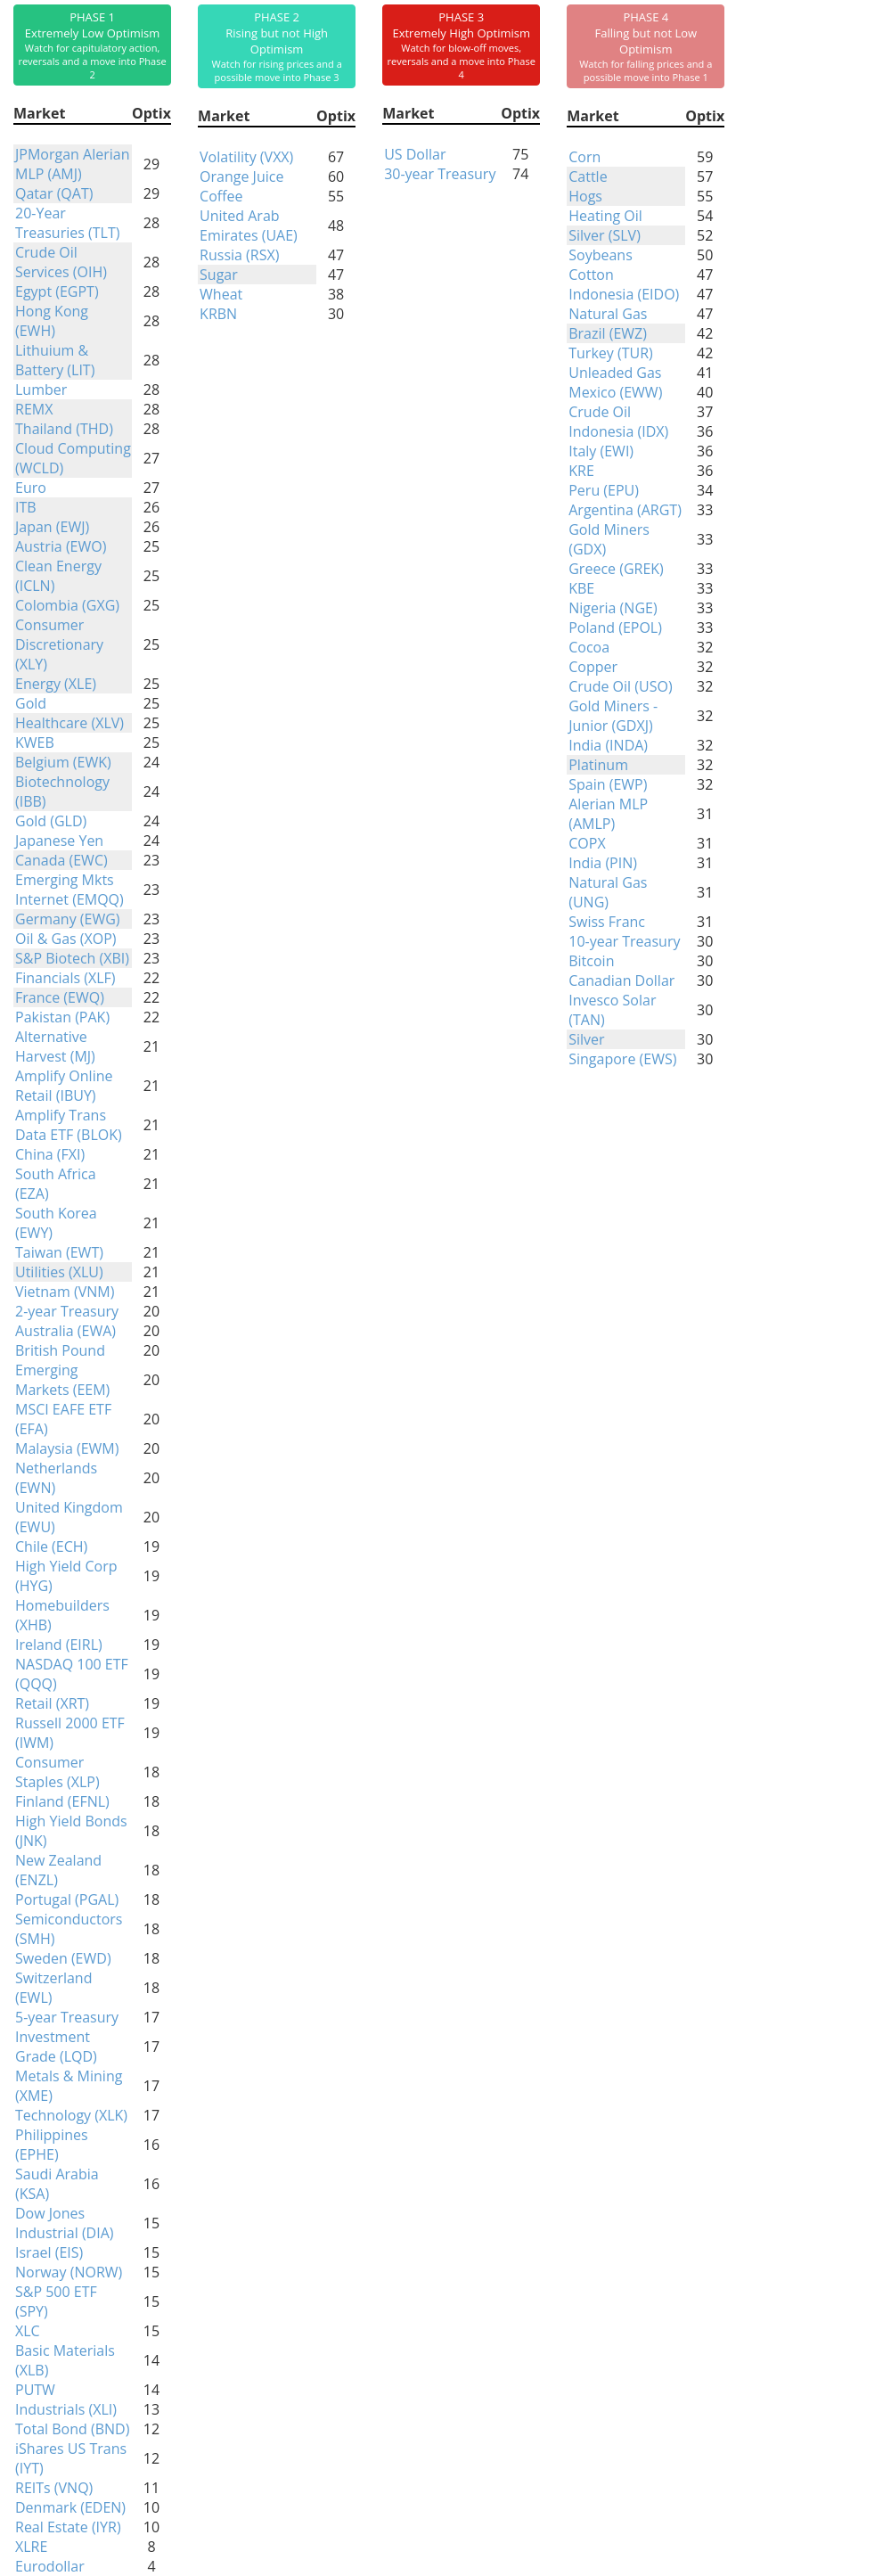
Indicators at Extremes
Phase Table
Ranks
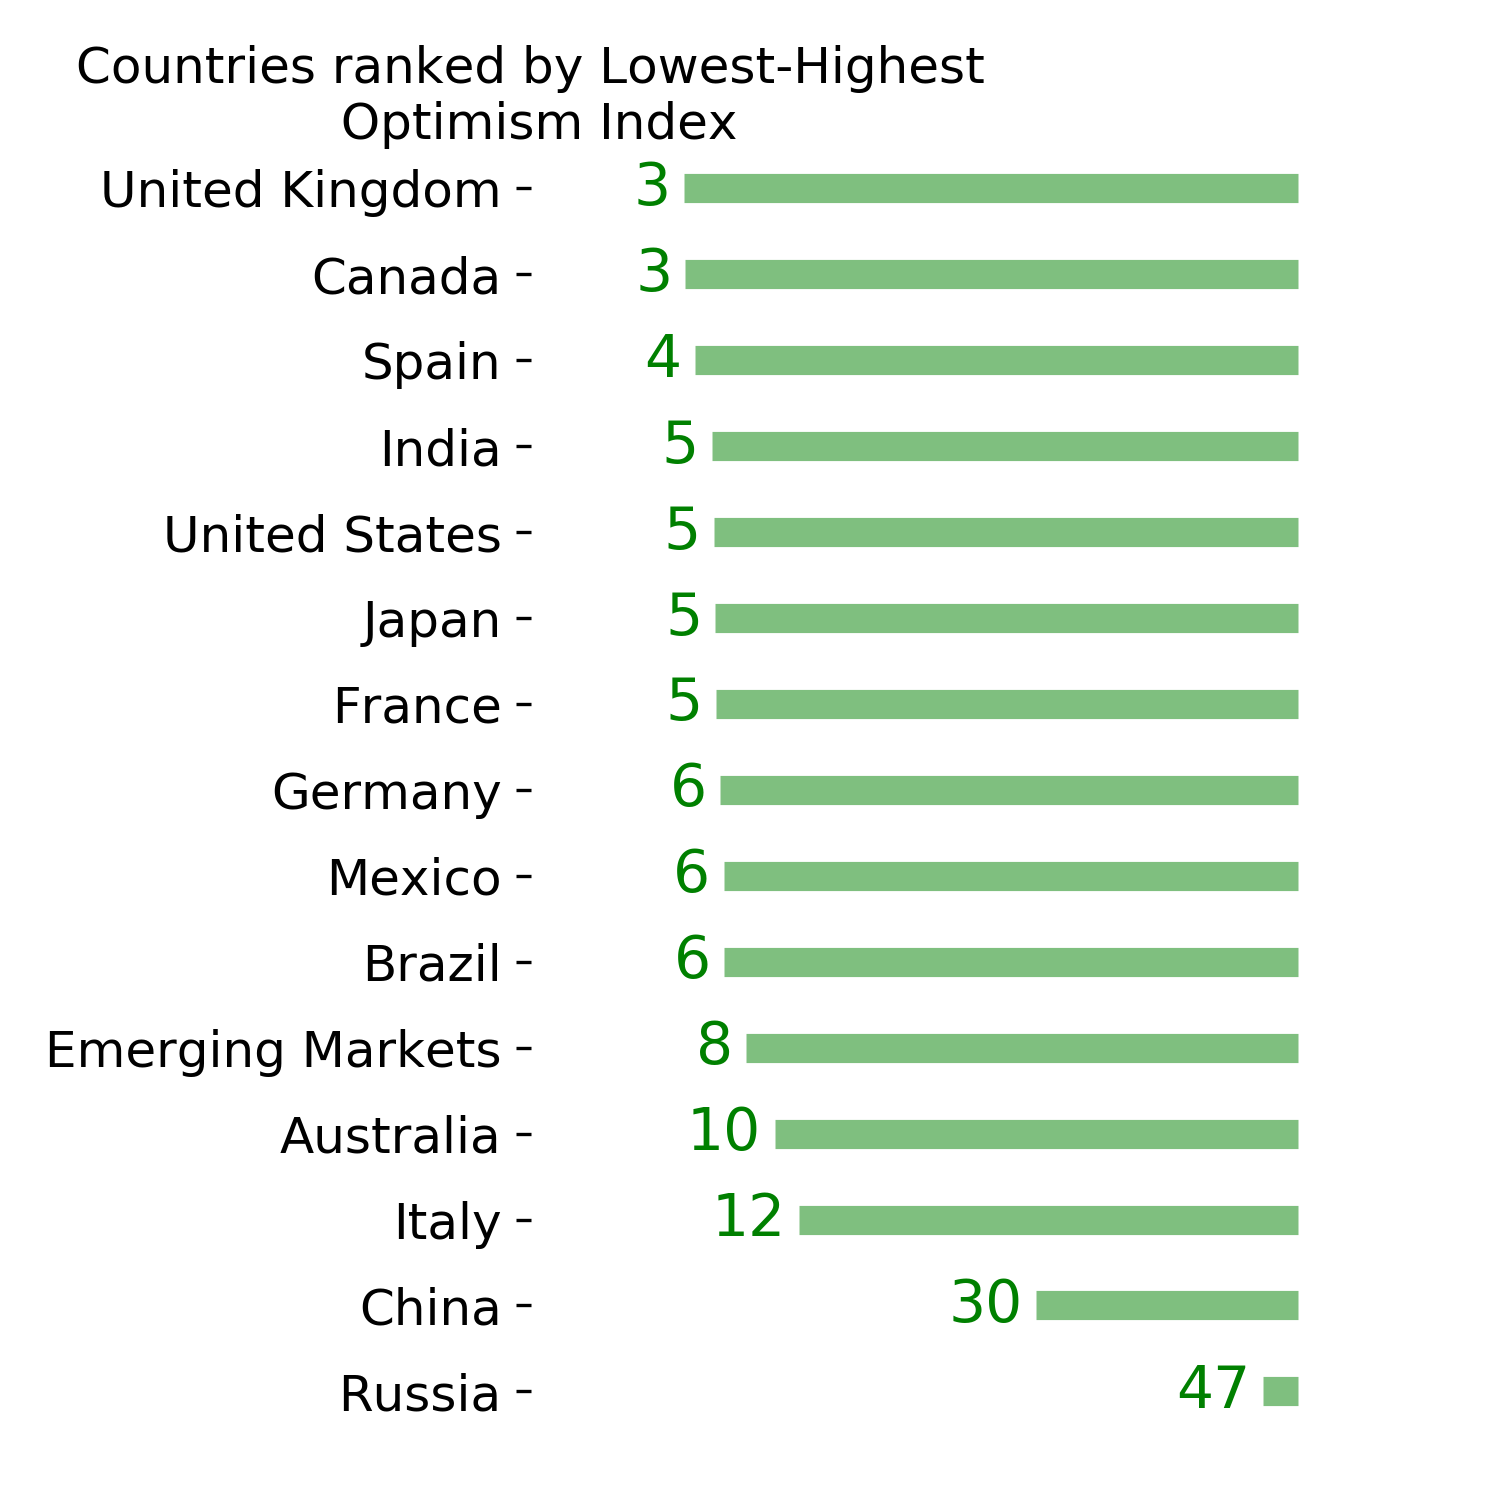
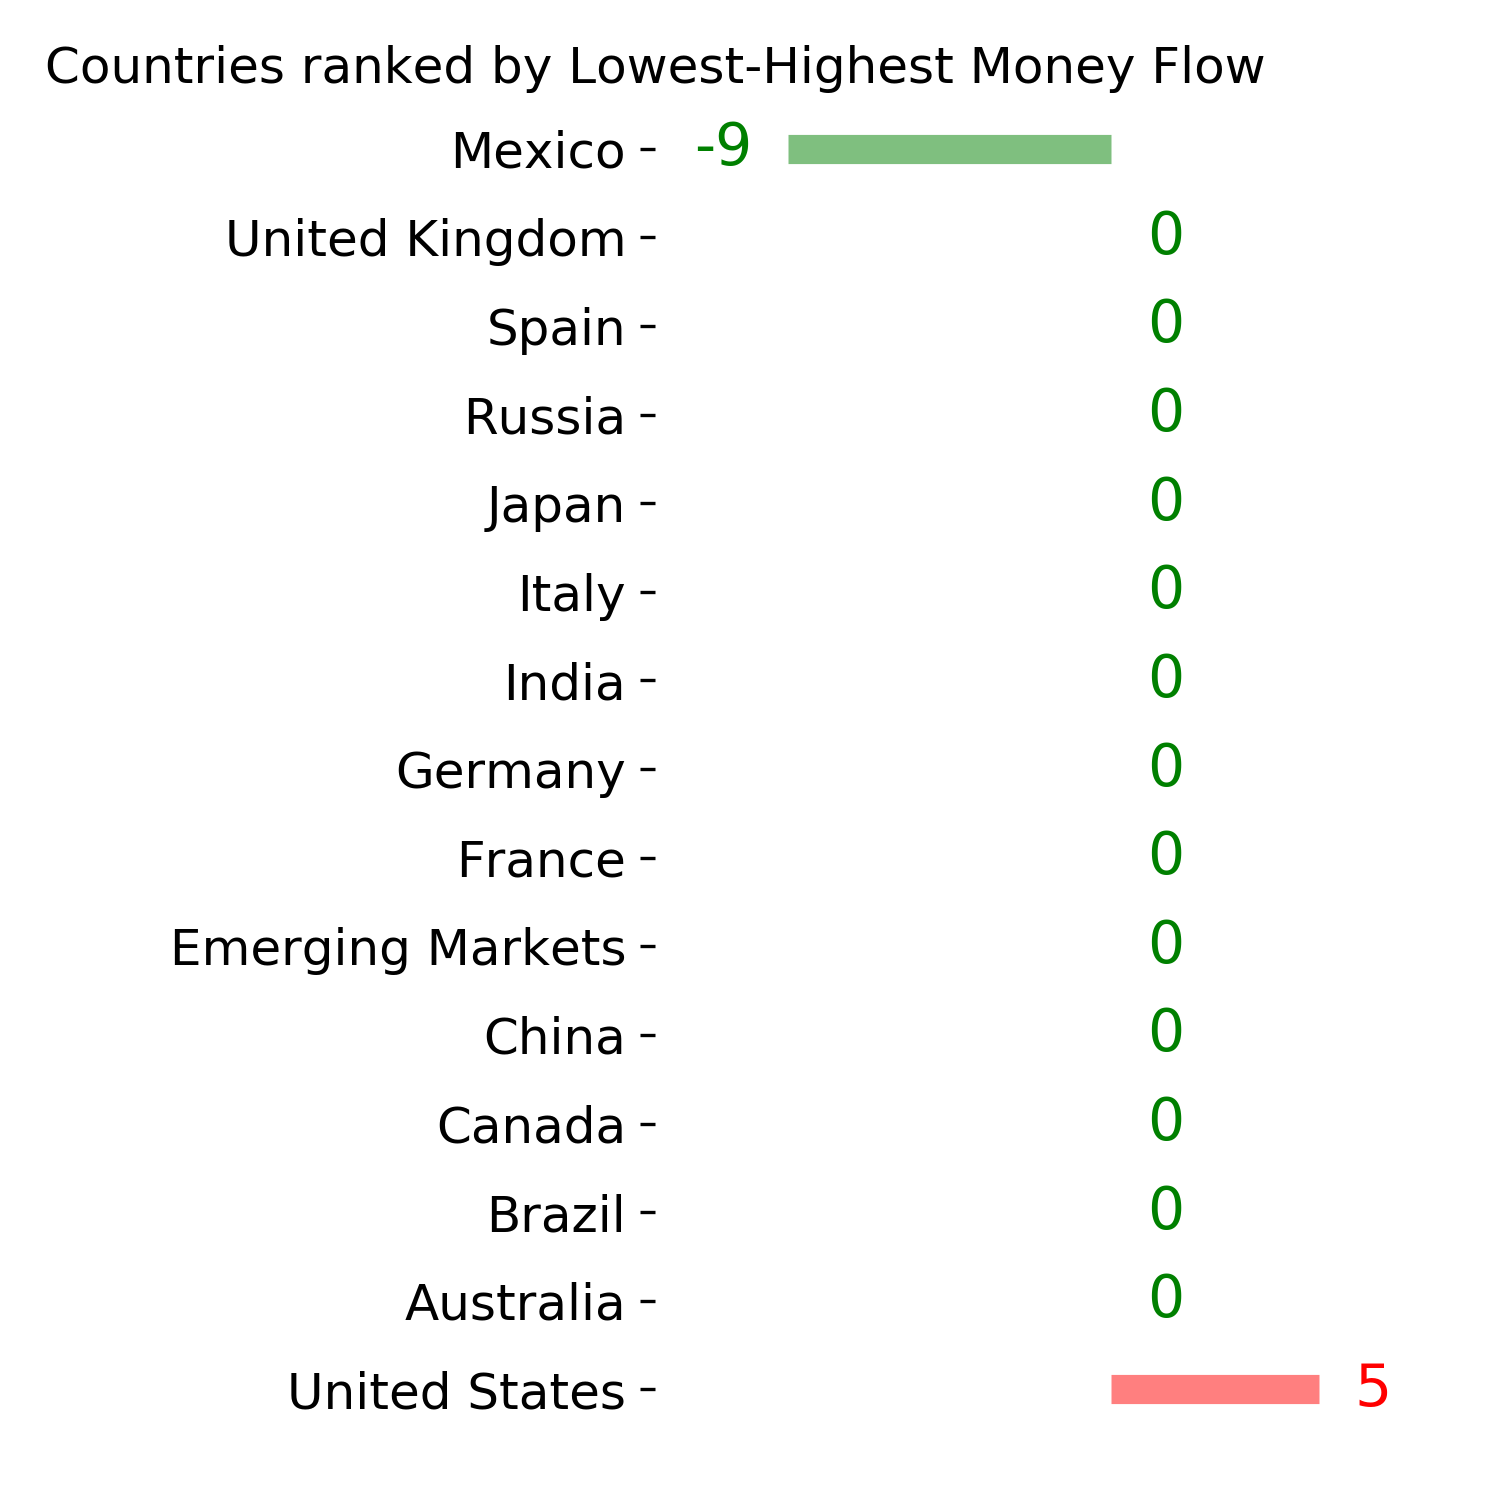
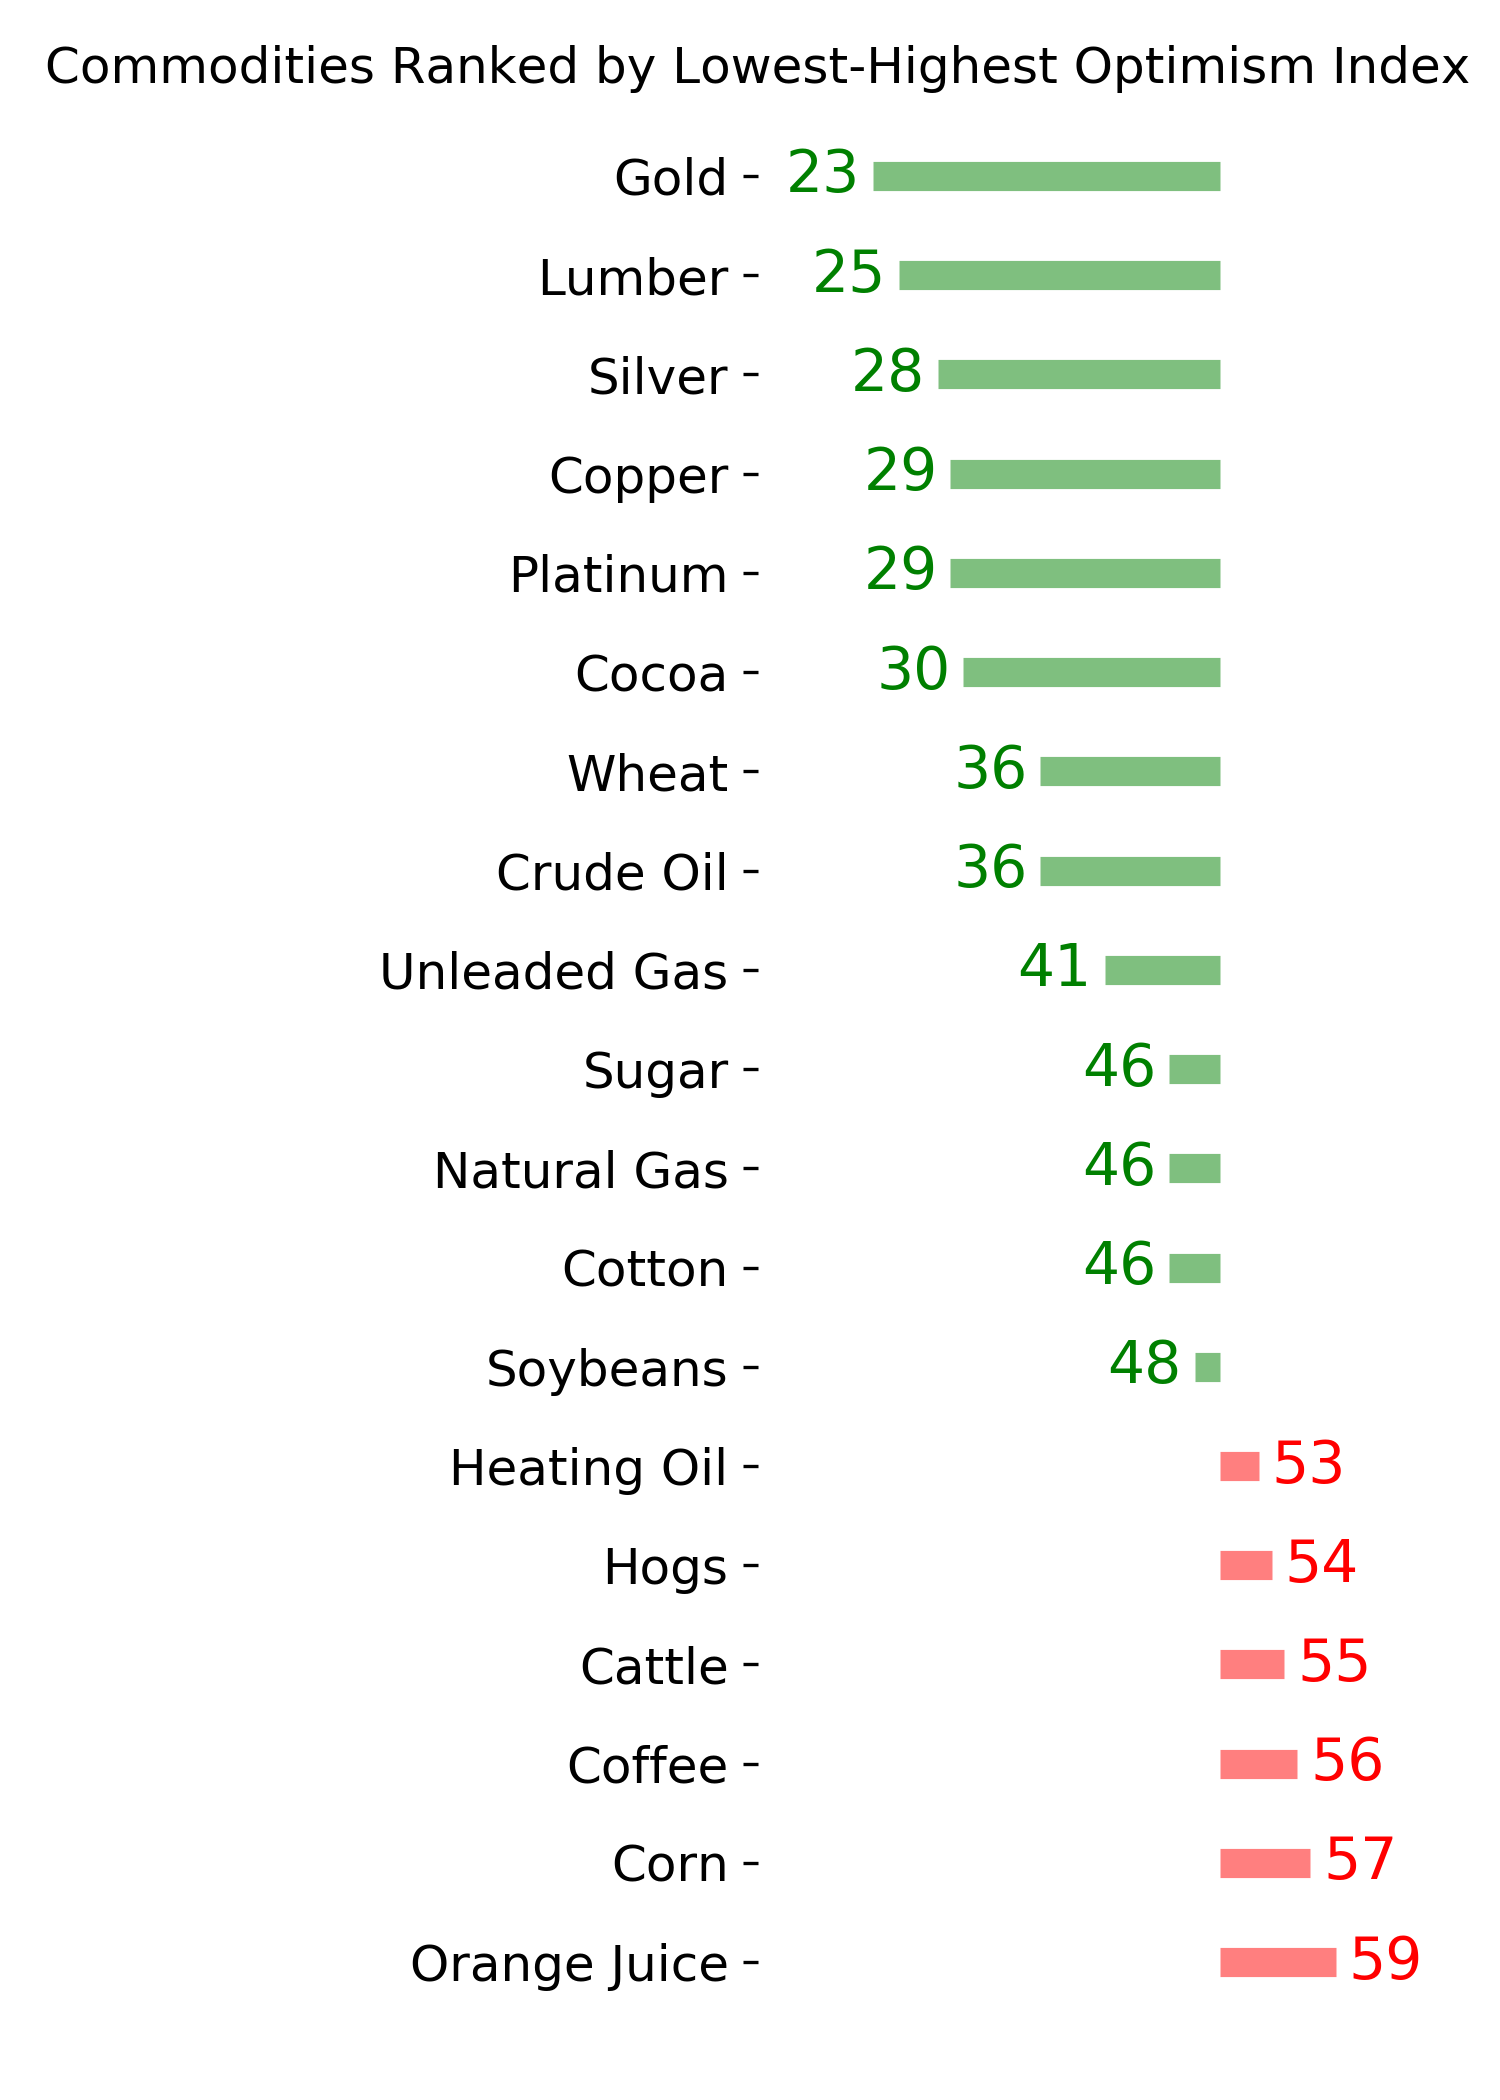
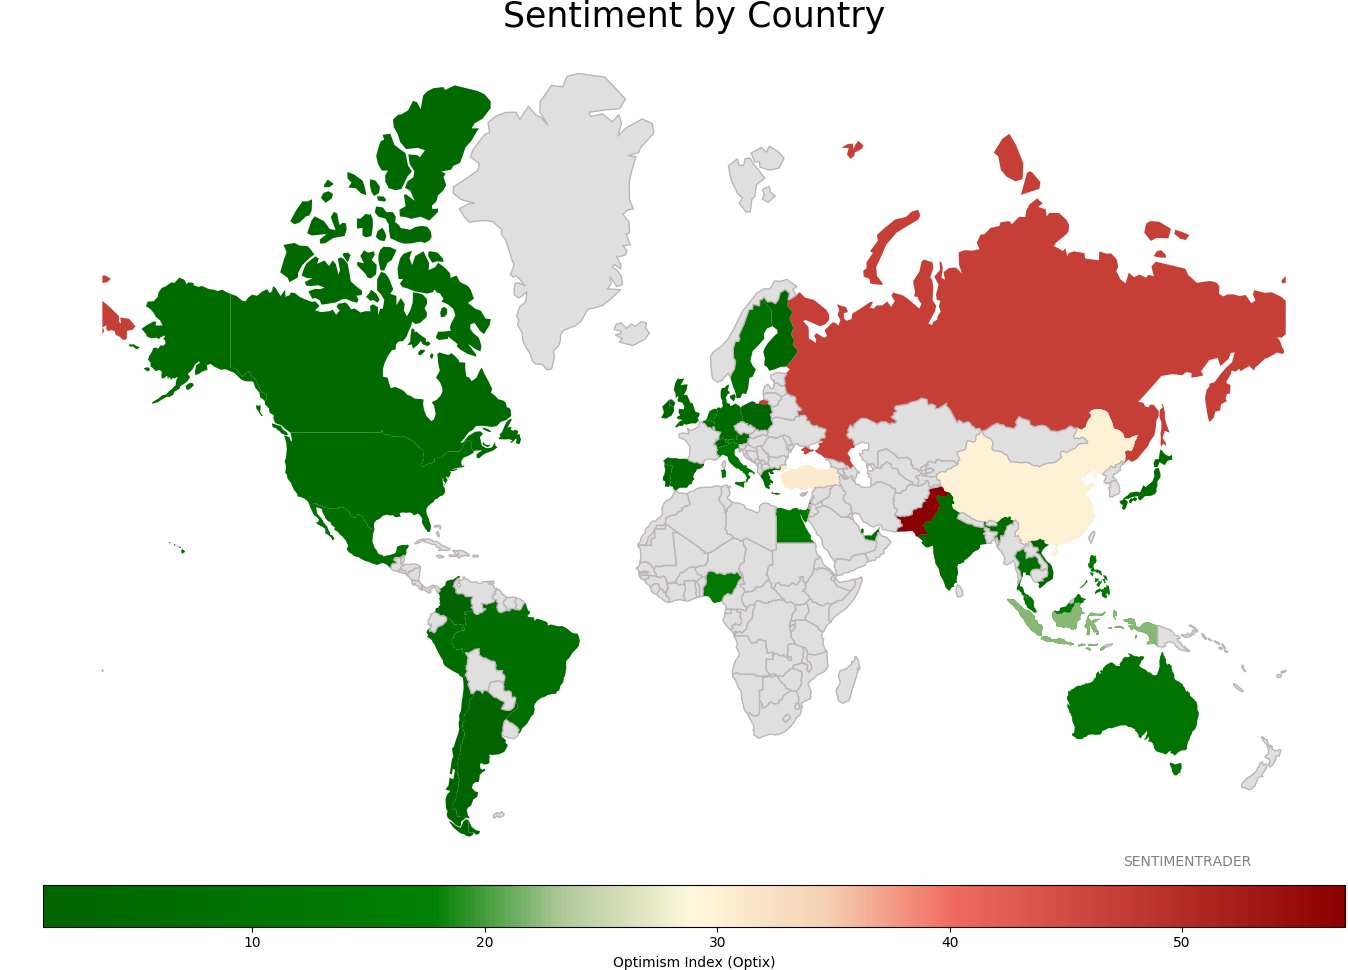
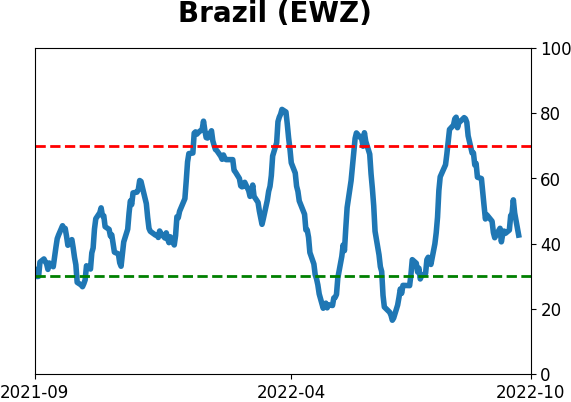
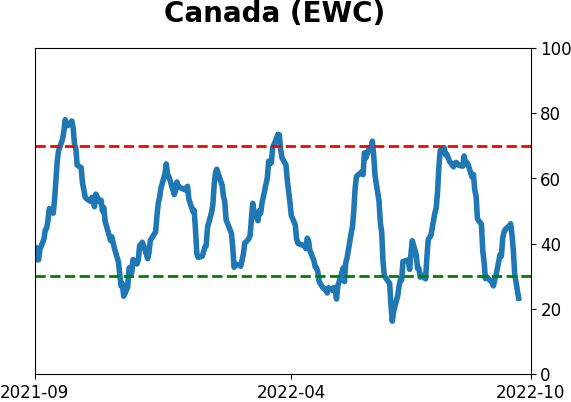
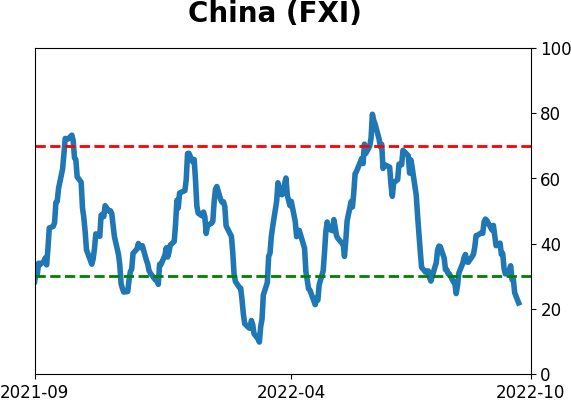
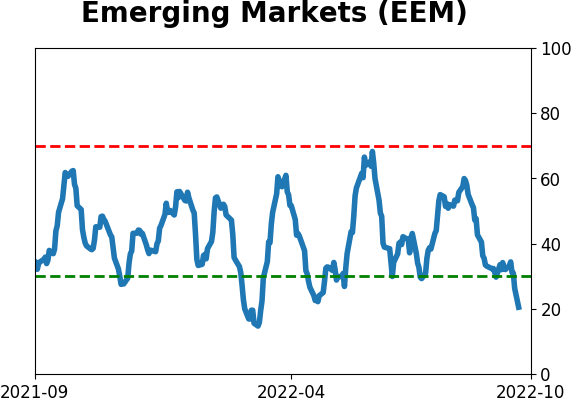
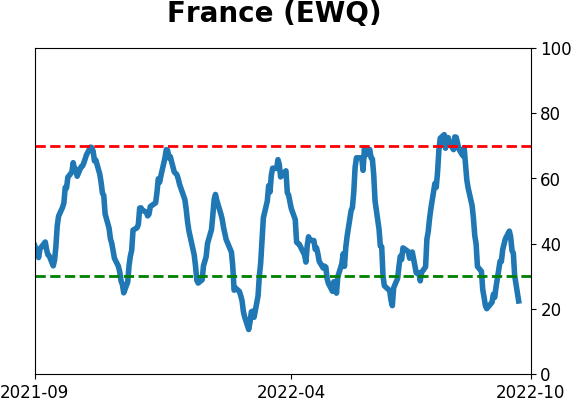
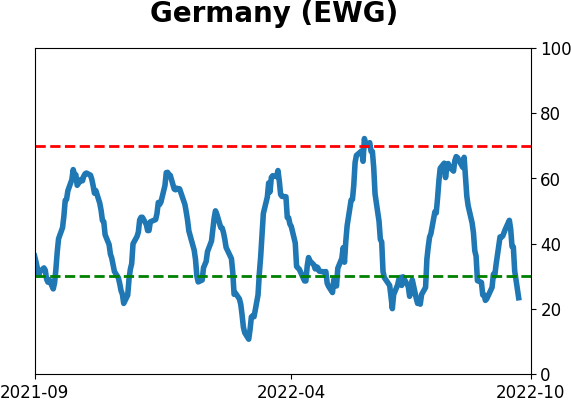
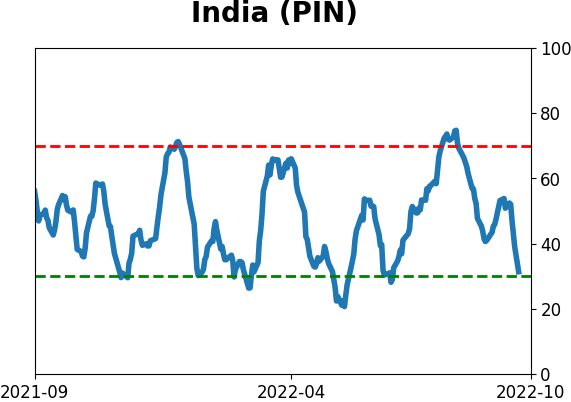
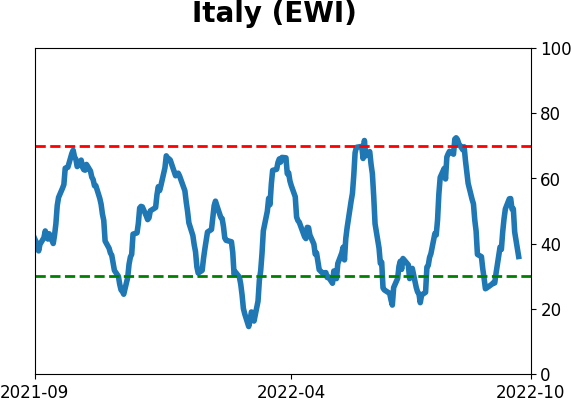
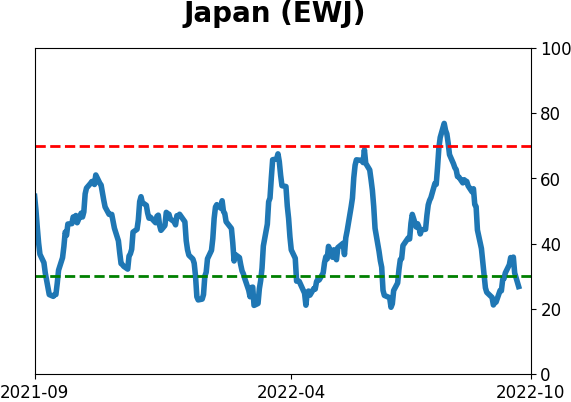
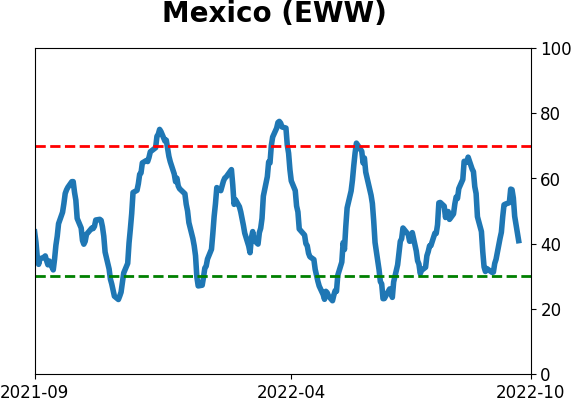
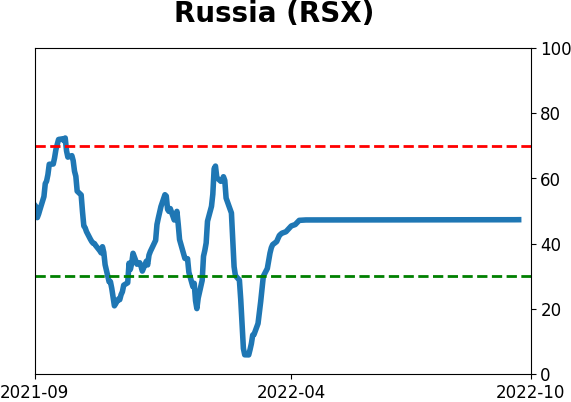
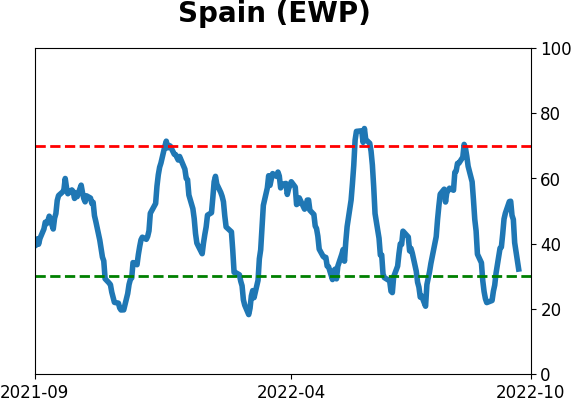
Sentiment Around The World
Optimism Index Thumbnails
|
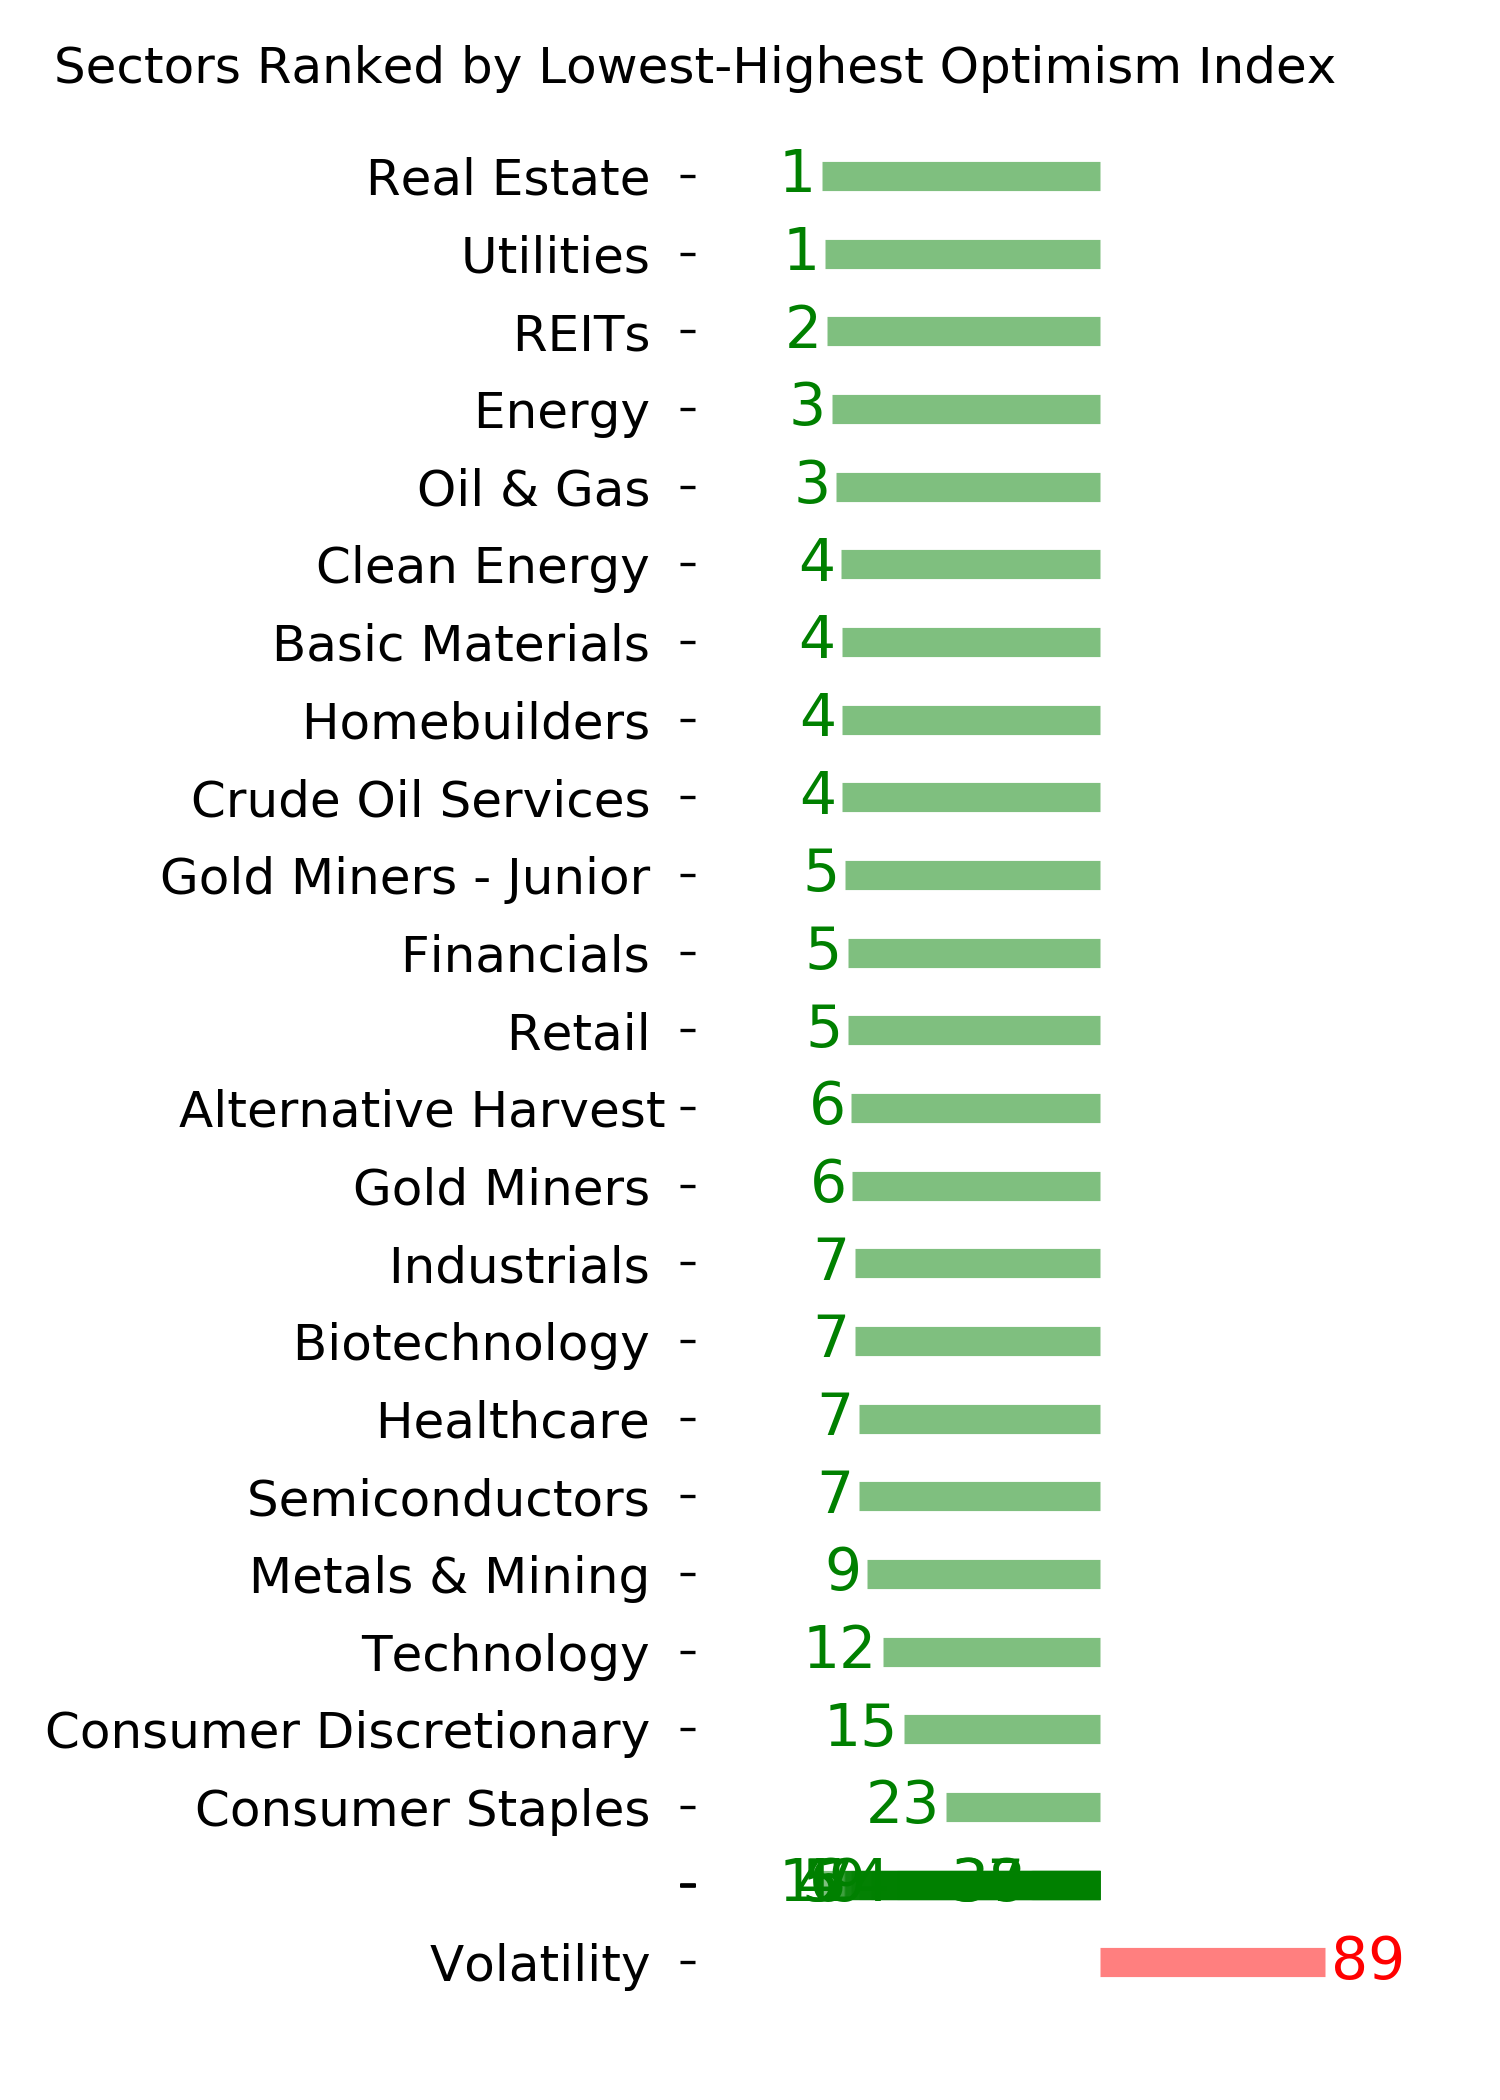
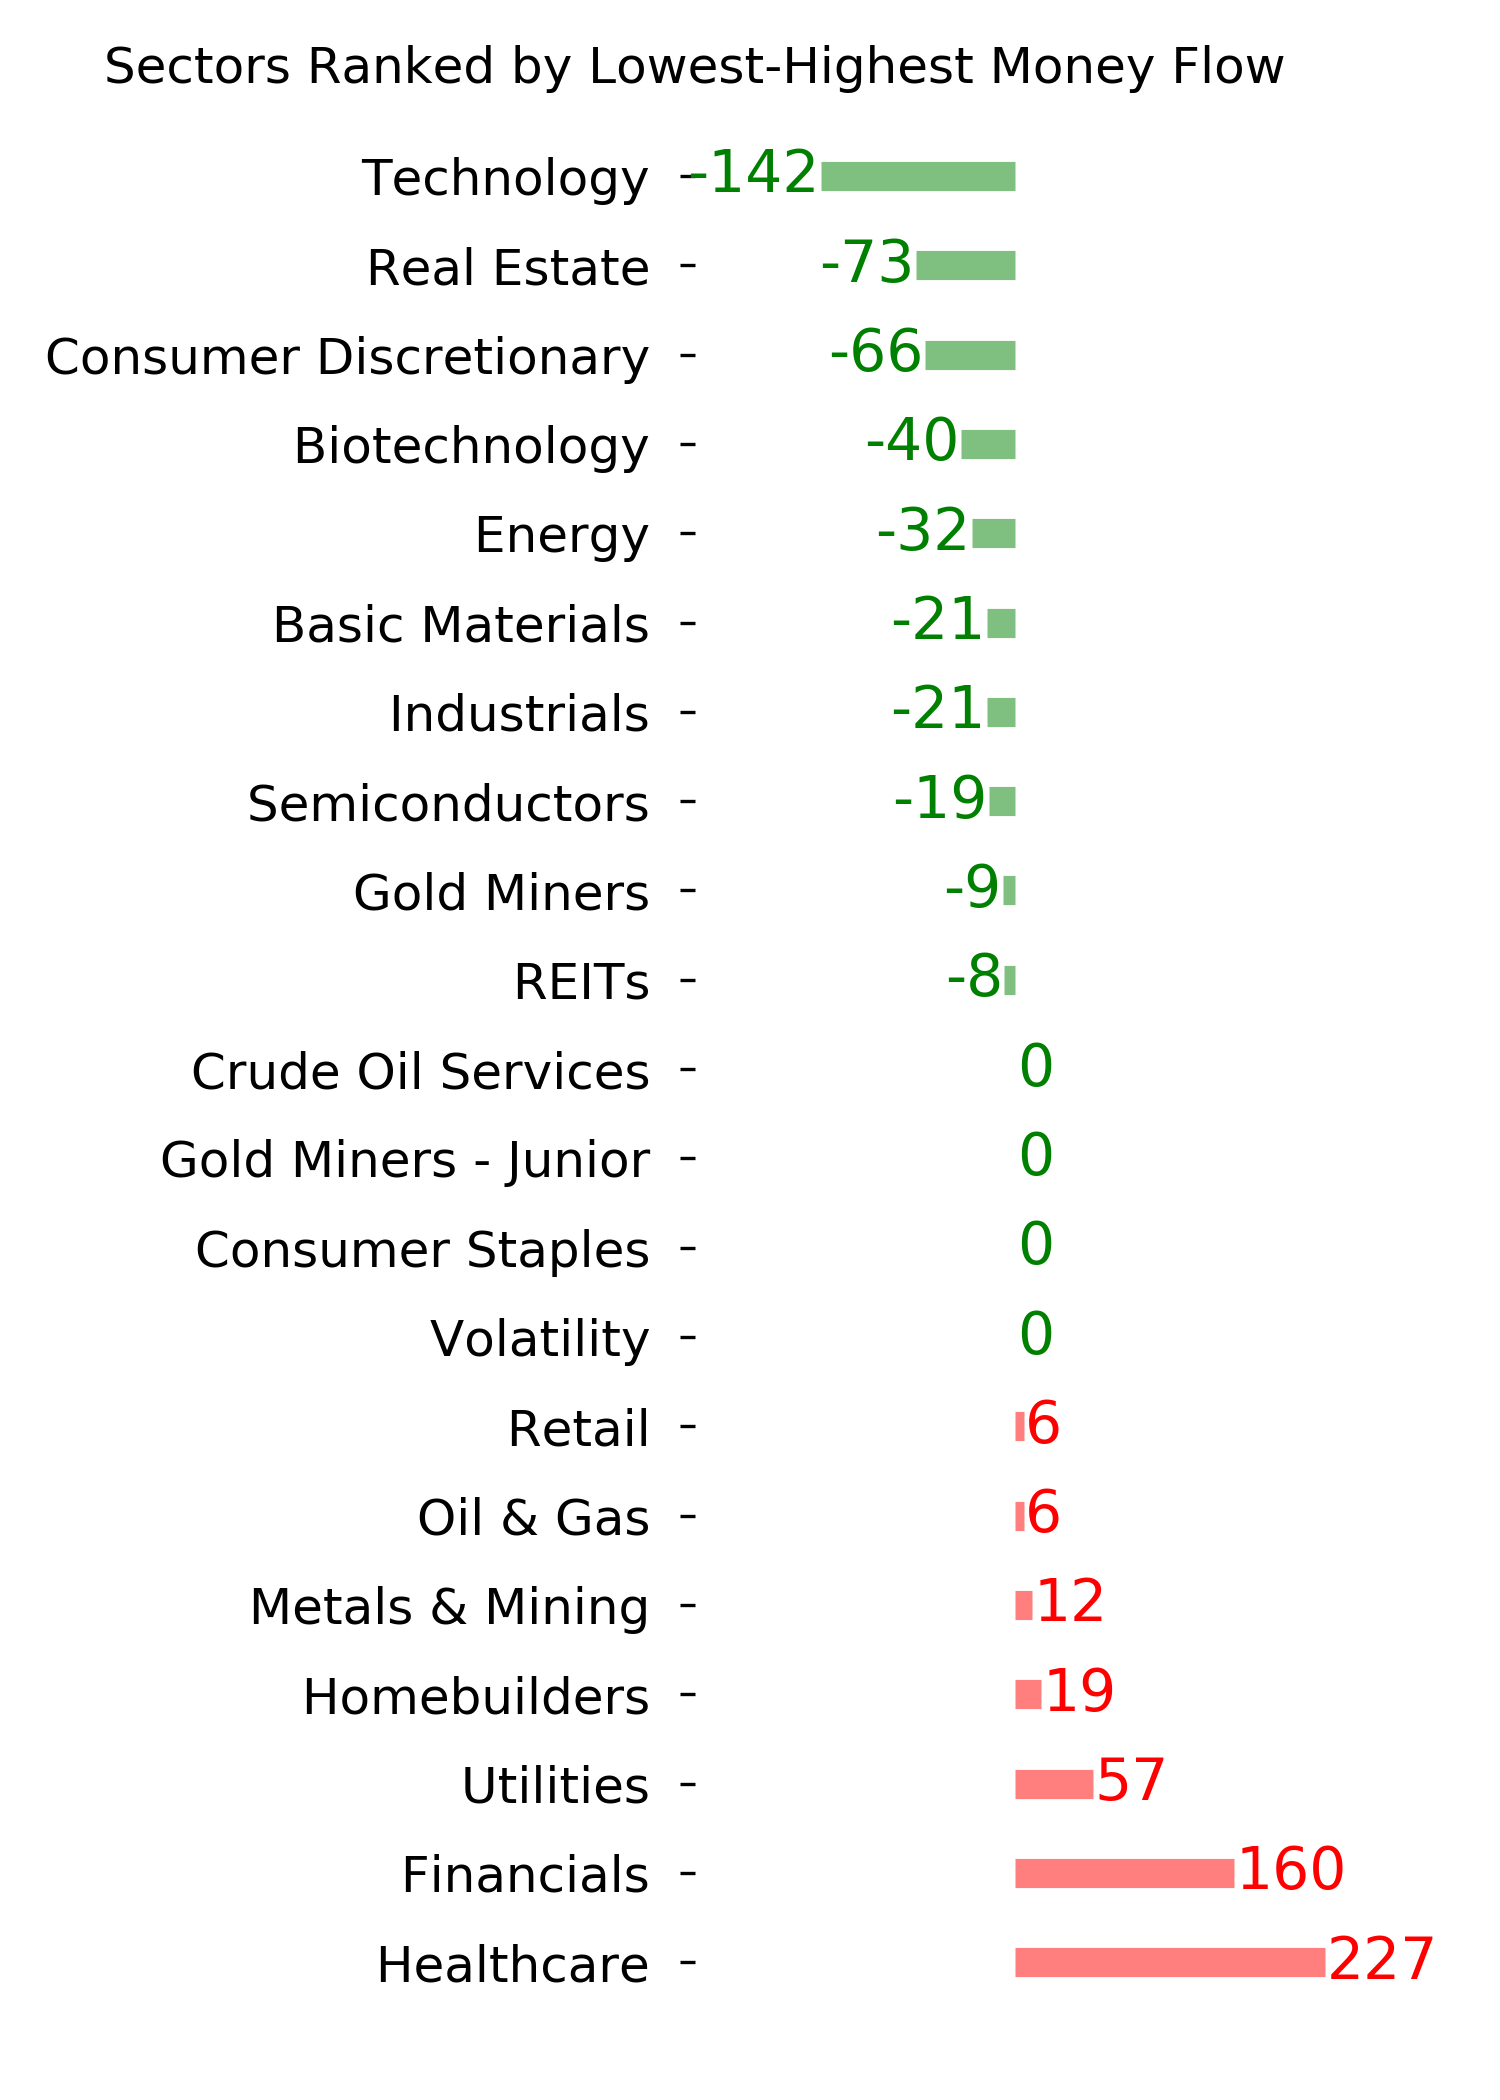
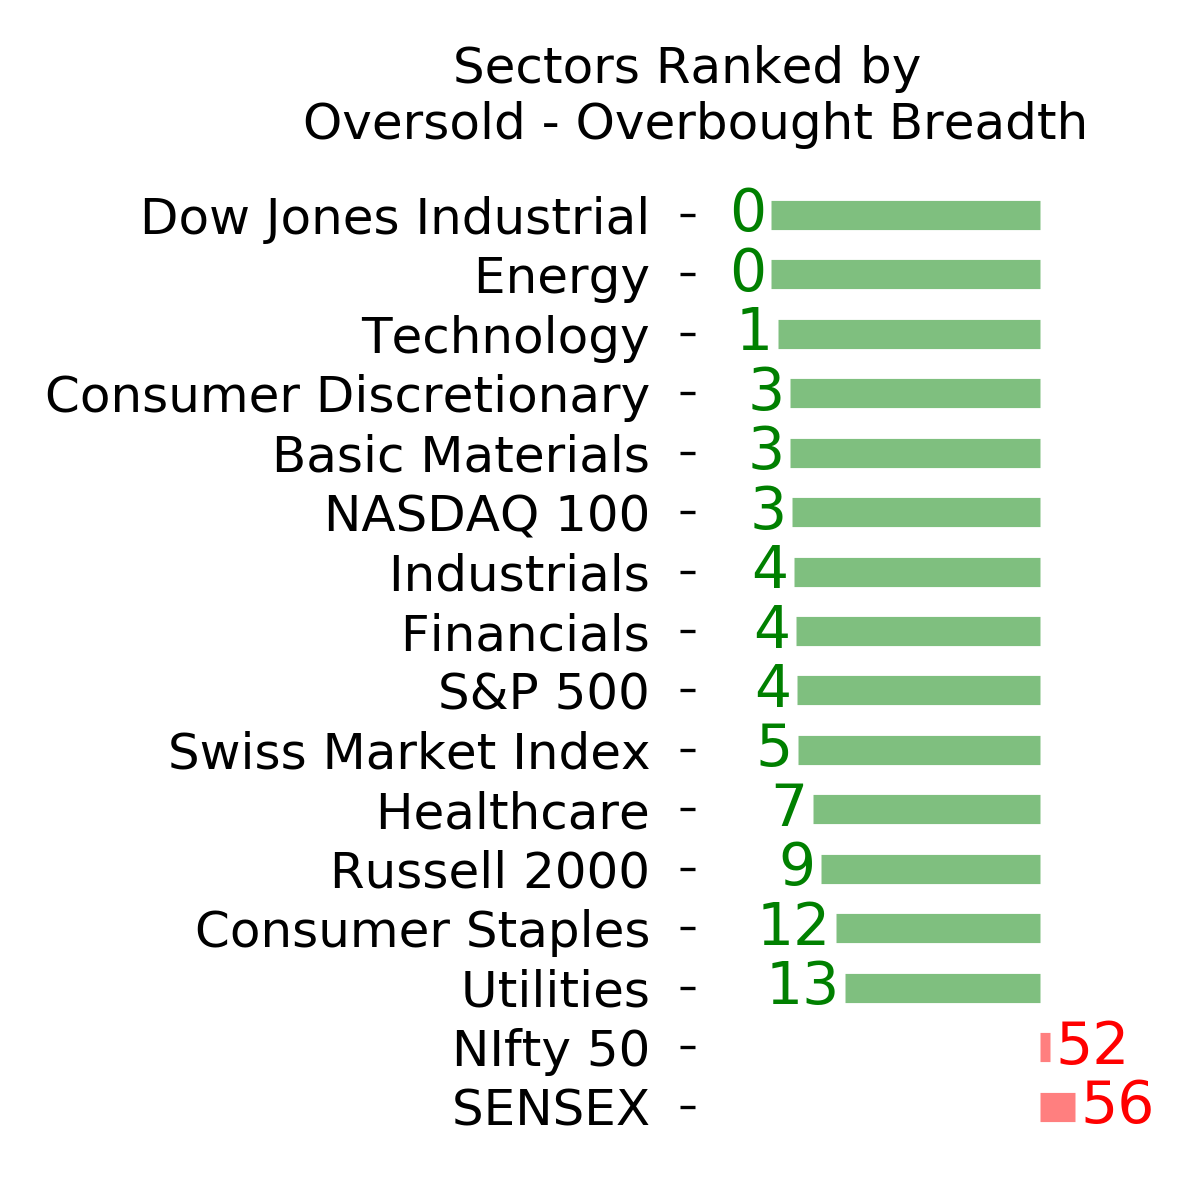
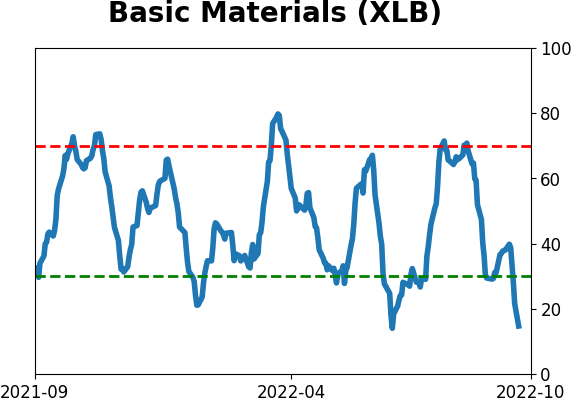
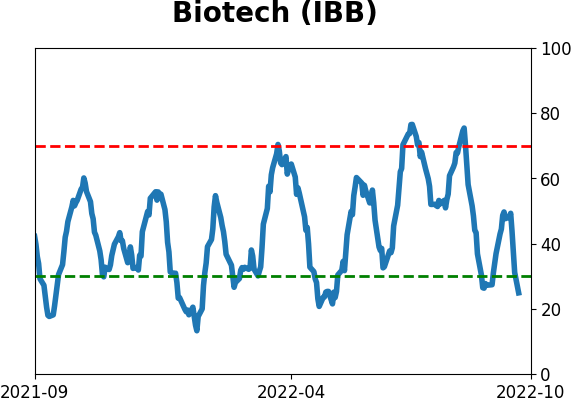
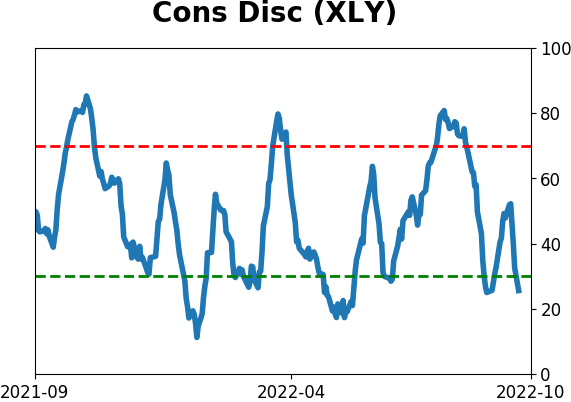
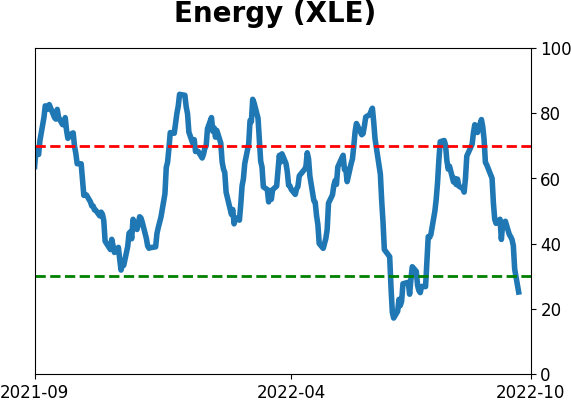
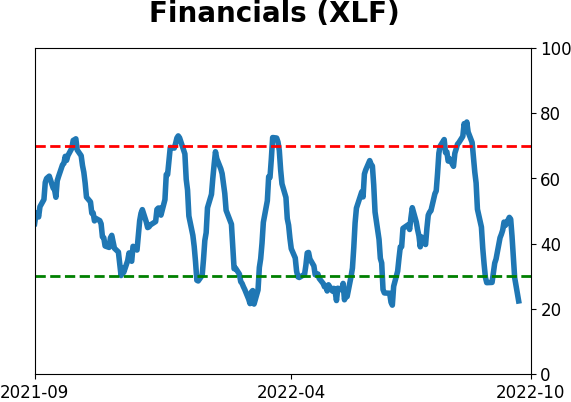
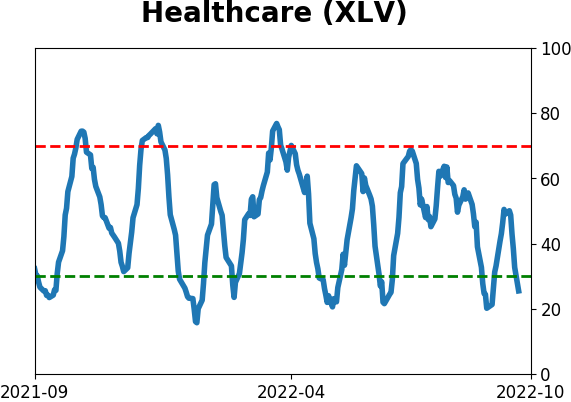
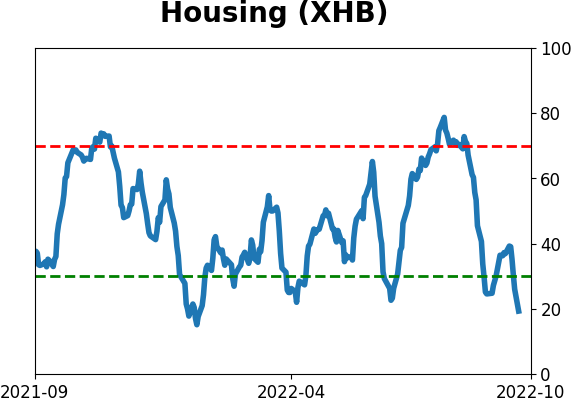
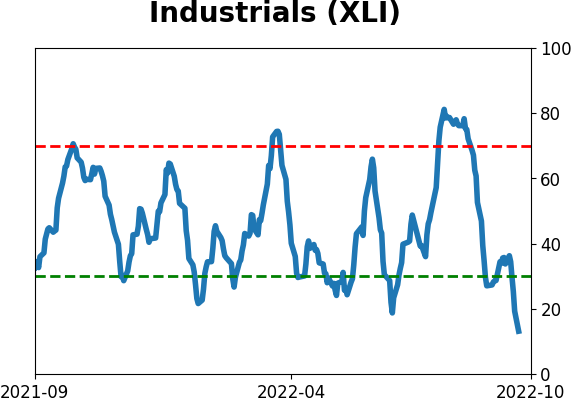
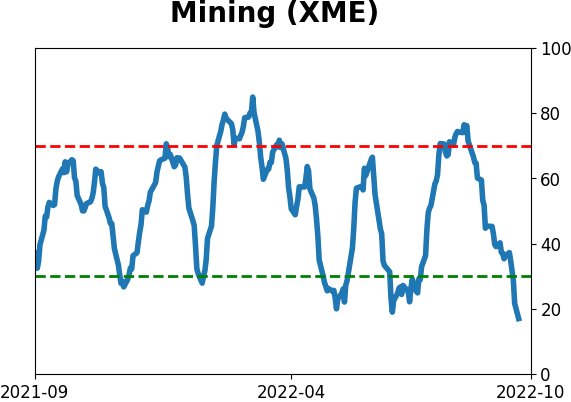
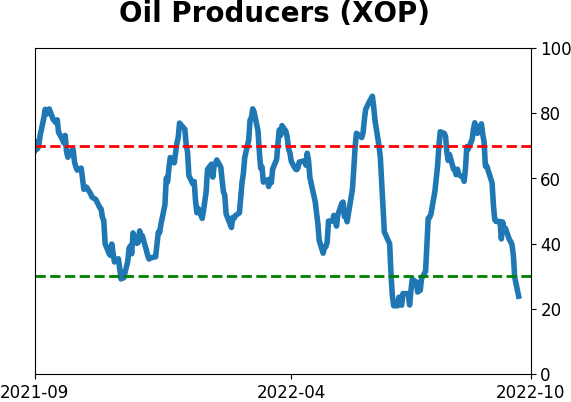
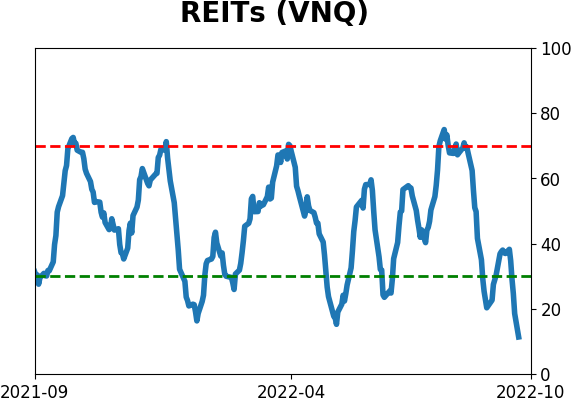
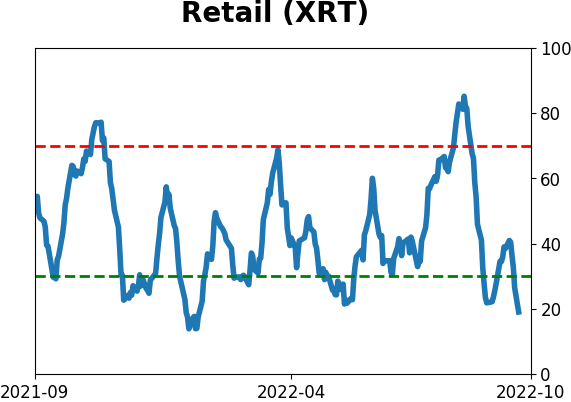
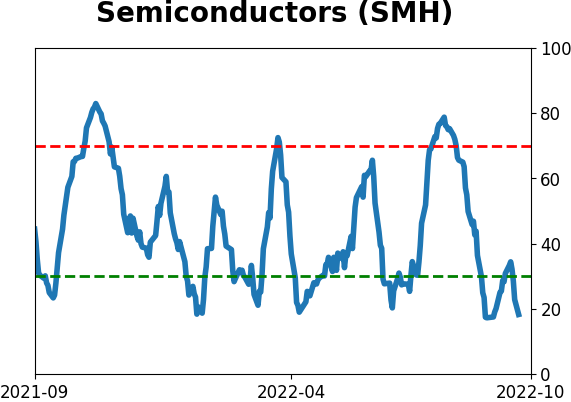
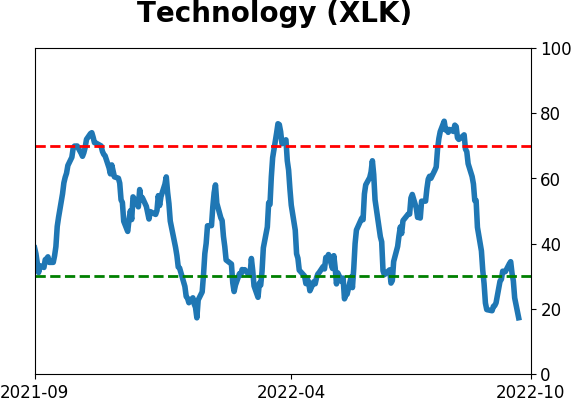
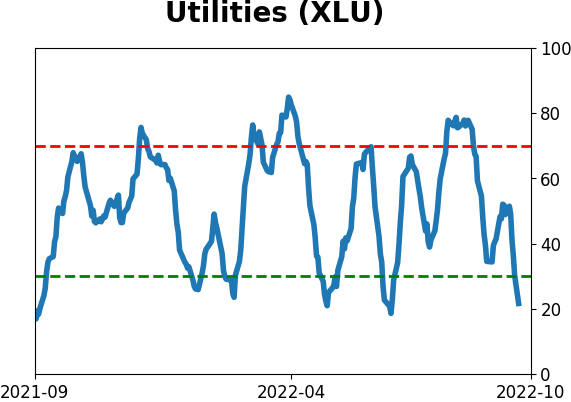
Sector ETF's - 10-Day Moving Average
|
|
|
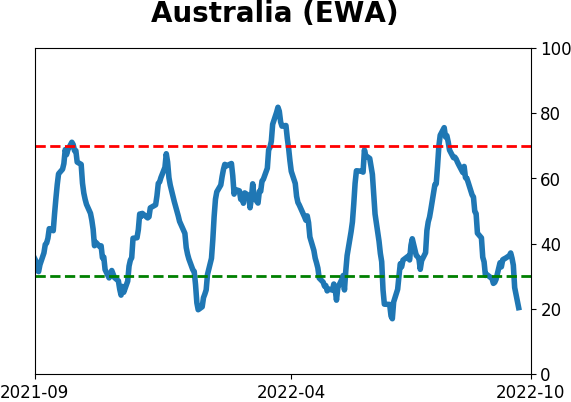
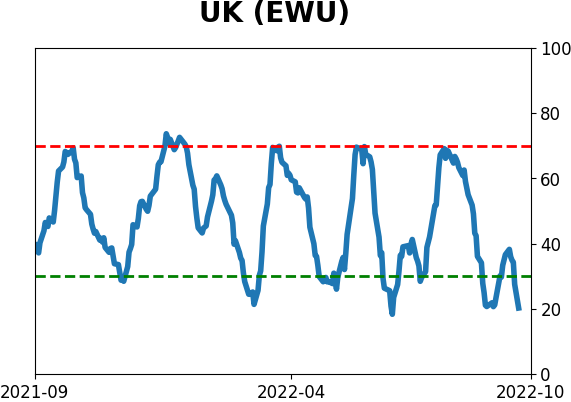
Country ETF's - 10-Day Moving Average
|
|
|
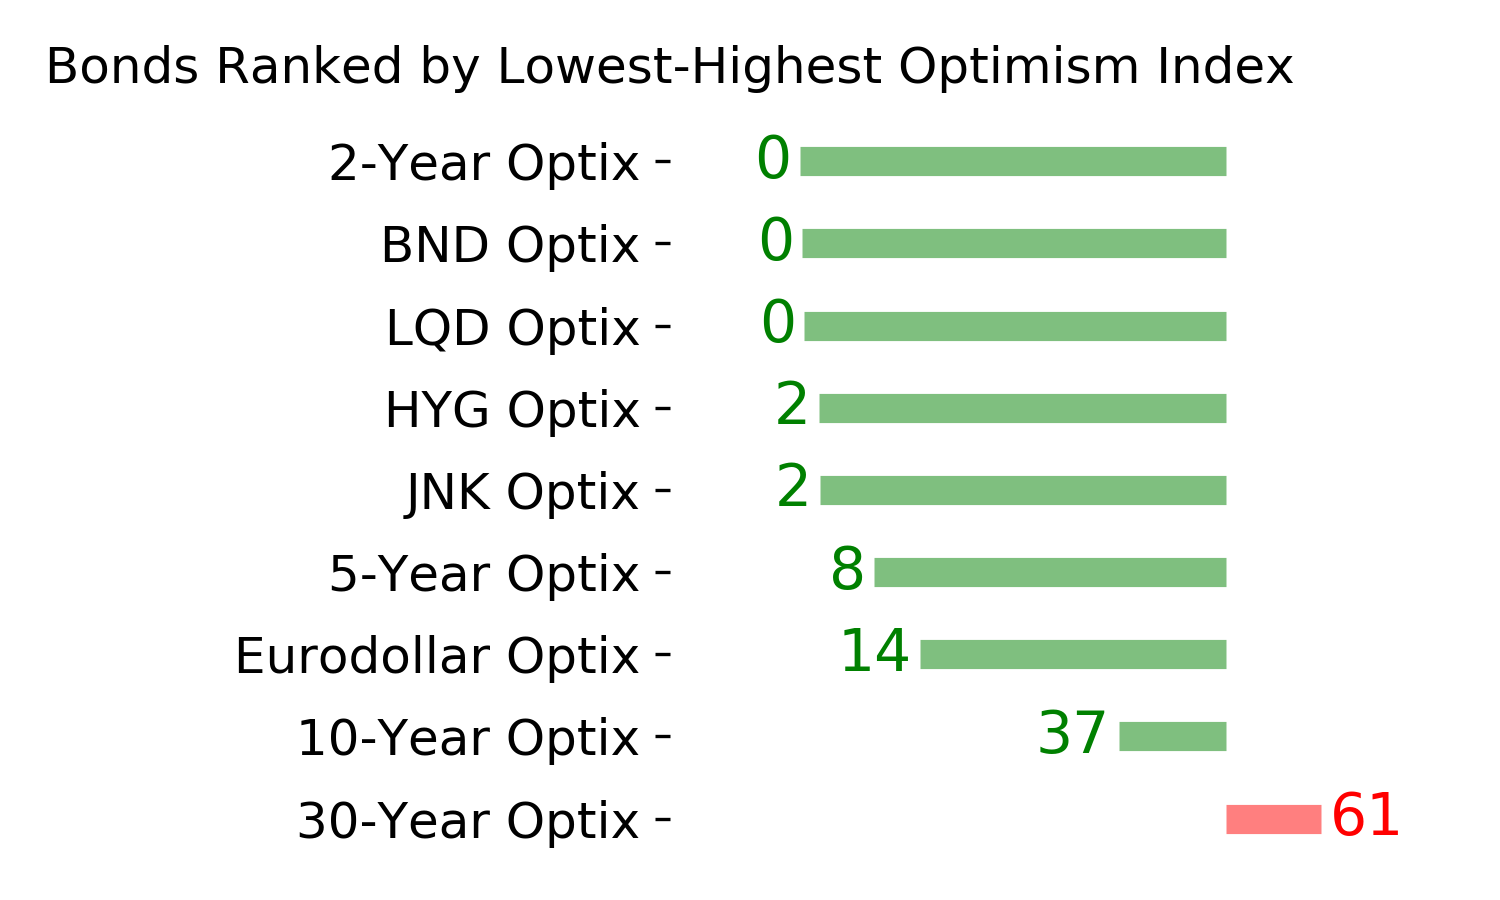
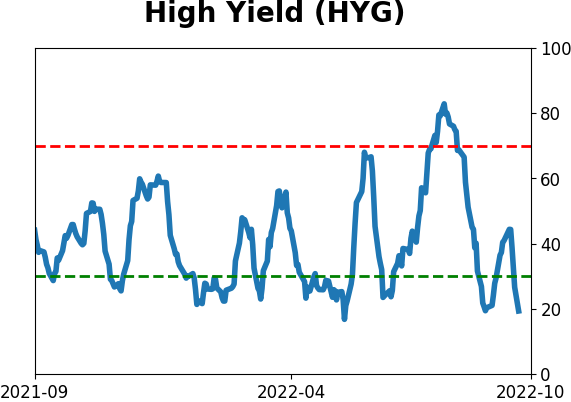
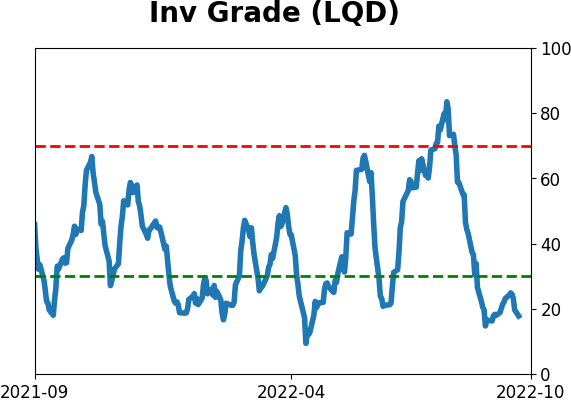
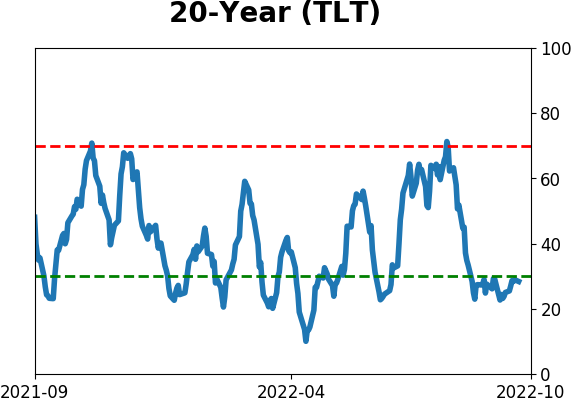
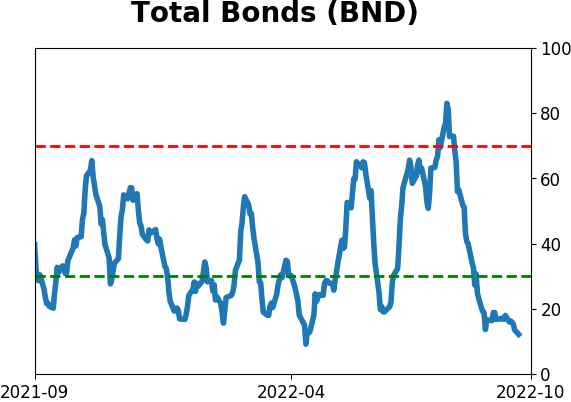
Bond ETF's - 10-Day Moving Average
|
|
|
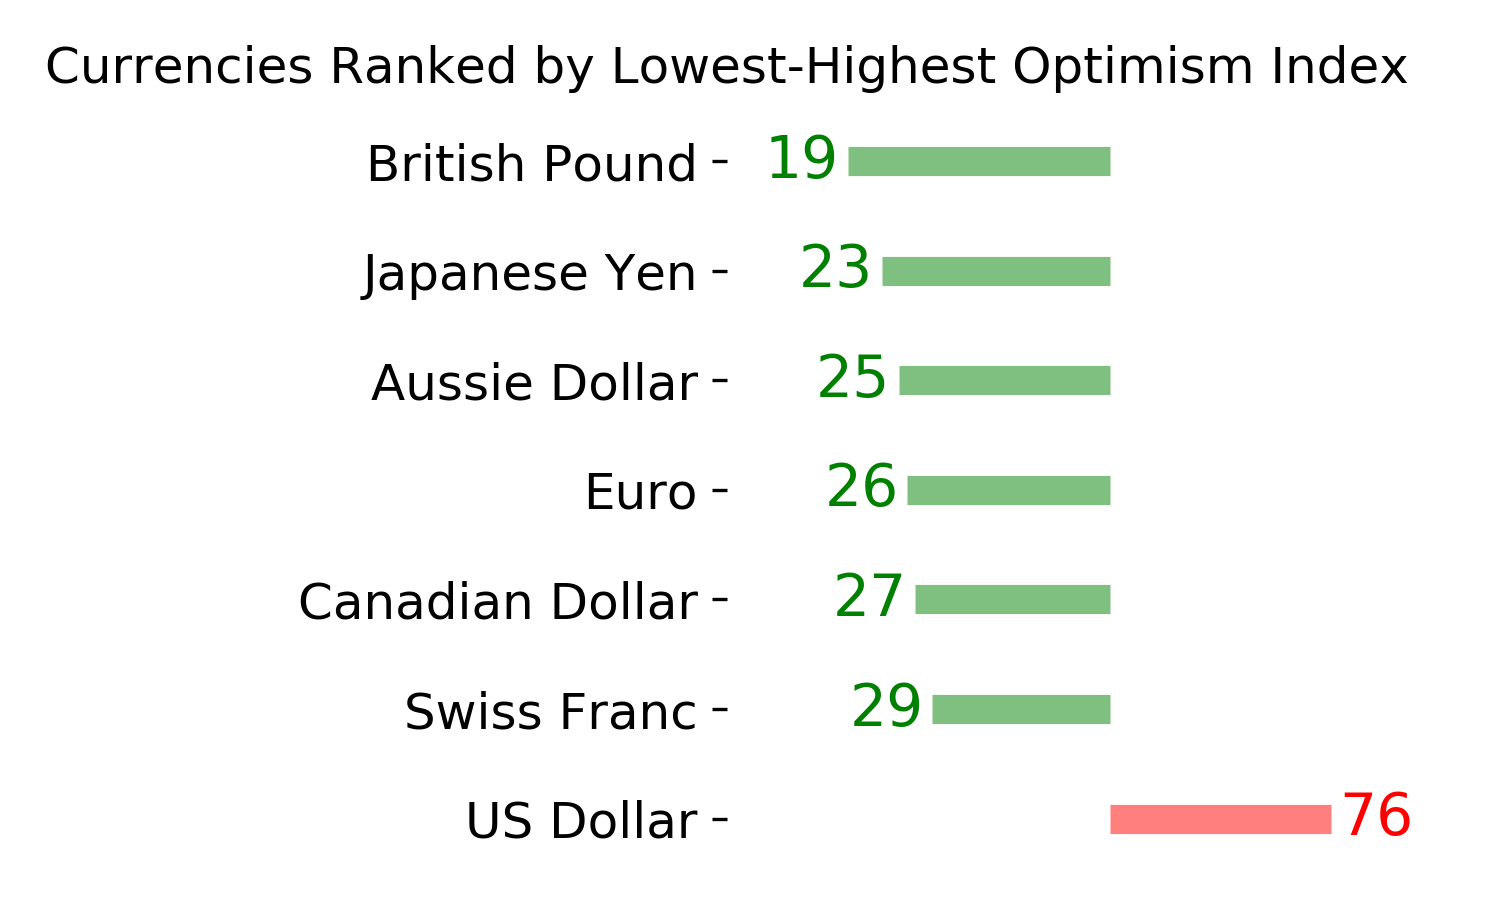
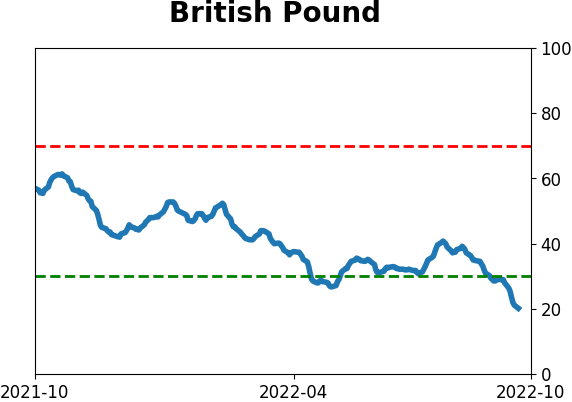
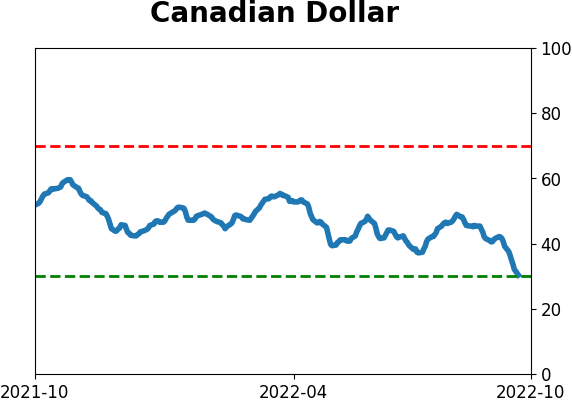
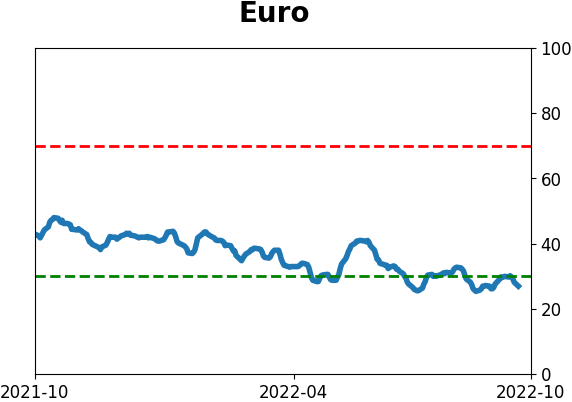
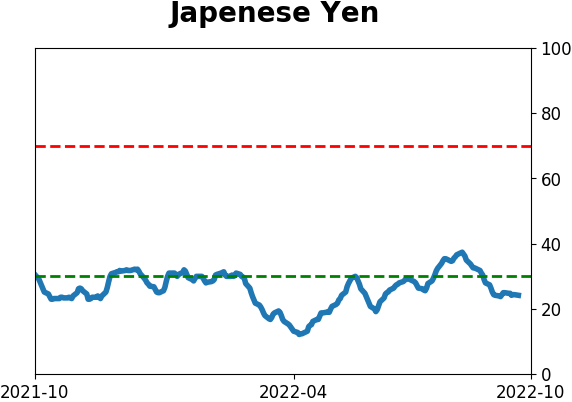
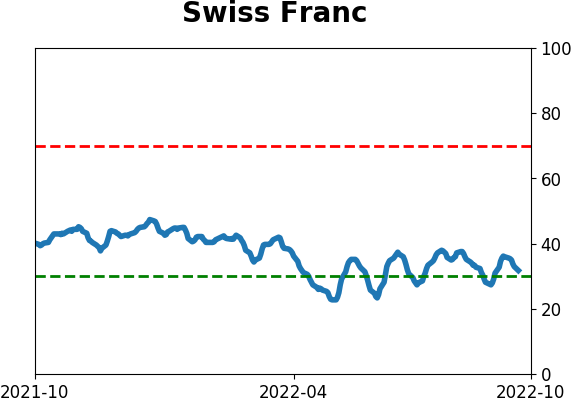
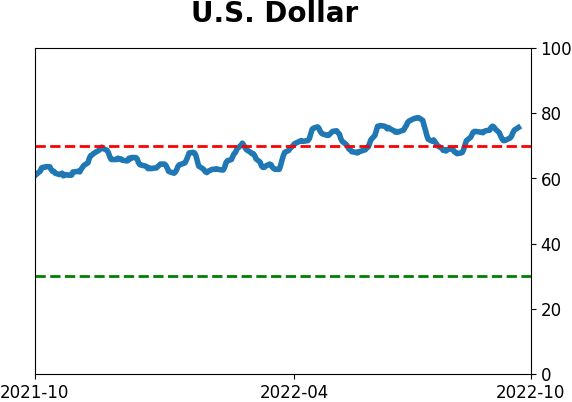
Currency ETF's - 5-Day Moving Average
|
|
|
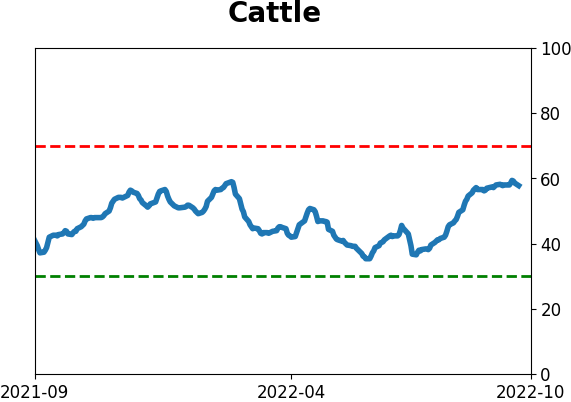
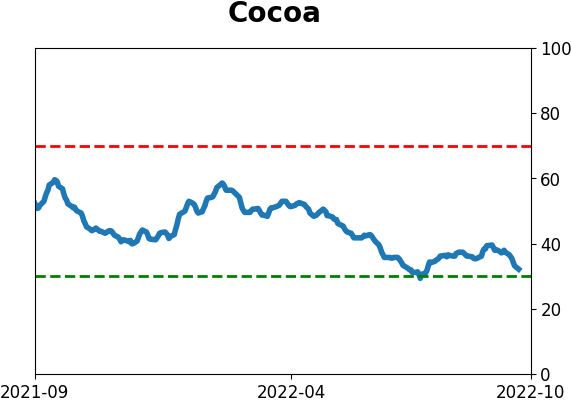
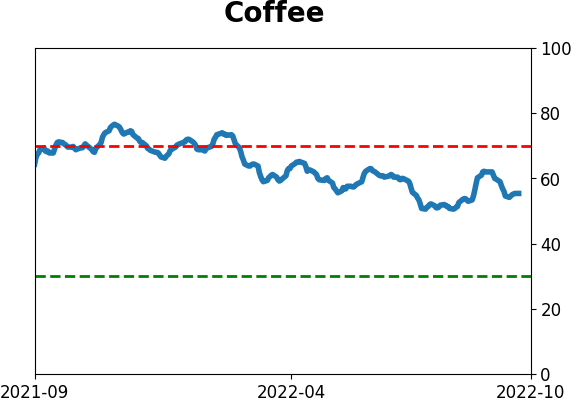
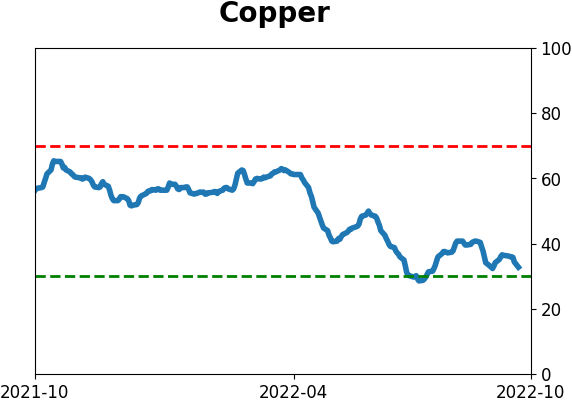
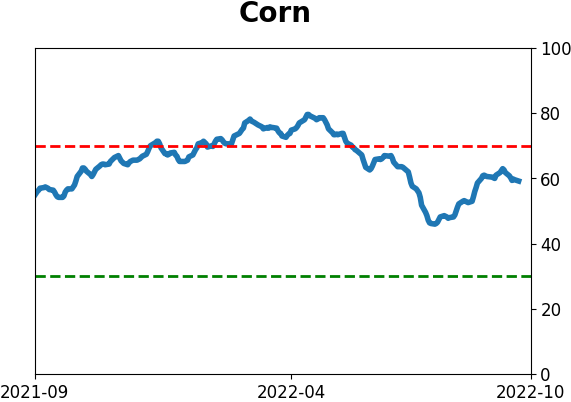
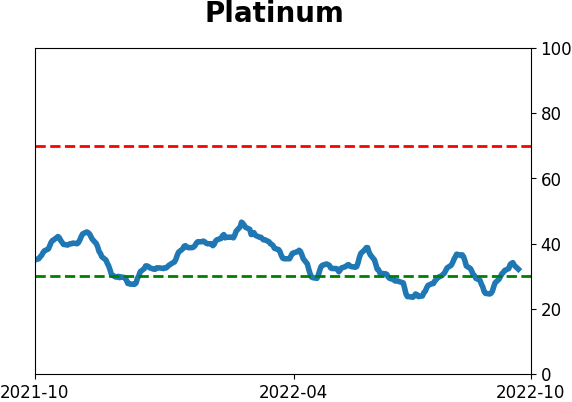
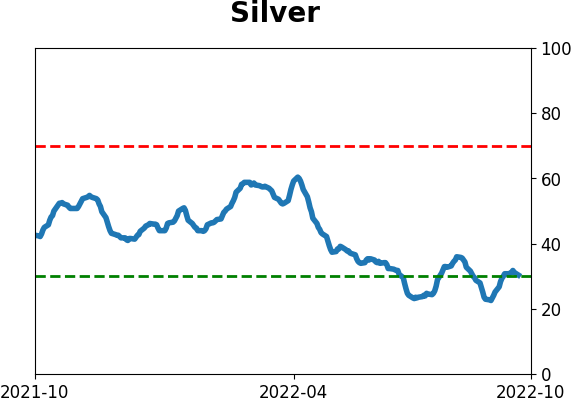
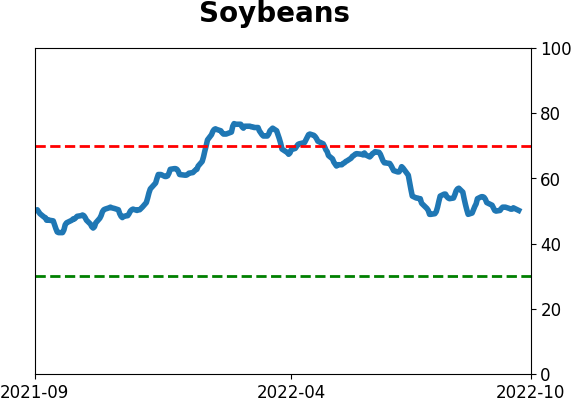
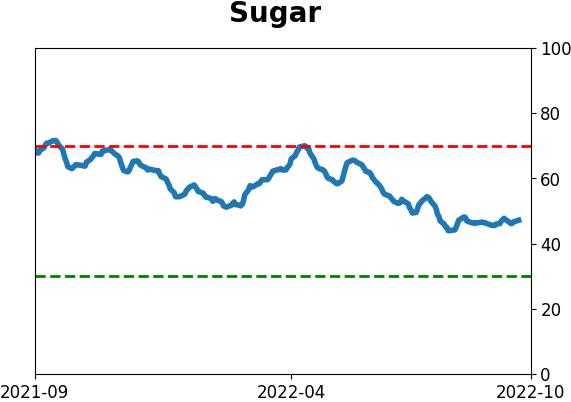
Commodity ETF's - 5-Day Moving Average
|
|