Headlines
|
|
Treasury yield curves show recession ahead:
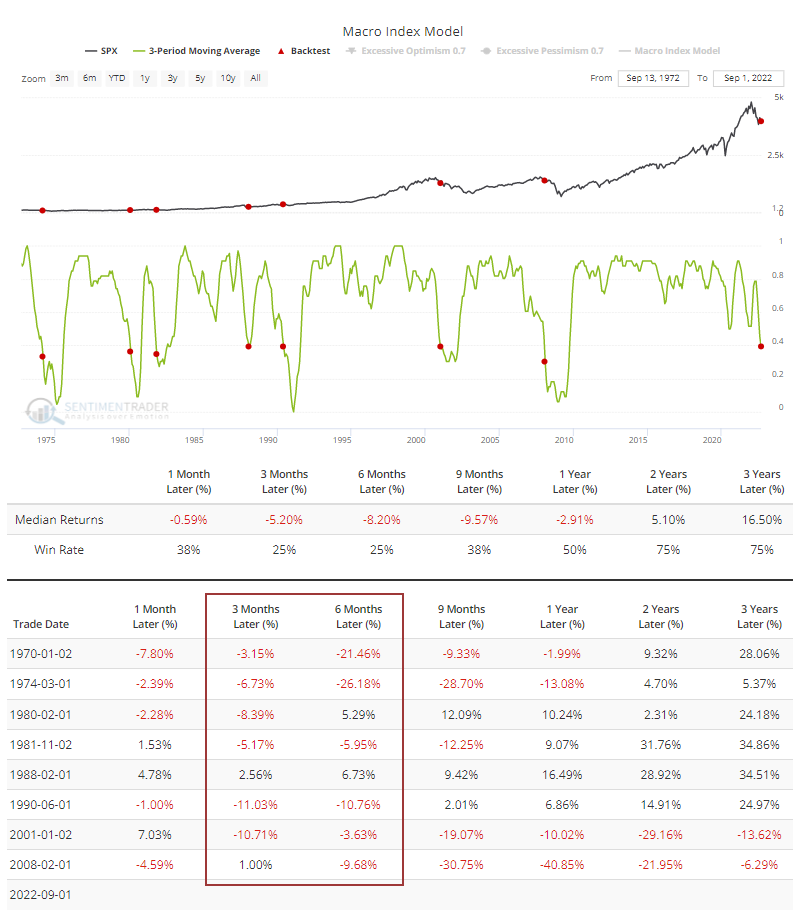
More than half of Treasury yield curves are now inverted, and the median curve is negative. Every time that's happened, recession was soon to follow. Our Macro Index Model is confirming that outlook. Under similar conditions, stock returns tended to be weak up to a few months later, but not necessarily after that.
|
Smart / Dumb Money Confidence
|
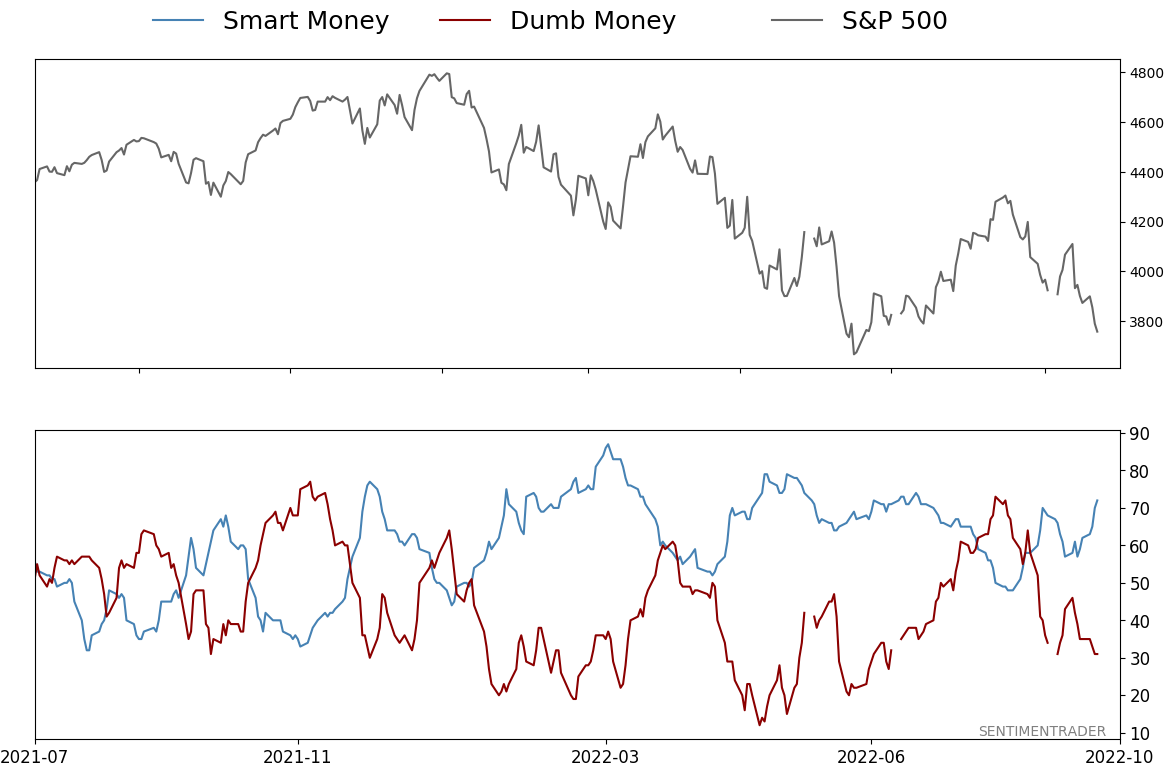
Smart Money Confidence: 72%
Dumb Money Confidence: 31%
|
|
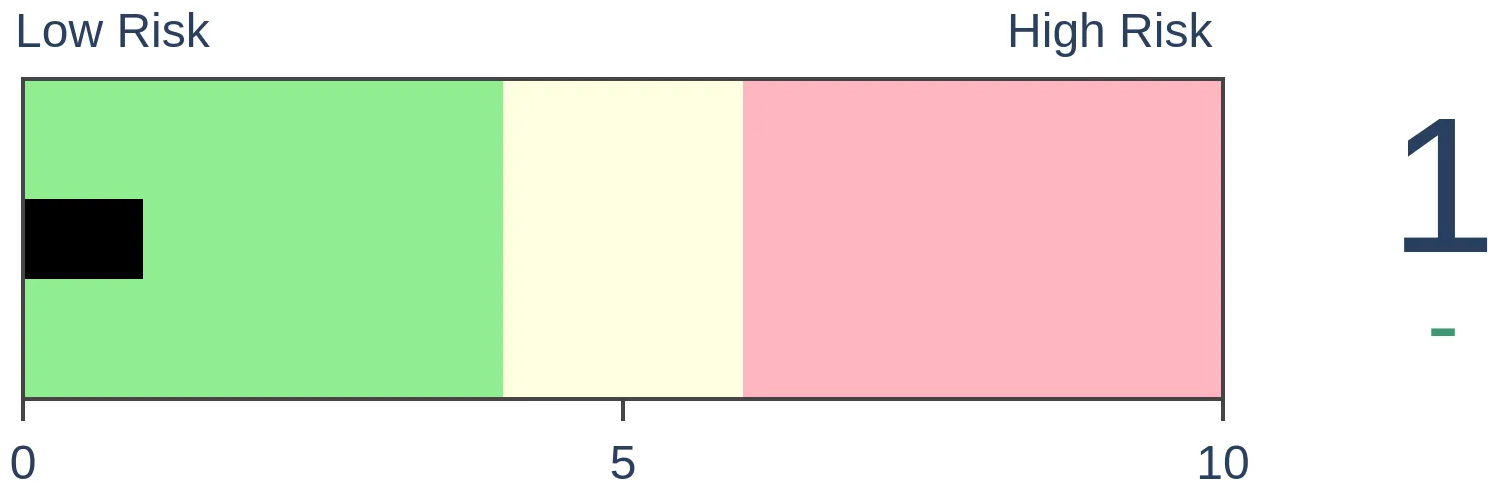
Risk Levels
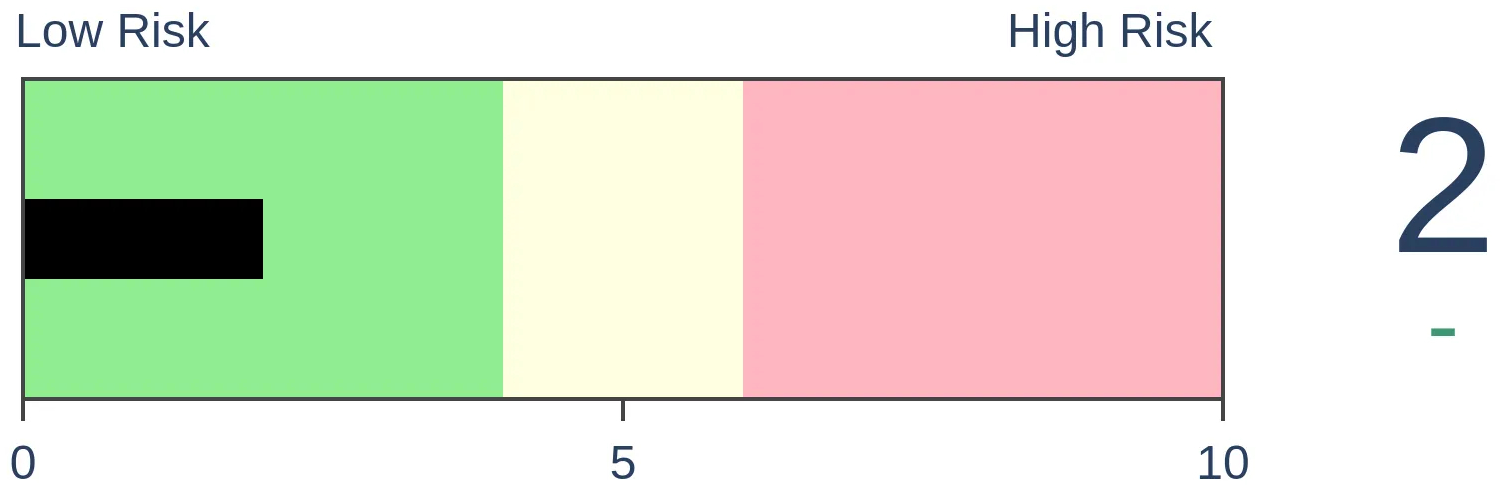
Stocks Short-Term

|
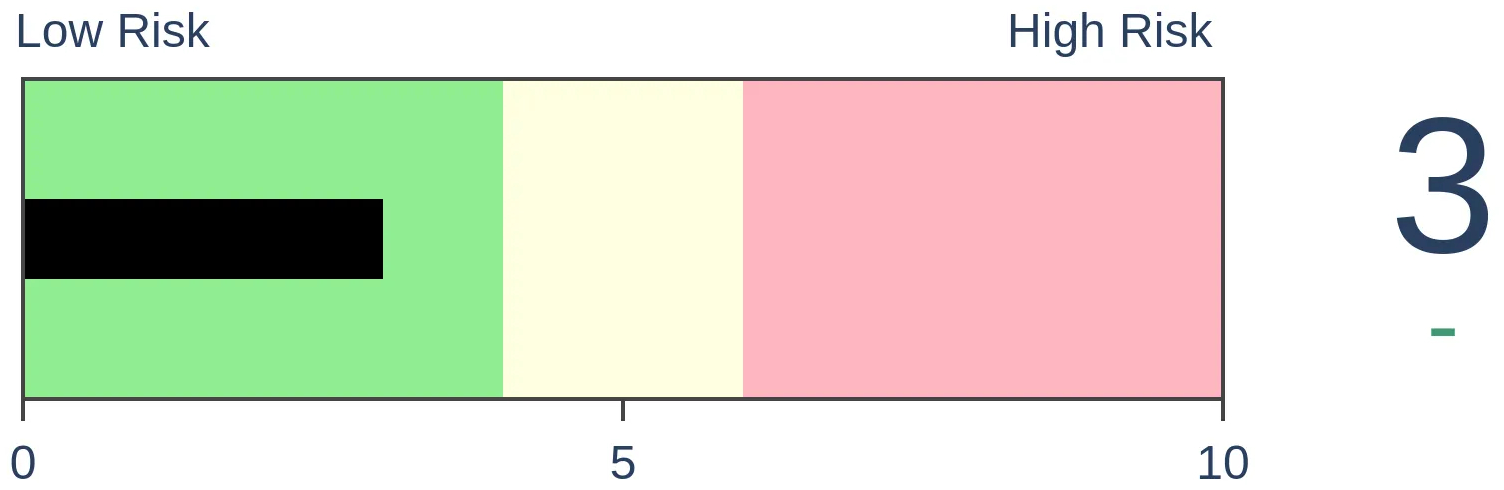
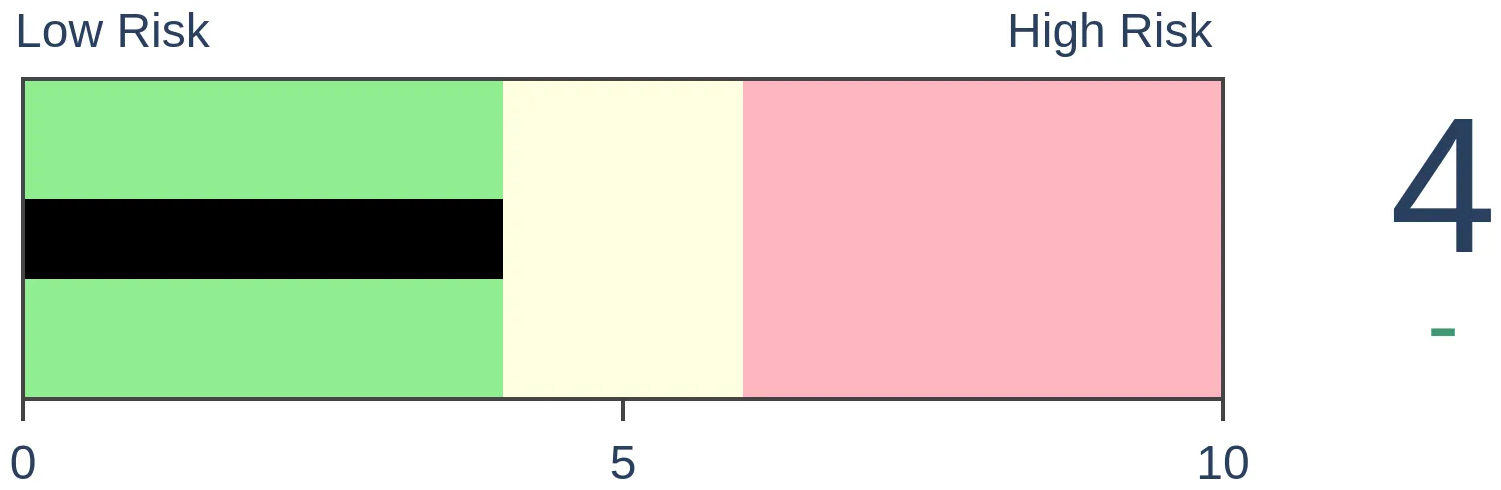
Stocks Medium-Term

|
|
Bonds
|
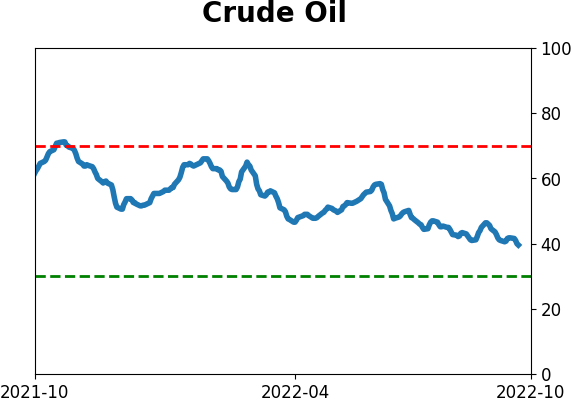
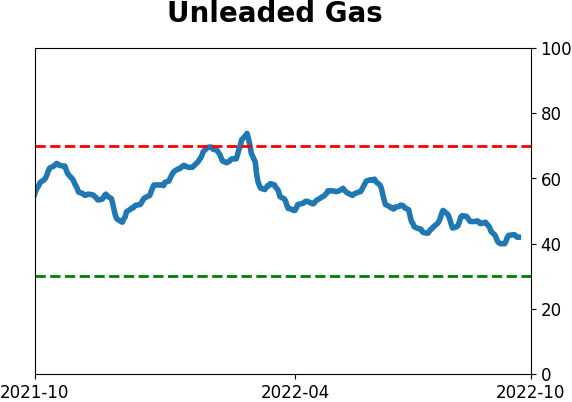
Crude Oil
|
|
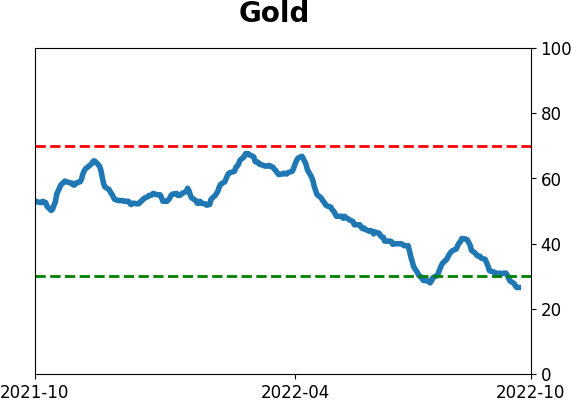
Gold
|
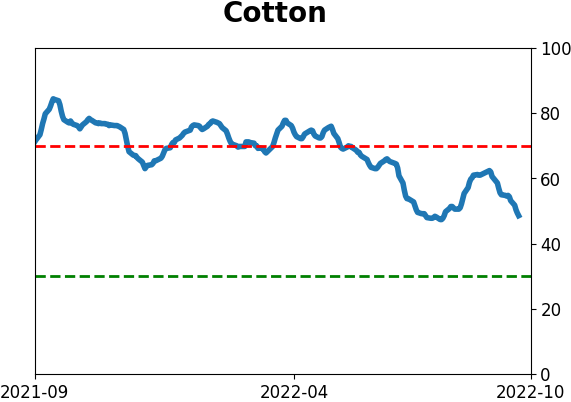
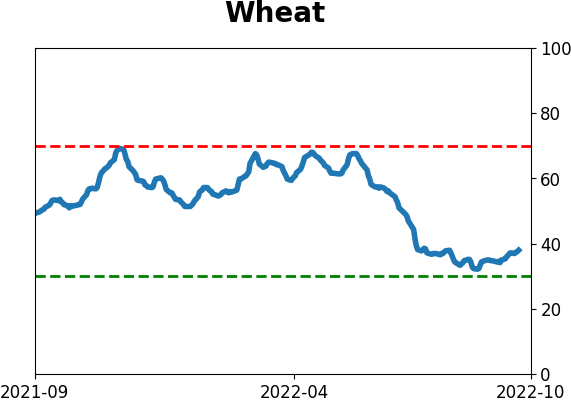
Agriculture
|
|
Research
By Jason Goepfert
BOTTOM LINE
More than half of Treasury yield curves are now inverted, and the median curve is negative. Every time that's happened, recession was soon to follow. Our Macro Index Model is confirming that outlook. Under similar conditions, stock returns tended to be weak up to a few months later, but not necessarily after that.
FORECAST / TIMEFRAME
None
|
Key points:
- More than half of Treasury yield curves are now inverted, and the median curve is inverted
- At the same time, our Macro Index Model has deteriorated and is suggesting a recession
- Equity returns tend to be weak in the short- to medium-term under similar conditions; long-term returns don't
With more than half of curves inverted, recession seems inevitable
Earlier this year, investors started to get nervous when a few yield curves inverted. The main problem with their warnings is that they often cherry-pick which curve they're looking at to maximize the fear value.
It turns out they were right to worry.
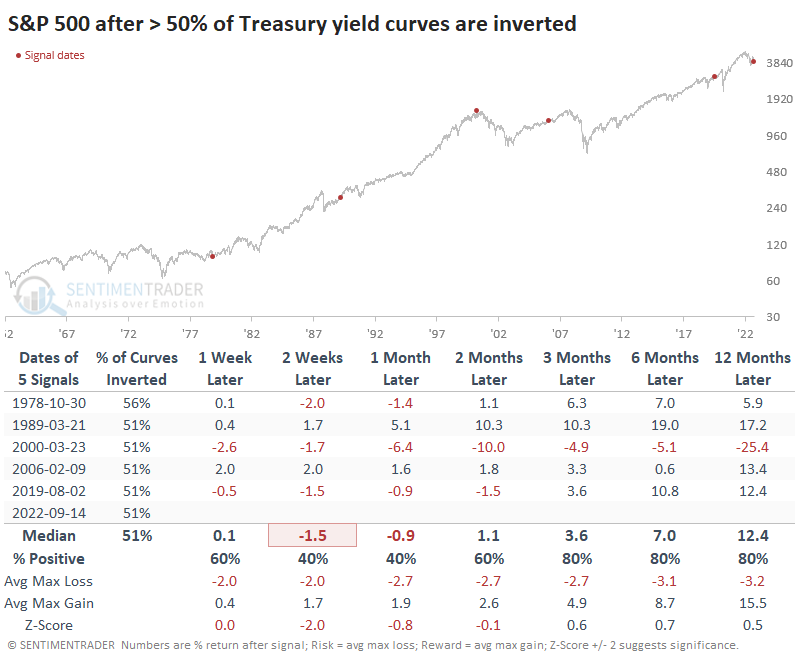
When we looked at this in March, only a few curves were inverted. A recession only becomes (much) more probable when more than 50% of major yield curve combinations show a negative value. And that's what has happened. At the same time, the median yield curve is now negative, a drastic decline over the past few months.
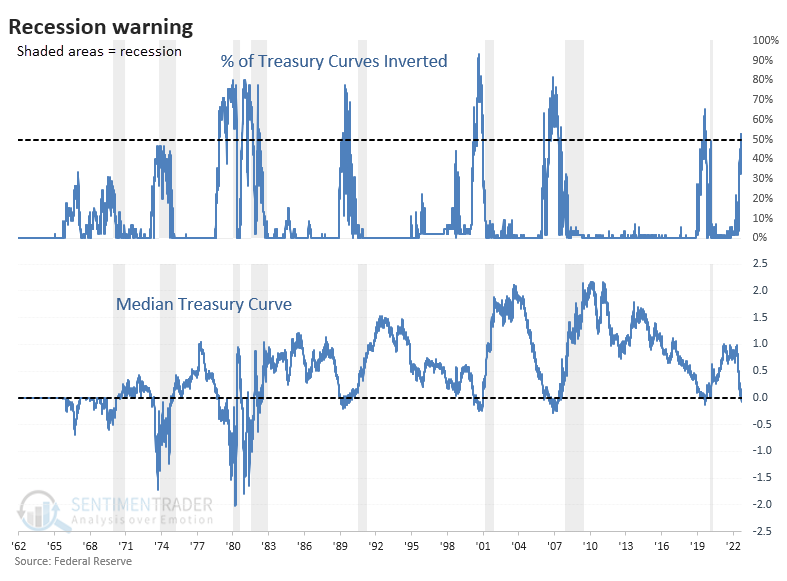
When we zoom in on the past 30 years, we can see that this combination preceded every recession, with no false positives. It's safe to say there's a high probability that one's coming down the pike, but it may take awhile.
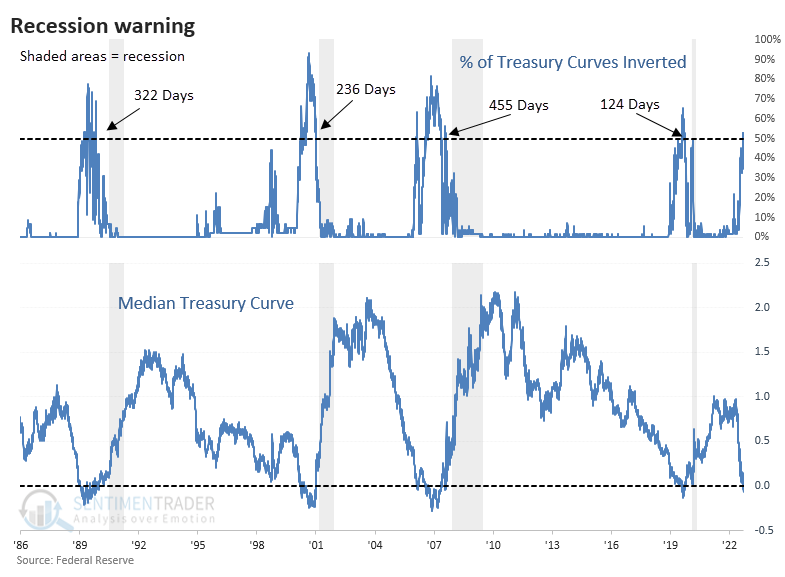
Over the past four recessions, it took an average of more than a year between when the signal triggered and the official declaration of recession. For these purposes, "signal" means that more than half of curves were inverted, and the median was negative.
Due to the nature of the data, we're limited to a tiny sample size, so any conclusions are suspect. Still, if we buy the S&P 500 just as we're about to enter a recession, surely the returns must be horrid?
Not necessarily. Of the five times this triggered, stocks did show mostly poor returns in the short term. But from 3-12 months later, the S&P sported a positive return all but once. Granted, that "once" was a doozy, as it triggered near the peak of the 2000 bubble.
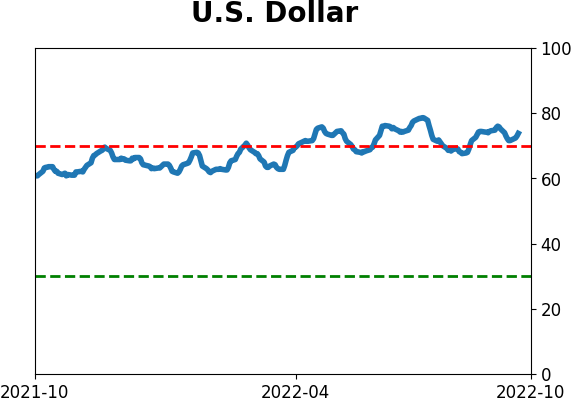
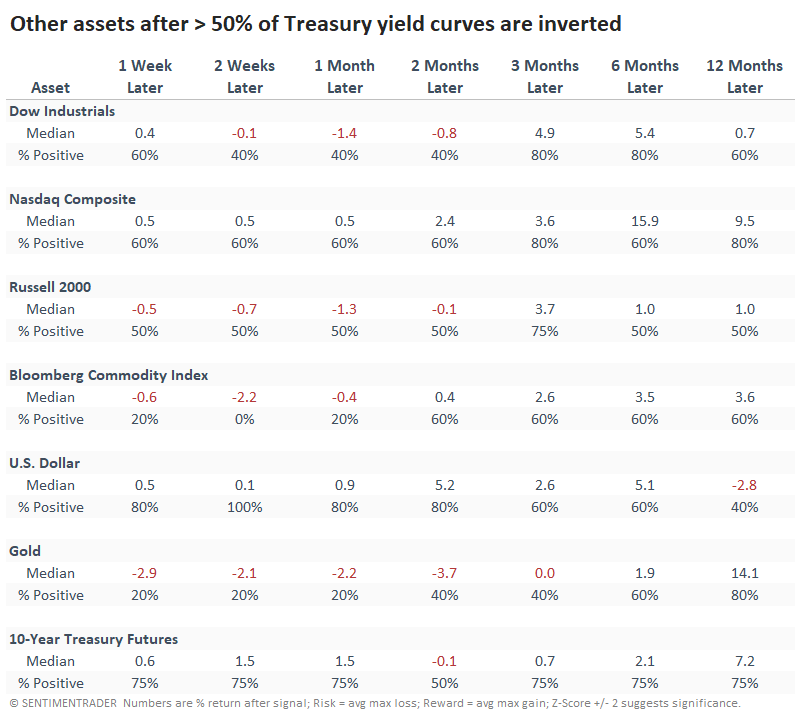
Other indexes and assets also showed mostly poor returns. The dollar tended to rally in the short- to medium-term, while gold did the opposite. It's somewhat surprising that the Nasdaq Composite performed the best out of the "big four" equity indexes.
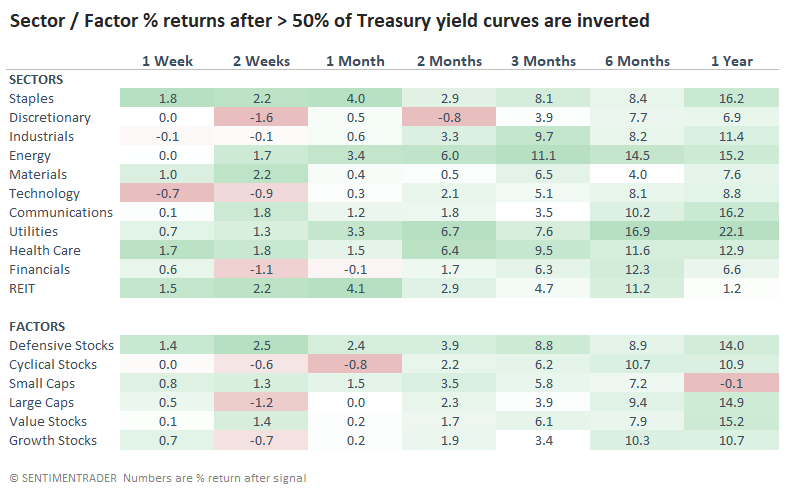
Defensive stocks showed the best and most consistent returns among sectors and factors, Staples, Health Care, and Utilities all did well. Energy also showed strong returns.
Macro conditions continue to soften
The Macro Index Model was still above the danger threshold in March but has deteriorated markedly since then.
We've noted before that if we flip the scale, it gives an estimated recession probability. That's especially true when it's beyond the threshold for more than just a month or two. Over the past three months, the model has averaged 40%, suggesting a 60% recession probability.
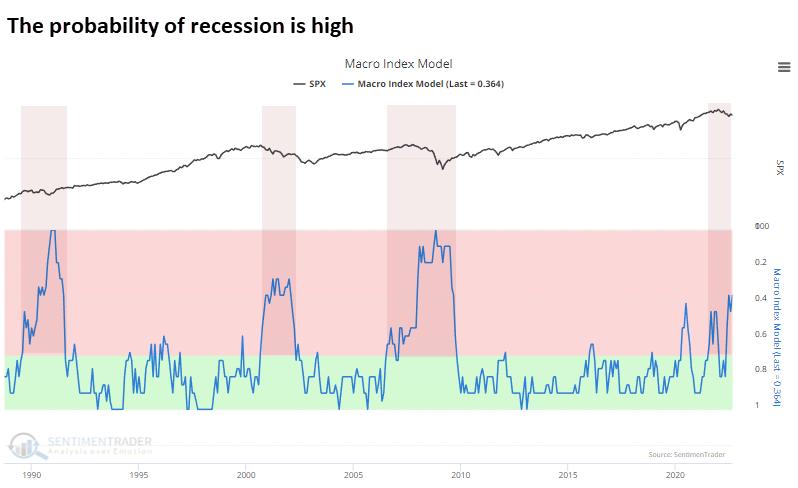
According to the Backtest Engine, the S&P 500 has not done well when the 3-month average drops below 40%. Either three or six months later, the S&P showed a negative return every time but once. Only 1988, in the aftermath of the 1987 crash, showed consistently rising prices.
What the research tells us...
Almost every study we've discussed this year related to economics or fundamentals has been negative. In June, pessimism reached a point that has preceded multi-month rallies, even during the worst markets. Then we saw the kind of retracement and buying thrusts that rarely occur in bear markets. So, behavioral and technical factors suggested the worst was likely behind us. But fundamentals have been a headwind and serve as a heavy ceiling.
Indicators at Extremes
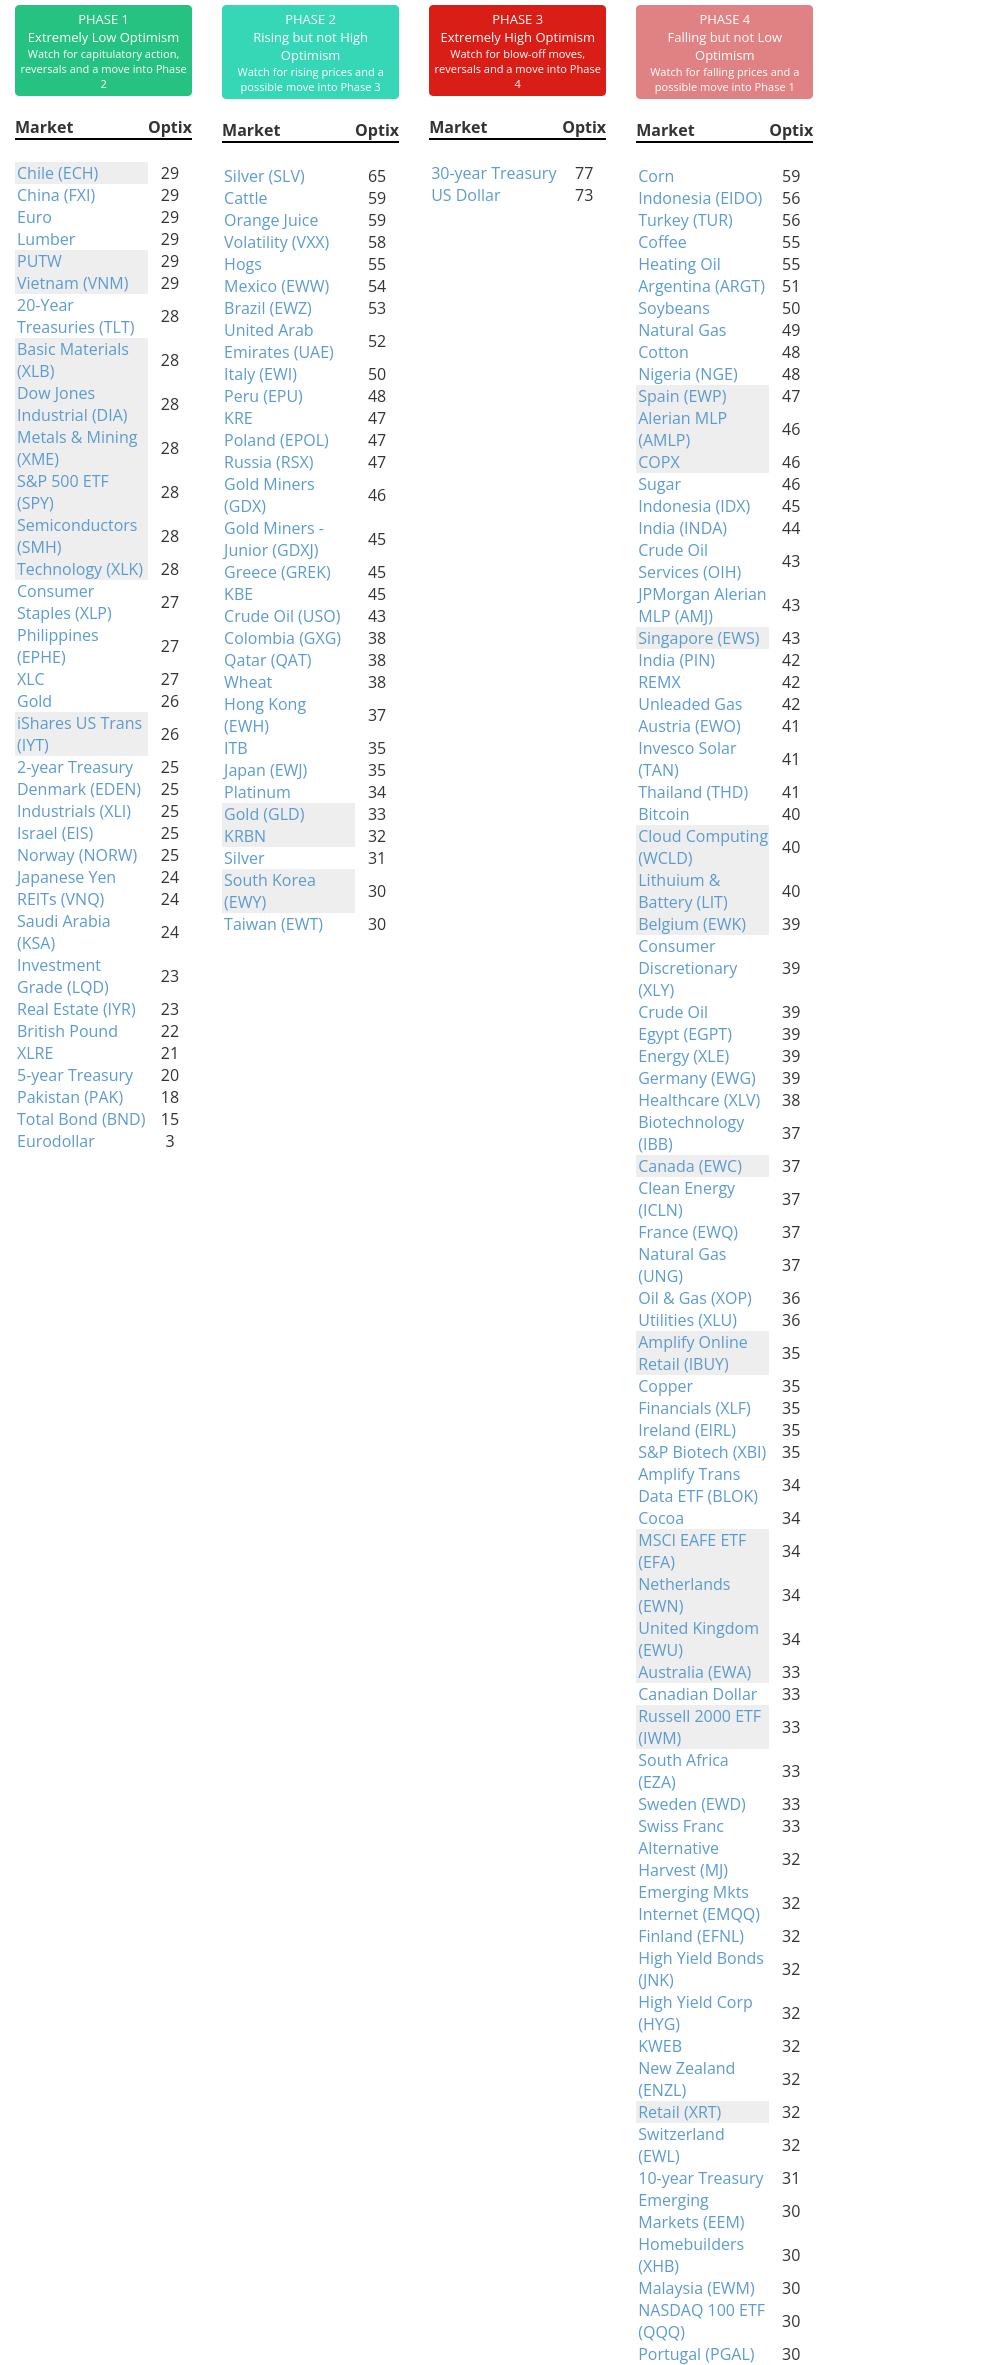
Phase Table
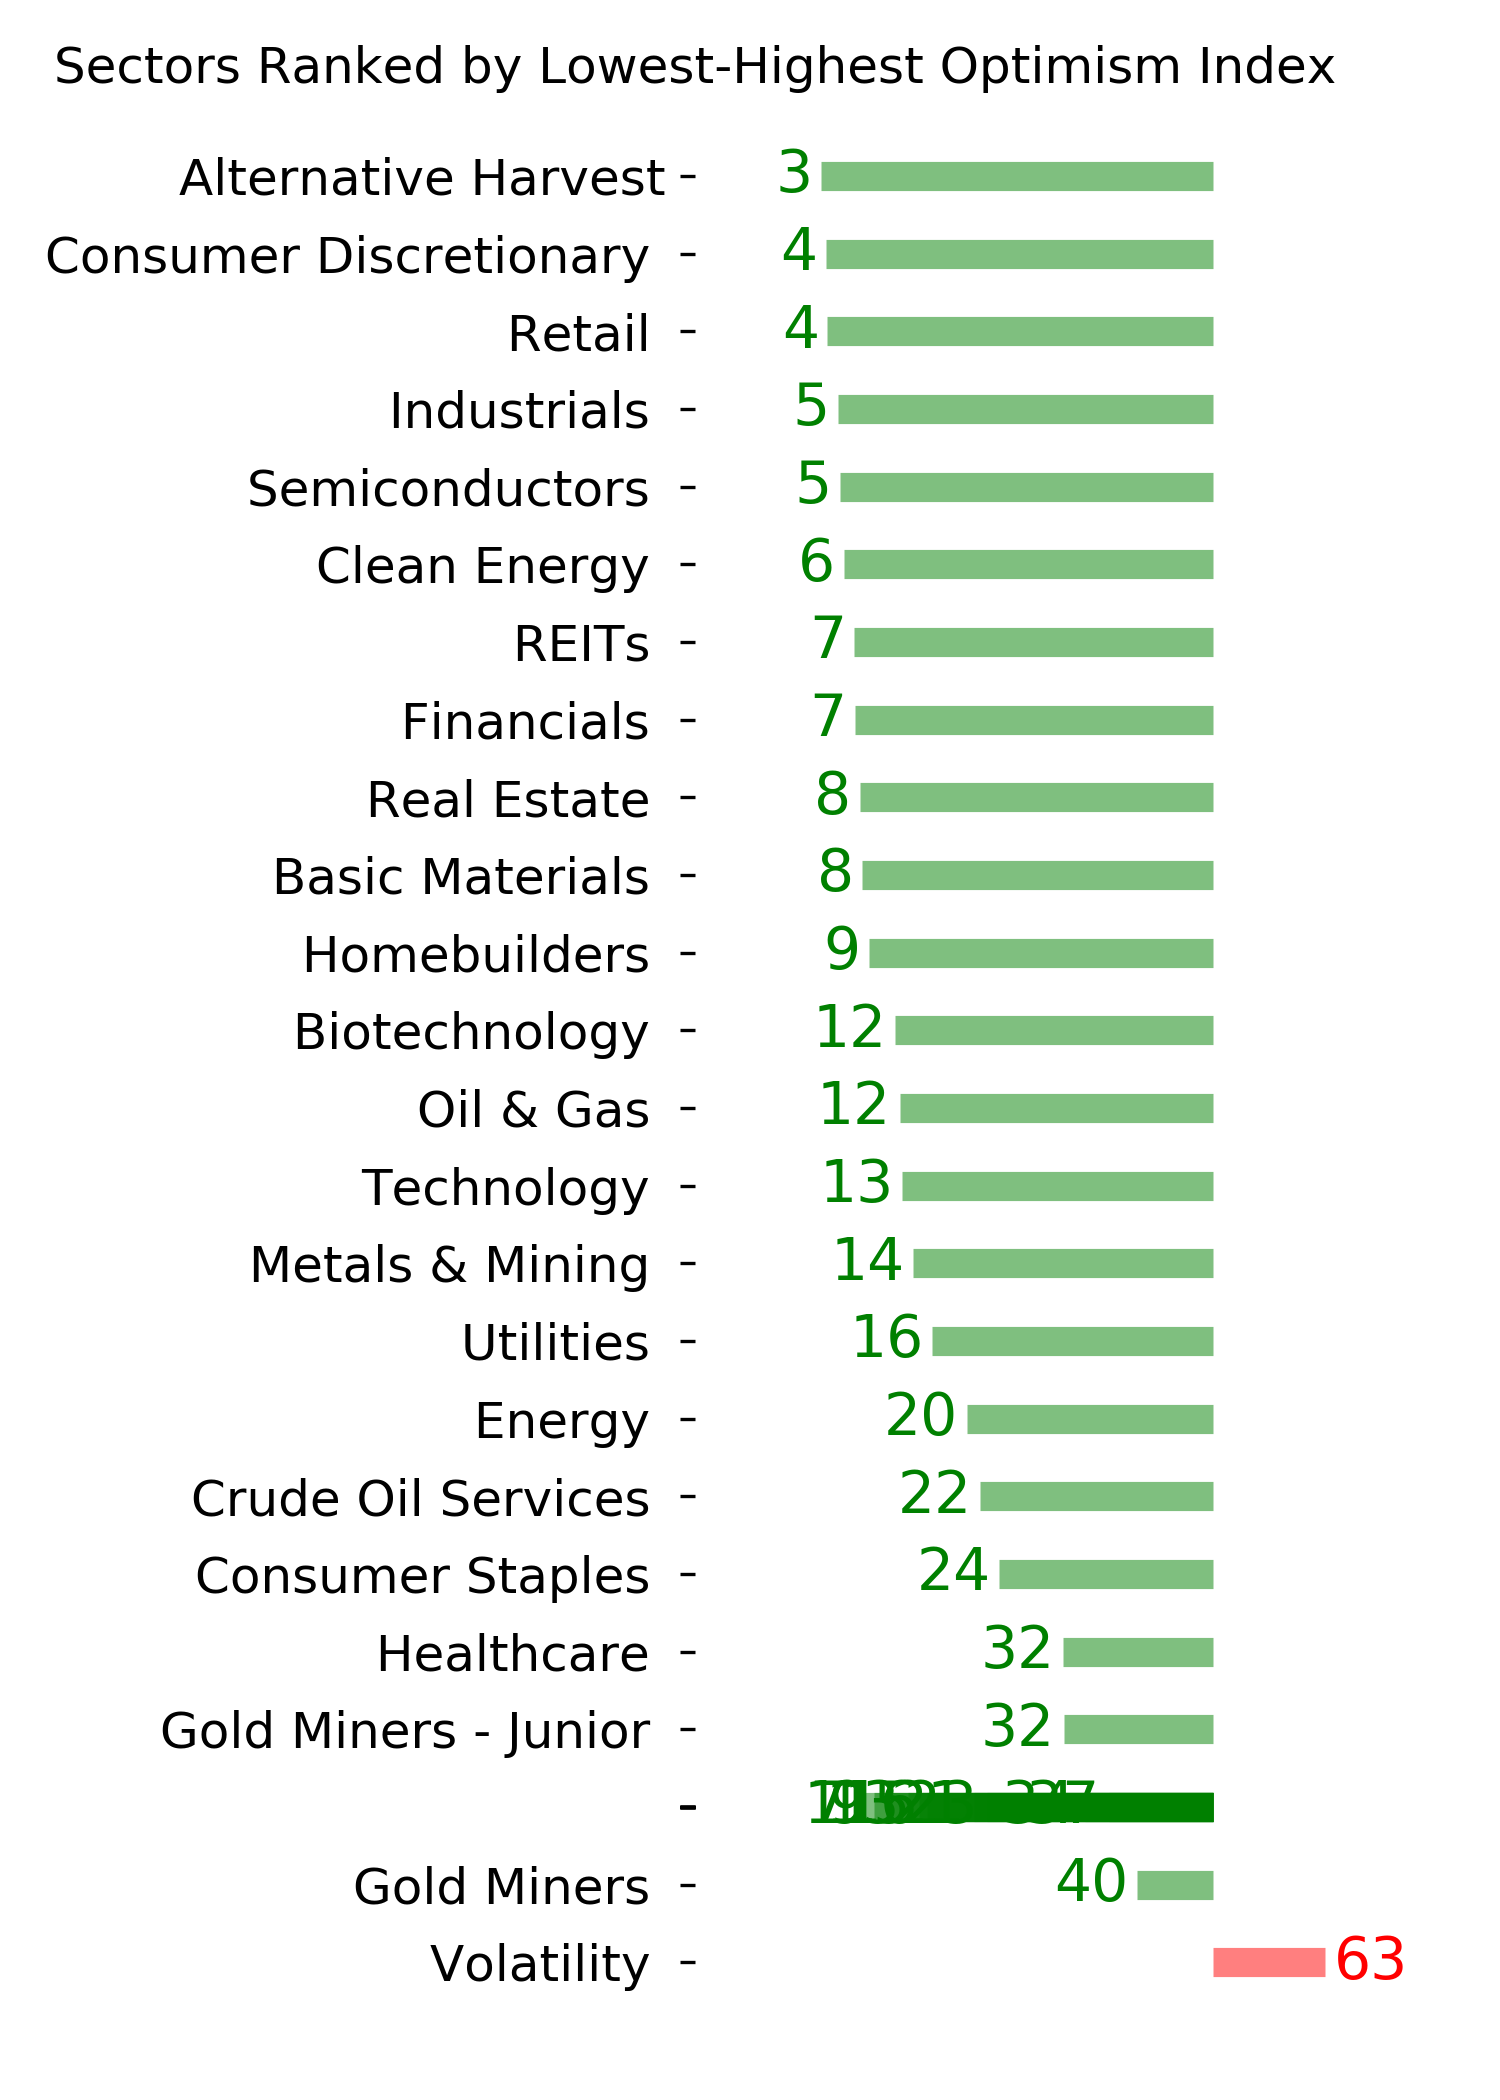
Ranks
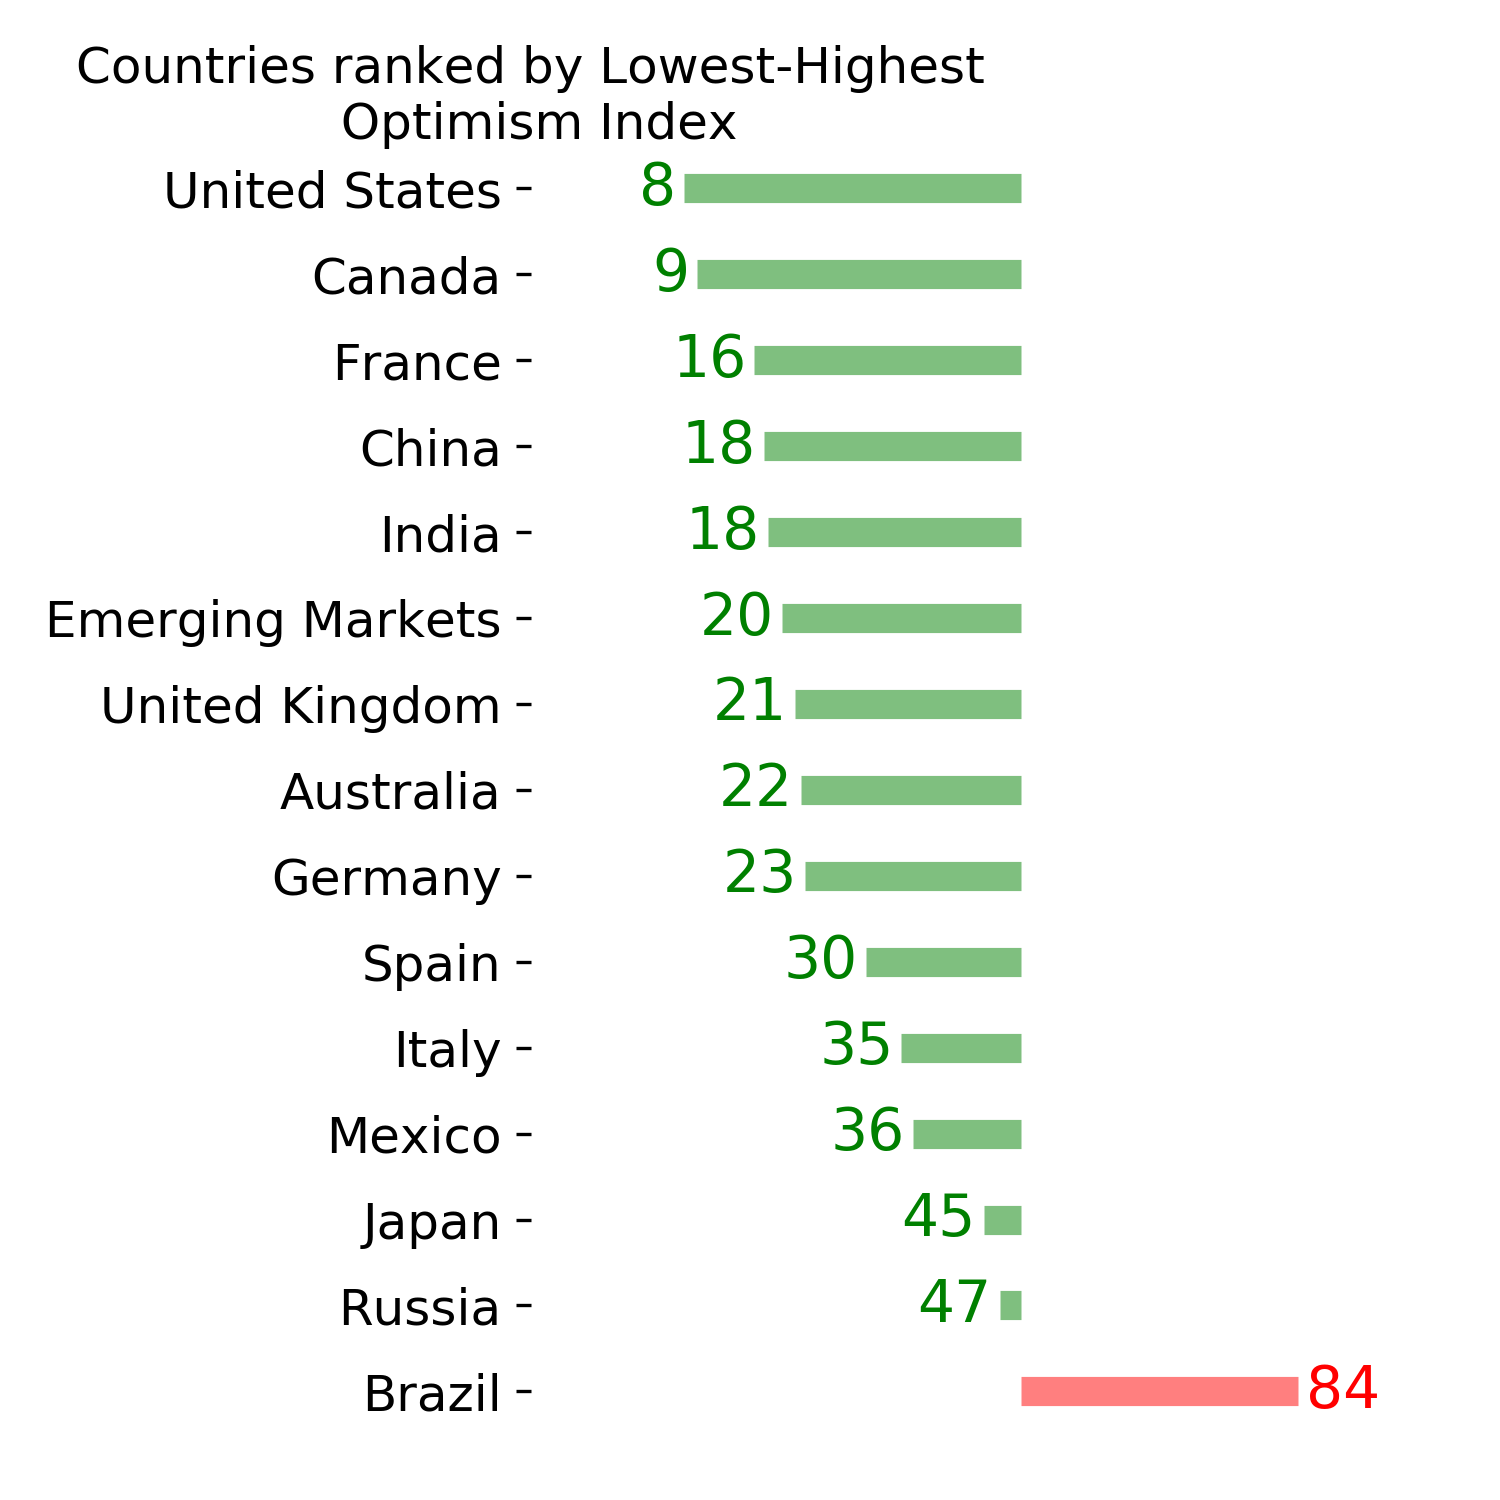
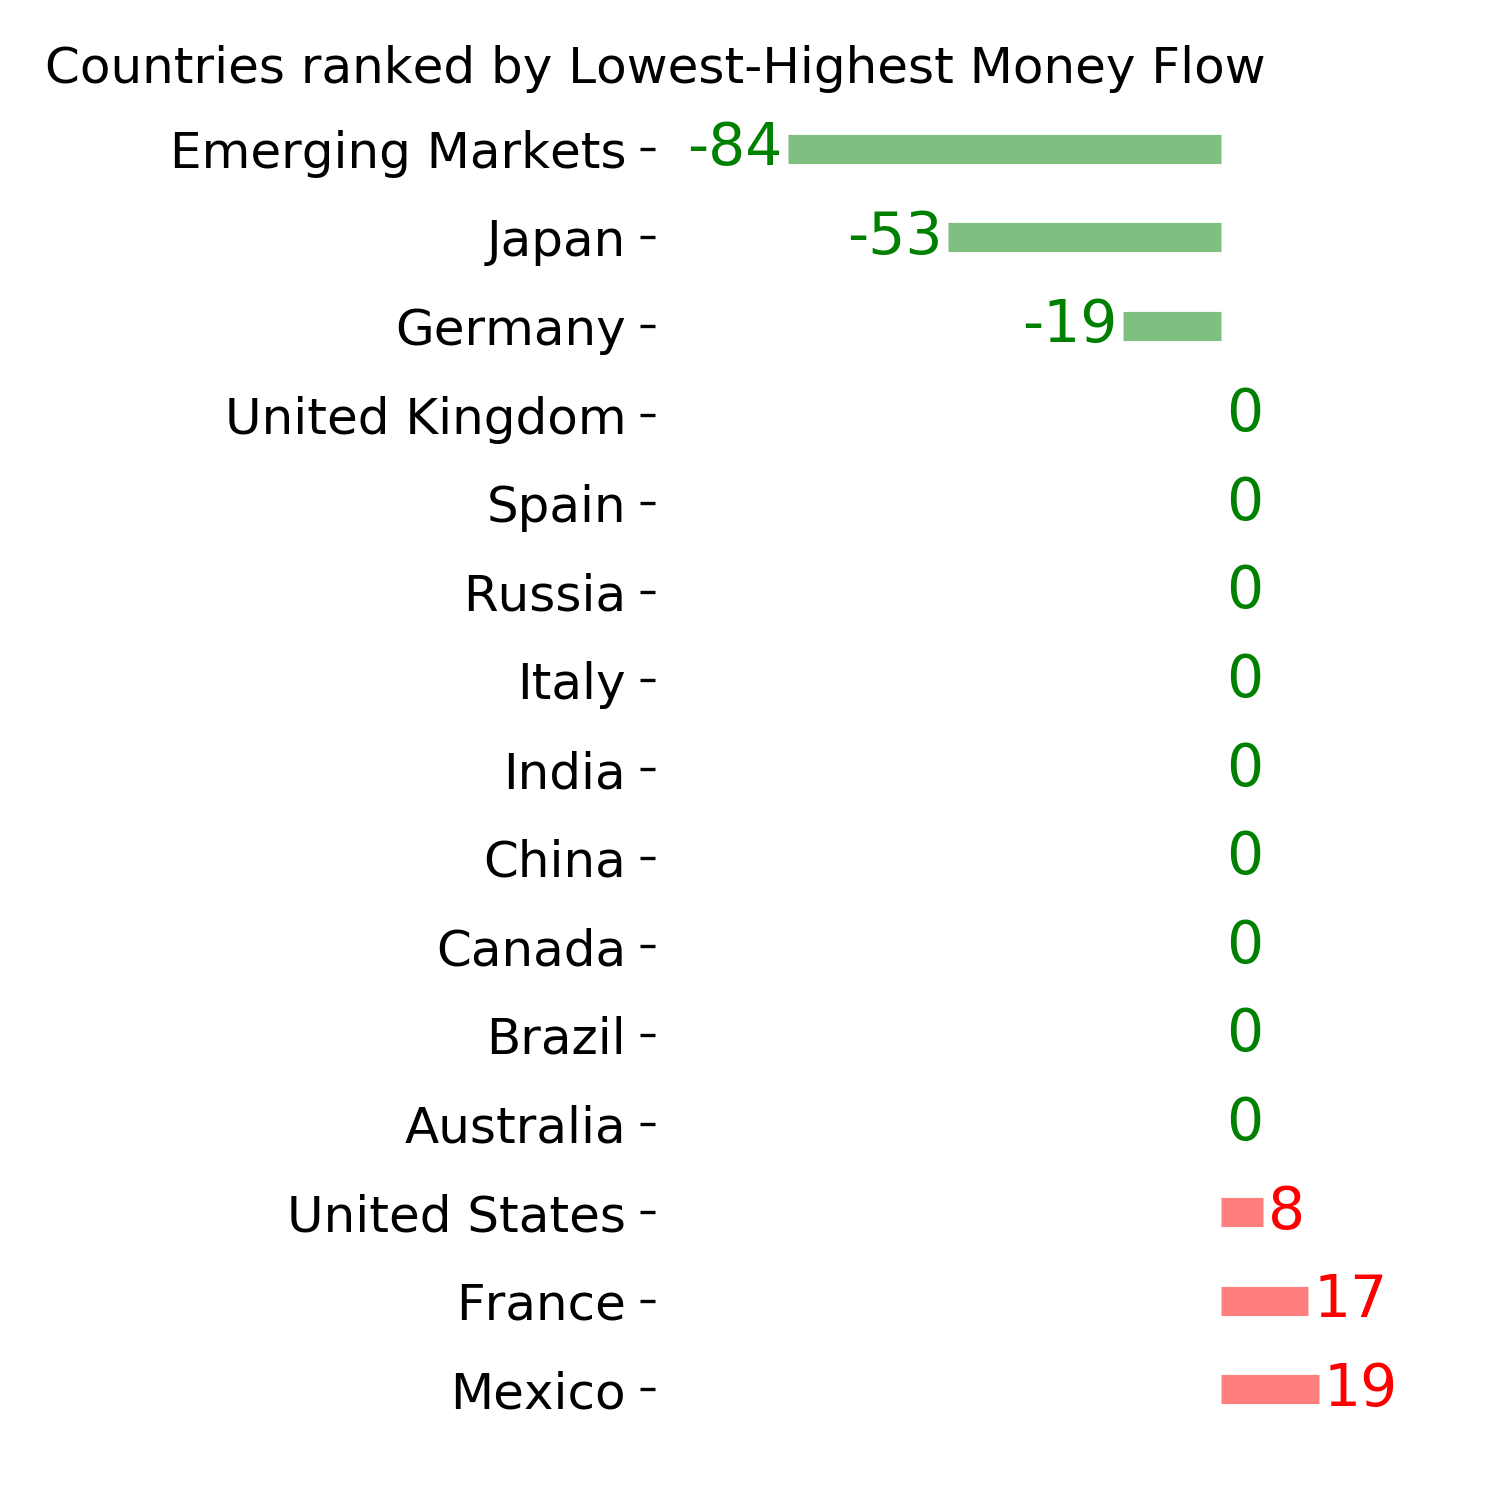
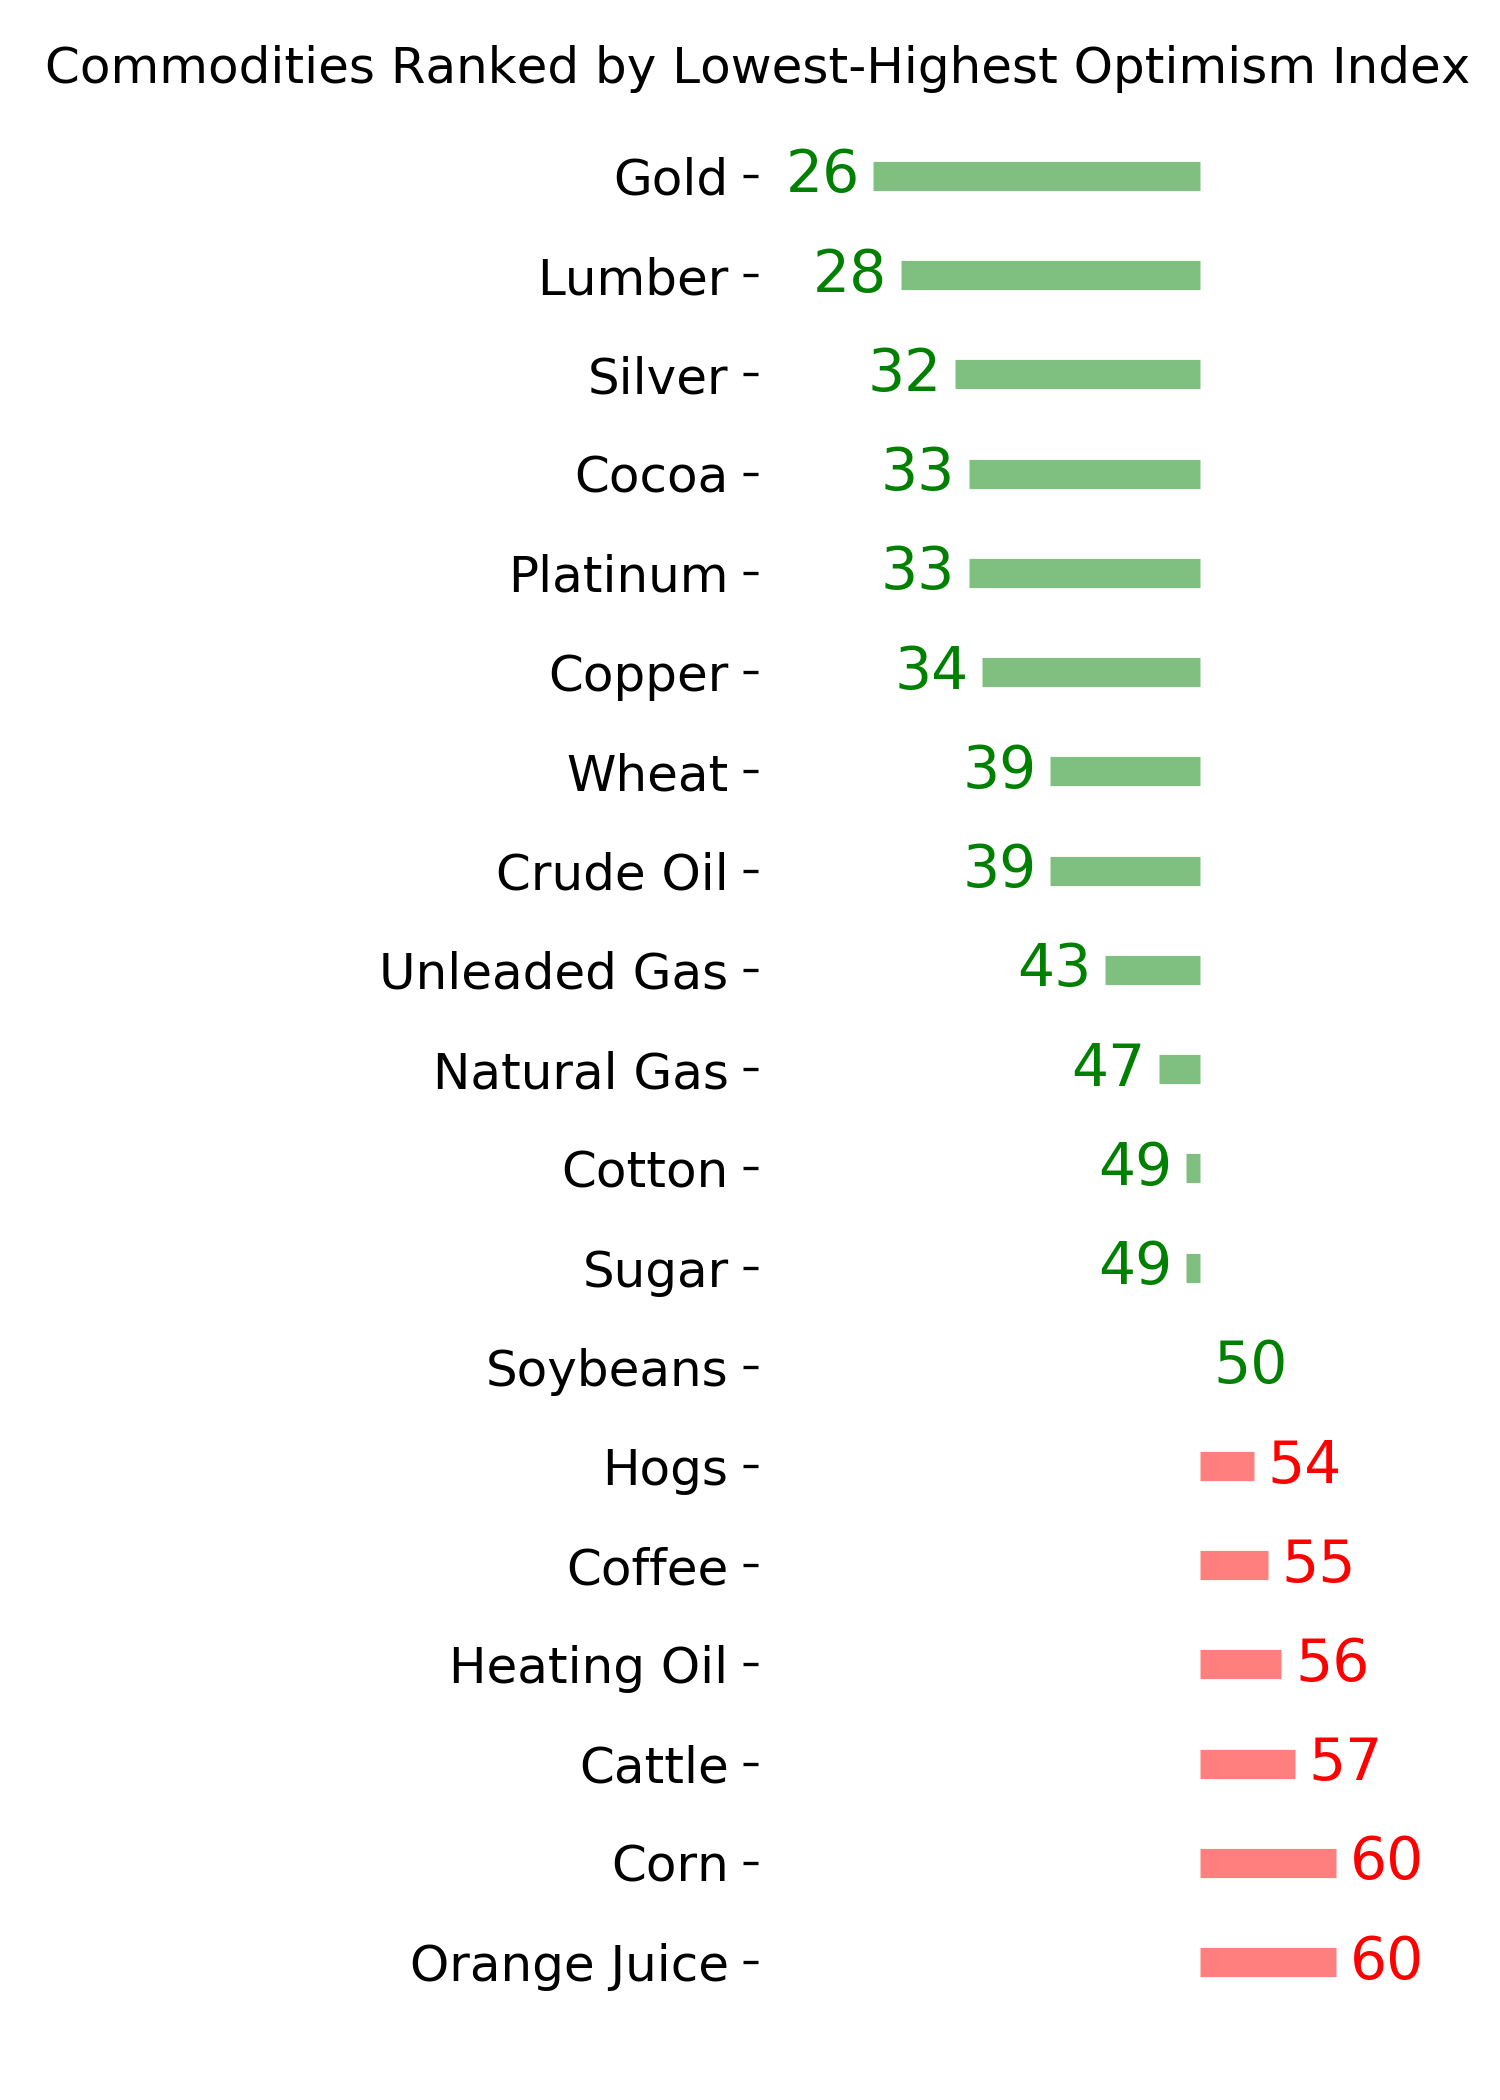
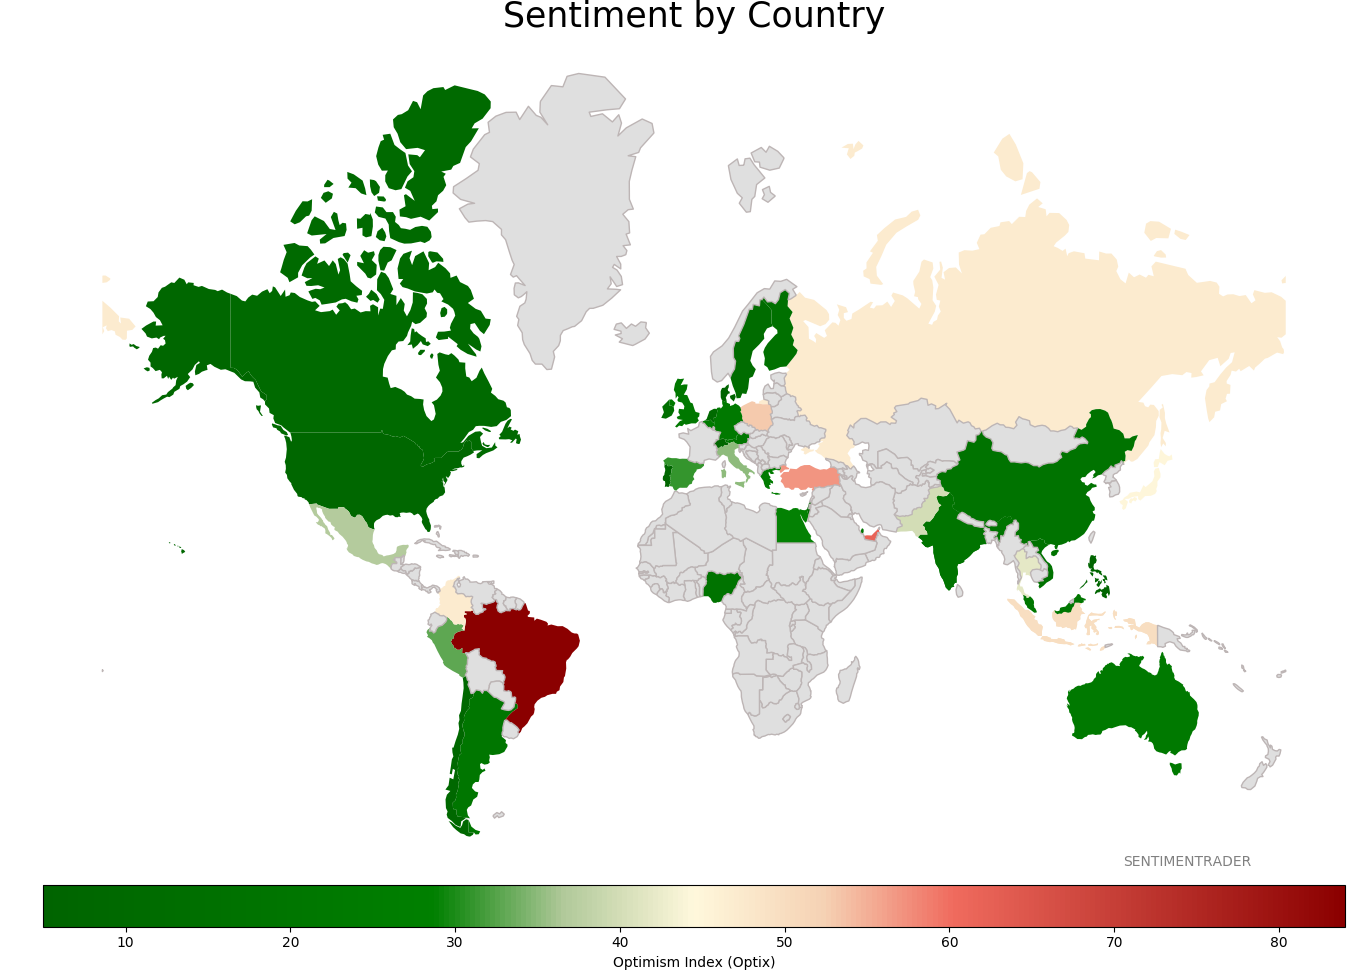
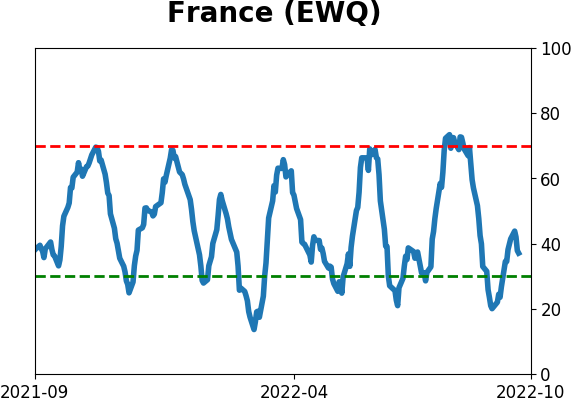
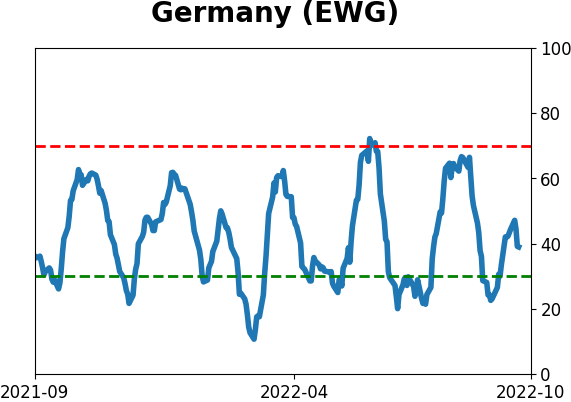
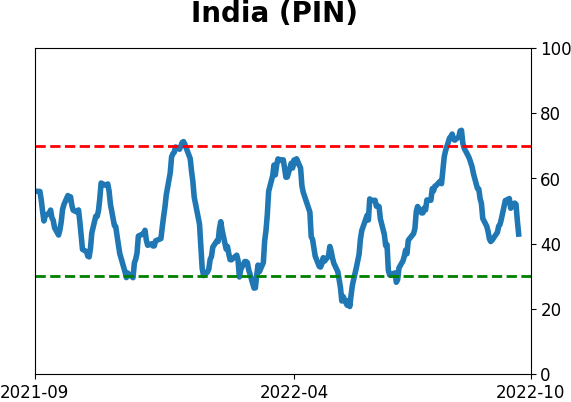
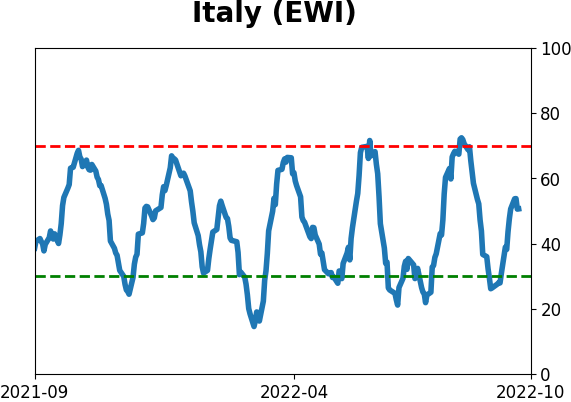
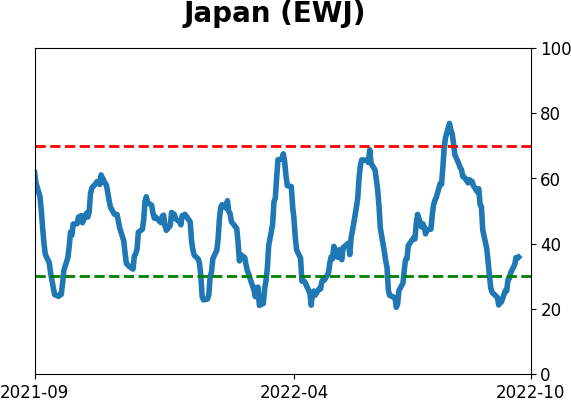
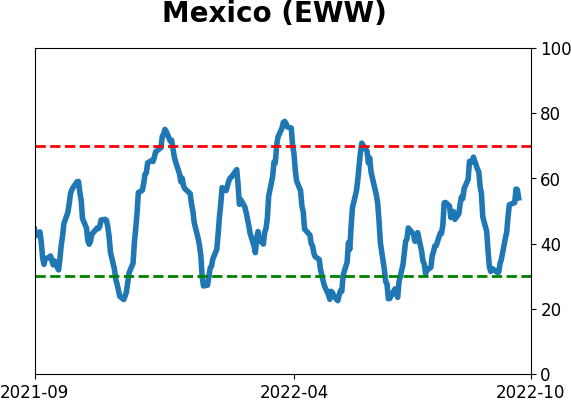
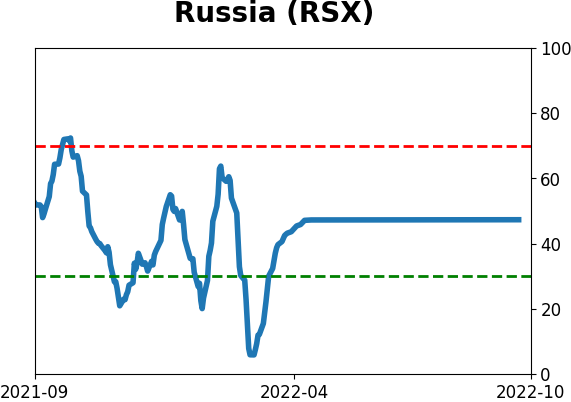
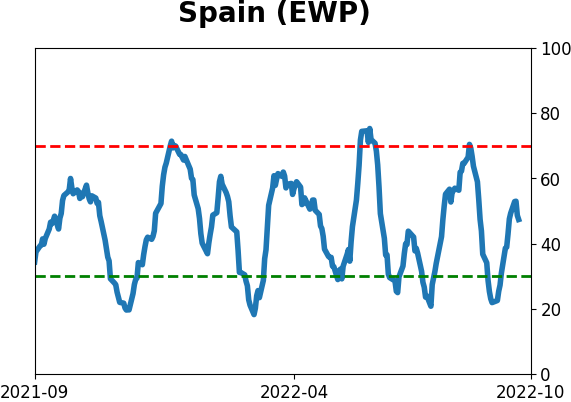
Sentiment Around The World
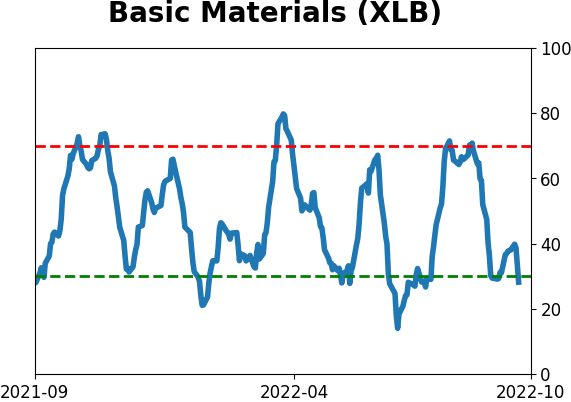
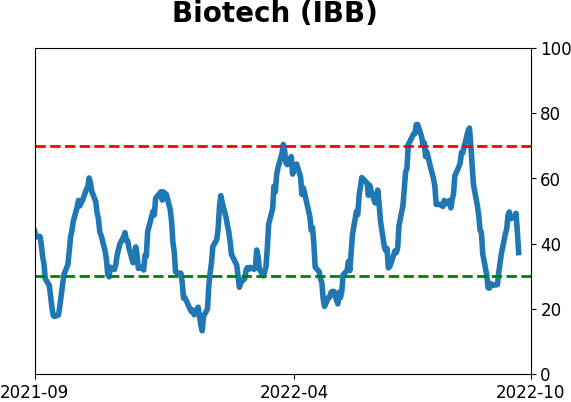
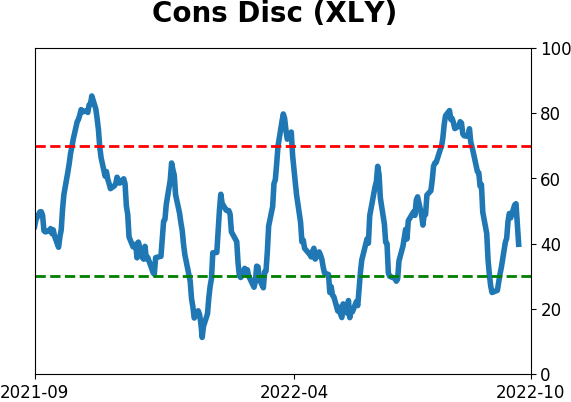
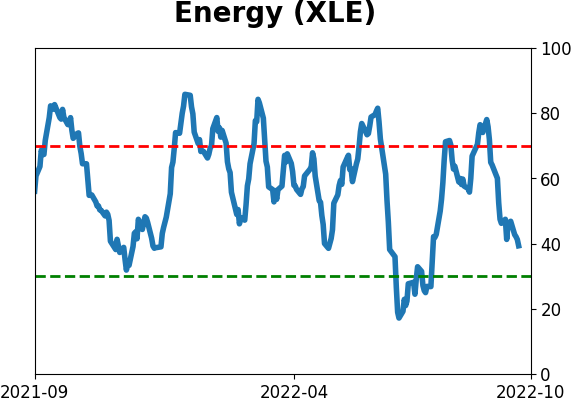
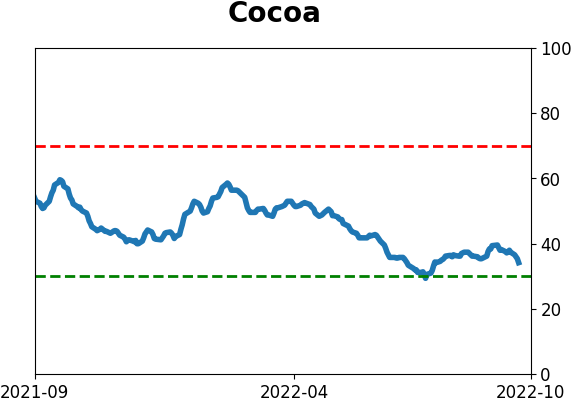
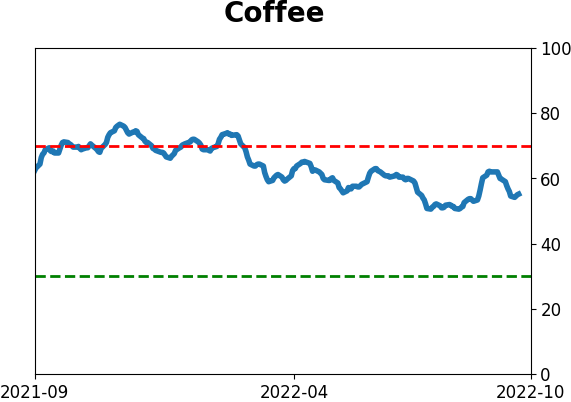
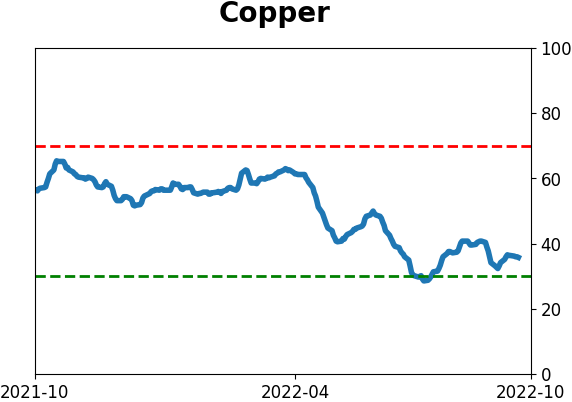
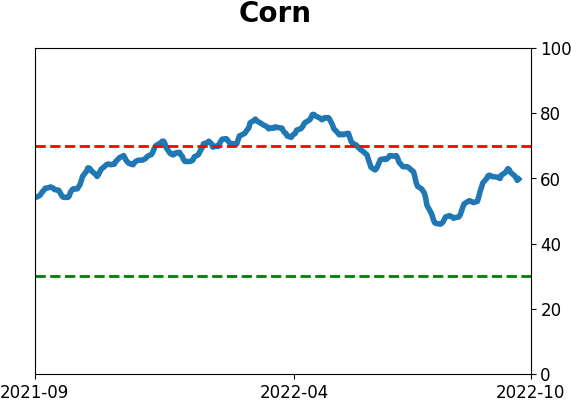
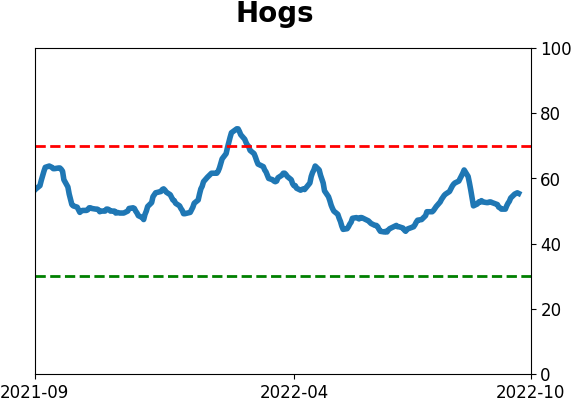
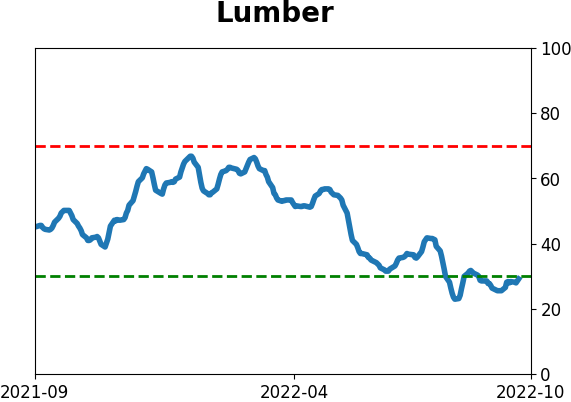
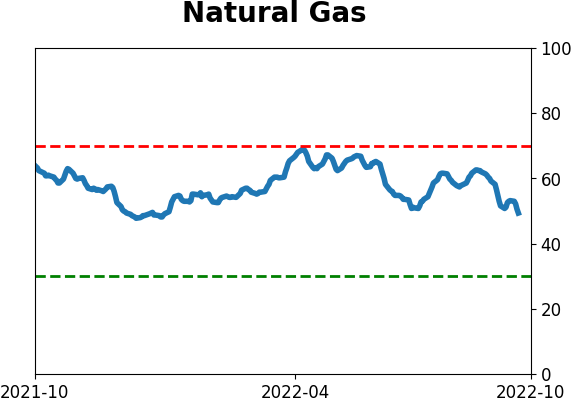
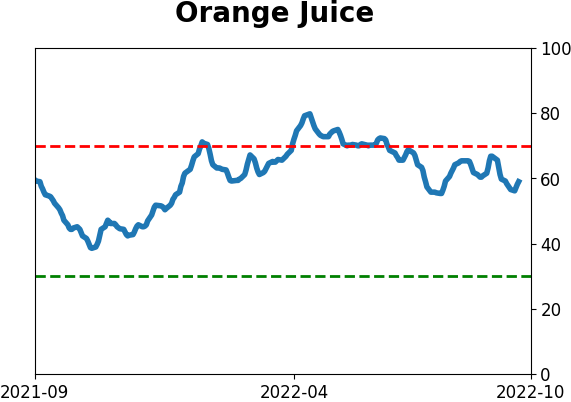
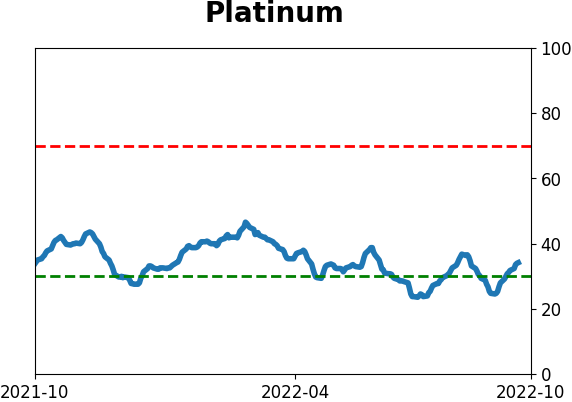
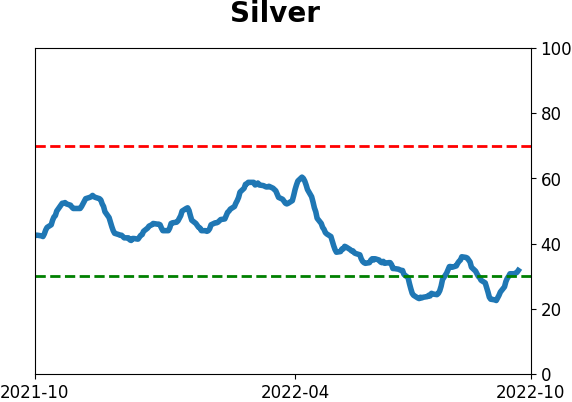
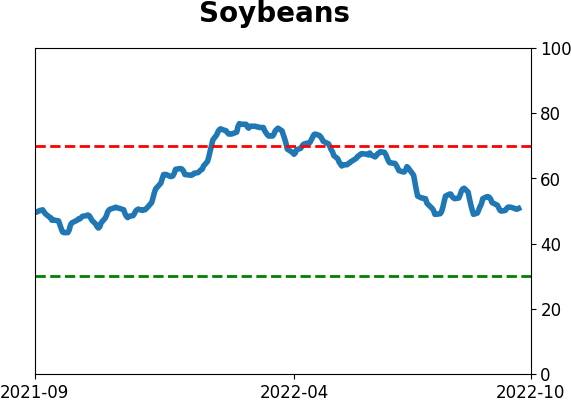
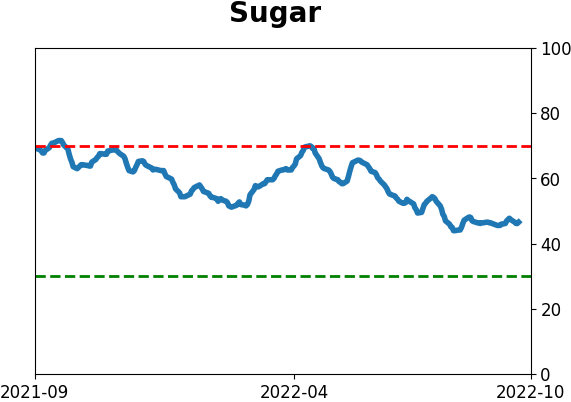
Optimism Index Thumbnails
|
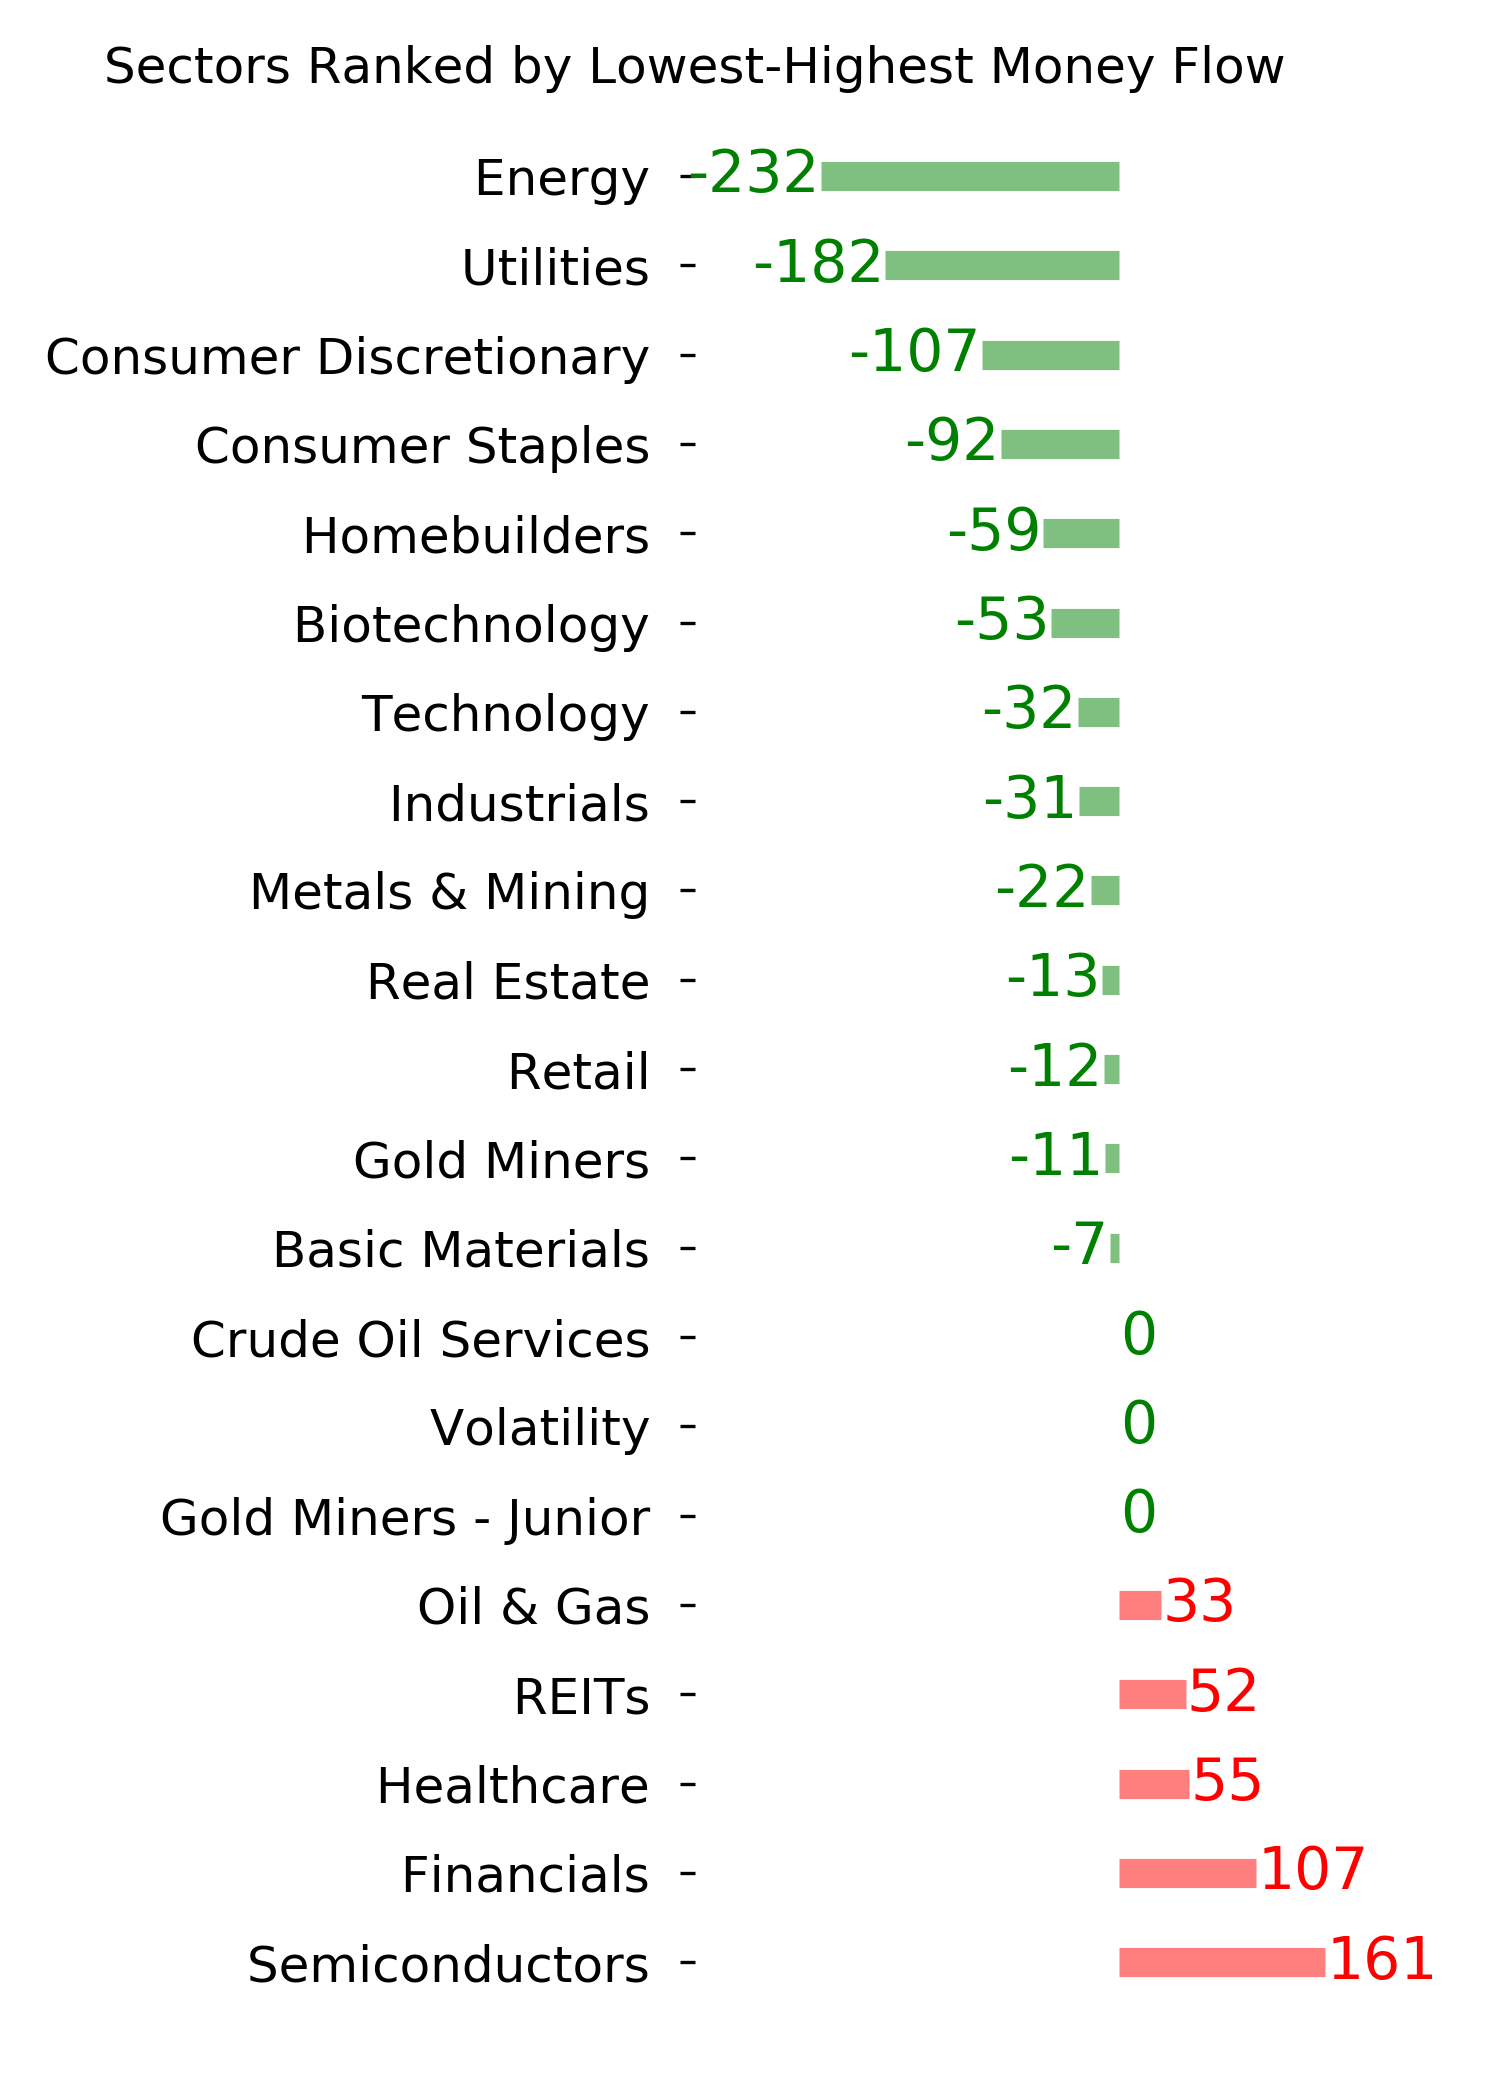
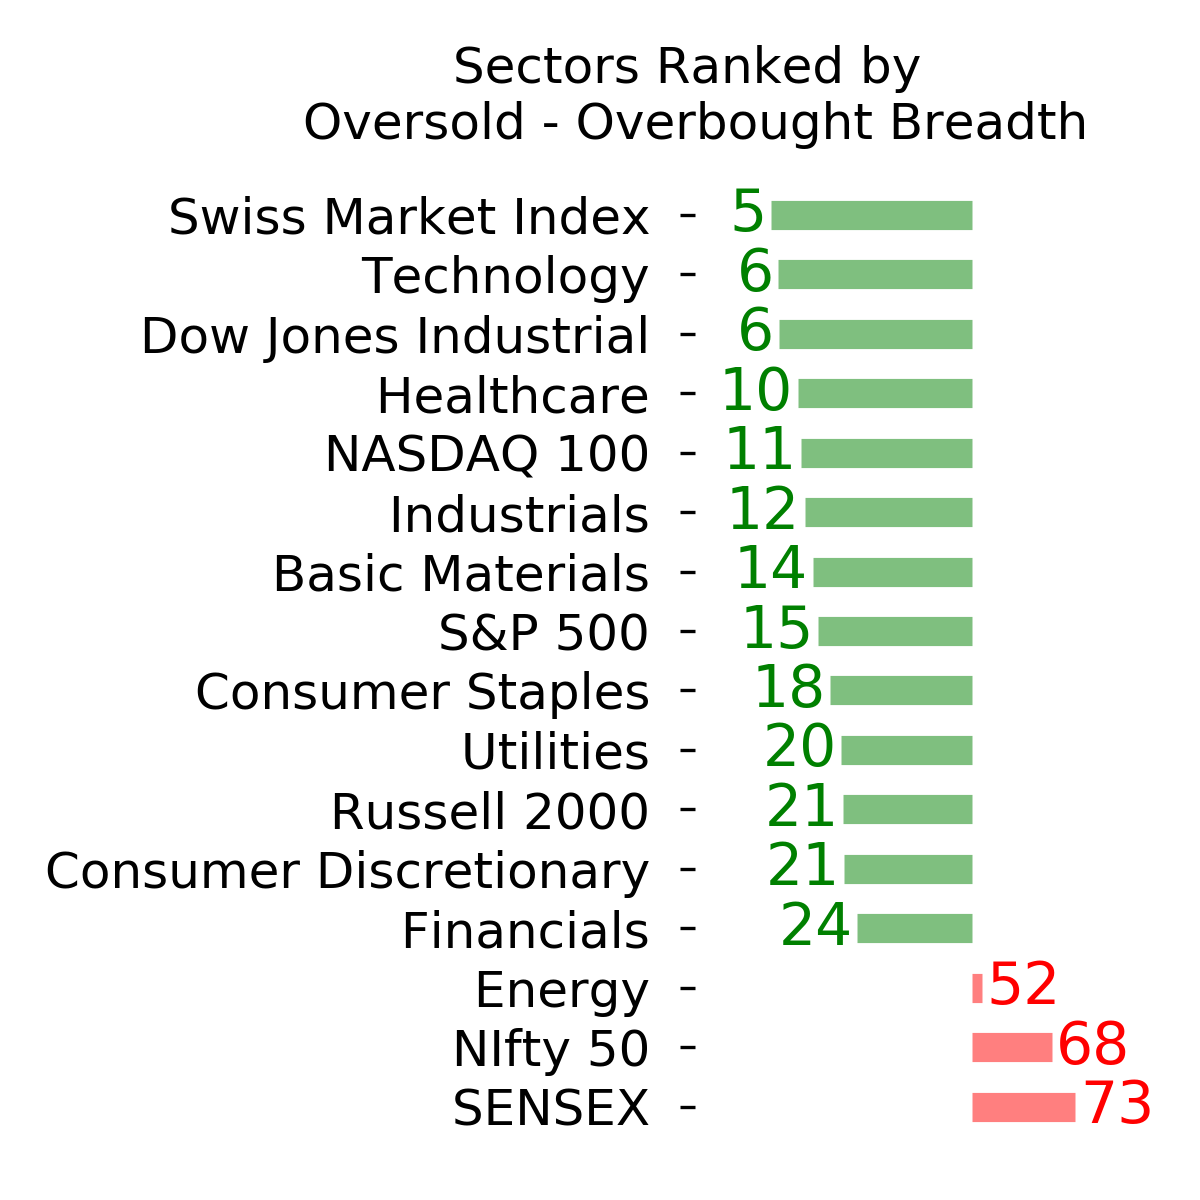
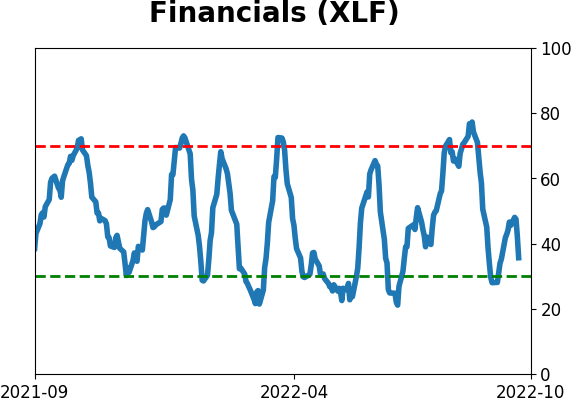
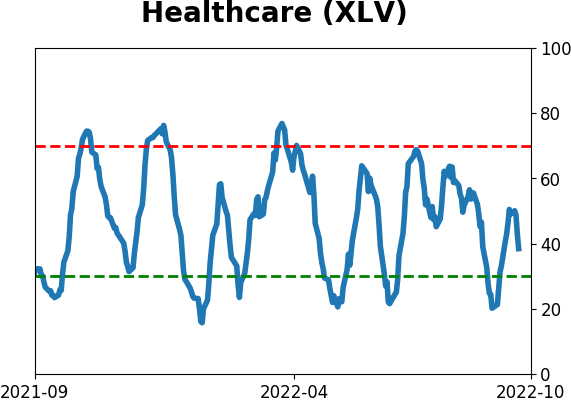
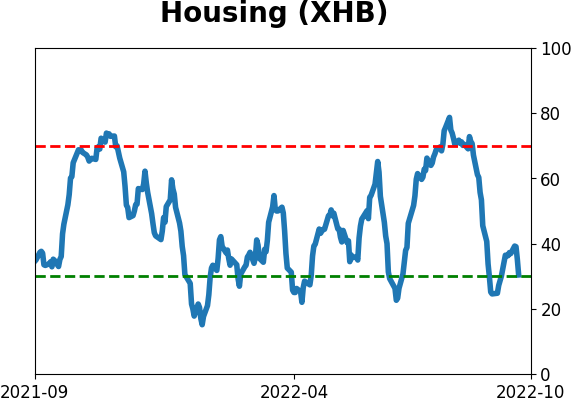
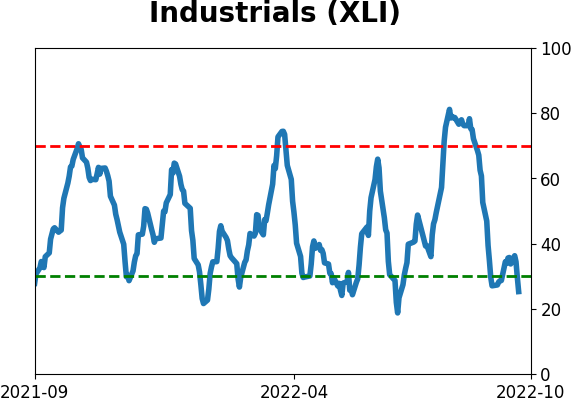
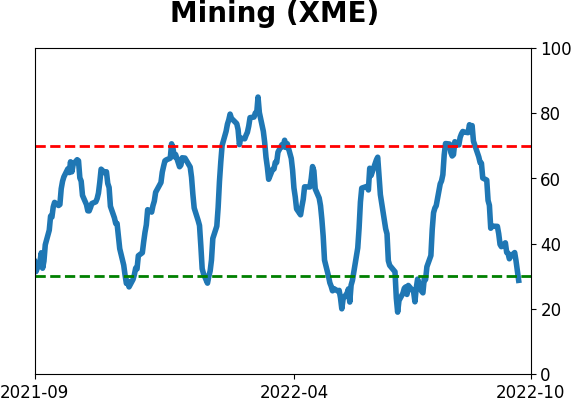
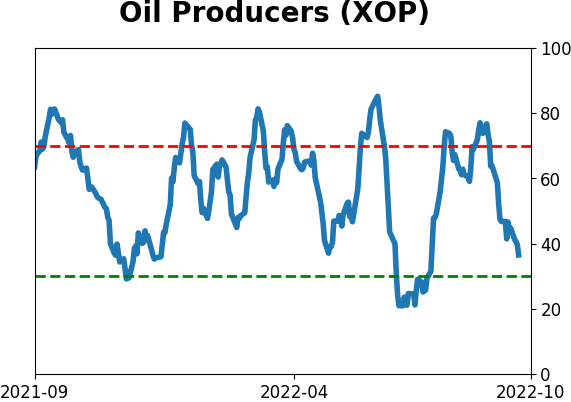
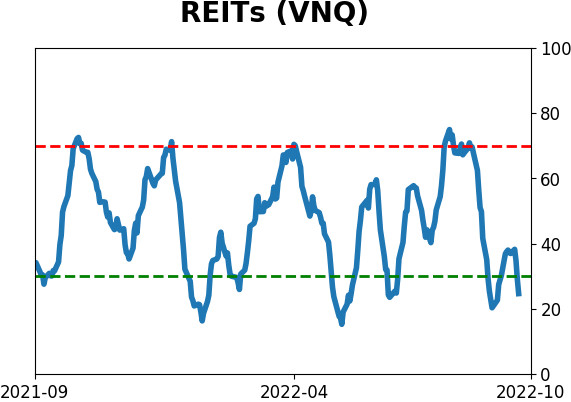
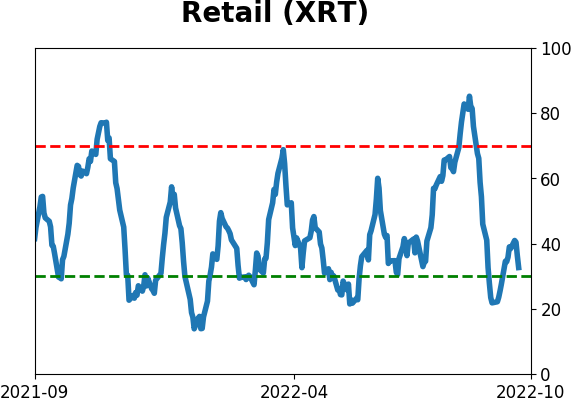
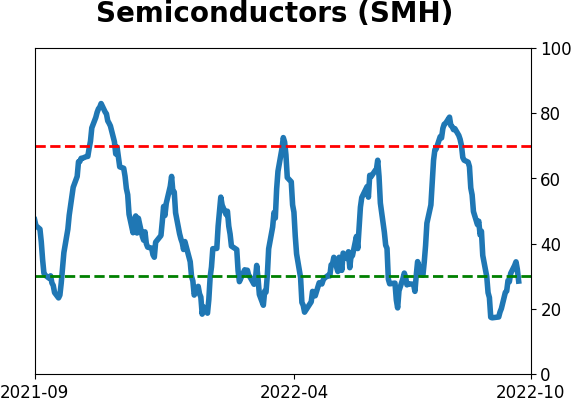
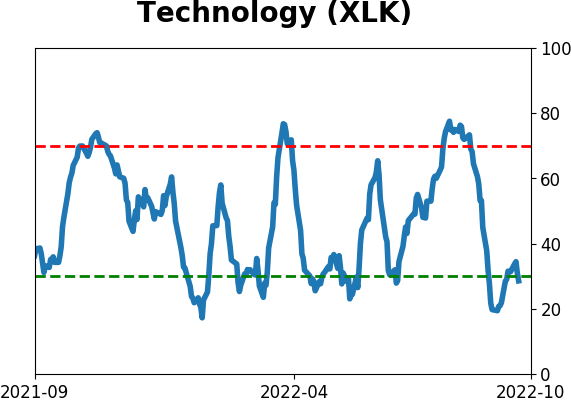
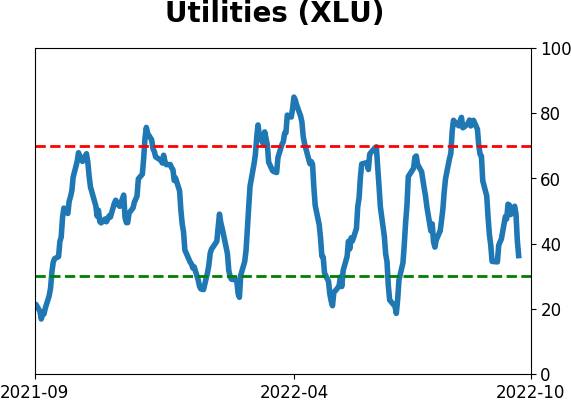
Sector ETF's - 10-Day Moving Average
|
|
|
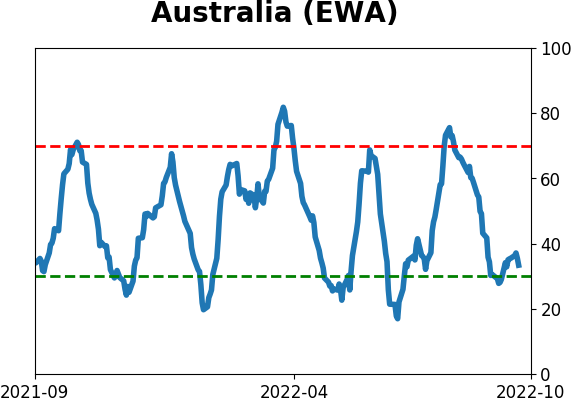
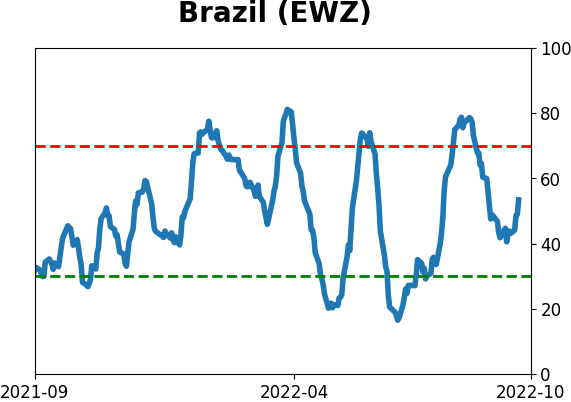
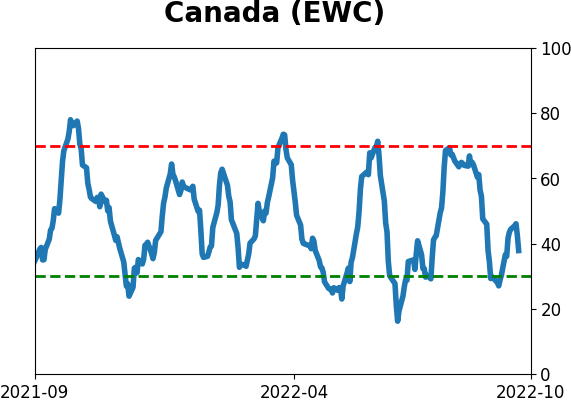
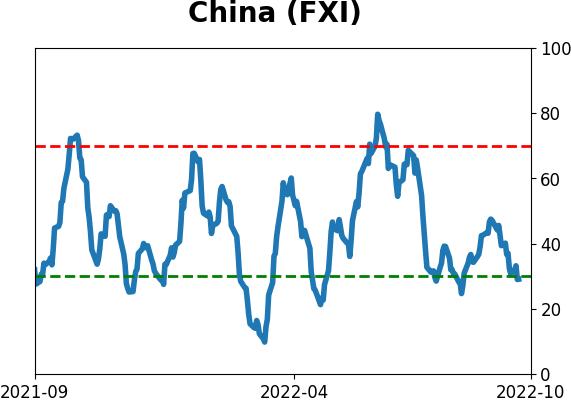
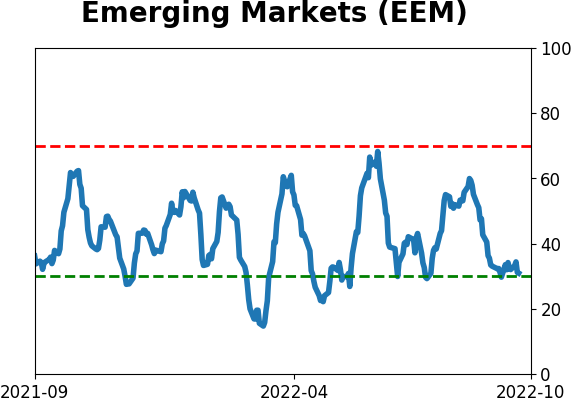
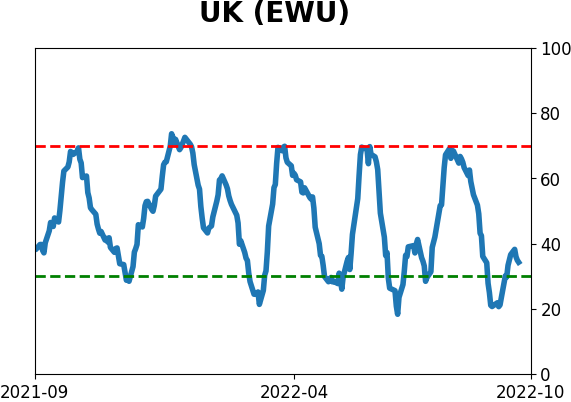
Country ETF's - 10-Day Moving Average
|
|
|
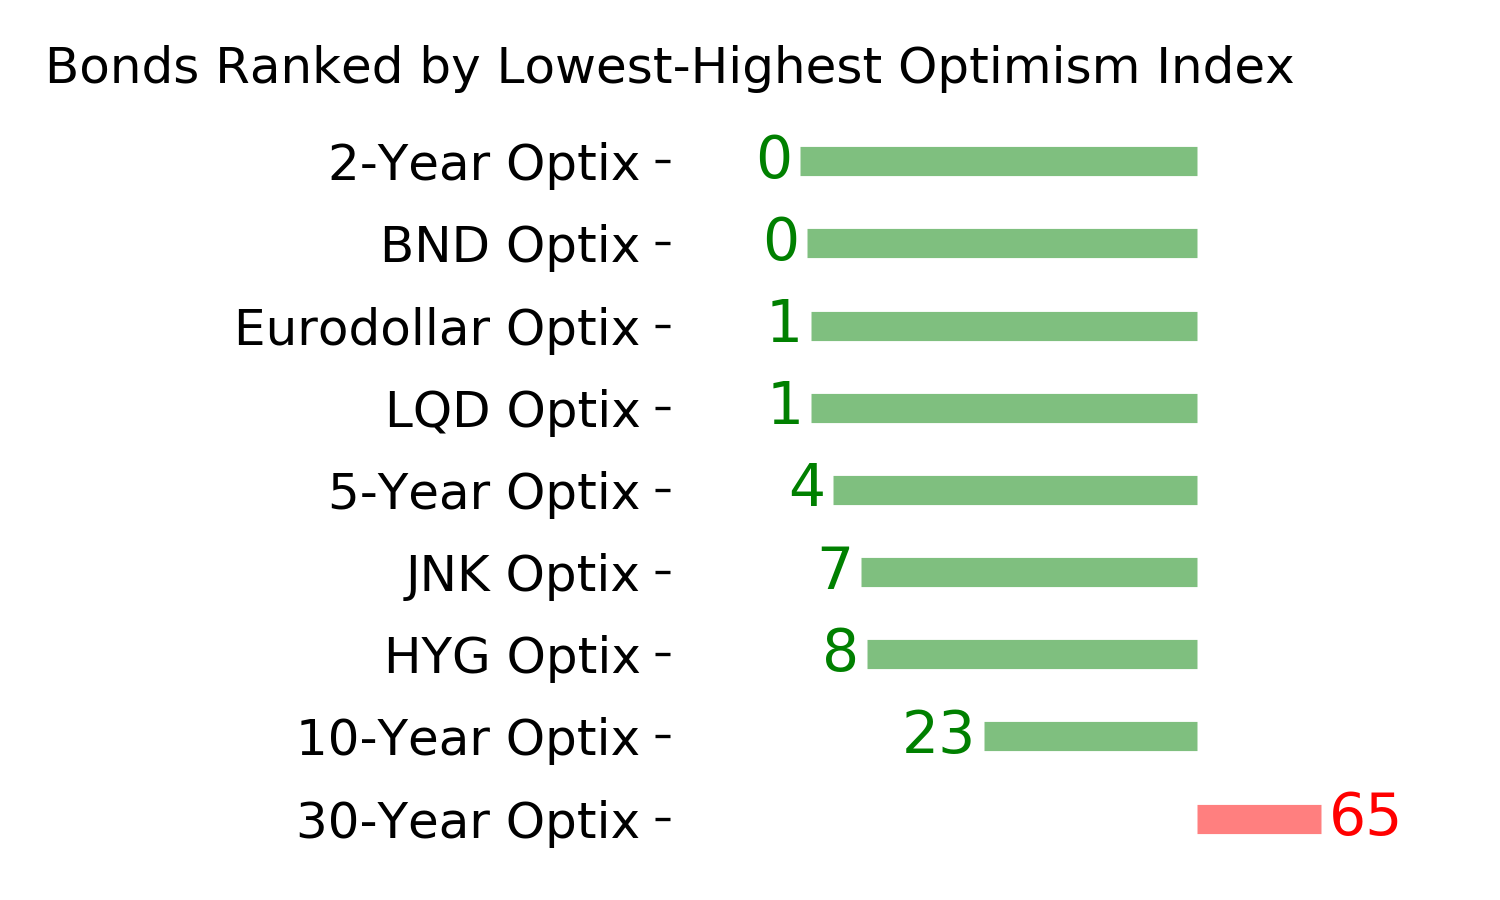
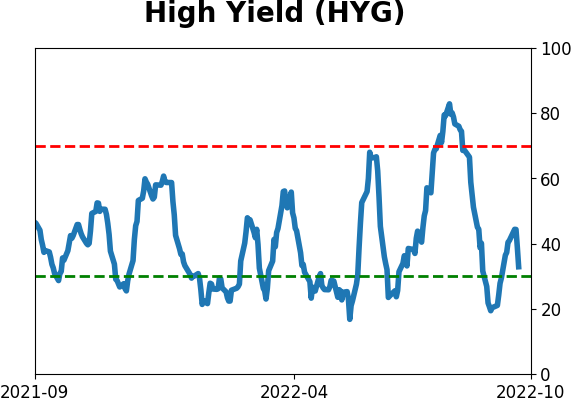
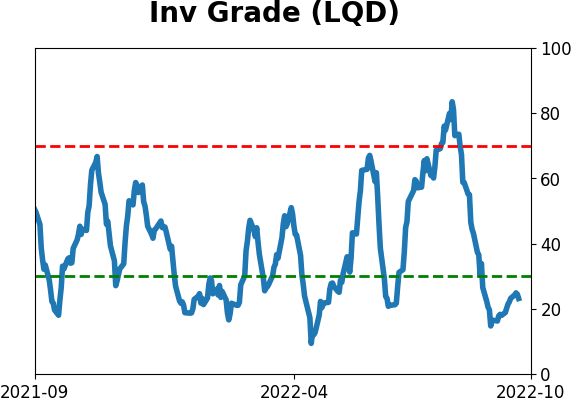
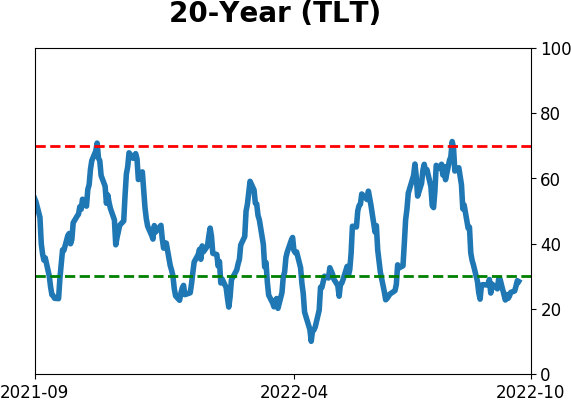
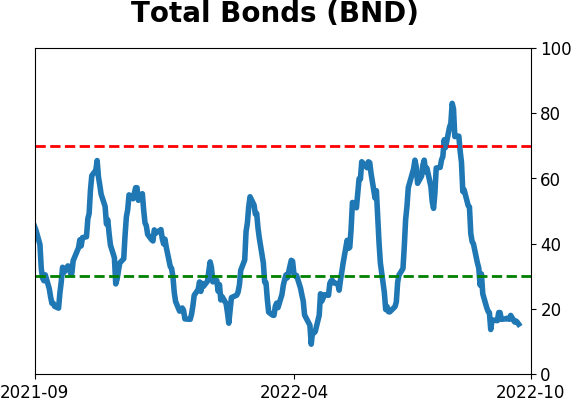
Bond ETF's - 10-Day Moving Average
|
|
|
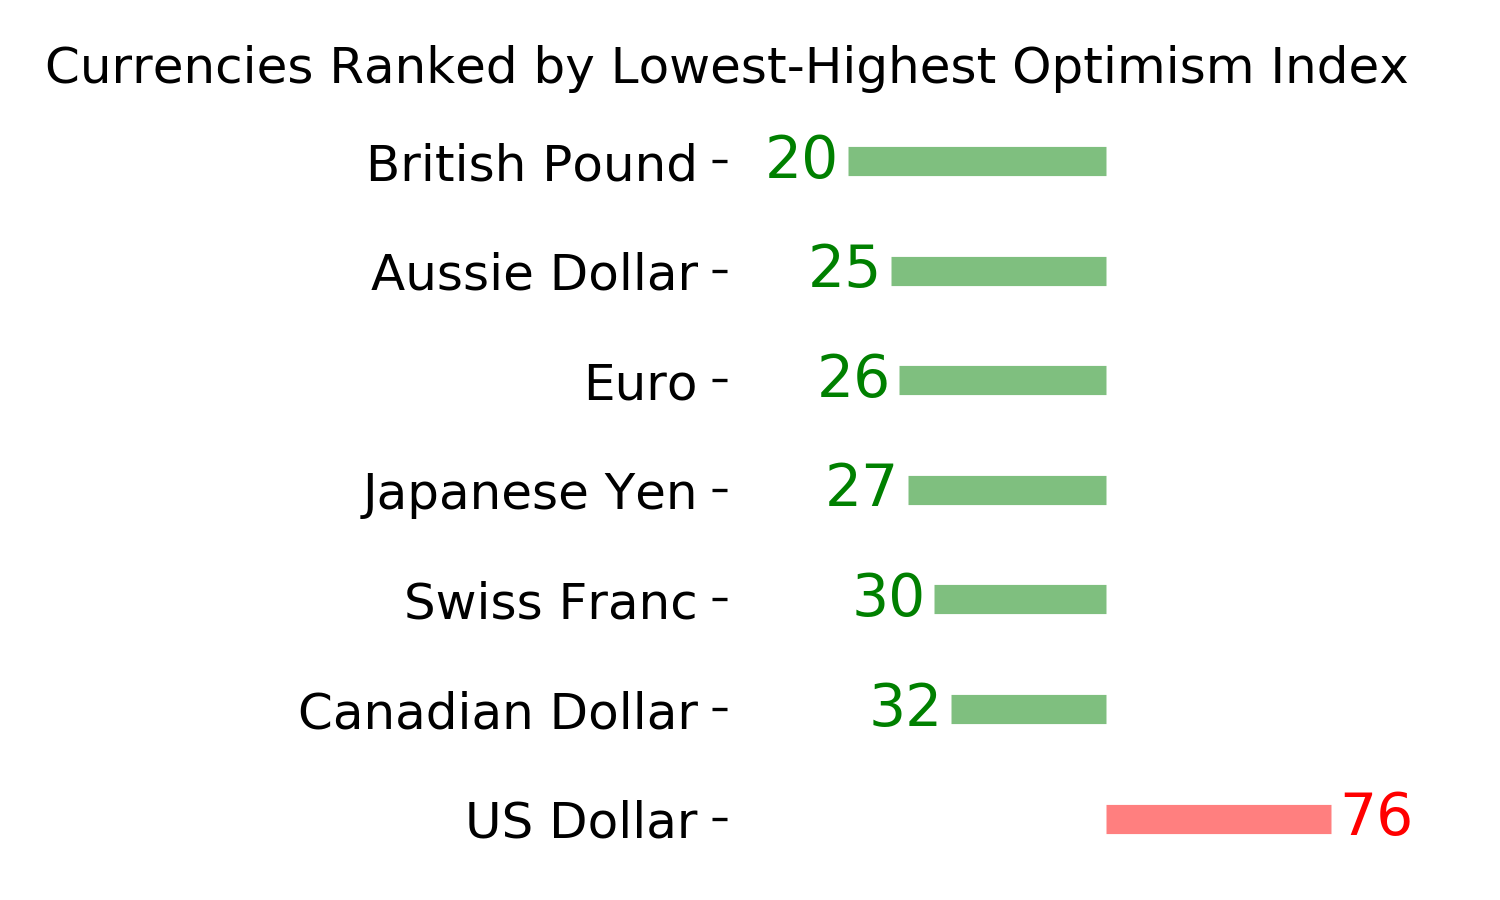
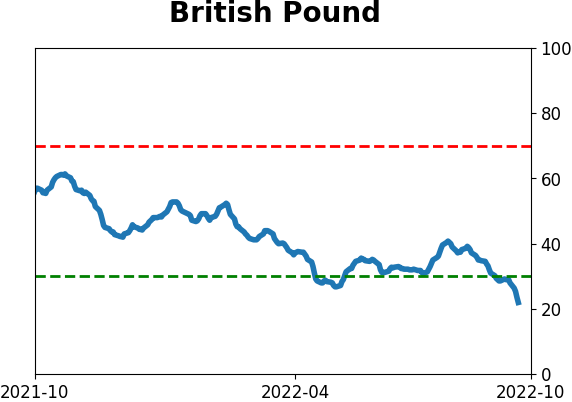
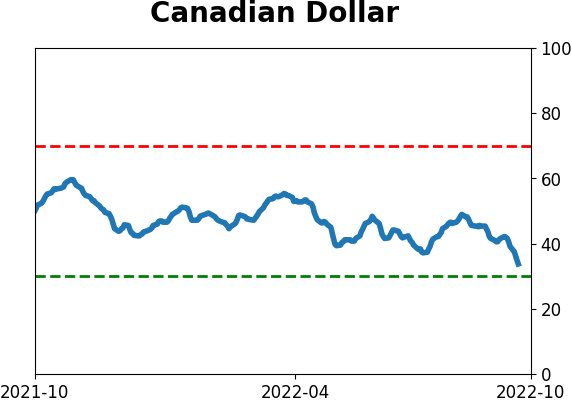
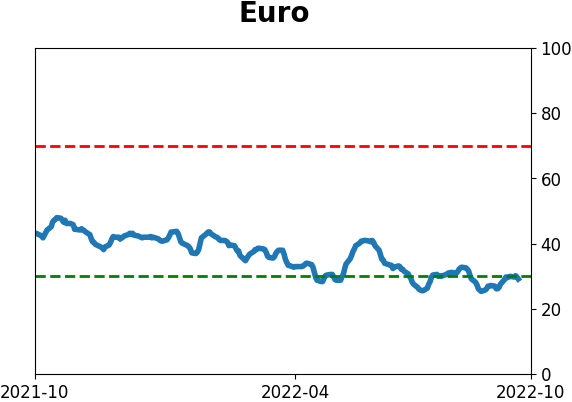
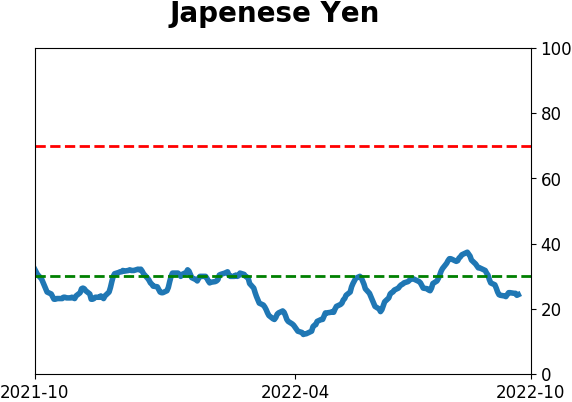
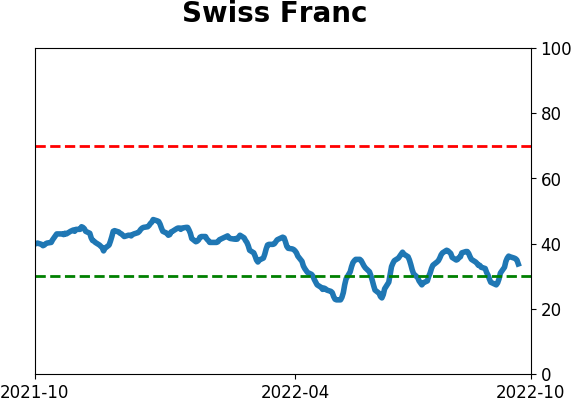
Currency ETF's - 5-Day Moving Average
|
|
|
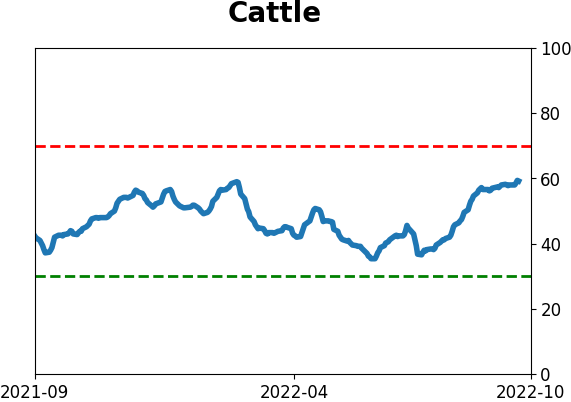
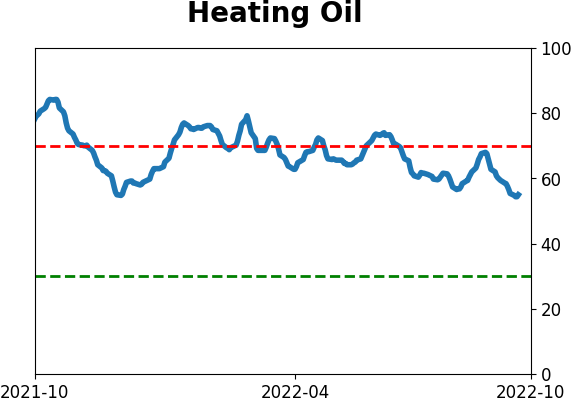
Commodity ETF's - 5-Day Moving Average
|
|