Headlines
|
|
Hang Seng is Nearing a Historic Washout:
Stocks in the Hang Seng index have suffered heavy selling pressure over the past month. A composite of 9 breadth metrics shows a high level of internal selling pressure, not quite on a level to suggest panic, but it's close.
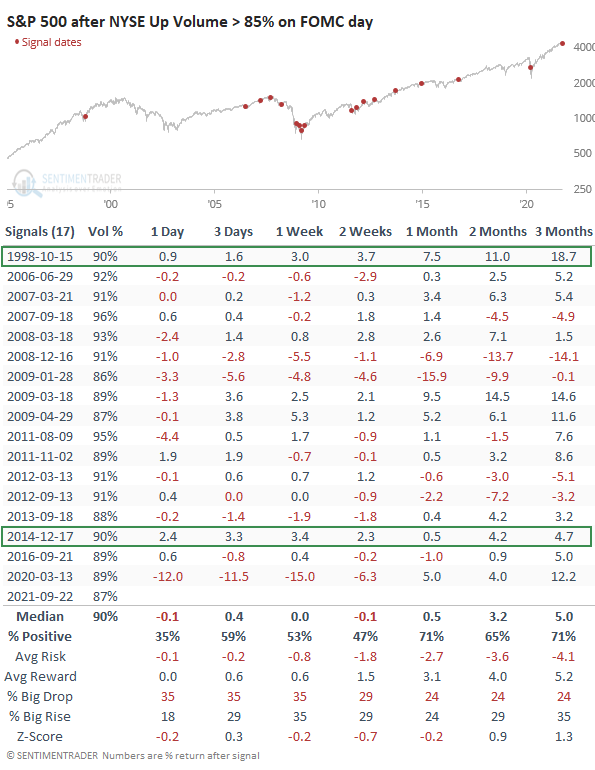
Fed faith: The Federal Reserve didn't do or say anything out of the ordinary on Wednesday, and perhaps that's exactly what traders were hoping. They made themselves felt, with more than 85% of volume on the NYSE flowing into advancing securities. That's one of the most lopsided days of buying pressure on any scheduled FOMC decision day in 25 years. A well-known tendency among market watchers is that the first reaction is most often a fakeout, and that proved to be the case here as well. Only 2 out of 17 signals saw the S&P continue to rally uninterrupted.
Bottom Line:
STOCKS: Hold
Sentiment continues to decline from the speculative February peak. With deteriorating breadth, this raises the risk of poor short- to medium-term returns until optimism and better breadth returns. See the Outlook & Allocations page for more. BONDS: Hold
Various parts of the market got hit in March, with the lowest Bond Optimism Index we usually see during healthy environments. Bond prices have modest recovered and there is no edge among the data we follow. GOLD: Hold
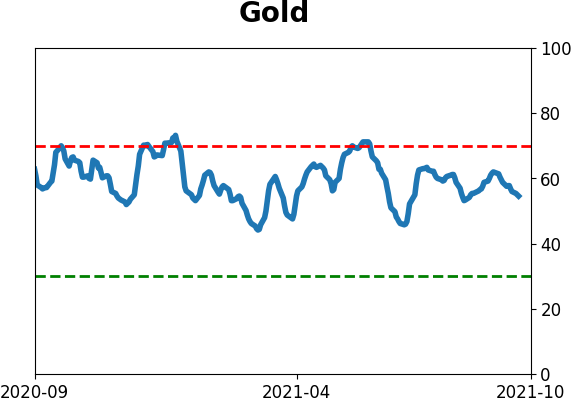
Gold and miners were rejected after trying to recover above their 200-day averages in May. Lately, some medium-term (not long-term) oversold extremes in breadth measures among miners have triggered.
|
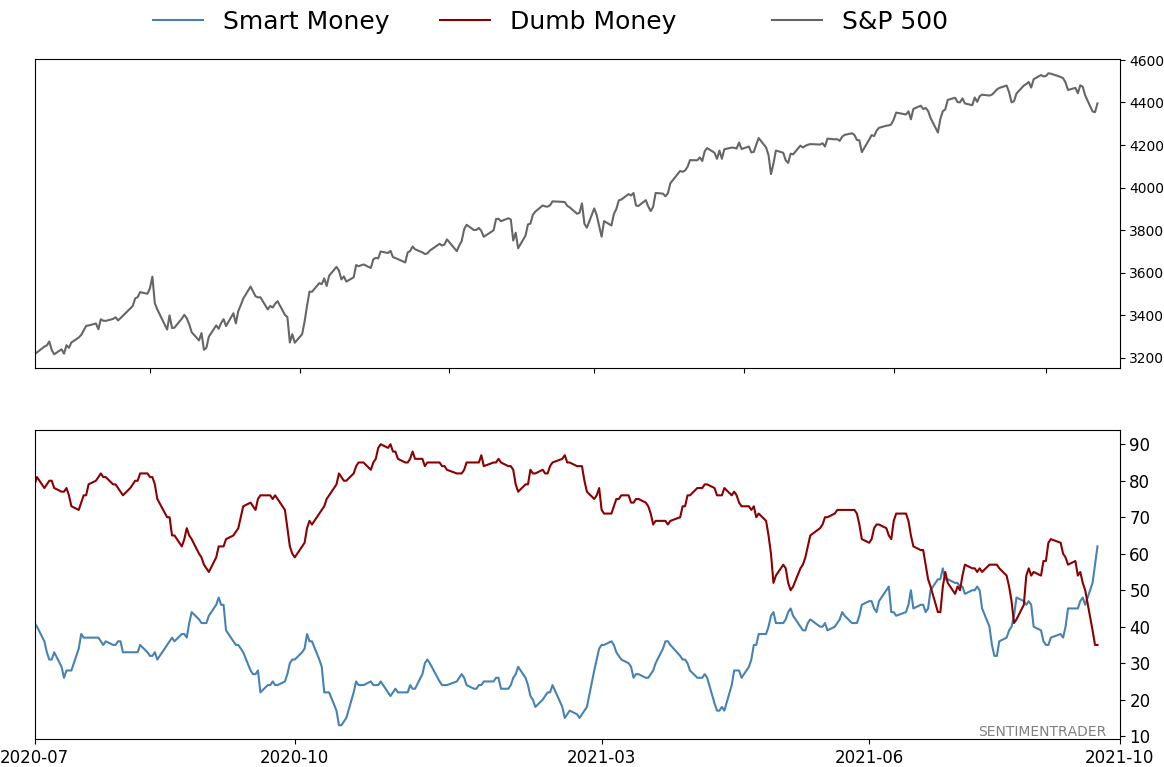
Smart / Dumb Money Confidence
|
Smart Money Confidence: 62%
Dumb Money Confidence: 35%
|
|
Risk Levels
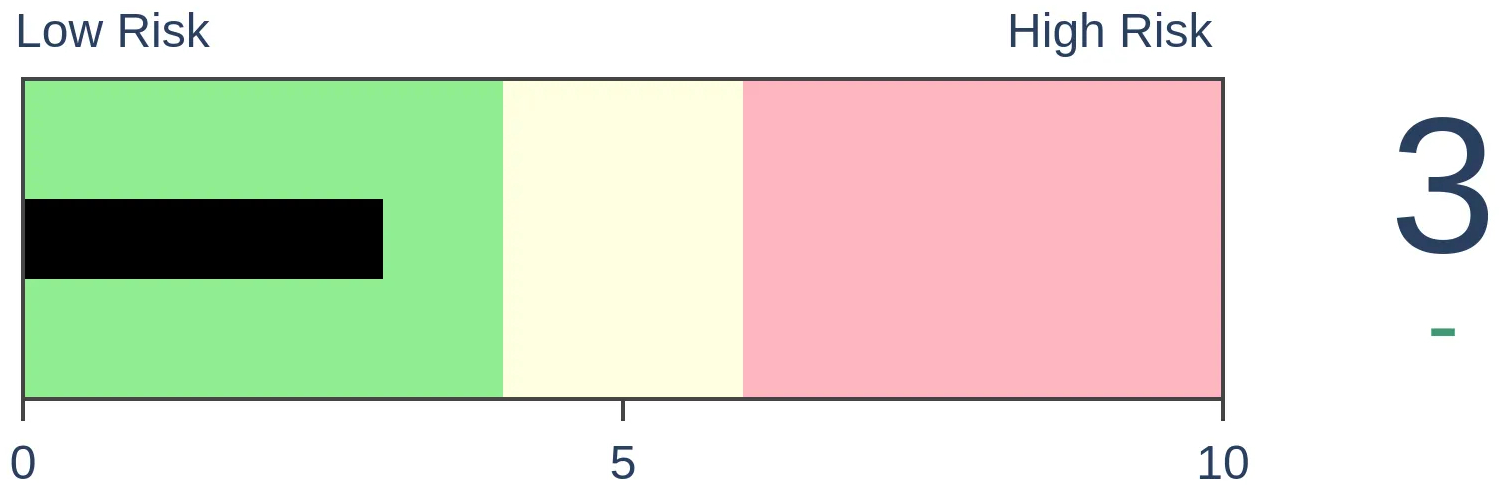
Stocks Short-Term
|
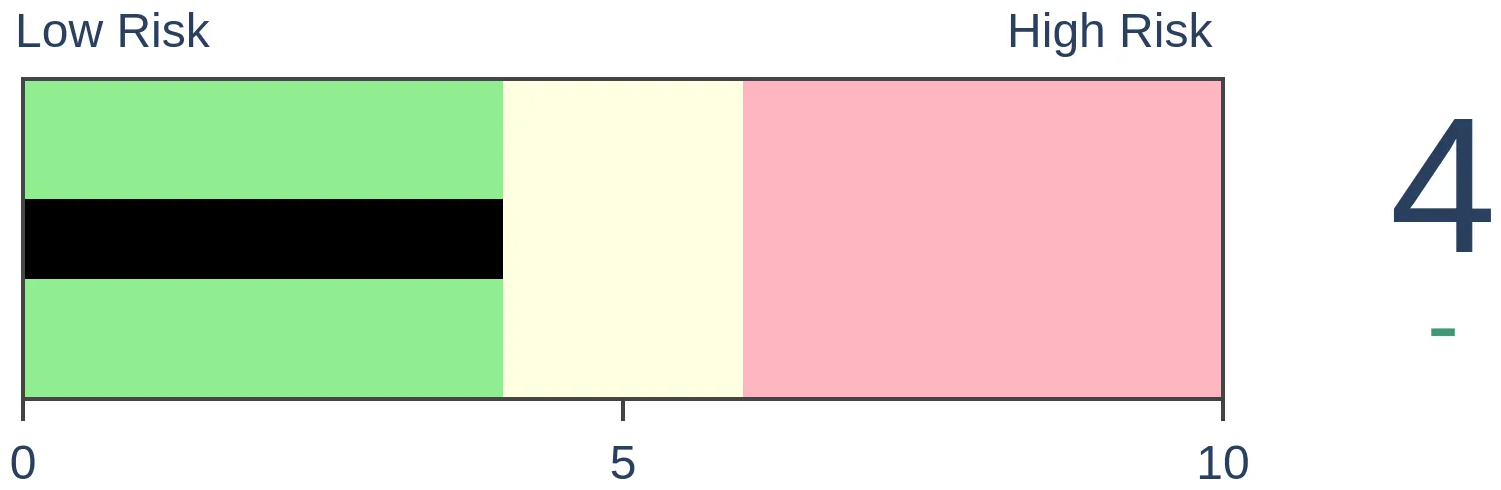
Stocks Medium-Term
|
|
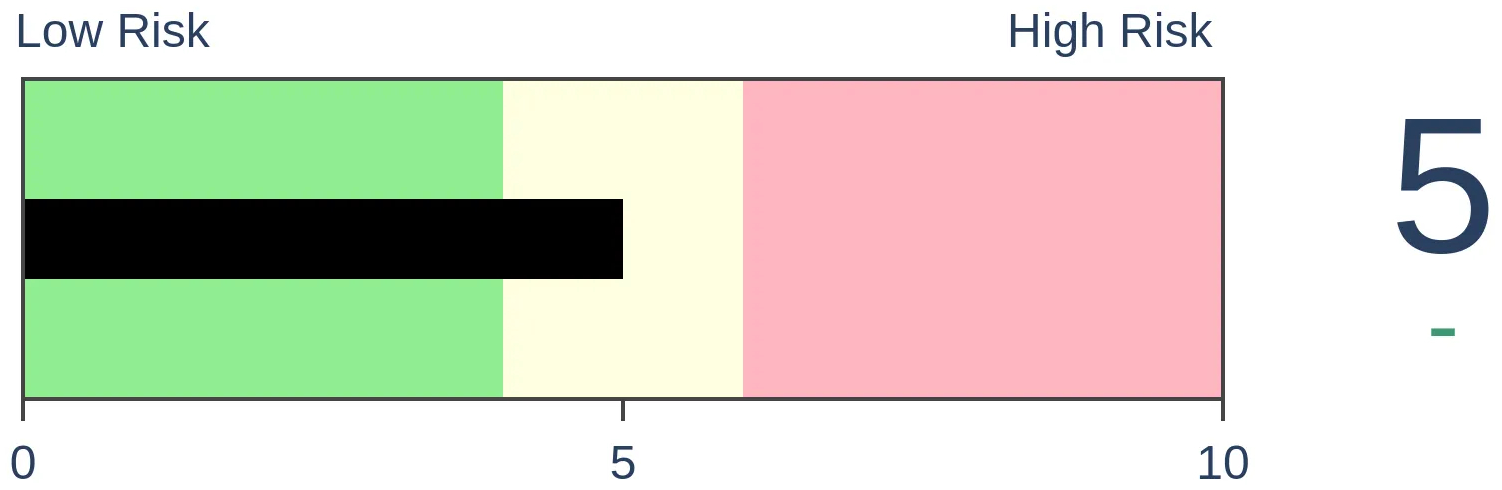
Bonds

|
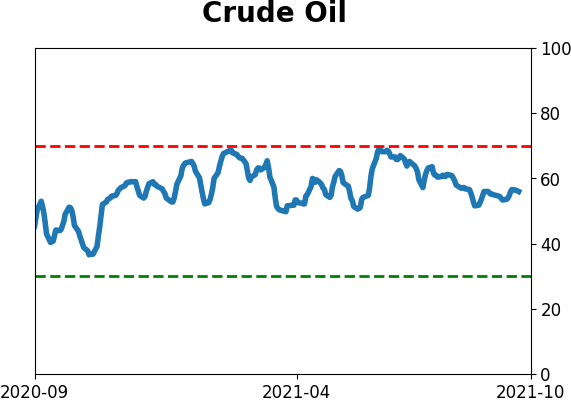
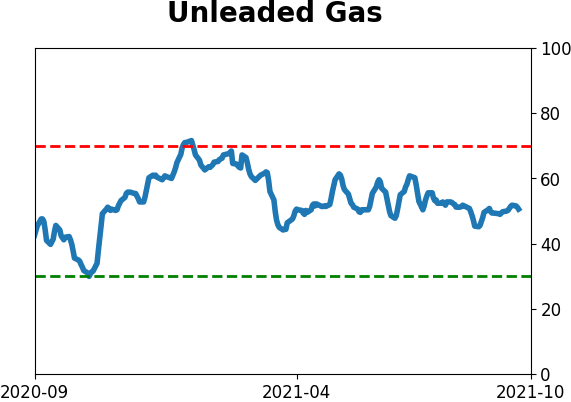
Crude Oil
|
|
Gold
|
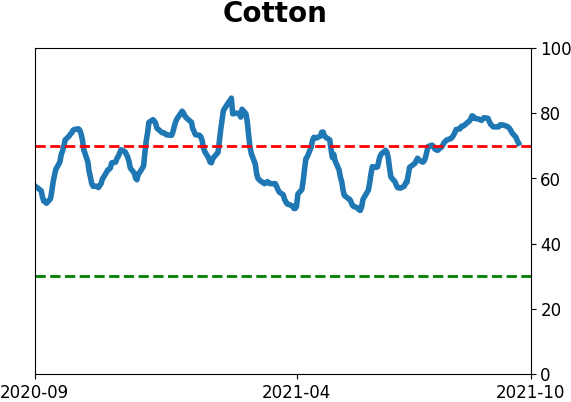
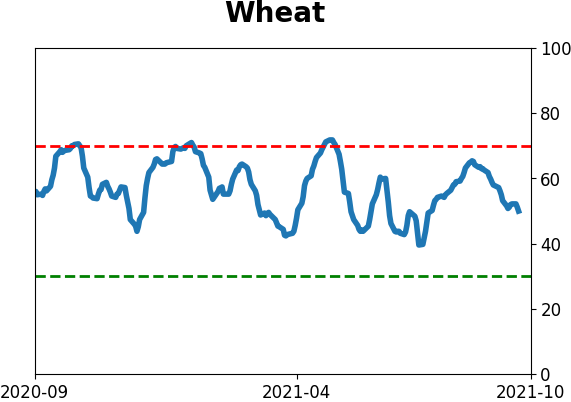
Agriculture

|
|
Research
By Jason Goepfert
BOTTOM LINE
Stocks in the Hang Seng index have suffered heavy selling pressure over the past month. A composite of 9 breadth metrics shows a high level of internal selling pressure, not quite on a level to suggest panic, but it's close.
FORECAST / TIMEFRAME
None
|
Fear that debt troubles with China's Evergrande would spread globally was the most common excuse for Monday's slide. Using it as a reason for drops in the U.S. is questionable, but the closer you get geographically, the more sense it makes.
Stocks in Hong Kong certainly have been feeling that pressure, thanks in part to a plunge in property developers and related companies.
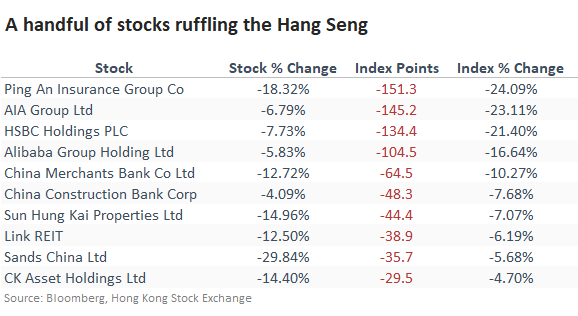
According to Bloomberg calculations, the five stocks with the most significant losses accounted for 600 of the Hang Seng's 628-point loss over the past month.
SELLING PRESSURE NEARING HISTORIC LEVELS
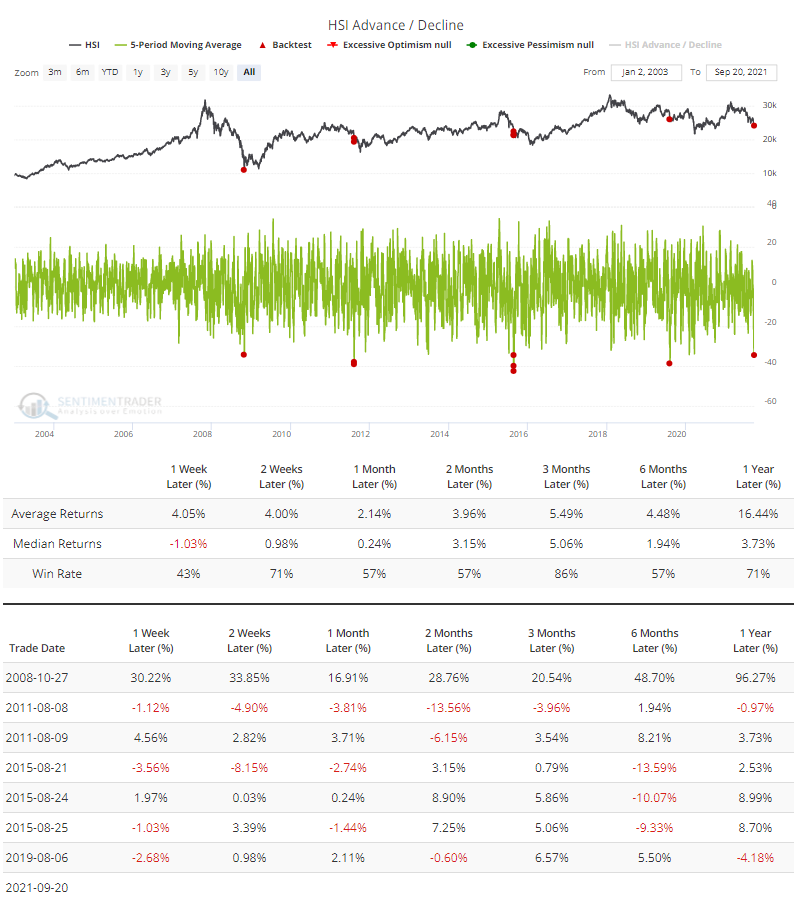
Over 5 days into Monday, an average of more than 34 stocks in the index declined versus advanced, one of the most extreme readings in nearly 20 years. The Backtest Engine shows mostly positive returns after the others. The index continued to slide for a couple more months in August 2011, then reversed those losses in the months ahead.
Internal weakness has been so severe that it helped push the McClellan Oscillator for the Hang Seng to one of its most extreme oversold readings of the past year.
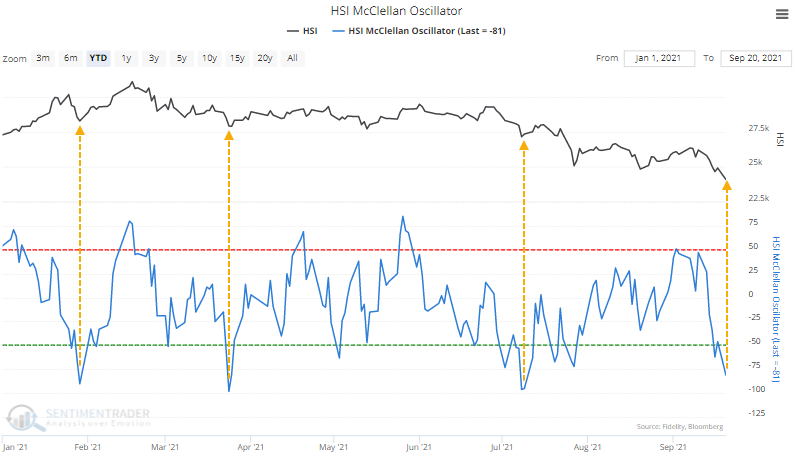
The other three instances all resulted in an immediate rally. The last one, in July, was short-lived, and the index soon rolled over to a lower low. That will be something to watch for this time around.
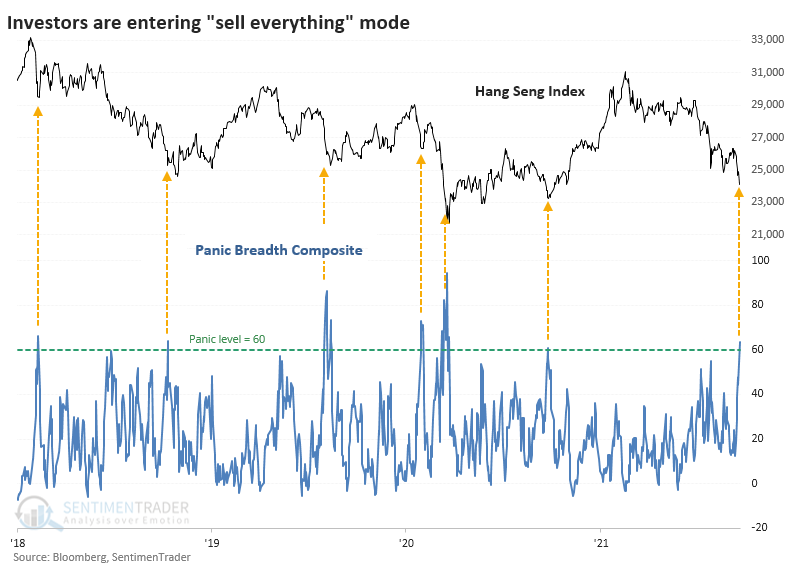
SIGNS OF PANIC
In prior years, we've looked at a breadth composite when a particular market looks like it's suffering panic-level selling pressure (like Mexico and South Korea in 2019). This composite includes nine breadth metrics that have a good record at highlighting overwhelming internal selling pressure.
- % of stocks above 10-day average
- % of stocks above 50-day average
- % of stocks above 200-day average
- % of stocks at 1-month low
- % of stocks at 3-month low
- % of stocks at 1-year low
- % of stocks below Bollinger Band
- % of stocks with oversold RSI
- McClellan Oscillator
The chart below shows this composite along with its recent record.
It was a decent medium-term sign with returns above random across most time frames, consistent gains, and more reward than risk. It wasn't outstanding, though, as there were several large losers. The sweet spot, as we so often see, was over the next 1-3 months.
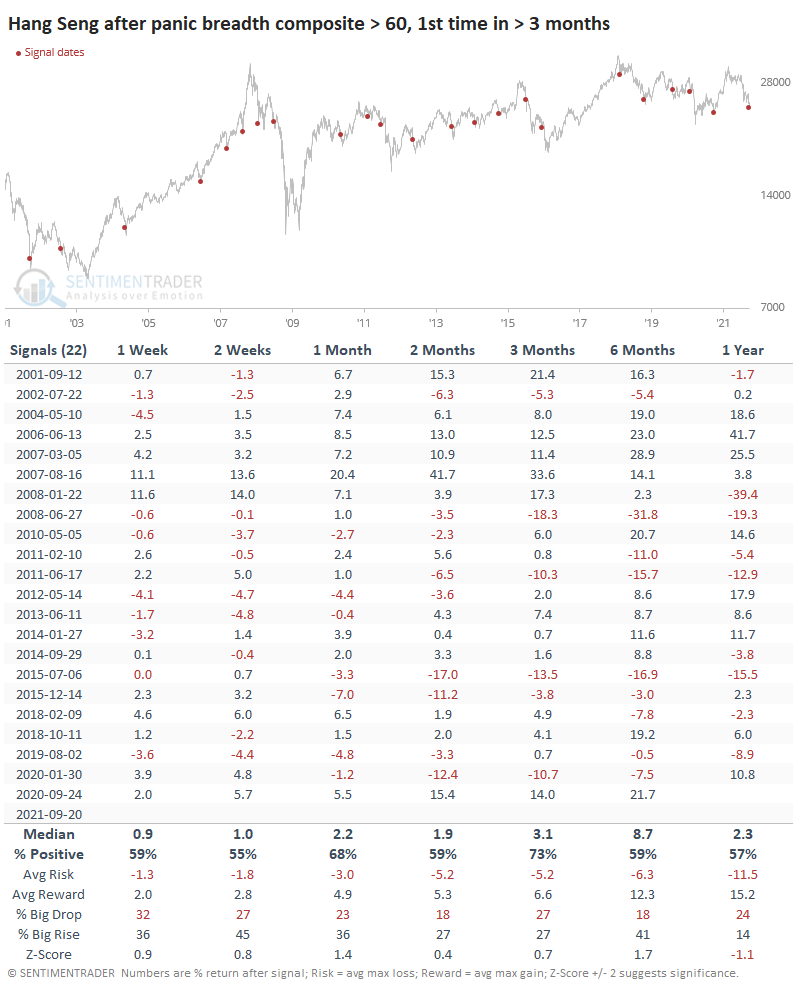
Successful signals didn't see more than an 8% drawdown during the next six months, and most of those were under 5%. The handful of failures didn't see any more significant rallies than about 5% before cratering.
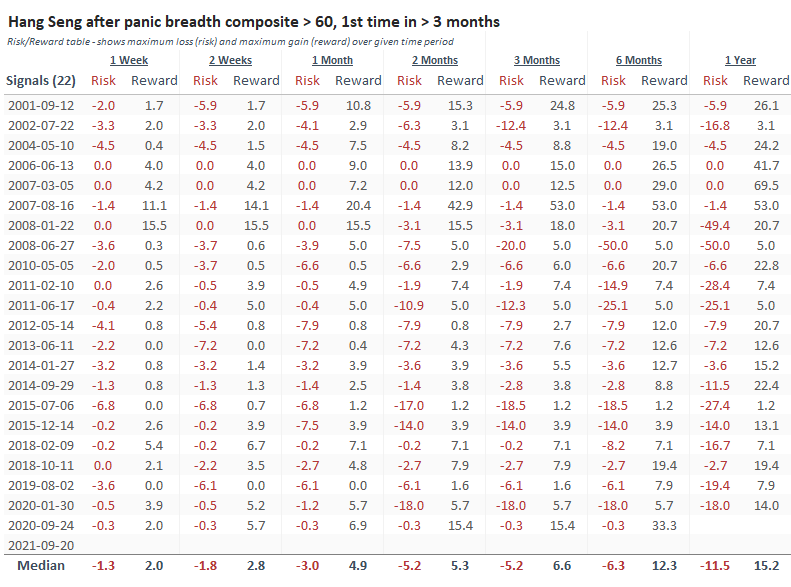
China's steps with property developers in the coming weeks will likely have the most impact on these stocks and even the broader Hang Seng index. Even after selling pressure like the past month, the index hasn't yet suffered full-out puke conditions, but it's getting close.
Internal selling has been significant enough to consider it heavily oversold, which typically means a multi-month rebound. Bulls will need to watch the risk/reward in the coming weeks, with anything further than a 5% slide ushering in some unpleasant precedents and anything more than a 5% rally suggesting the worst is likely past.
Active Studies
| Time Frame | Bullish | Bearish | | Short-Term | 0 | 6 | | Medium-Term | 6 | 3 | | Long-Term | 11 | 5 |
|
Indicators at Extremes
Portfolio
| Position | Description | Weight % | Added / Reduced | Date | | Stocks | RSP | 4.1 | Added 4.1% | 2021-05-19 | | Bonds | 23.9% BND, 6.9% SCHP | 30.7 | Reduced 7.1% | 2021-05-19 | | Commodities | GCC | 2.6 | Reduced 2.1%
| 2020-09-04 | | Precious Metals | GDX | 5.6 | Reduced 4.2% | 2021-05-19 | | Special Situations | 4.3% XLE, 2.2% PSCE | 7.6 | Reduced 5.6% | 2021-04-22 | | Cash | | 49.4 | | |
|
Updates (Changes made today are underlined)
Much of our momentum and trend work has remained positive for several months, with some scattered exceptions. Almost all sentiment-related work has shown a poor risk/reward ratio for stocks, especially as speculation drove to record highs in exuberance in February. Much of that has worn off, and most of our models are back toward neutral levels. There isn't much to be excited about here. The same goes for bonds and even gold. Gold has been performing well lately and is back above long-term trend lines. The issue is that it has a poor record of holding onto gains when attempting a long-term trend change like this, so we'll take a wait-and-see approach. RETURN YTD: 8.1% 2020: 8.1%, 2019: 12.6%, 2018: 0.6%, 2017: 3.8%, 2016: 17.1%, 2015: 9.2%, 2014: 14.5%, 2013: 2.2%, 2012: 10.8%, 2011: 16.5%, 2010: 15.3%, 2009: 23.9%, 2008: 16.2%, 2007: 7.8%
|
|
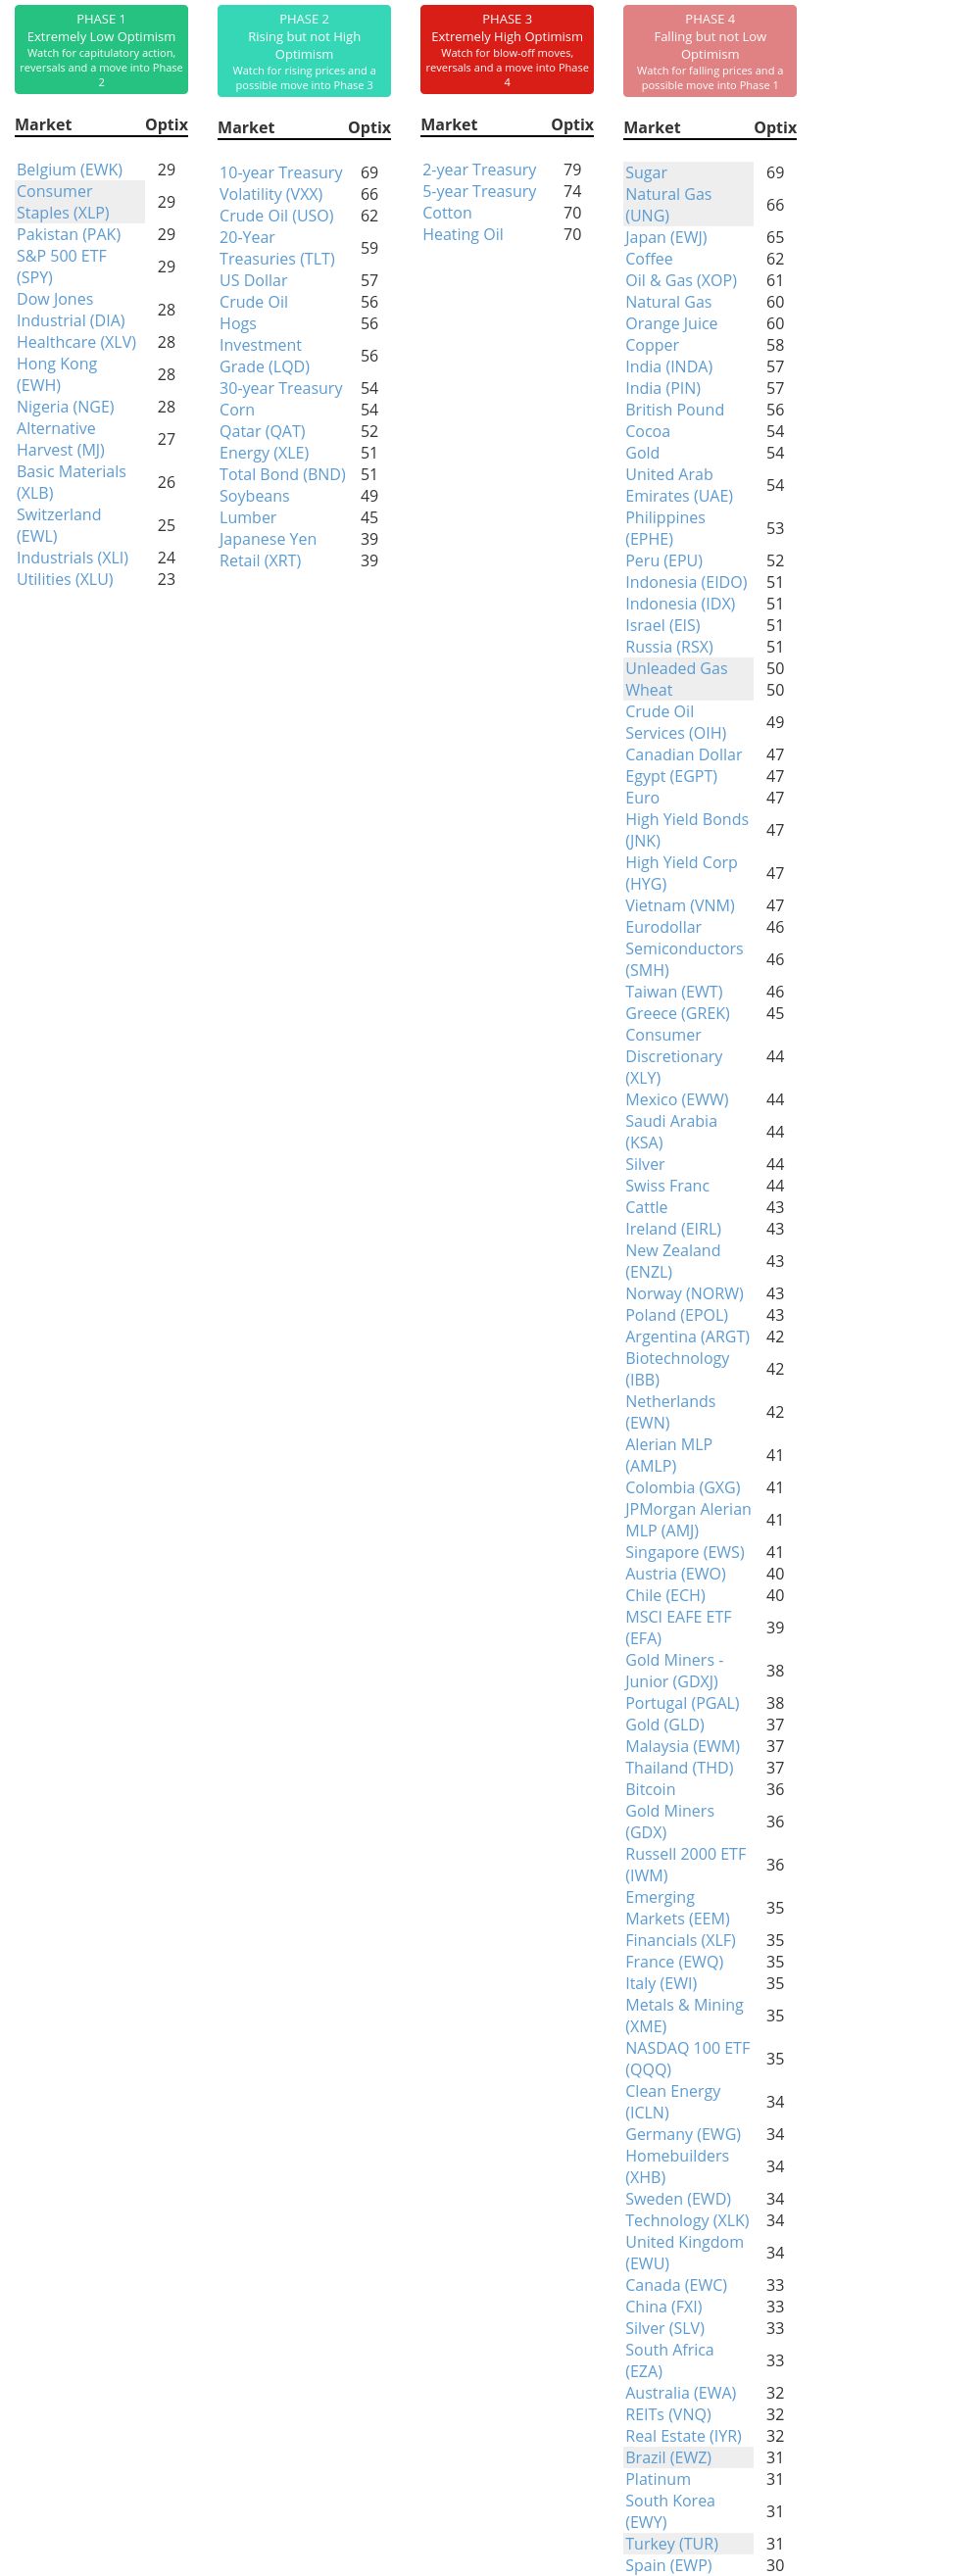
Phase Table
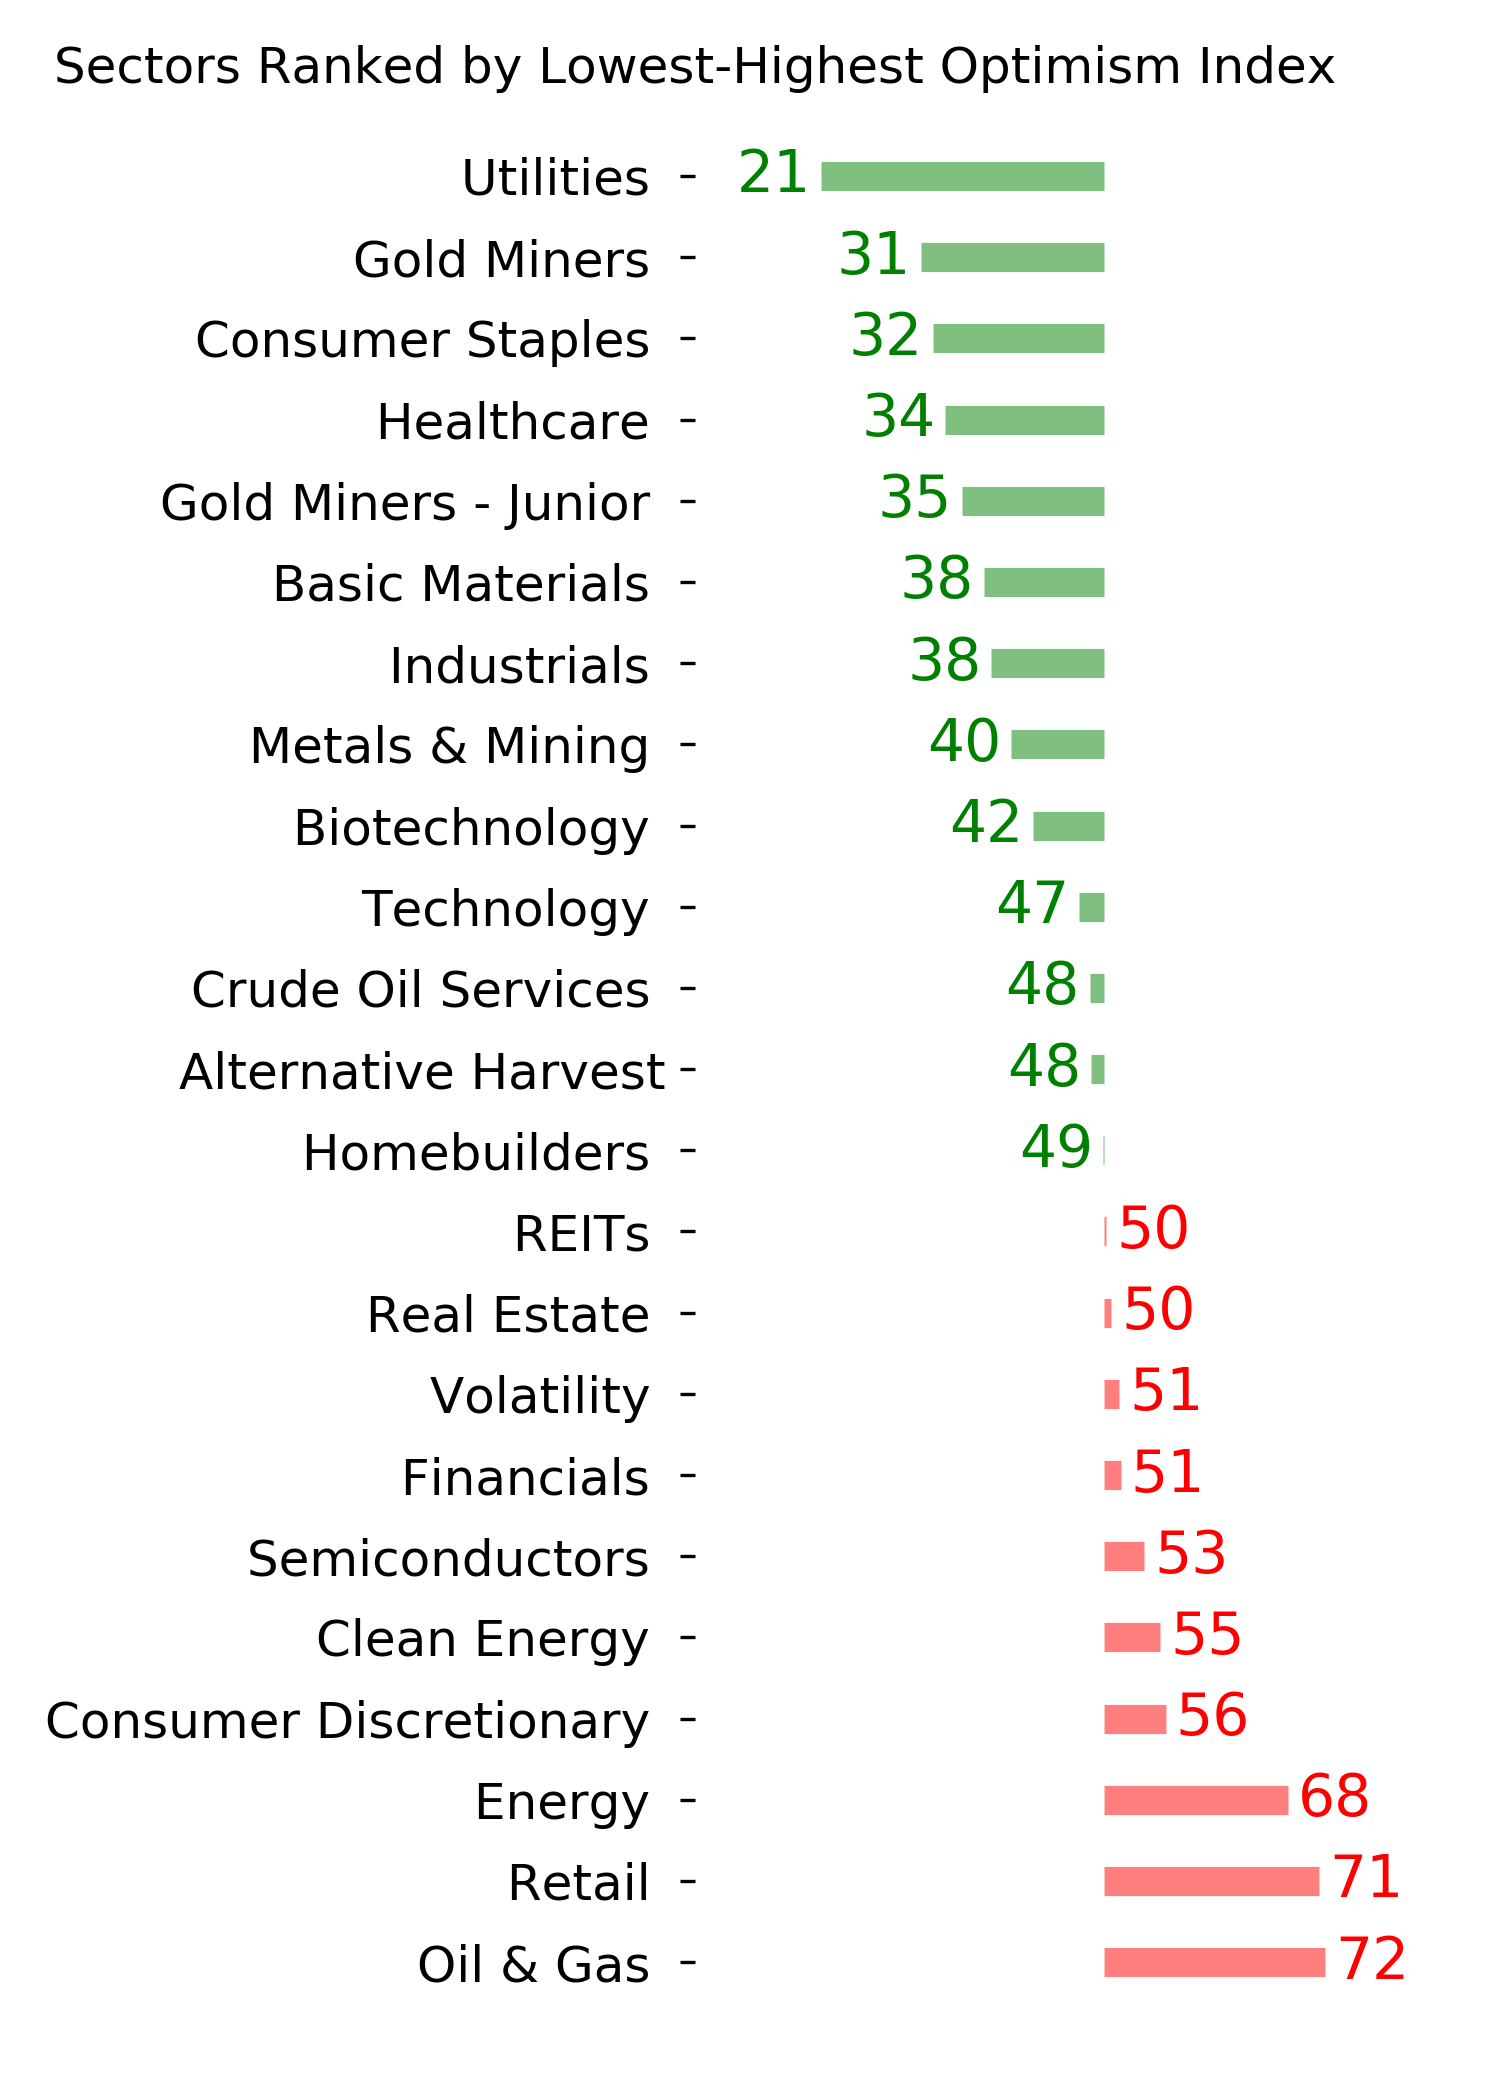
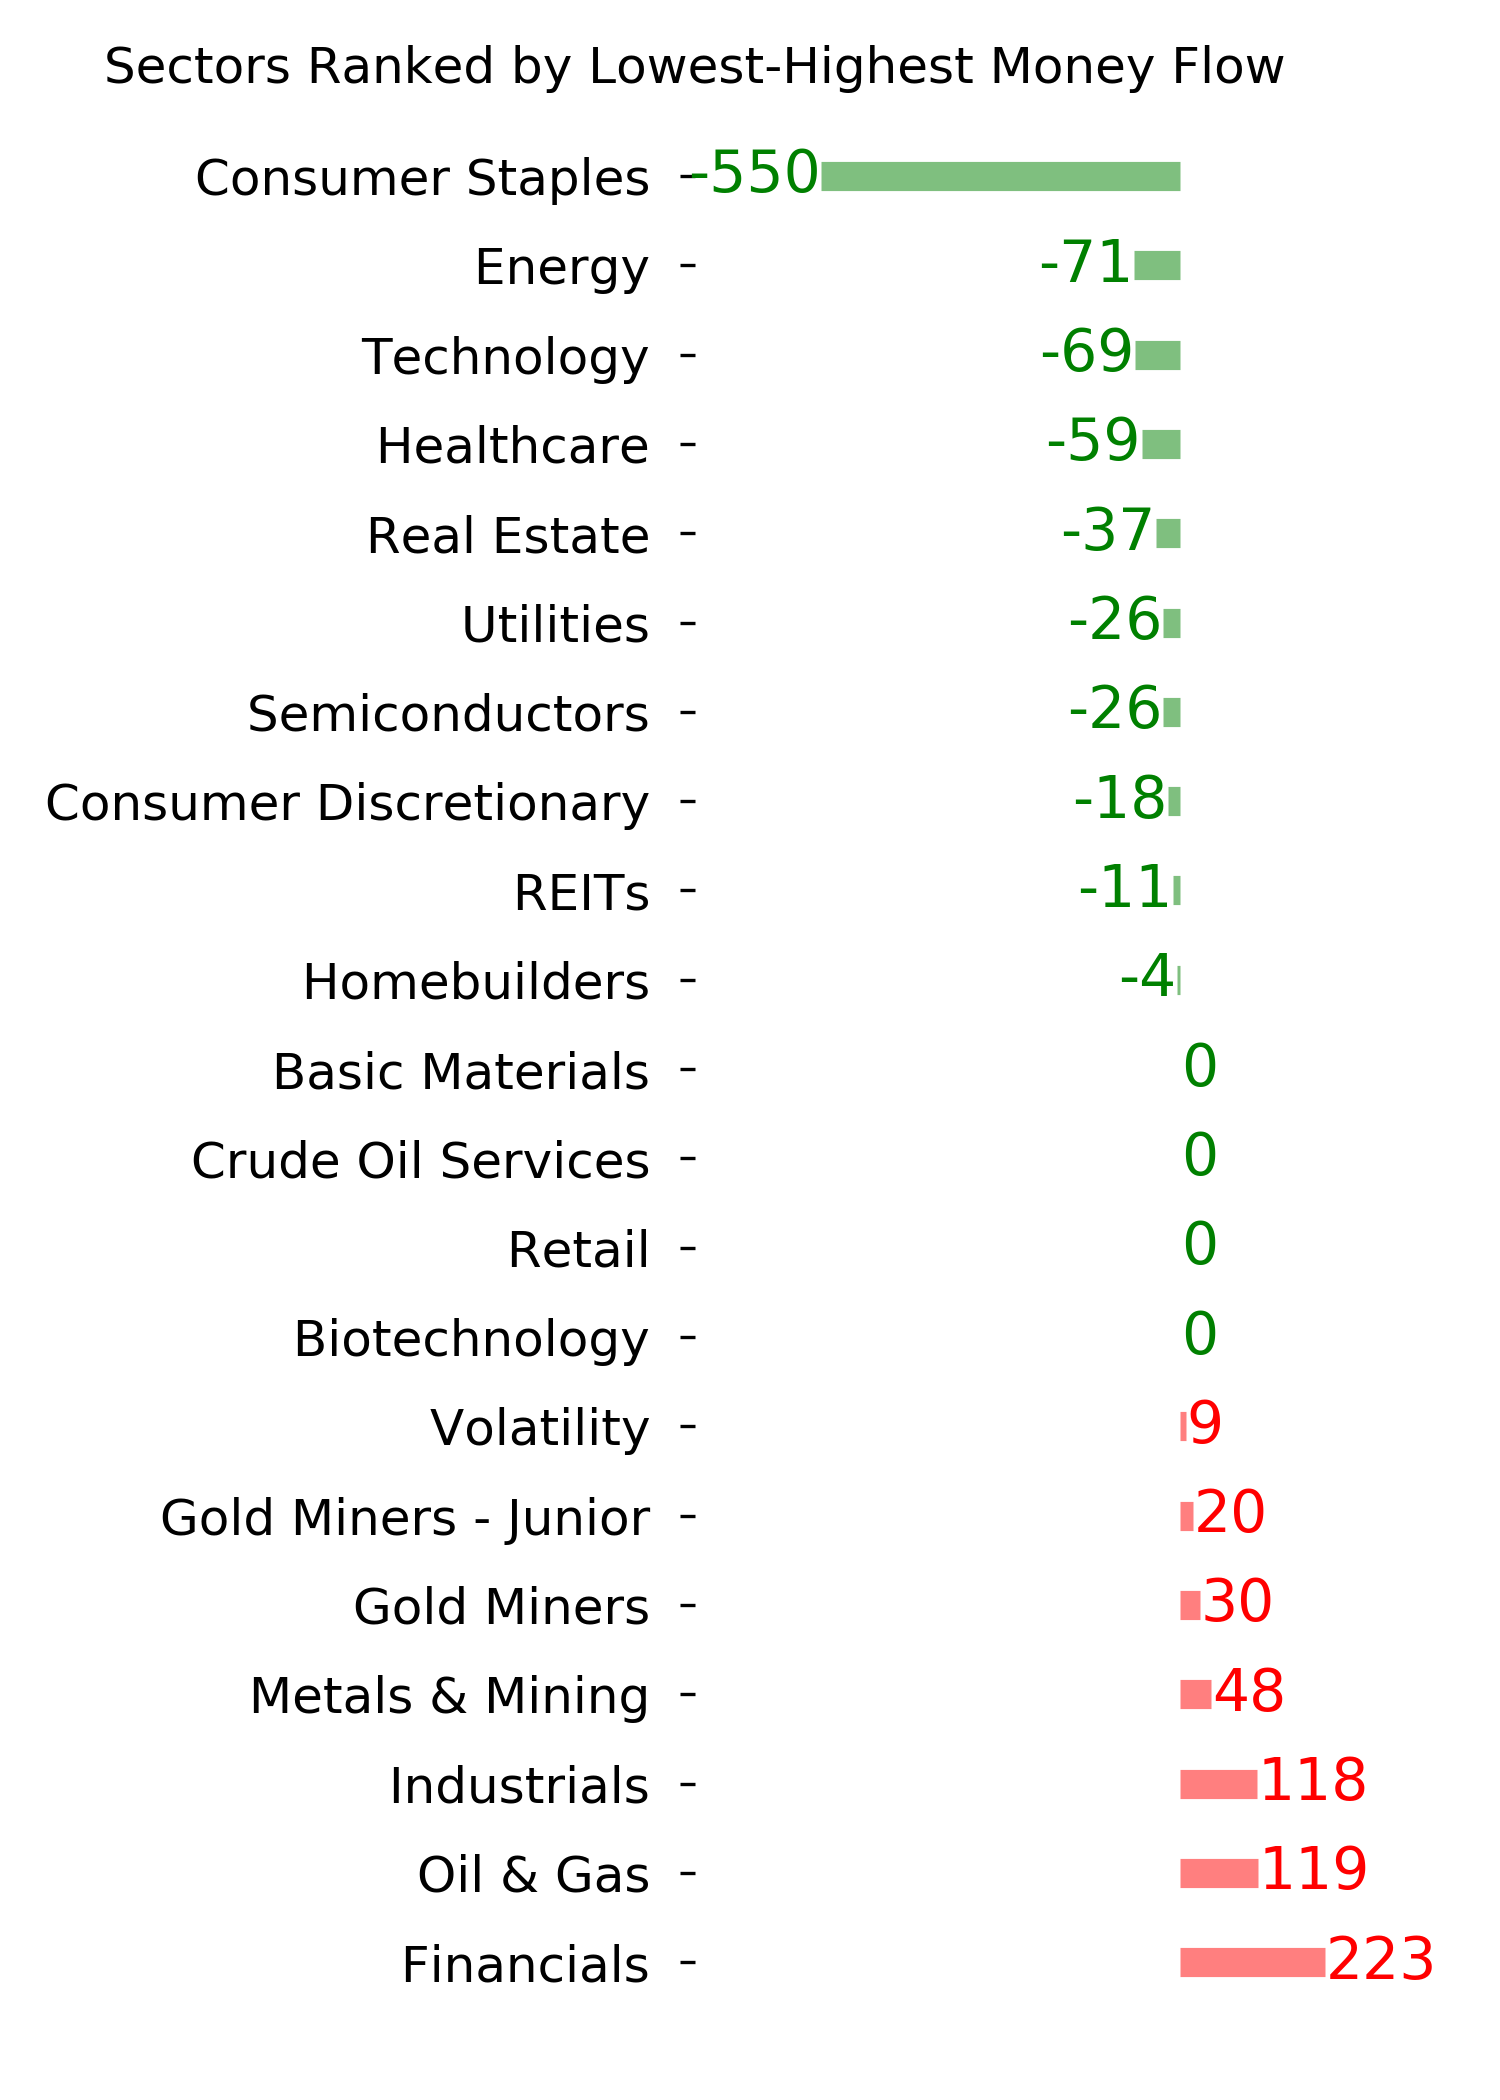
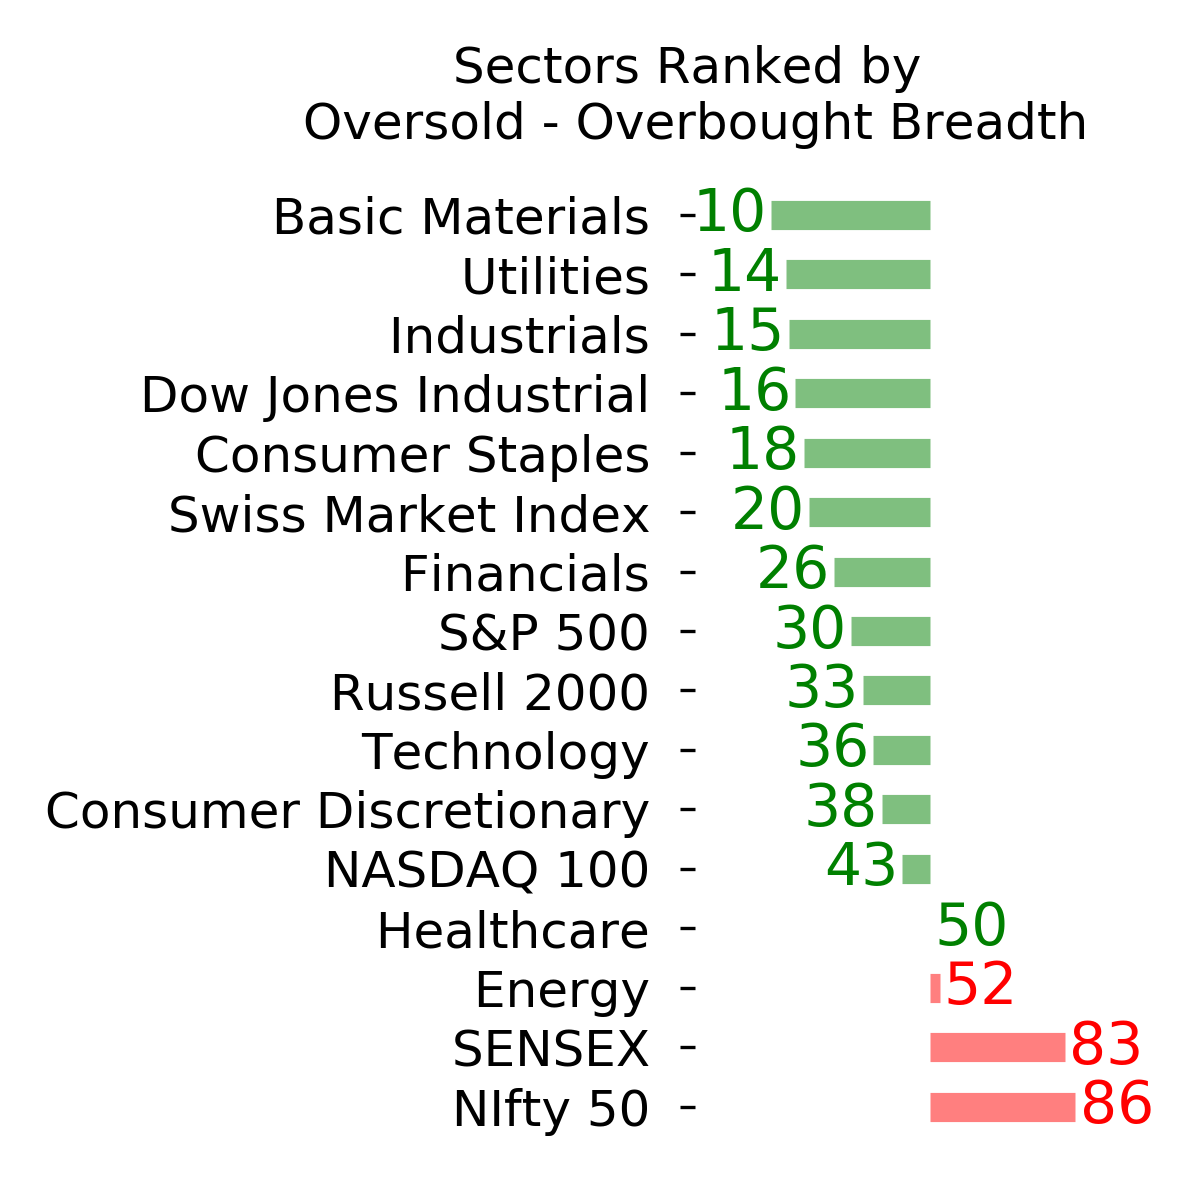
Ranks
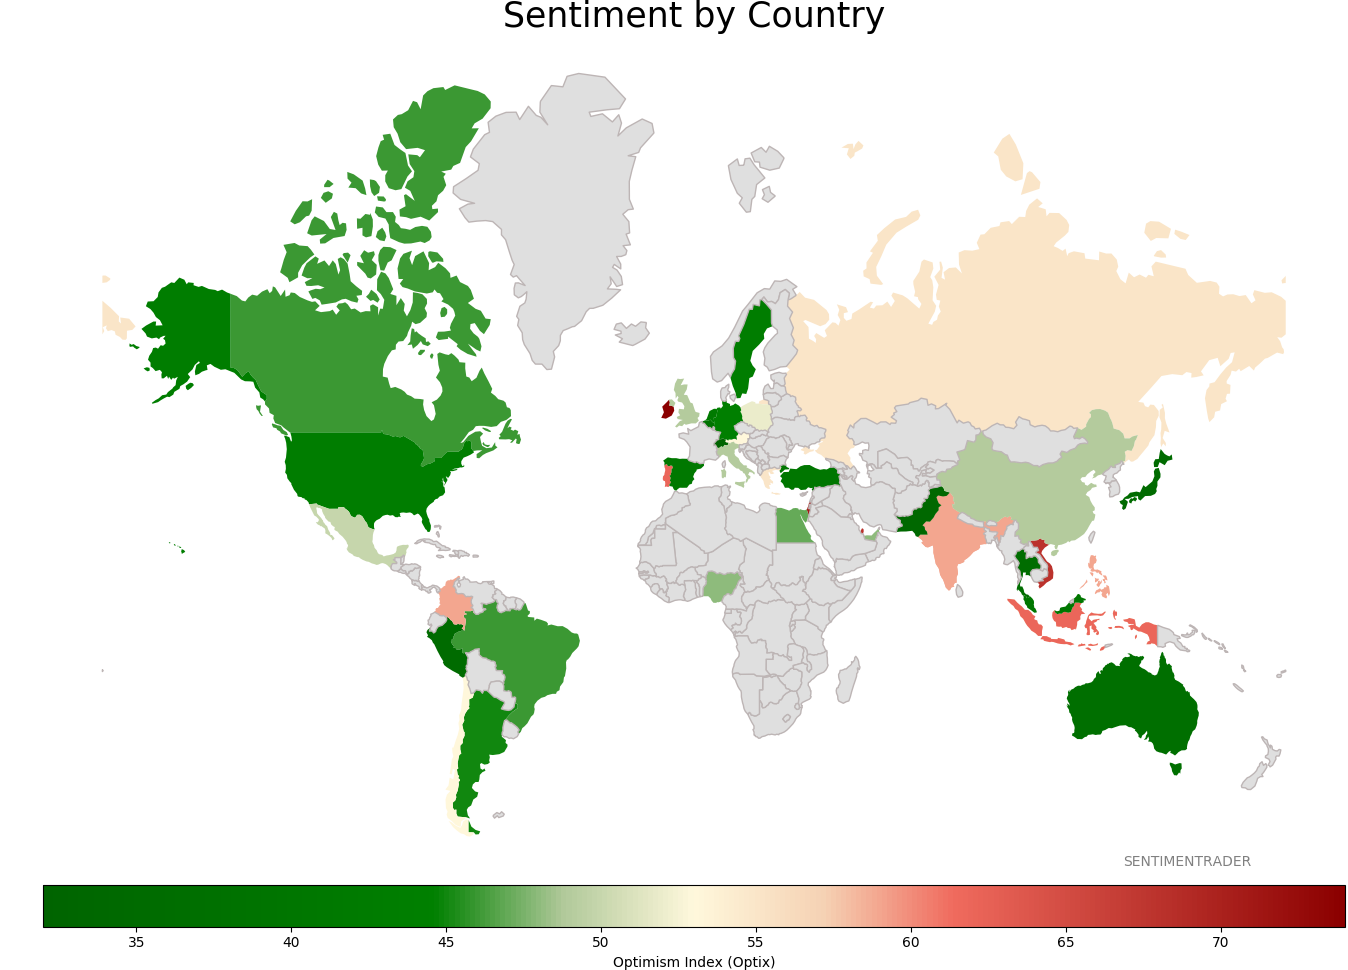
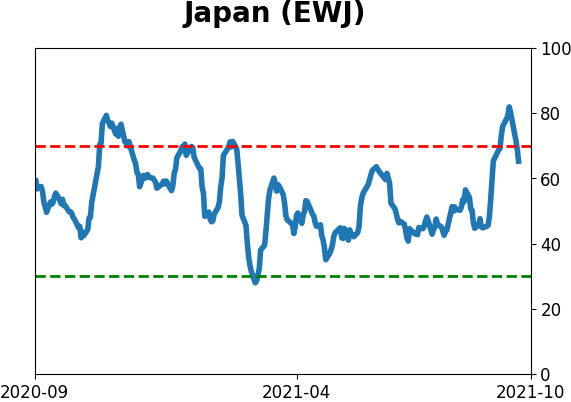
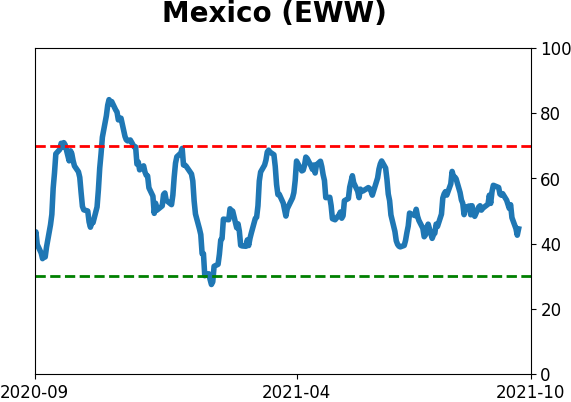
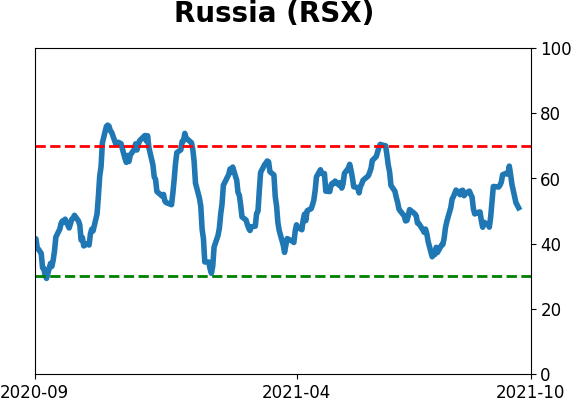
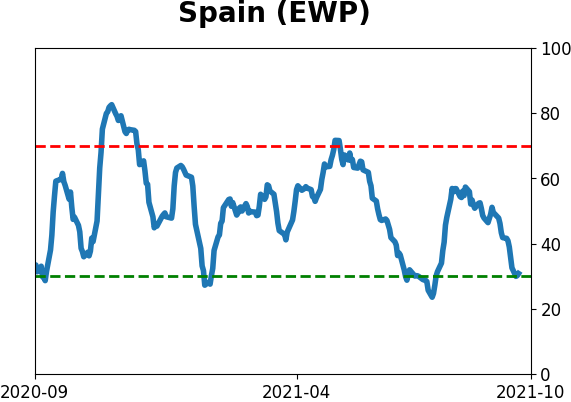
Sentiment Around The World
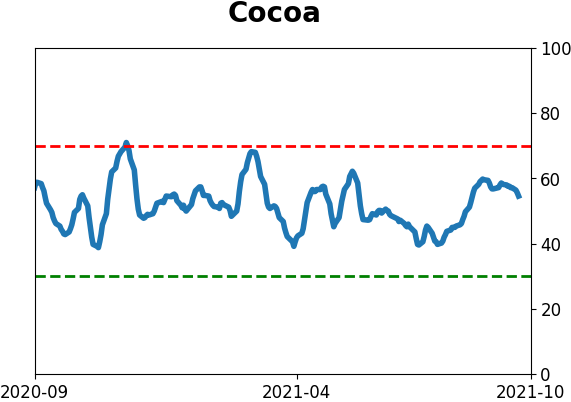
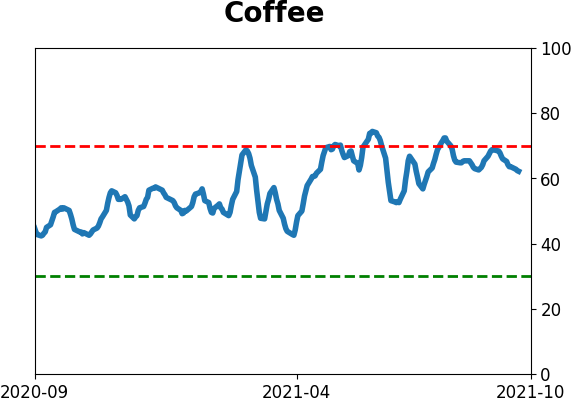
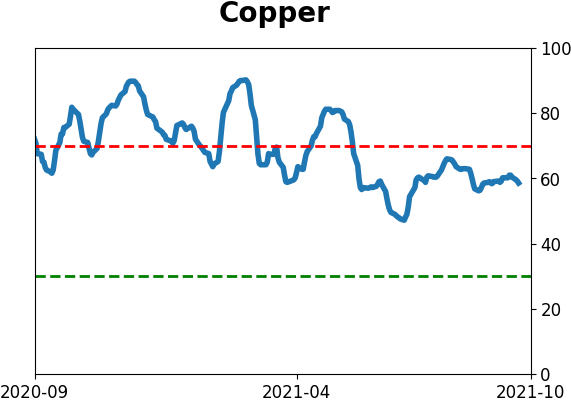
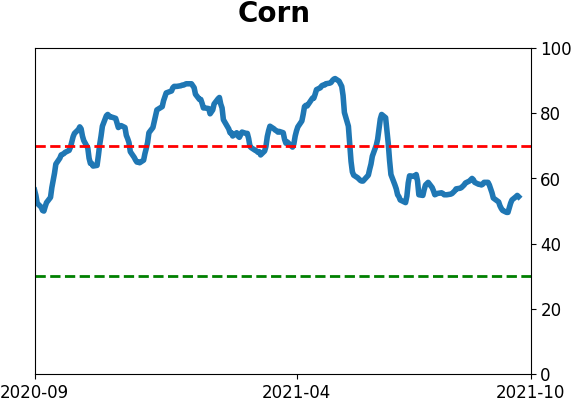
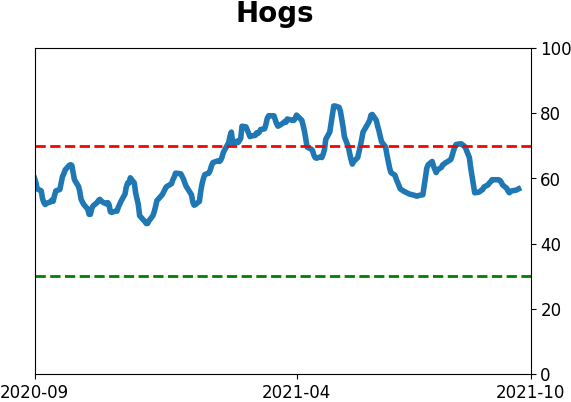
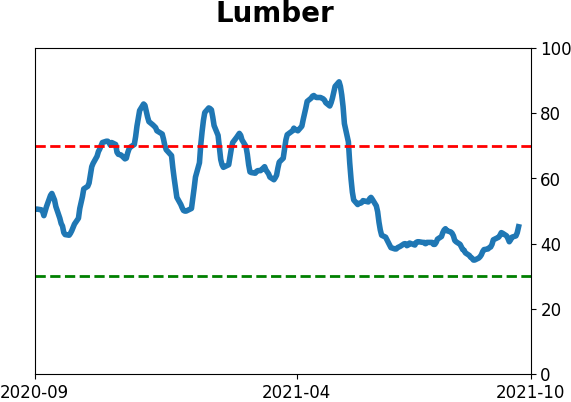
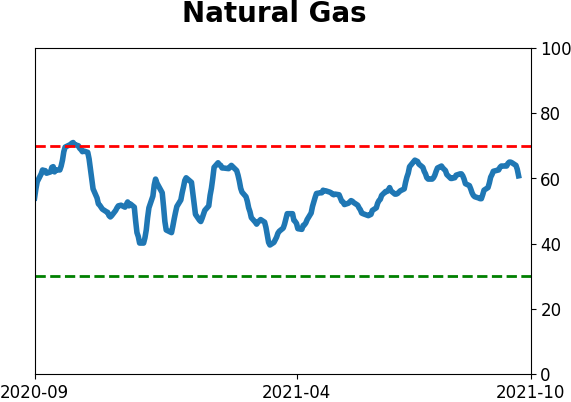
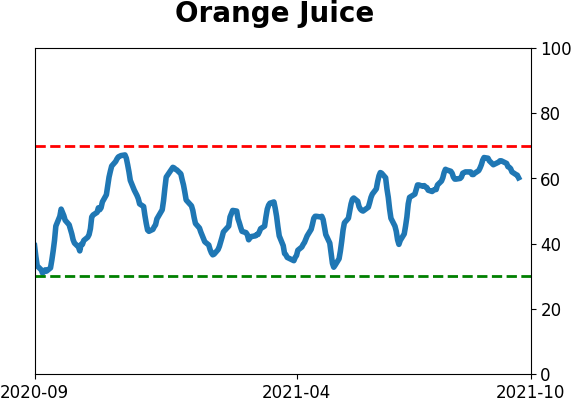
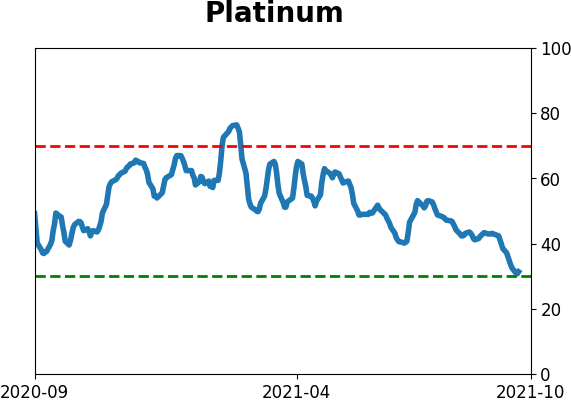
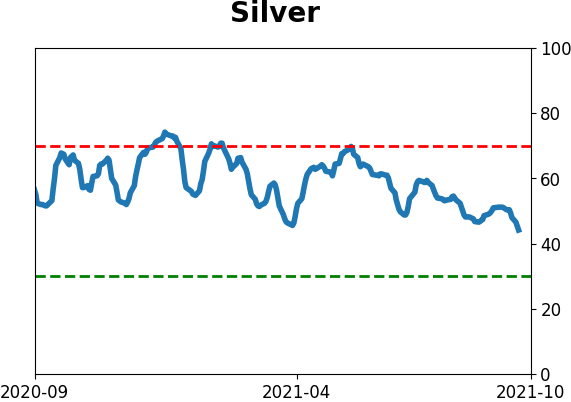
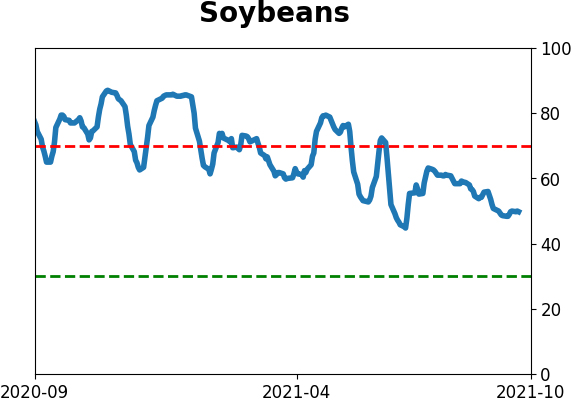
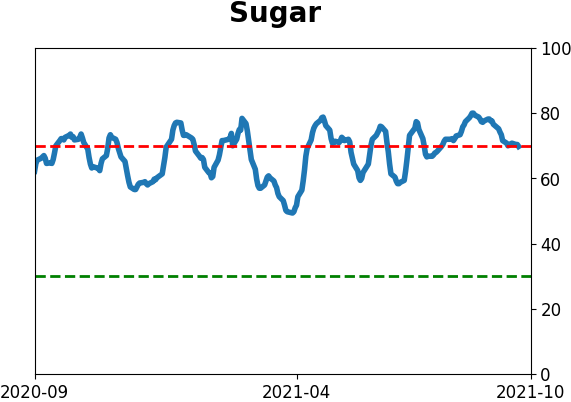
Optimism Index Thumbnails
|
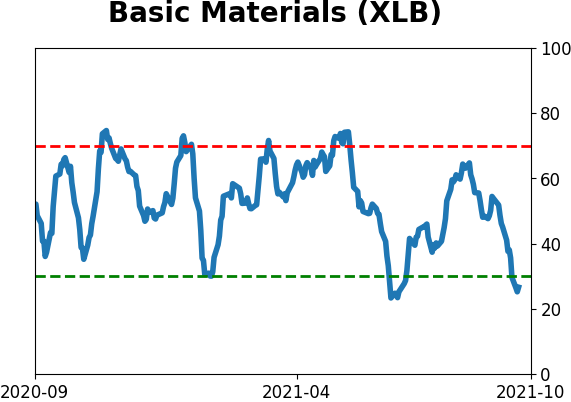
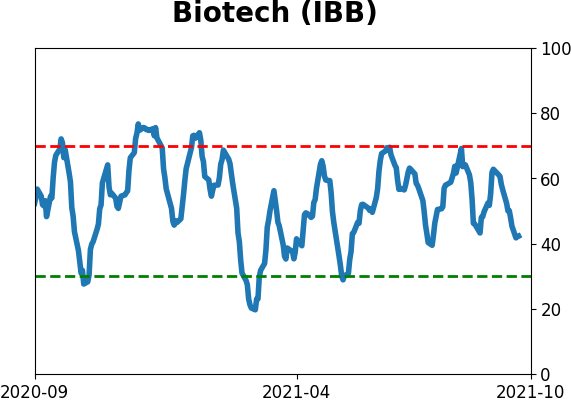
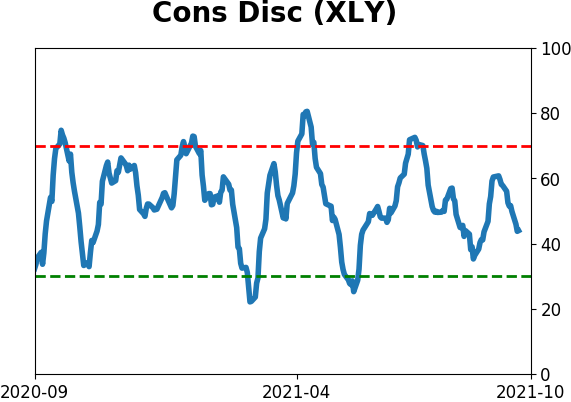
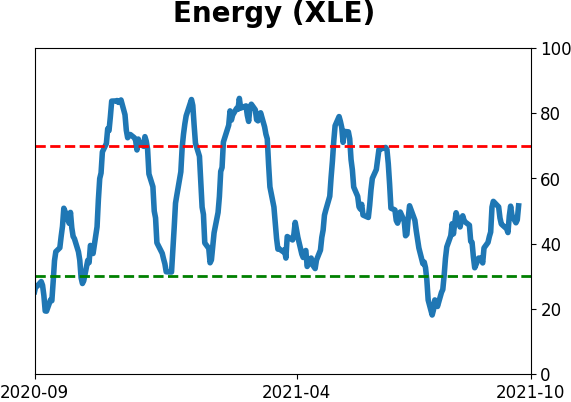
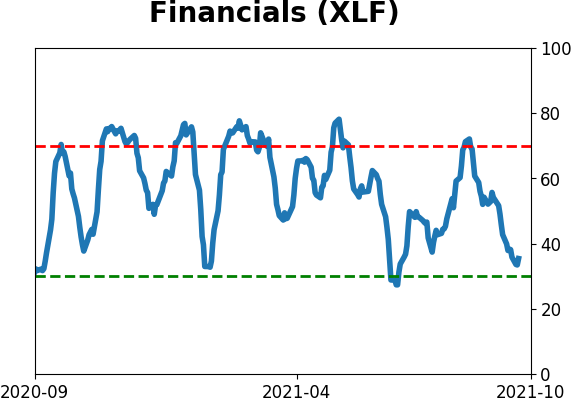
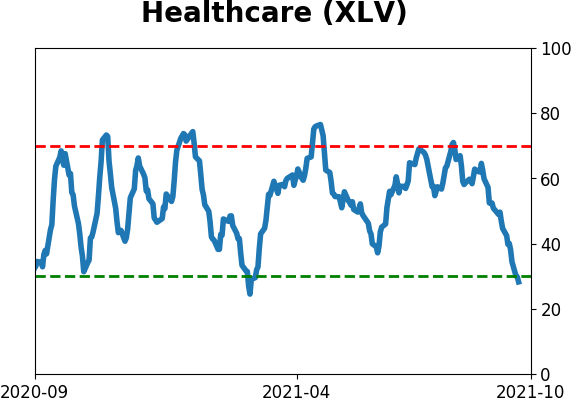
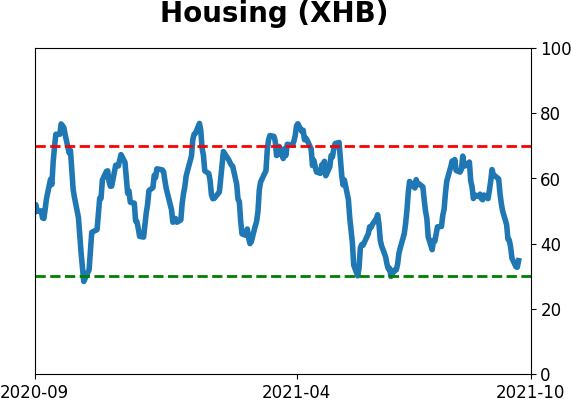
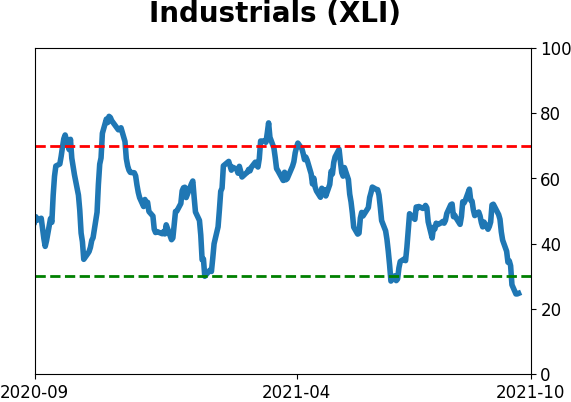
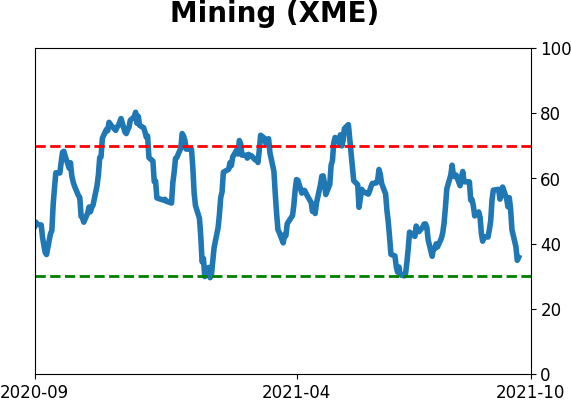
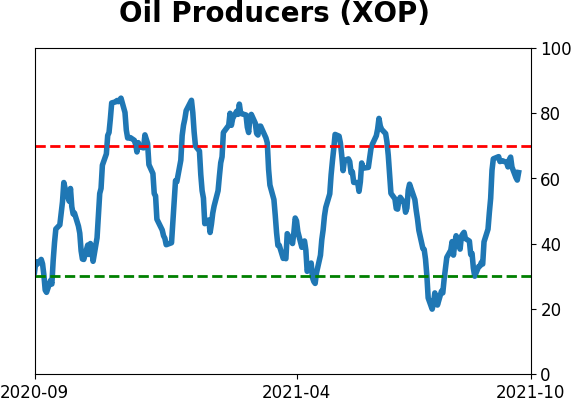
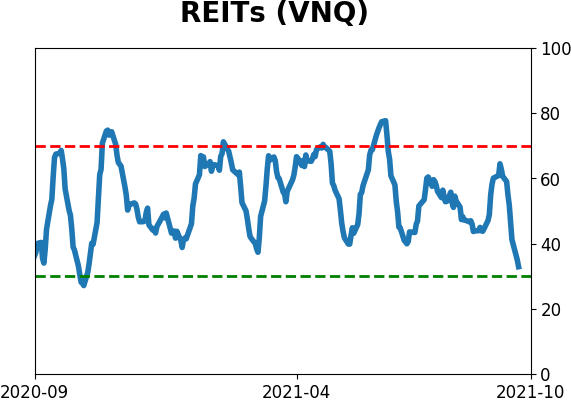
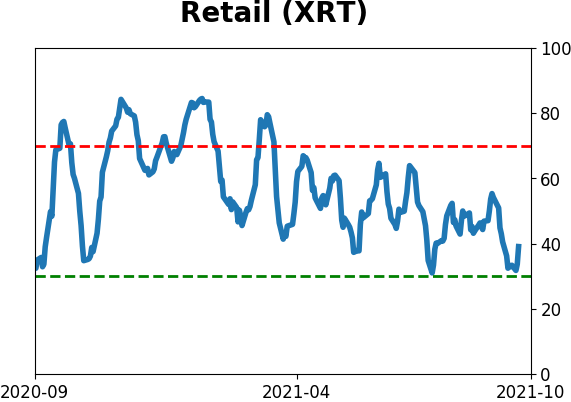
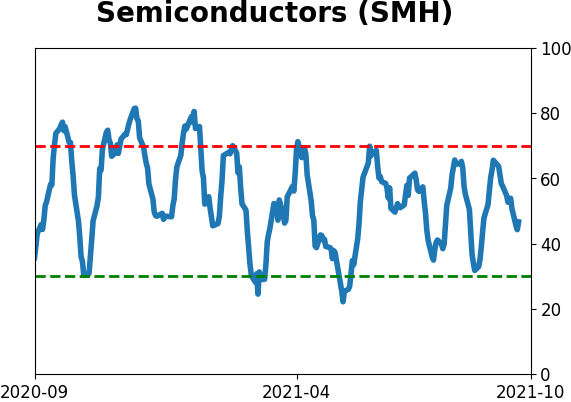
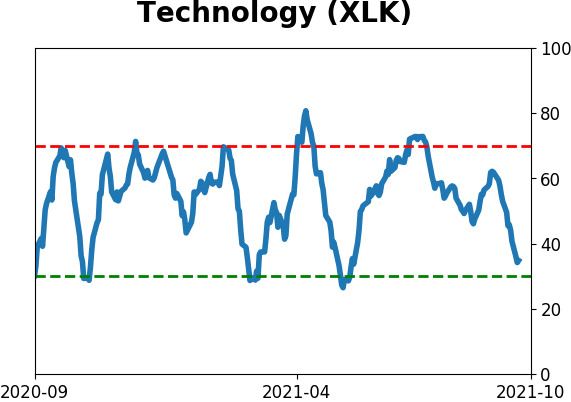
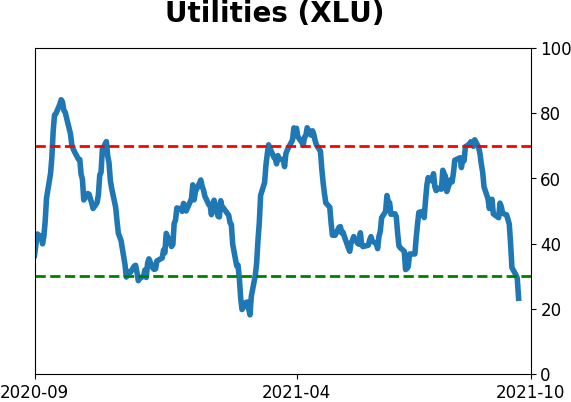
Sector ETF's - 10-Day Moving Average
|
|
|
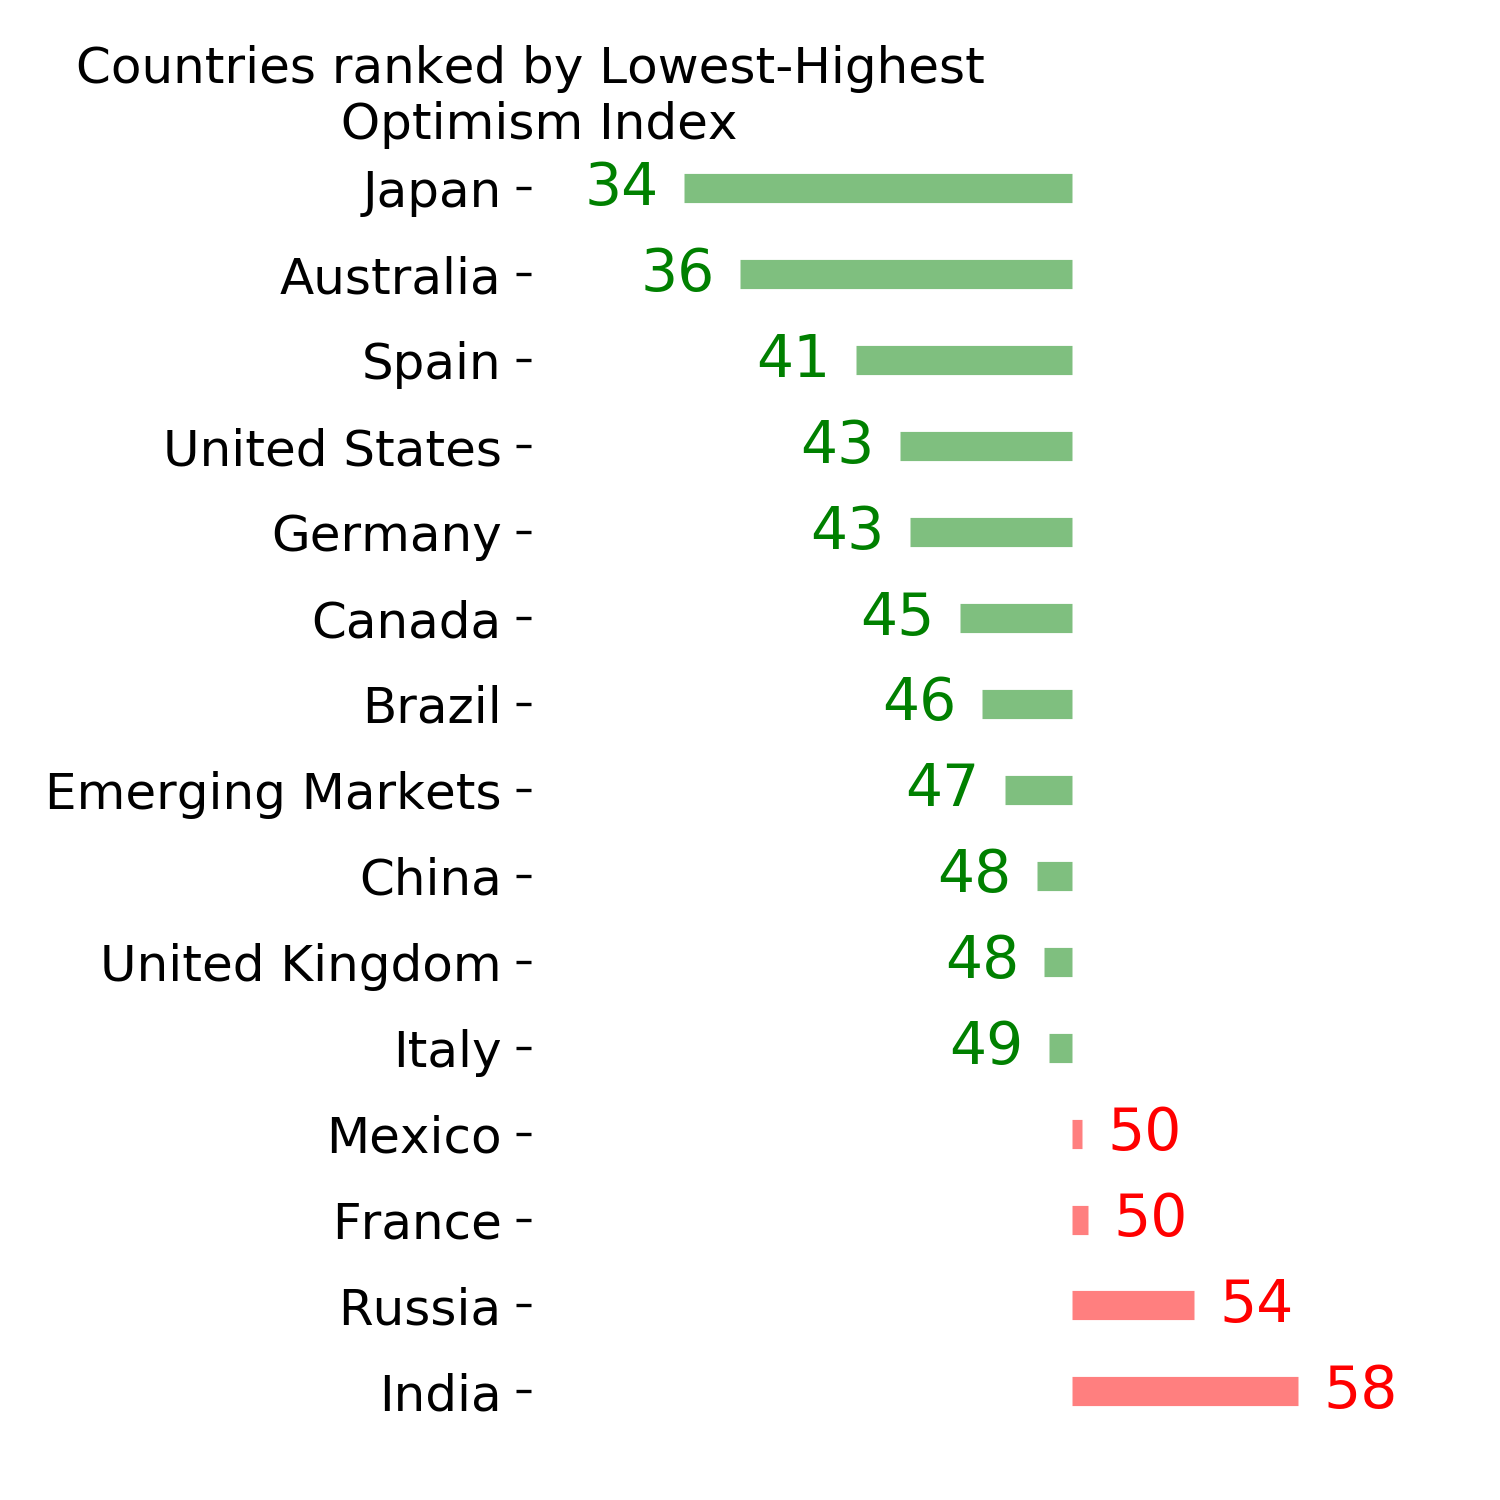
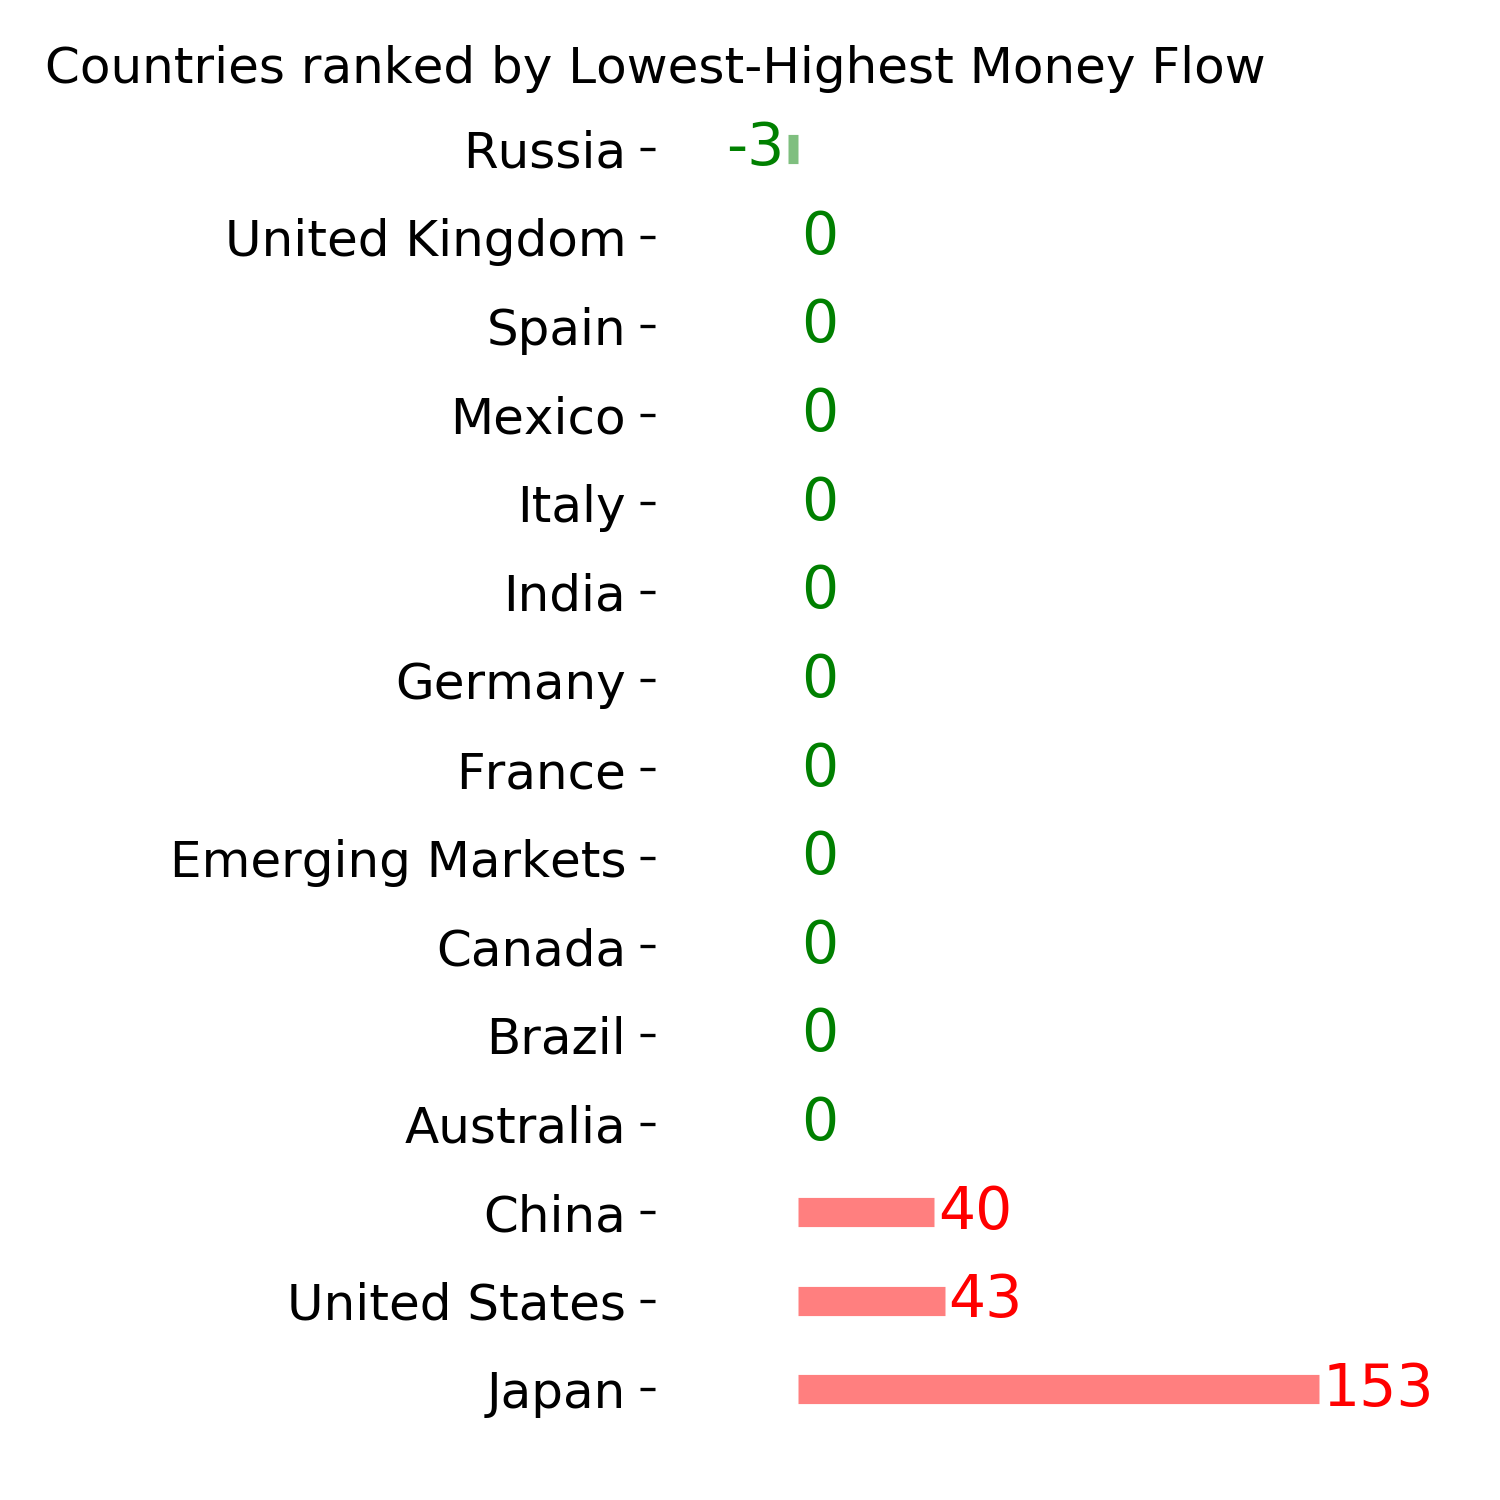
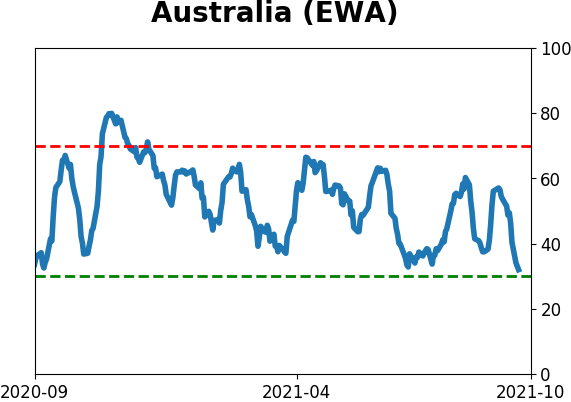
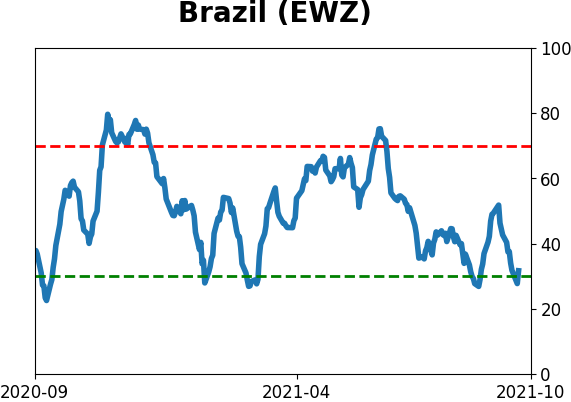
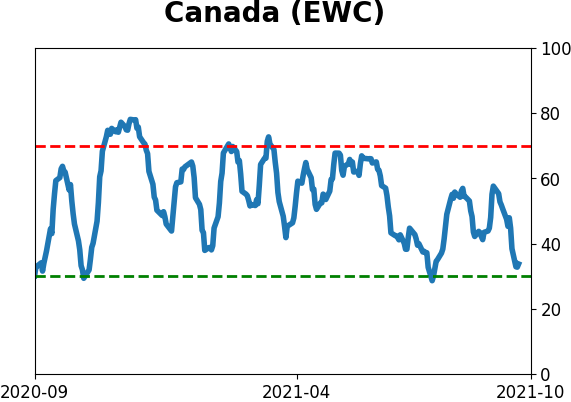
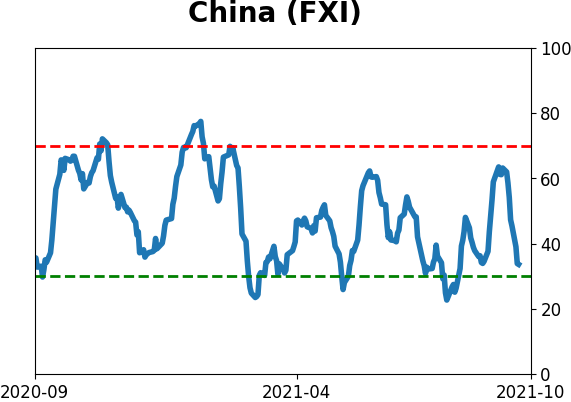
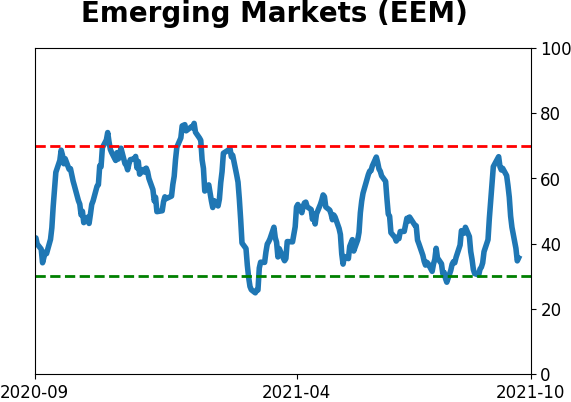
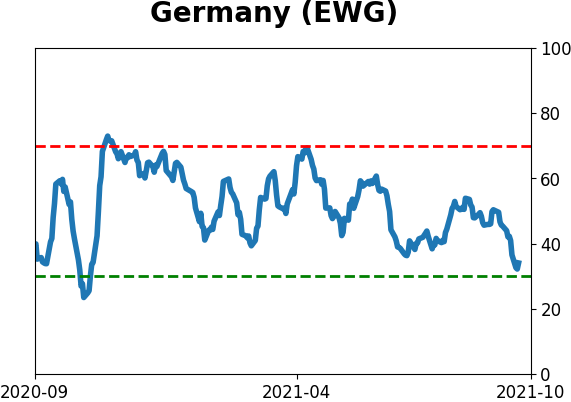
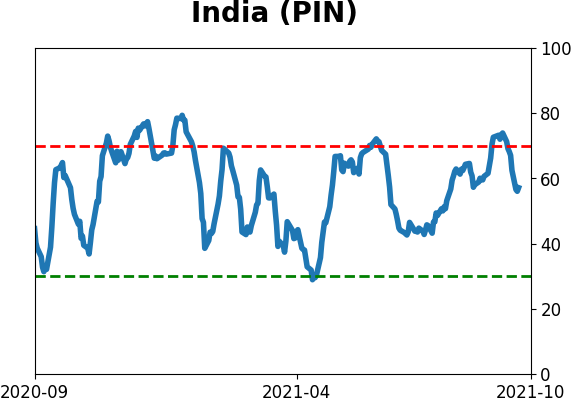
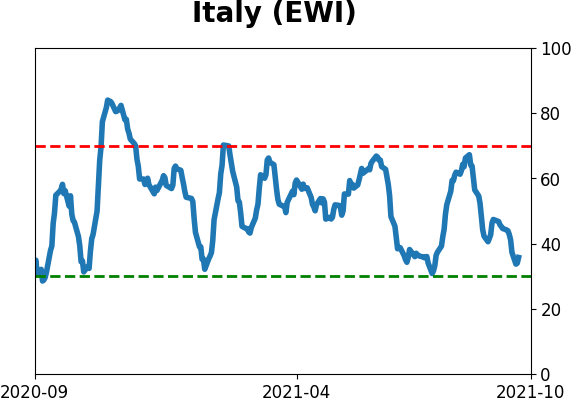
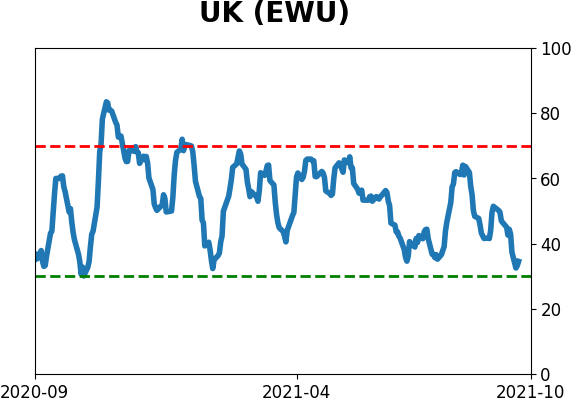
Country ETF's - 10-Day Moving Average
|
|
|
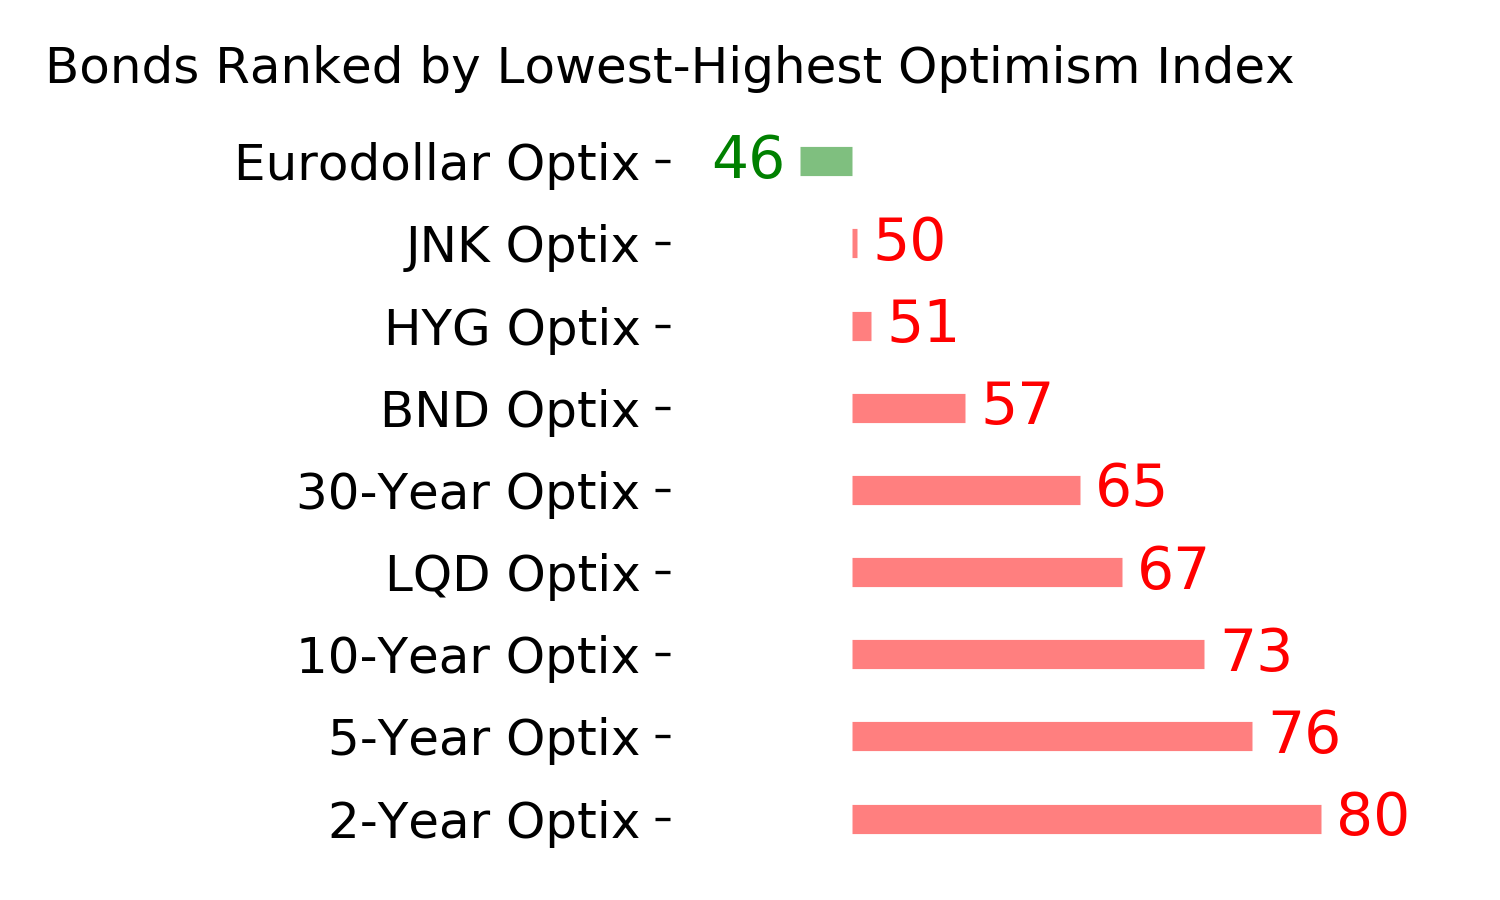
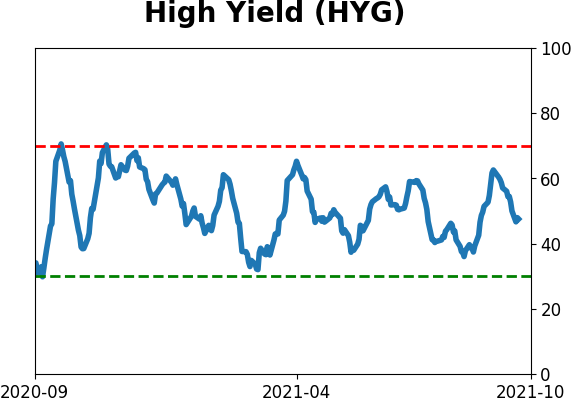
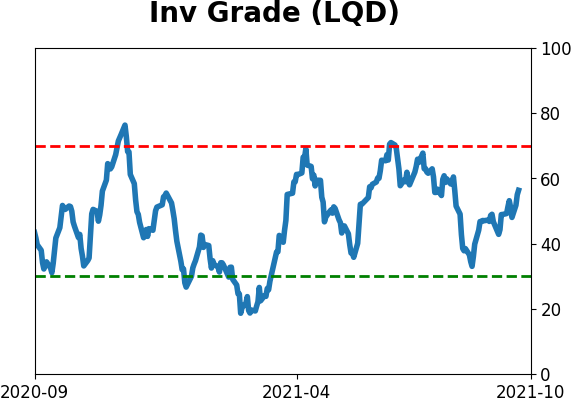
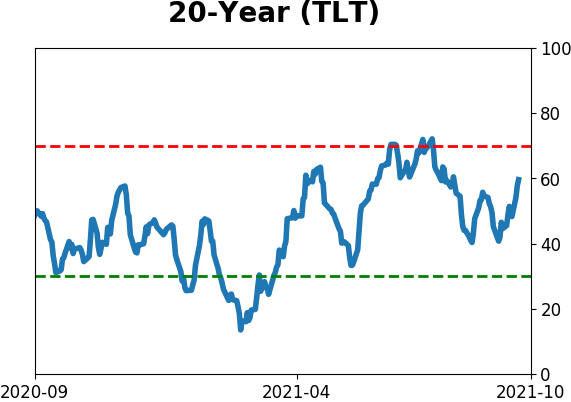
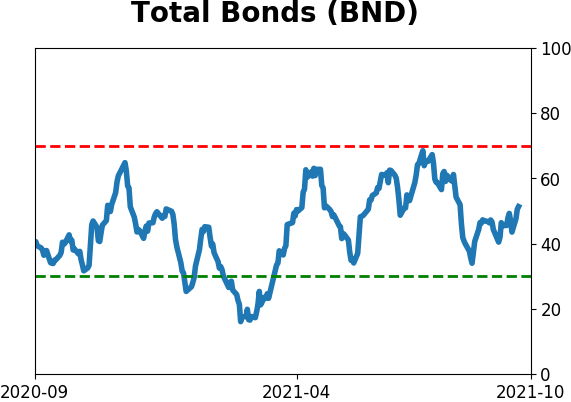
Bond ETF's - 10-Day Moving Average
|
|
|
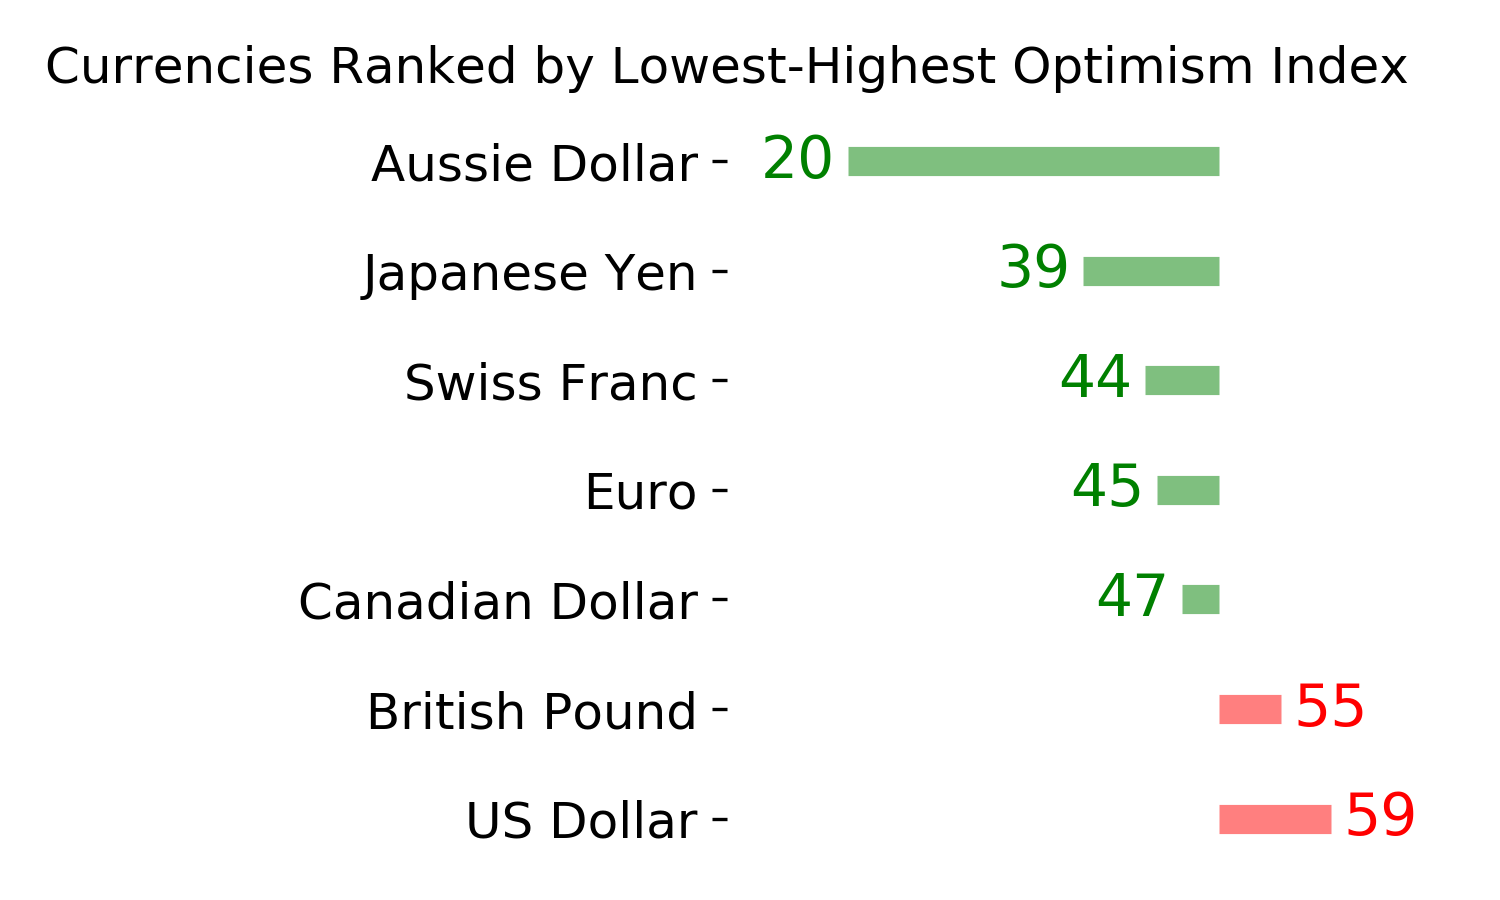
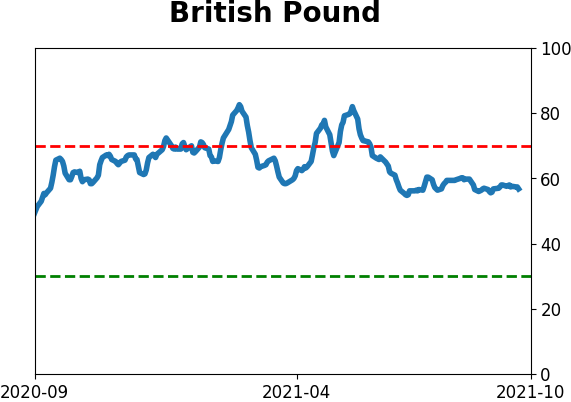
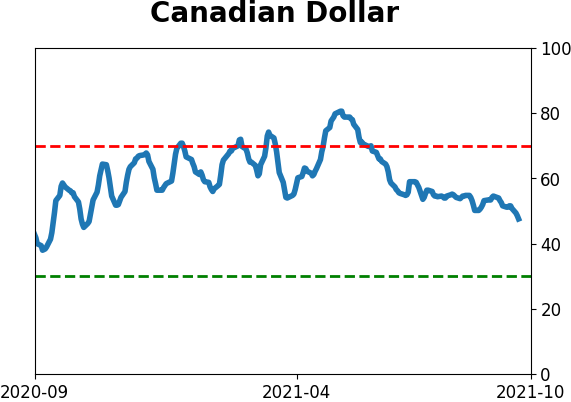
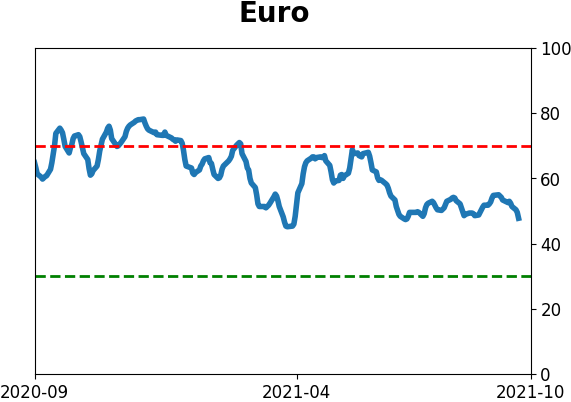
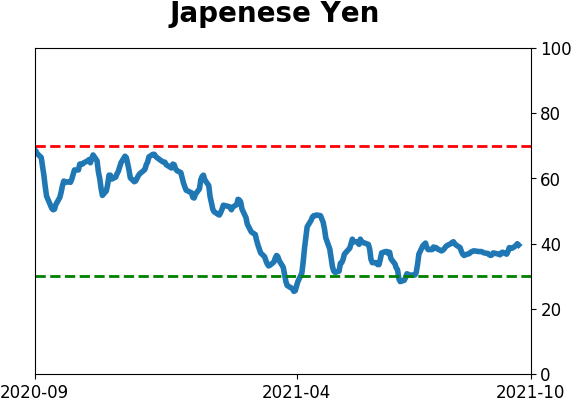
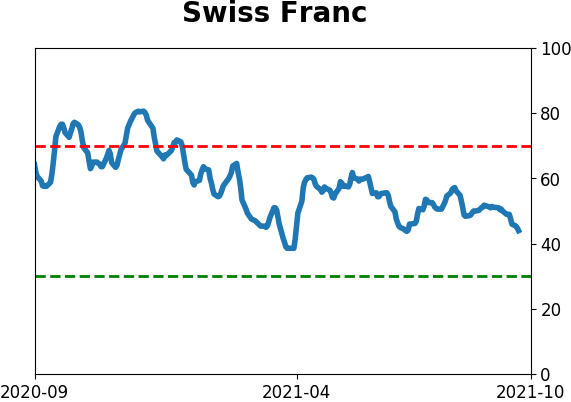
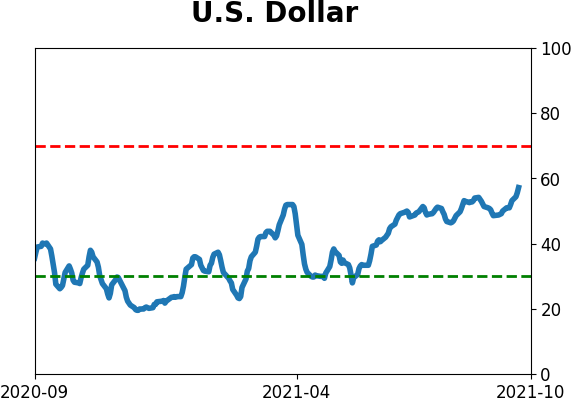
Currency ETF's - 5-Day Moving Average
|
|
|
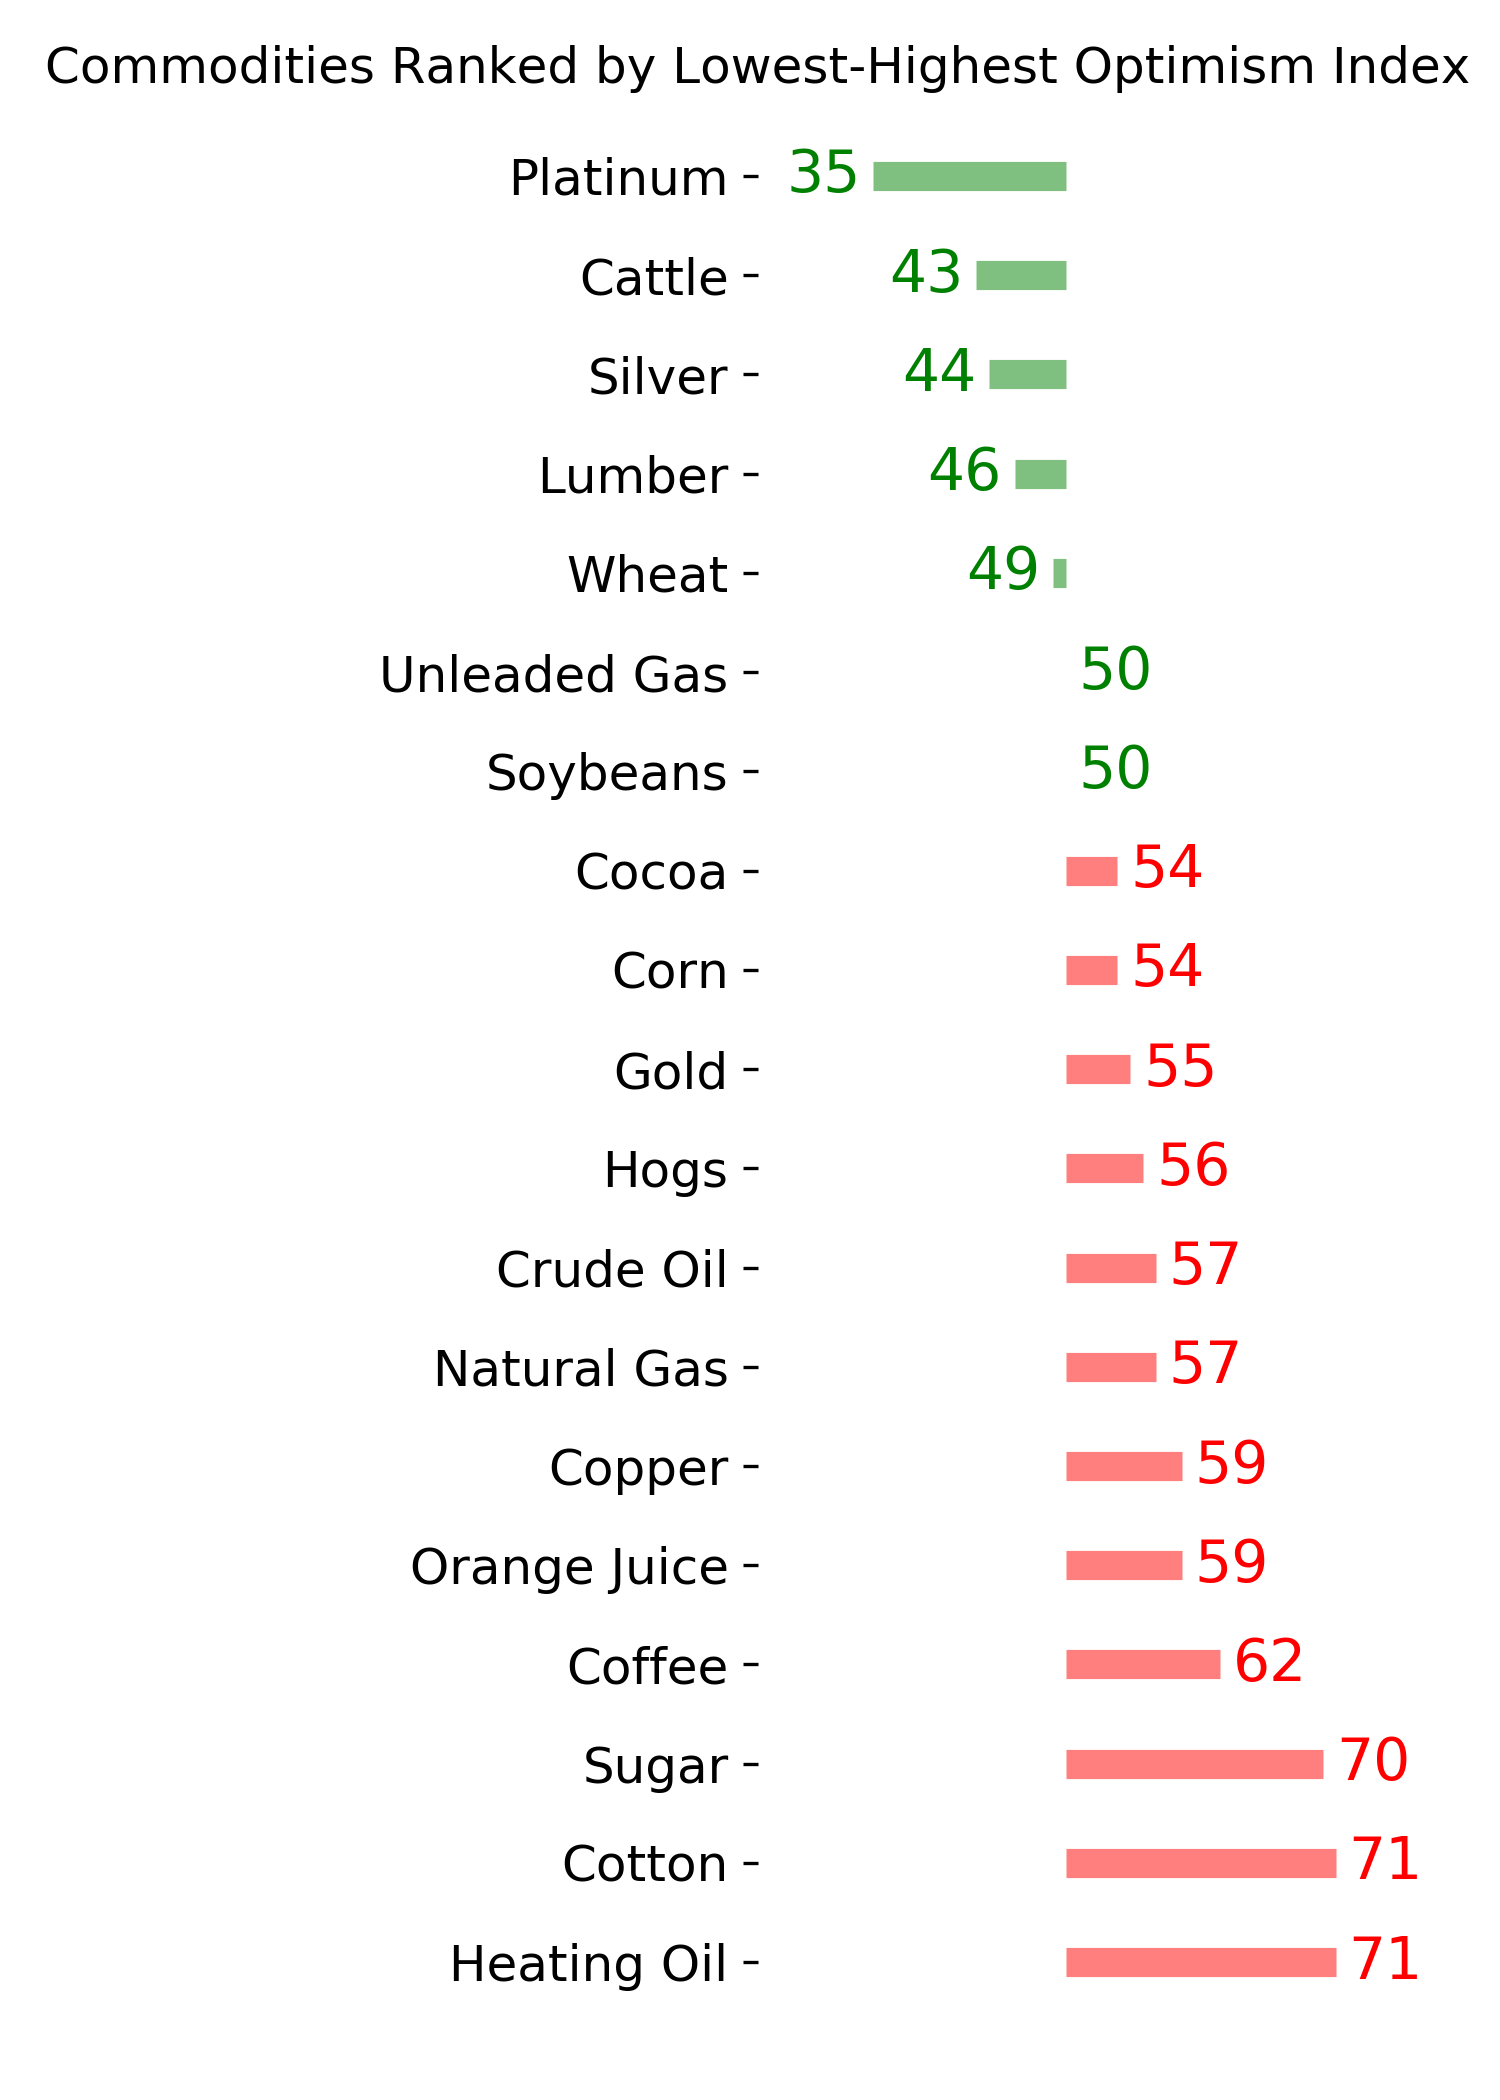
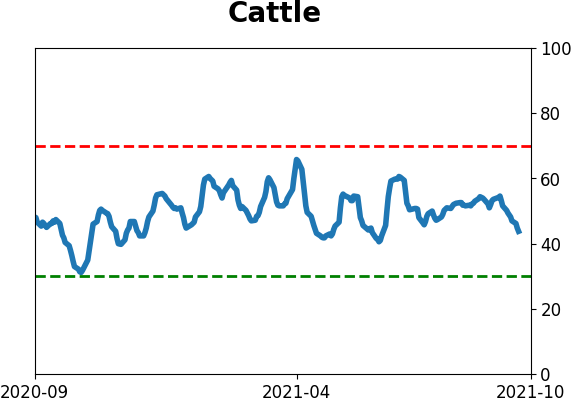
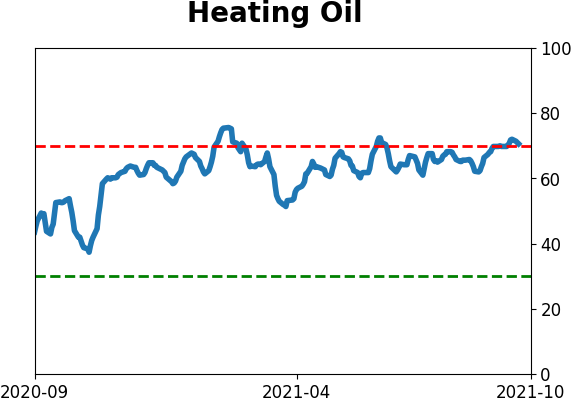
Commodity ETF's - 5-Day Moving Average
|
|