Headlines
|
|
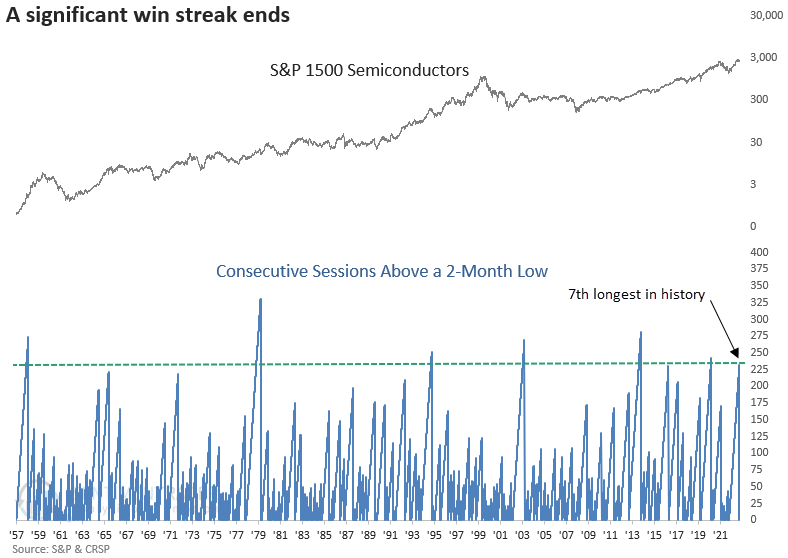
A historic win streak for semiconductors comes to an end :
After an astonishing run of 232 sessions without hitting a 2-month low, a semiconductor index closed at a new multi-month low, ranking as the 7th longest such streak since 1958. Historically, these breakdowns have acted as brief respites that rejuvenate bullish trends. A month later, the industry was higher 90% of the time.
|
Smart / Dumb Money Confidence
|
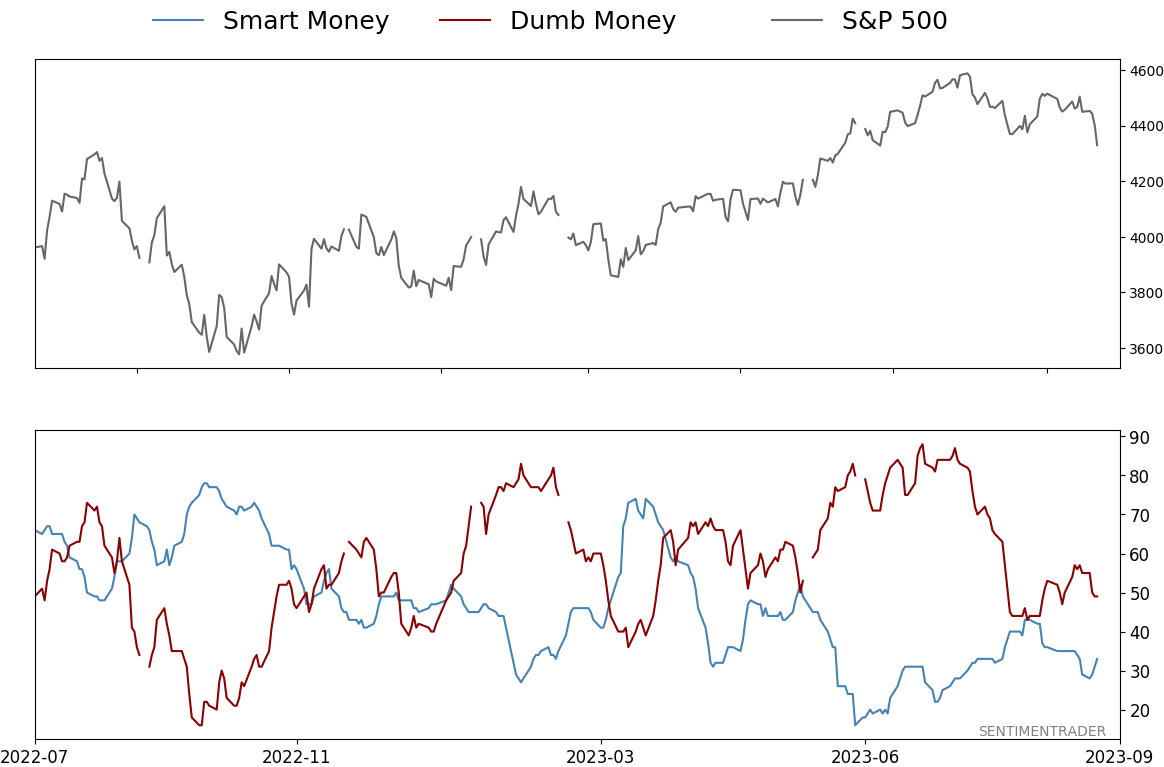
Smart Money Confidence: 33%
Dumb Money Confidence: 49%
|
|
Risk Levels
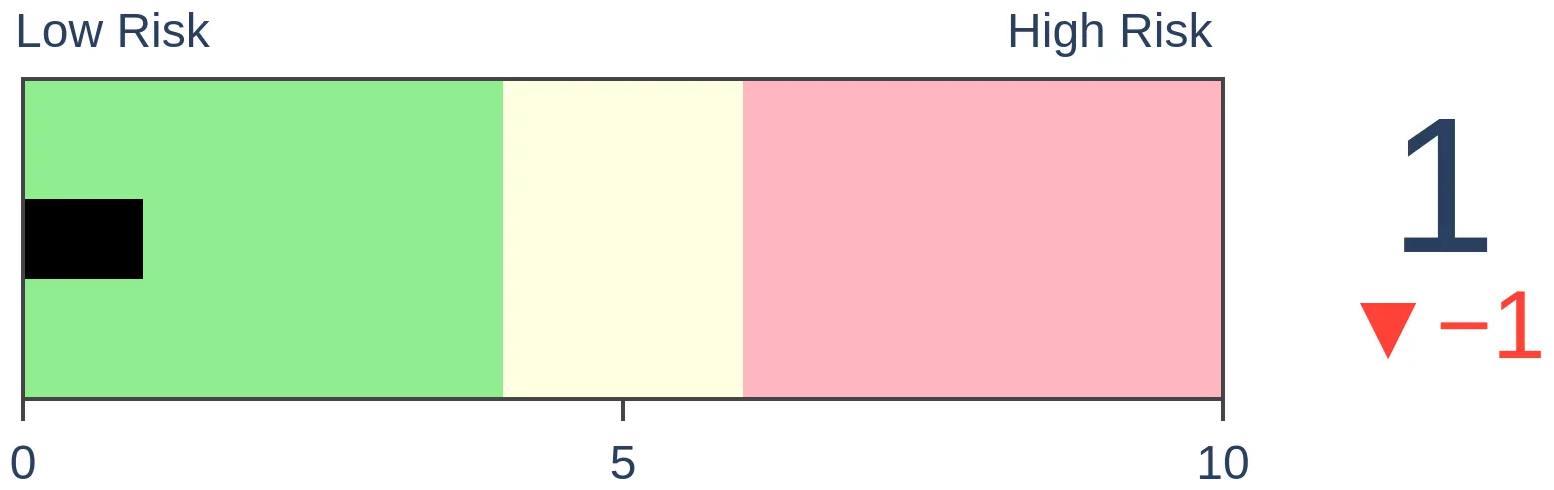
Stocks Short-Term
|
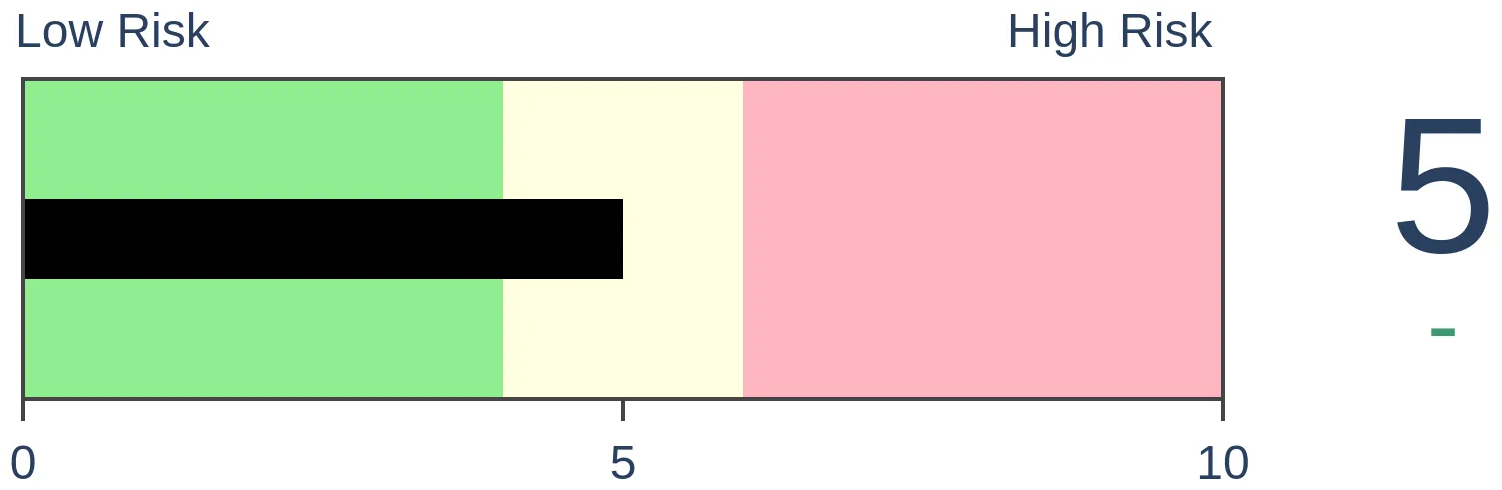
Stocks Medium-Term

|
|
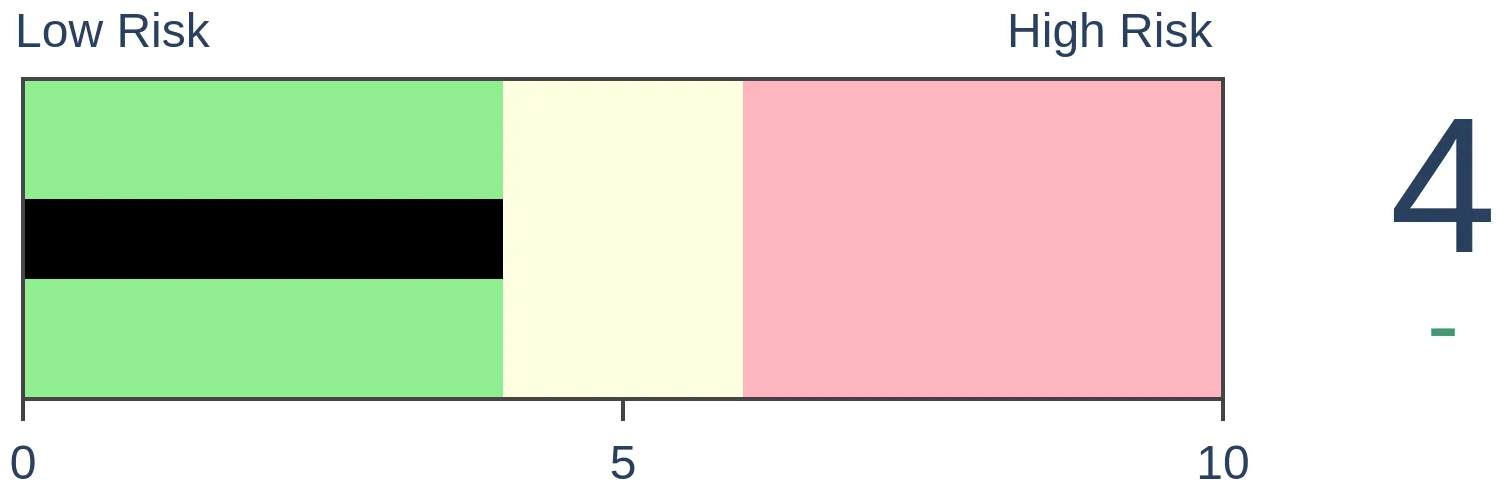
Bonds
|
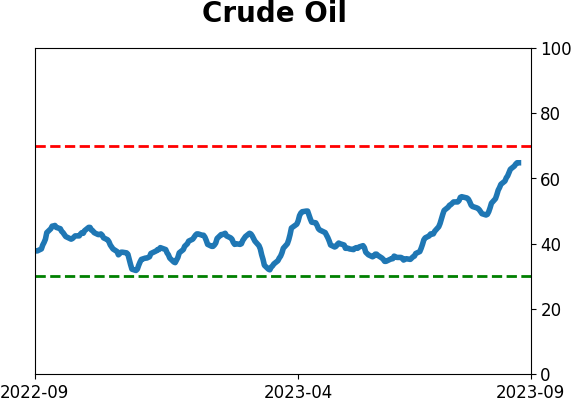
Crude Oil
|
|
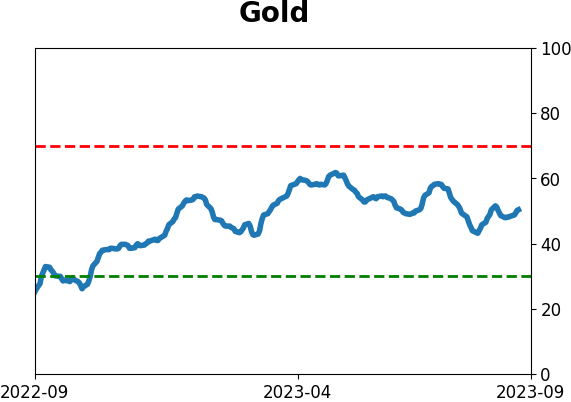
Gold
|
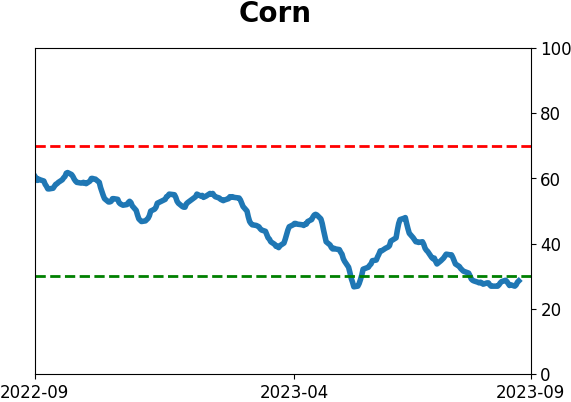
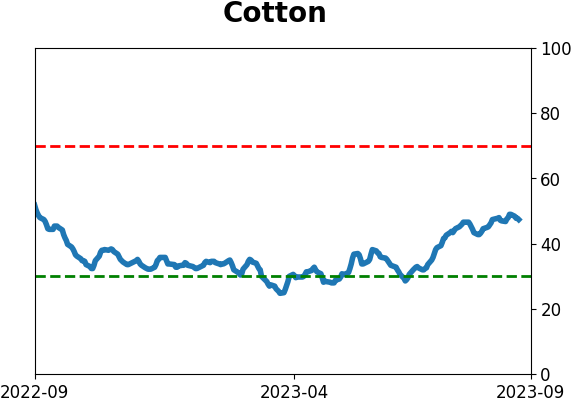
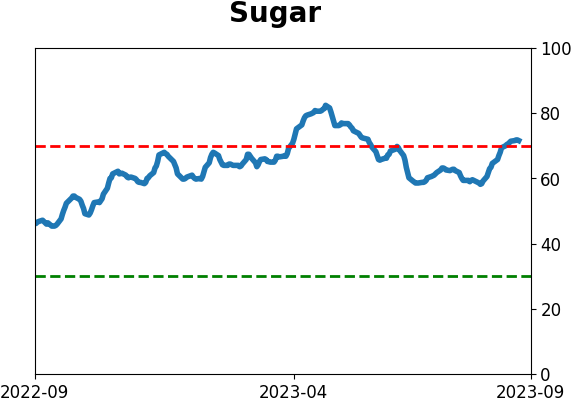
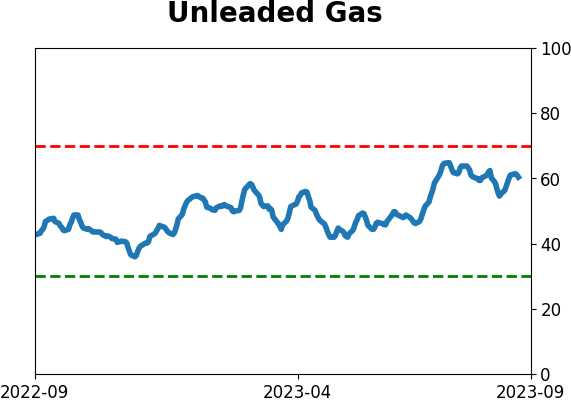
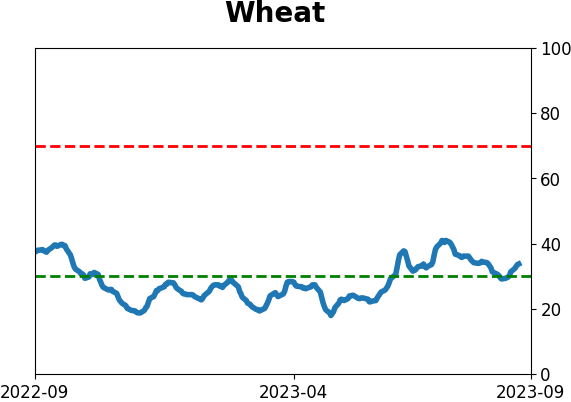
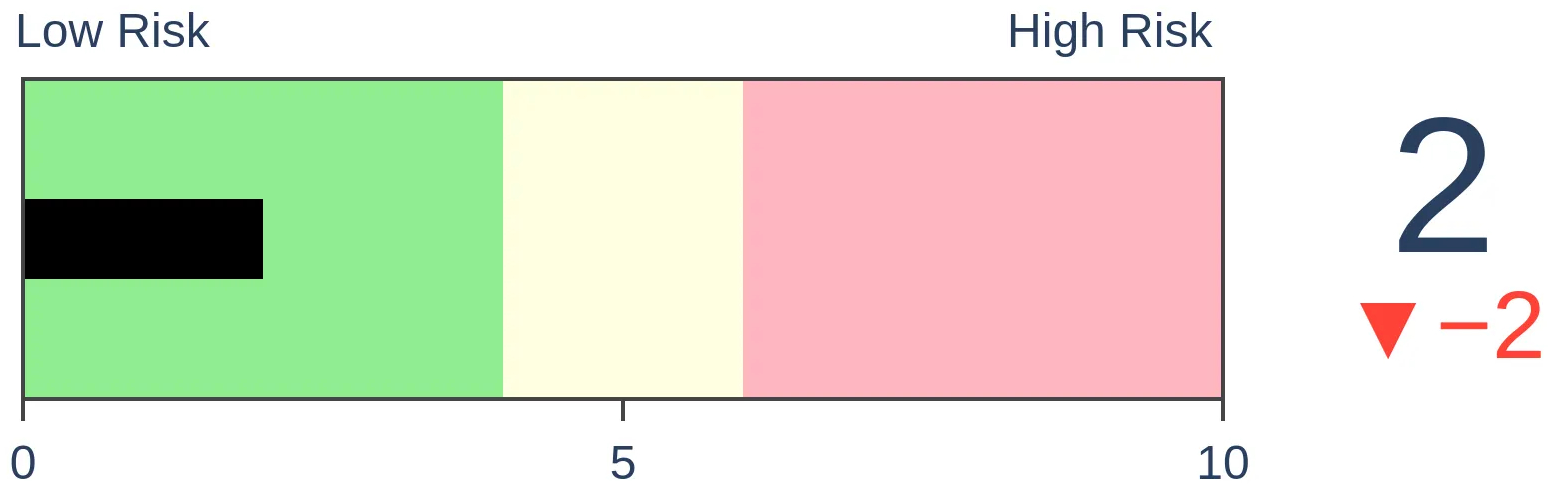
Agriculture

|
|
Research
By Dean Christians
BOTTOM LINE
After an astonishing run of 232 sessions without hitting a 2-month low, a semiconductor index closed at a new multi-month low, ranking as the 7th longest such streak since 1958. Historically, these breakdowns have acted as brief respites that rejuvenate bullish trends. A month later, the industry was higher 90% of the time.
FORECAST / TIMEFRAME
None
|
Key points:
- For the first time in 232 consecutive sessions, a semiconductor index closed at a 2-month low
- Similar conclusions to a lengthy win streak led to a short-term pause within the context of an uptrend
- Semiconductors tend to outperform Technology and the S&P 500 over medium and long-term horizons
The ability to avoid a multi-month low for an extended period is a sign of an uptrend
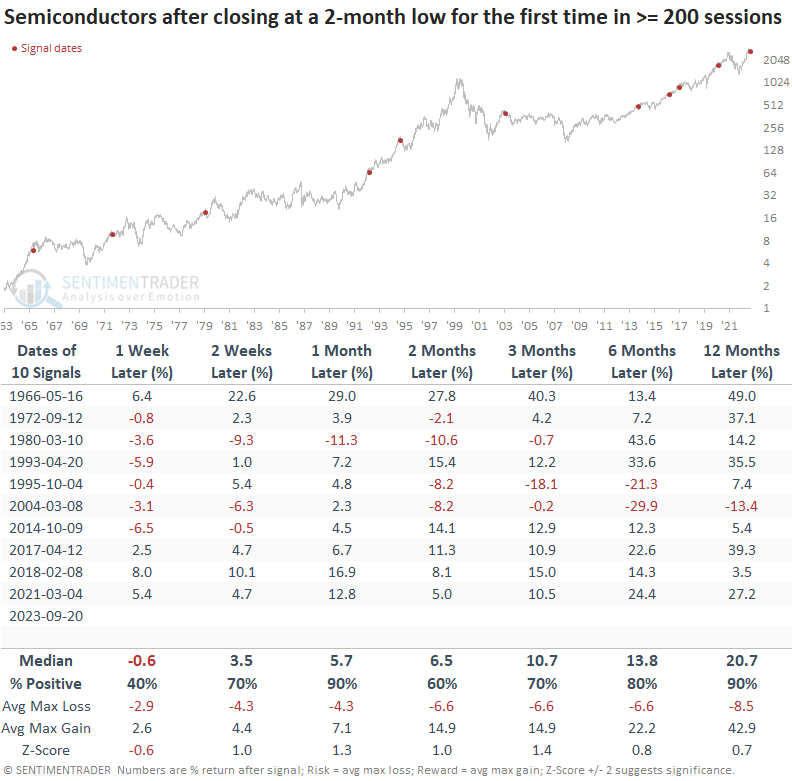
After failing to close at a 2-month low for 232 consecutive sessions, the S&P 1500 Semiconductor index snapped its win streak on Wednesday, ending the 7th most prolonged period without a low in over 65 years.
As I've highlighted in numerous research reports, the ability of a stock or index to consistently stay above a moving average or a low over an extended period serves as a clear signal of positive momentum, a characteristic typically associated with uptrends rather than downtrends.
Similar multi-month lows after a prolonged win streak preceded positive returns
Once semiconductors dip to a 2-month low following a streak of 200 sessions or more without a low, the industry often witnesses additional downside momentum in the subsequent week. However, the group wastes no time bouncing back, achieving a remarkable 90% win rate at the 1-month mark. A year later, the semiconductor index continued its upward trajectory, posting higher values in all but one case with a median gain of 20%.
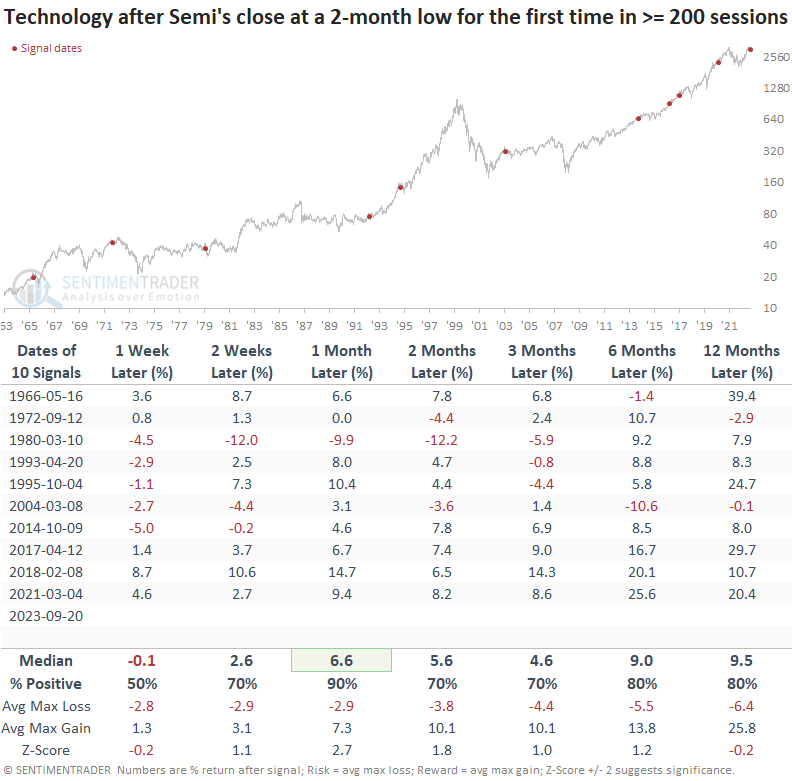
Not surprisingly, the S&P 500 Technology sector follows a similar path, albeit returns and win rates are slightly less favorable.
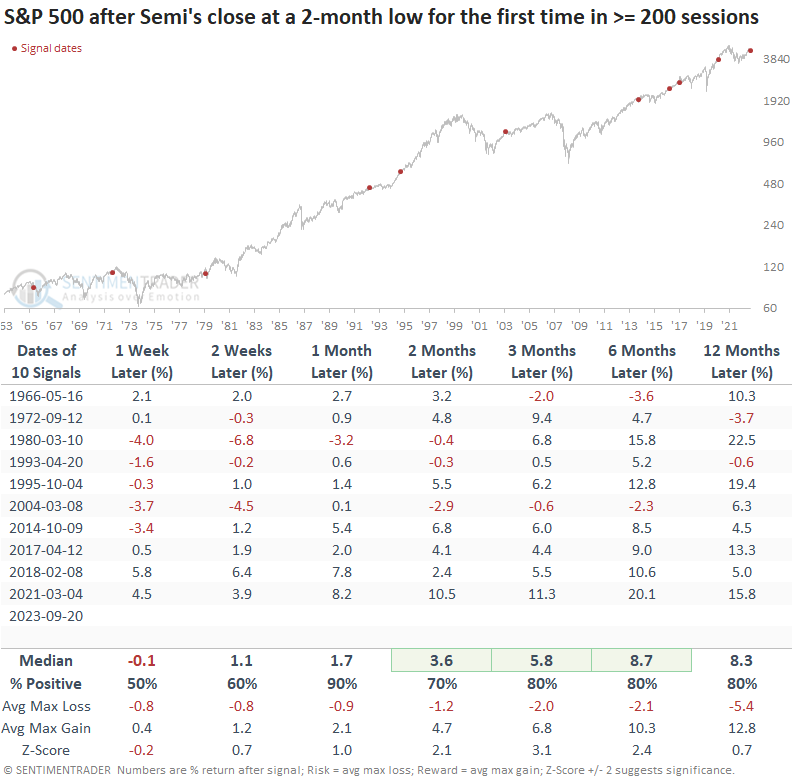
Similar to semiconductors and Technology, returns, win rates, and z-scores for the world's most benchmarked index look solid.
From a relative comparison perspective, it's a coin flip whether semiconductors outperform the Technology sector in the short term. However, relative returns over longer horizons look much better. Compared to the S&P 500, the outlook for semiconductors looks solid across almost all time horizons.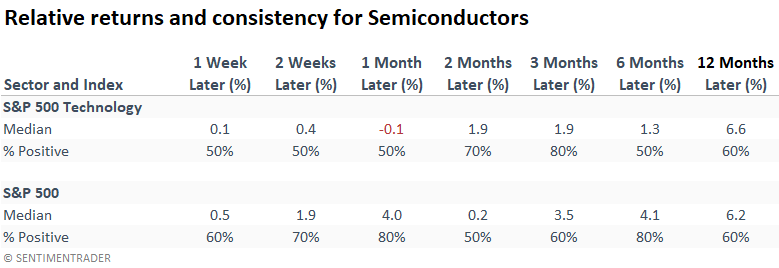
Another interesting new low will trigger today
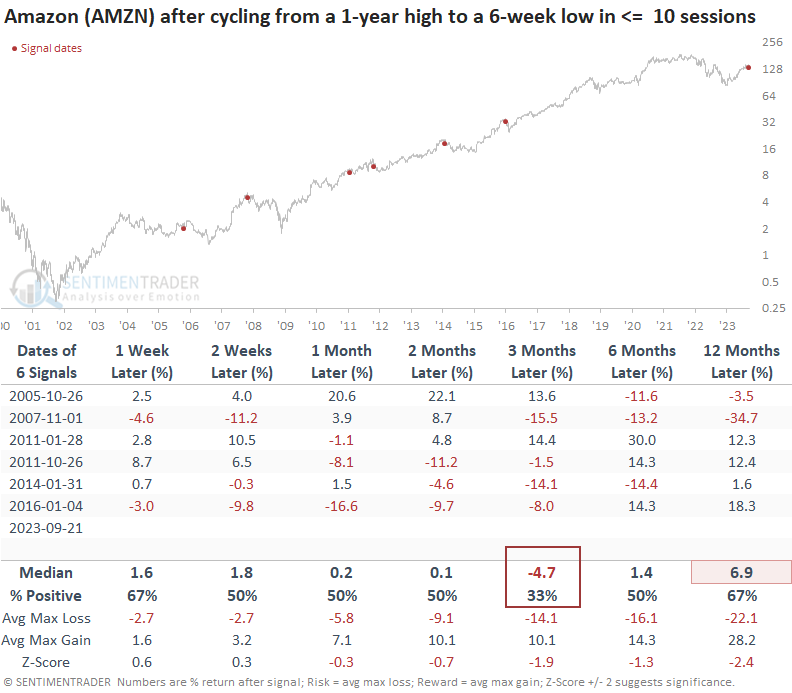
Amazon, a bellwether Consumer Discretionary stock with a significant market capitalization, reversed from a 1-year high to a 6-week low in only six sessions, which has occurred only twice in history. To capture more precedents, I eased the days since high condition from six to ten sessions. Similar reversals suggest Amazon could be in the penalty box for the next three months.
What the research tells us...
The S&P 1500 Semiconductor Industry group broke a 232-session streak by closing at a new two-month low. Historically, similar breakdowns following extended periods above the low resulted in additional downside over the subsequent week. Despite this temporary setback, the industry tends to quickly rebound and regain its upward momentum just one month later. Amazon, another widely followed stock market bellwether, reversed from a 1-year high to a 6-week low in ten or fewer sessions. Similar reversals suggest a cautious outlook over the medium term.
Indicators at Extremes
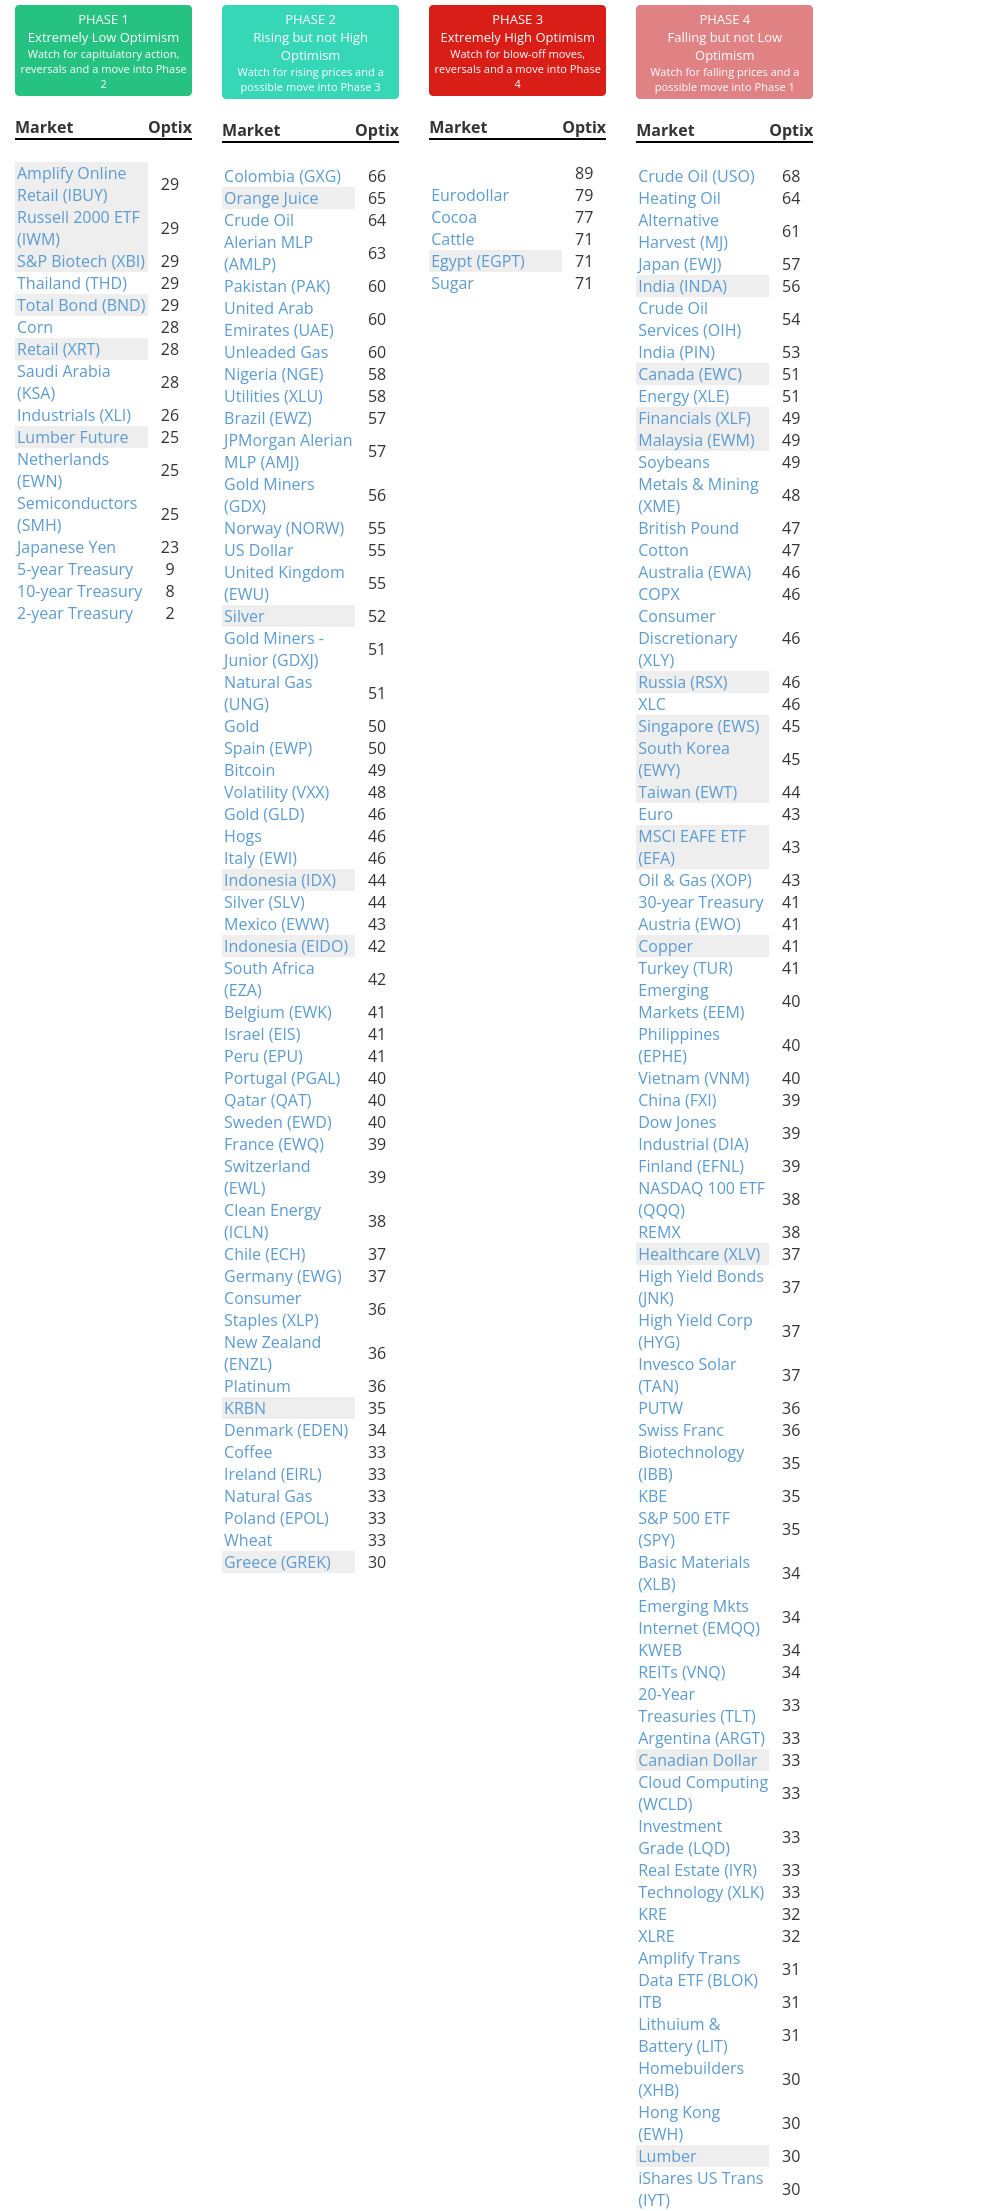
Phase Table
Ranks
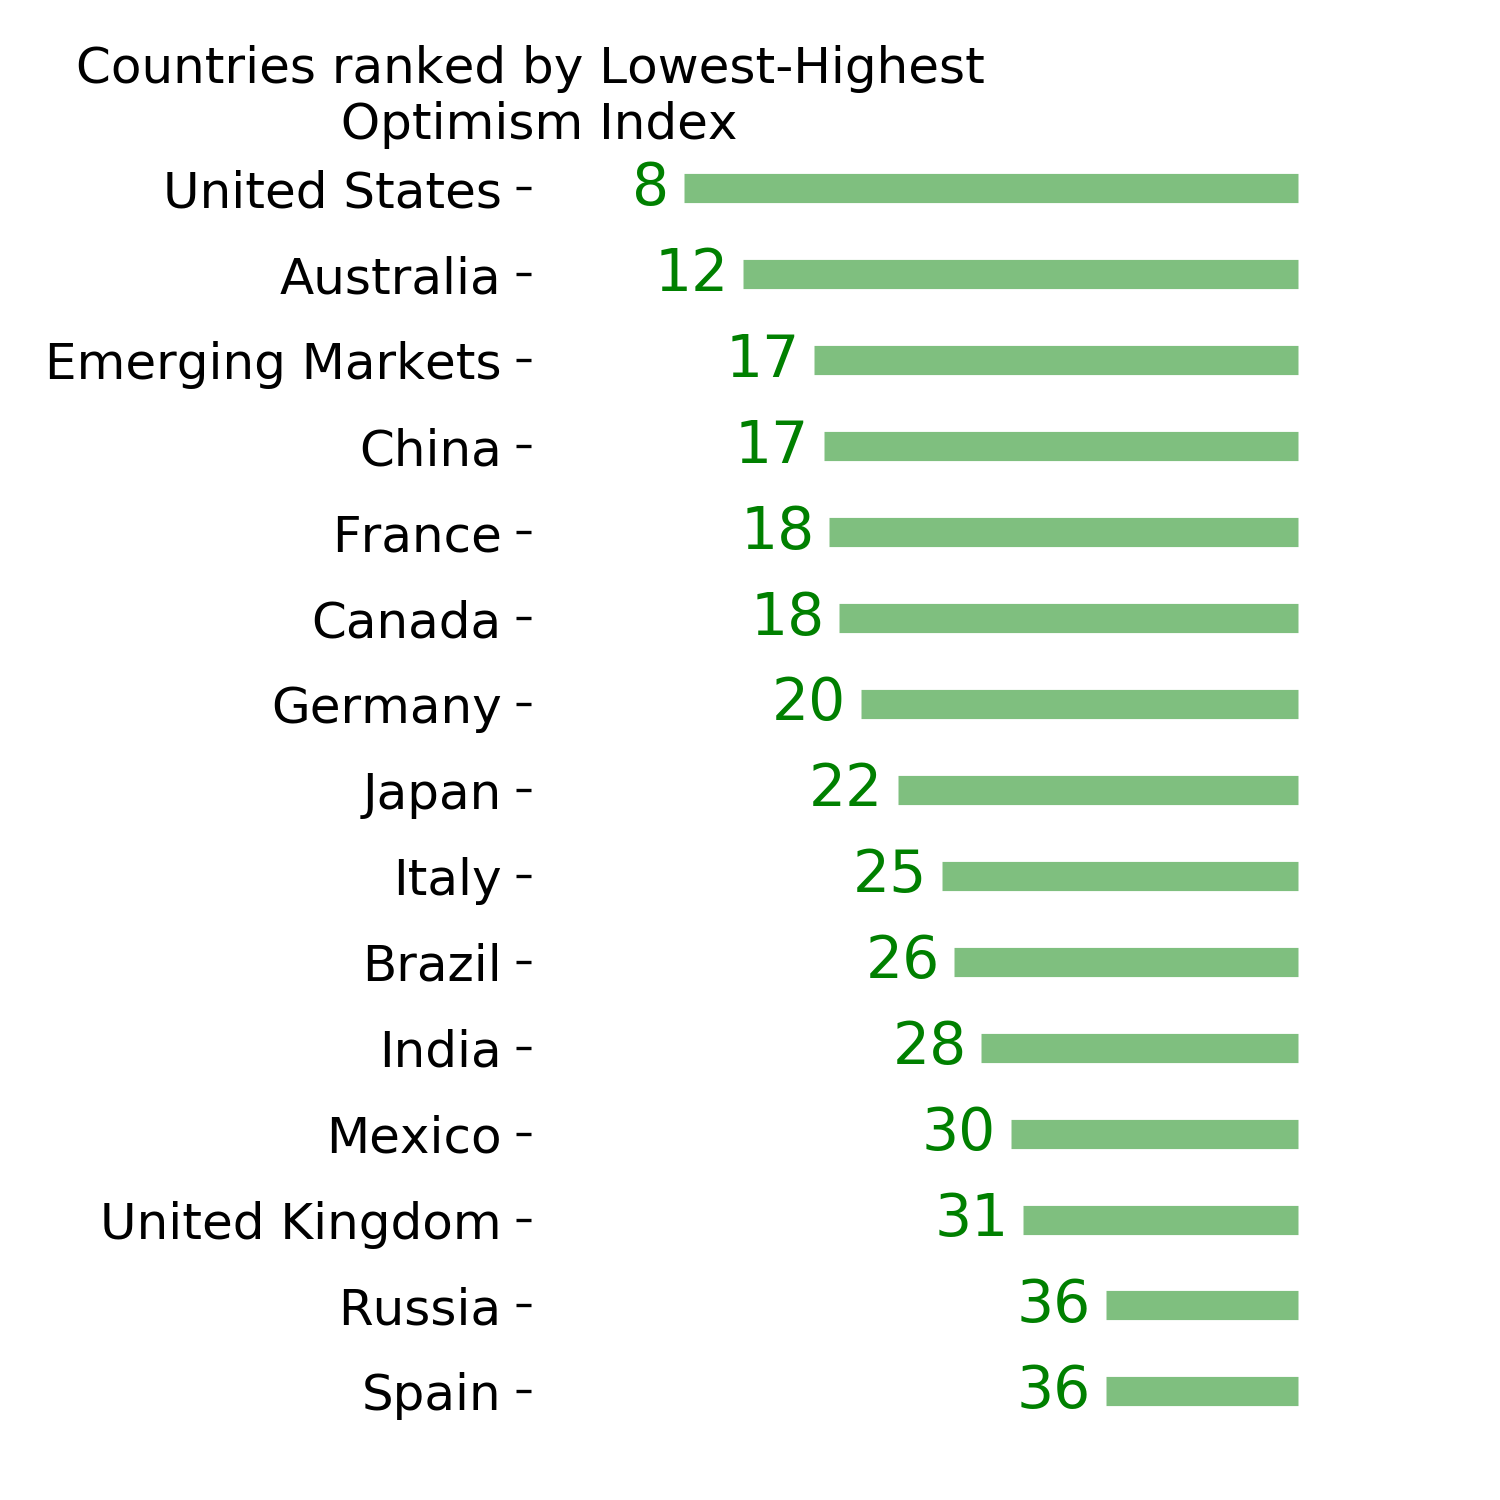
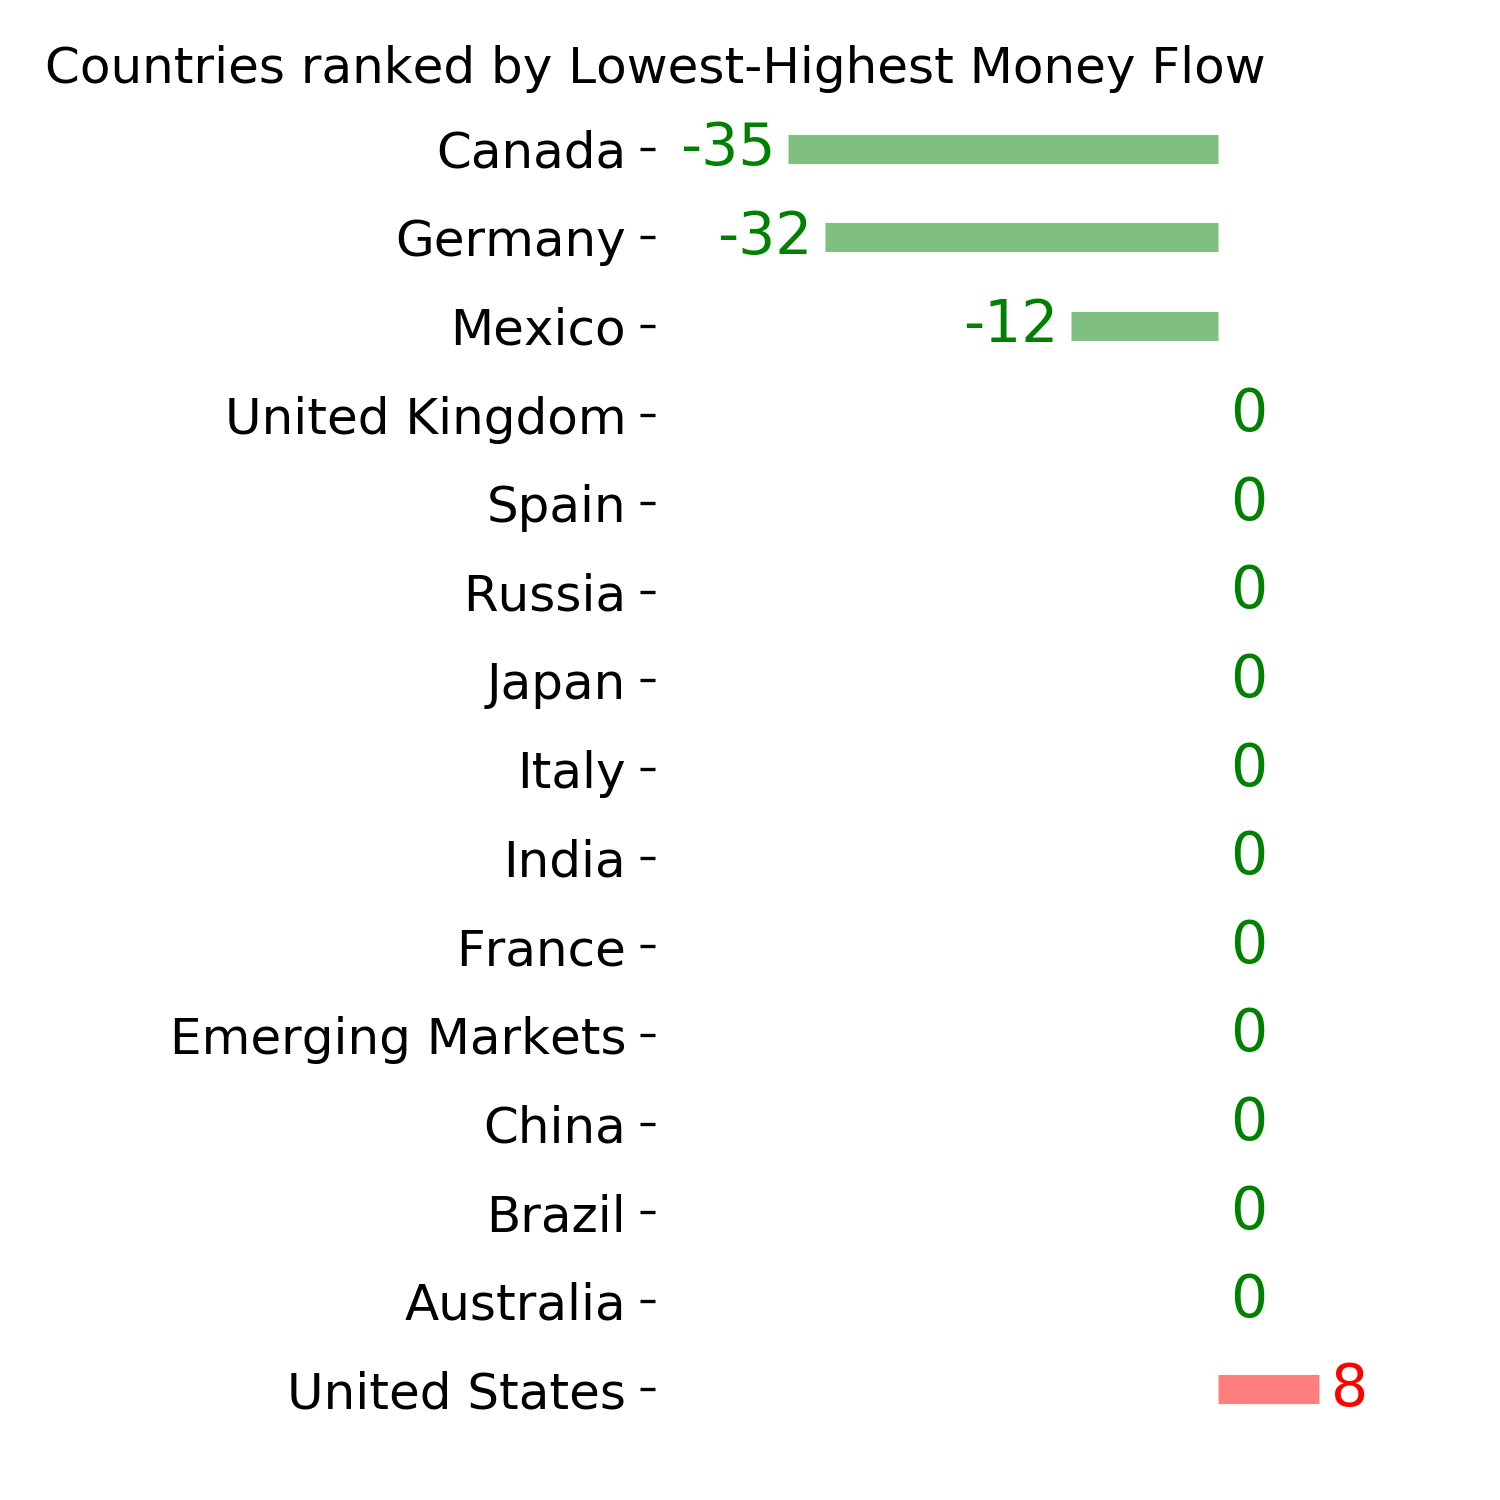
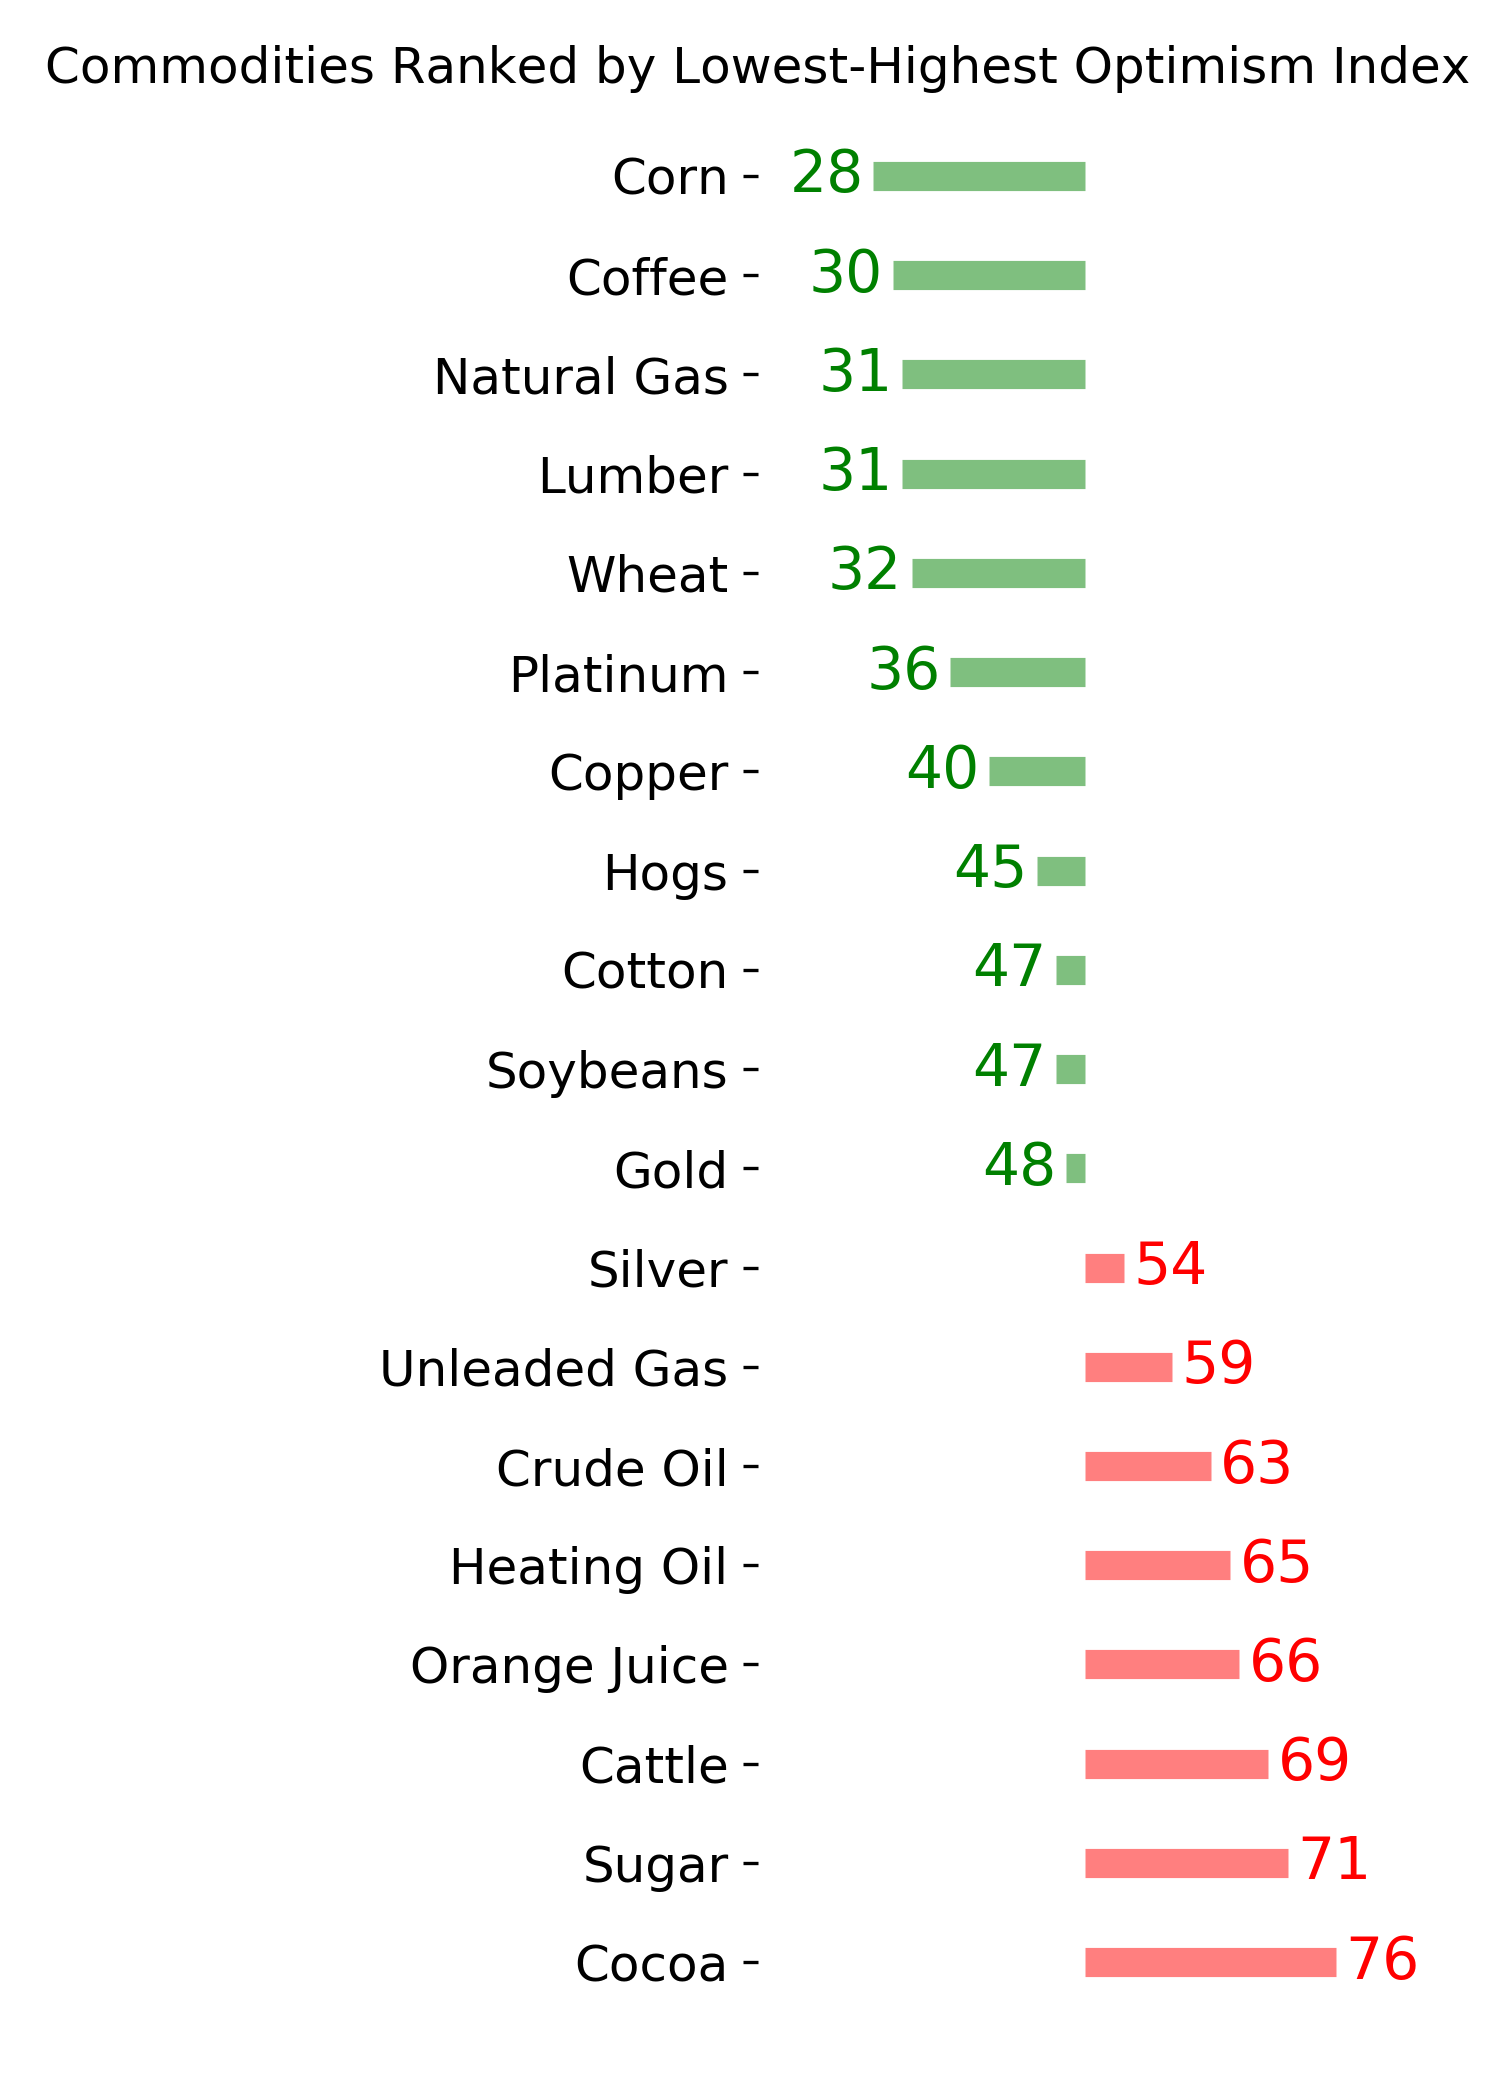
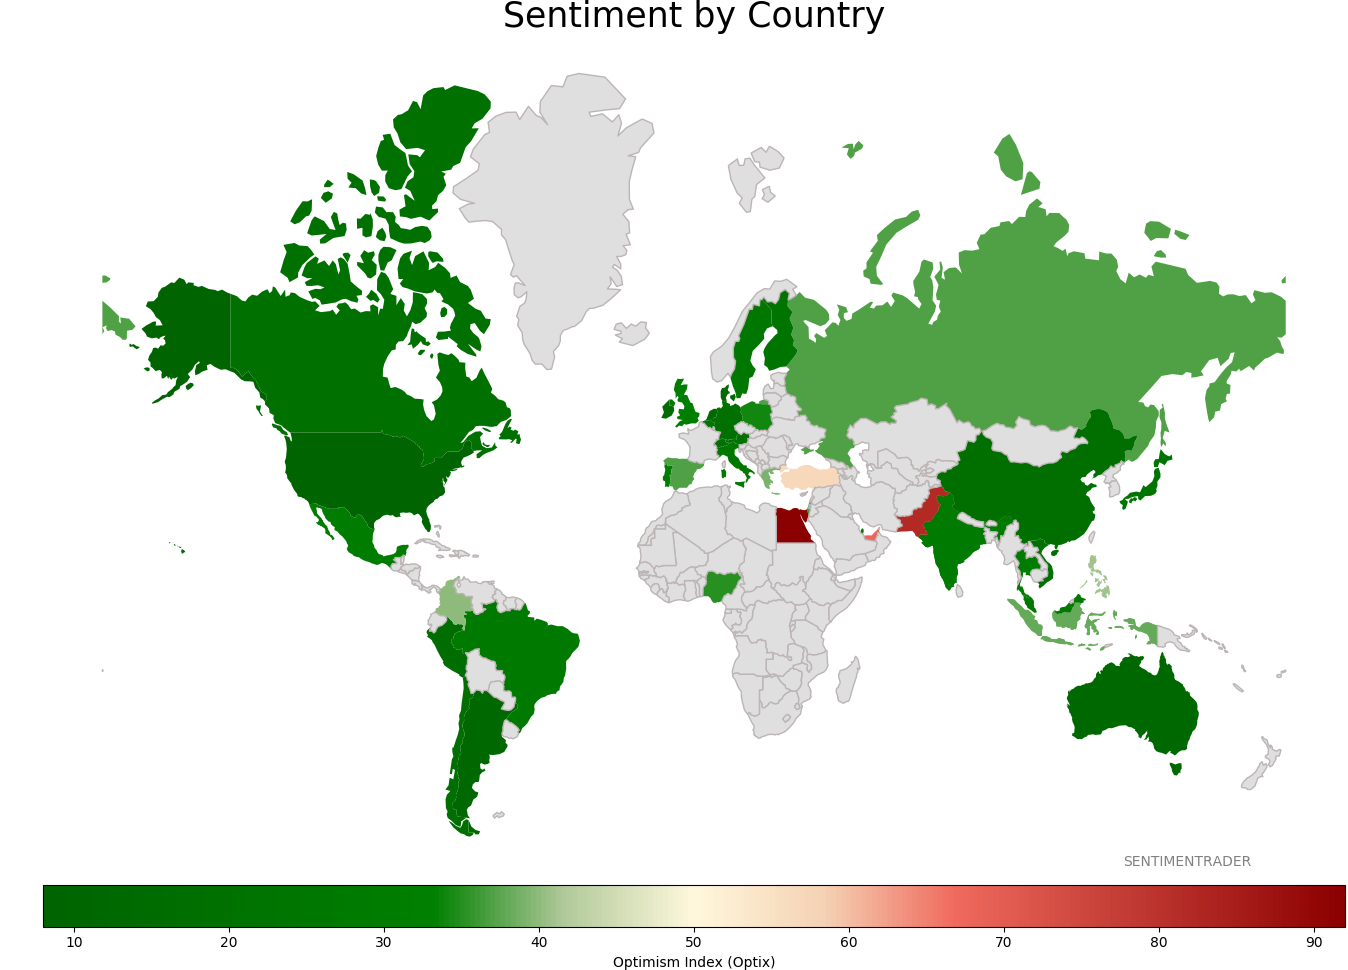
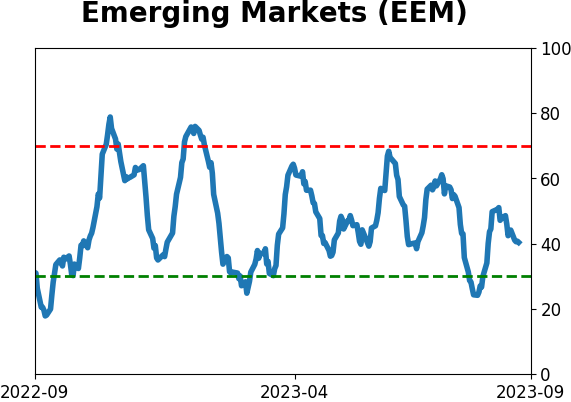
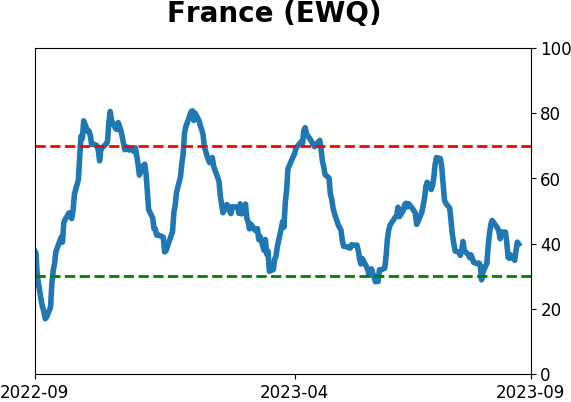
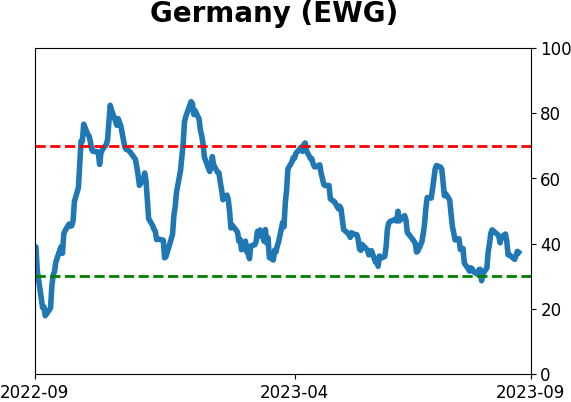
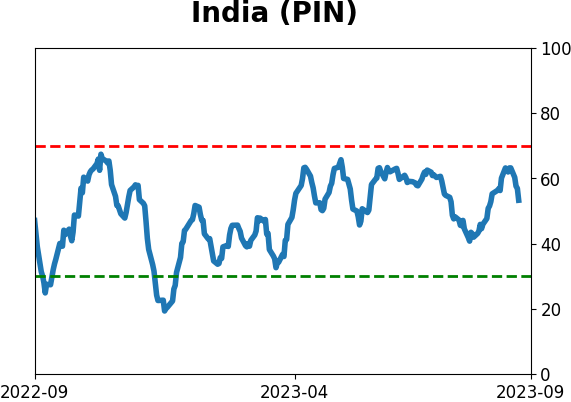
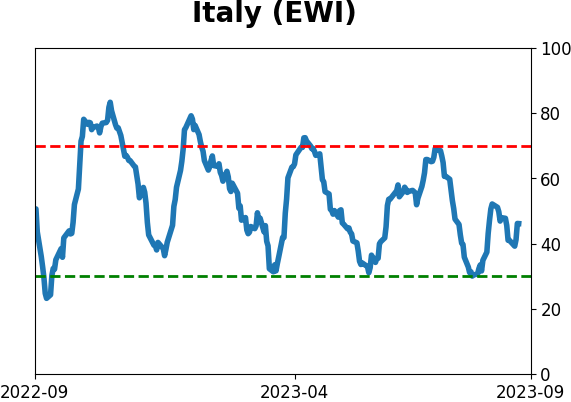
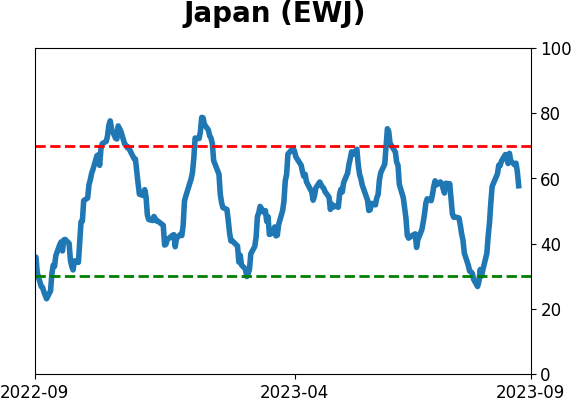
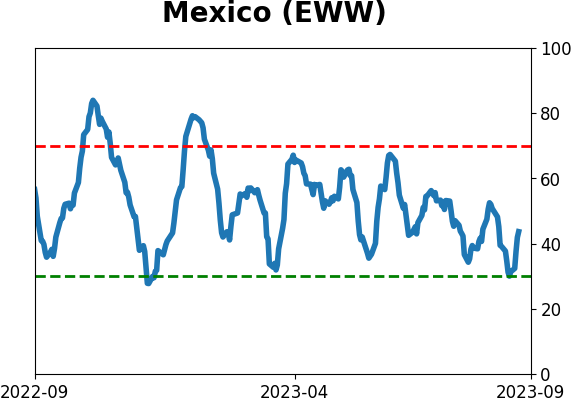
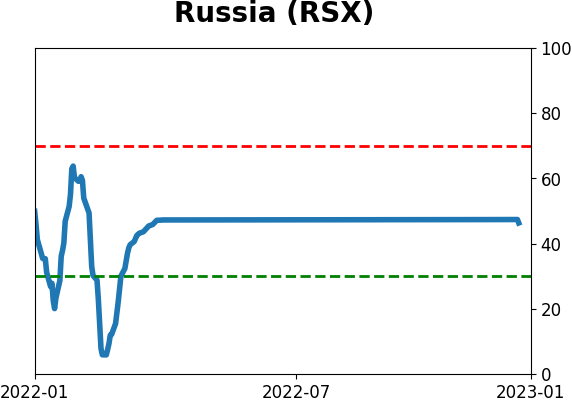
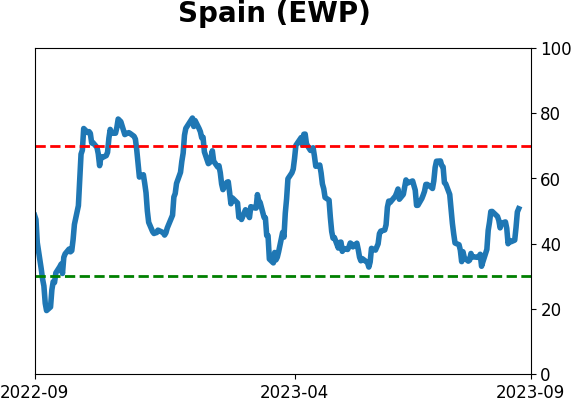
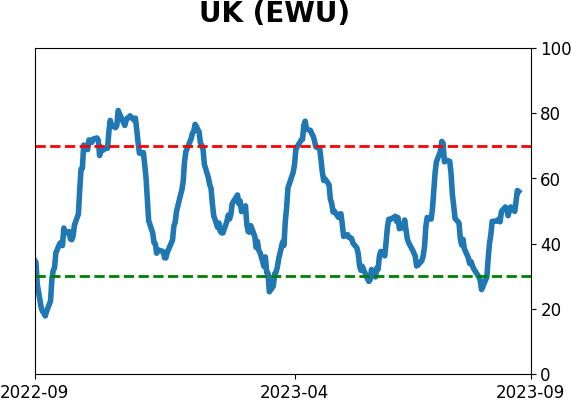
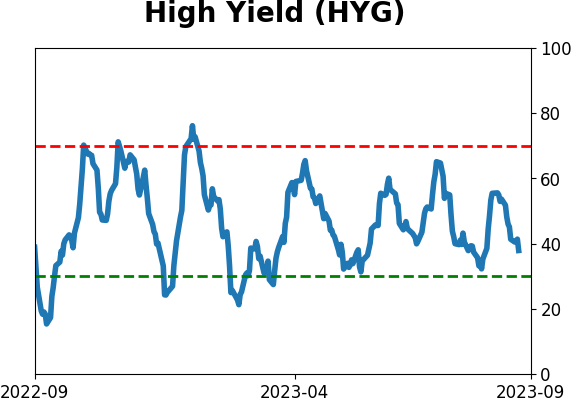
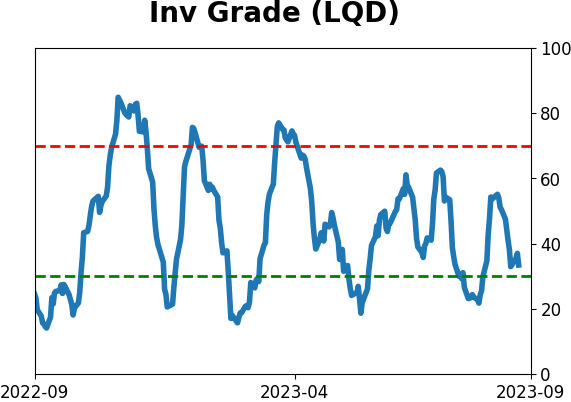
Sentiment Around The World
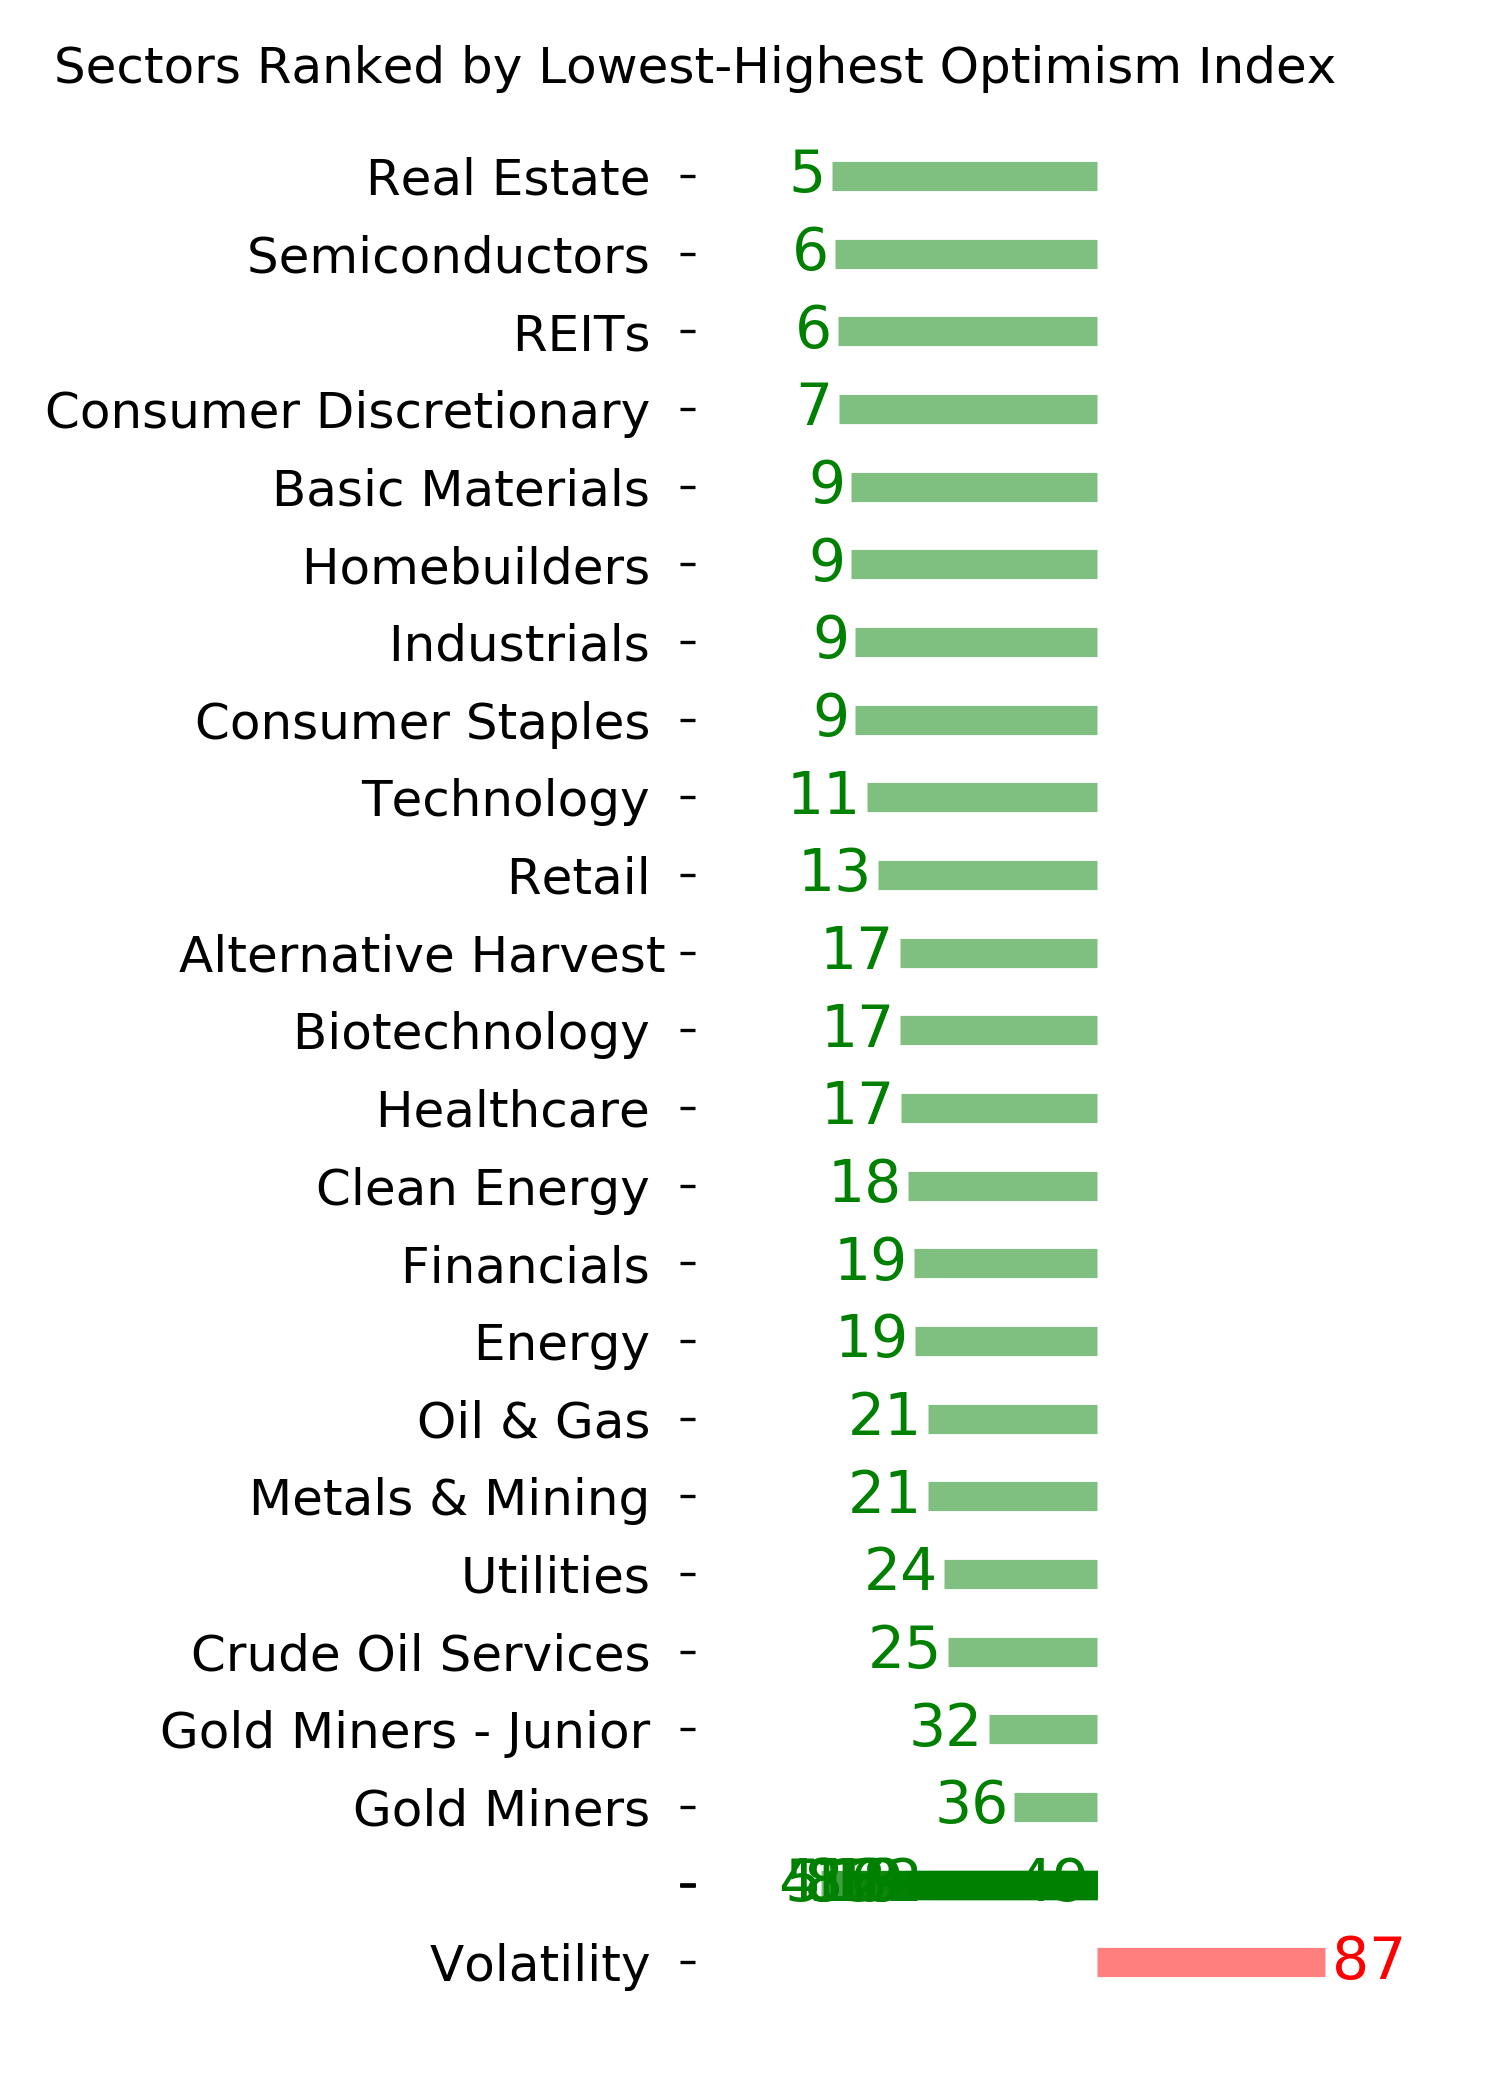
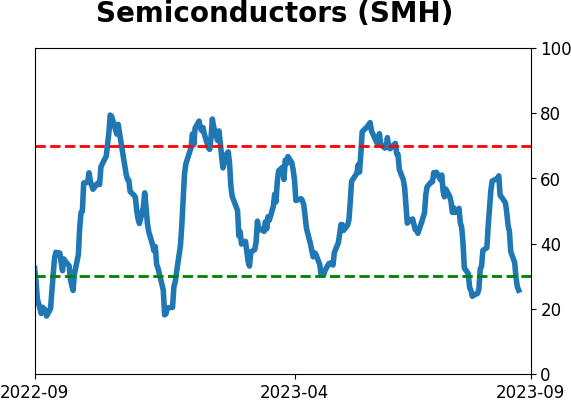
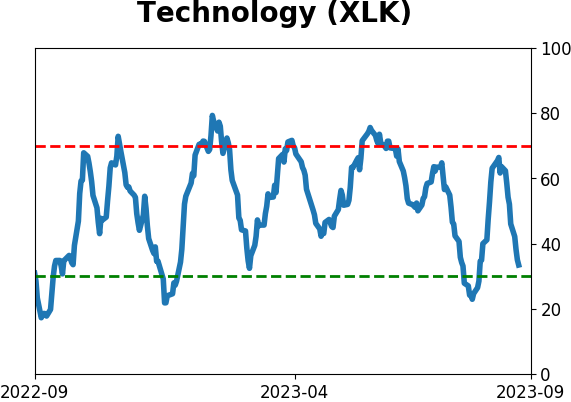
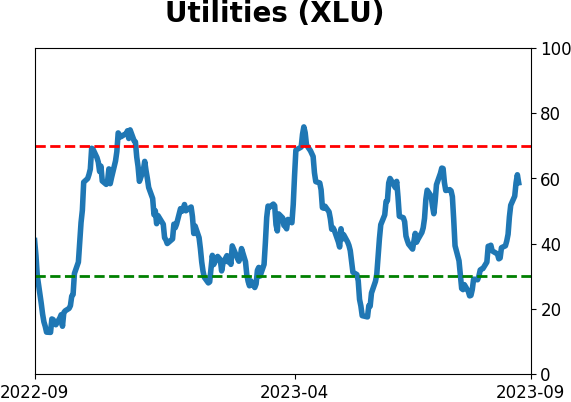
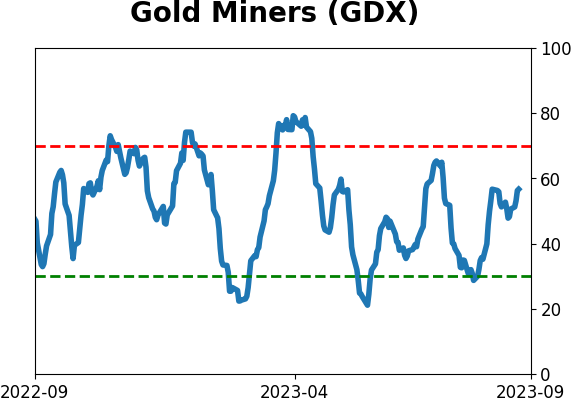
Optimism Index Thumbnails
|
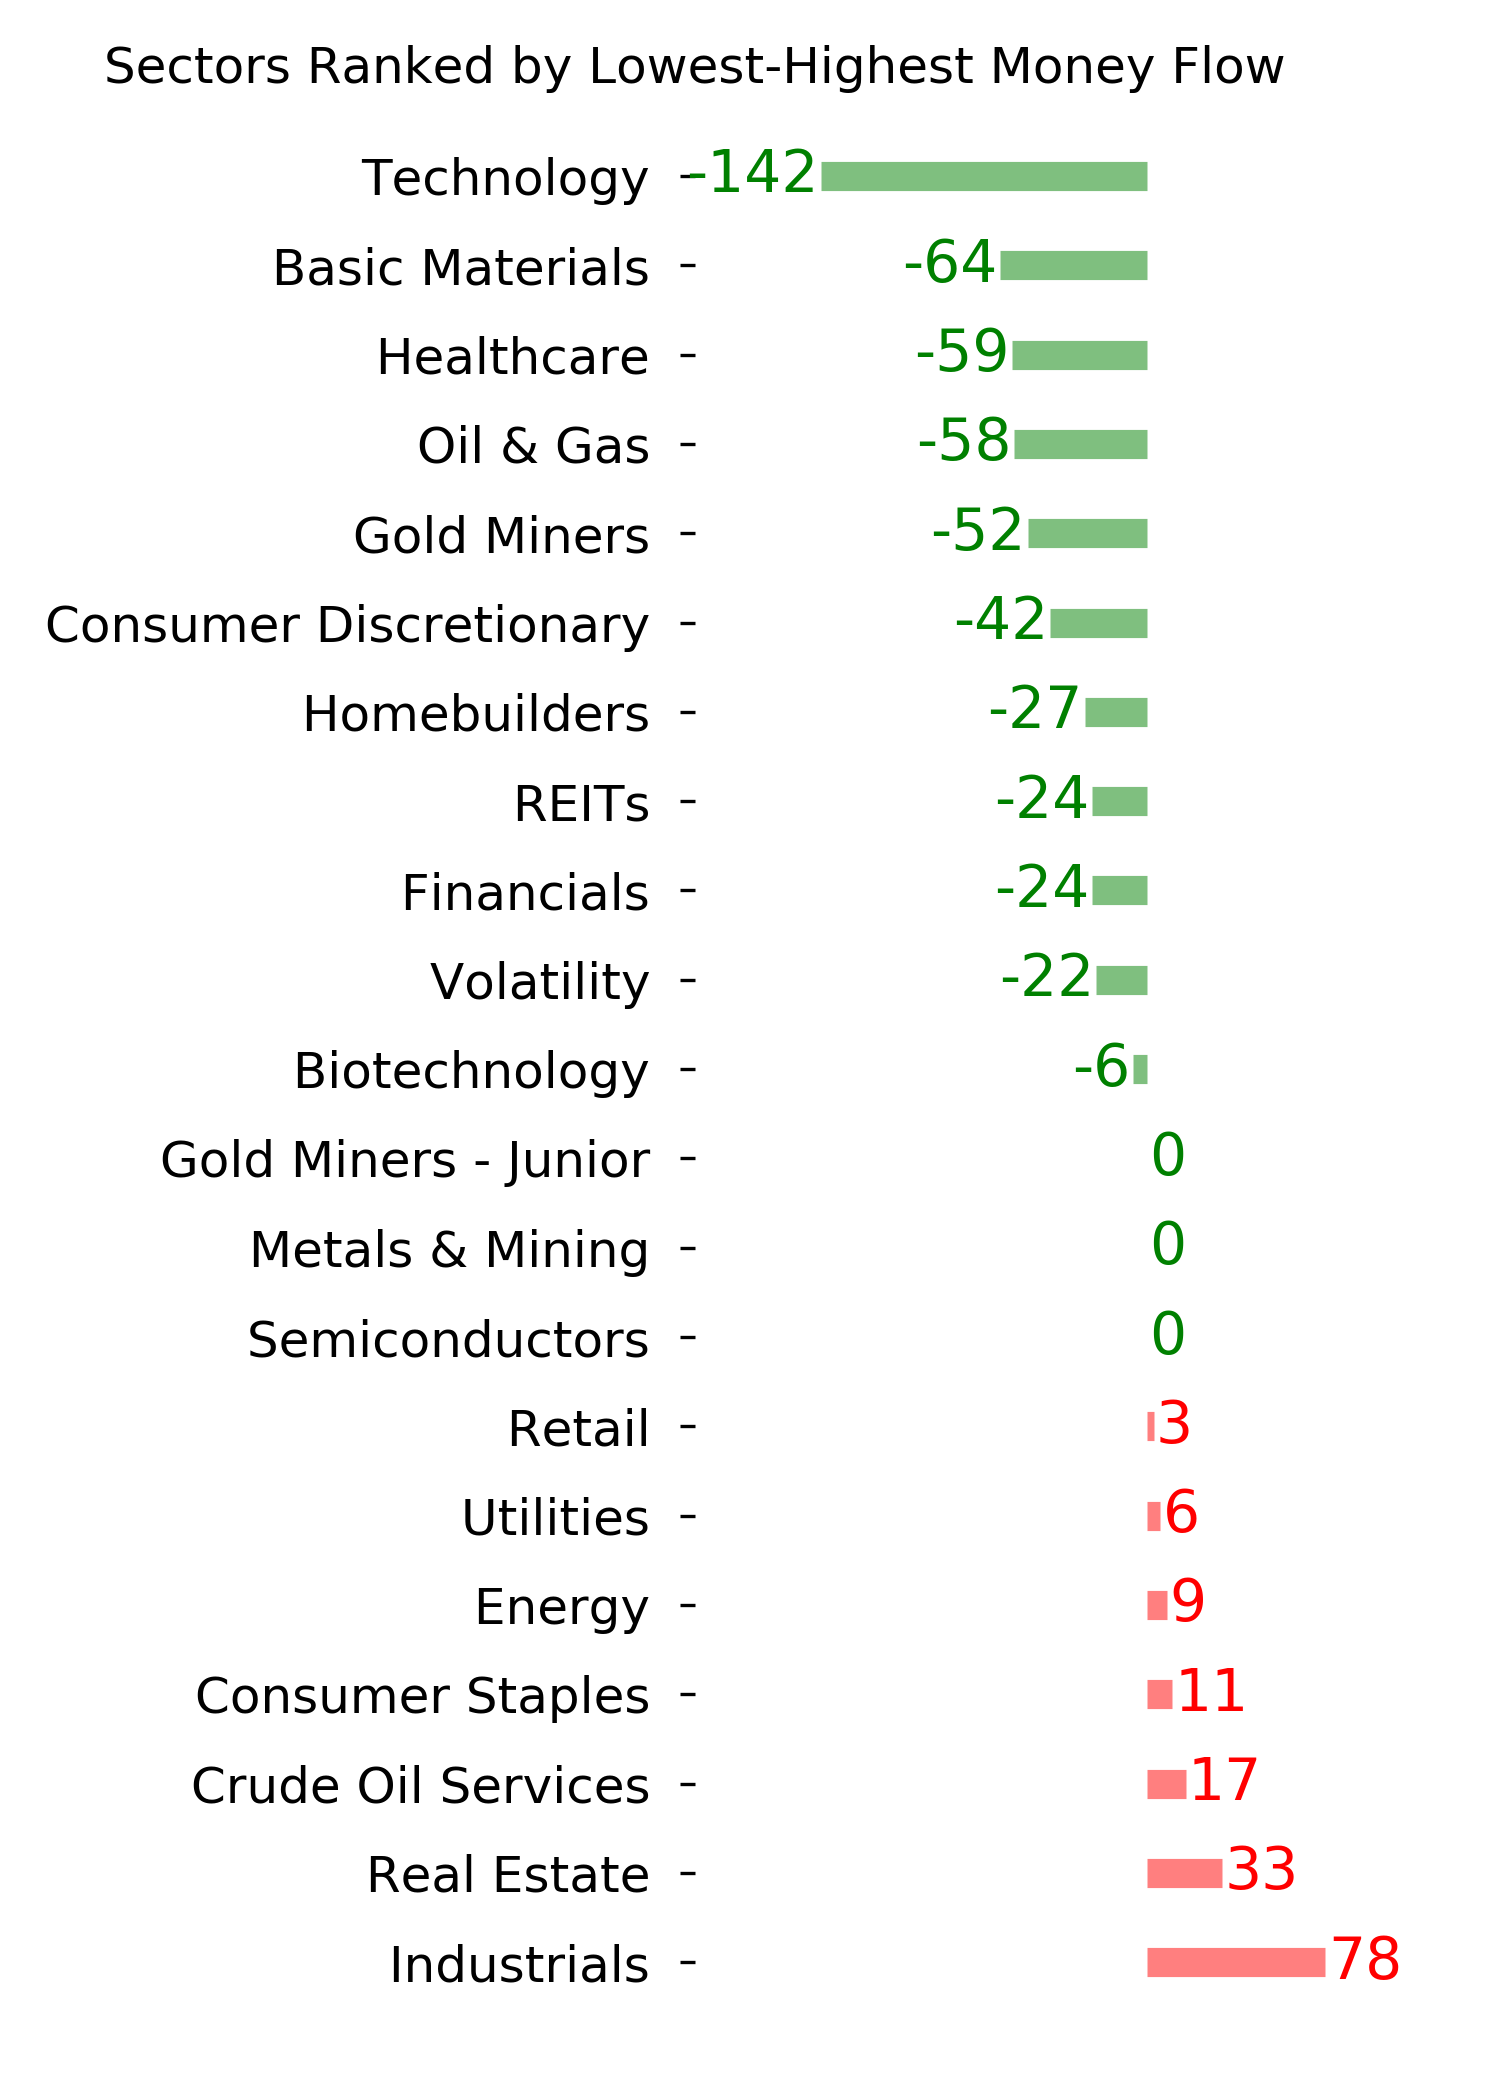
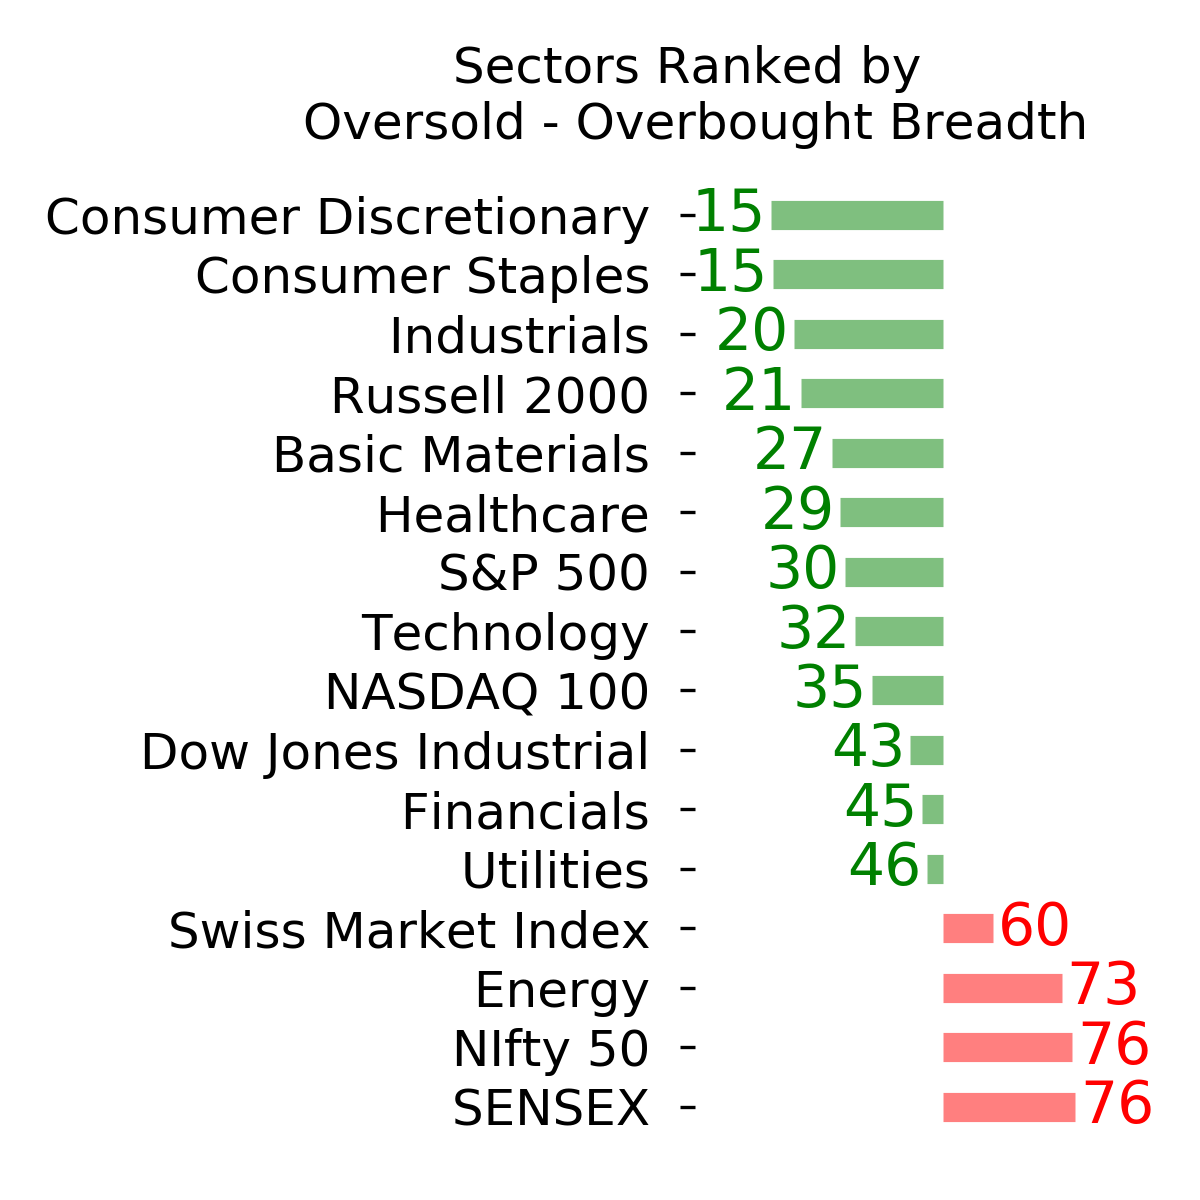
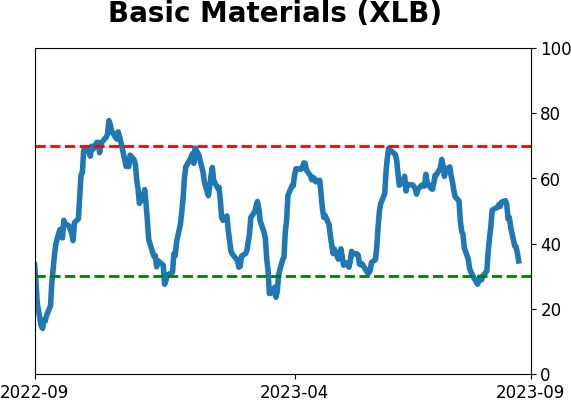
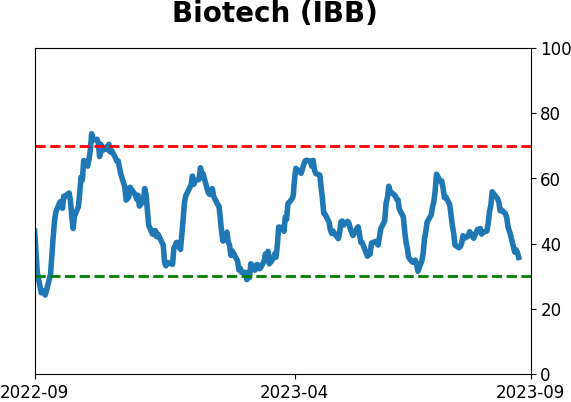
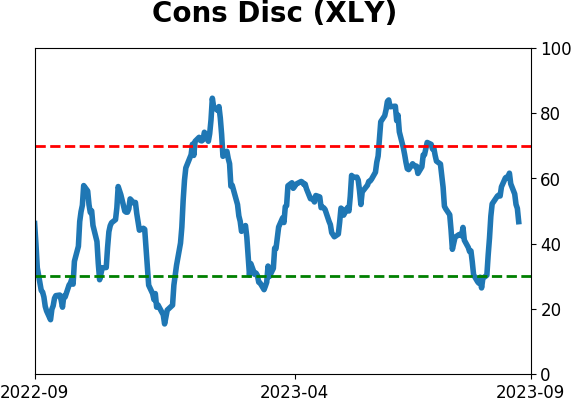
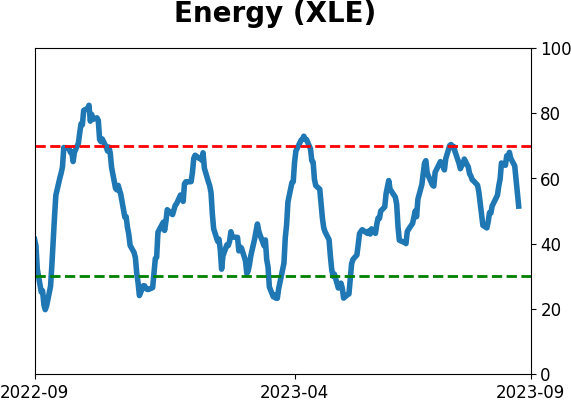
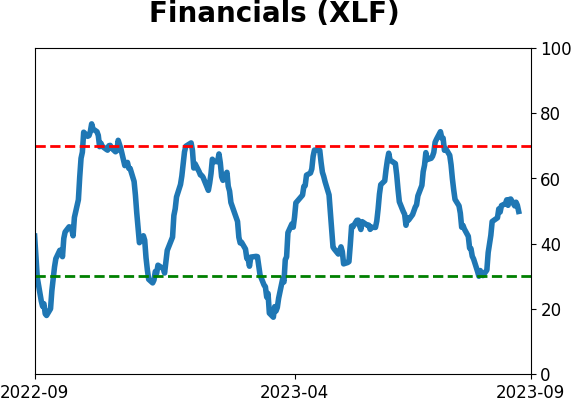
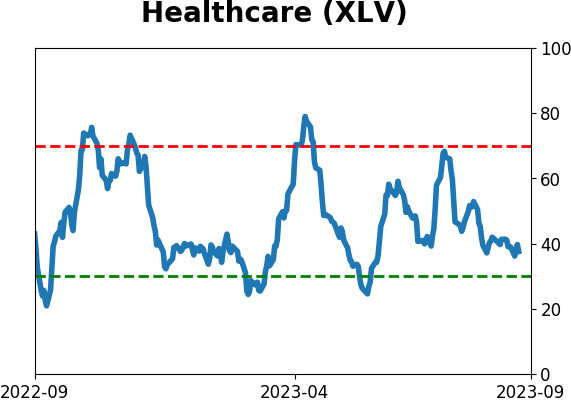
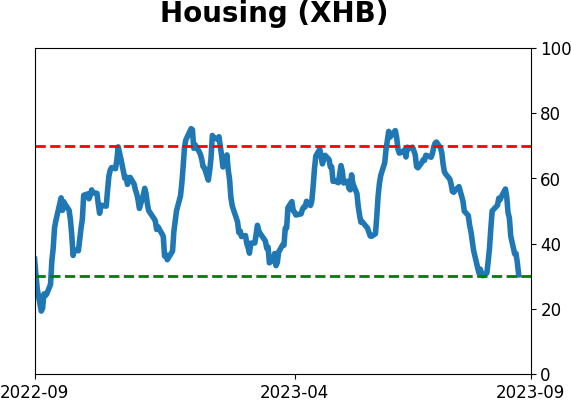
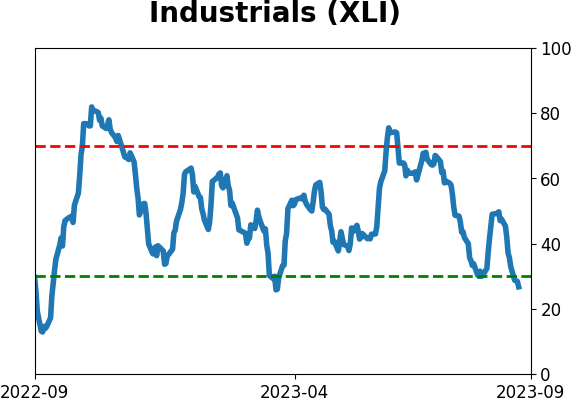
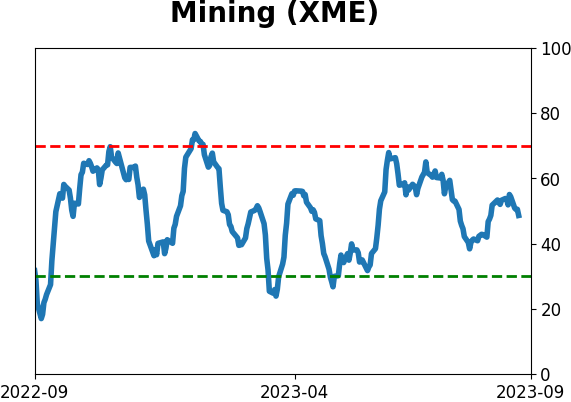
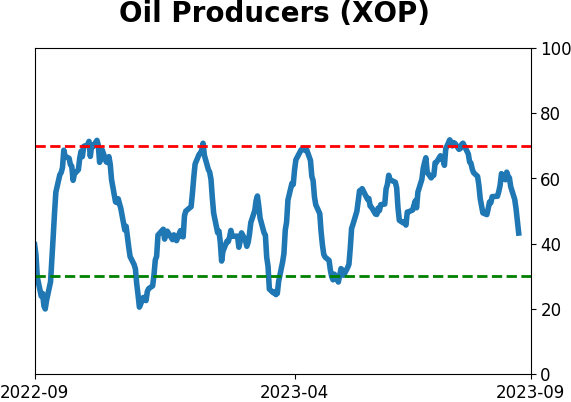
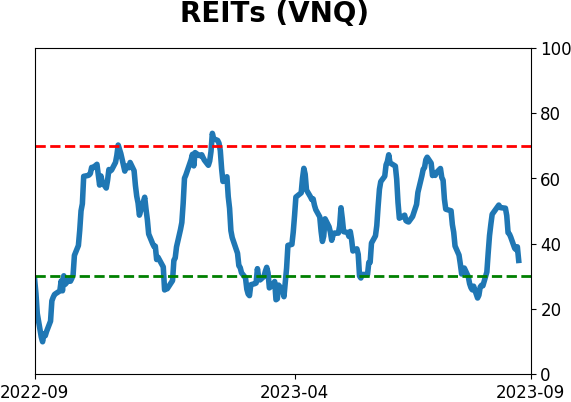
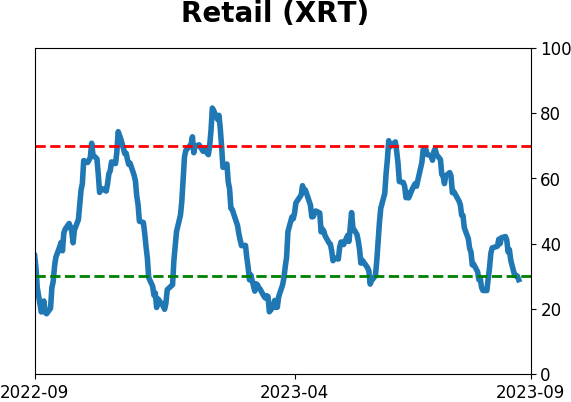
Sector ETF's - 10-Day Moving Average
|
|
|
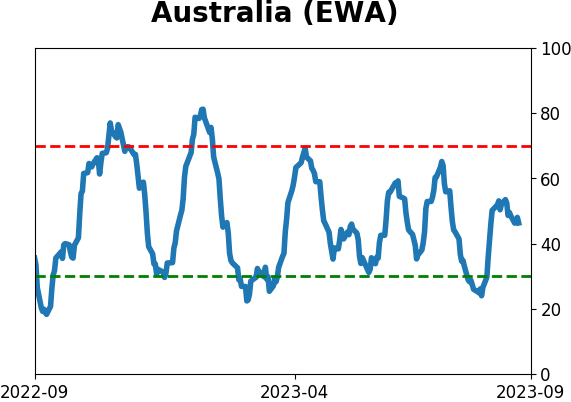
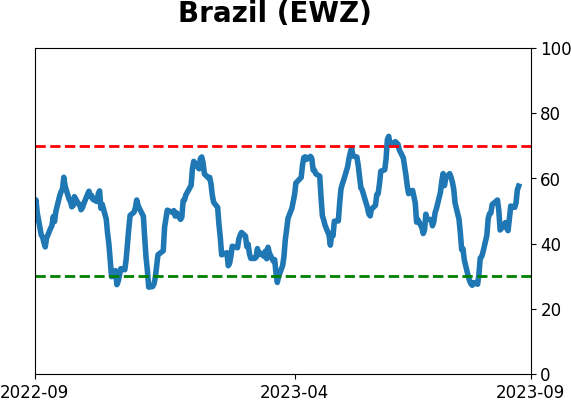
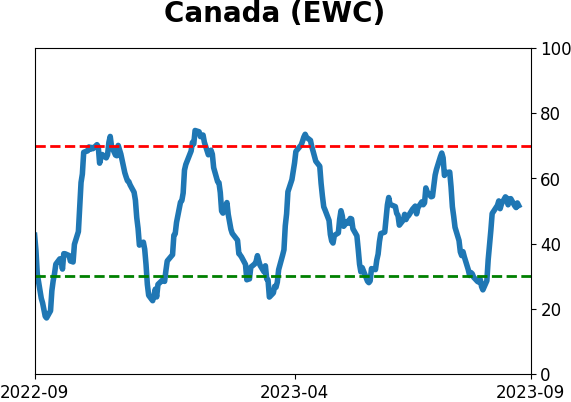
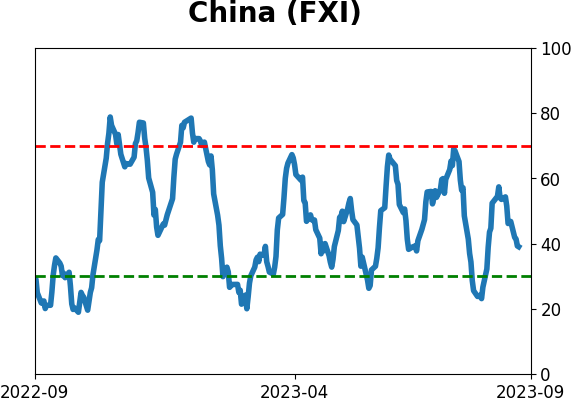
Country ETF's - 10-Day Moving Average
|
|
|
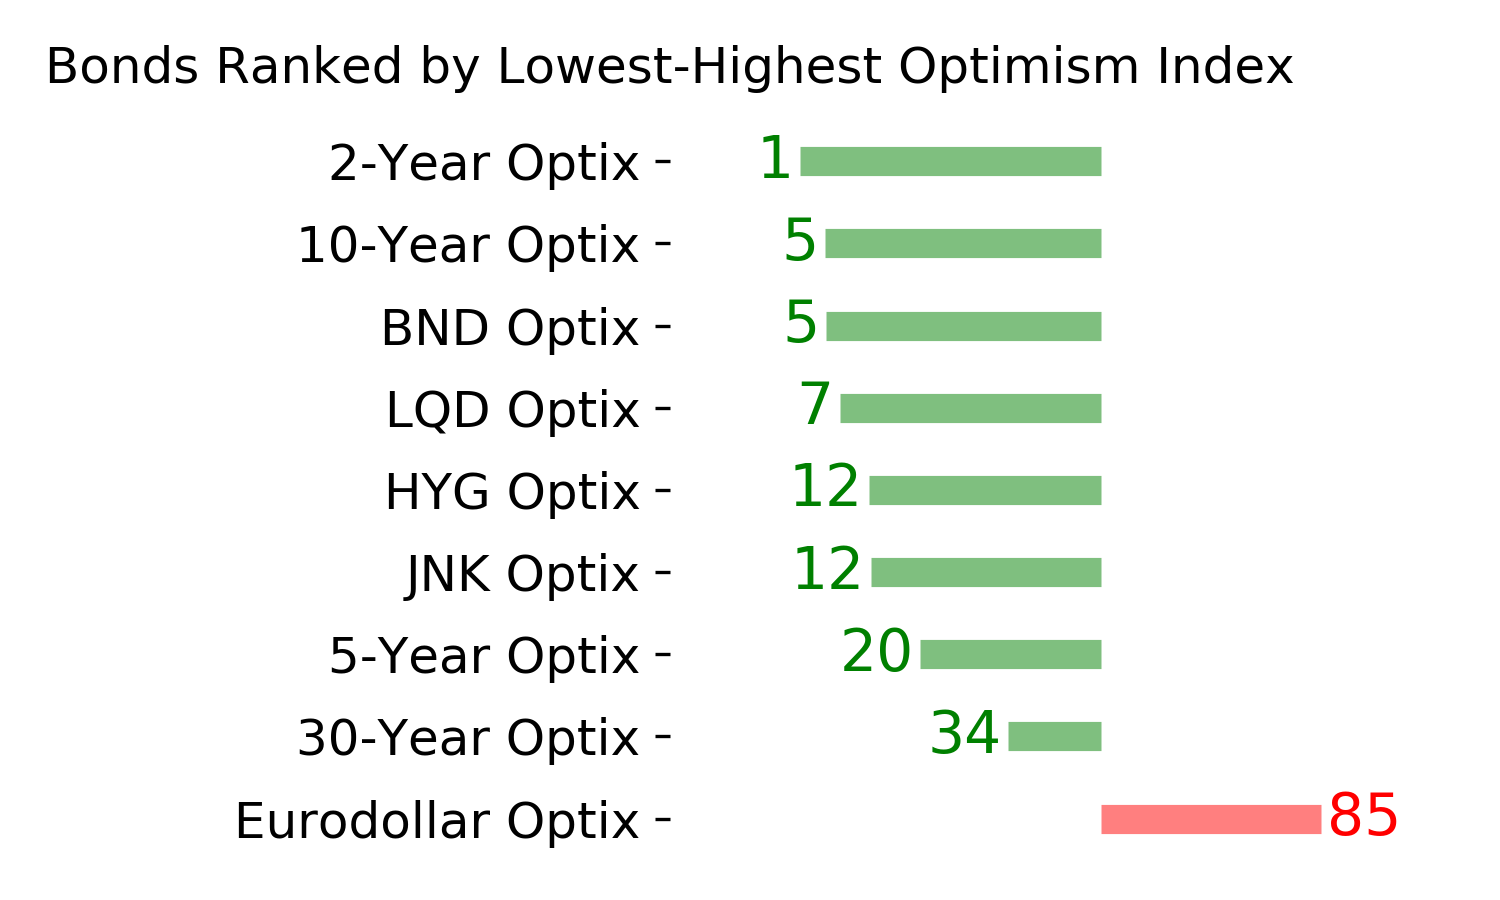
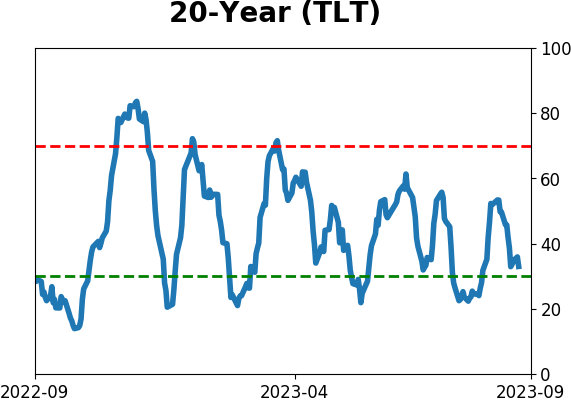
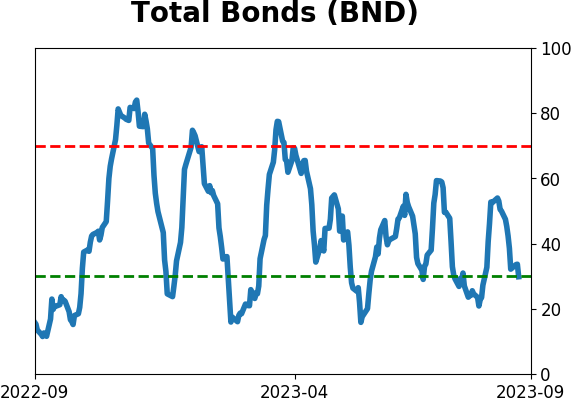
Bond ETF's - 10-Day Moving Average
|
|
|
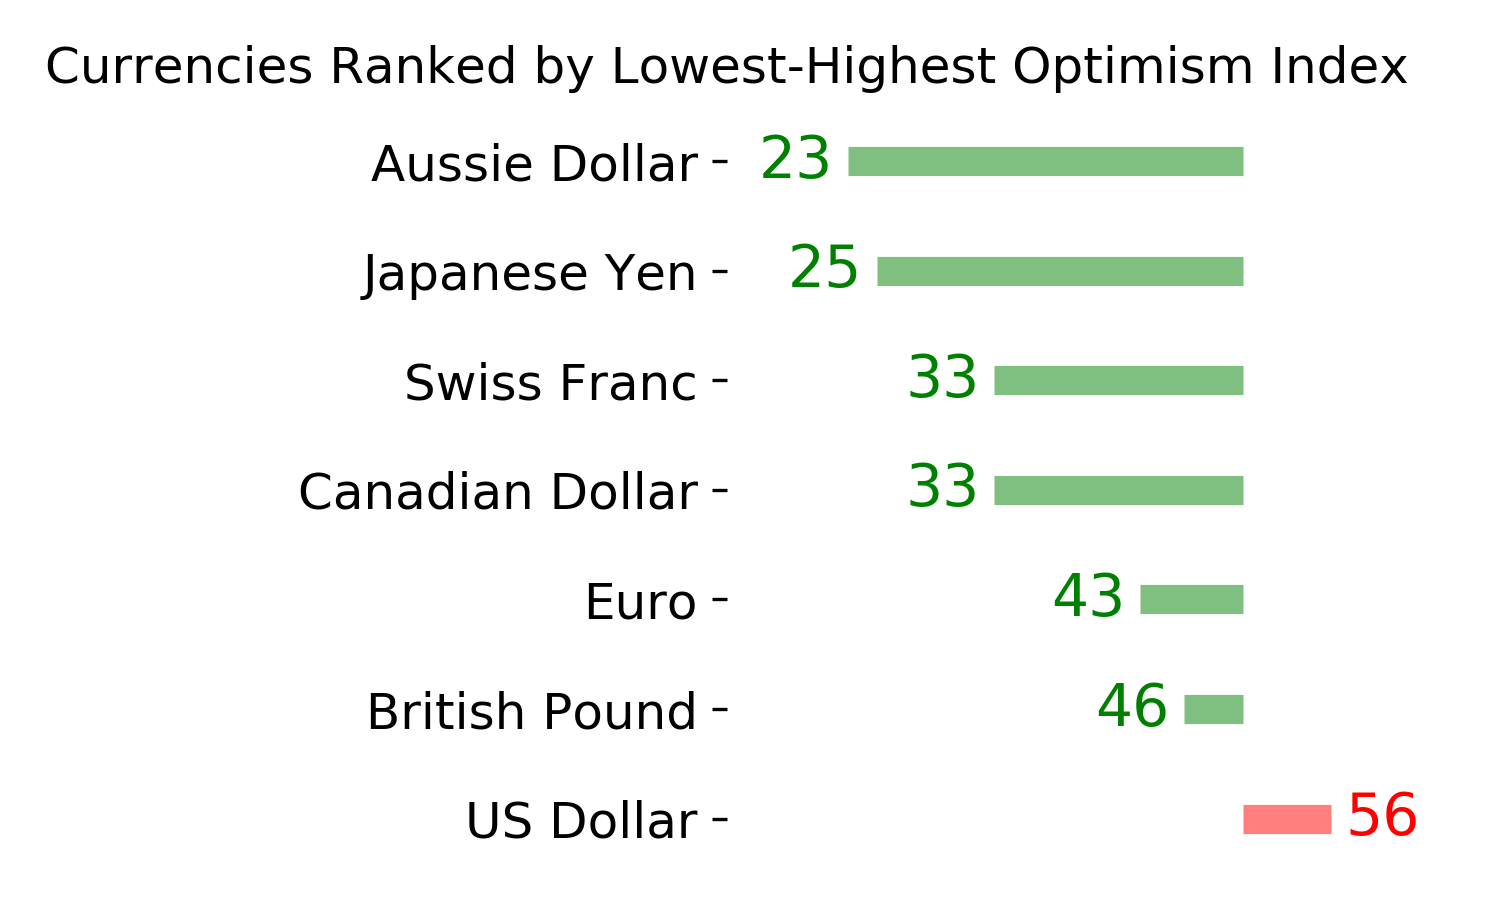
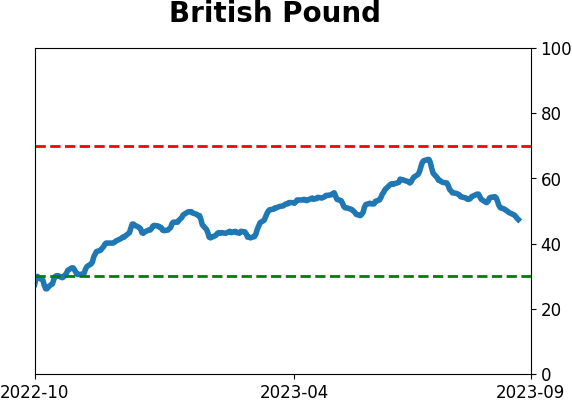
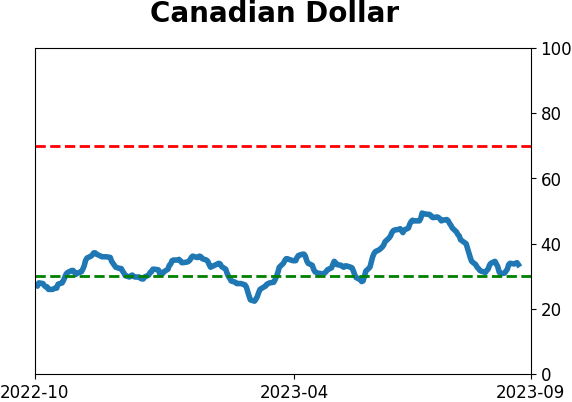
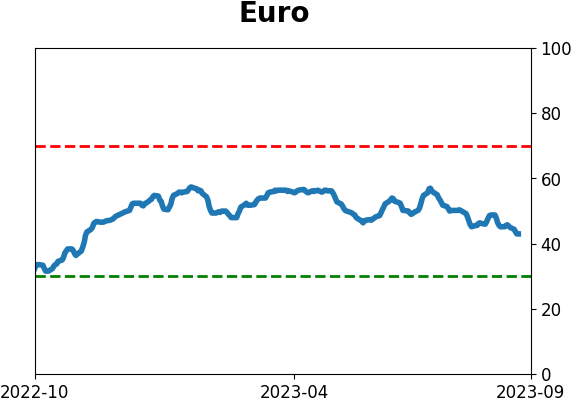
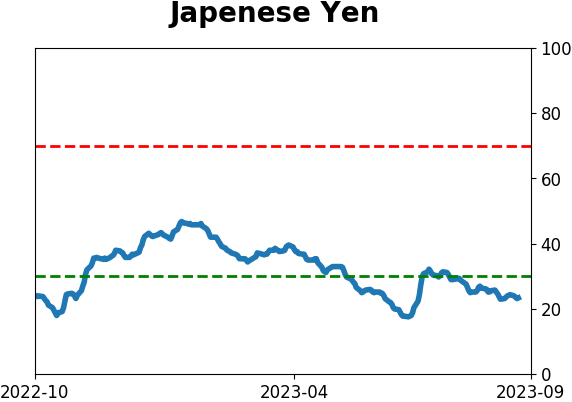
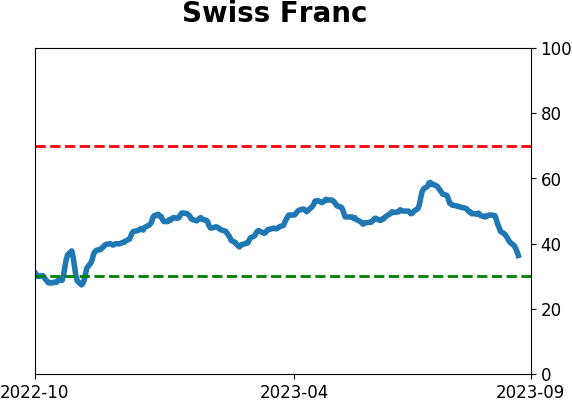
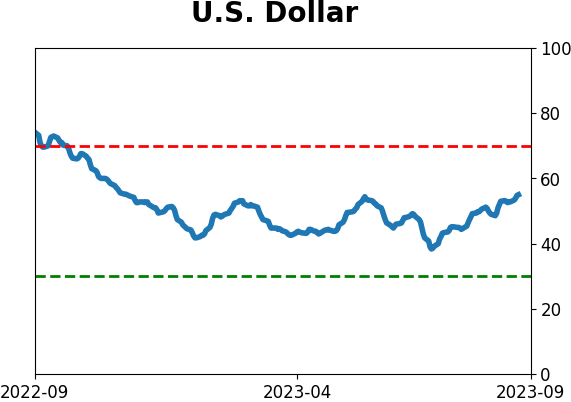
Currency ETF's - 5-Day Moving Average
|
|
|
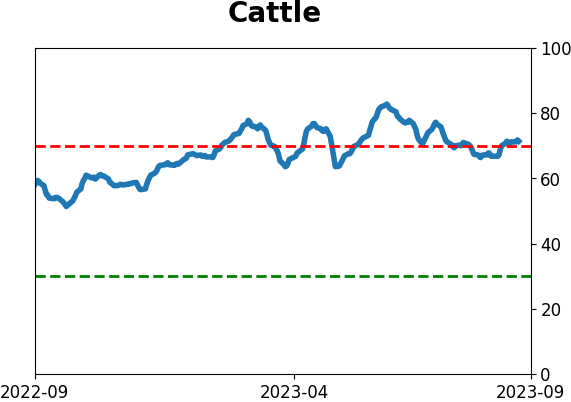
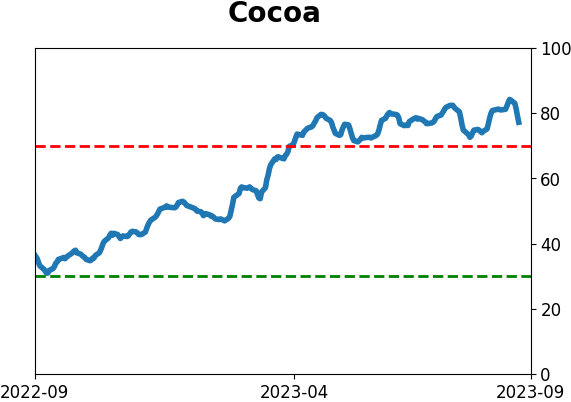
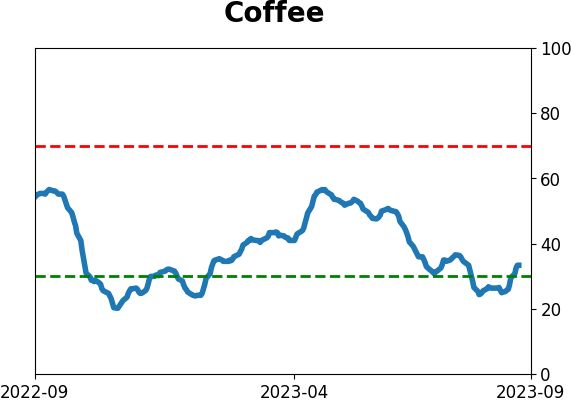
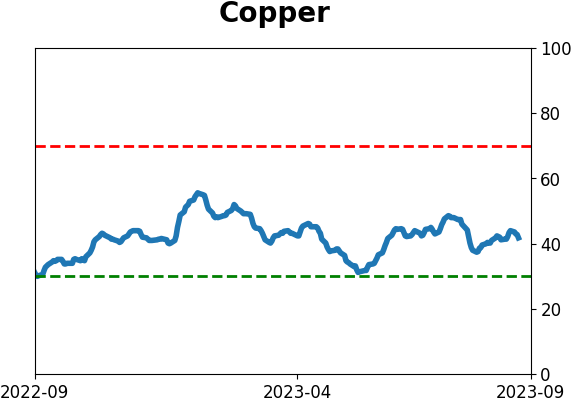
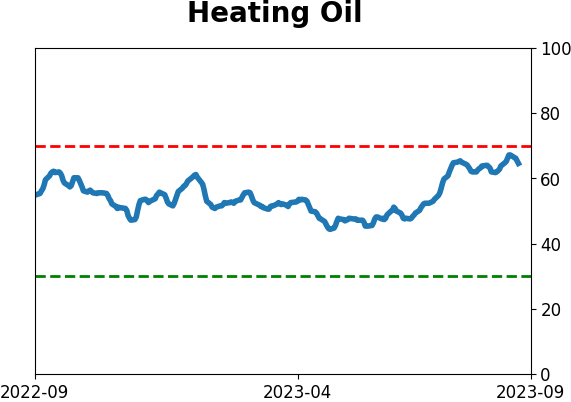
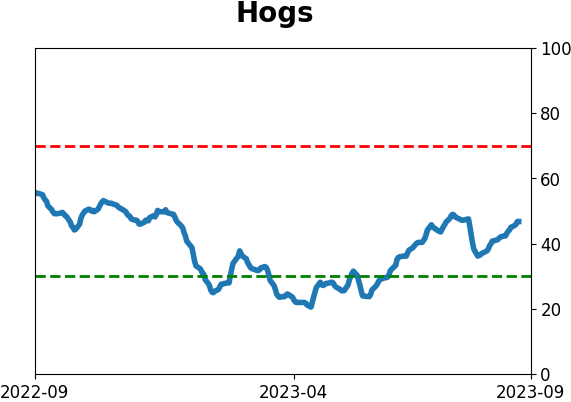
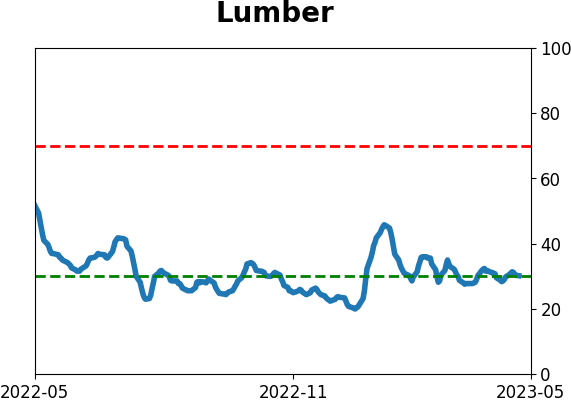
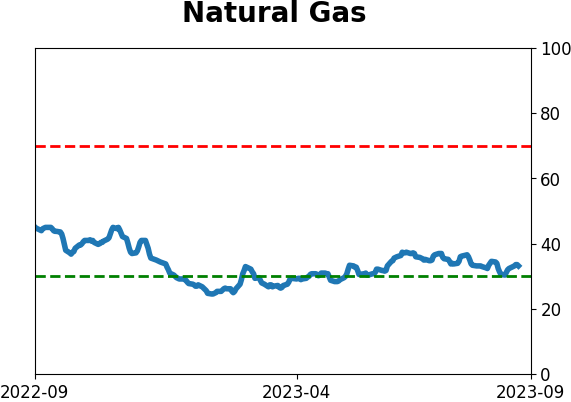
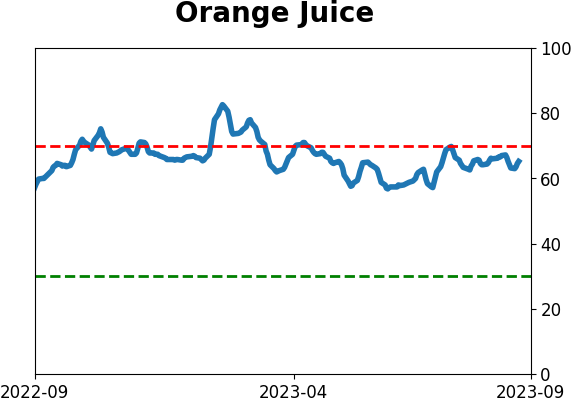
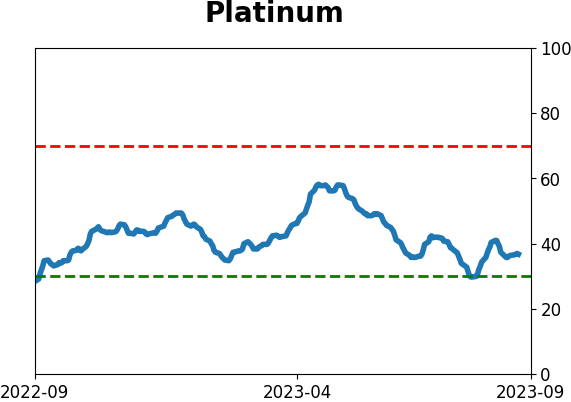
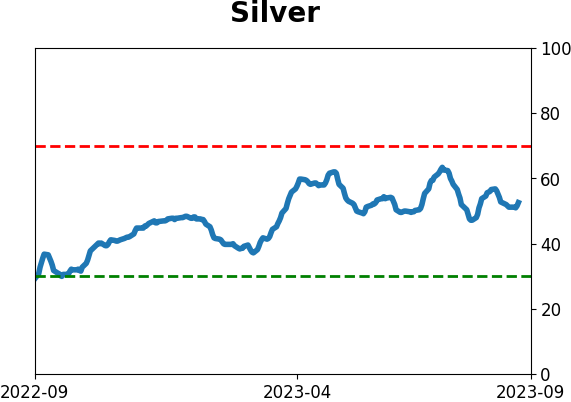
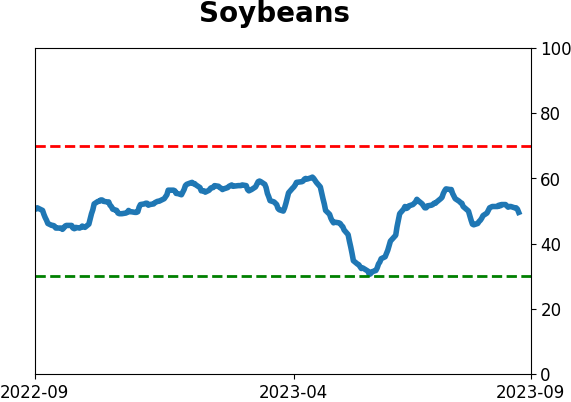
Commodity ETF's - 5-Day Moving Average
|
|