Headlines
|
|
Three months in, an odd mix of leading sectors:
Three months after the S&P 500 bottomed in June, an unusual mix of leaders and laggards has emerged. Discretionary stocks don't often lead along with Utilities, but that's what we've seen. An analysis of most-correlated bottoms shows this isn't necessary a bad thing, and the inverse hasn't been a good thing.
|
Smart / Dumb Money Confidence
|
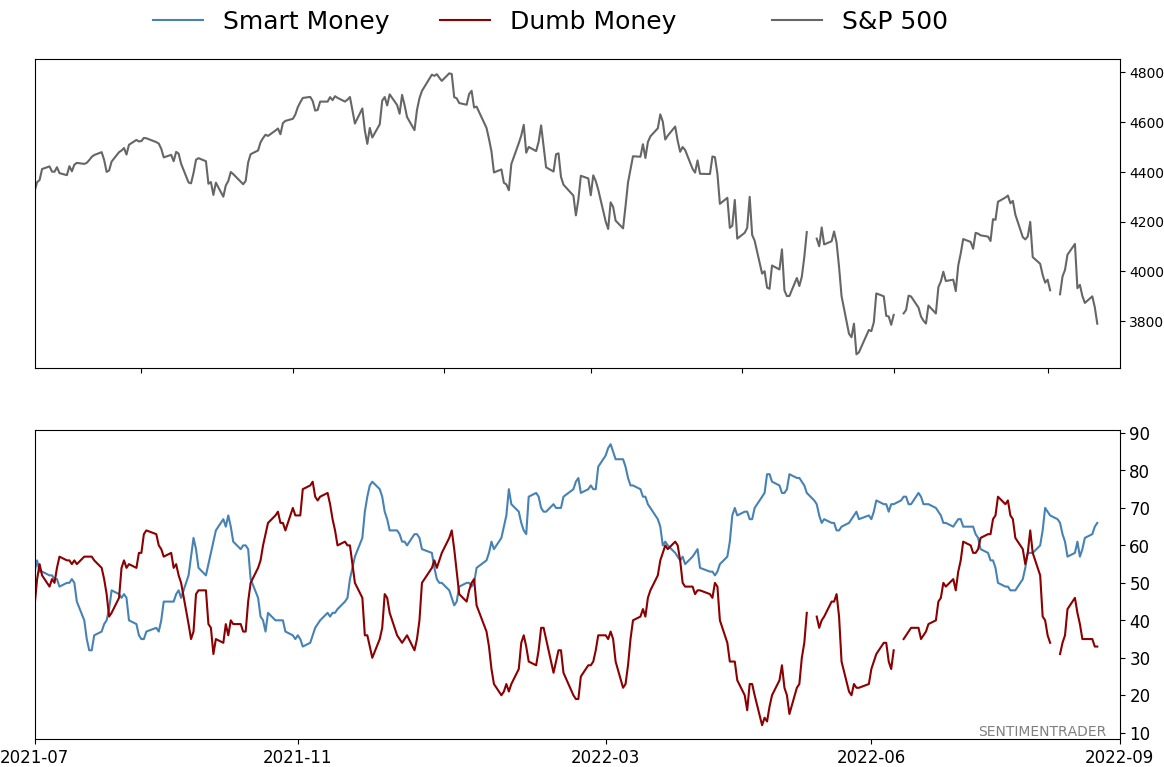
Smart Money Confidence: 66%
Dumb Money Confidence: 33%
|
|
Risk Levels
Stocks Short-Term
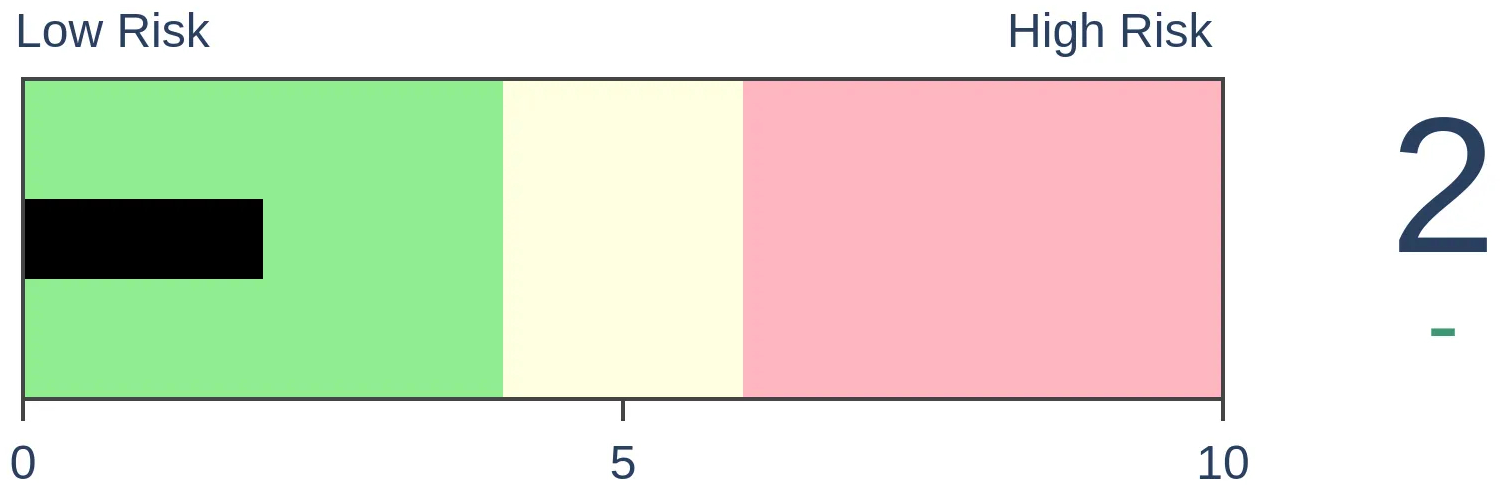
|
Stocks Medium-Term
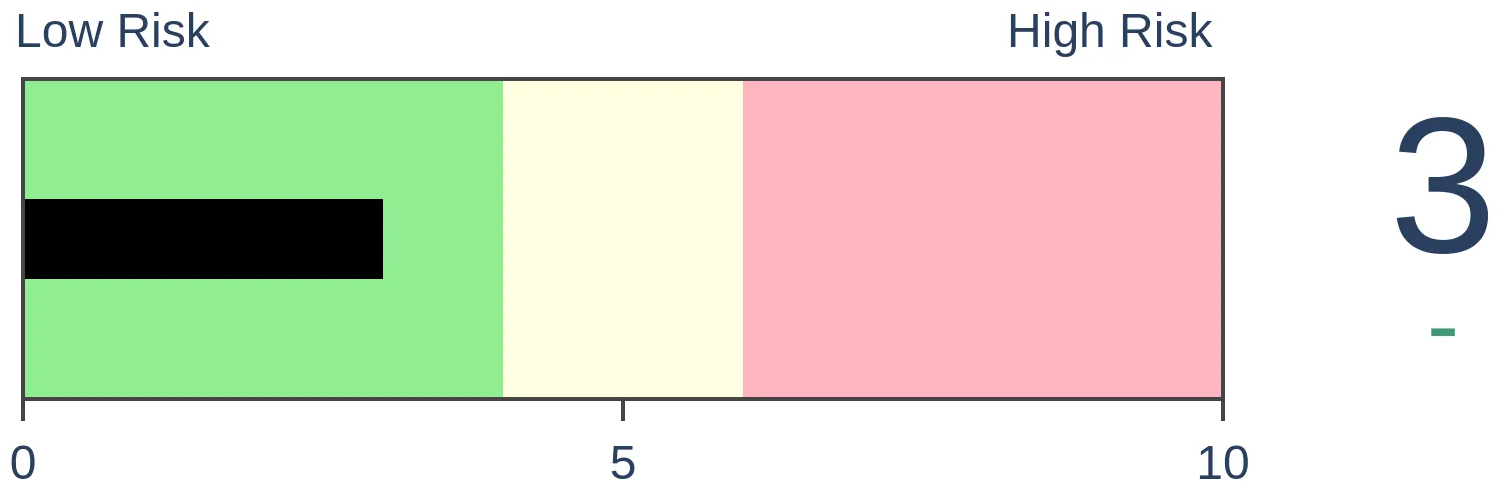
|
|
Bonds
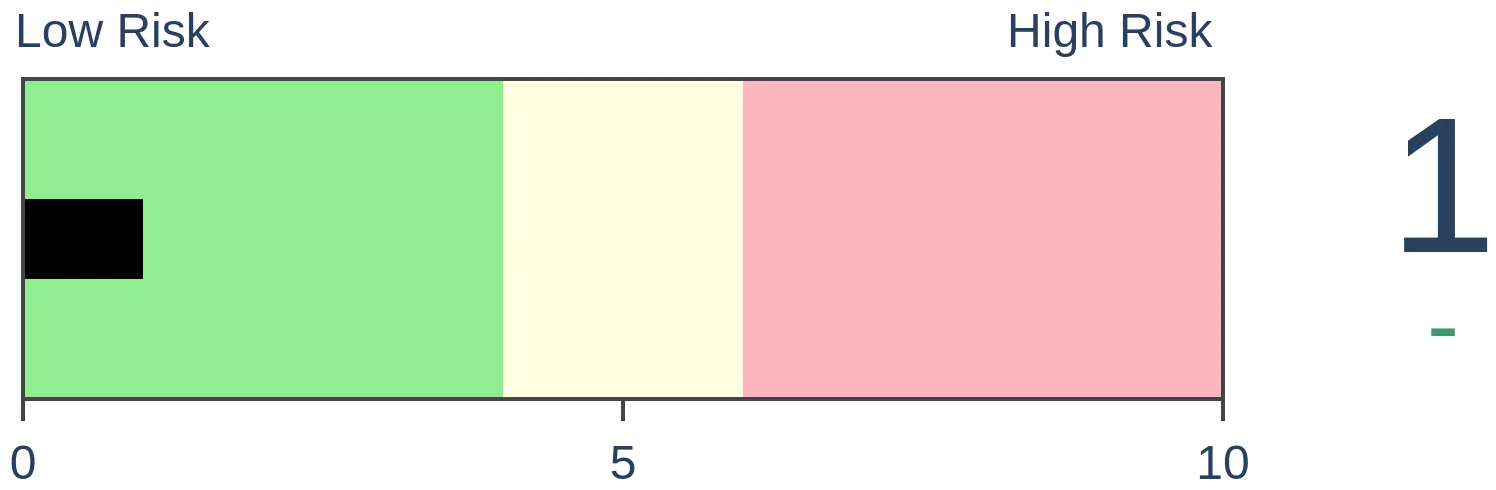
|
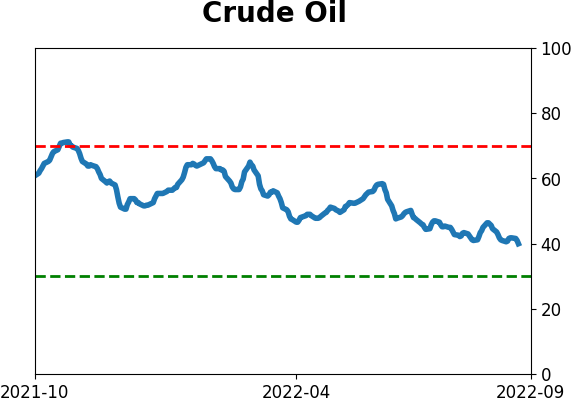
Crude Oil

|
|
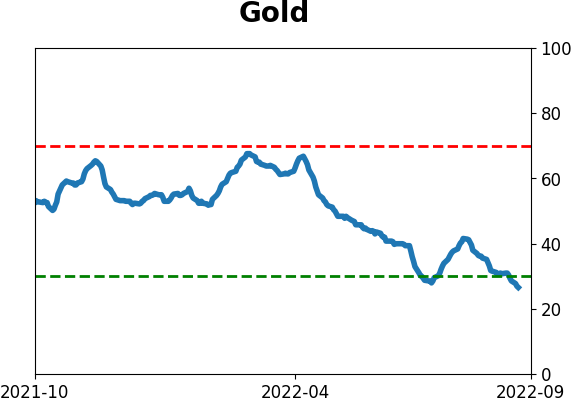
Gold
|
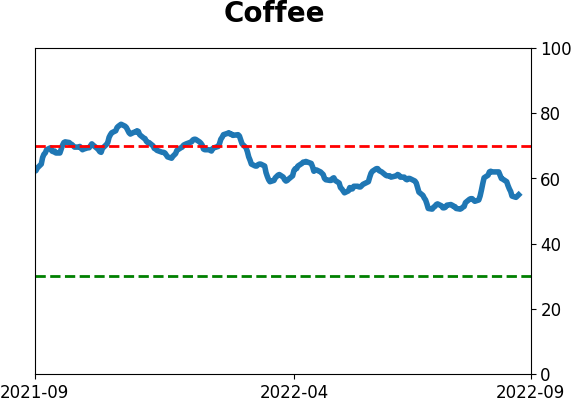
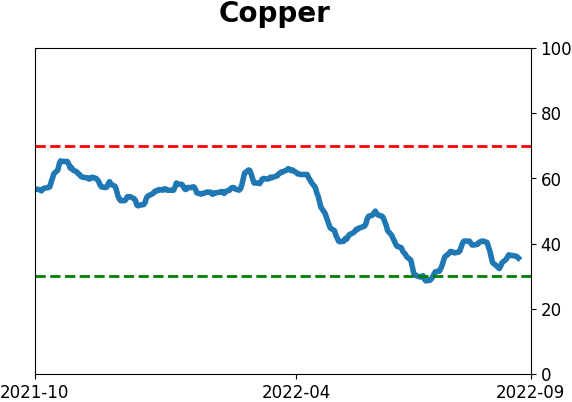
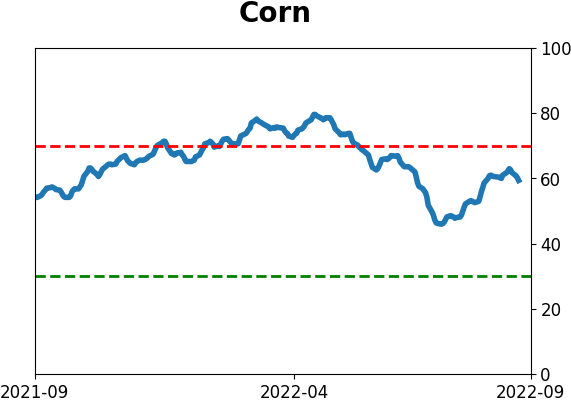
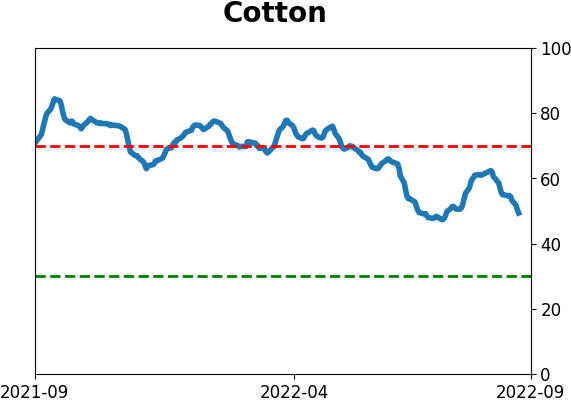
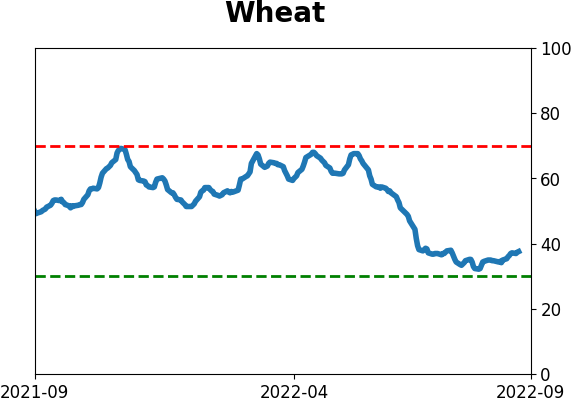
Agriculture
|
|
Research
By Jason Goepfert
BOTTOM LINE
Three months after the S&P 500 bottomed in June, an unusual mix of leaders and laggards has emerged. Discretionary stocks don't often lead along with Utilities, but that's what we've seen. An analysis of most-correlated bottoms shows this isn't necessary a bad thing, and the inverse hasn't been a good thing.
FORECAST / TIMEFRAME
None
|
Key points:
- Three months after stocks bottomed, an odd mix of sectors and factors are leading/lagging
- The most-similar mix of leaders/laggards tended to lead to more gains
- The least-correlated three-month sector and factor performance tended to see weaker forward returns
Three months after the low, an unusual mix of sector leaders
It's been 65 days since the June 16 bottom. And the focus of investors has been...interesting.
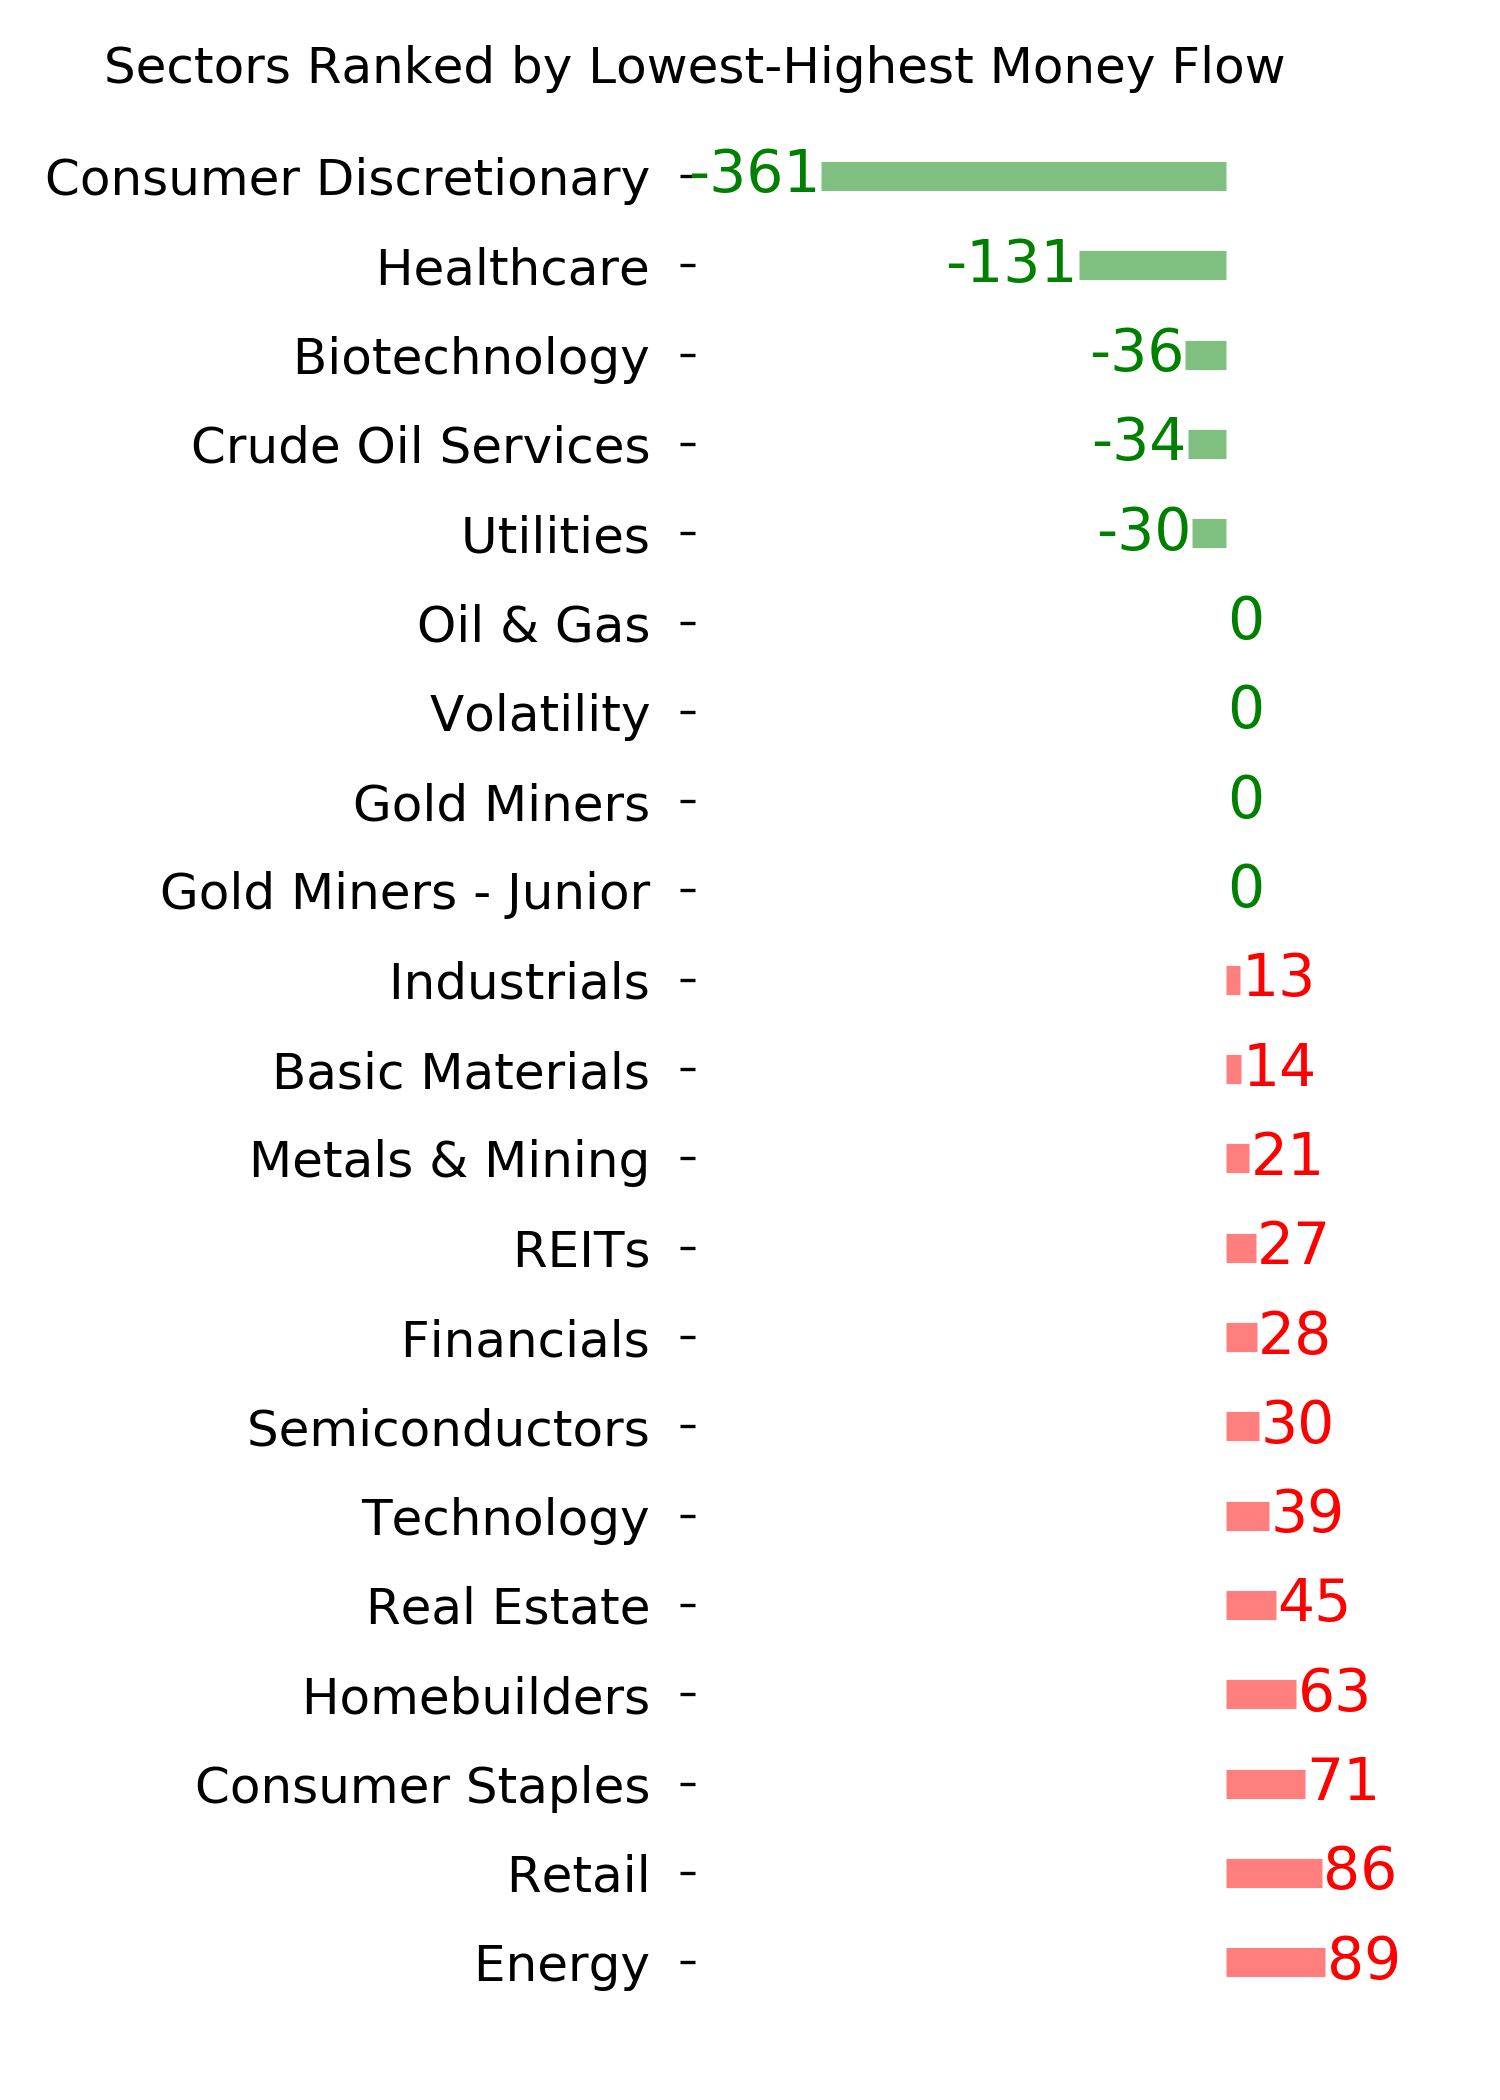
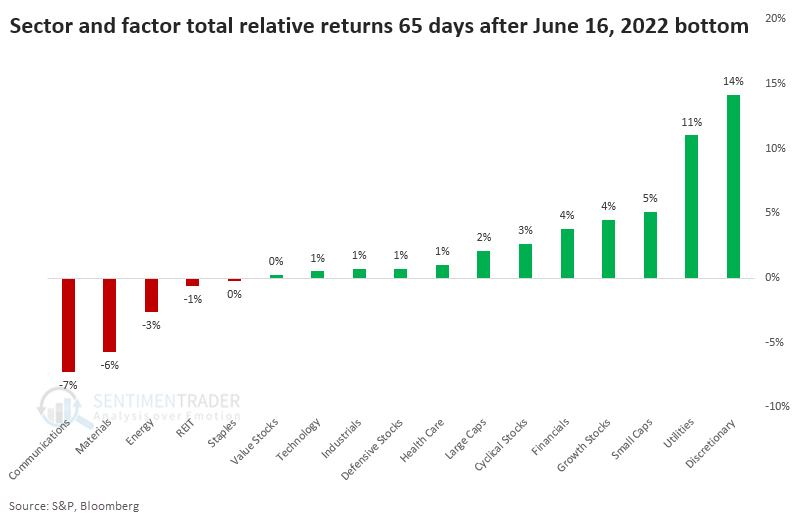
Consumer Discretionary stocks have sported the best return, along with Utilities, of all things. Bringing up the bottom of the sectors and factors we watch are Communications and Materials.
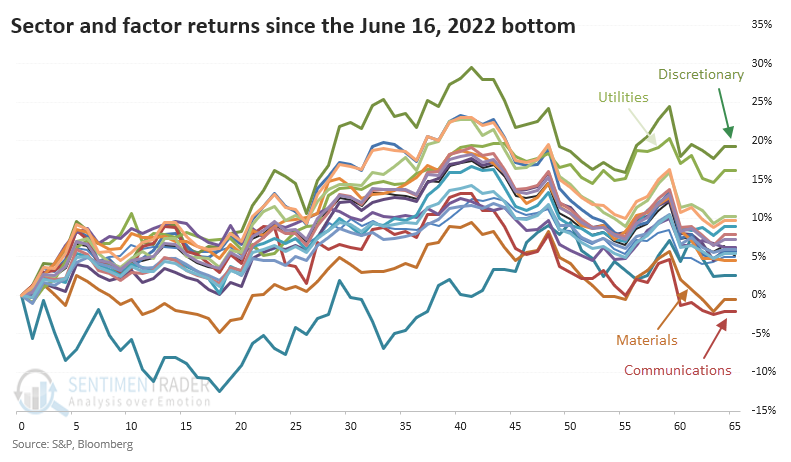
Relative to the S&P 500's return, Discretionary and Utility stocks have far outpaced the index and other sectors and factors.
Bottoms like this have tended to do okay
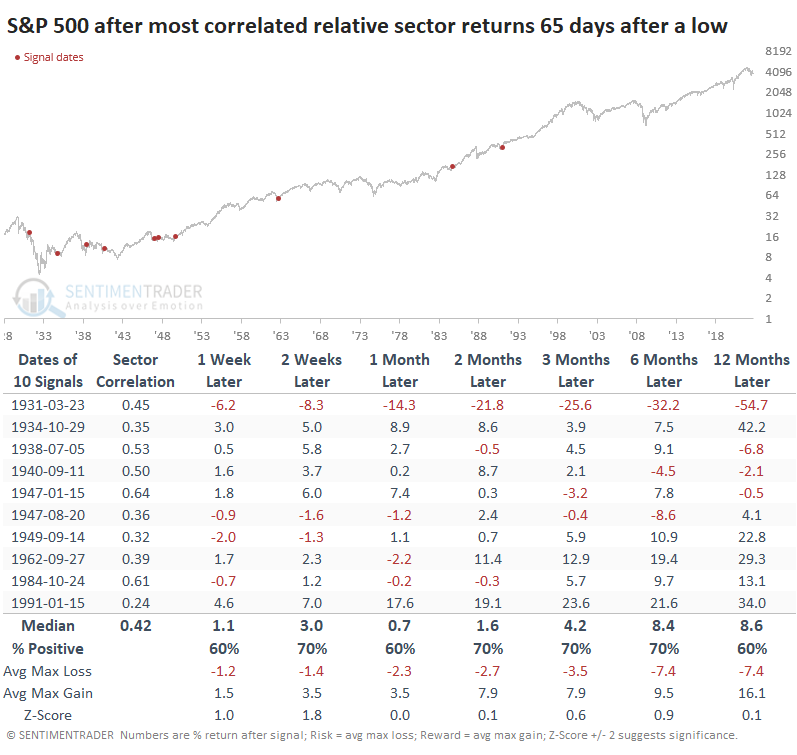
Macro folks like to point out Utilities and insist, "This is not what new bull markets are made of!" To see if that has merit, we'll go back to 1928 and look at how major sectors and factors performed relative to the S&P 500 during the first 65 days of a rally from a 252-day low.
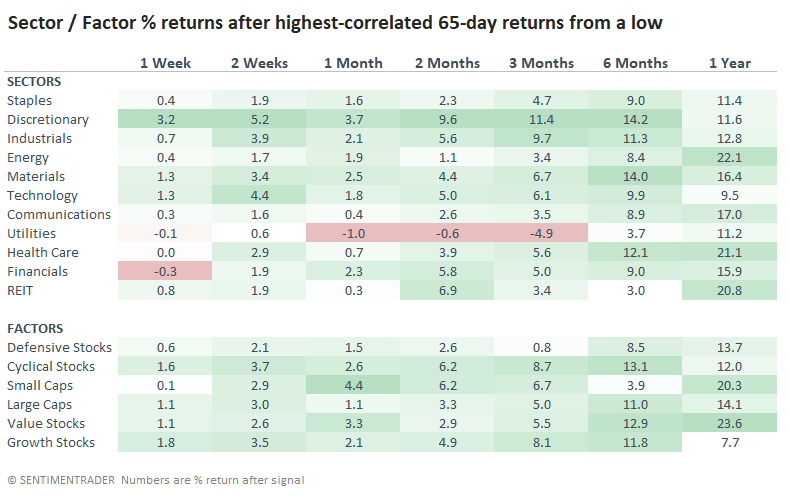
The ten bottoms with the highest correlation are shown in the table below. The highest-correlated sector and factor performance occurred in the first three months of the lows in 1984, 1947, and 1938. Those didn't lead to great gains, but also not big losses.
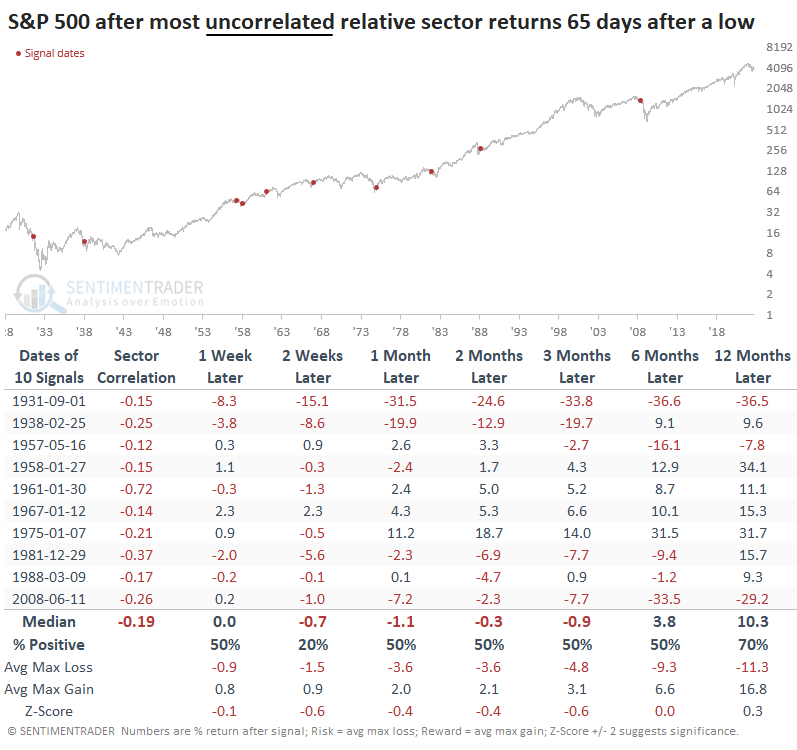
We like to look at the inverse conditions as that can help bolster confidence in a conclusion. When we look at the most inversely correlated sector and factor returns after a low, the S&P 500's returns going forward were worse. That suggests that the stocks leading now aren't necessarily the "bad" ones that increase the chances that we're just seeing a bear market rally.
As for the sectors and factors themselves, we've seen many times before that Utilities have a bear of a time holding onto significant outperformance. That tended to be the case here, as well. That was the worst-performing sector or factor by far.
What the research tells us...
It's dangerous to rely on heuristics like "Utilities don't lead new bull markets." Sometimes they do. When we objectively look at the first few months after a one-year low, the ones that most look like the last three months tended to do pretty well. Only one precedent ended up leading to large and sustained losses. But the bottoms that least looked liked the past few months ended up leading to several large losses.
Indicators at Extremes
Phase Table
Ranks
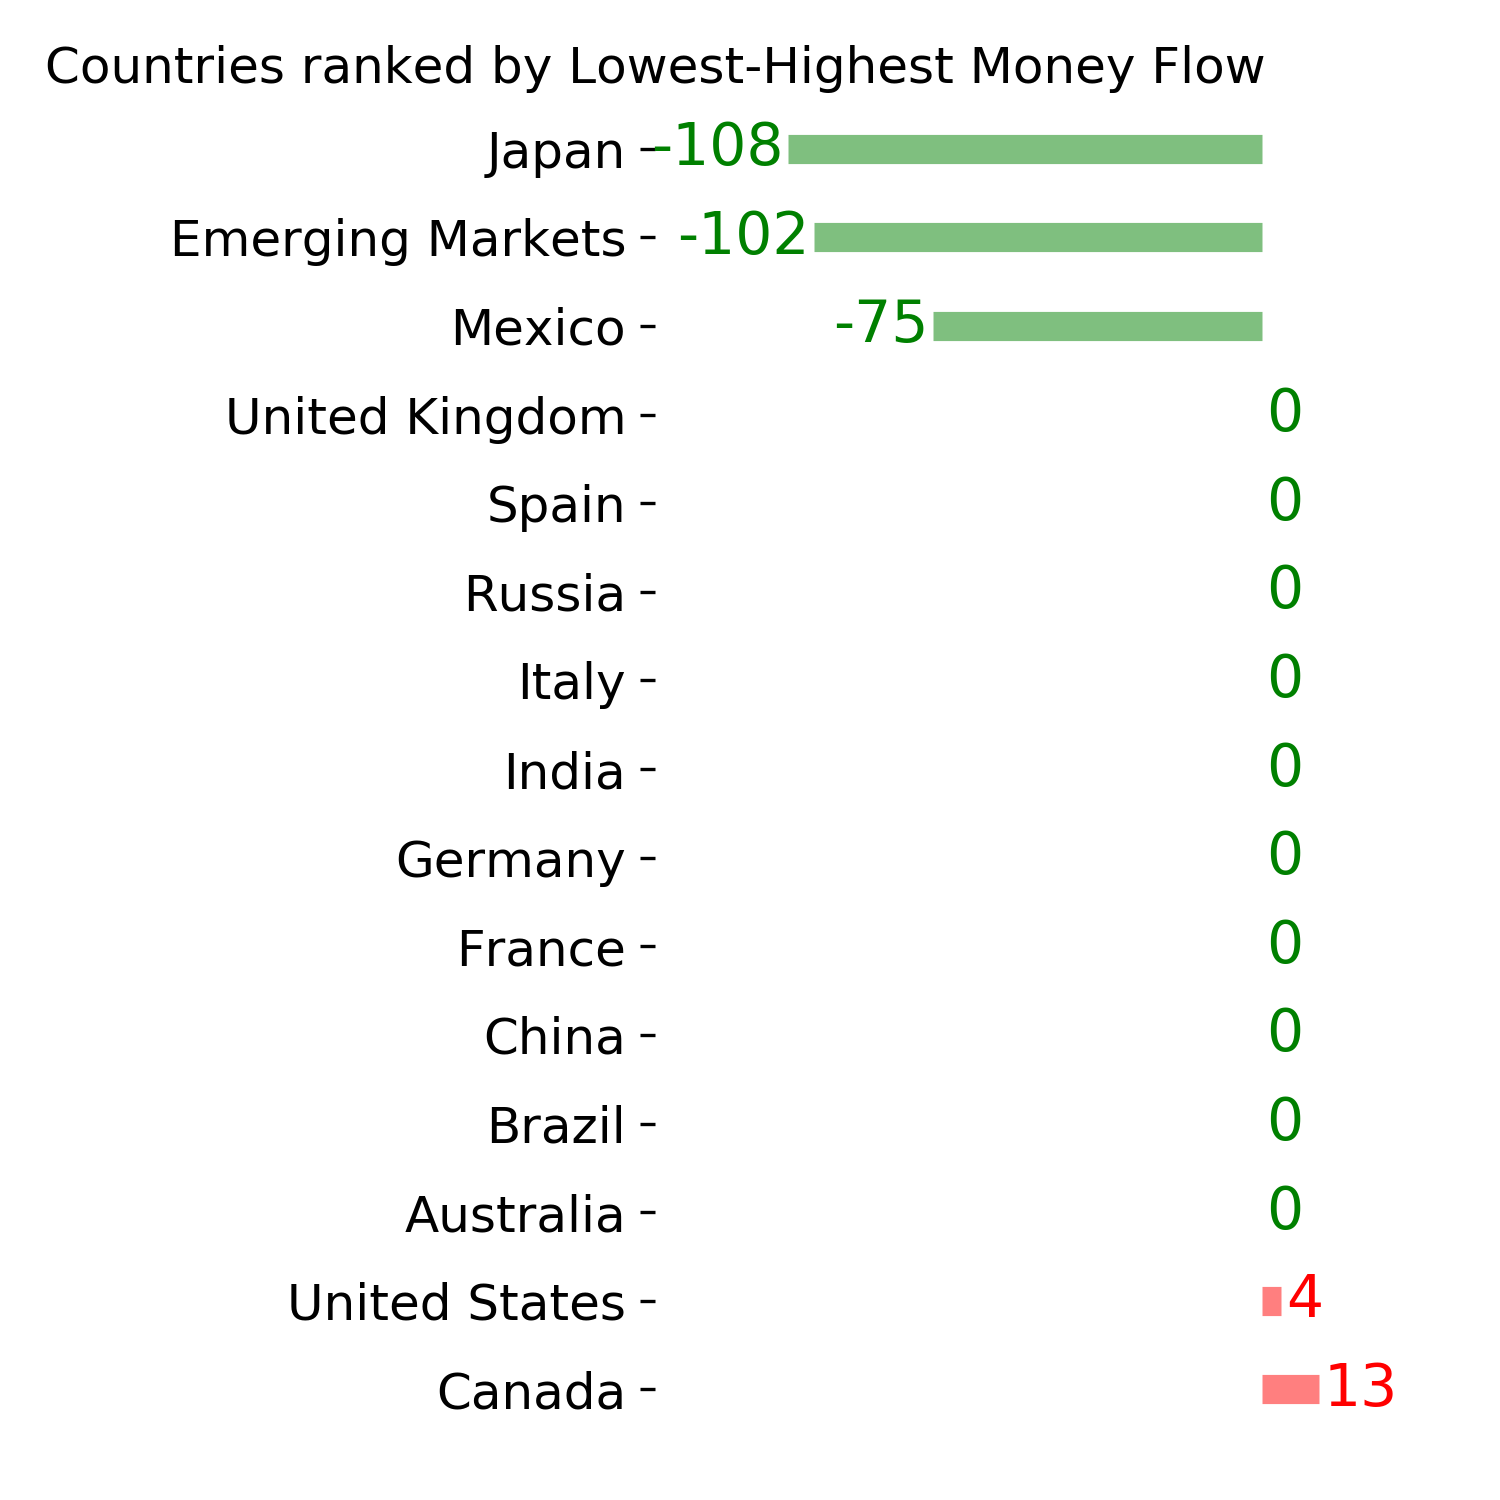
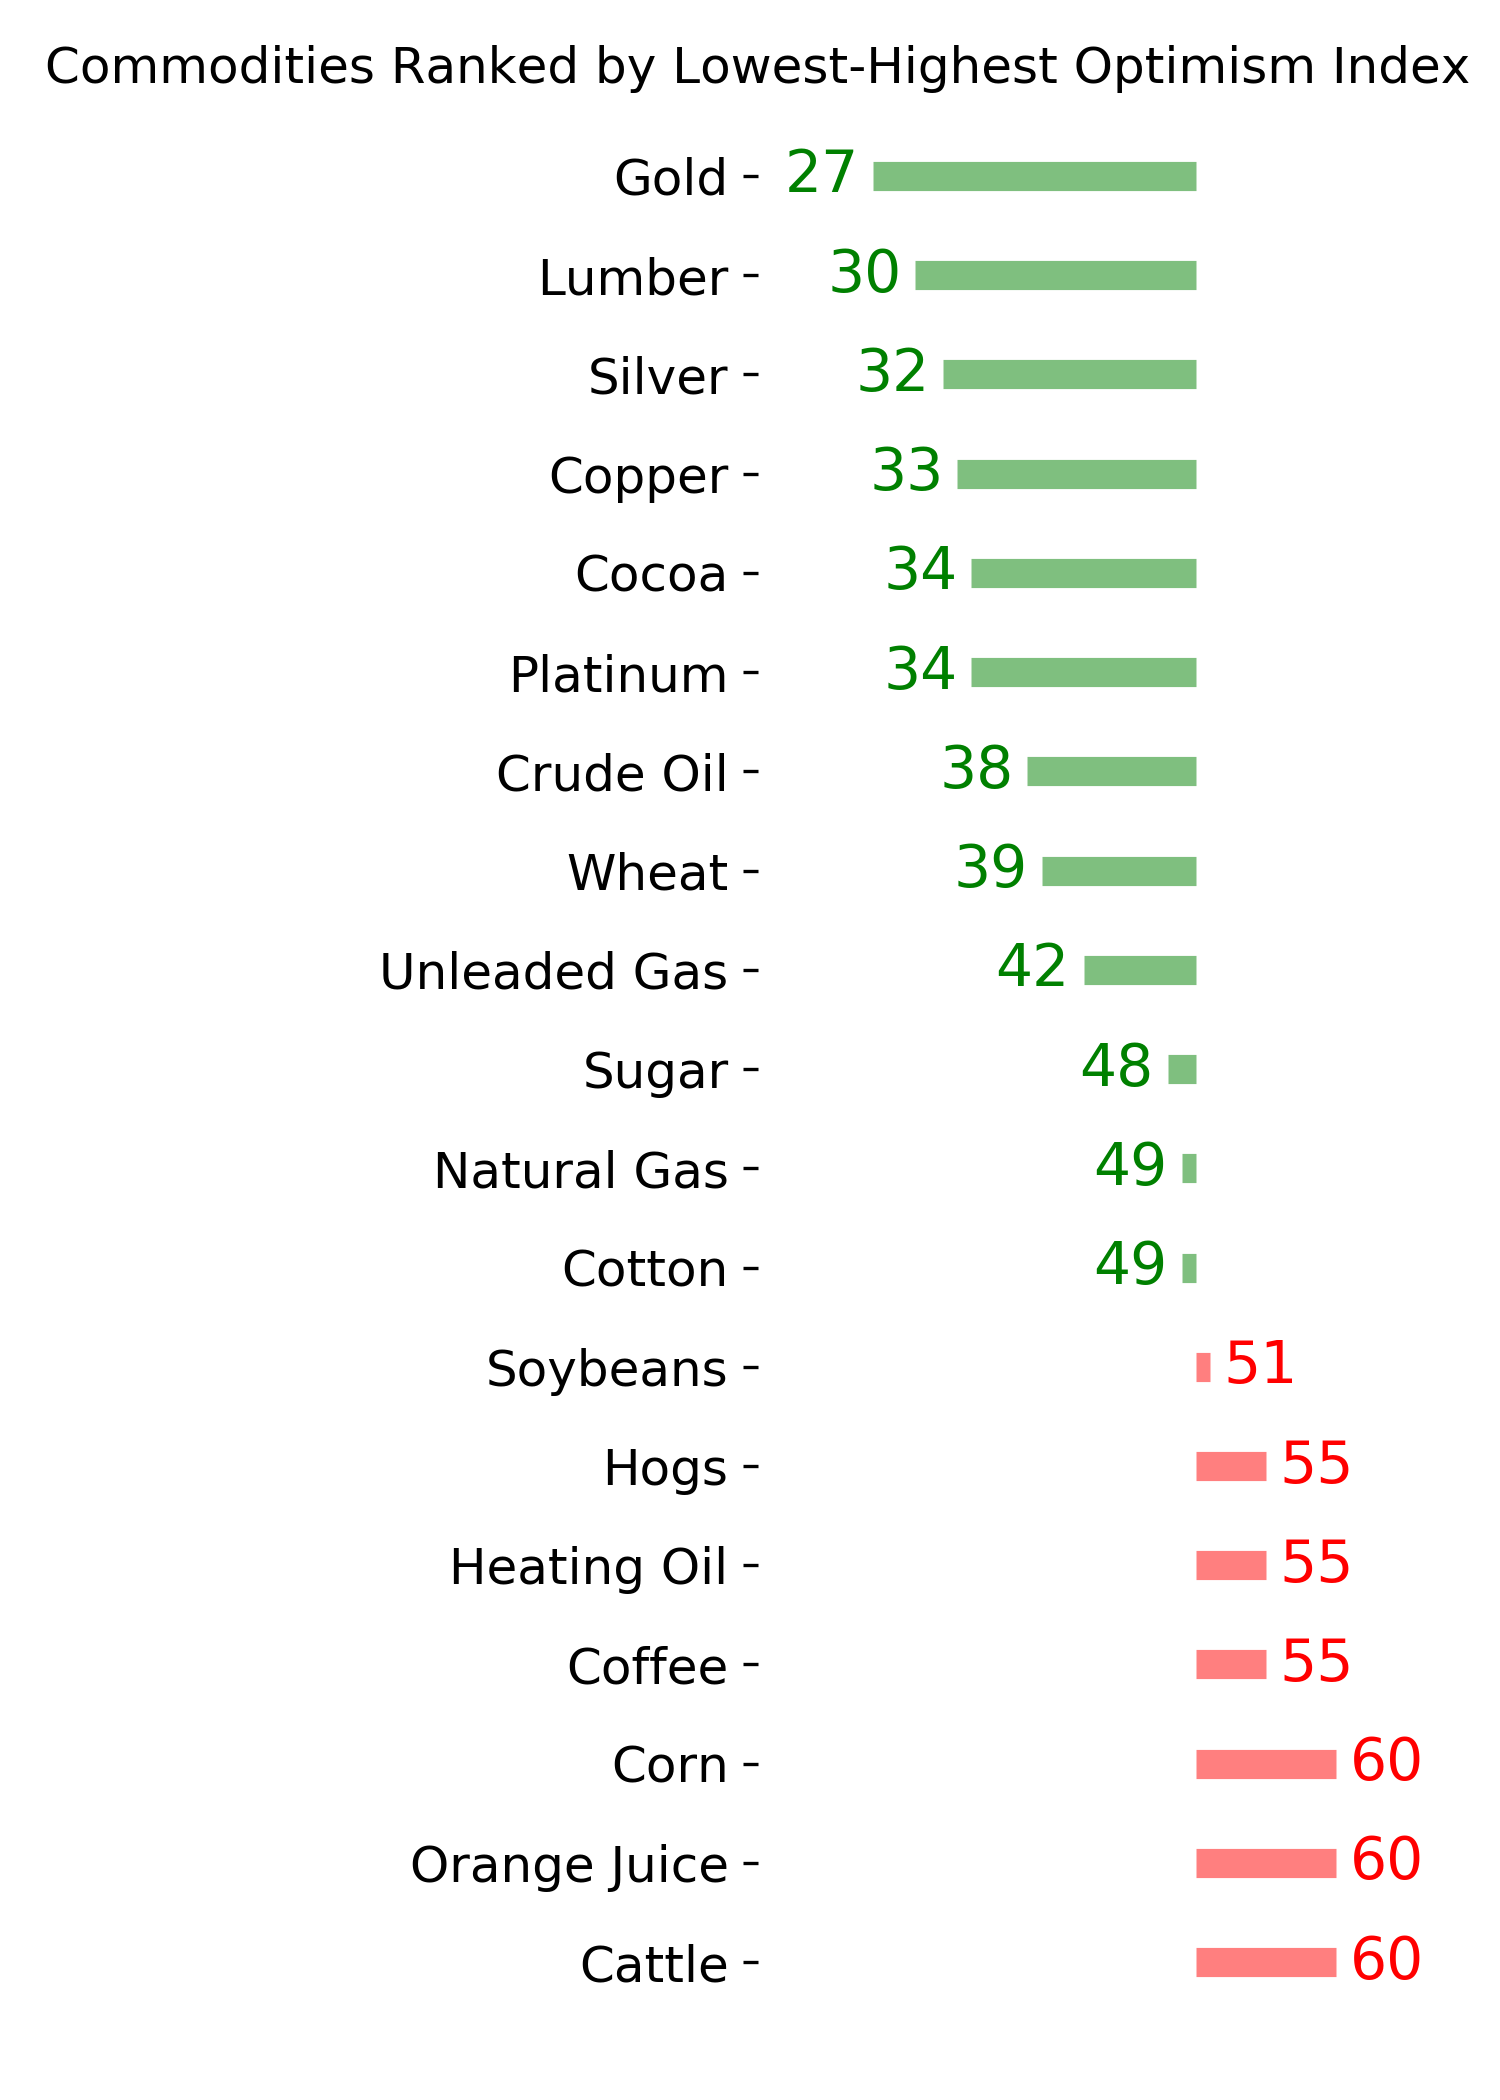
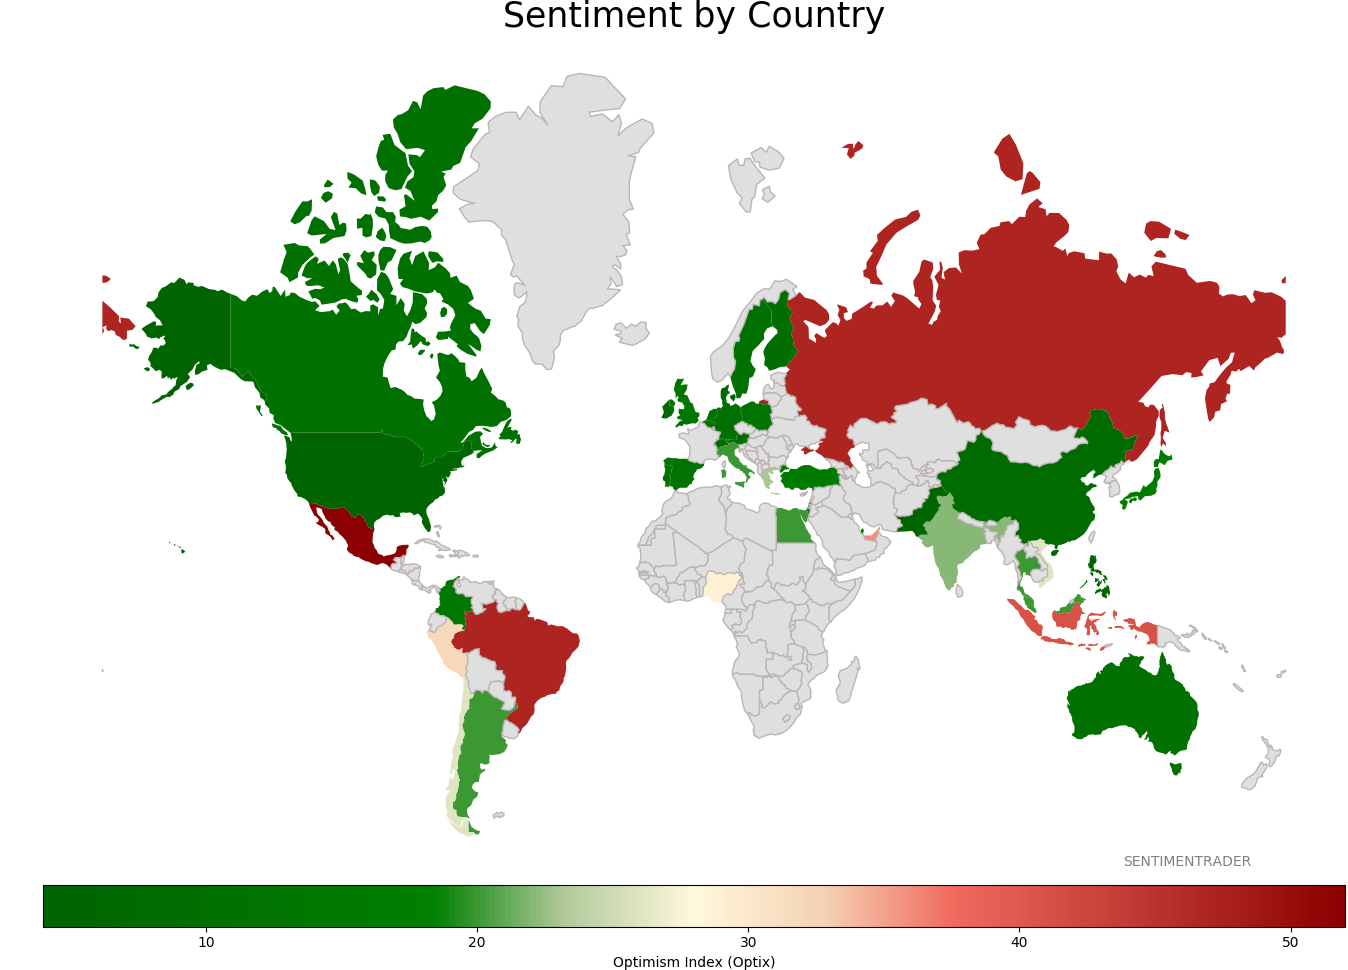
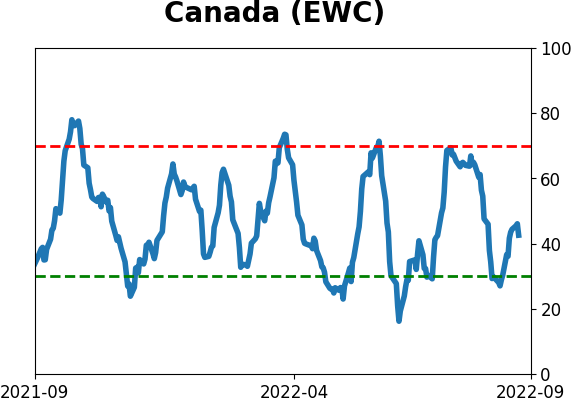
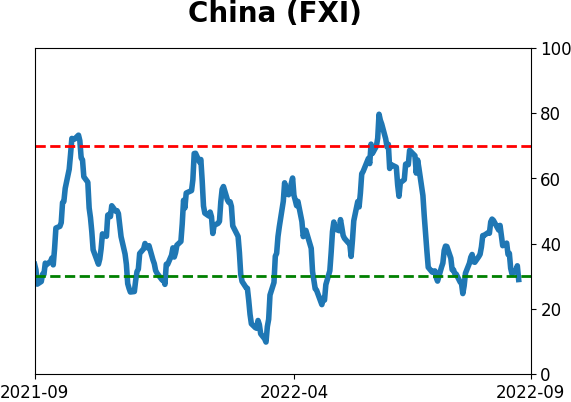
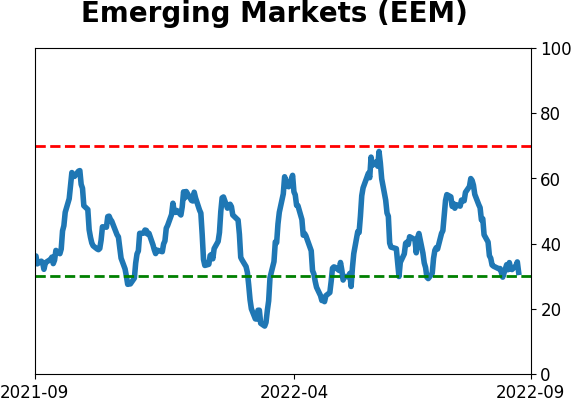
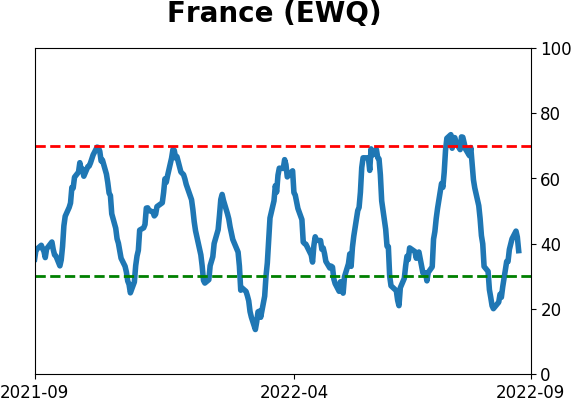
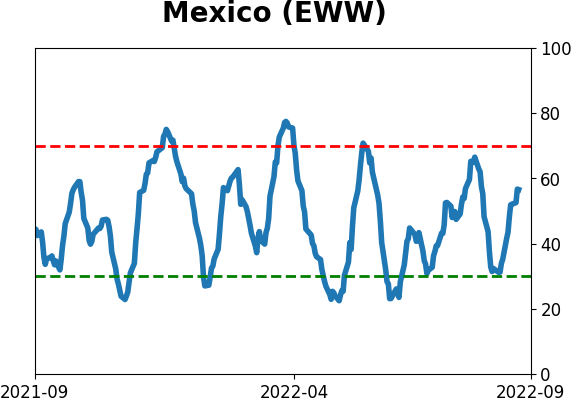
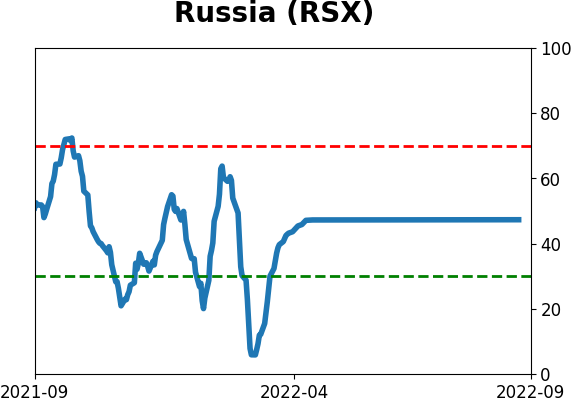
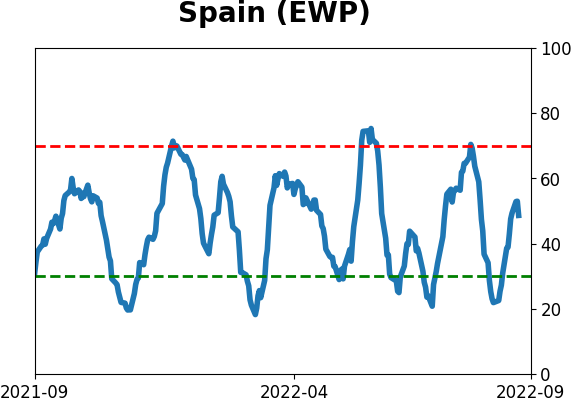
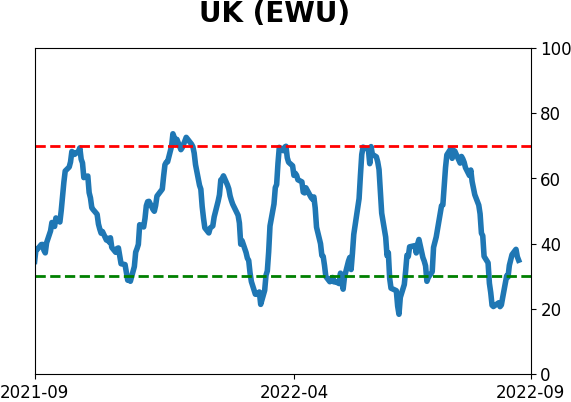
Sentiment Around The World
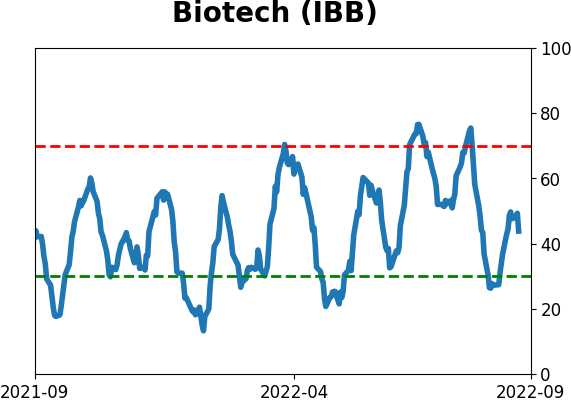
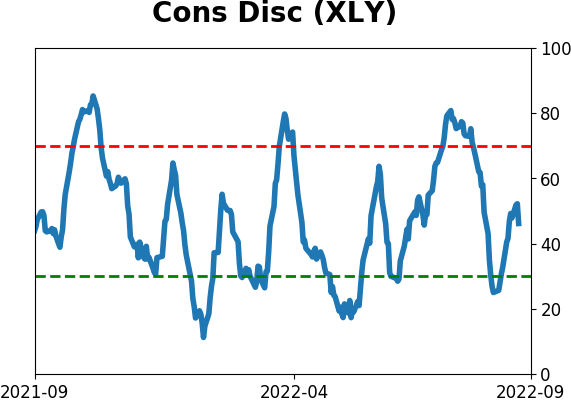
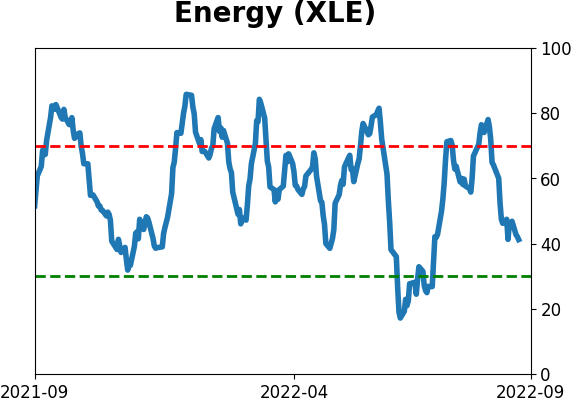
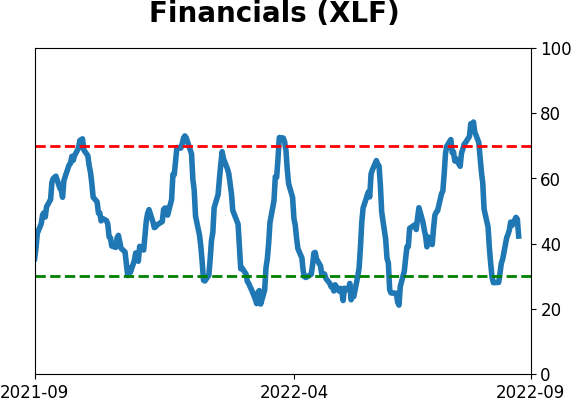
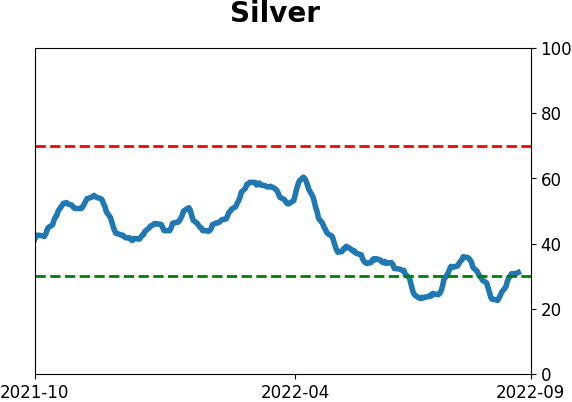
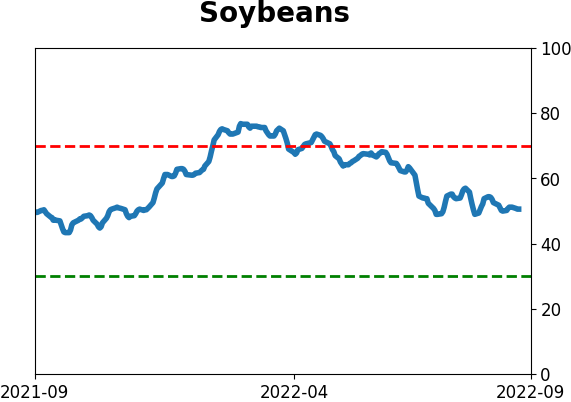
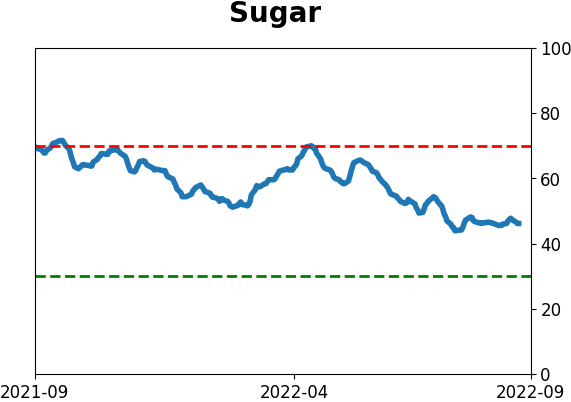
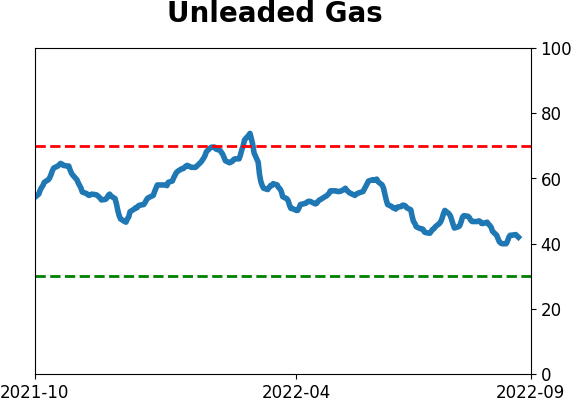
Optimism Index Thumbnails
|
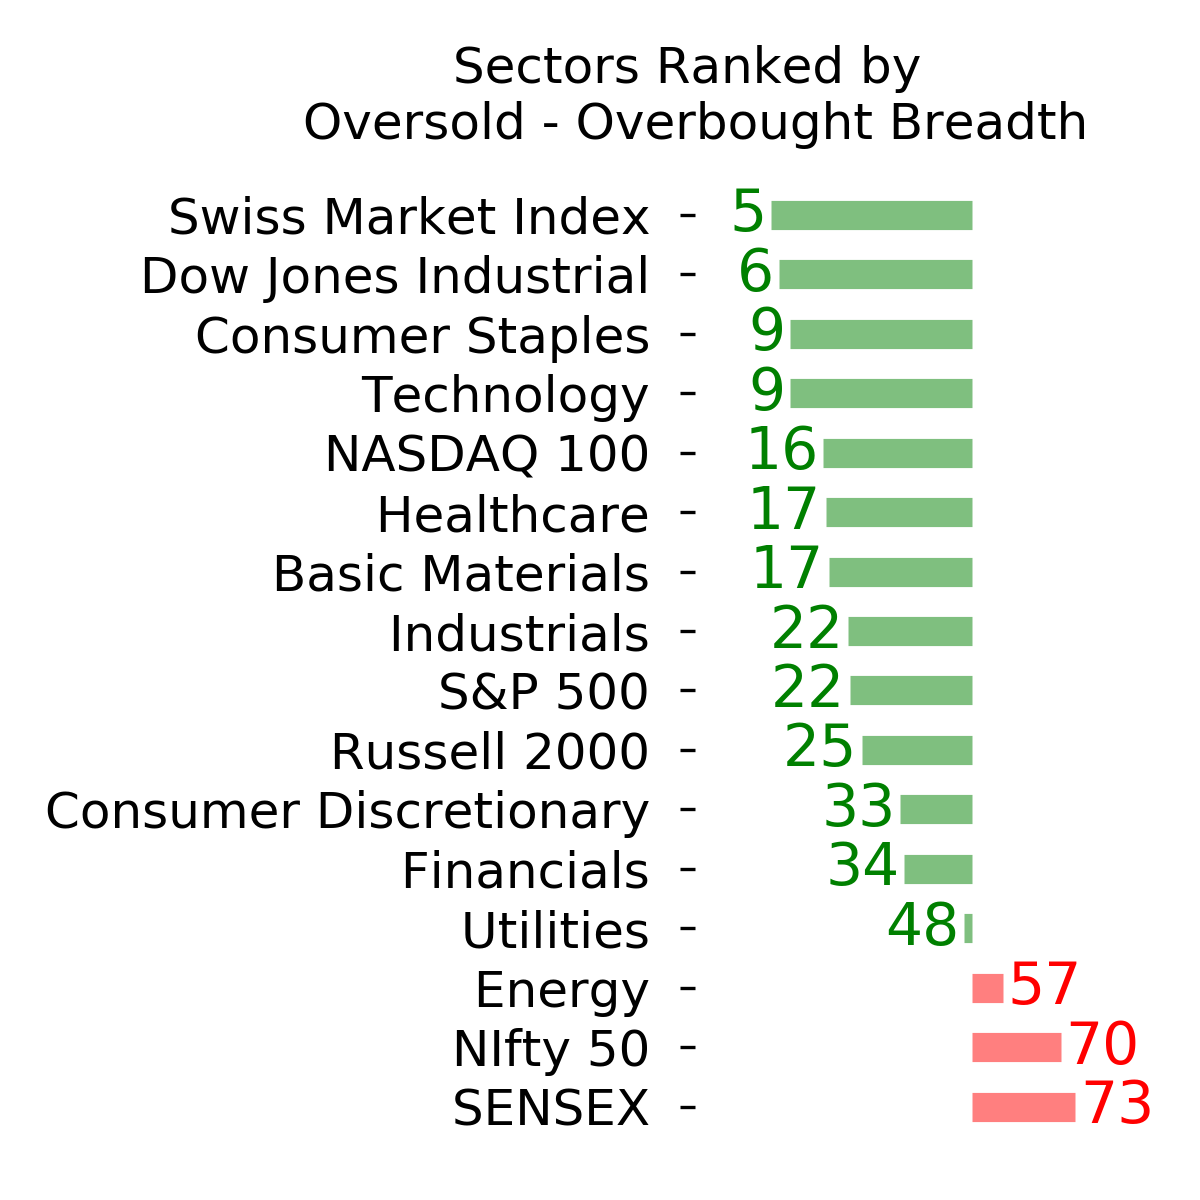
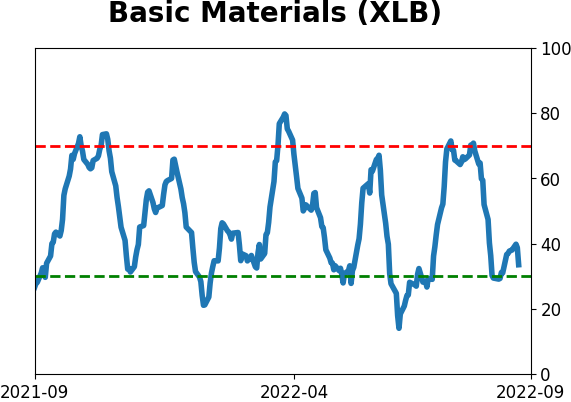
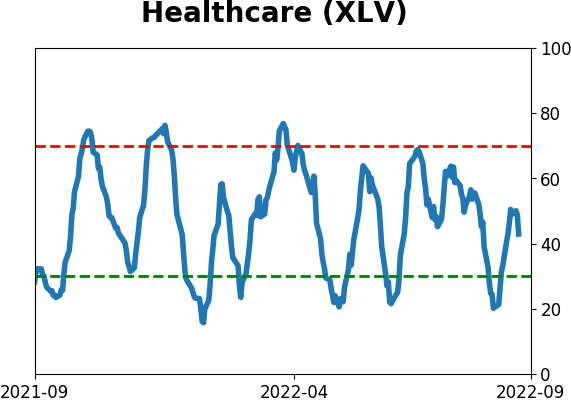
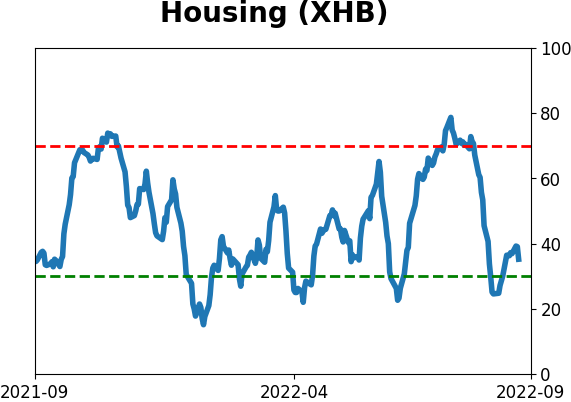
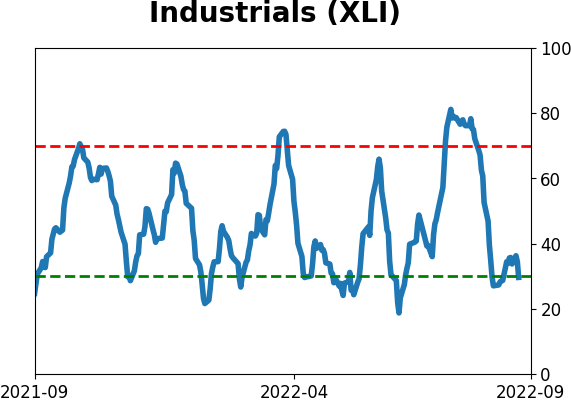
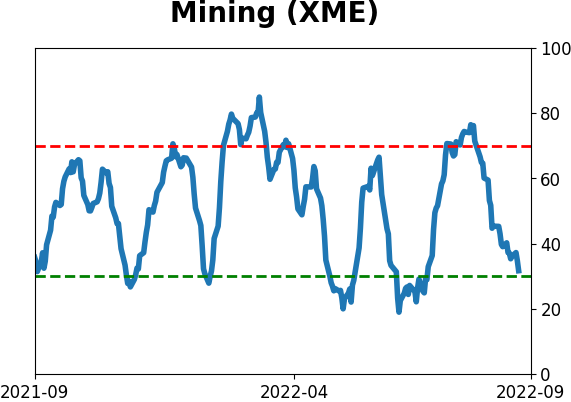
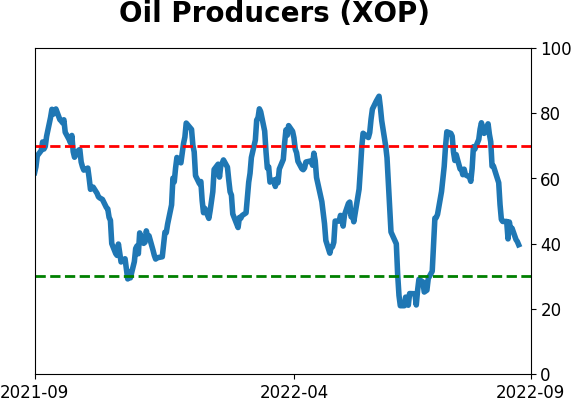
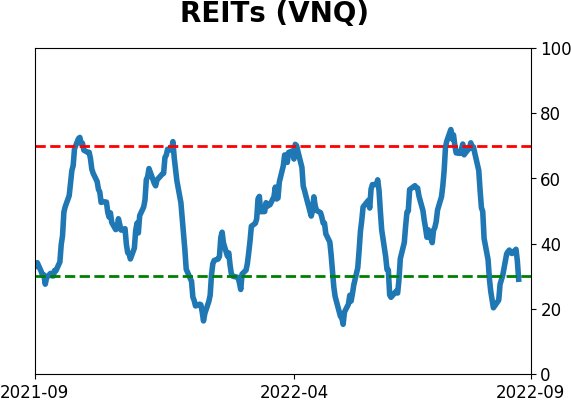
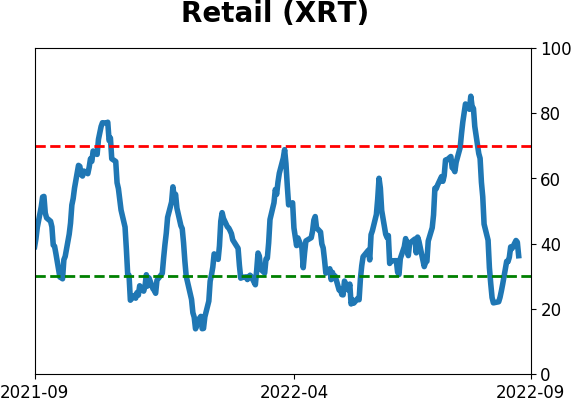
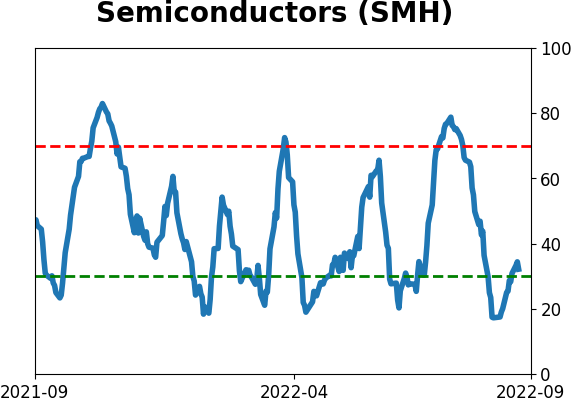
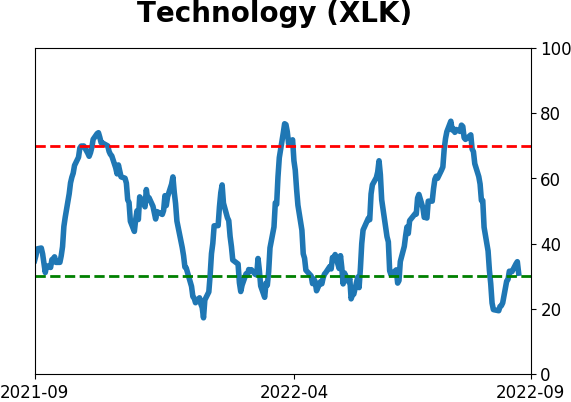
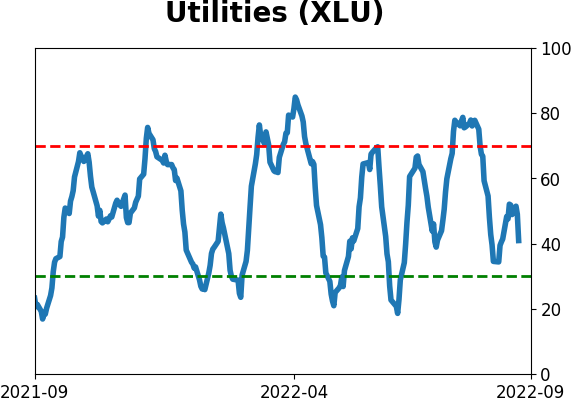
Sector ETF's - 10-Day Moving Average
|
|
|
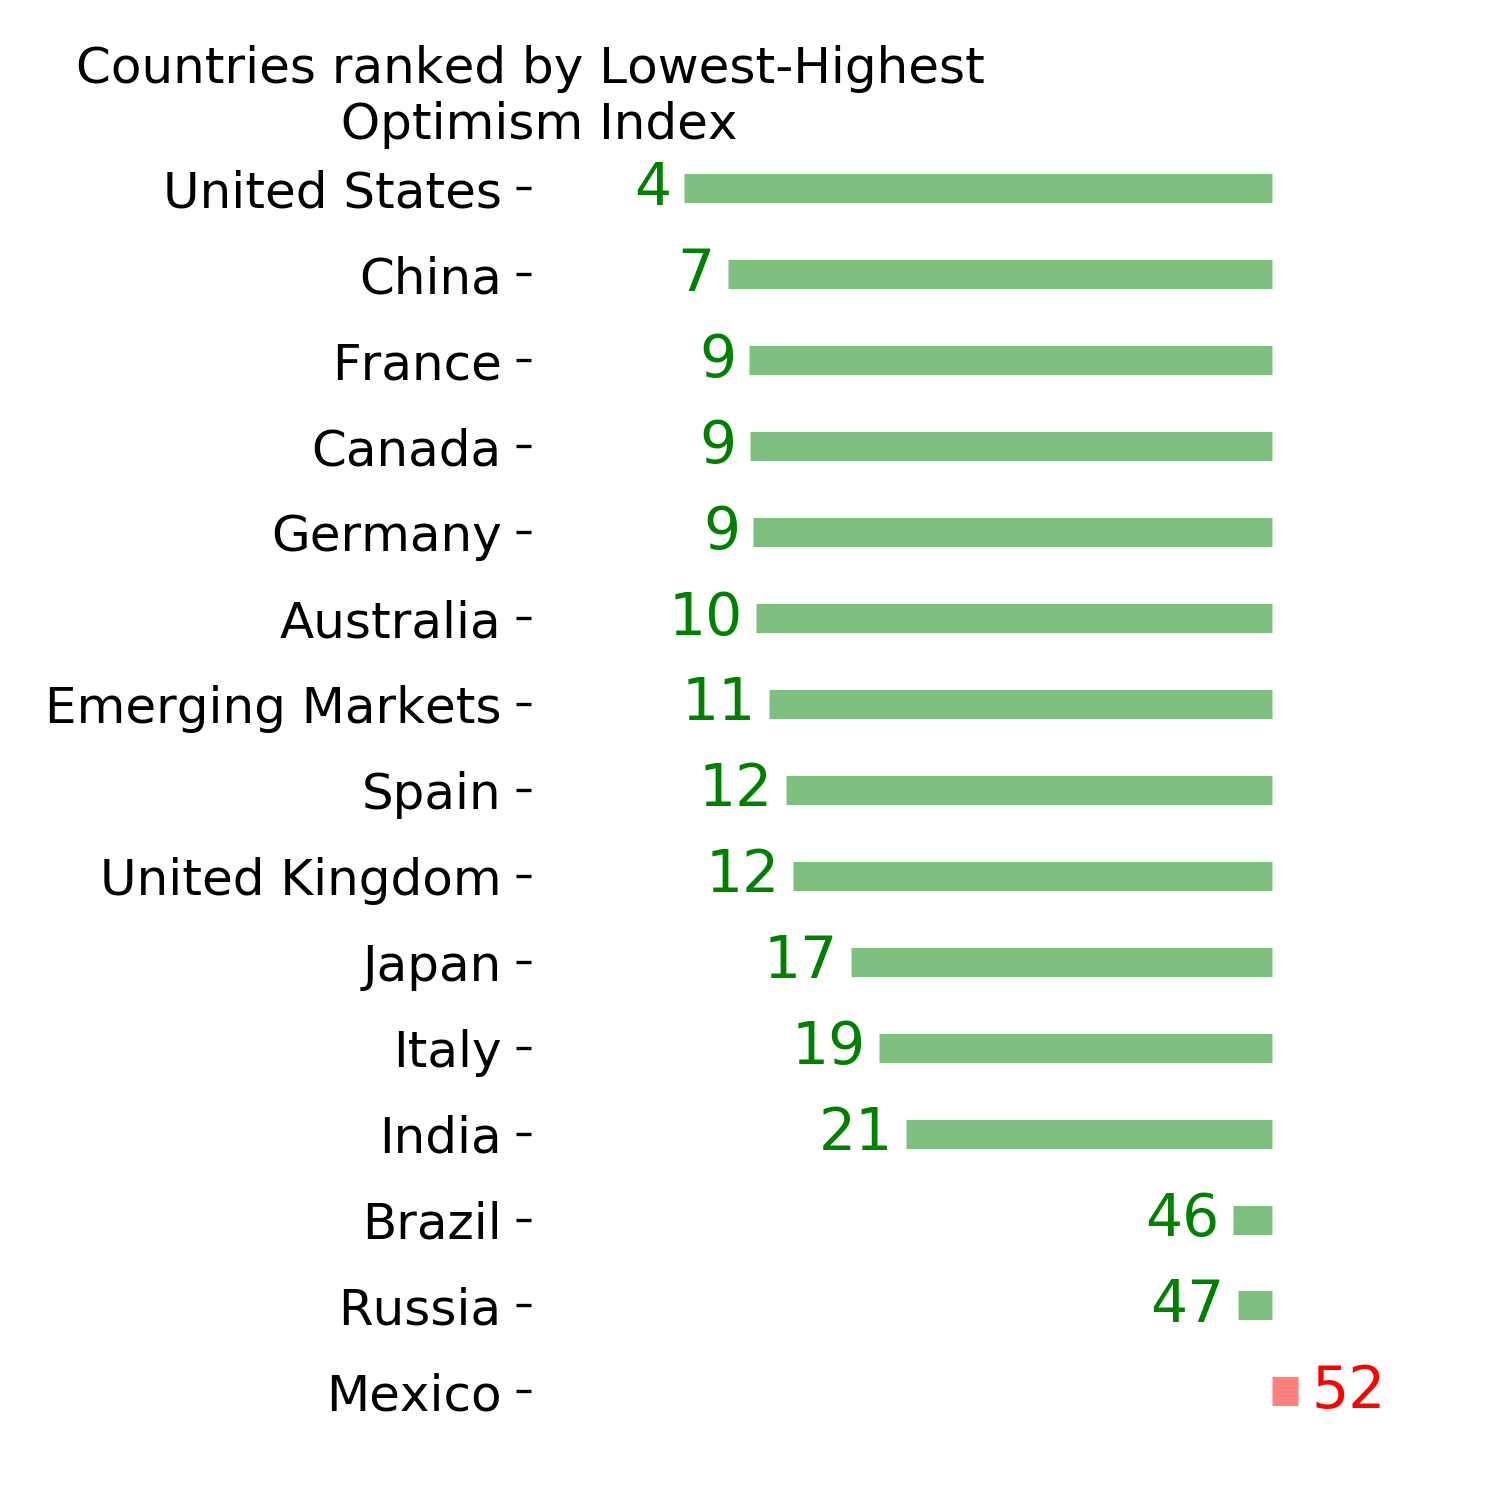
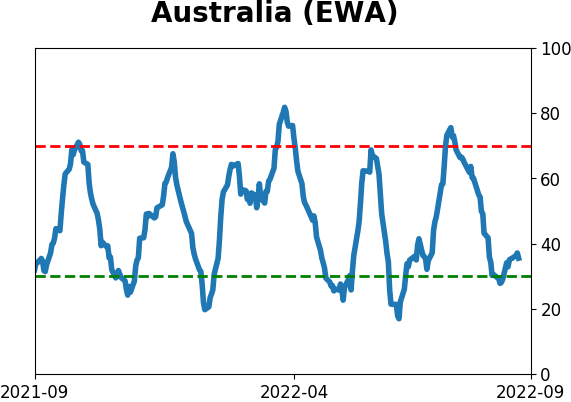
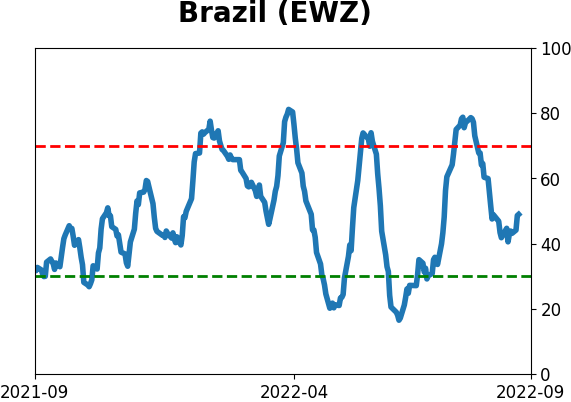
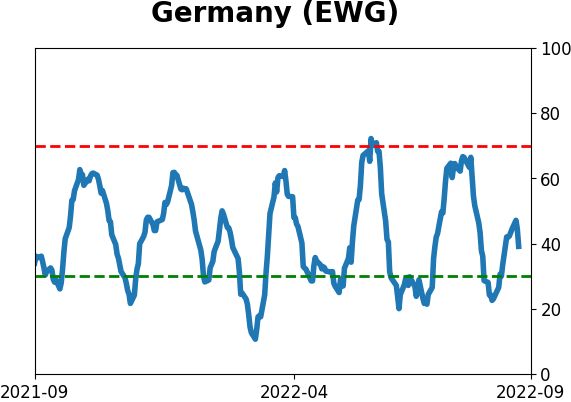
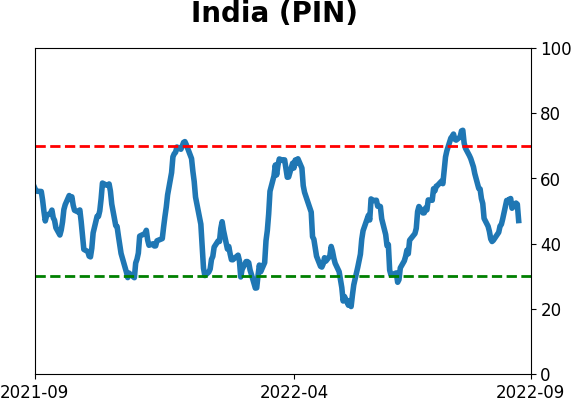
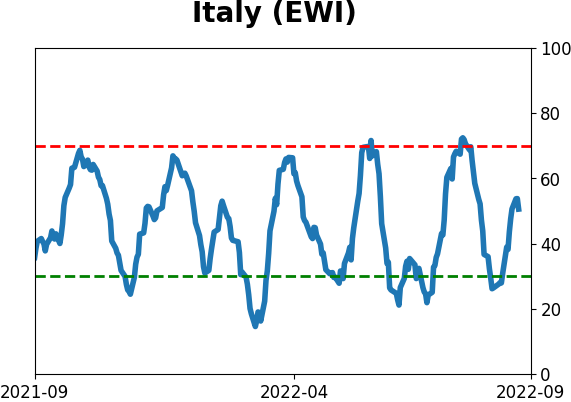
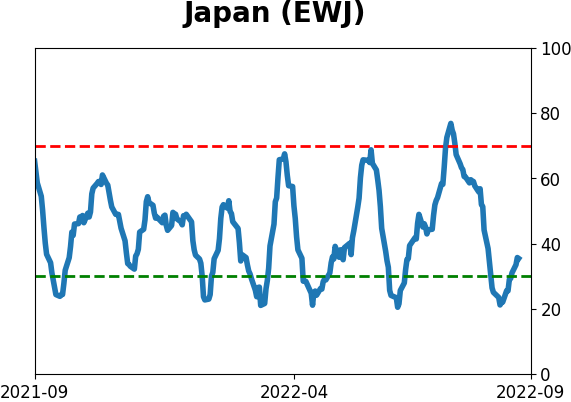
Country ETF's - 10-Day Moving Average
|
|
|
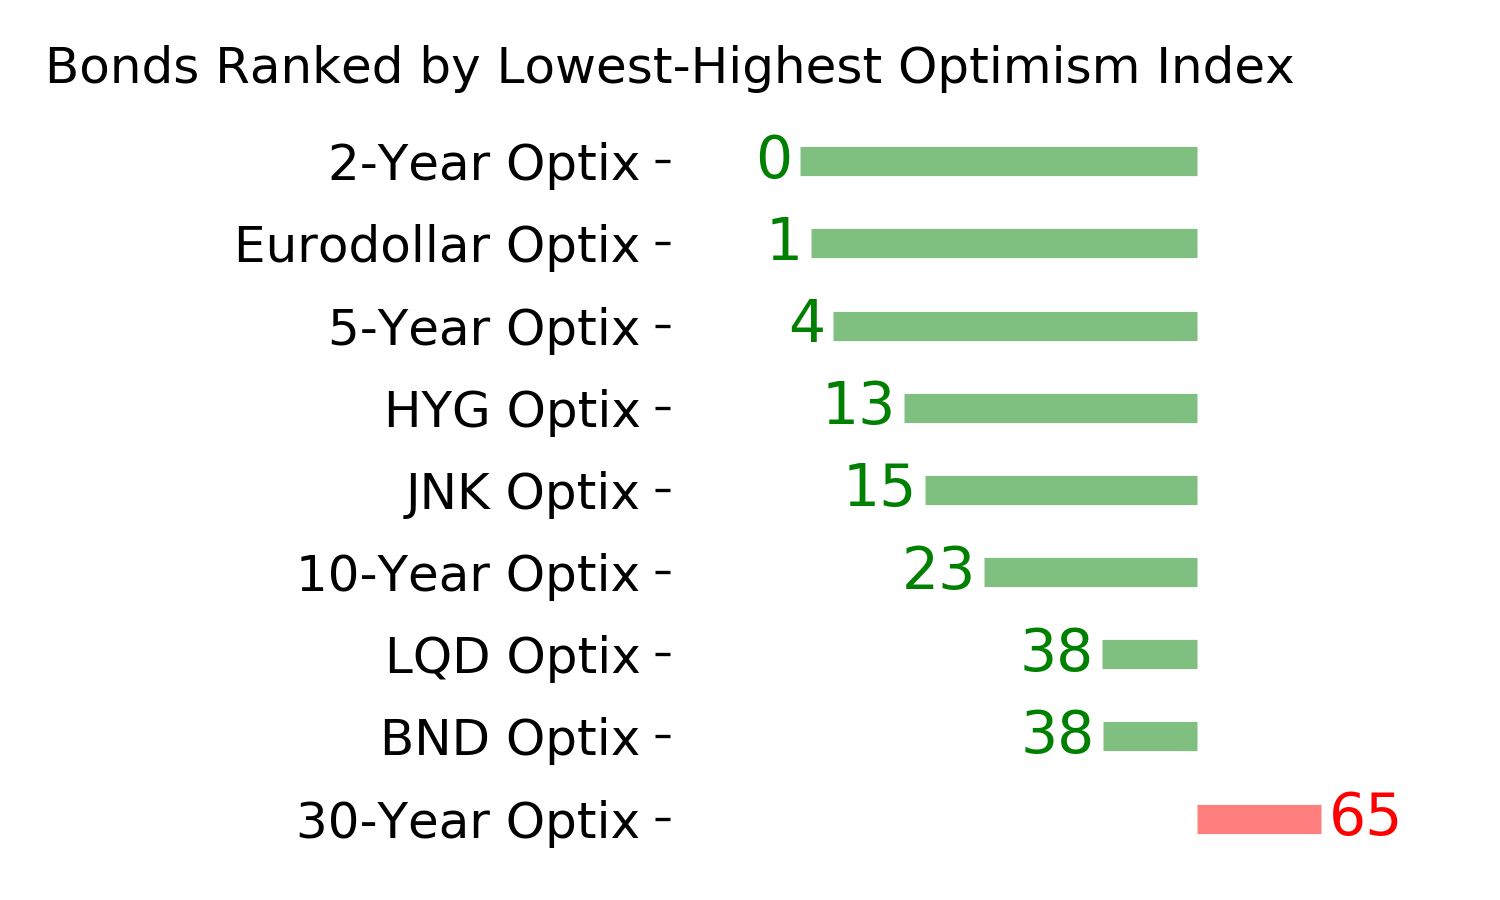
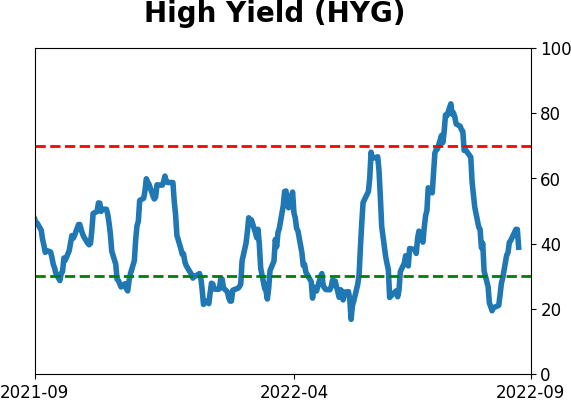
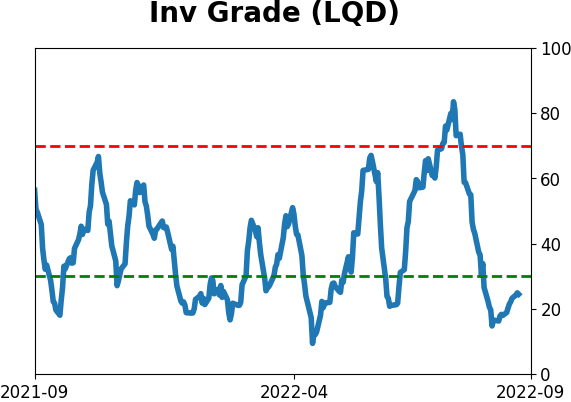
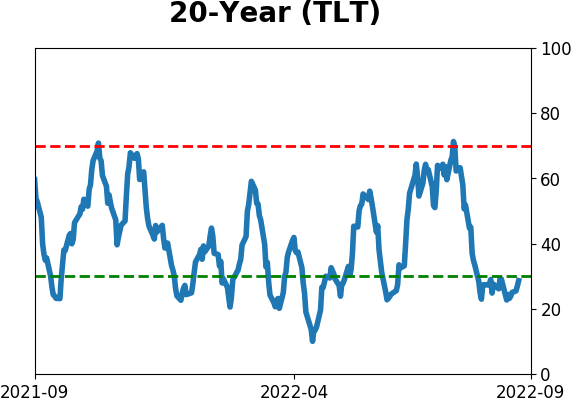
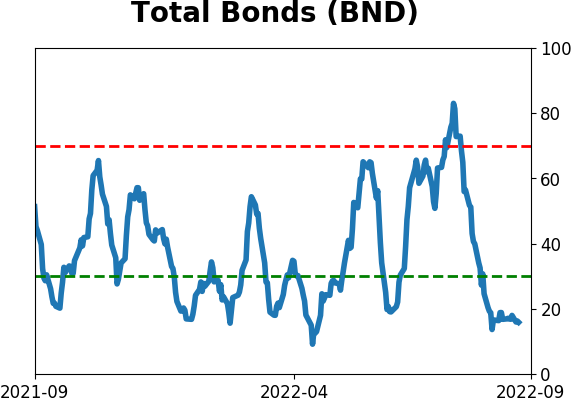
Bond ETF's - 10-Day Moving Average
|
|
|
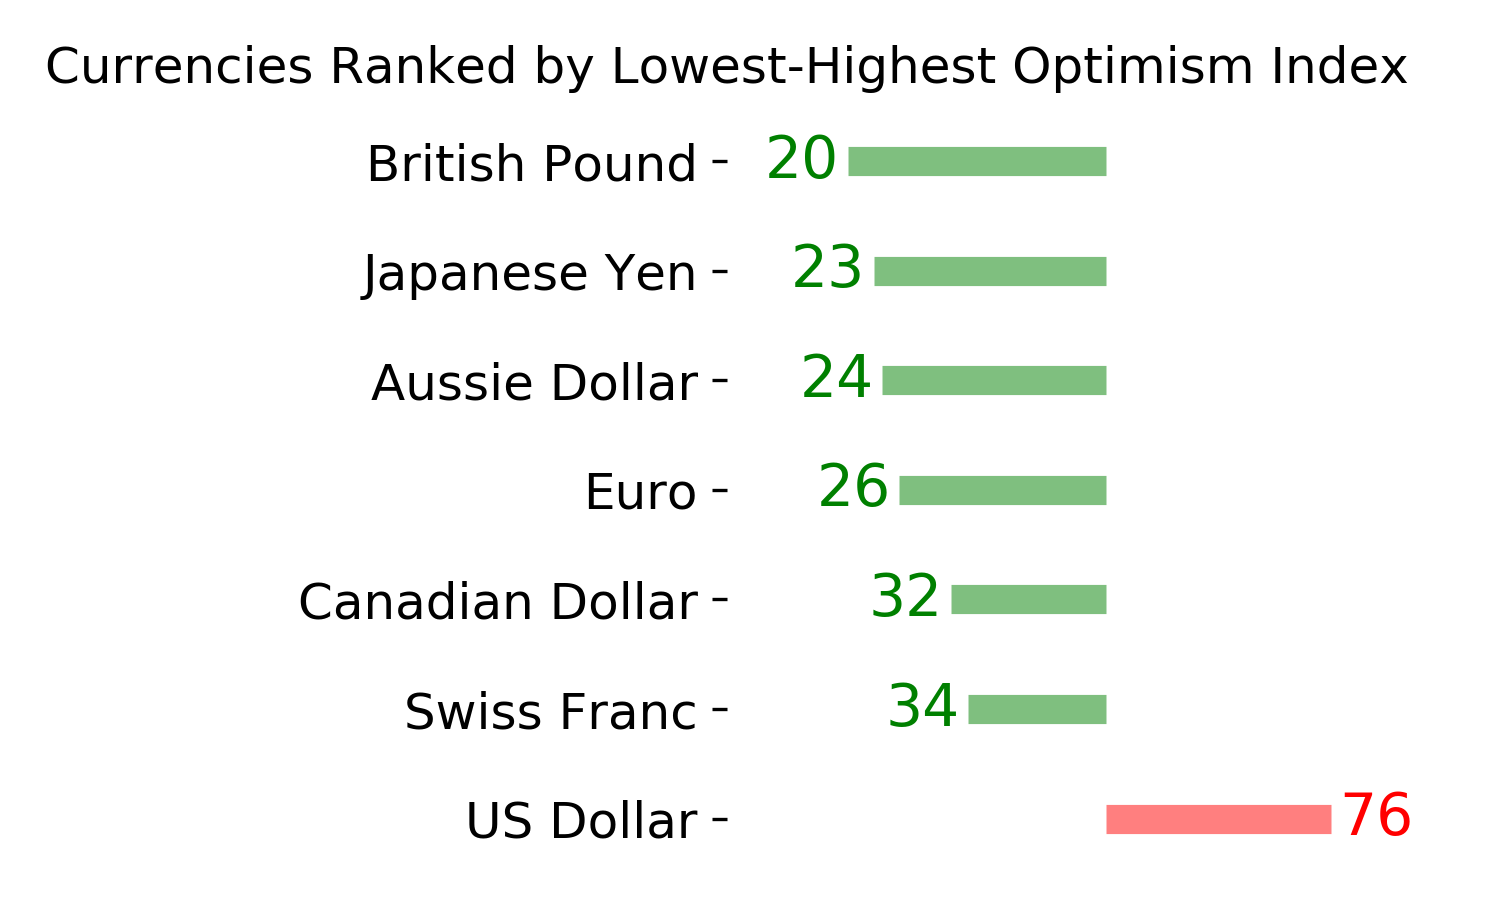
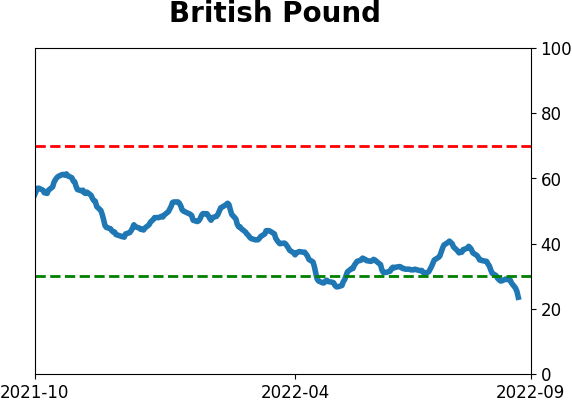
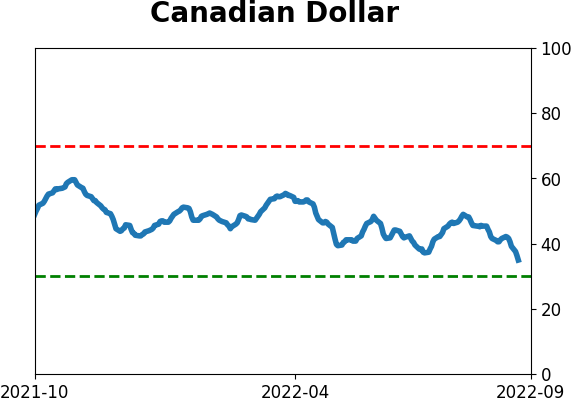
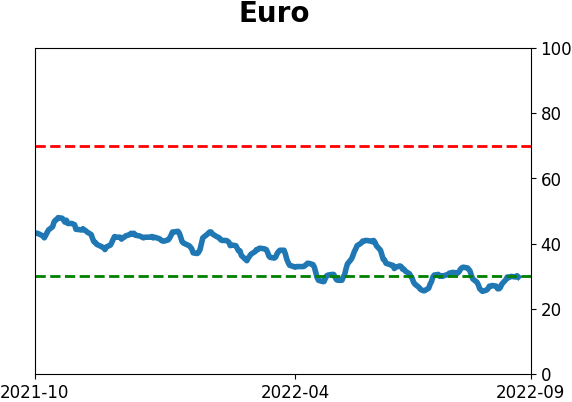
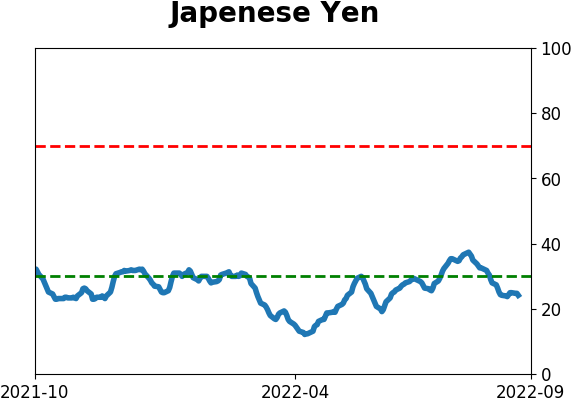
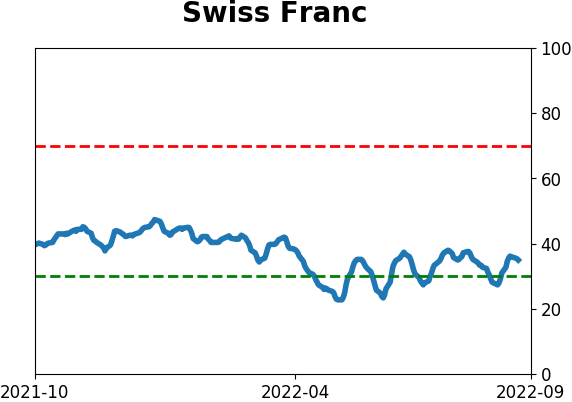
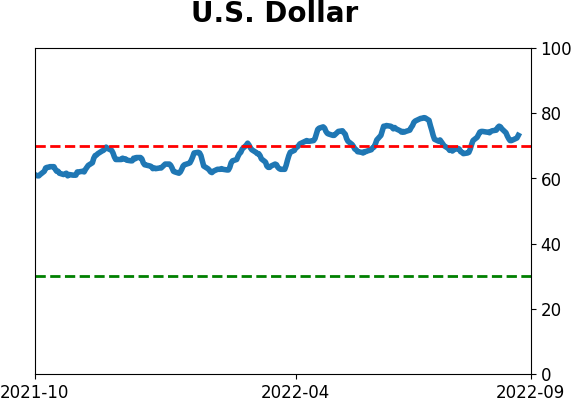
Currency ETF's - 5-Day Moving Average
|
|
|
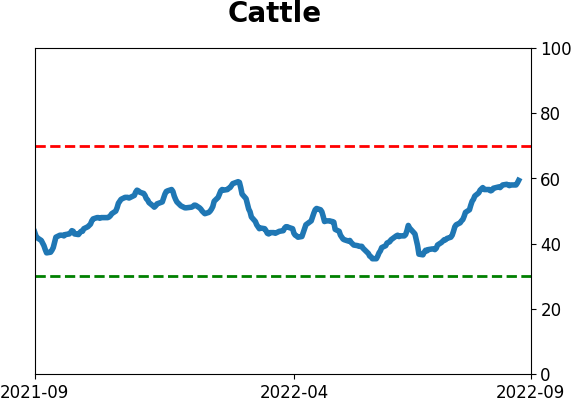
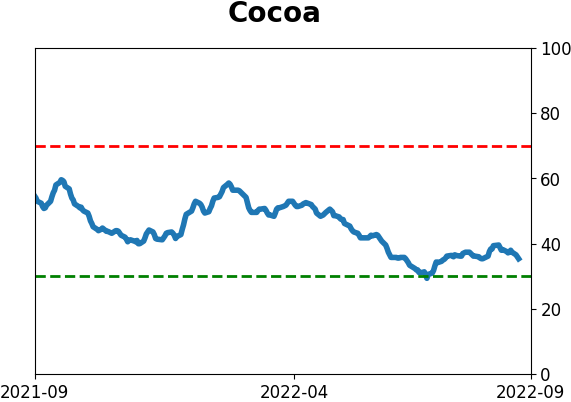
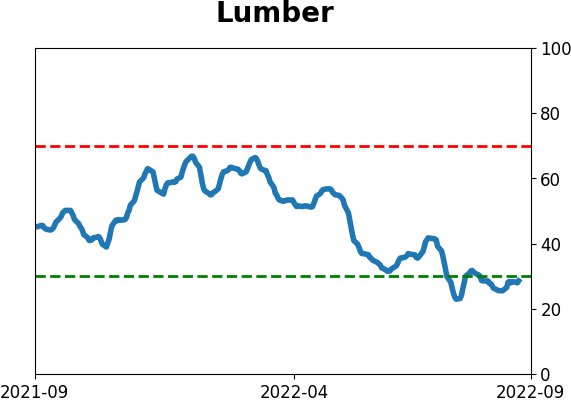
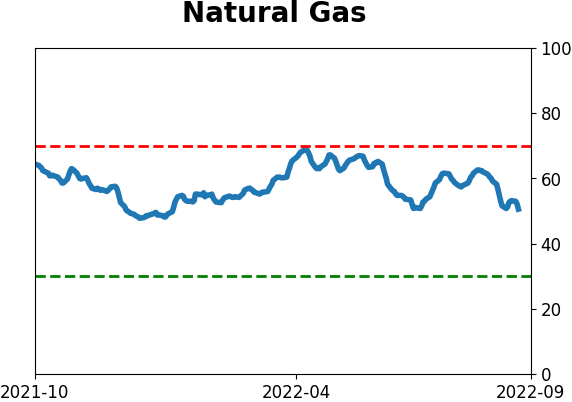
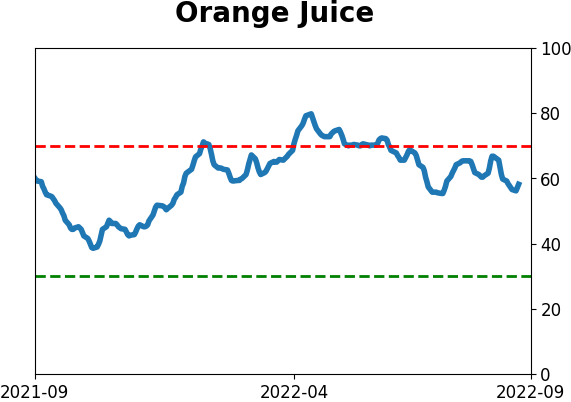
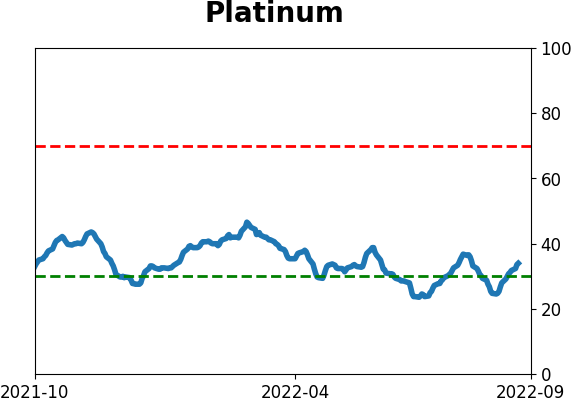
Commodity ETF's - 5-Day Moving Average
|
|