Headlines
|
|
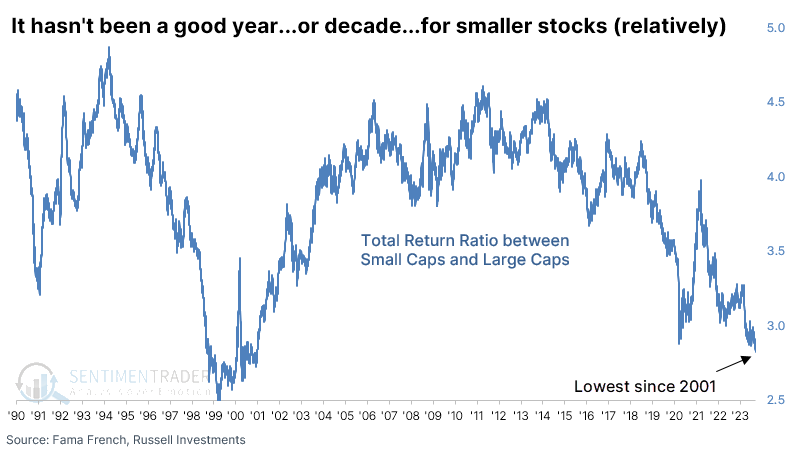
Another new relative low for Small Cap stocks:
The ratio of the total return in Small Caps versus Large Caps fell to another multi-decade low last week. Since 1928, decade-long lows in the ratio showed a strong tendency to lead to further erosion in smaller stocks versus larger ones. Since the 1950, the S&P 500 managed to show a yearly gain every time.
|
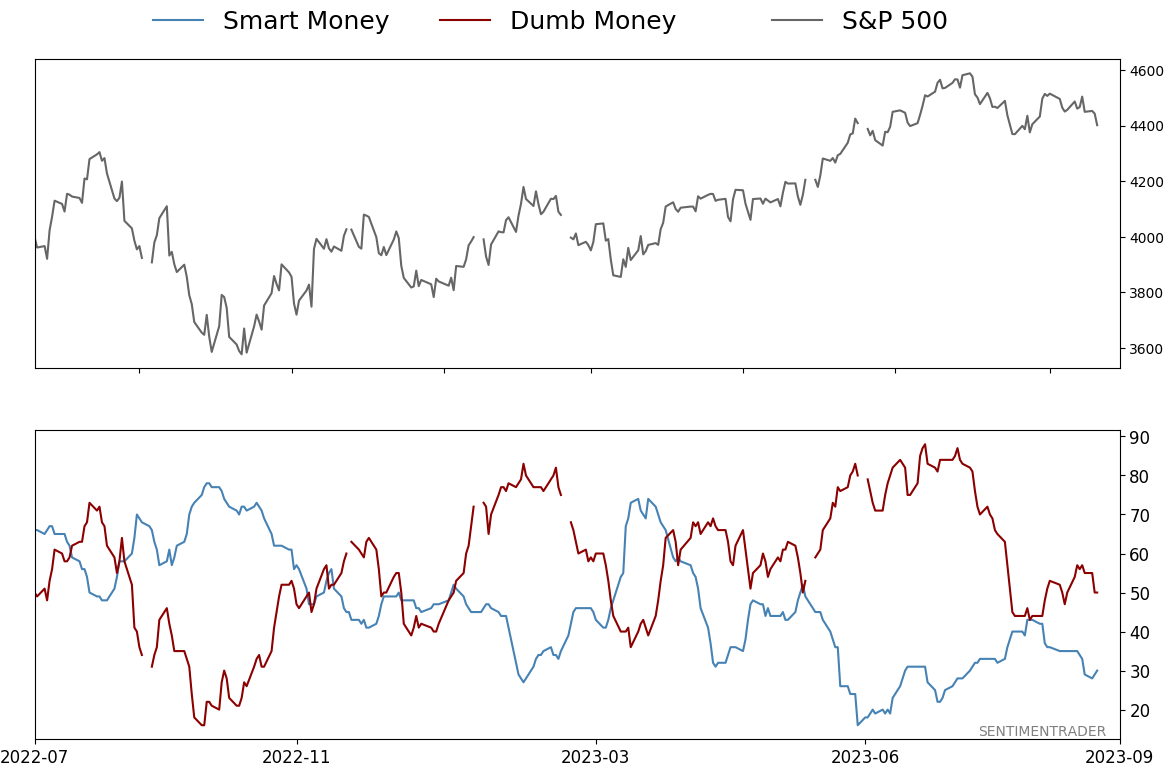
Smart / Dumb Money Confidence
|
Smart Money Confidence: 30%
Dumb Money Confidence: 50%
|
|
Risk Levels
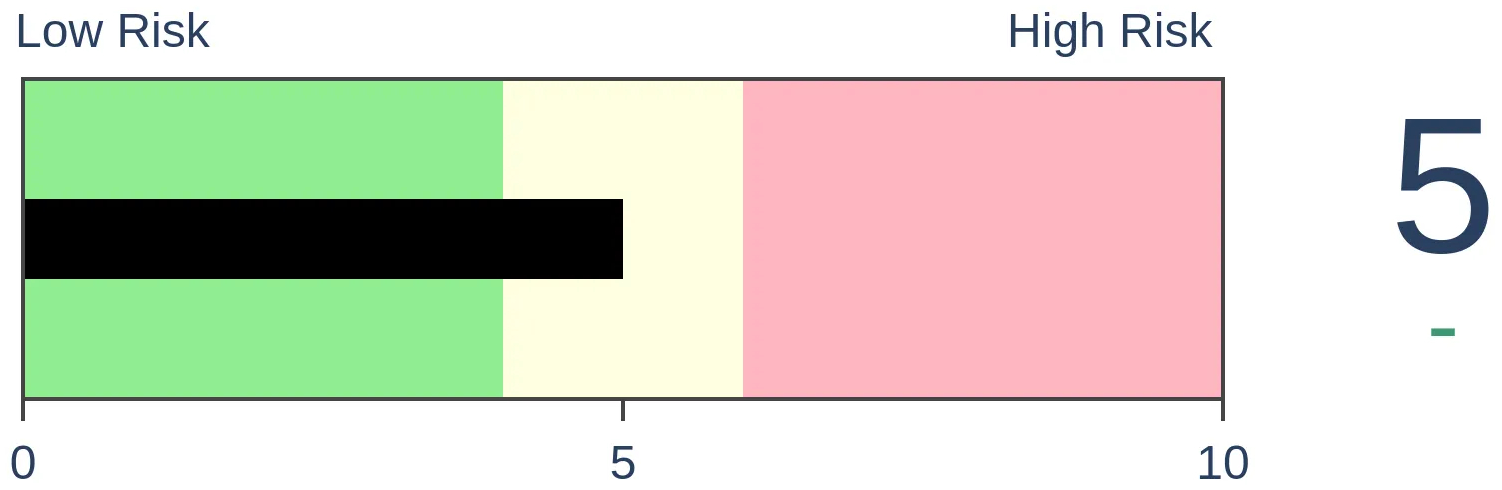
Stocks Short-Term
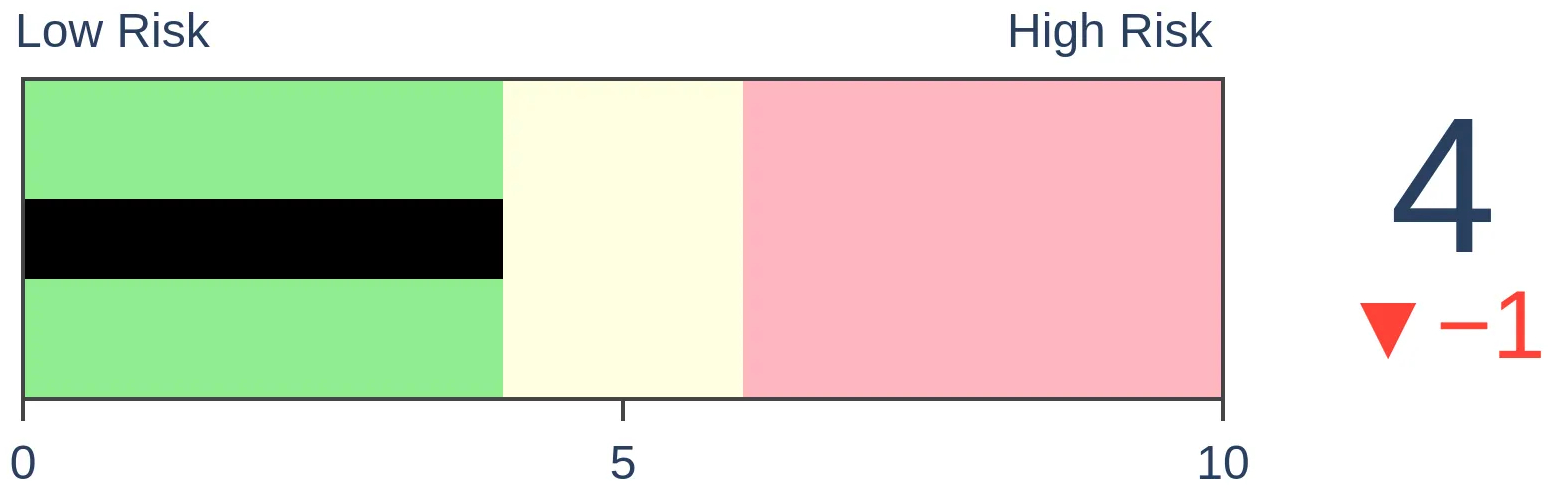
|
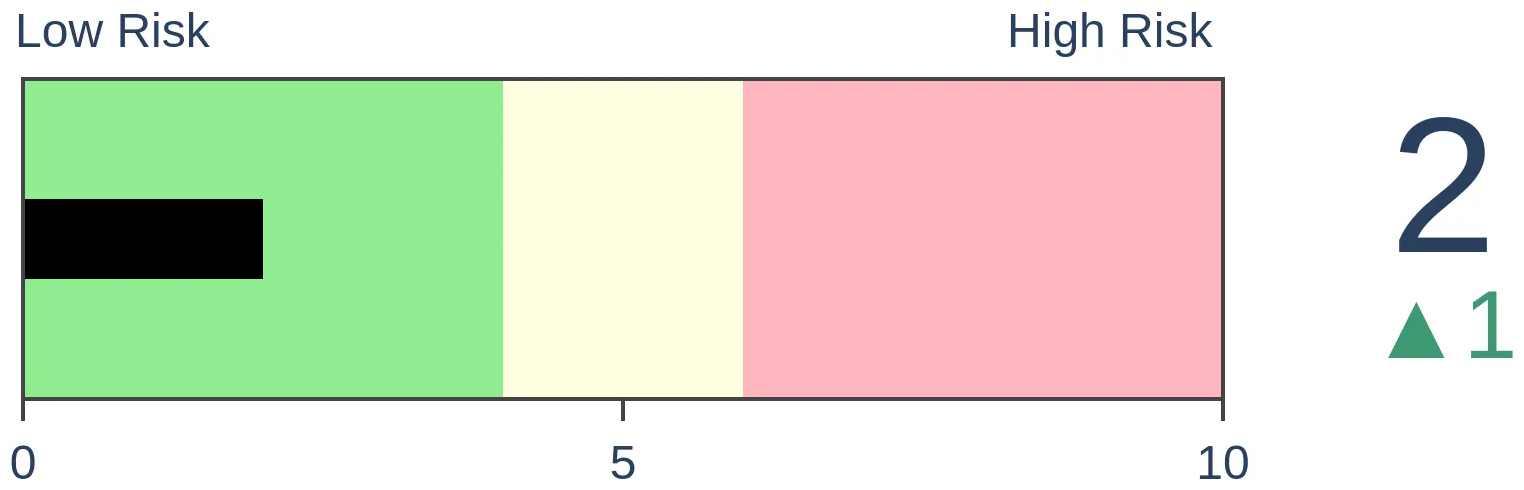
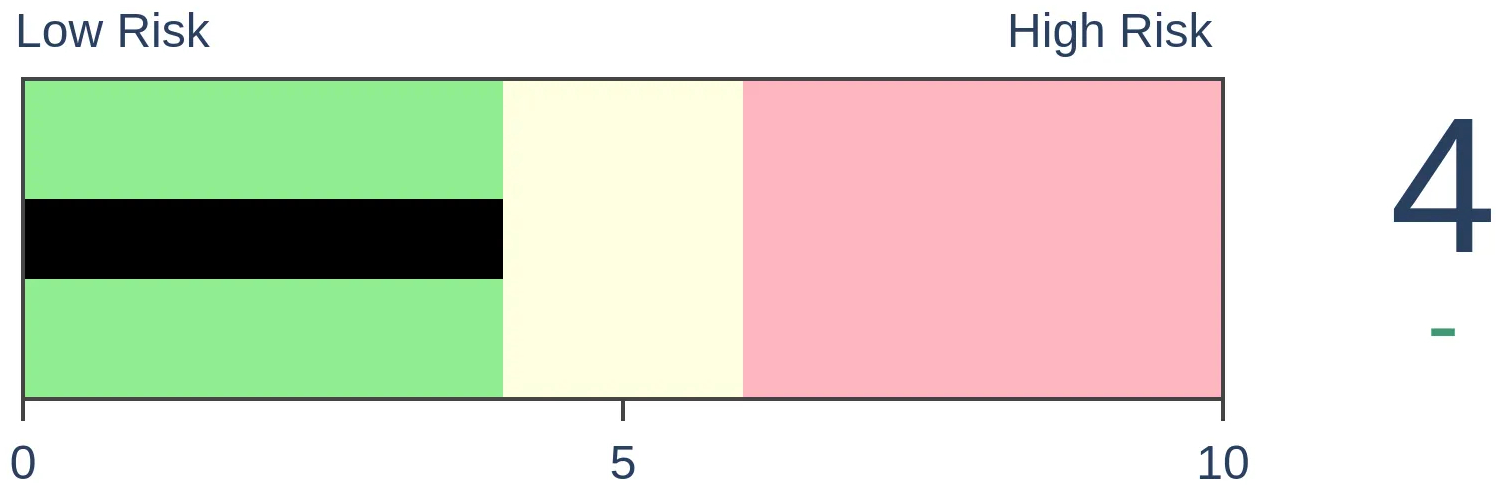
Stocks Medium-Term

|
|
Bonds
|
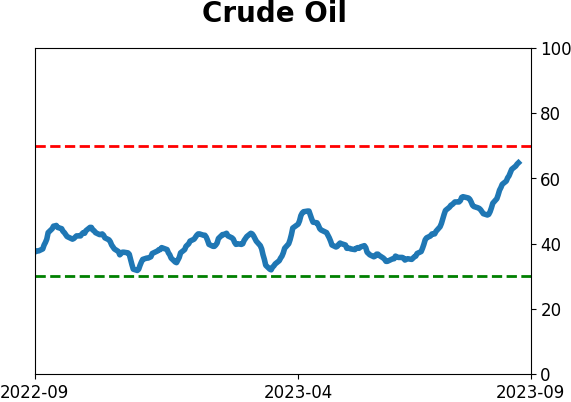
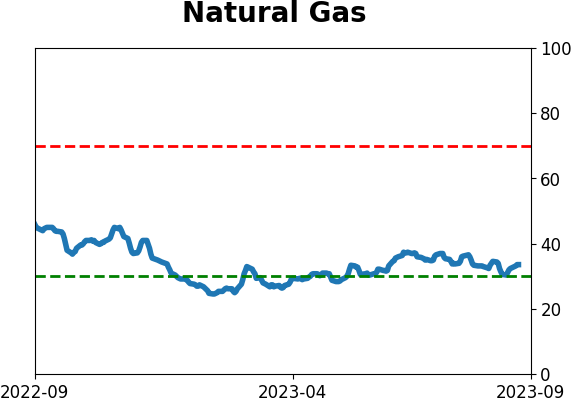
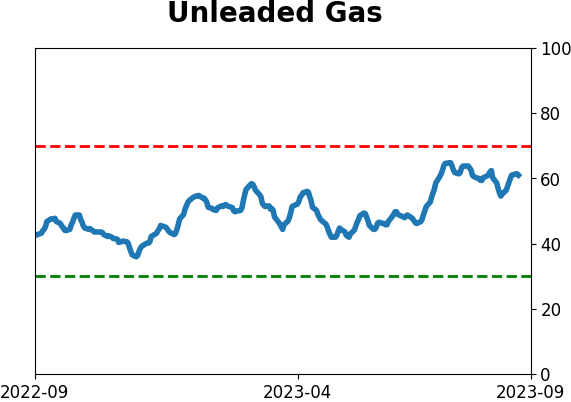
Crude Oil
|
|
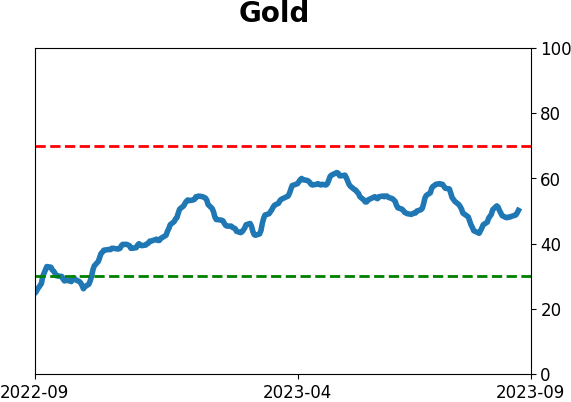
Gold
|
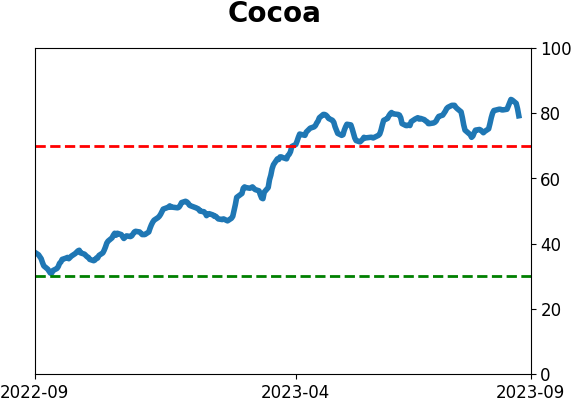
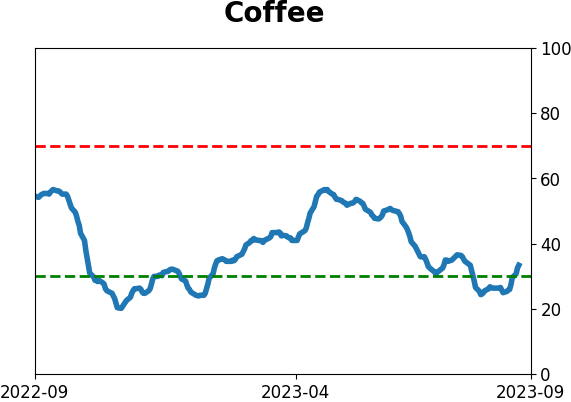
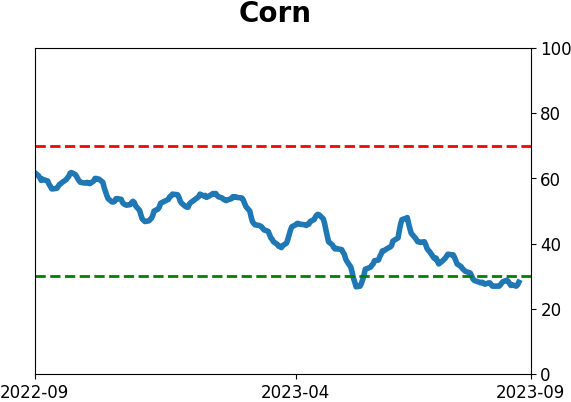
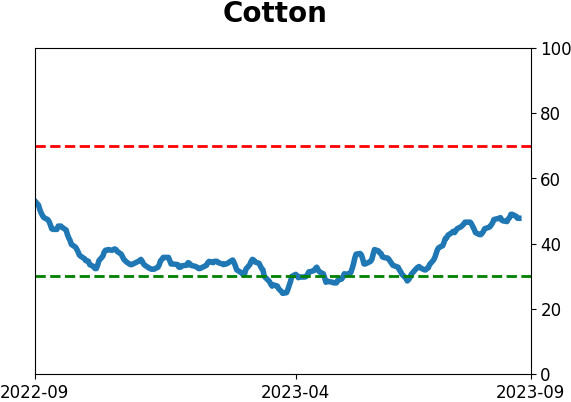
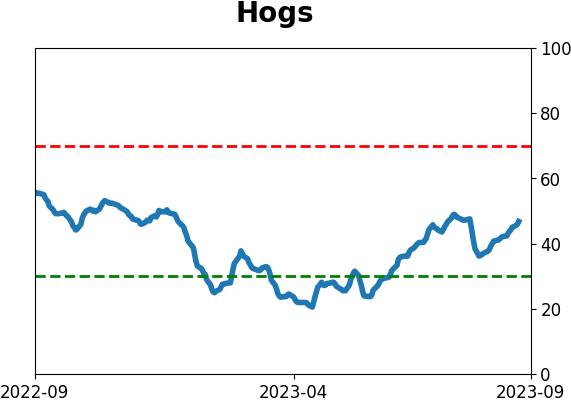
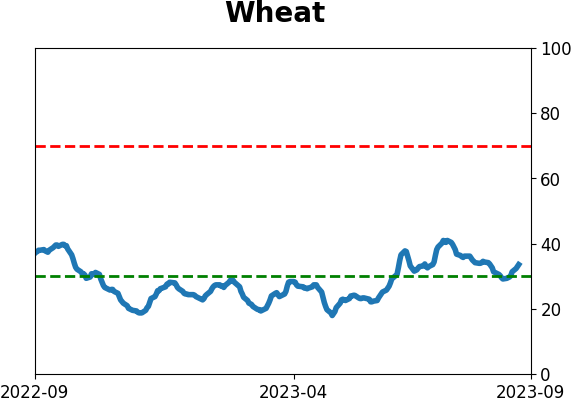
Agriculture

|
|
Research
By Jason Goepfert
BOTTOM LINE
The ratio of the total return in Small Caps versus Large Caps fell to another multi-decade low last week. Since 1928, decade-long lows in the ratio showed a strong tendency to lead to further erosion in smaller stocks versus larger ones. Since the 1950, the S&P 500 managed to show a yearly gain every time.
FORECAST / TIMEFRAME
None
|
Key points:
- The total return in smaller stocks versus larger ones fell to its lowest level in more than 20 years
- Decade-long lows in the ratio tended to precede poor returns in Small Caps and decent ones in Large Caps
- The ratio between them showed a strong tendency to continue falling over the next 3-6 months
Smaller stocks fall to multi-decade relative low
We've spent some time looking at the differences in fortunes between various sectors and factors this year because there has been ample opportunity to do so. While the "breadth is narrow" argument doesn't have a whole lot of support, there is no doubt that a handful of stocks have been able to drive a large part of the gains across sectors and indexes.
Bloomberg recently noted that investor preference between smaller stocks and larger ones has become so stark lately that a ratio between the two just fell to a two-decade low.
In theory, the longer we wait, the more confident we should be that the 2000 will outperform. But the reverse is happening. Over the last 22 years (starting when markets reopened after the 9/11 terrorist attacks), the 1000 has now beaten the 2000.
Indeed it has.
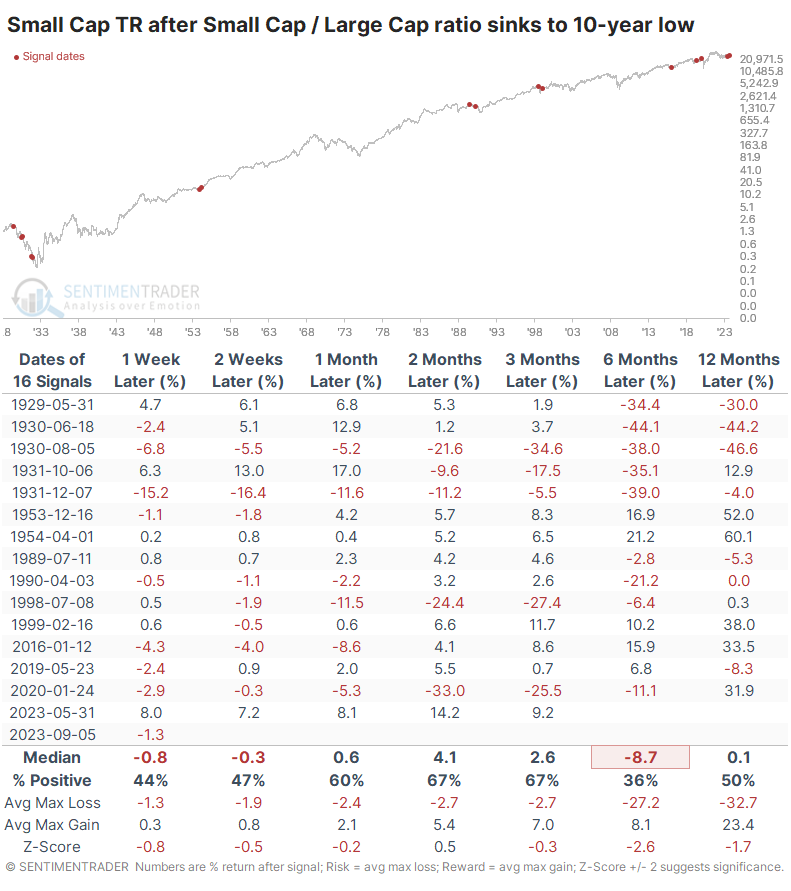
Based on other times the ratio fell to the lowest in at least a decade, and for the first time in at least 30 sessions, there wasn't a lot of reason to expect an imminent or sustained turnaround. Over the next three months, the total return on Small Caps exceeded Large Caps only 3 times out of 15 attempts, and those were just barely.
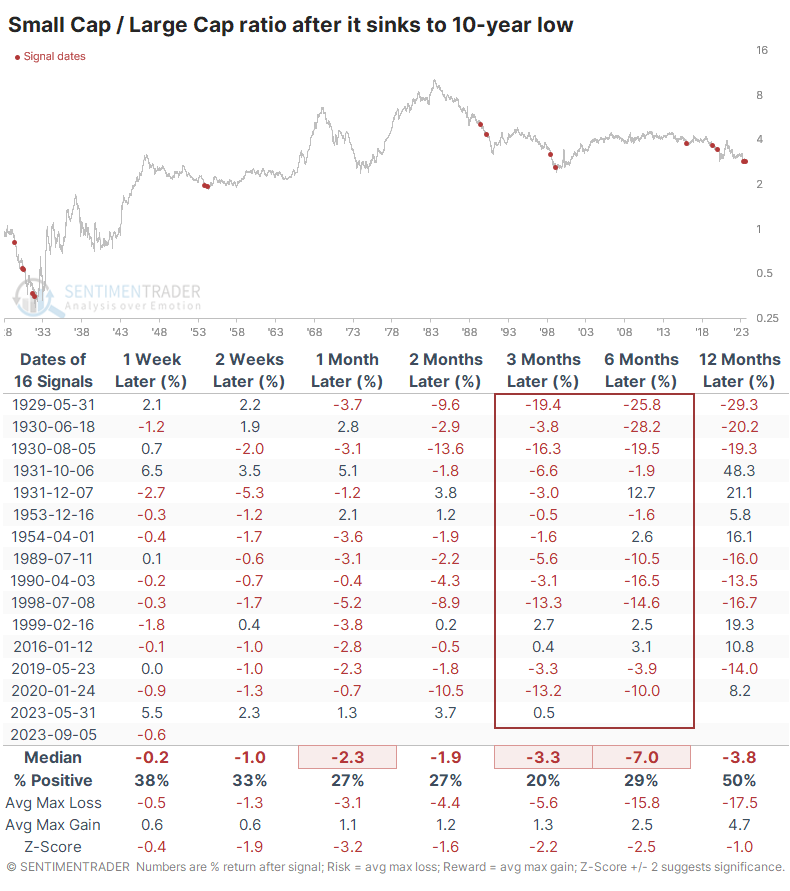
The total return on Small Caps was uninspiring. Over the next six months, the median return was -8.7%, which is horrid for a total return index. Even excluding the 1930s, returns were quite good four times but not the others.
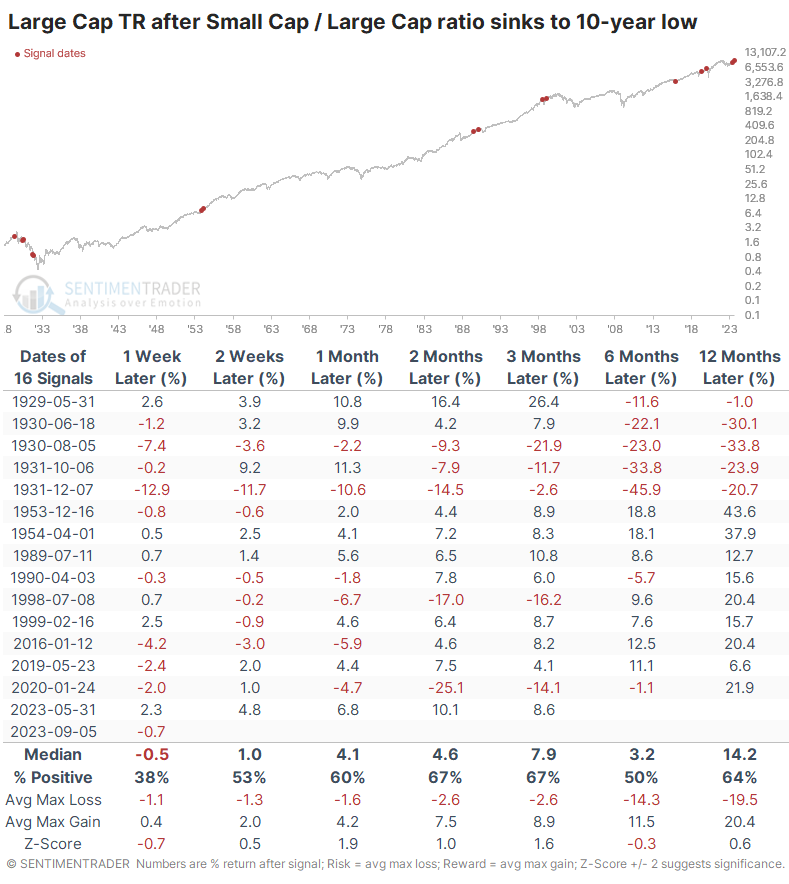
It was better for Large Caps. Since 1950, the twelve-month returns were positive each time, all but one by double digits.
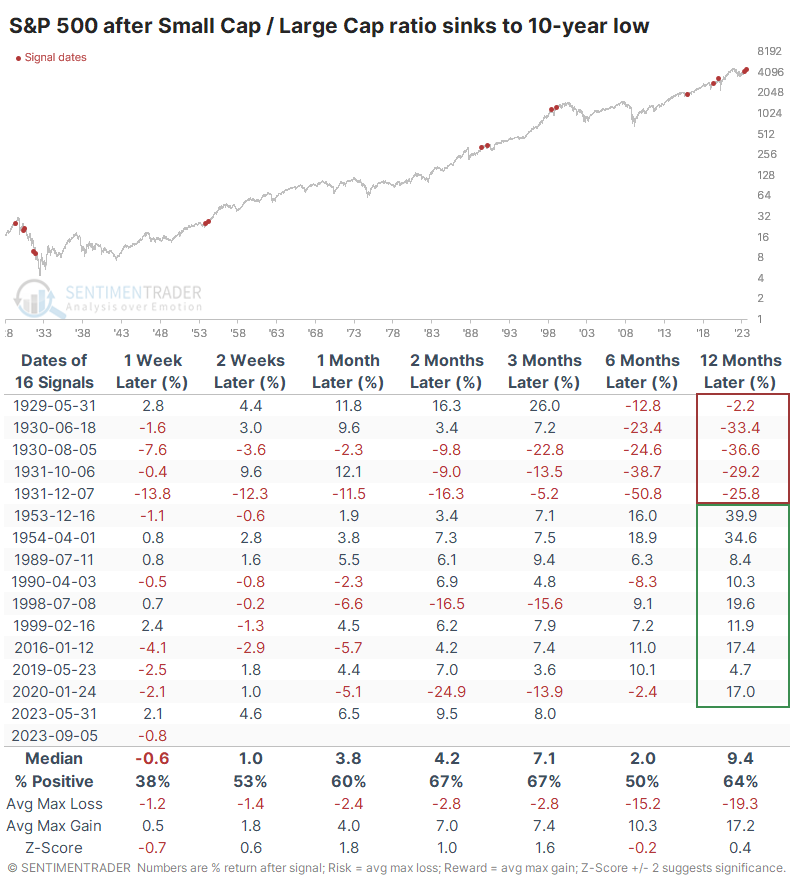
The price-only return for the S&P 500 was mostly positive but tepid, thanks to the handful of readings in the 1930s.
What the research tells us...
Whenever there is an extreme in an indicator, there is a tendency to assume it's naturally a sign of imminent mean-reversion. That's true for some indicators, in some markets, but not for all...or maybe even most. One area where price-based extremes tend to be more of a continuation than mean-reversion signals is factor ratios - growth/value, defensive/cyclical, etc.
When it comes to small versus large stocks, it seems evident we've witnessed another extreme as the ratio has plunged to the lowest in decades. Historically, similarly poor behavior by Small Caps preceded even worse performance relative to Large Caps. This is one of those factor relationships that tends to see extremes lead to a continuation of the immediate trend.
Indicators at Extremes
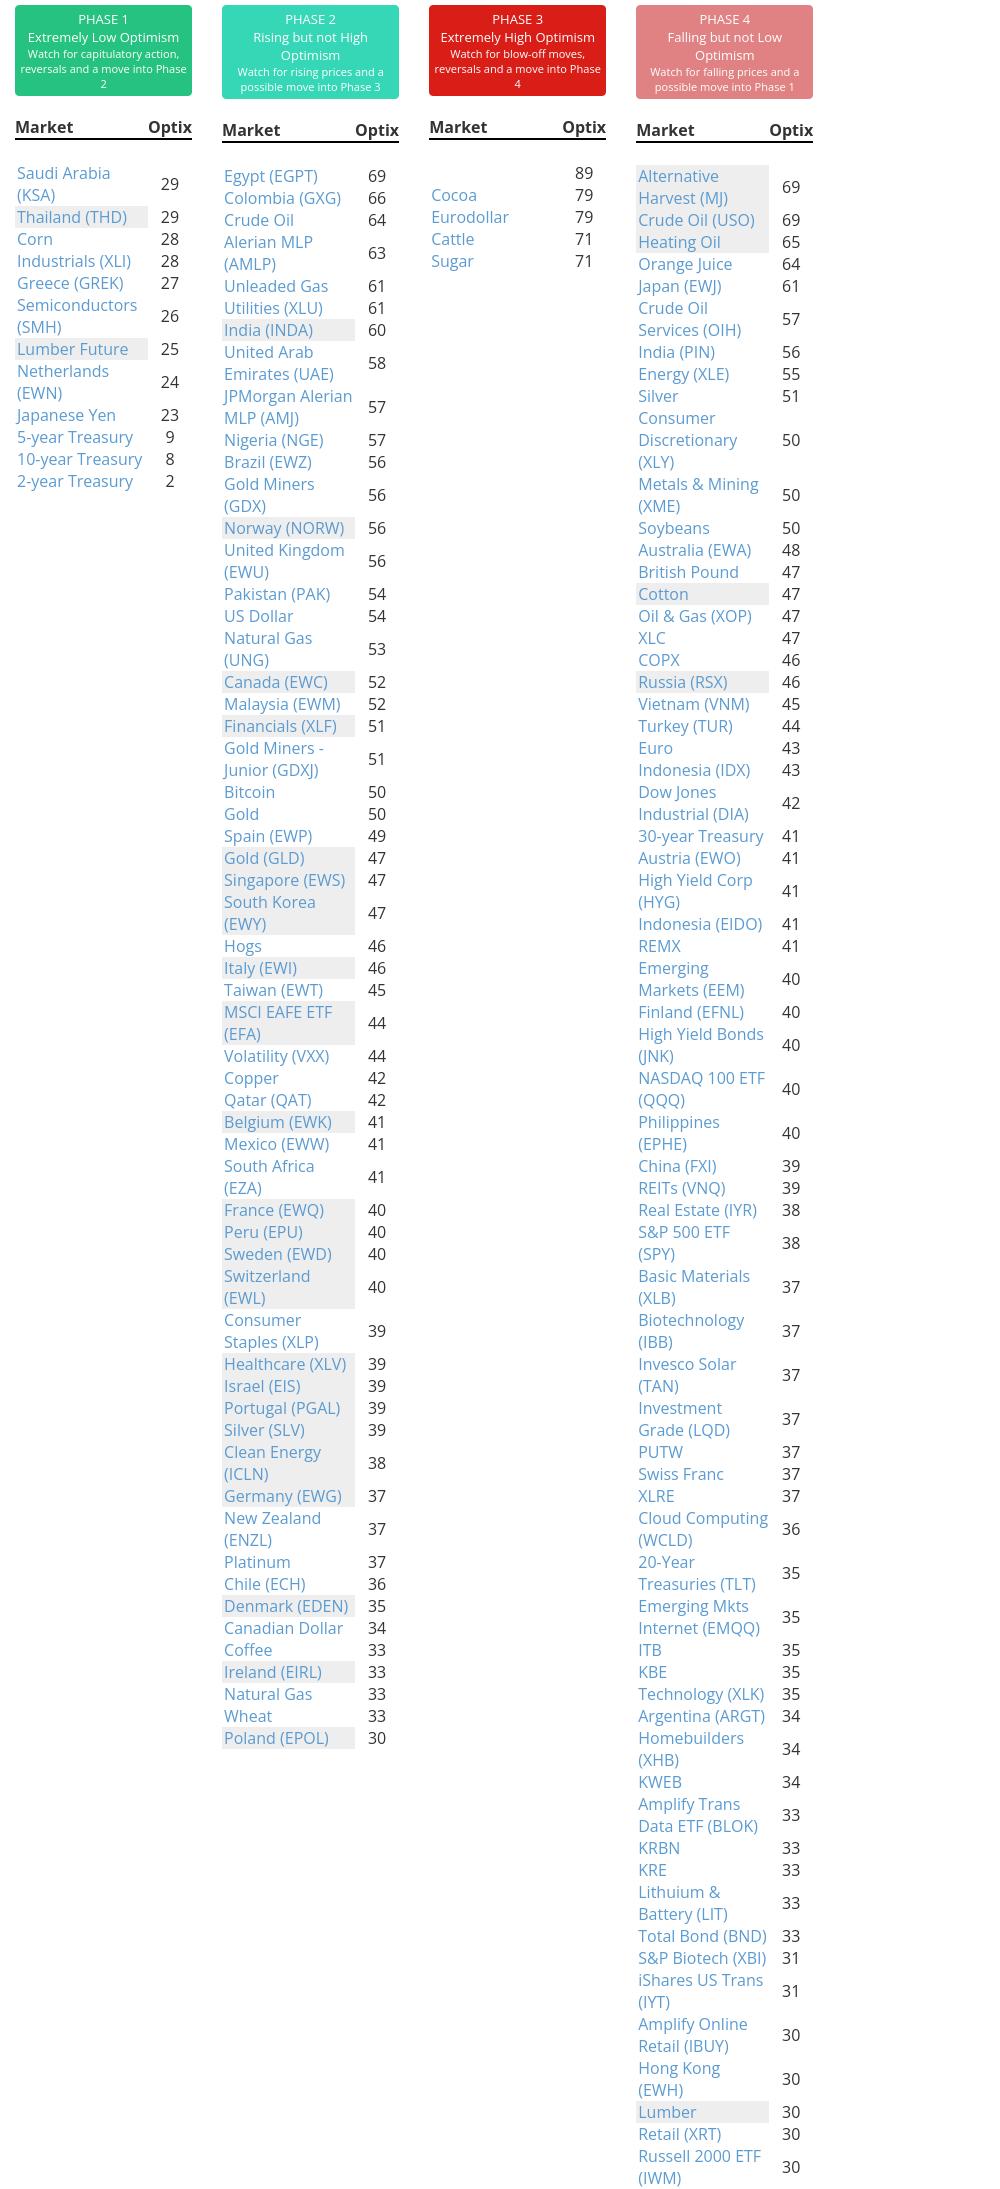
Phase Table
Ranks
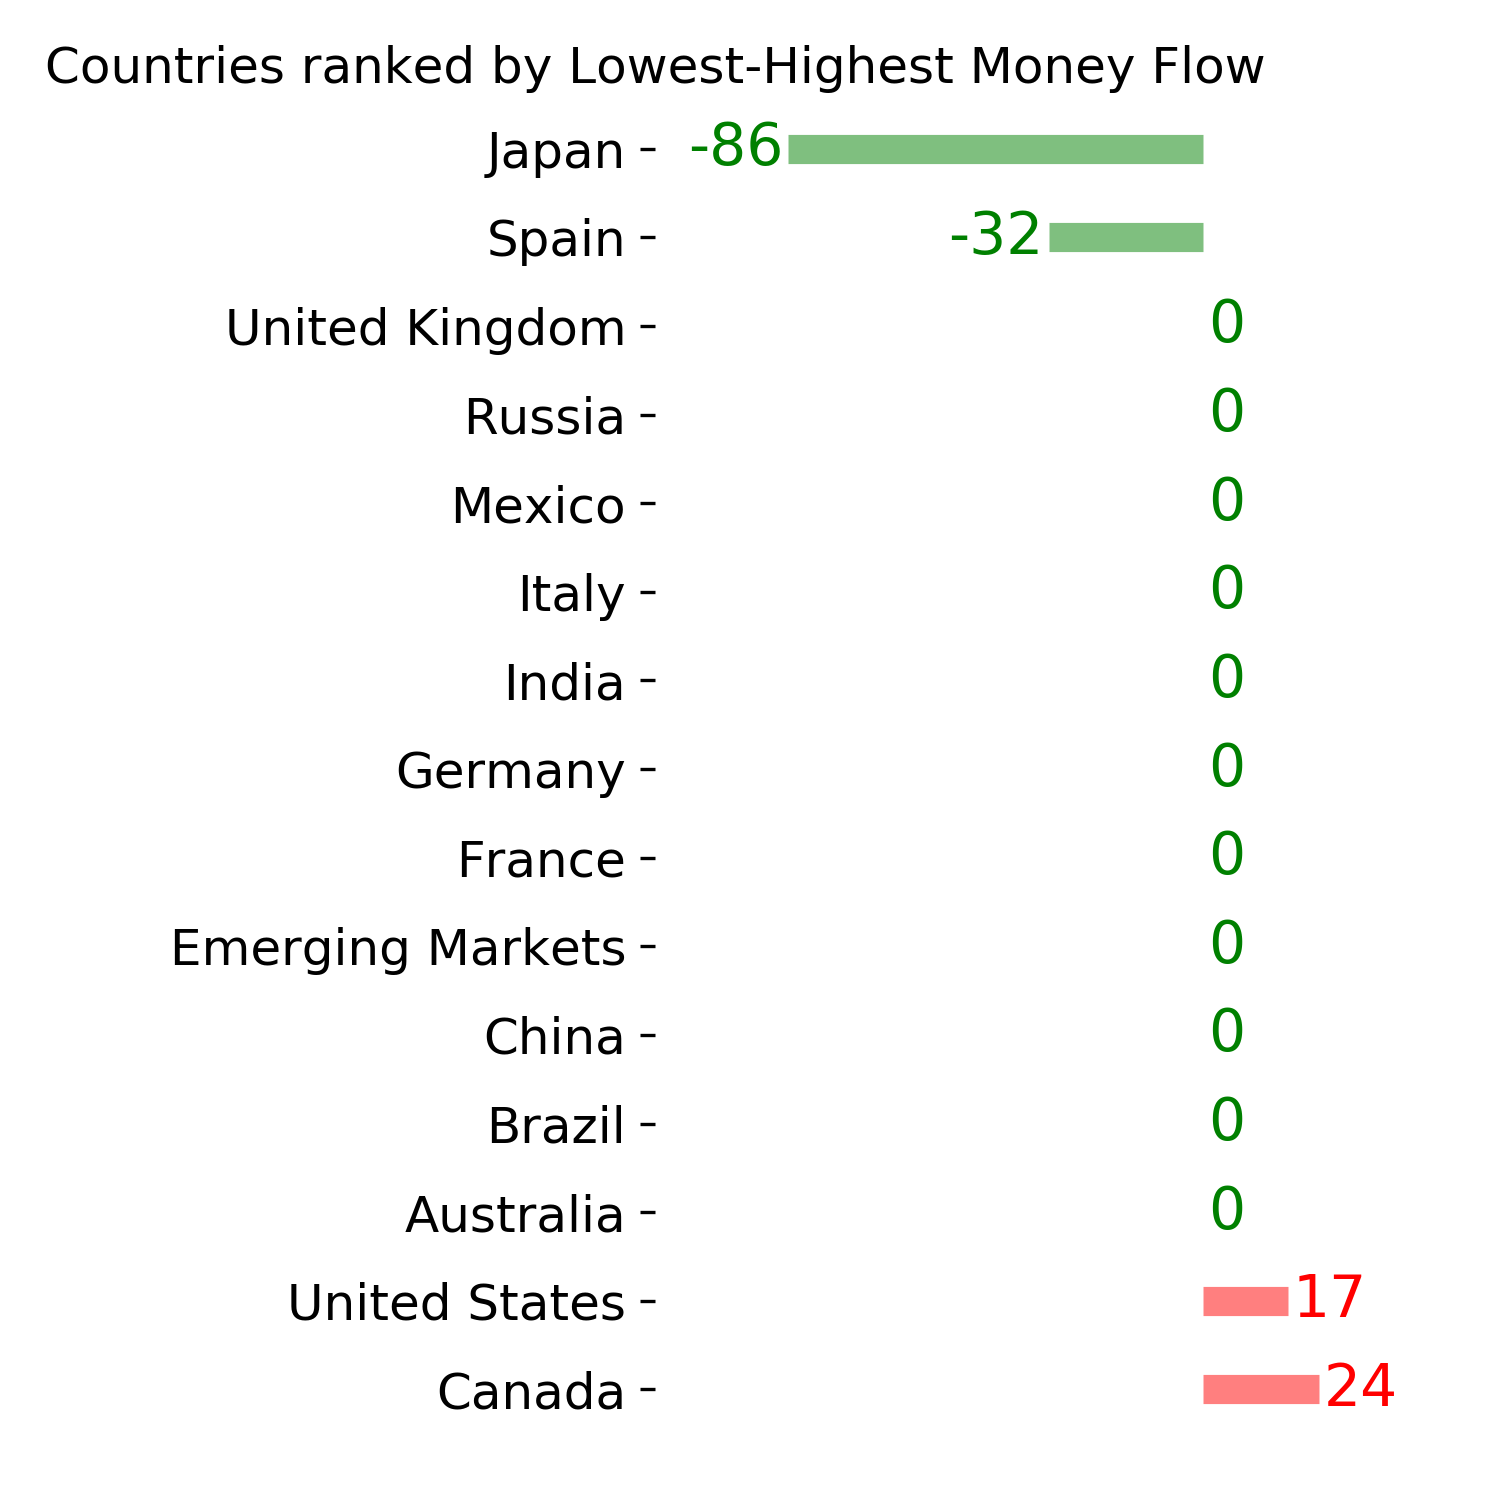
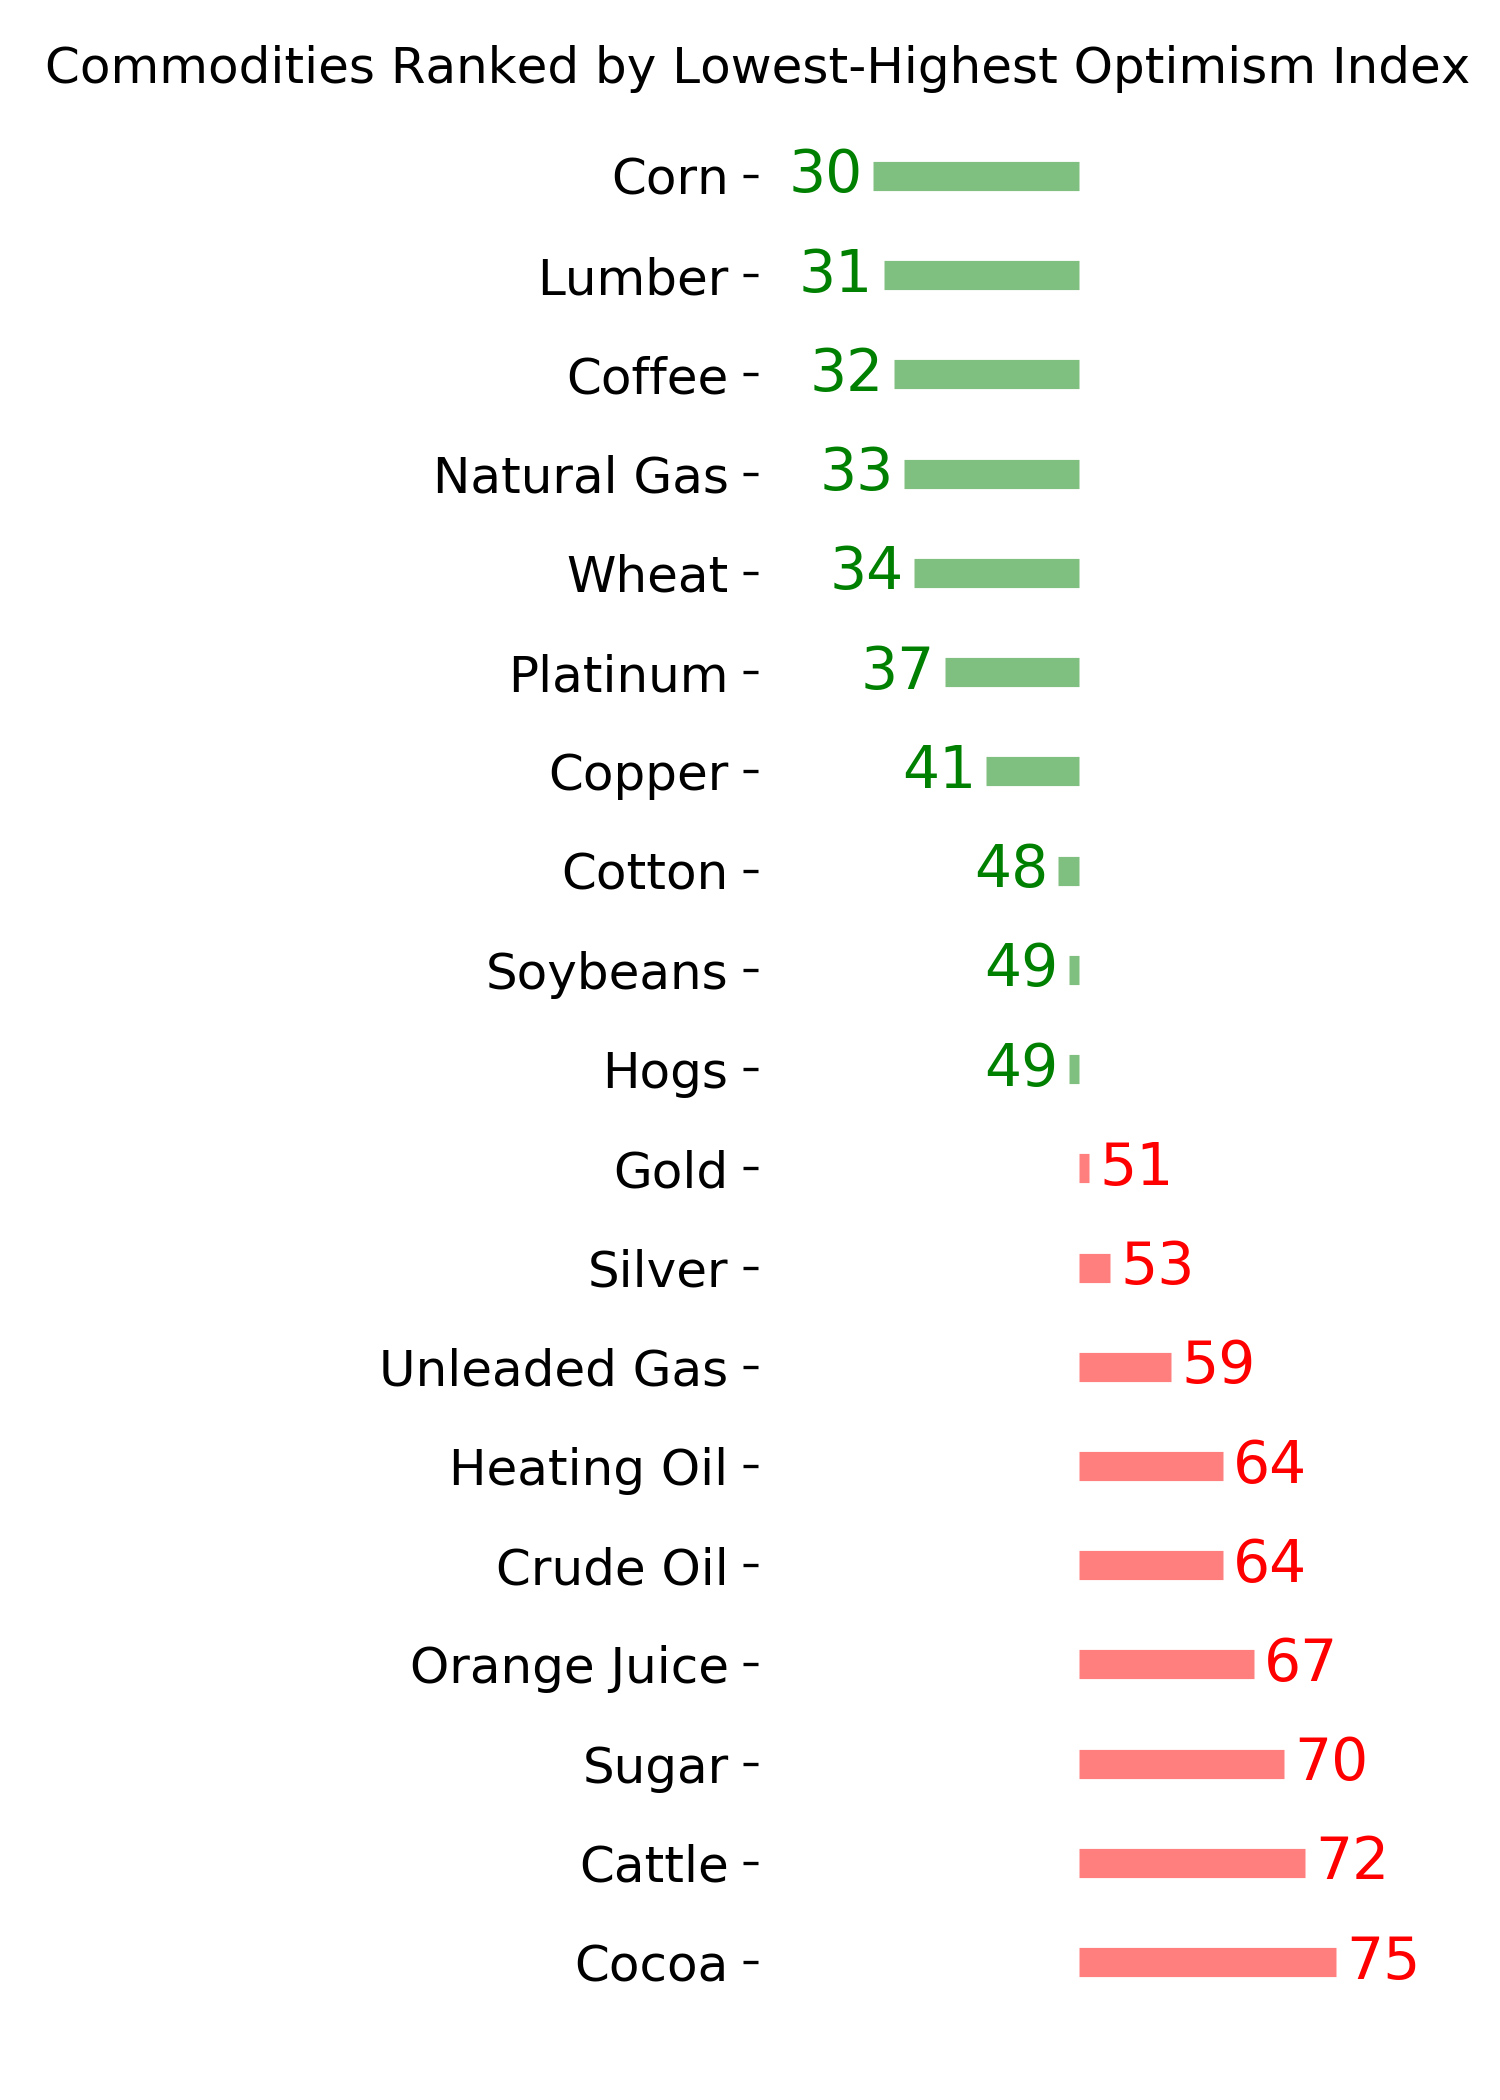
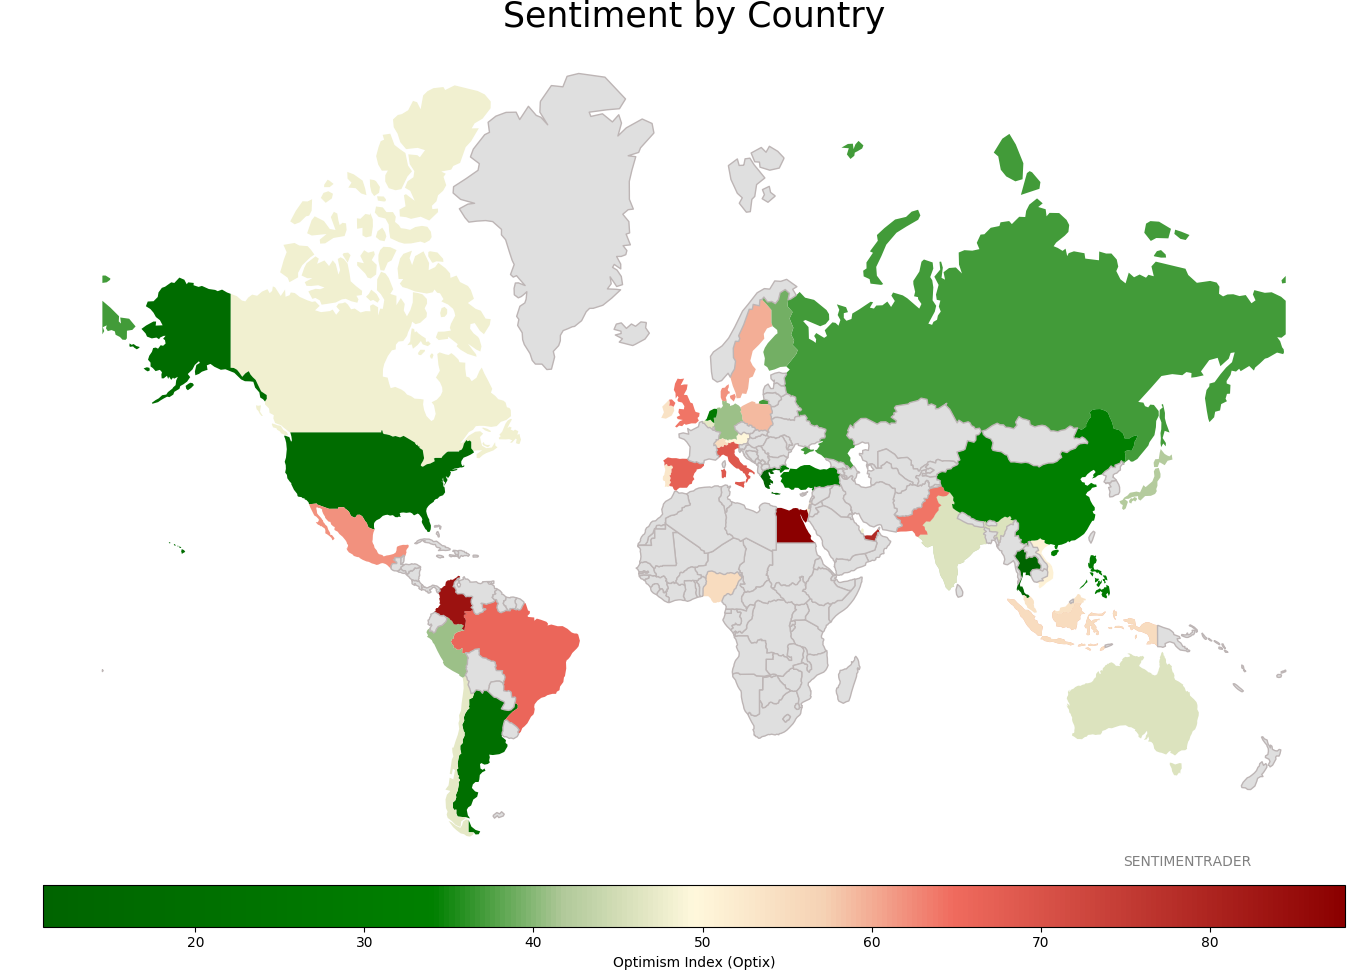
Sentiment Around The World
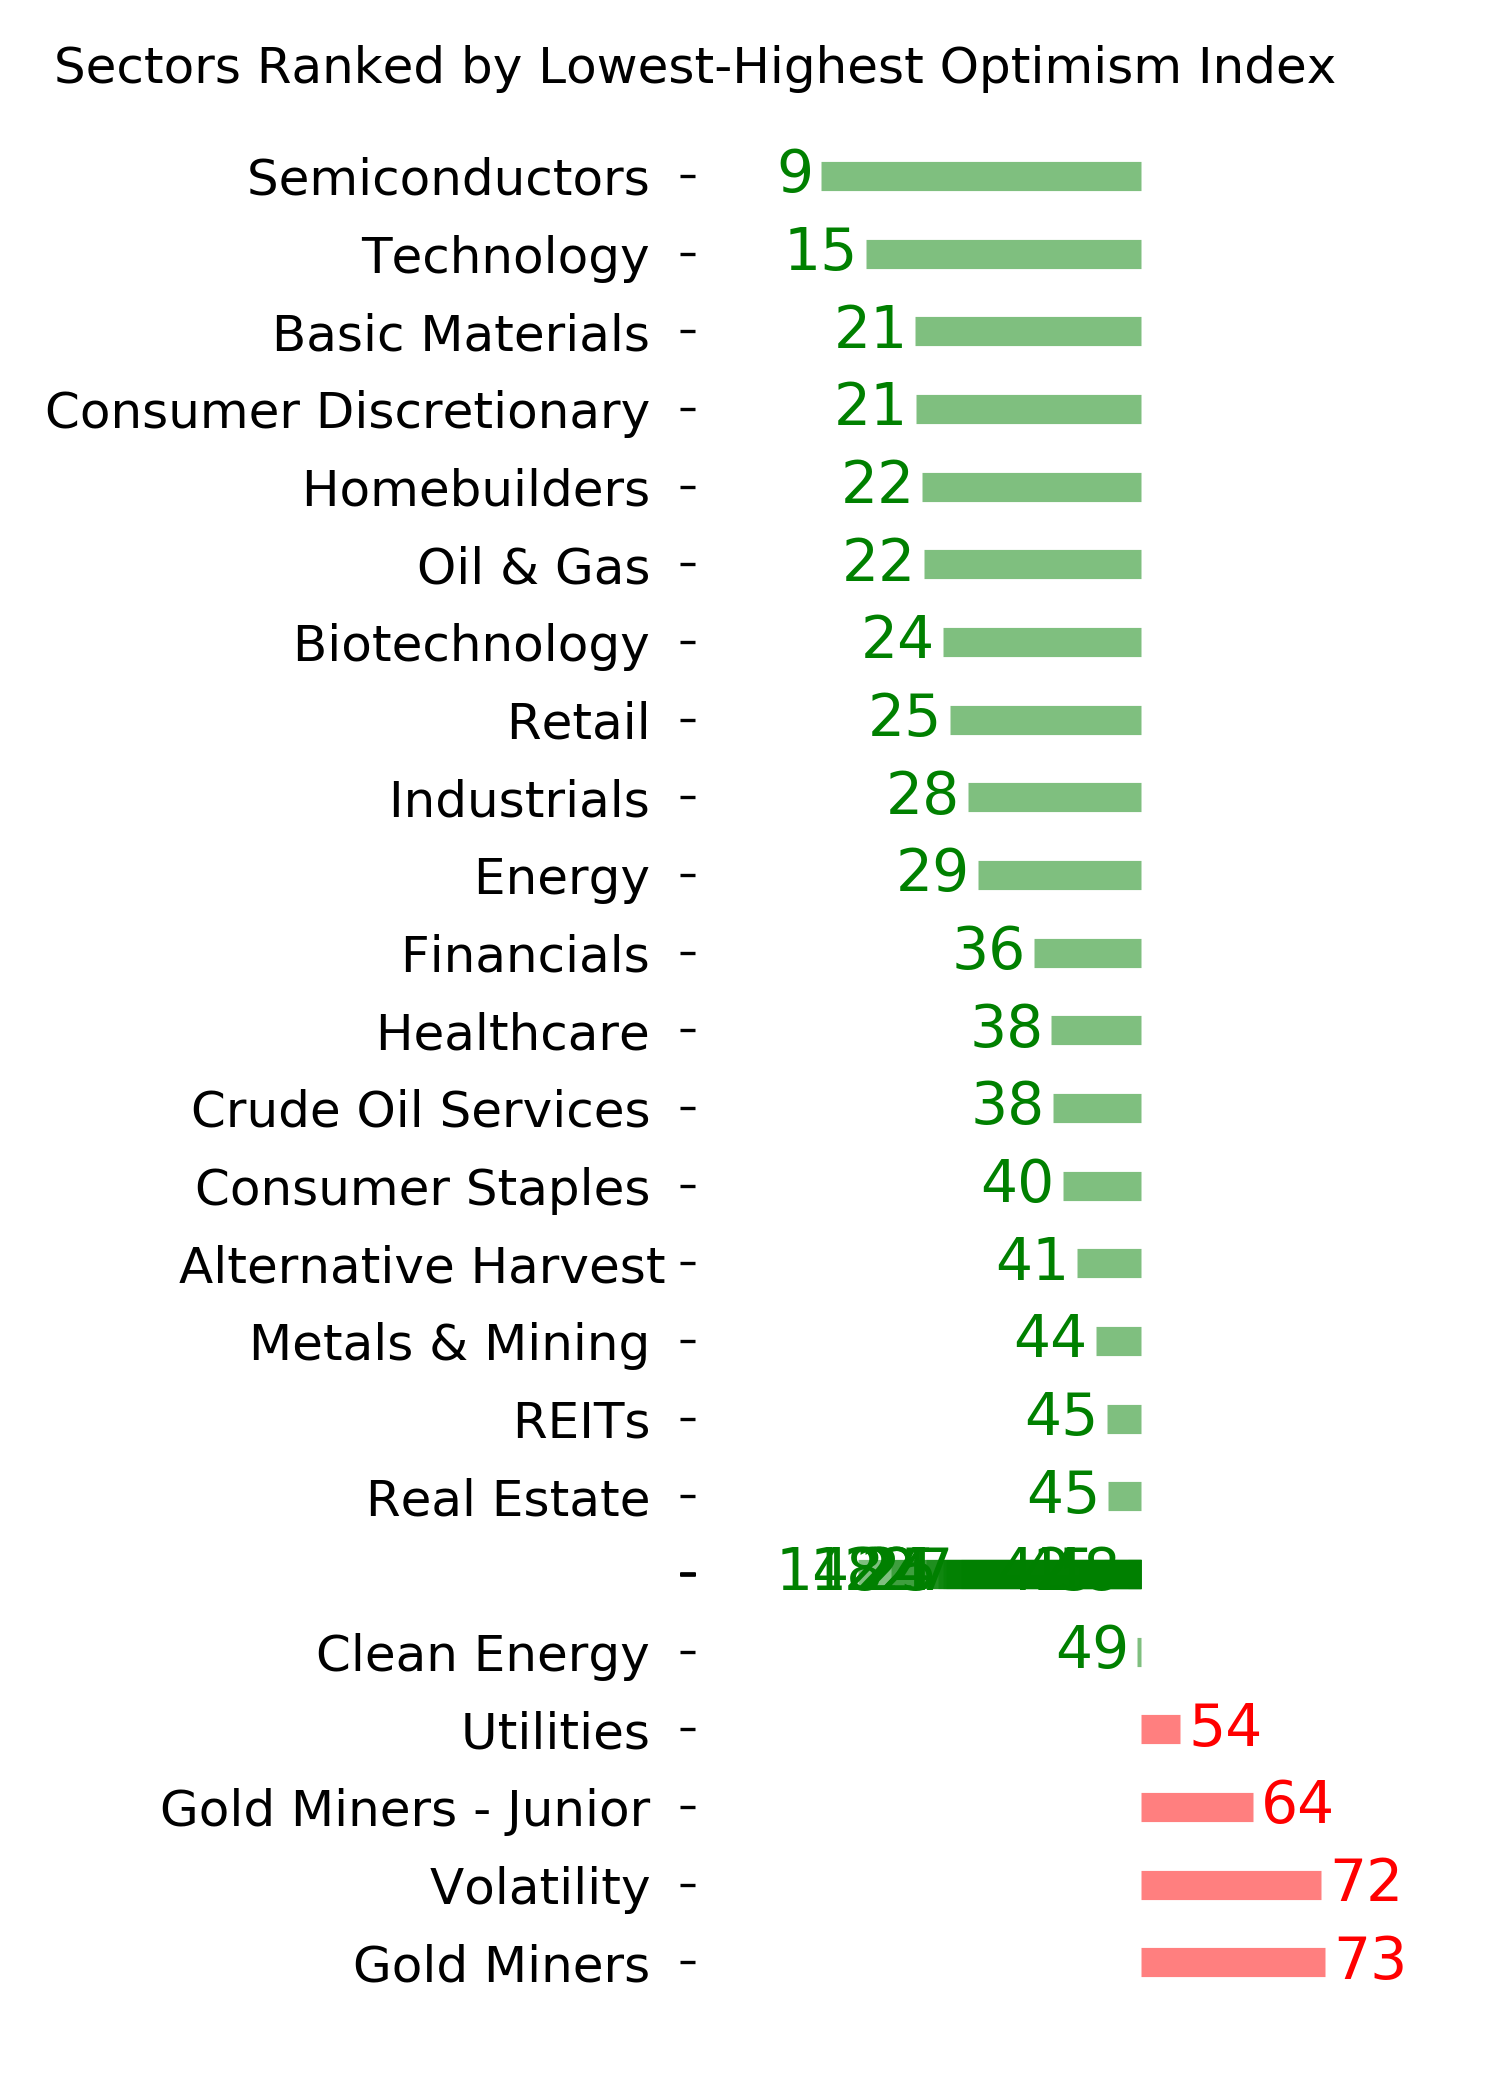
Optimism Index Thumbnails
|
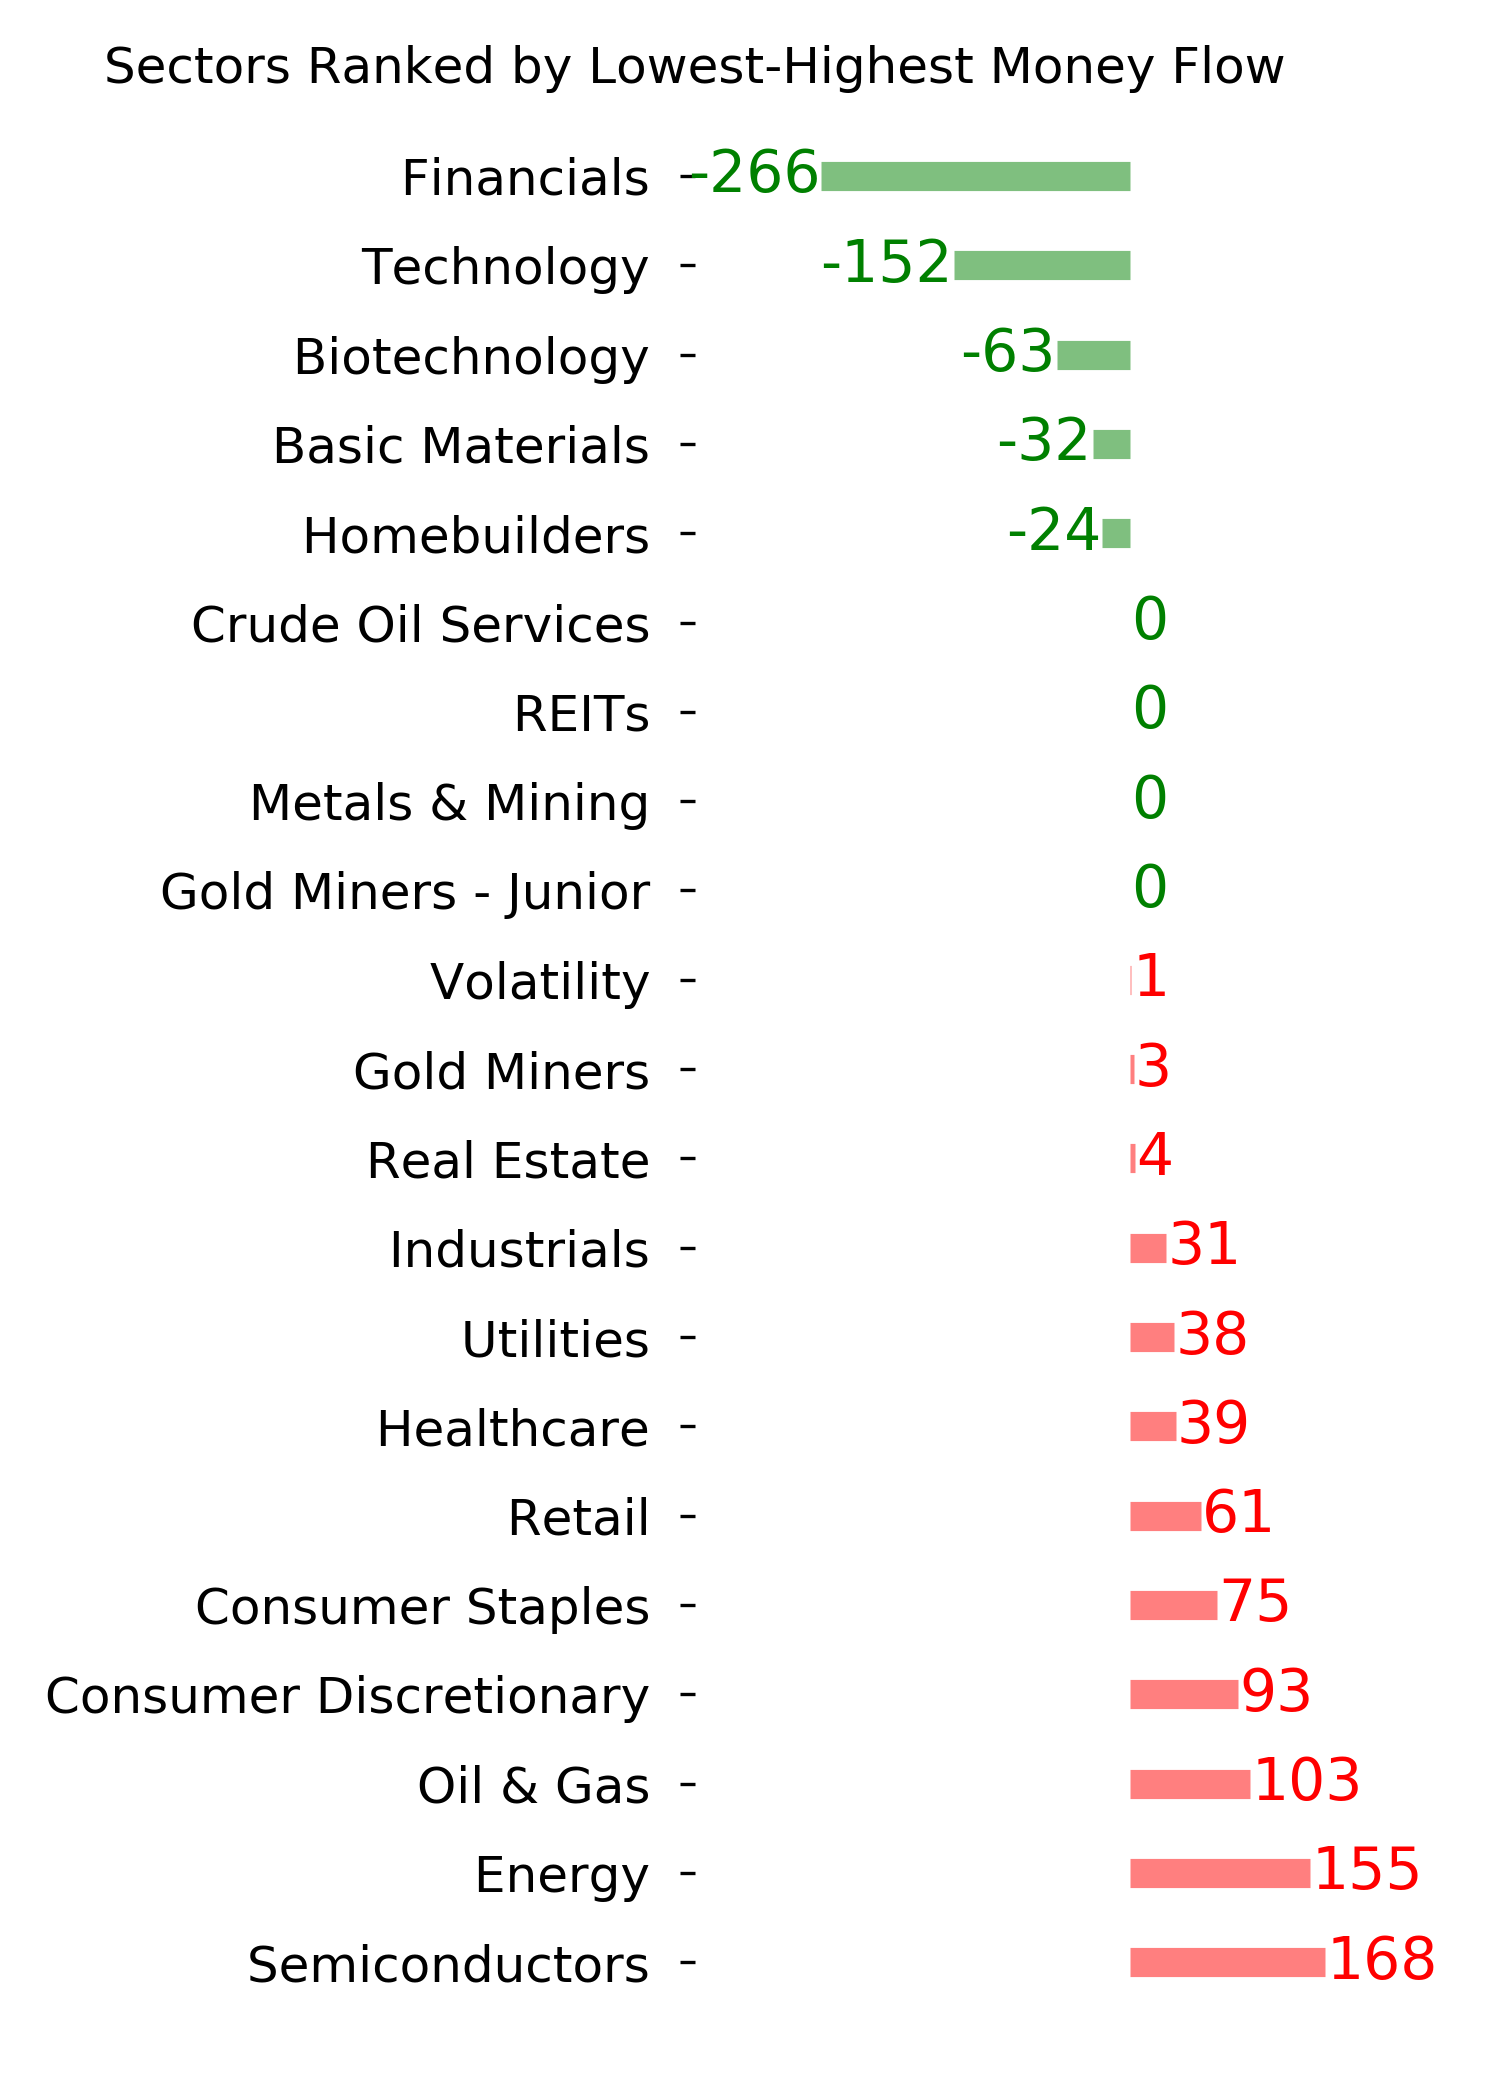
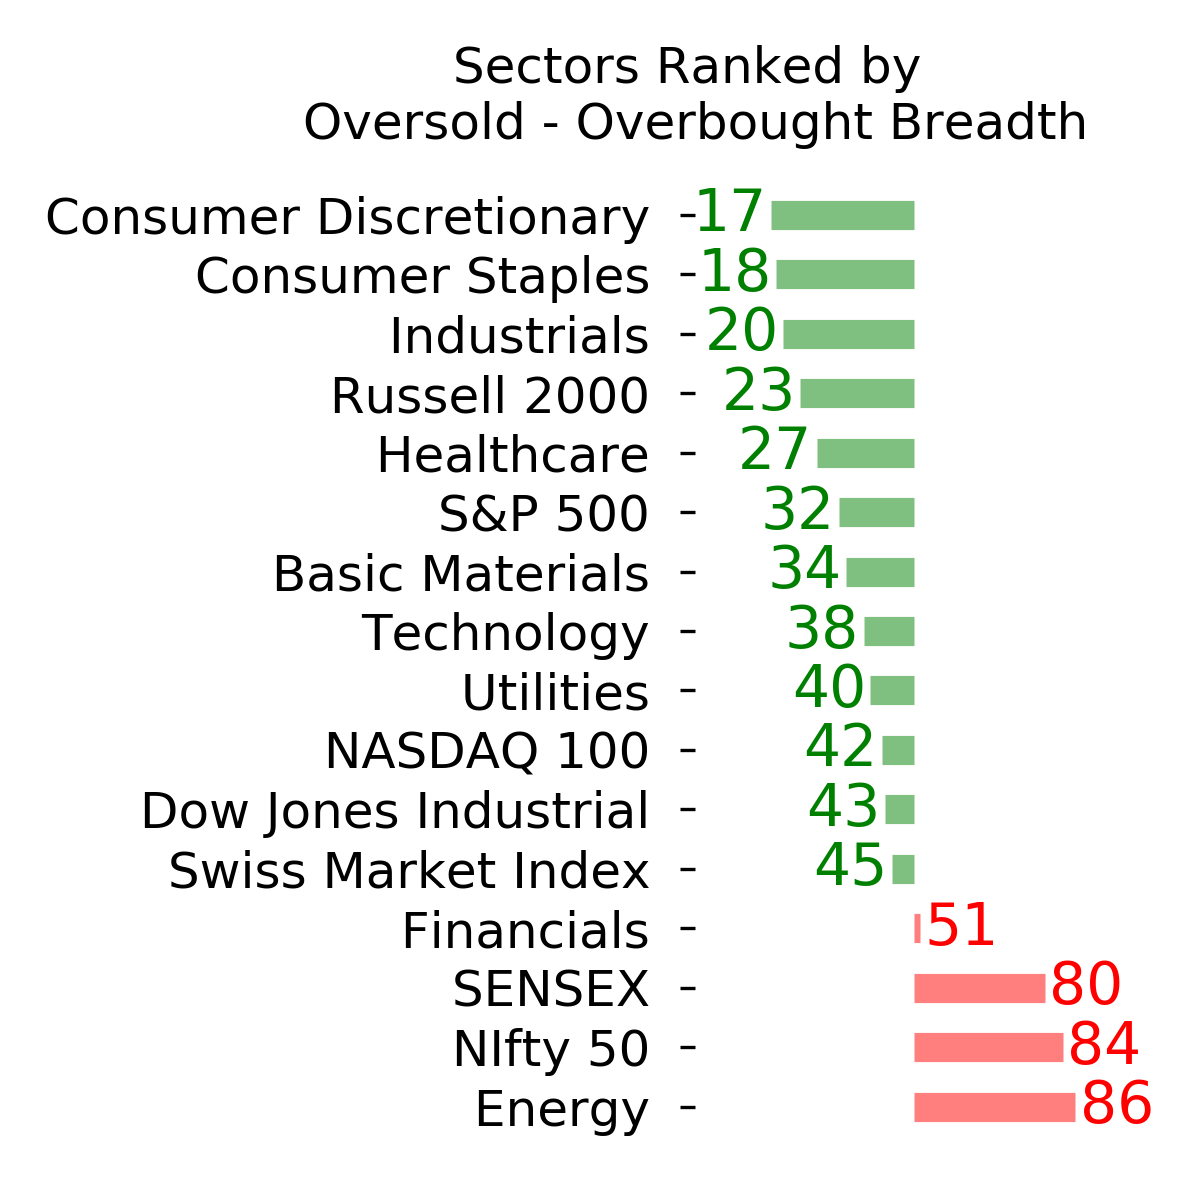
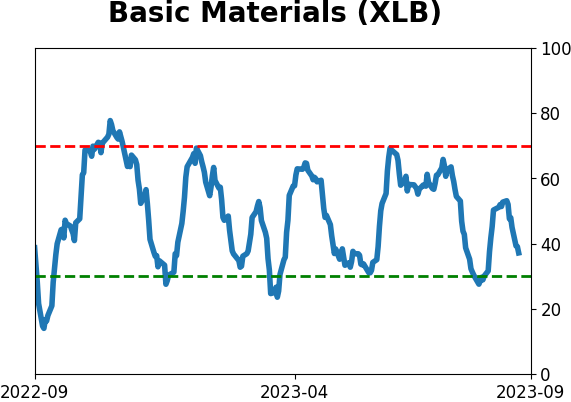
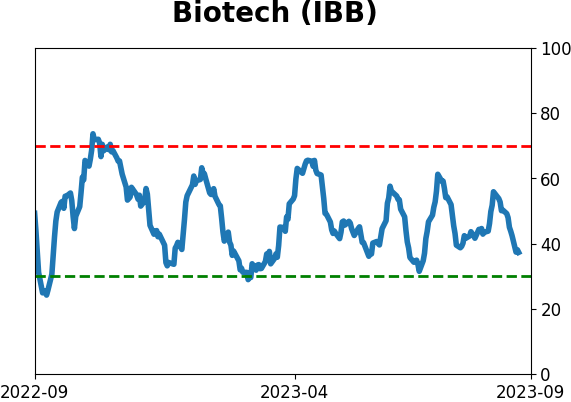
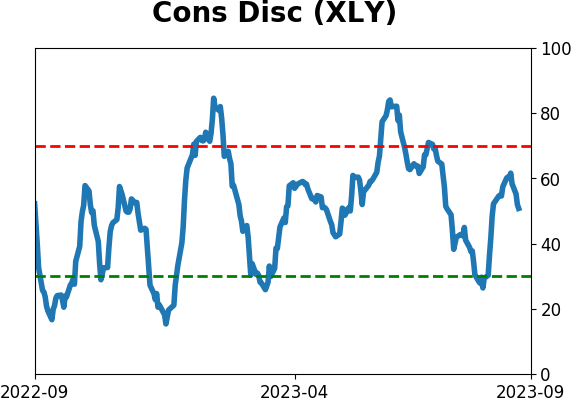
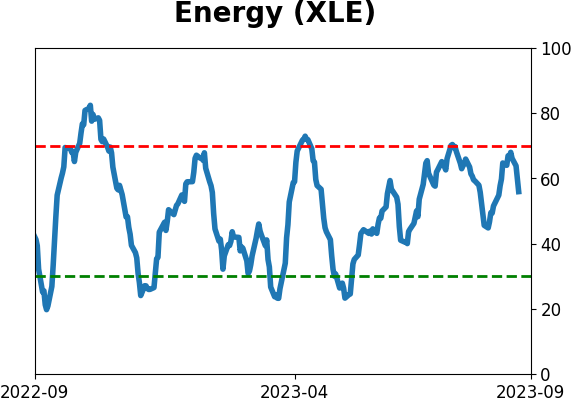
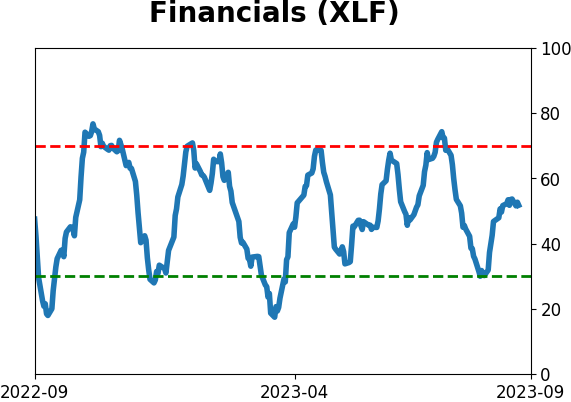
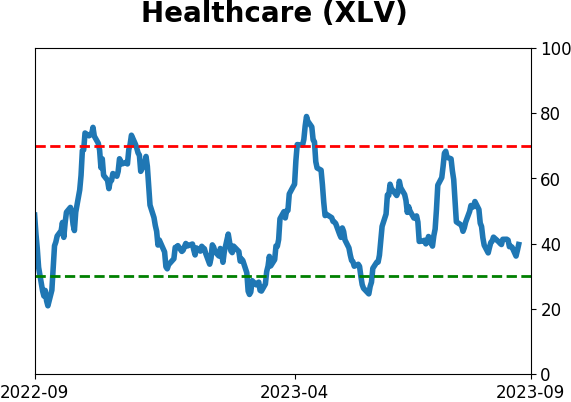
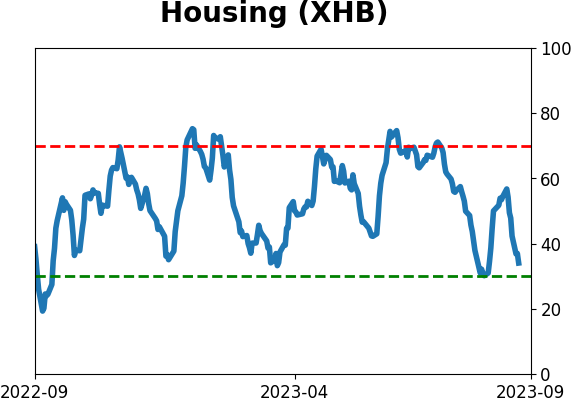
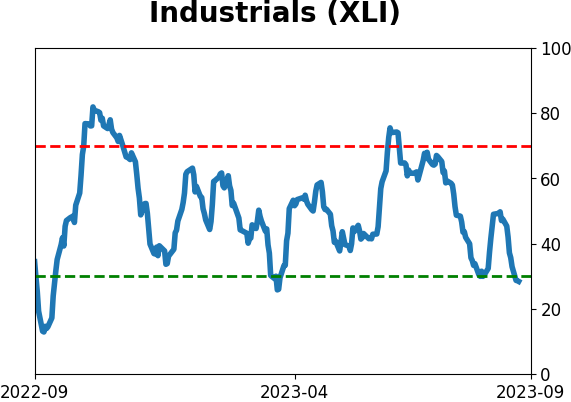
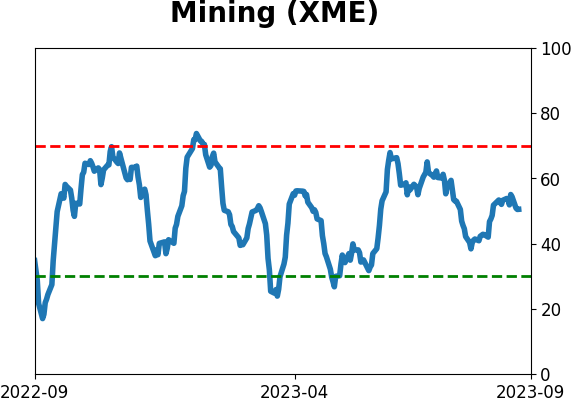
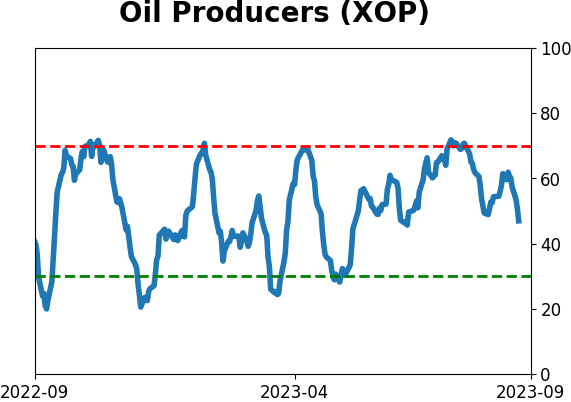
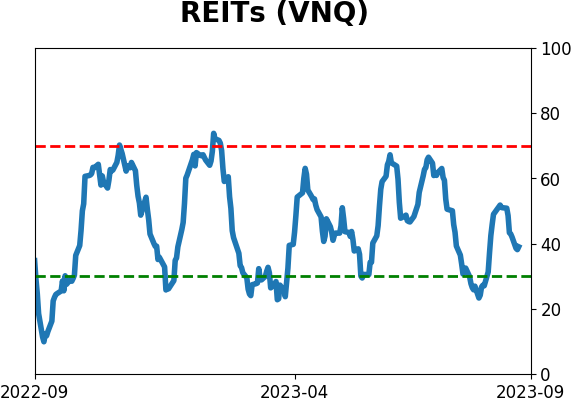
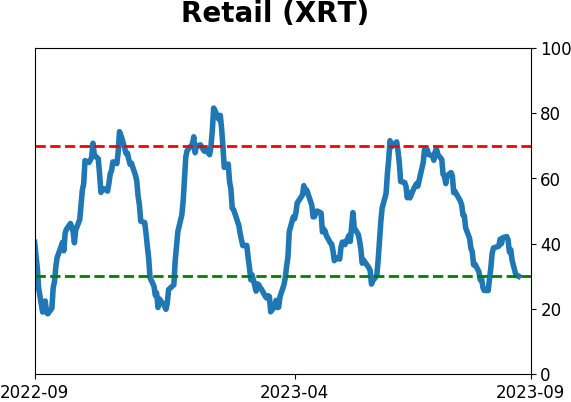
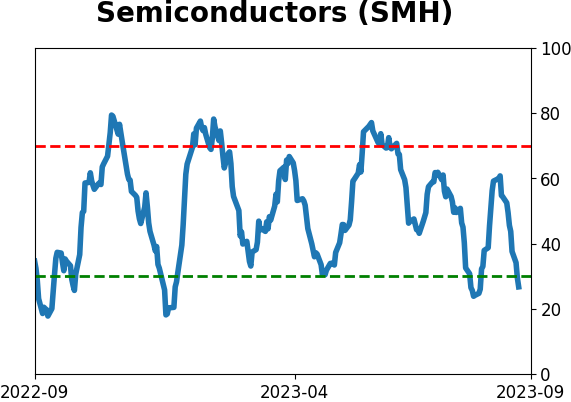
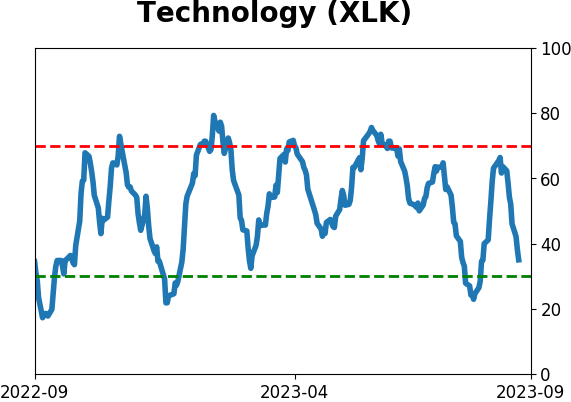
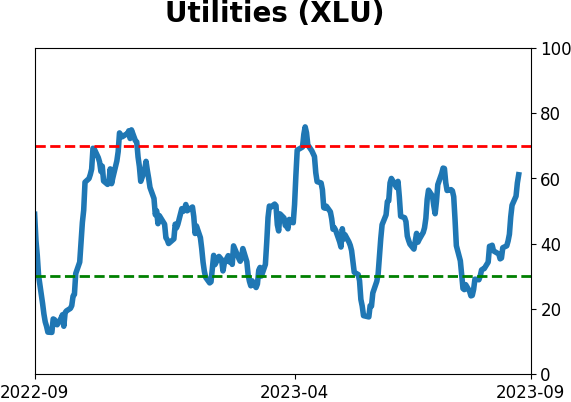
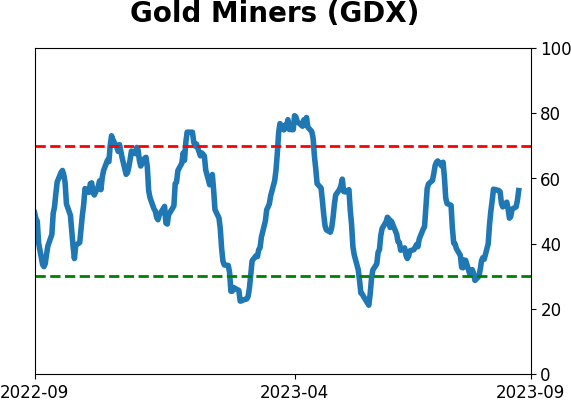
Sector ETF's - 10-Day Moving Average
|
|
|
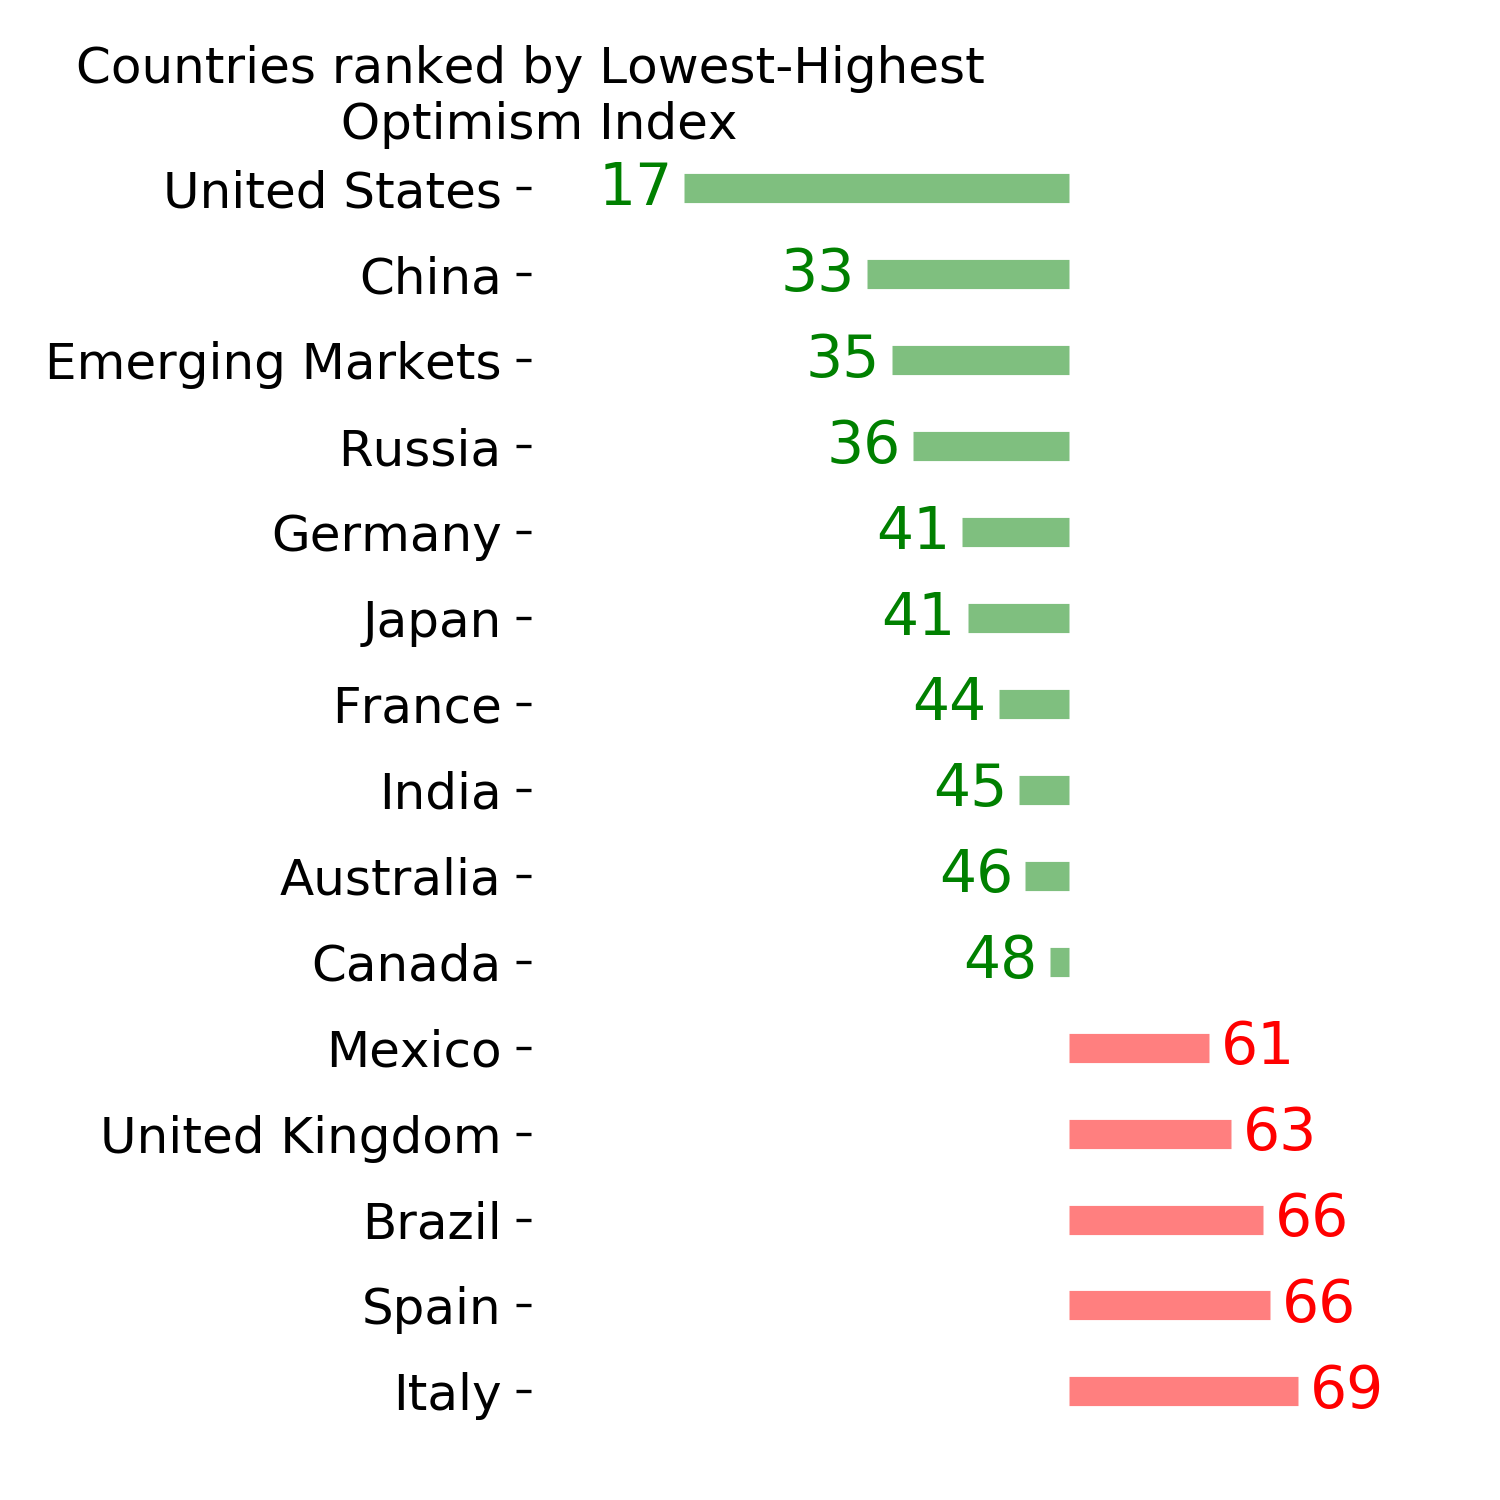
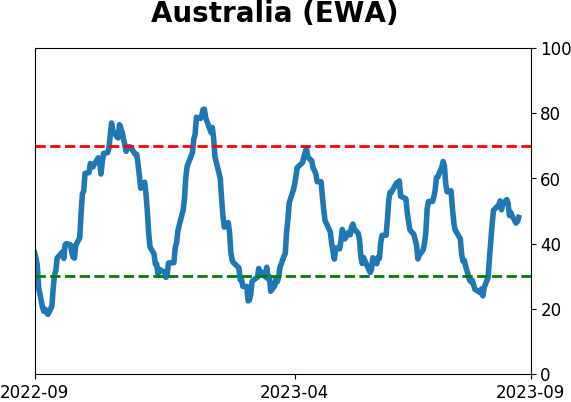
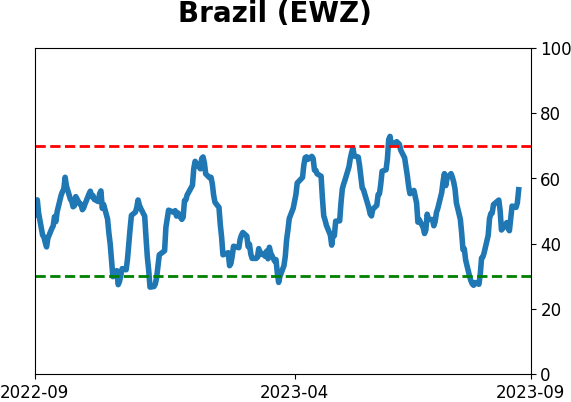
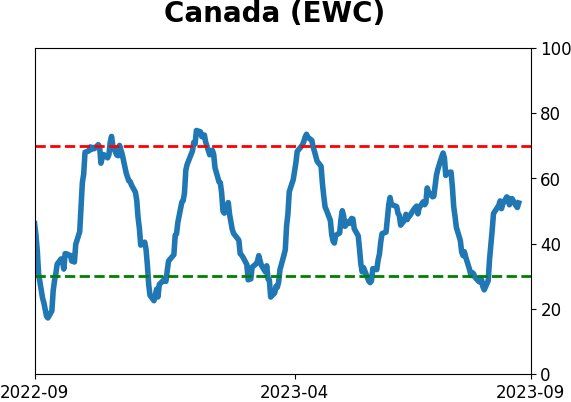
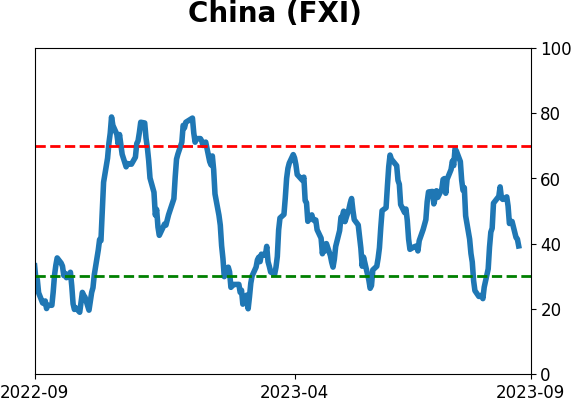
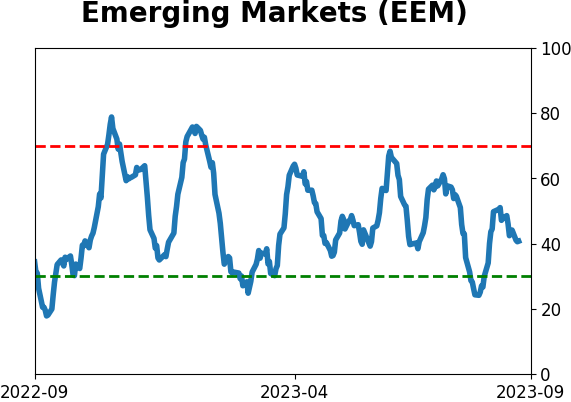
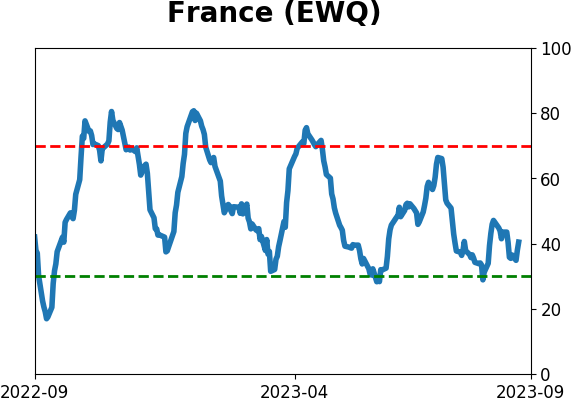
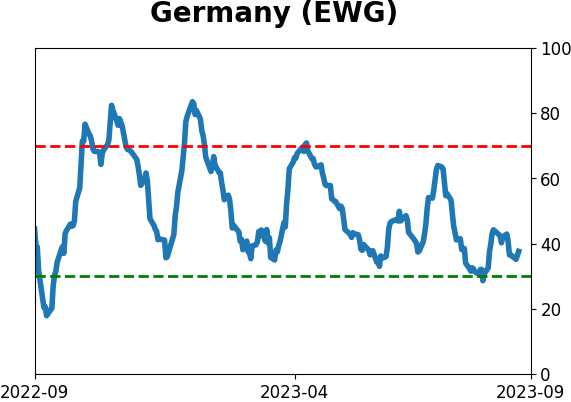
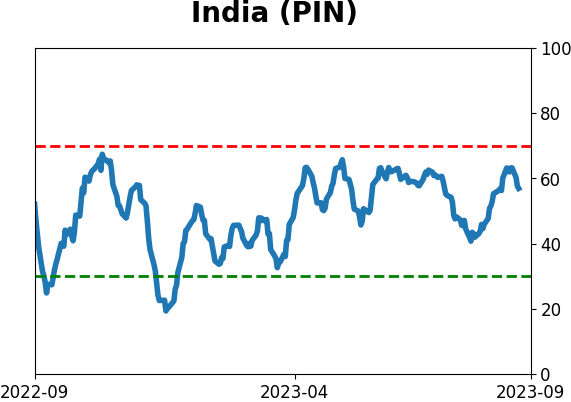
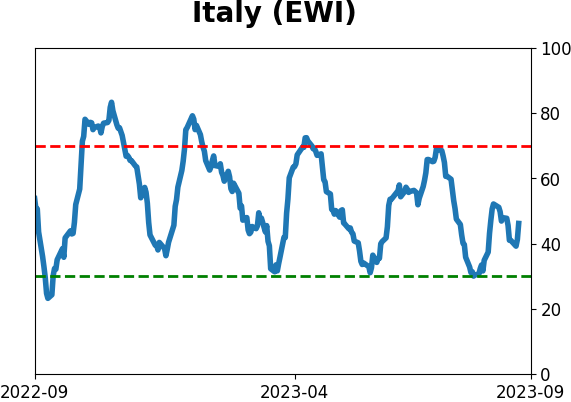
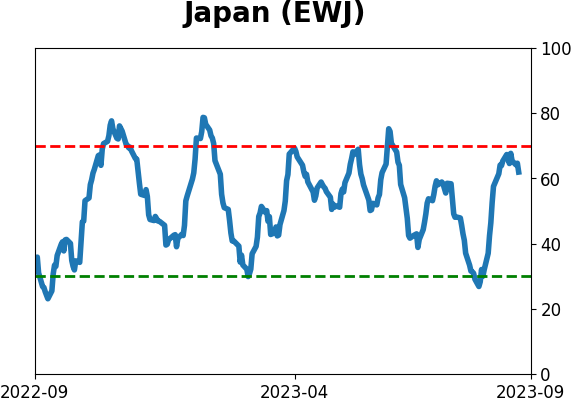
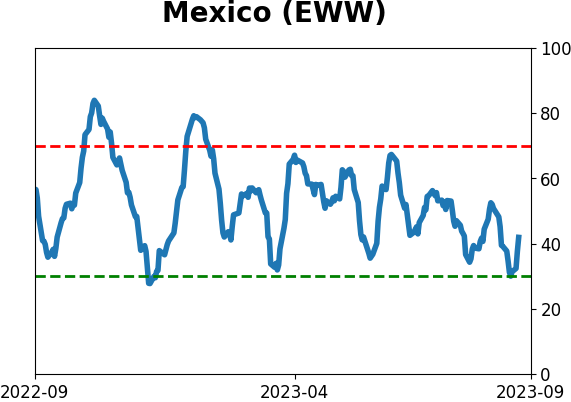
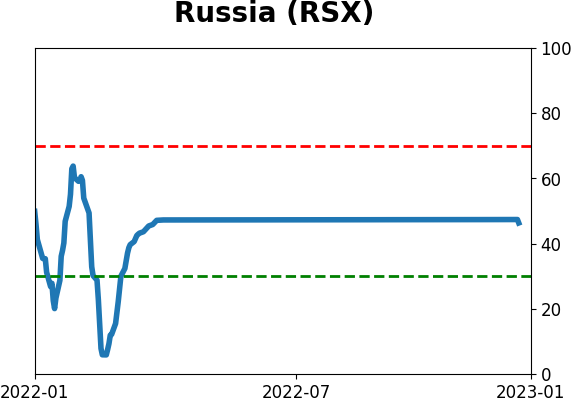
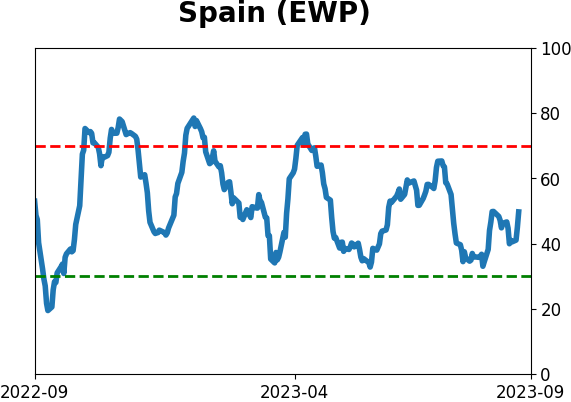
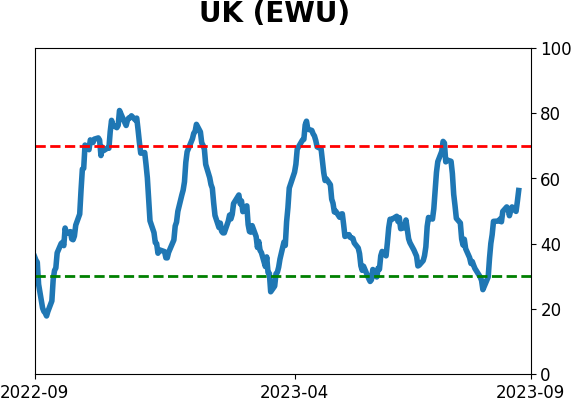
Country ETF's - 10-Day Moving Average
|
|
|
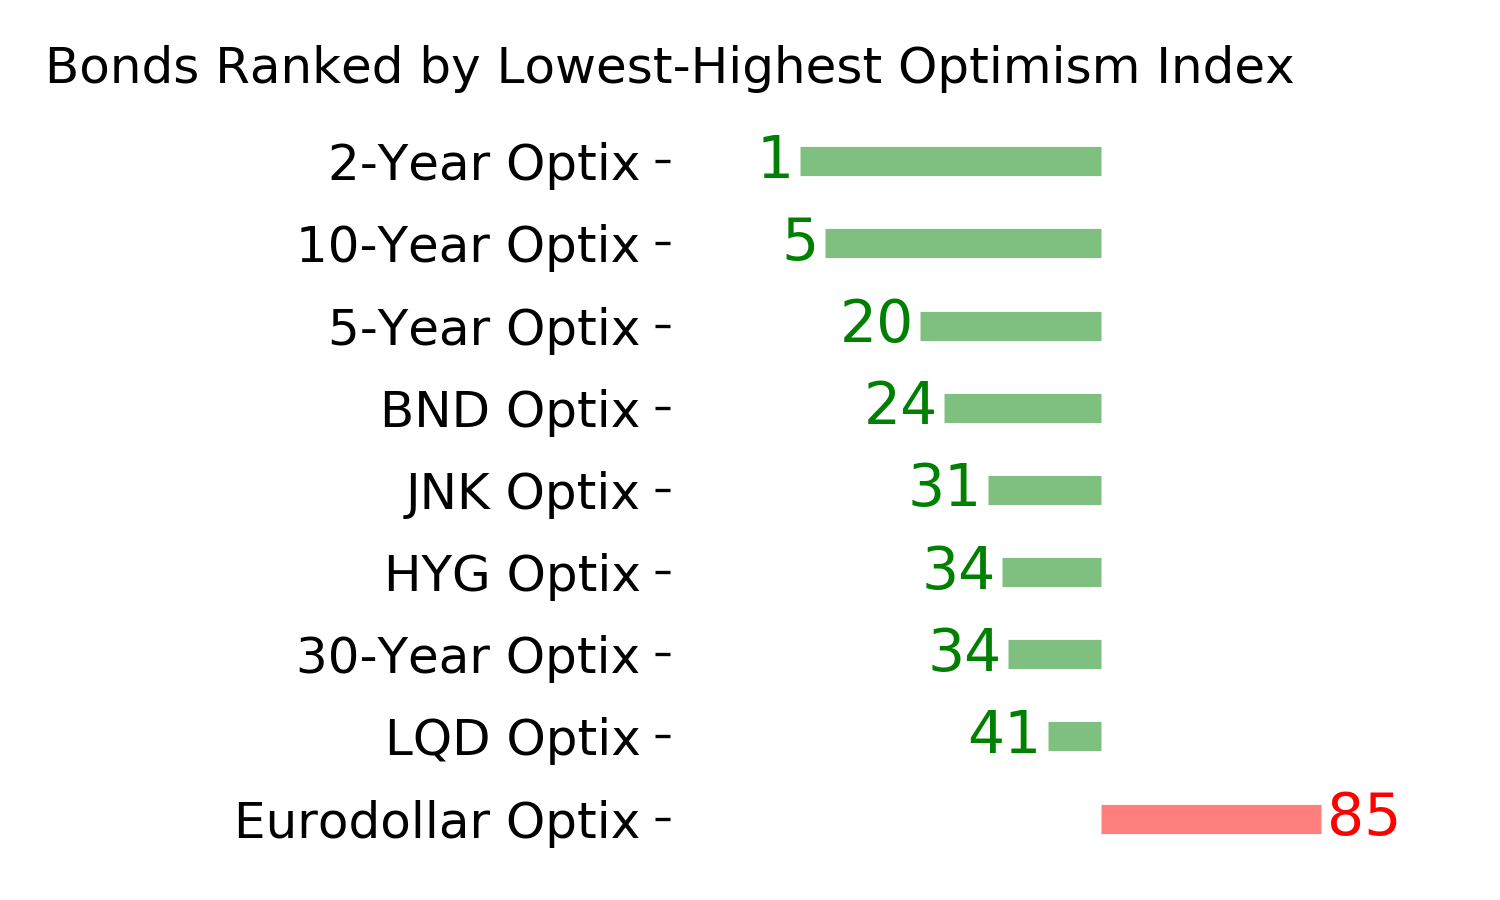
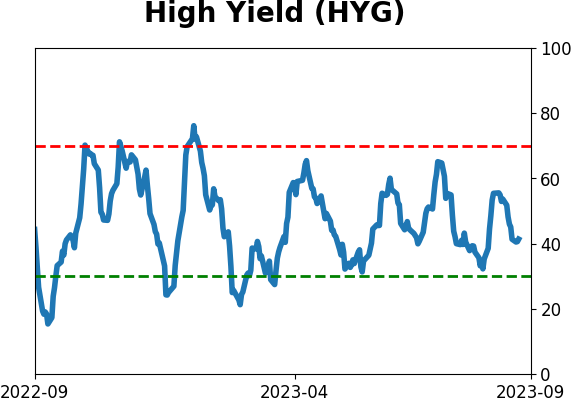
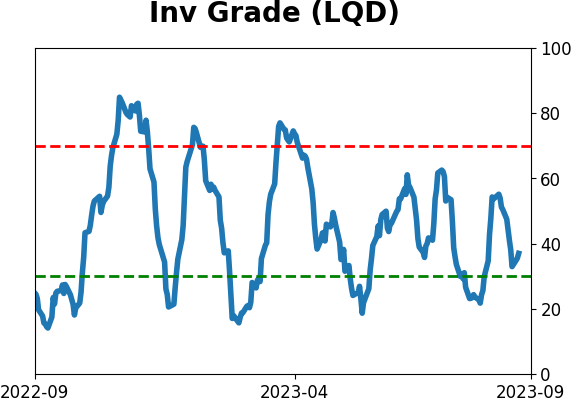
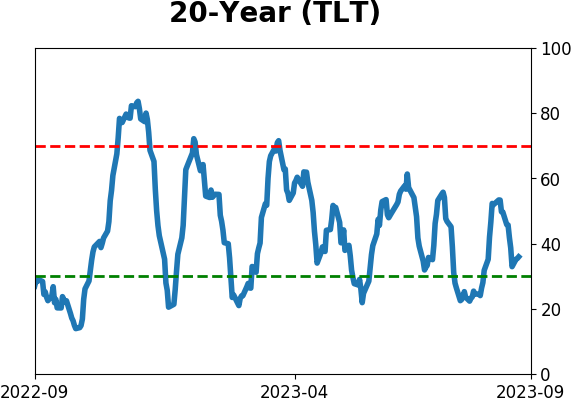
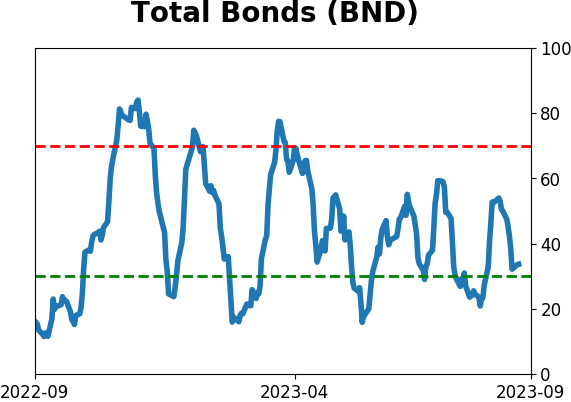
Bond ETF's - 10-Day Moving Average
|
|
|
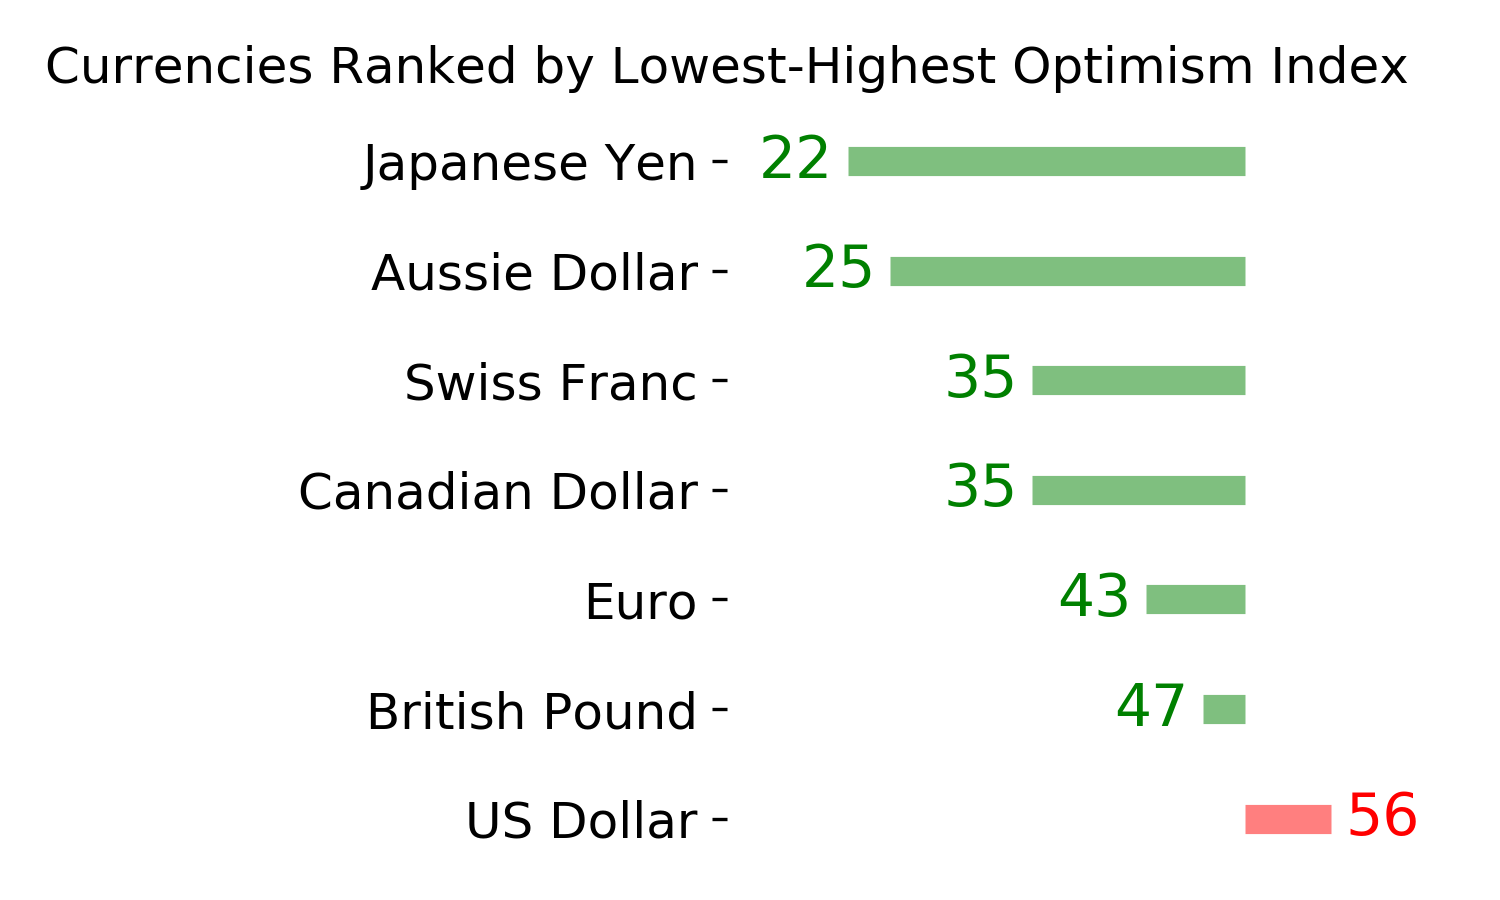
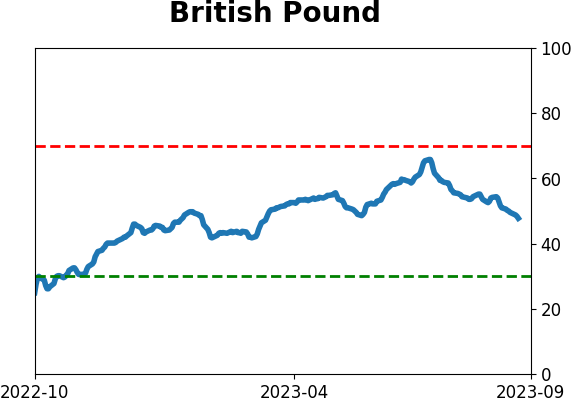
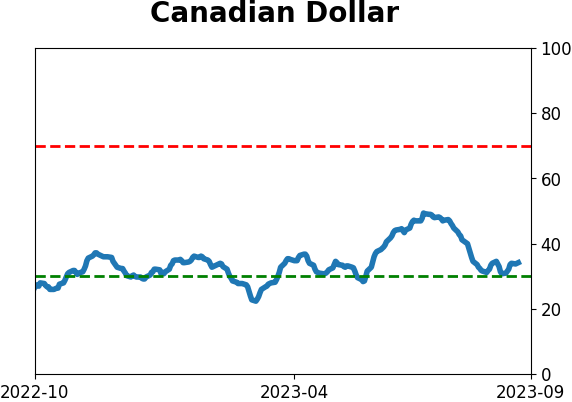
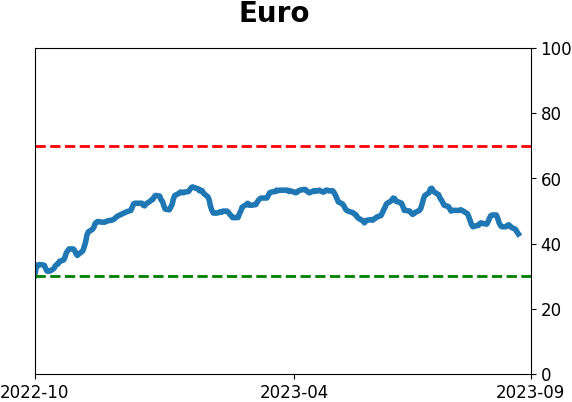
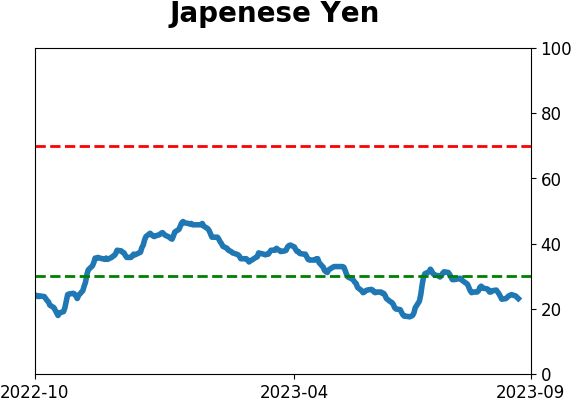
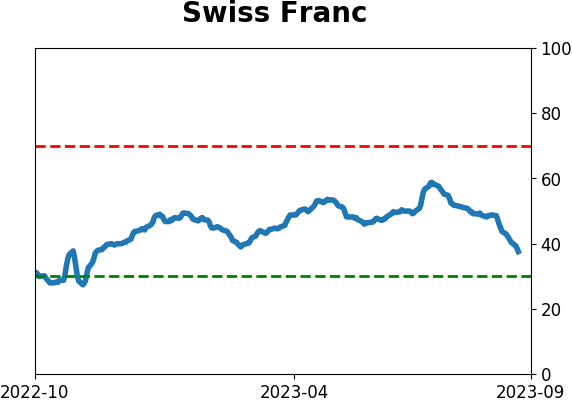
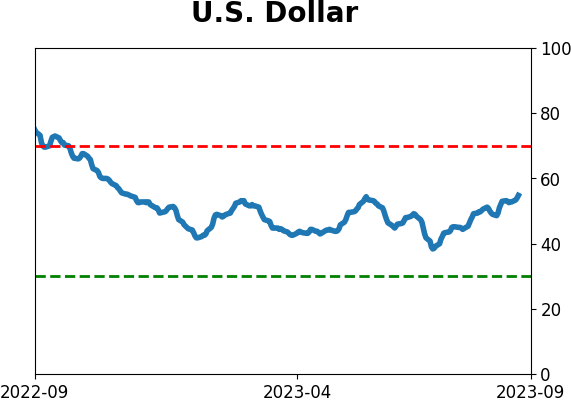
Currency ETF's - 5-Day Moving Average
|
|
|
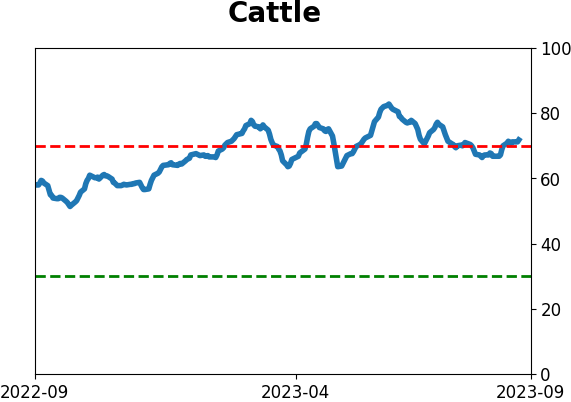
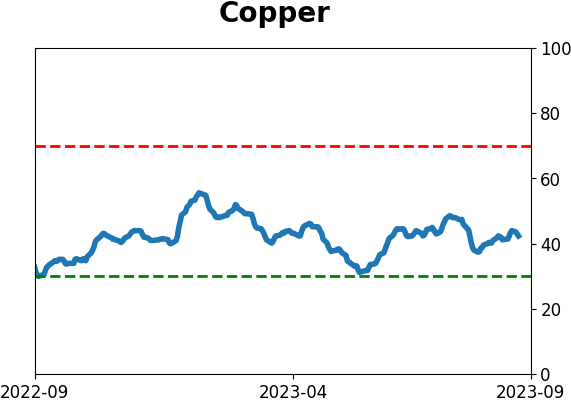
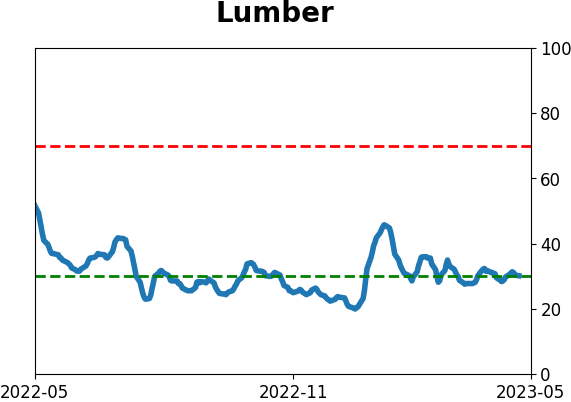
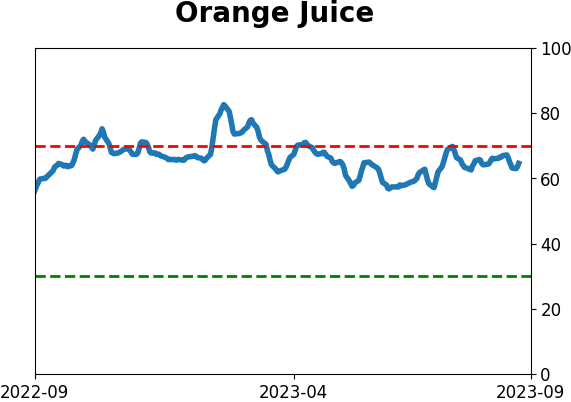
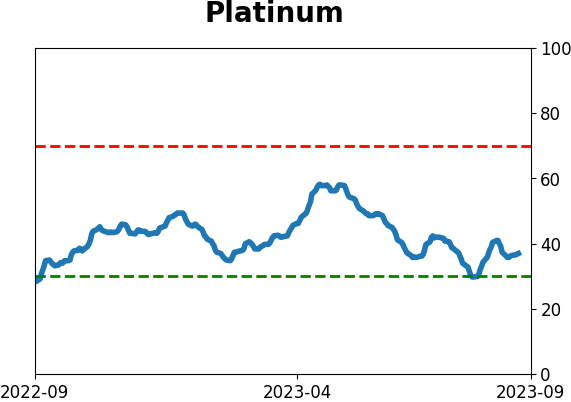
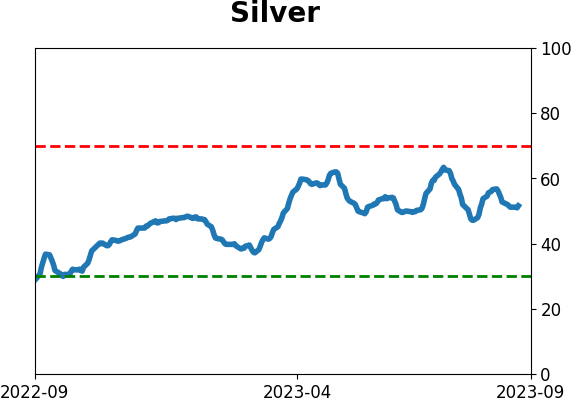
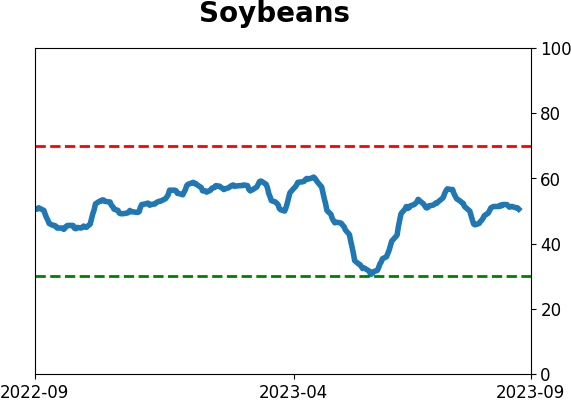
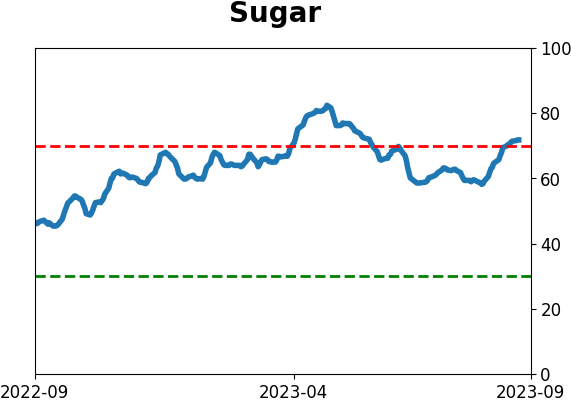
Commodity ETF's - 5-Day Moving Average
|
|