Headlines
|
|
Big Tech has been holding up but more stocks falling to new lows:
Even as the Nasdaq 100 index has jumped higher over the past month, more and more stocks in the index have been falling to 52-week lows. This is one of the largest divergences in 40 years, but similar behavior hasn't been a consistent worry. It would be more troublesome if we see more signs of a split market.
|
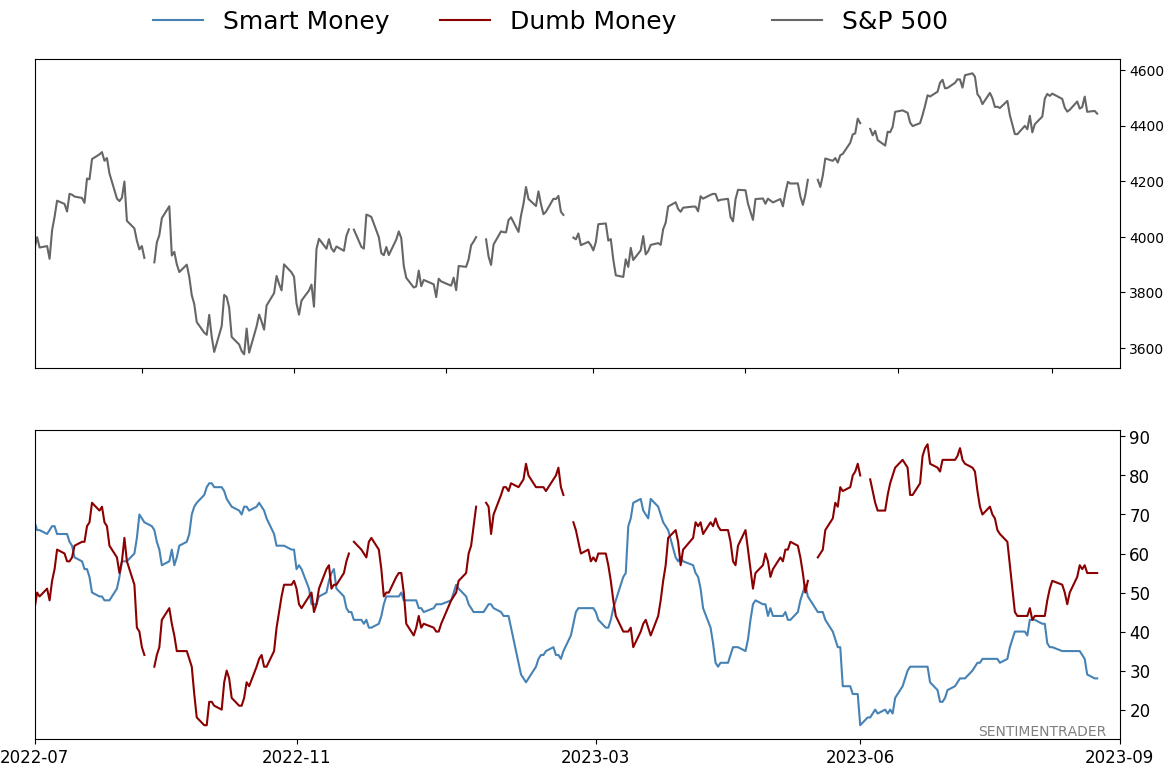
Smart / Dumb Money Confidence
|
Smart Money Confidence: 28%
Dumb Money Confidence: 55%
|
|
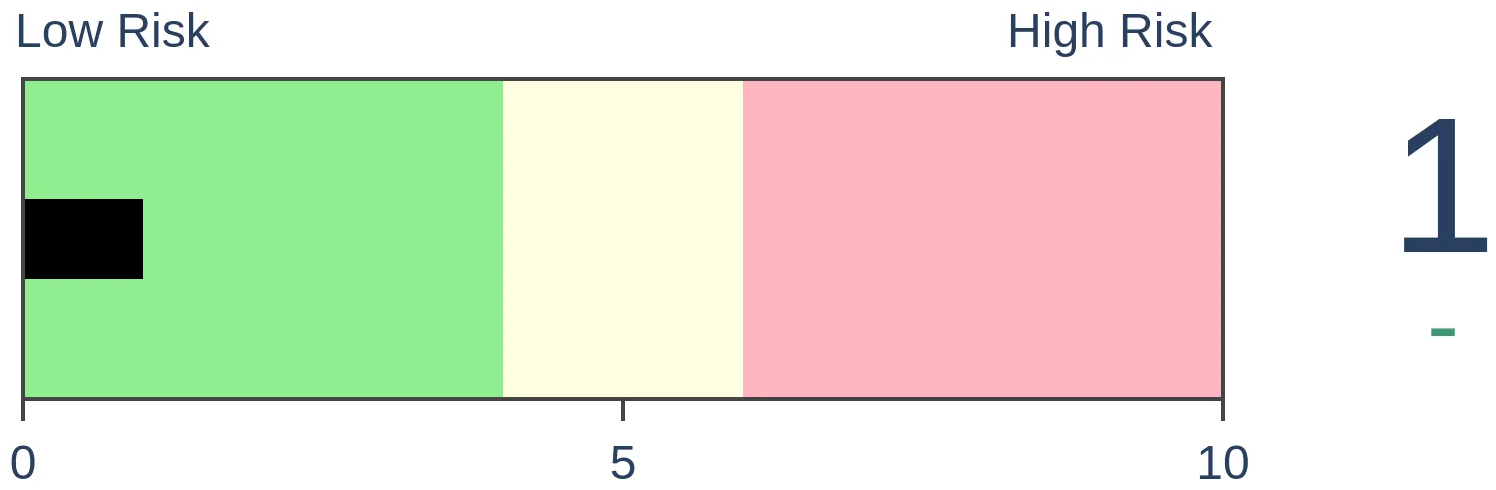
Risk Levels
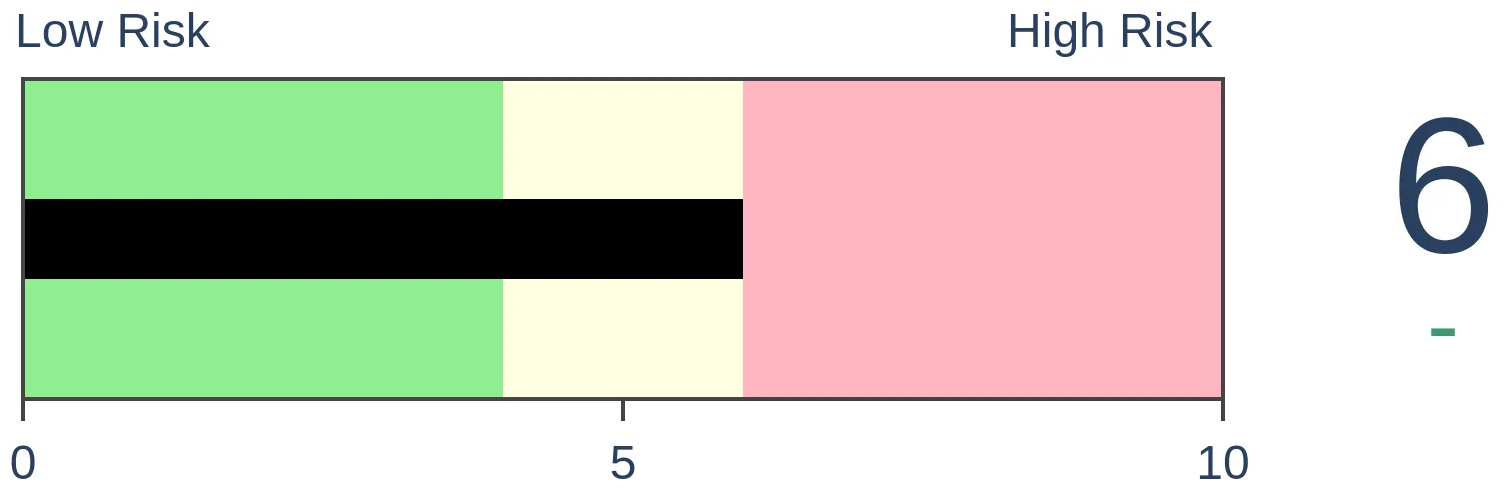
Stocks Short-Term

|
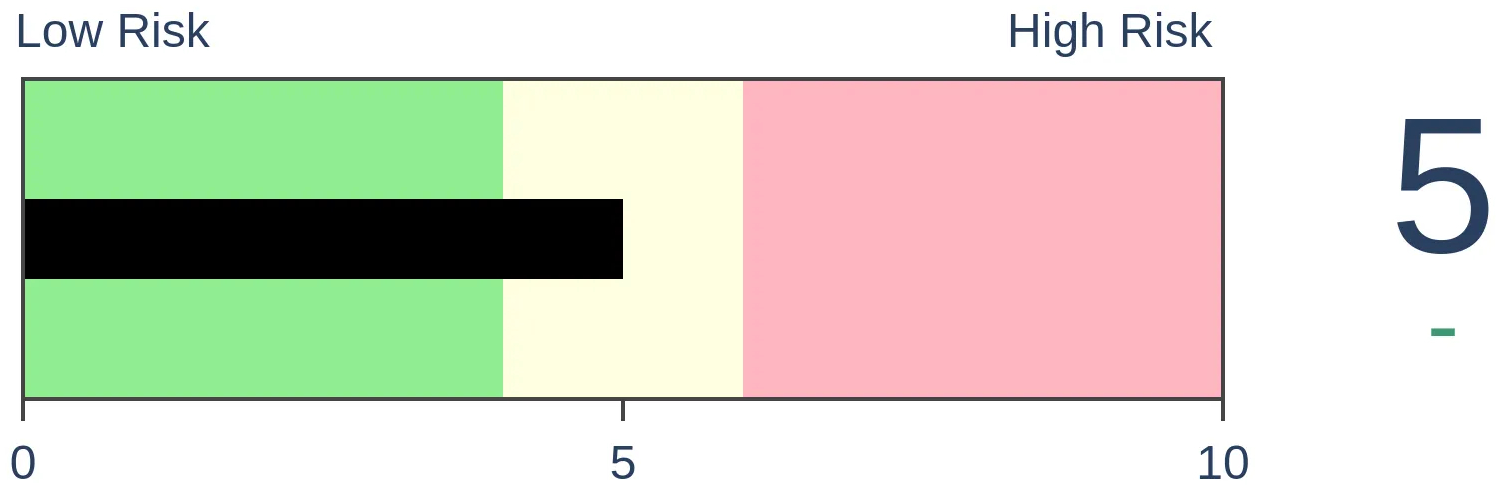
Stocks Medium-Term

|
|
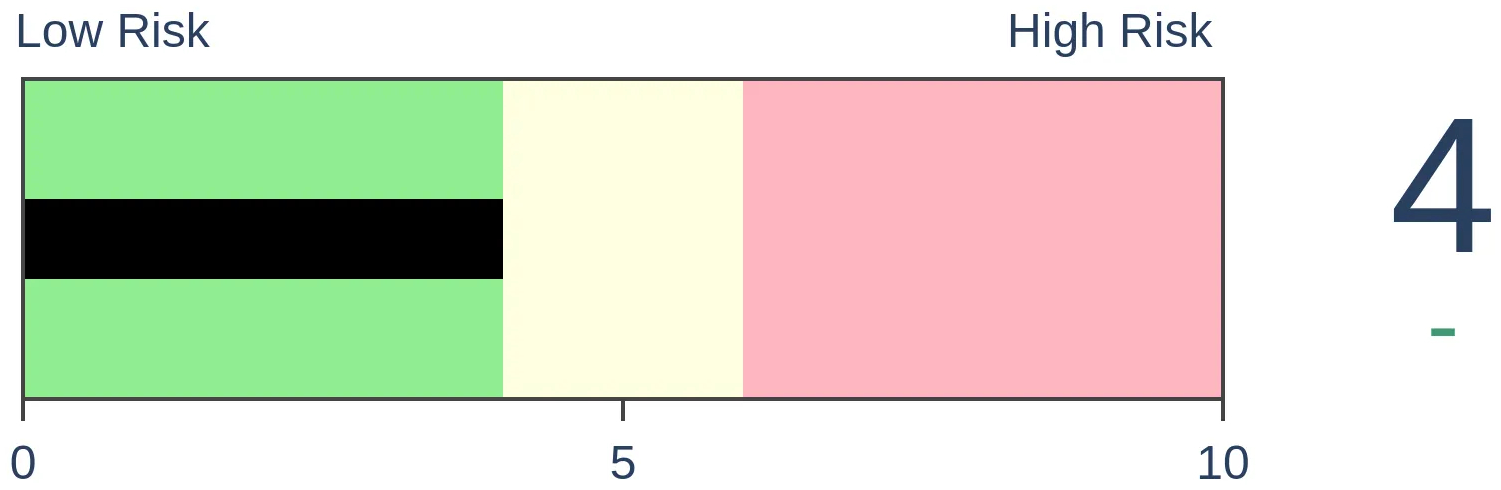
Bonds
|
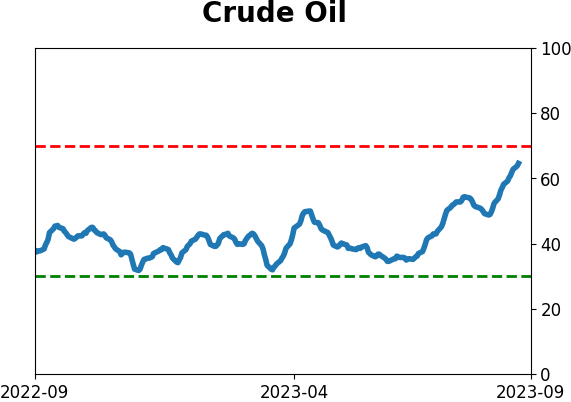
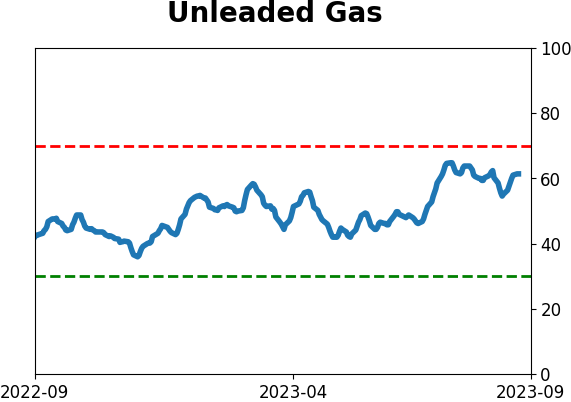
Crude Oil
|
|
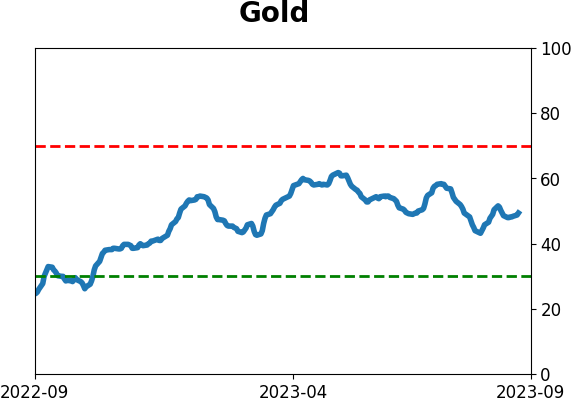
Gold
|
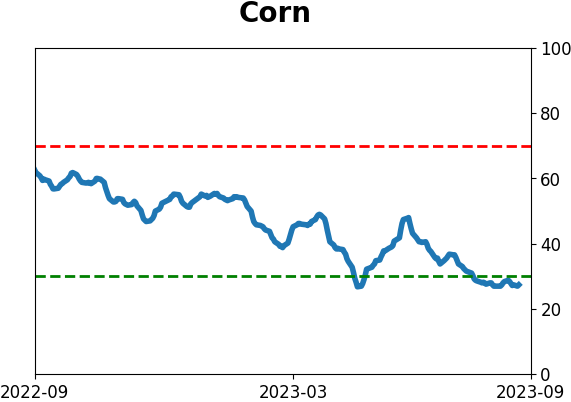
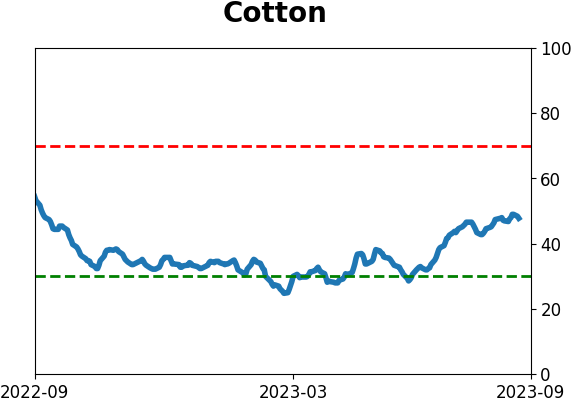
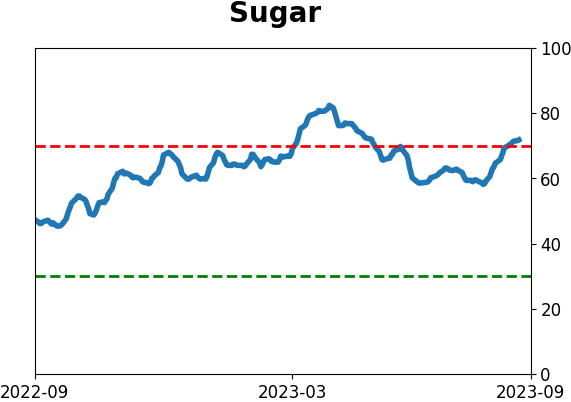
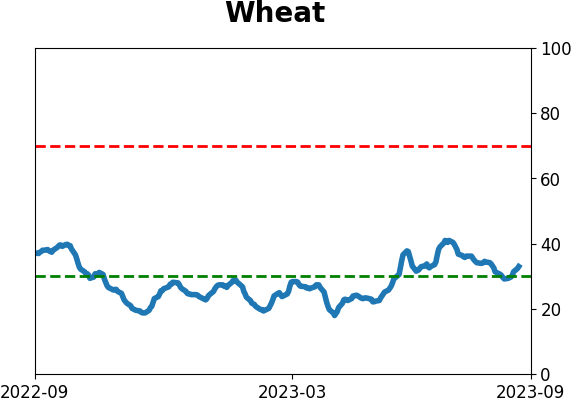
Agriculture
|
|
Research
By Jason Goepfert
BOTTOM LINE
Even as the Nasdaq 100 index has jumped higher over the past month, more and more stocks in the index have been falling to 52-week lows. This is one of the largest divergences in 40 years, but similar behavior hasn't been a consistent worry. It would be more troublesome if we see more signs of a split market.
FORECAST / TIMEFRAME
None
|
Key points:
- The tech-heavy Nasdaq 100 has jumped over the past month, but more stocks are falling to 52-week lows
- This has been one of the larger divergences in 40 years but hasn't been especially troubling
- It will be more worrisome if technical sell signals start piling up, suggesting a heavily split market
While the Nasdaq 100 has jumped, more stocks are falling to new lows
There are some nascent signs that the good participation among stocks that have helped to sustain the market since October is slipping. Some of the biggest drivers of the rally have been massive tech stocks, which are heavily represented in the Nasdaq 100.
That index has rebounded spectacularly, and it hasn't just been a handful of stocks, though they're the ones getting the attention and accounting for many of the index points. But like we're seeing within the S&P 500, there are some initial signs that all is not well within the index.
Over the past 20 days, the Nasdaq 100 has rallied several percent. But the percentage of stocks within the index that have fallen to a 52-week low has more than doubled.
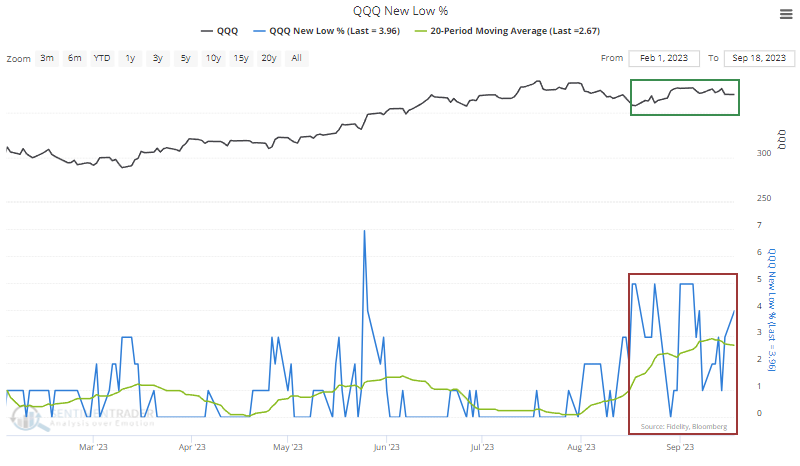
Divergences like this can be an effective heads-up of looming trouble in the index. So far, the signs of internal deterioration are isolated, and historical similarities aren't all that troubling...yet.
A new low split in the NDX hasn't been all that problematic
The table below shows every time over the past (nearly) 40 years when the NDX climbed by more than 3.5% over the past month, yet the 20-day average of 52-week lows climbed by more than 1.5%. It filters out any signals that occurred when the index was more than 10% from a multi-year high.
It's kind of a weird way of expressing things, but it shows times like now when the index jumped by a substantial amount, but there was also a sustained rise in the number of its stocks plunging to new lows.
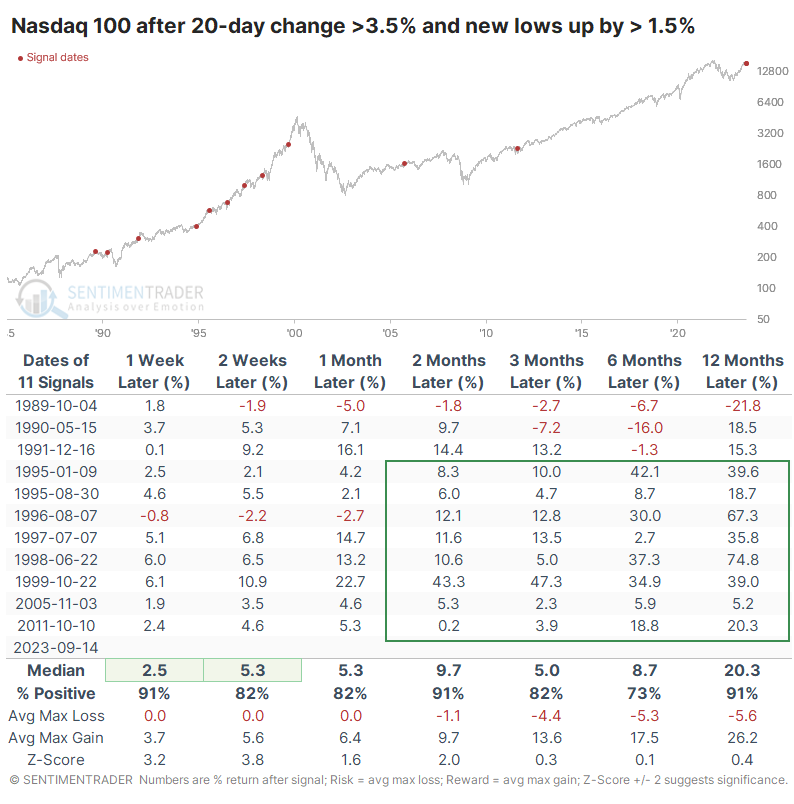
It wasn't much of a problem. Over the past 30 years, the Nasdaq 100 continued to rise over the medium- to long-term every time. It was not an effective indicator of imminent demise.
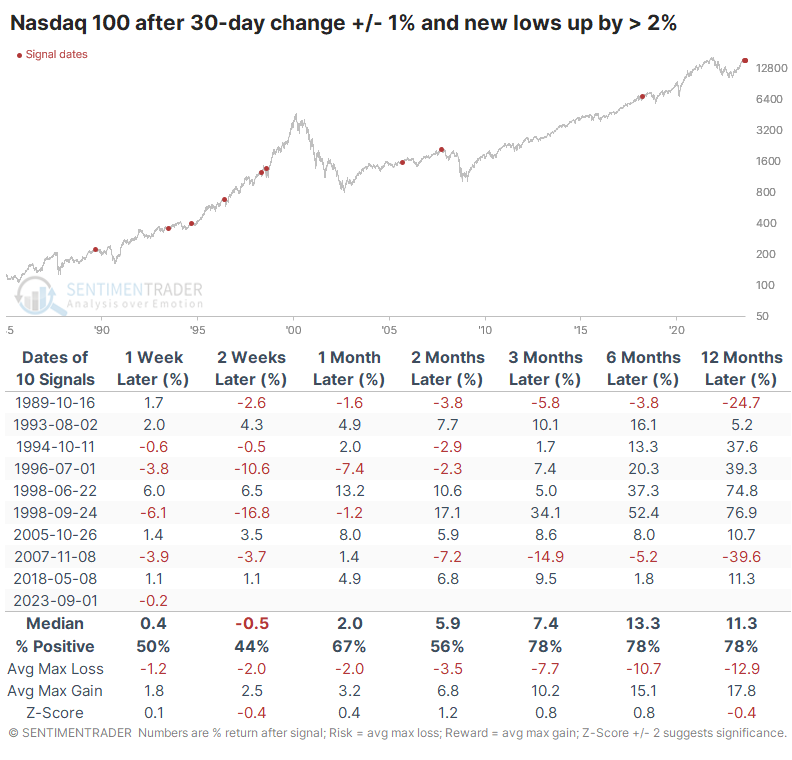
The conundrum of rising new lows within the index has been going on for more than just the past 20 sessions; it's been over 30 sessions. The table below takes a slightly different look. This shows times when the index was basically flat over the past 30 days, but new lows rose substantially.
This one captured a significant decline before the 1990 recession and just before the global financial crisis, but all the others preceded gains.
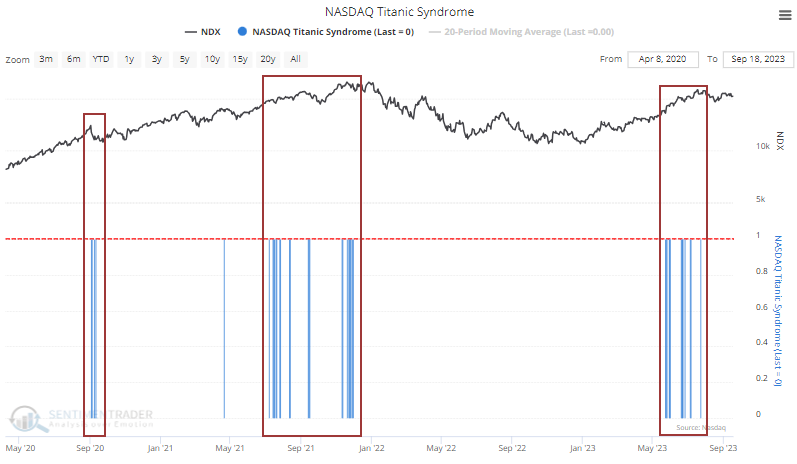
So, the initial evidence isn't compelling enough to suggest the index is in immediate trouble. It would be more worrisome if further signs of internal deterioration started to trigger. It happened in June, with a bevy of technical warnings via the Titanic Syndrome on the broader Nasdaq exchange.
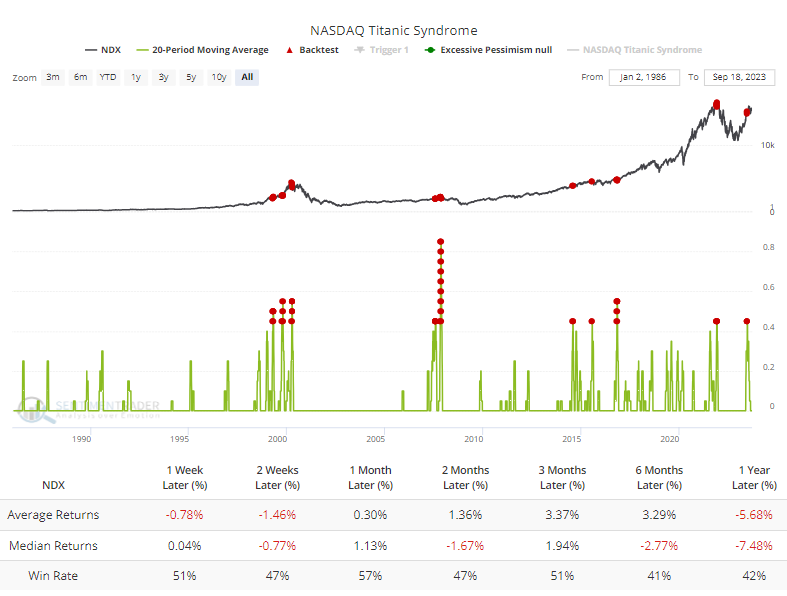
The Backtest Engine shows that the Nasdaq 100 suffered poor consistency and average returns from 6-12 months after a cluster of these signals over 20 days. It would be even more worrisome if these signals started cropping up again, especially if it's coupled with triggers in the Hindenburg Omen, further indicating signs of a terribly split market.
What the research tells us...
For one of the few times in almost a year, we're starting to see signs of a split in the market. Whereas during most of the last 11 months, most stocks were rising, and there were multiple bouts of buying thrusts, buyers' interests have become more concentrated and isolated. That doesn't necessarily spell imminent doom, but it's not a great sign.
Some of the indexes that have shown the best gains, like the tech-heavy Nasdaq 100, are seeing the first signs of becoming split between big winners and big losers, but so far, it hasn't been enough to be all that worrisome. If more divergences begin piling up, especially if it's reflected in technical sell signals, we'd have more compelling evidence to take it more seriously.
Indicators at Extremes
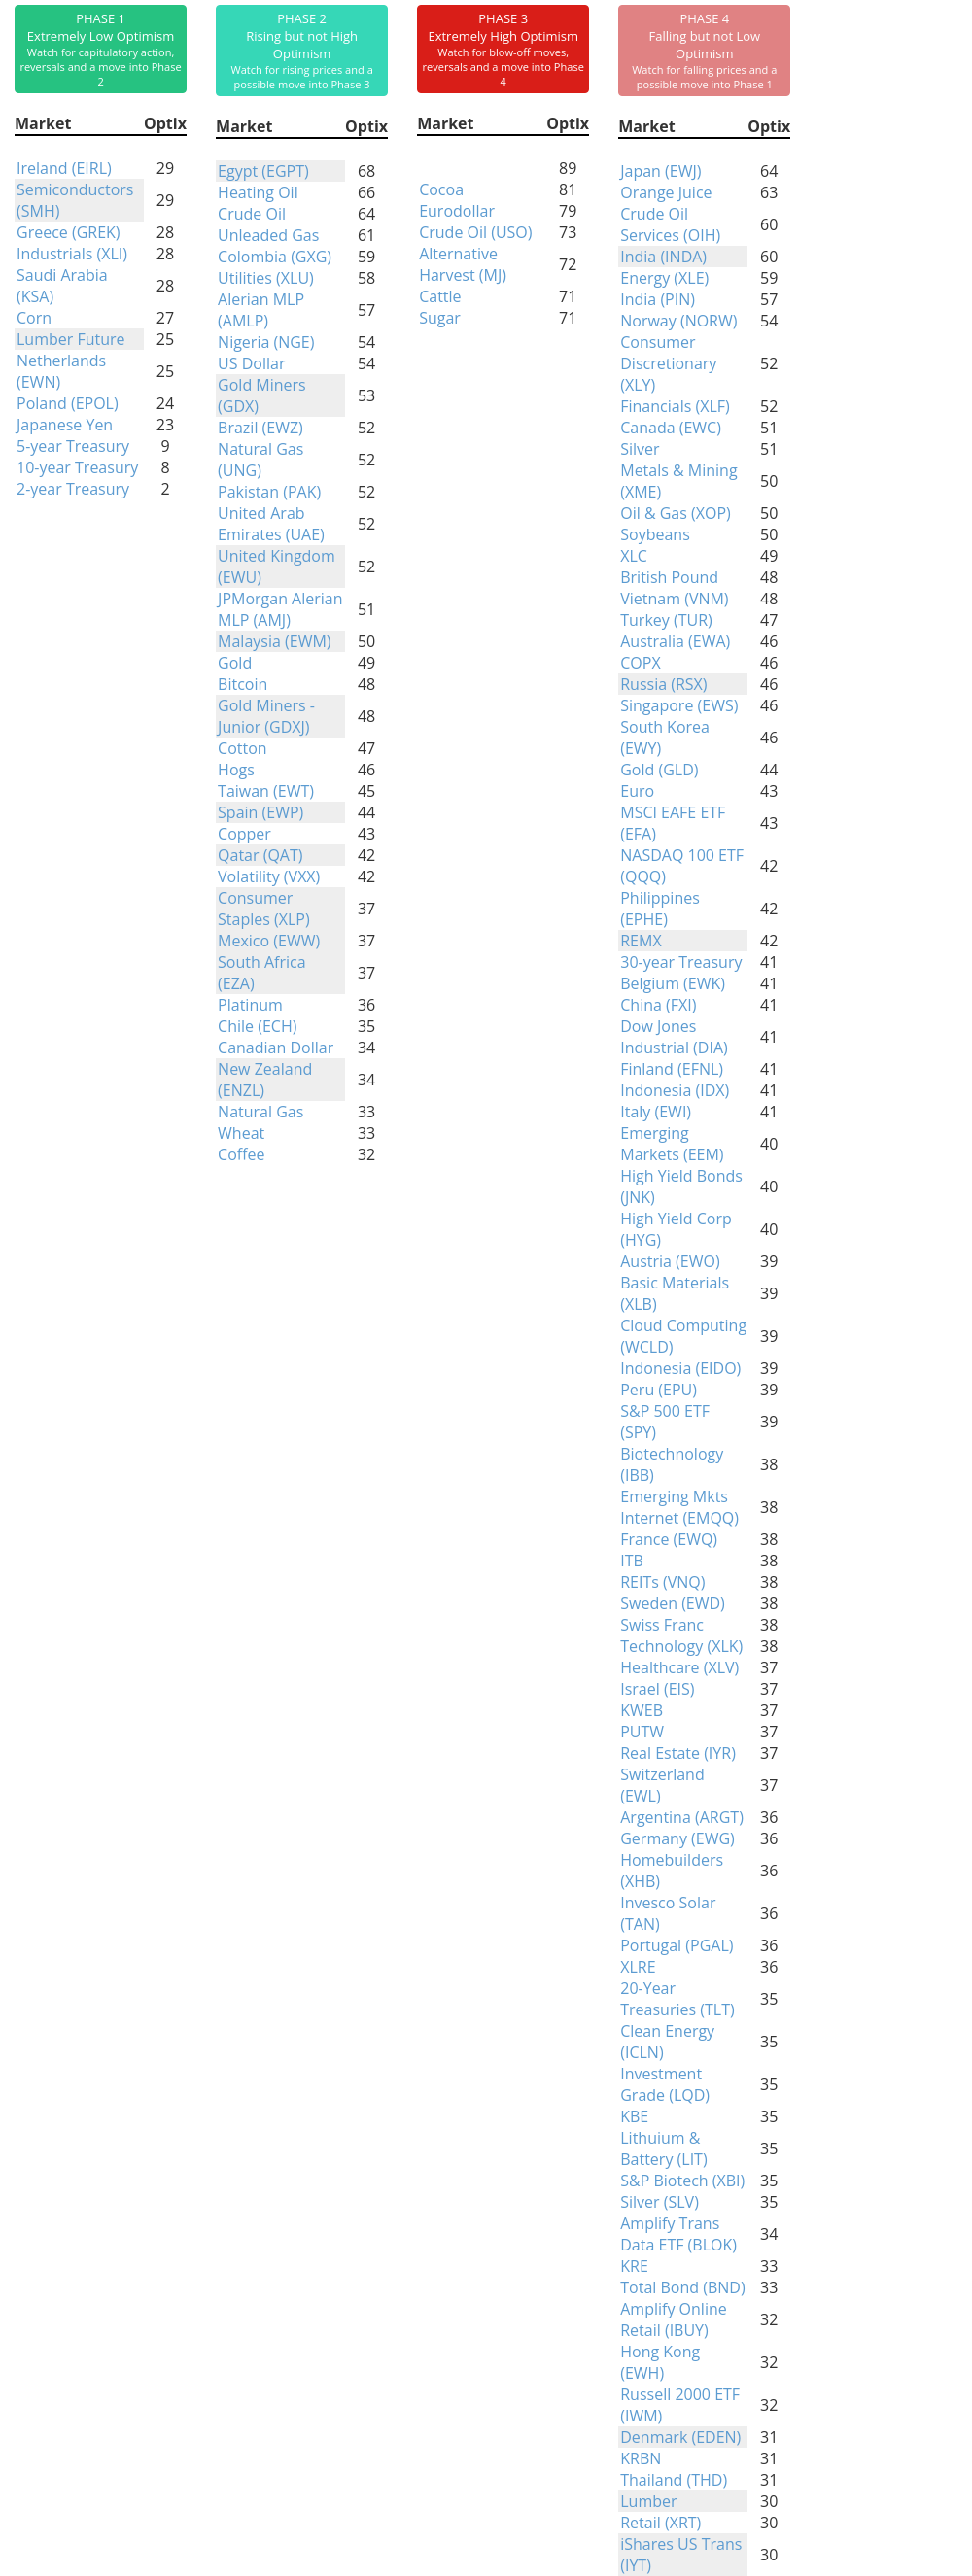
Phase Table
Ranks
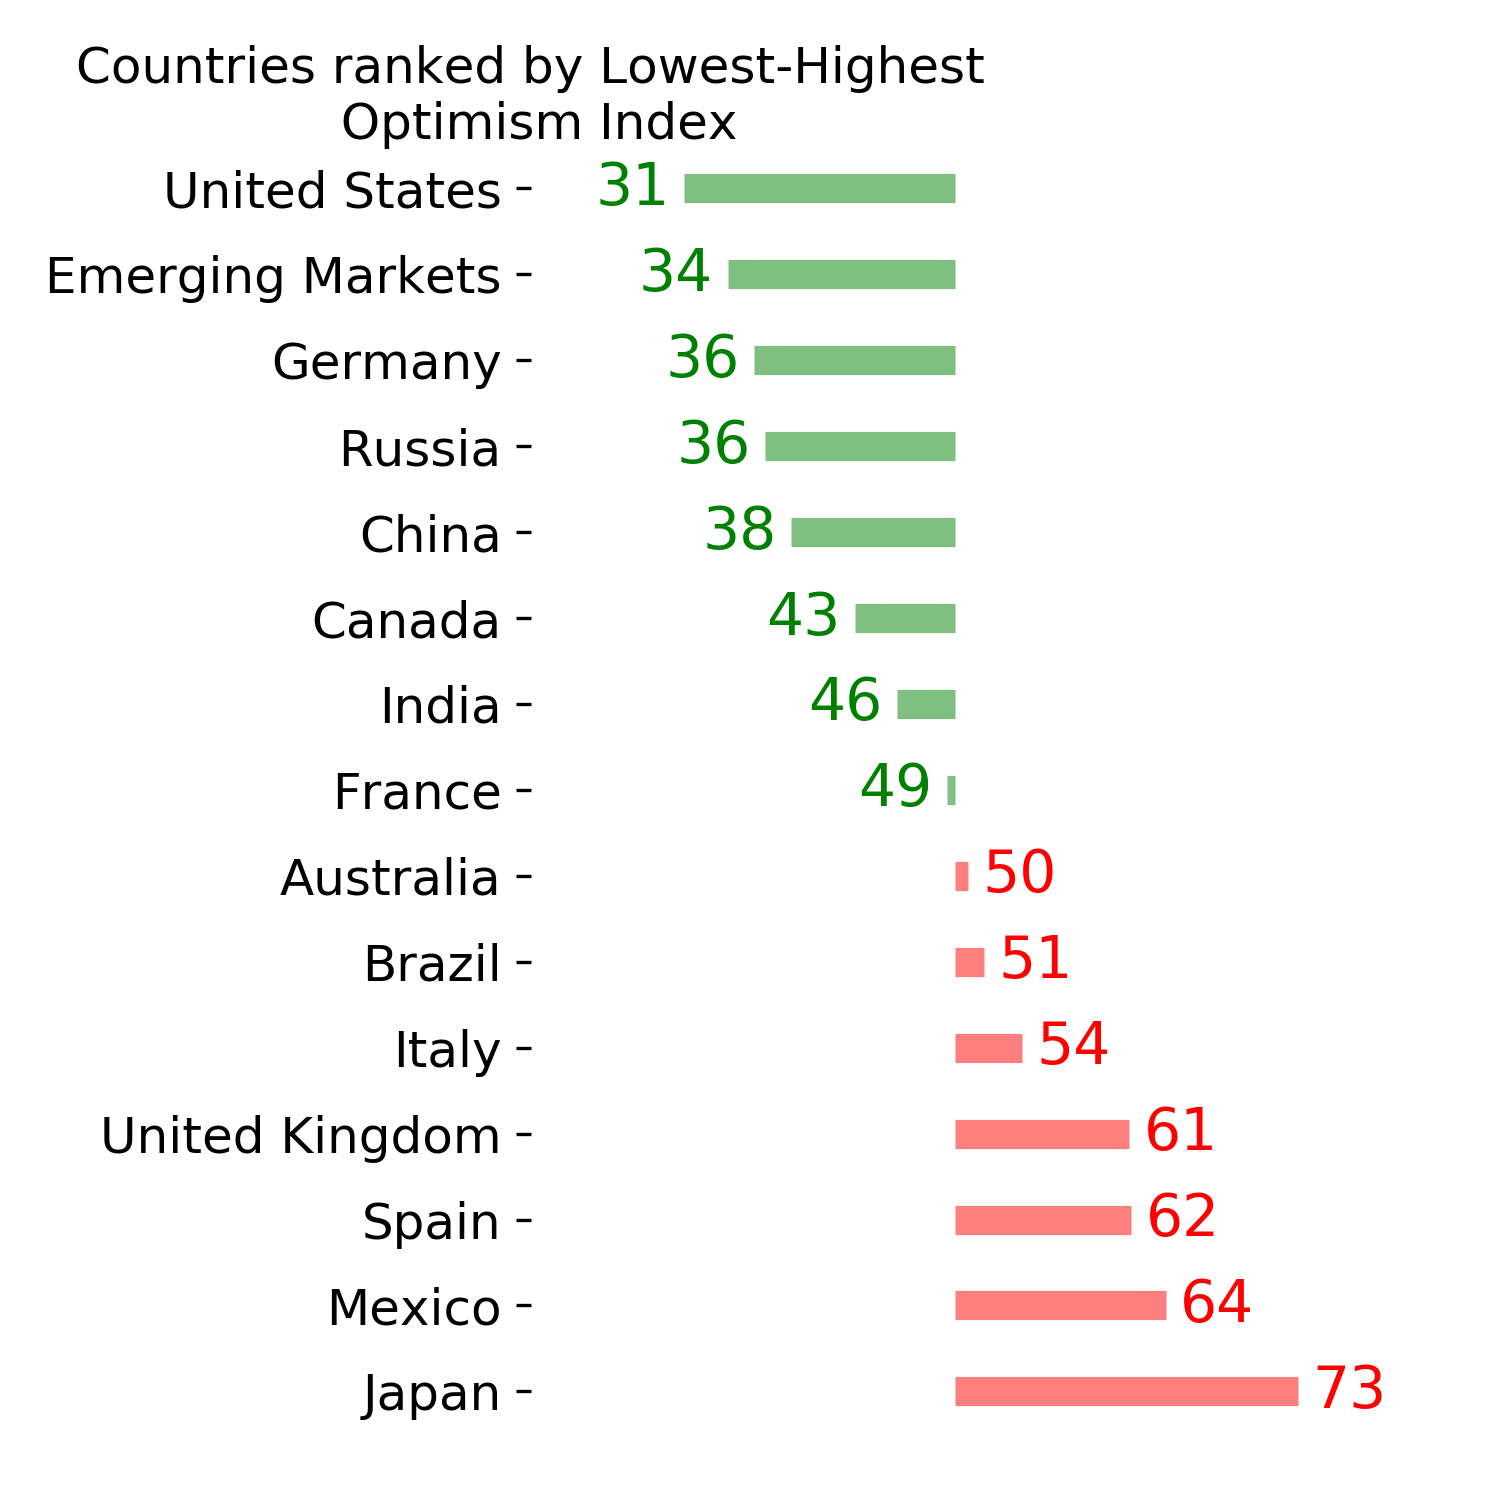
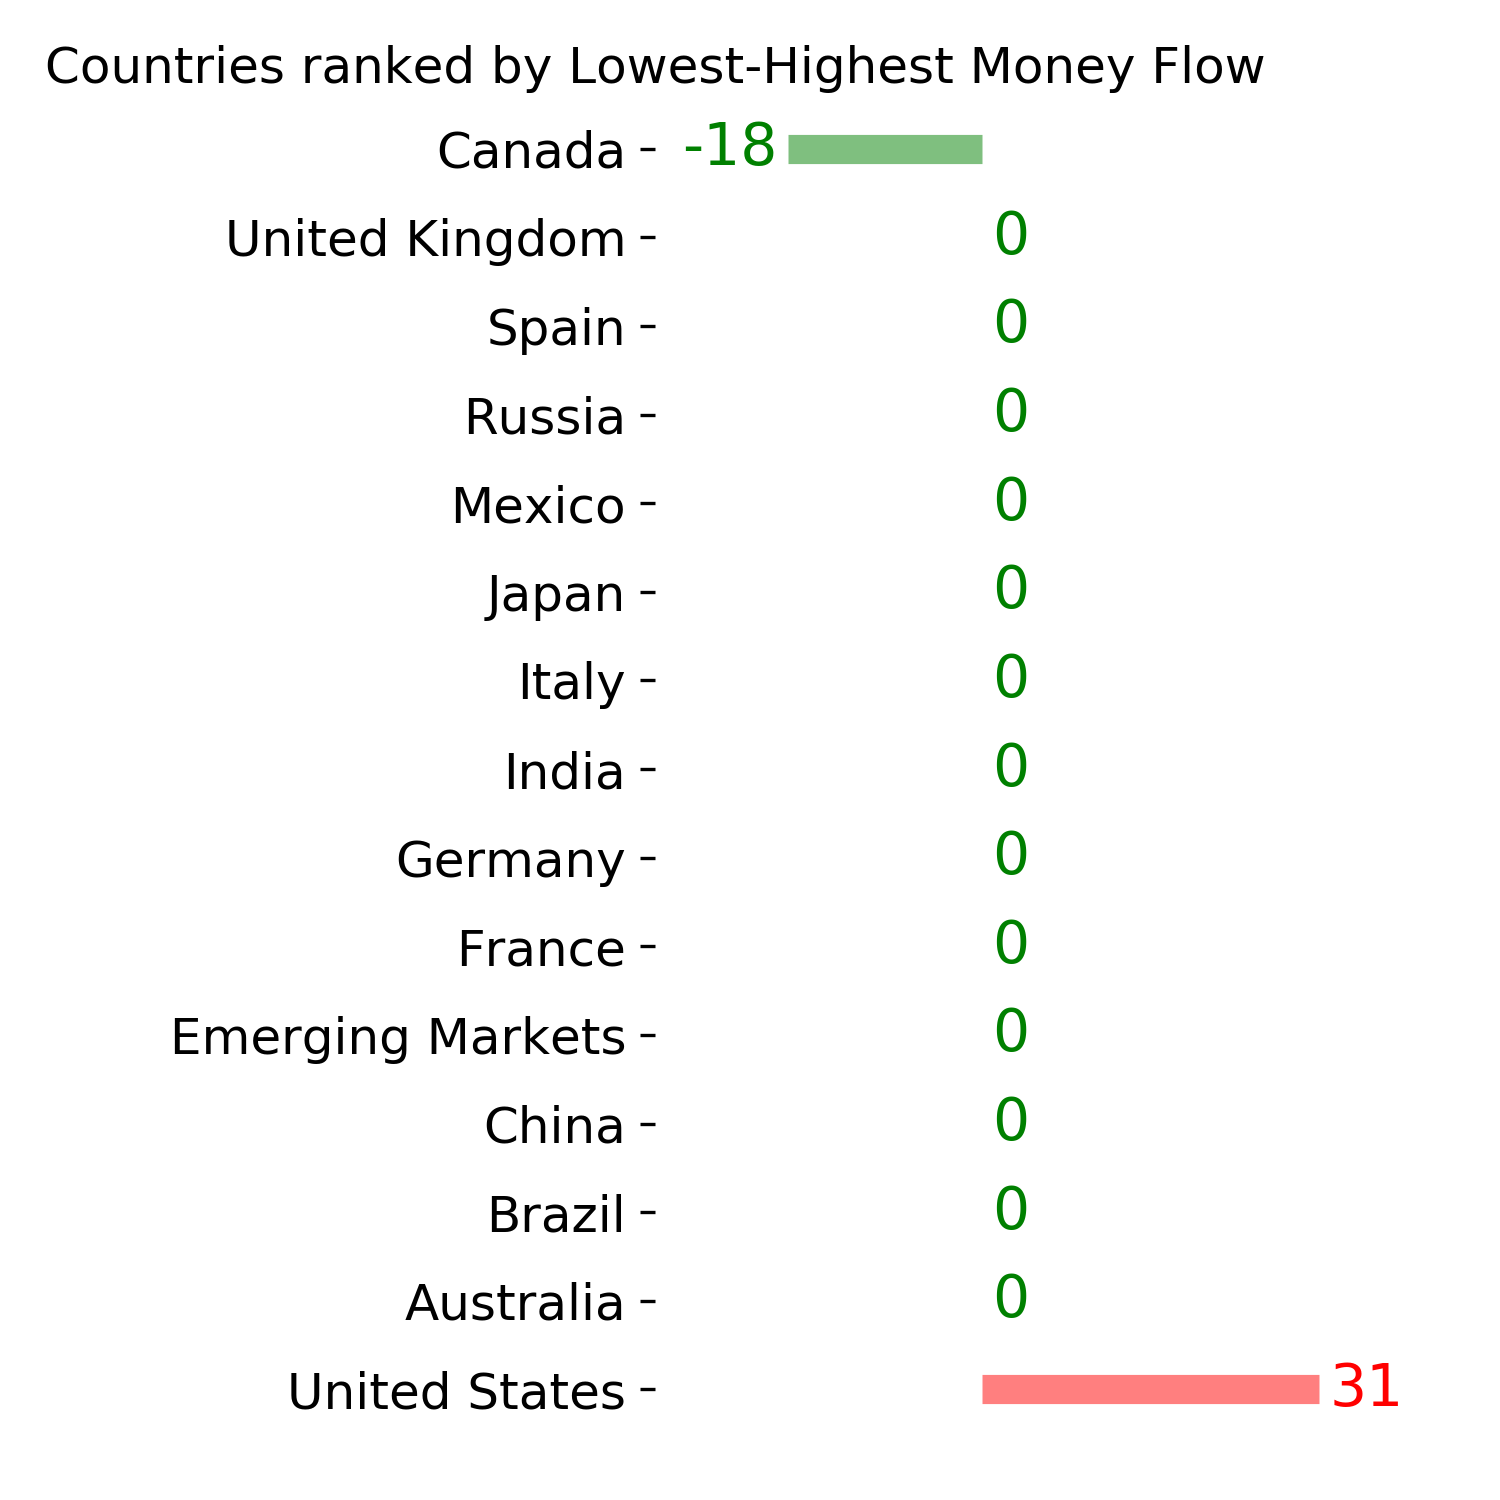
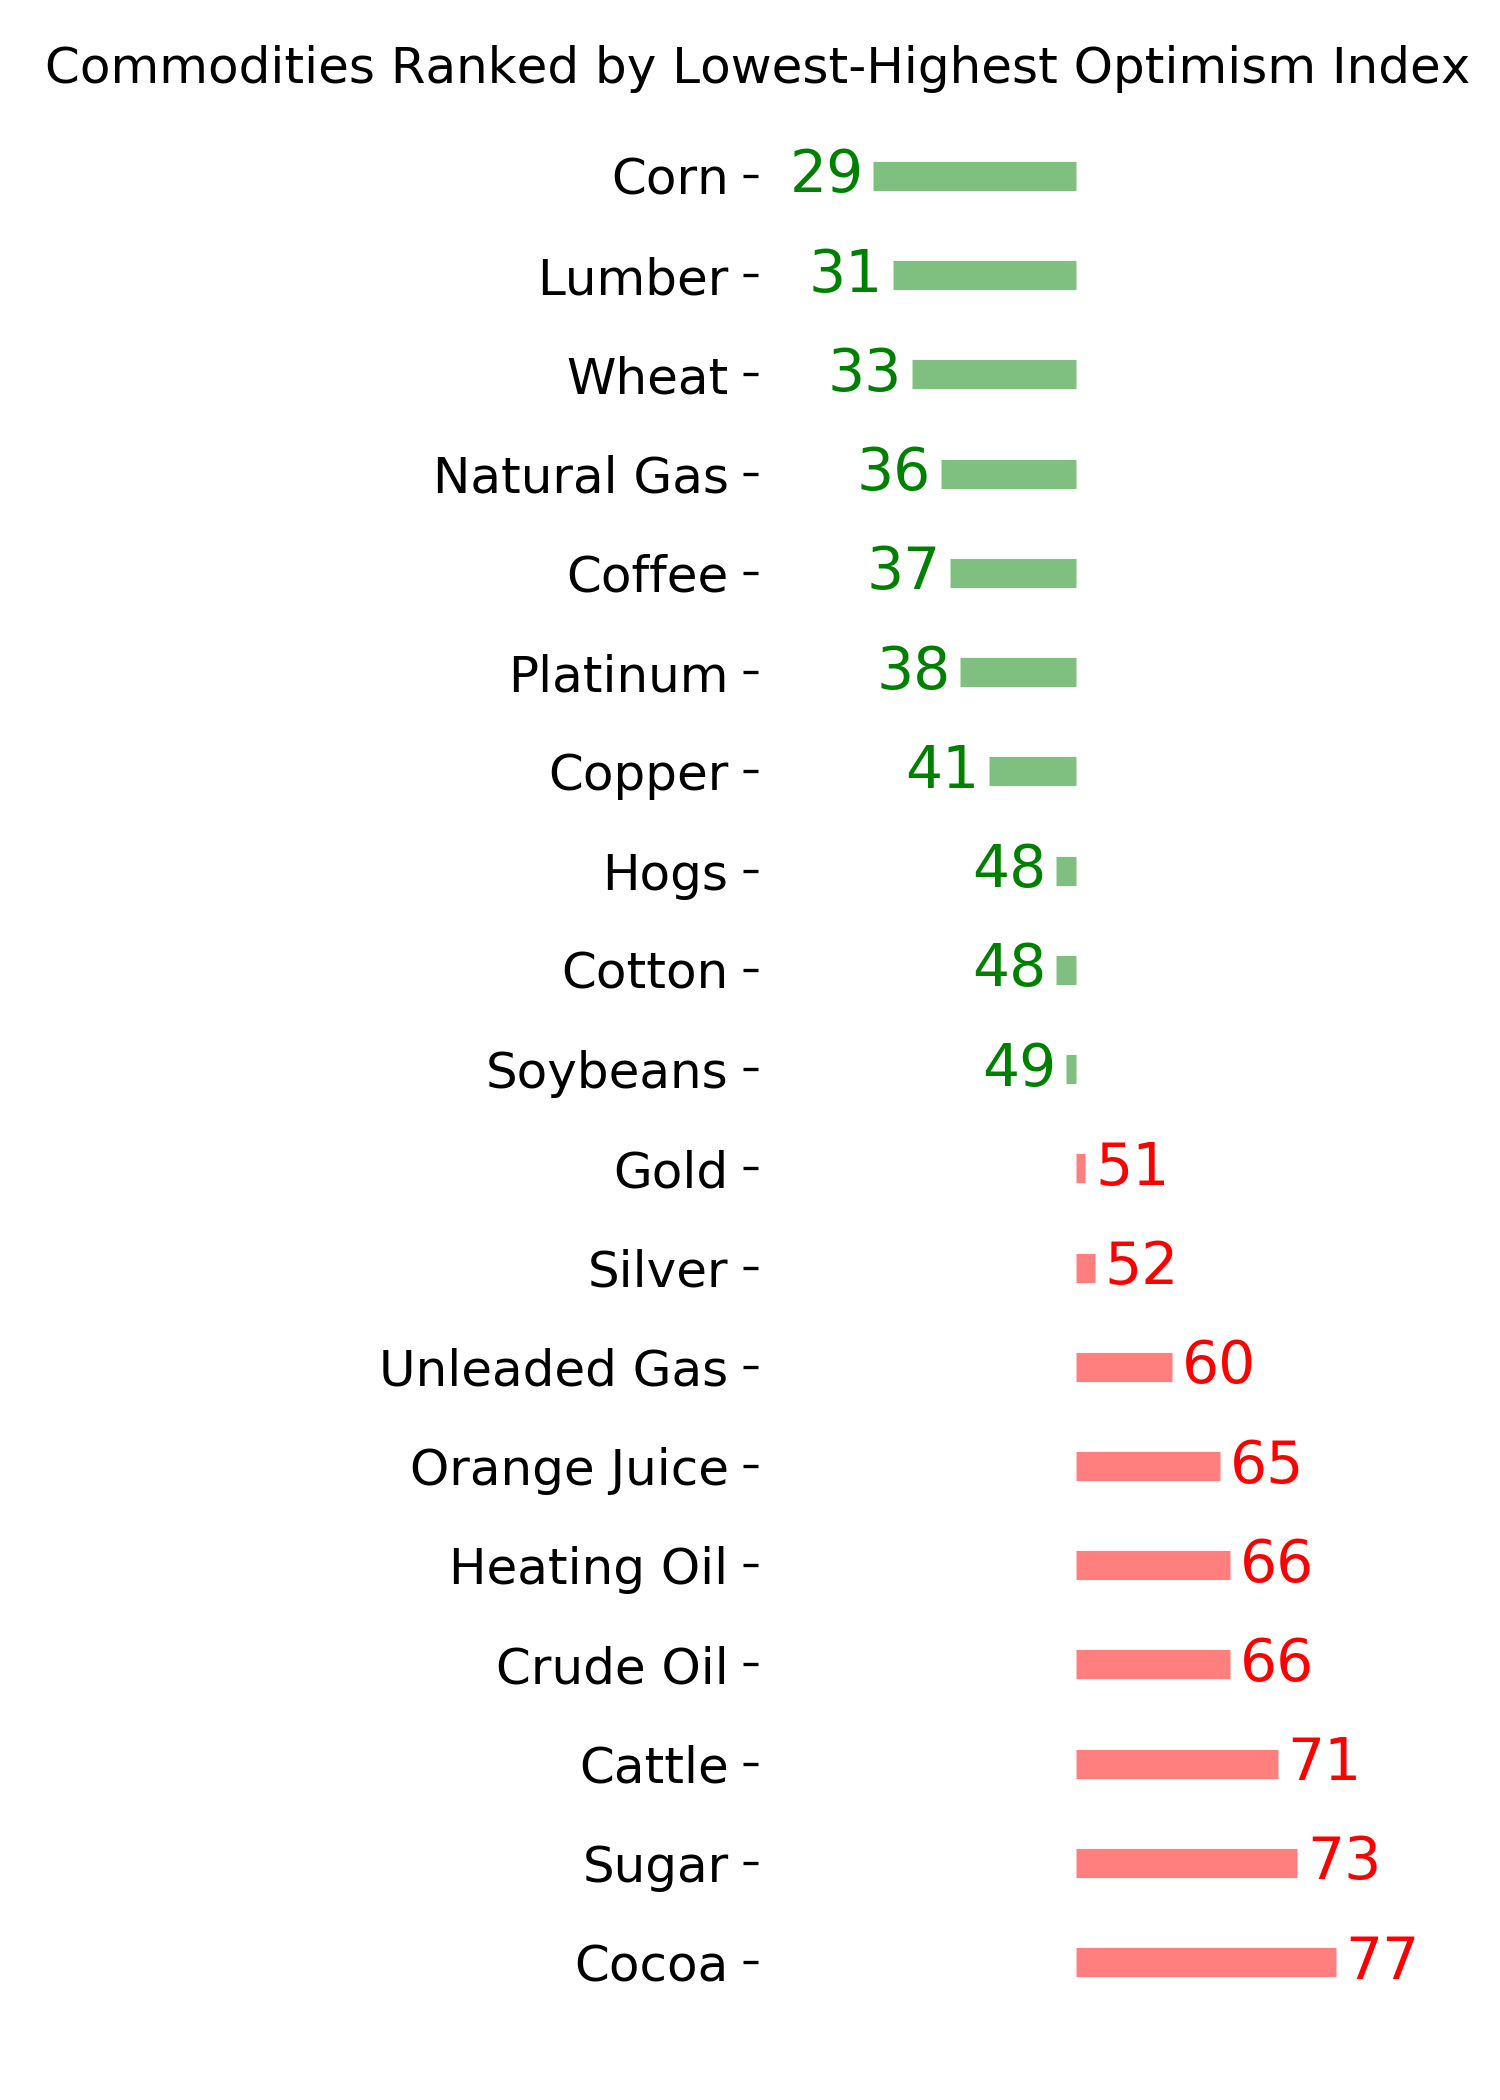
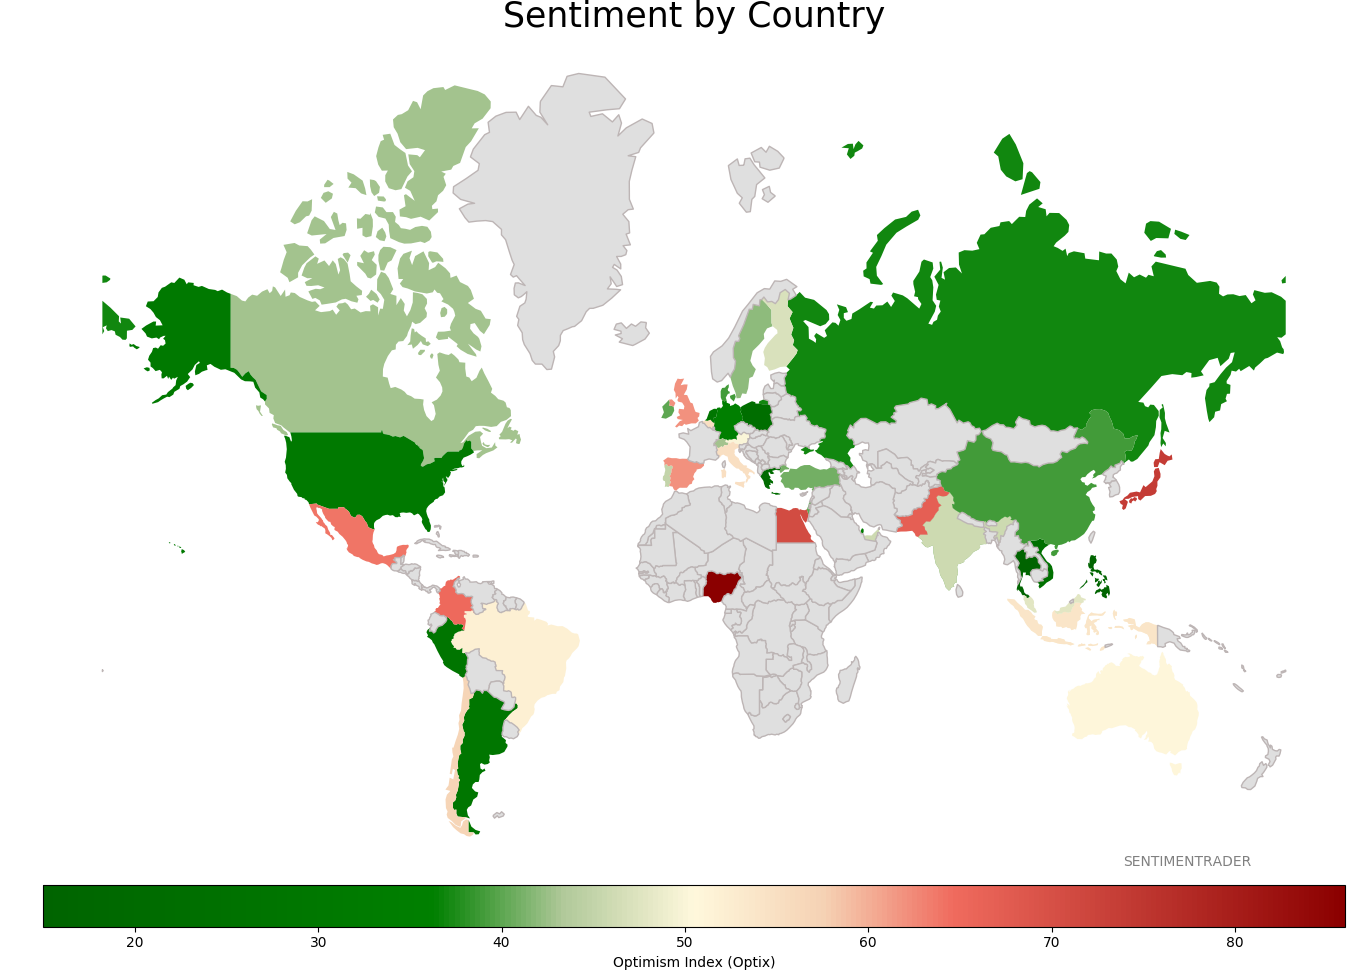
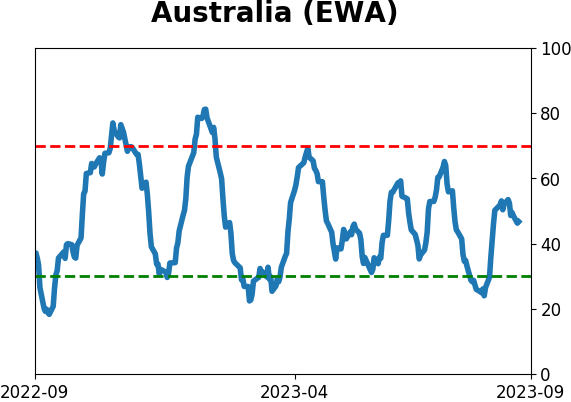
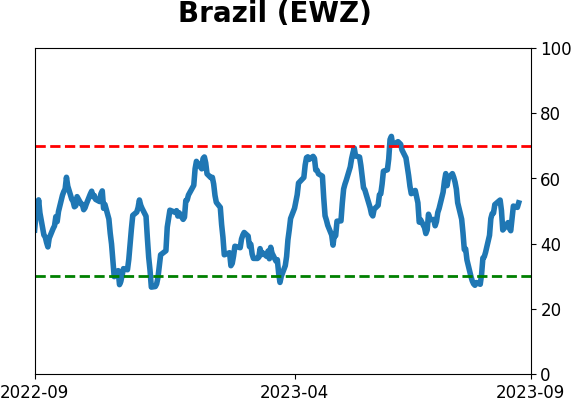
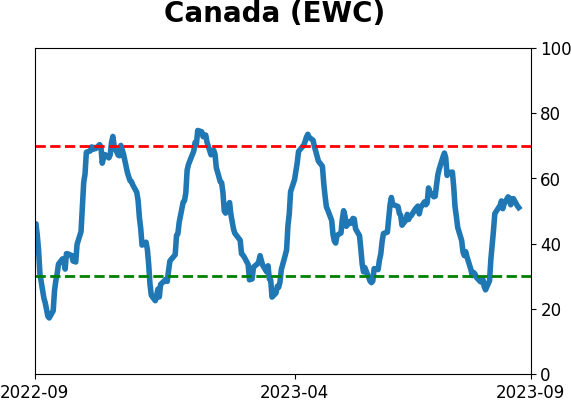
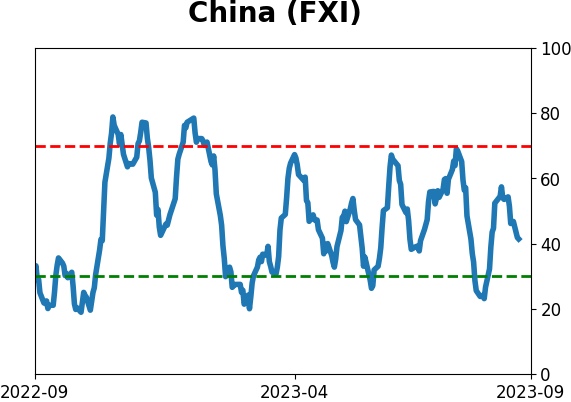
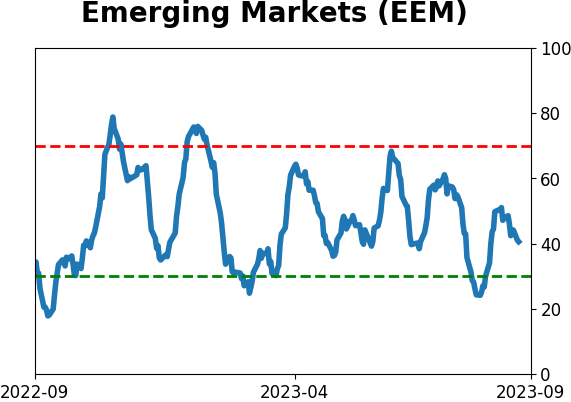
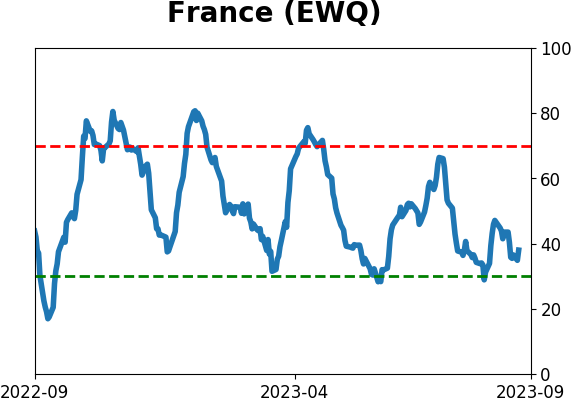
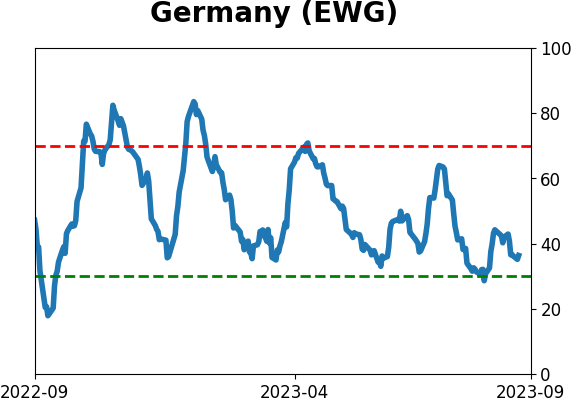
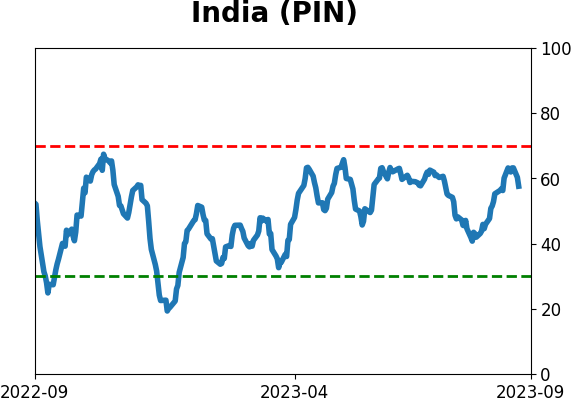
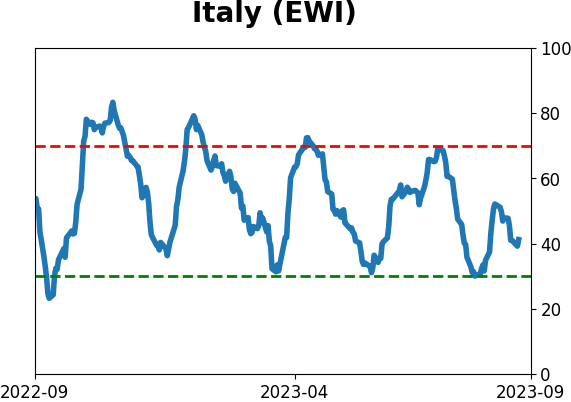
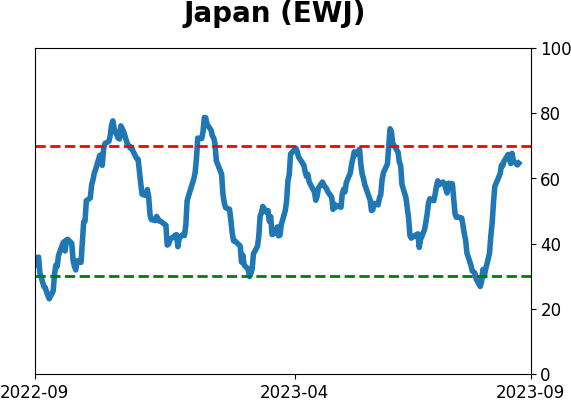
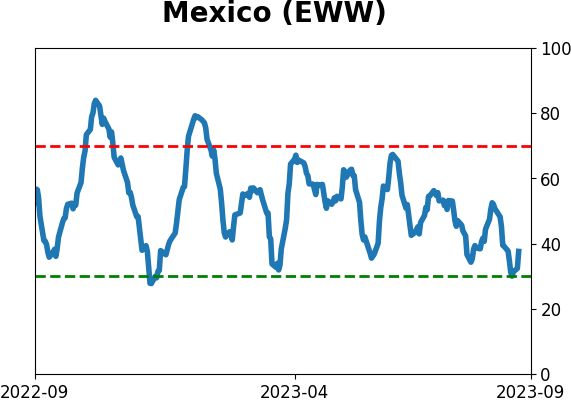
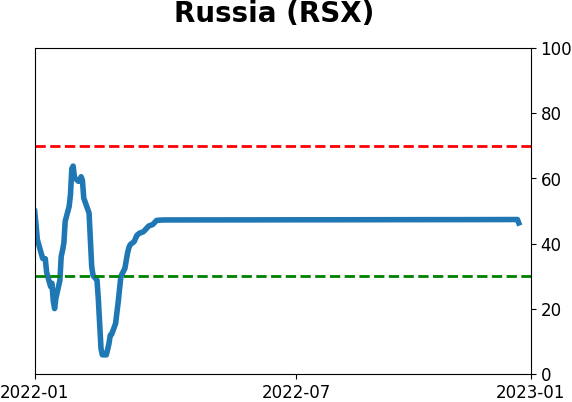
Sentiment Around The World
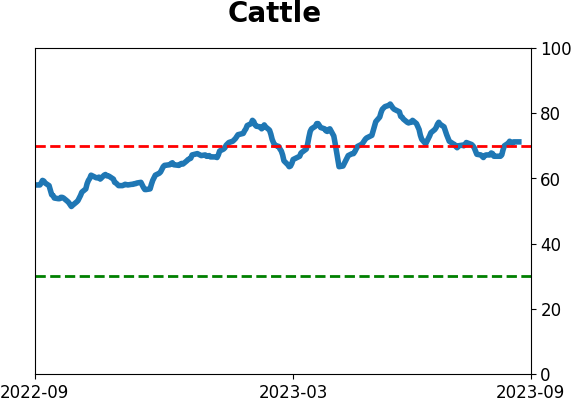
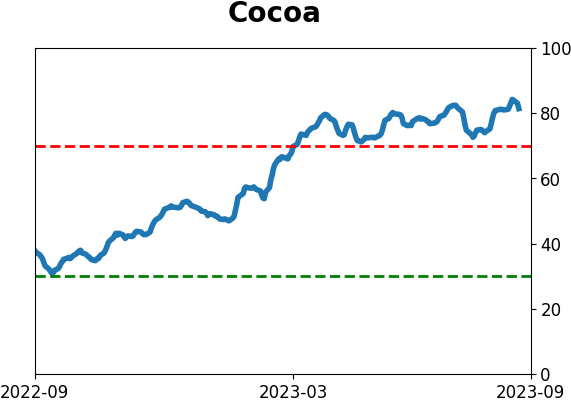
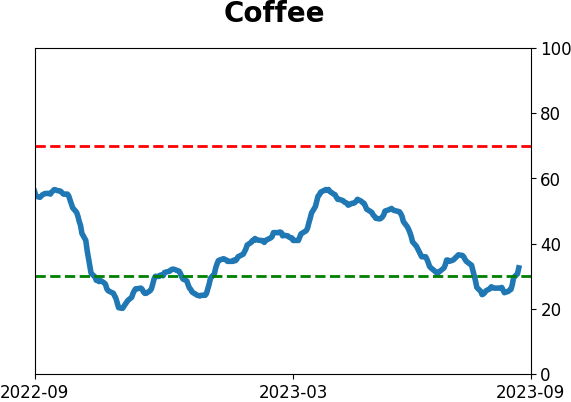
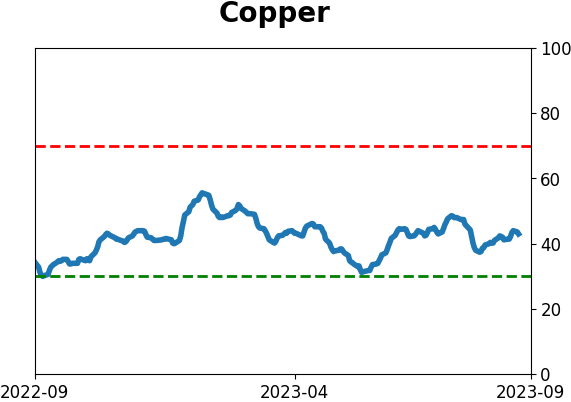
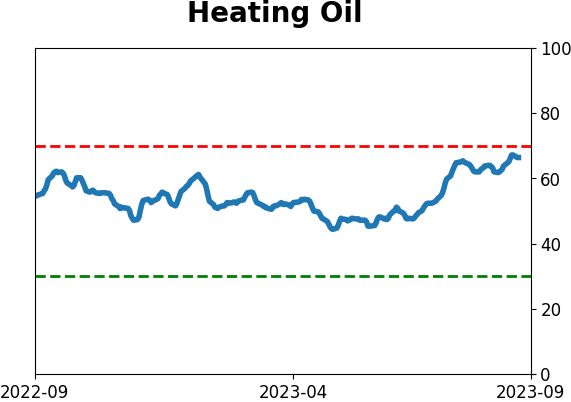
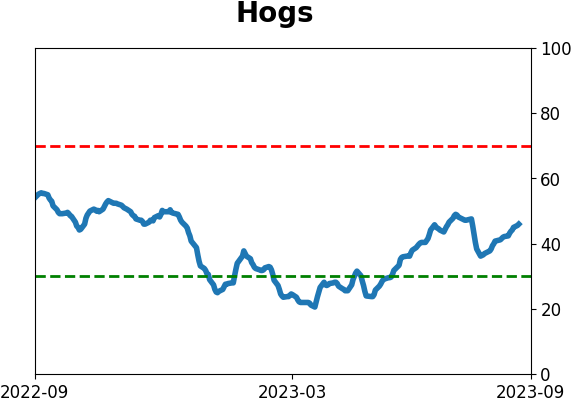
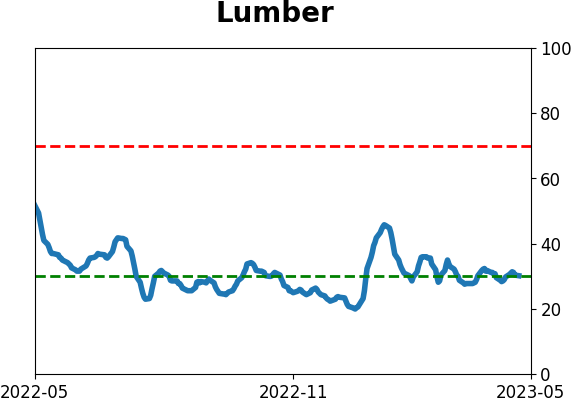
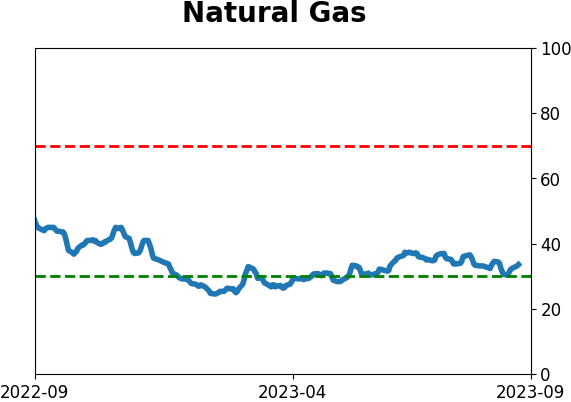
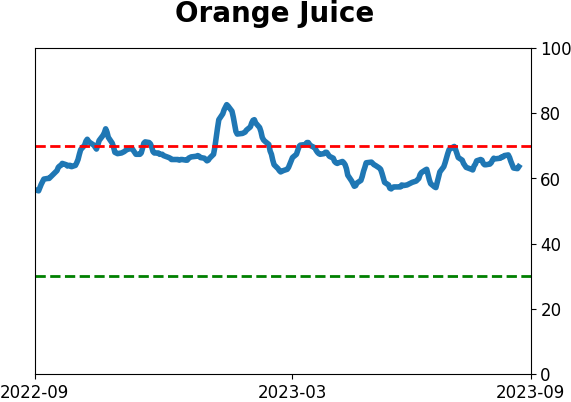
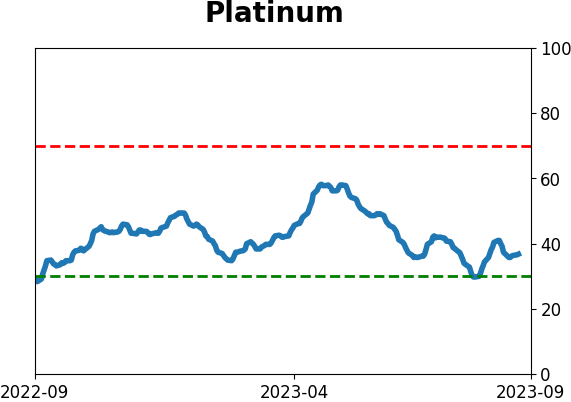
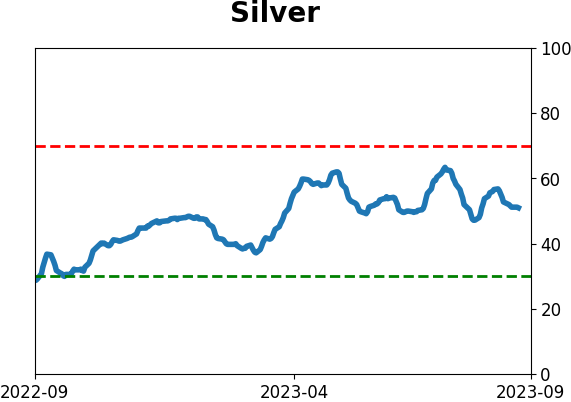
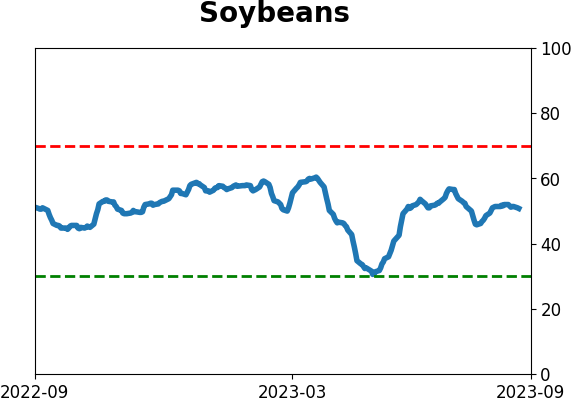
Optimism Index Thumbnails
|
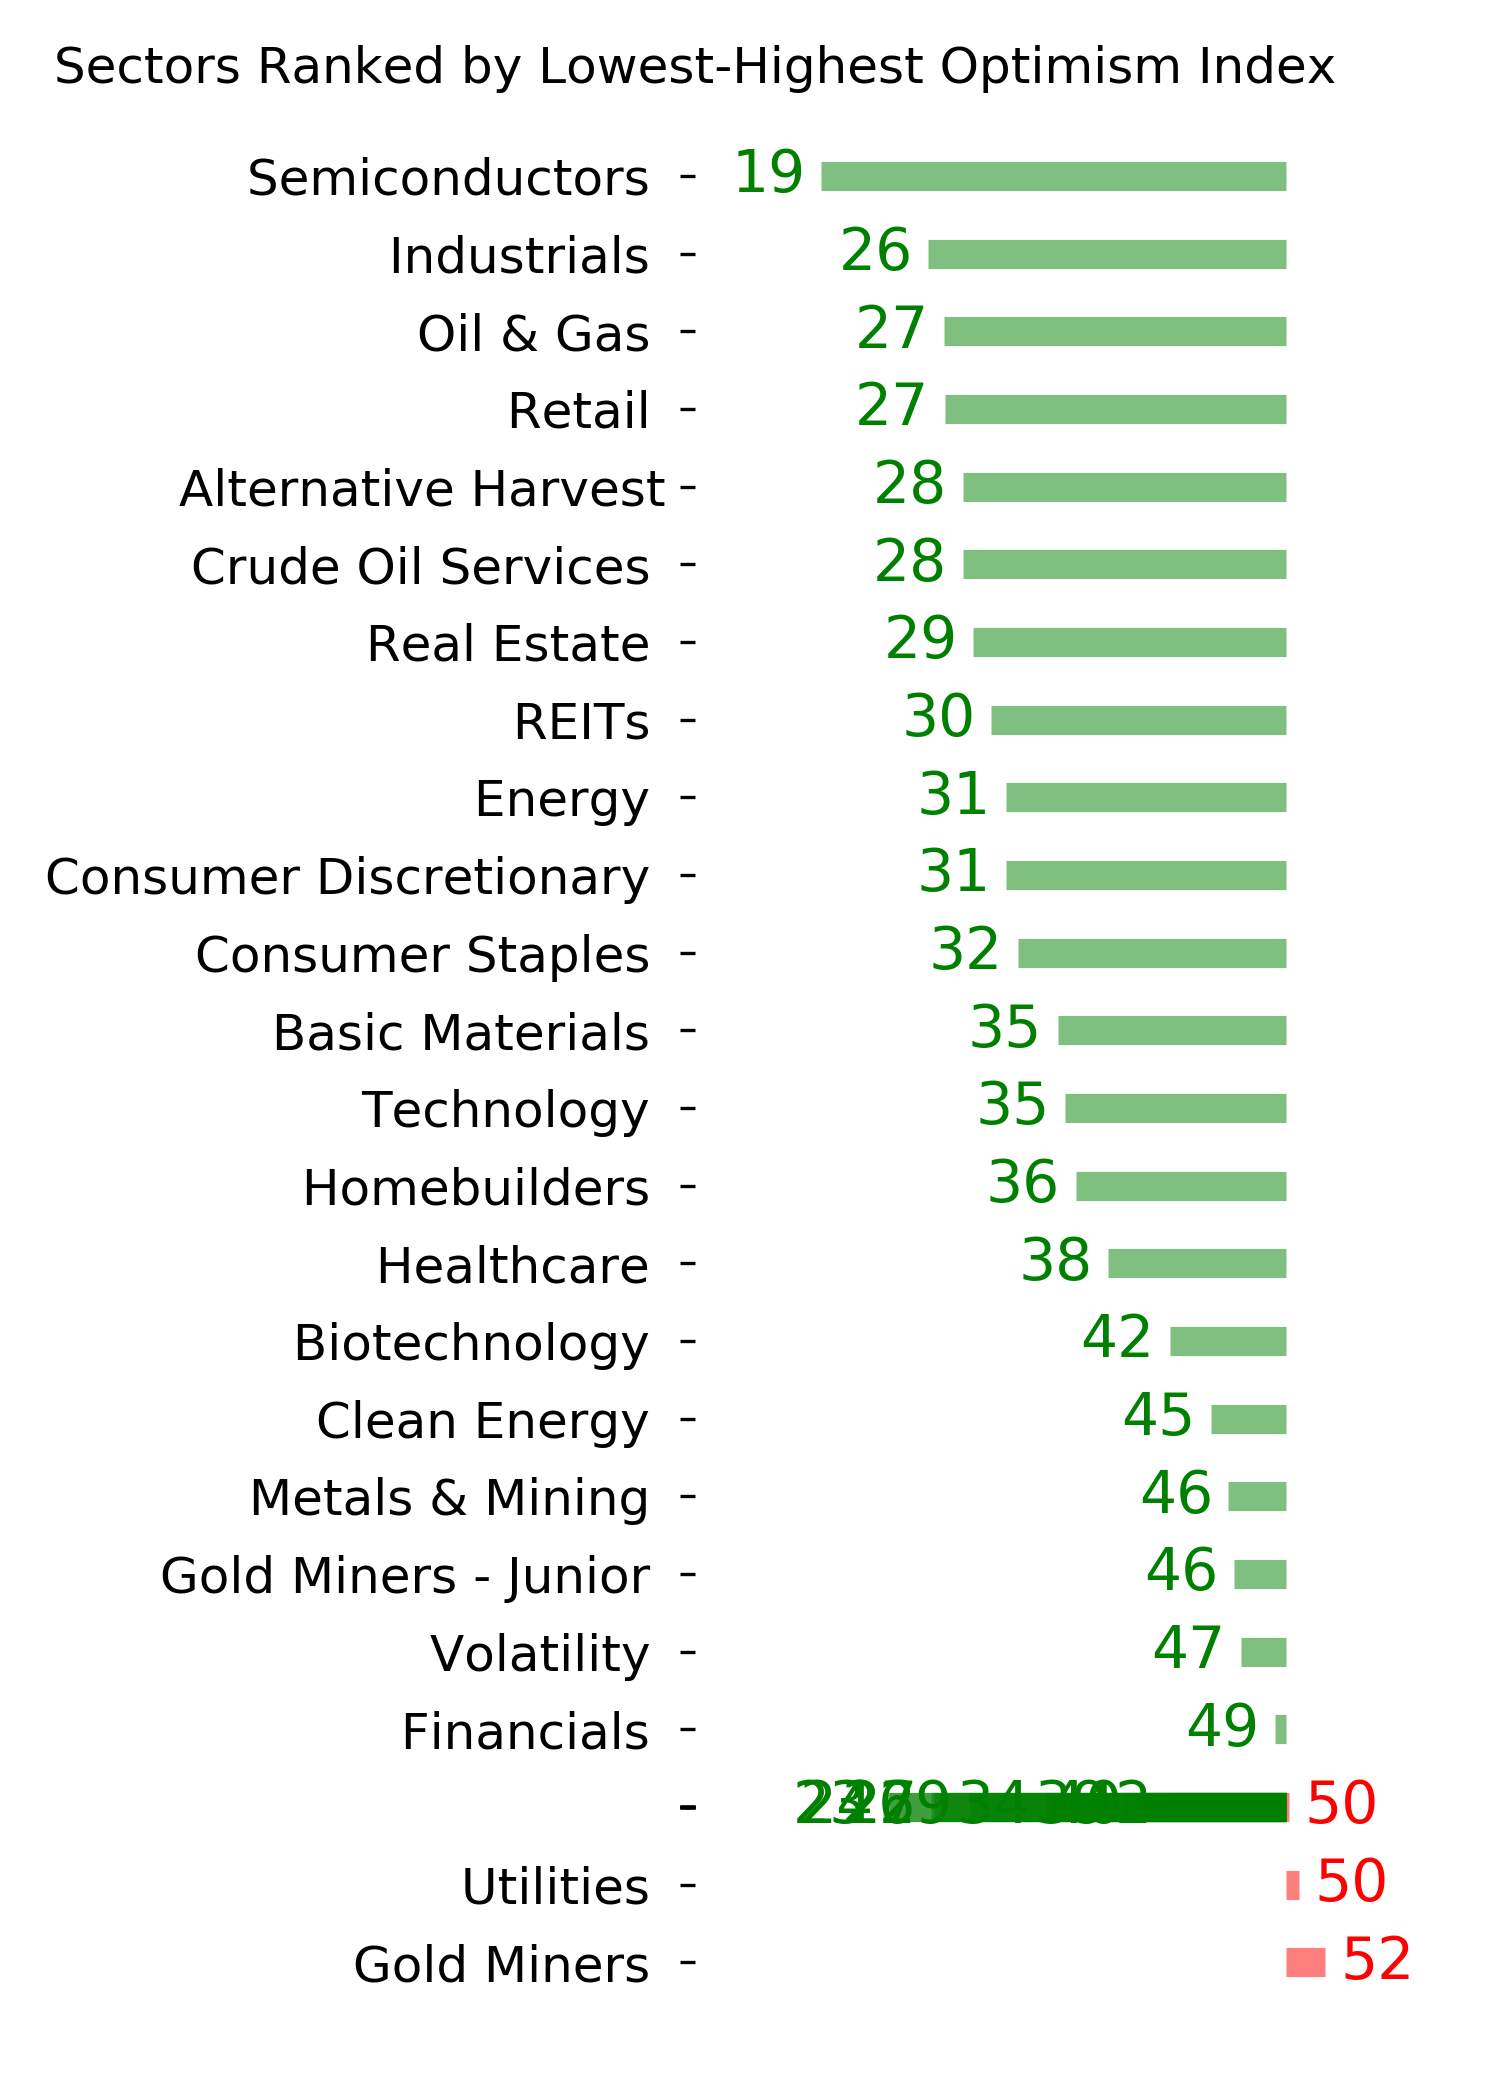
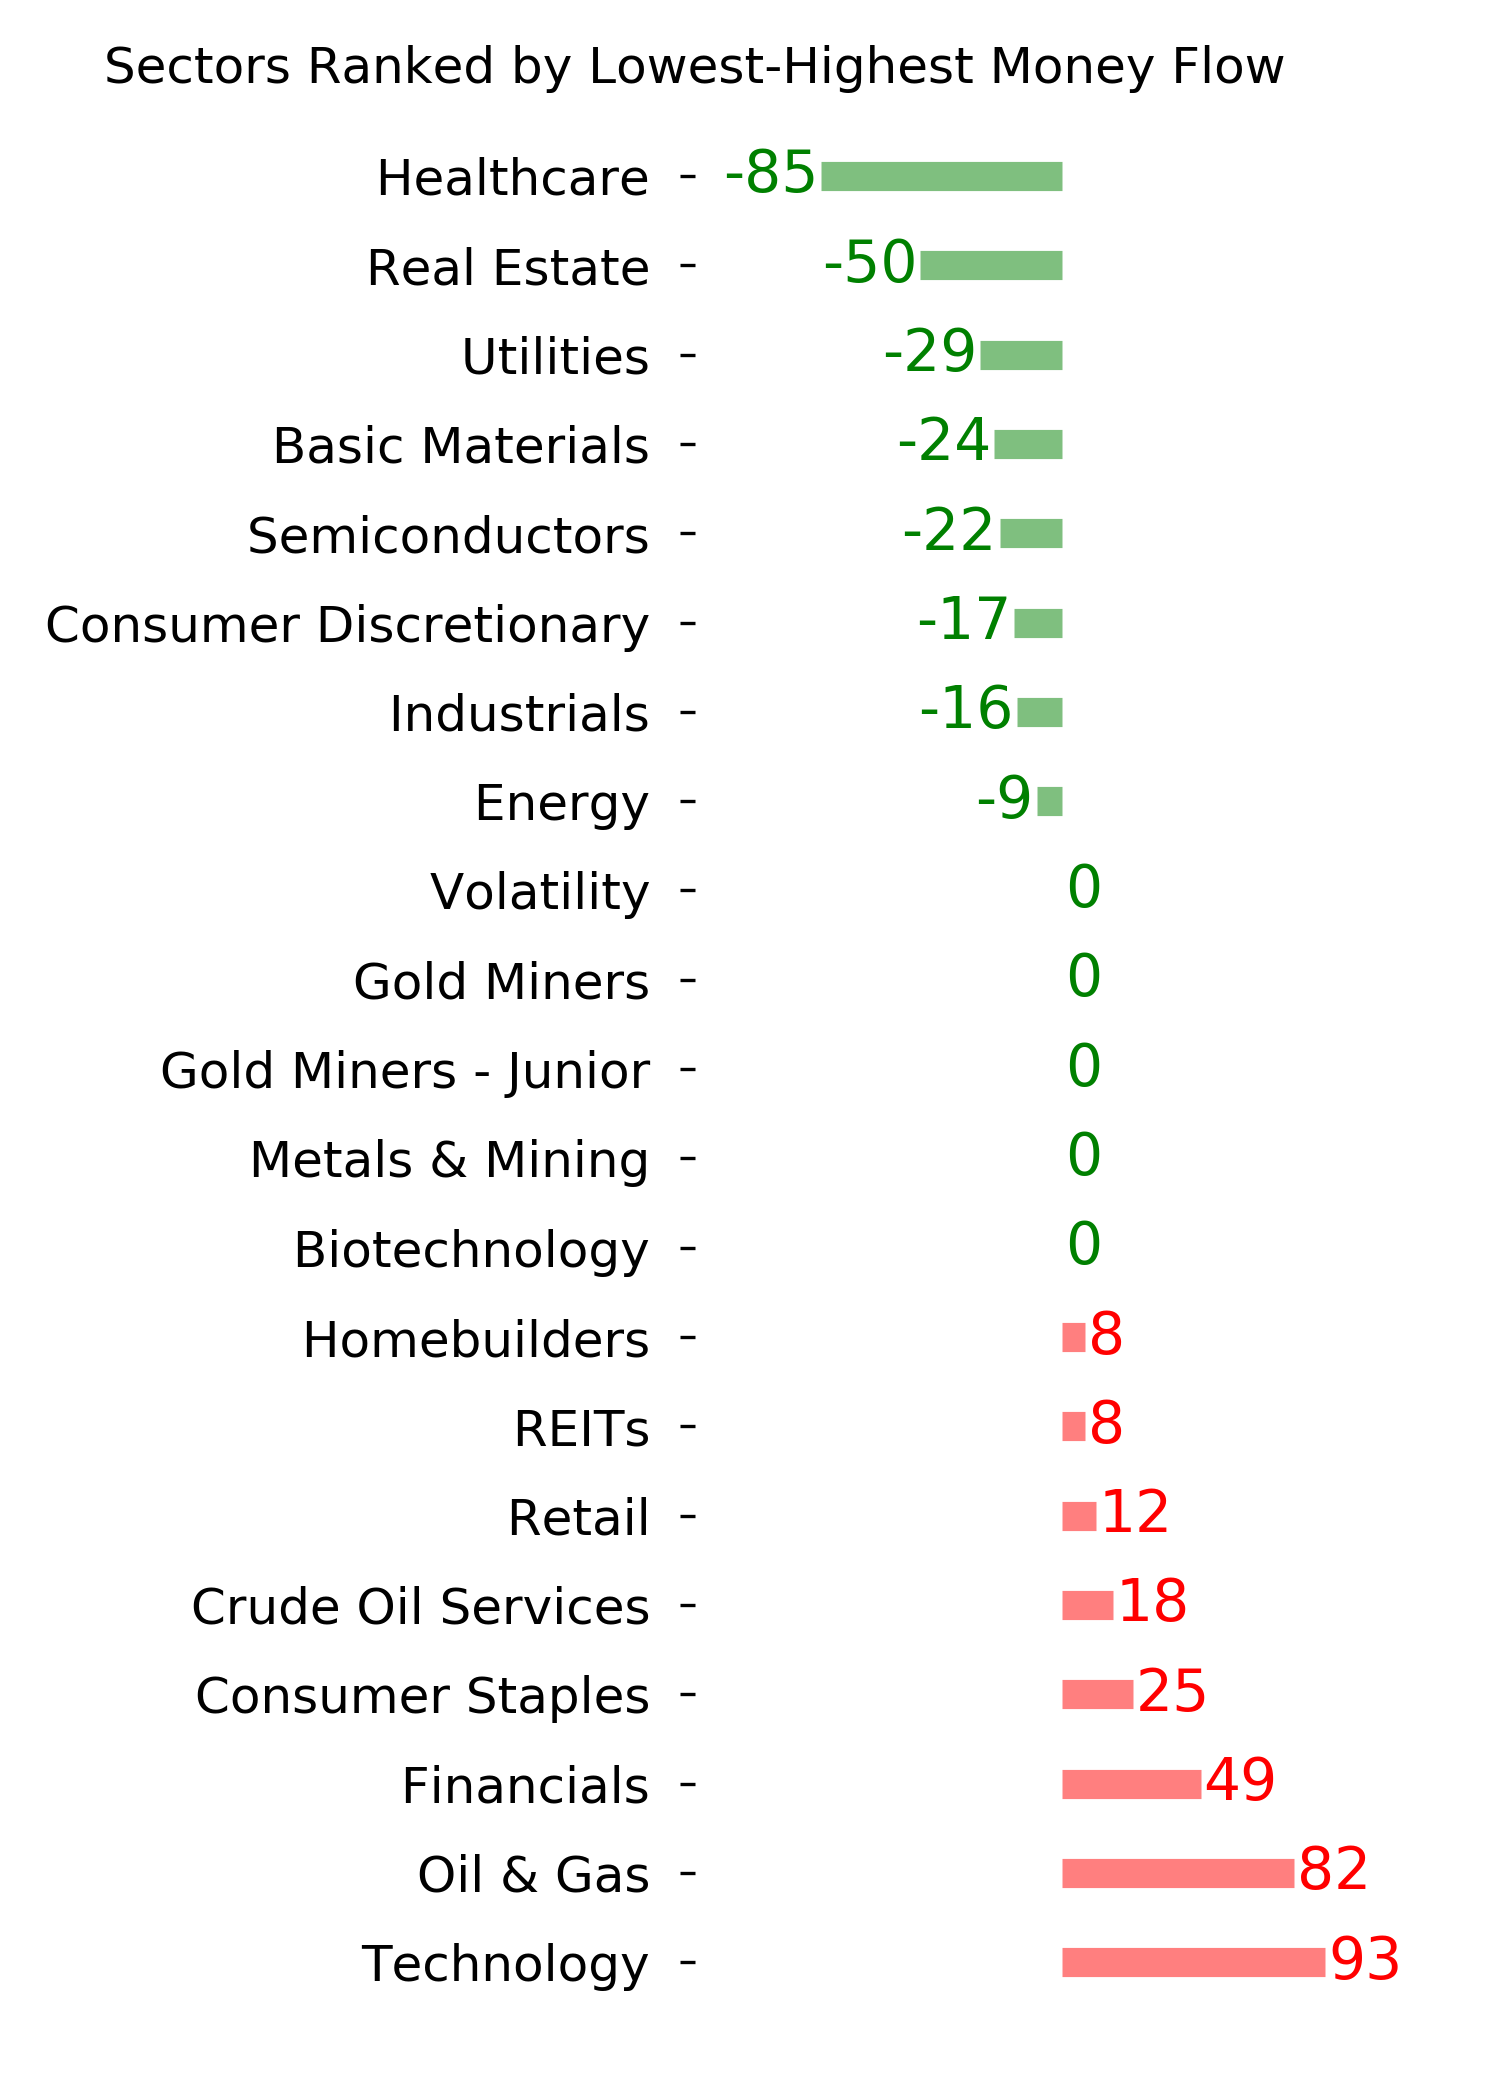
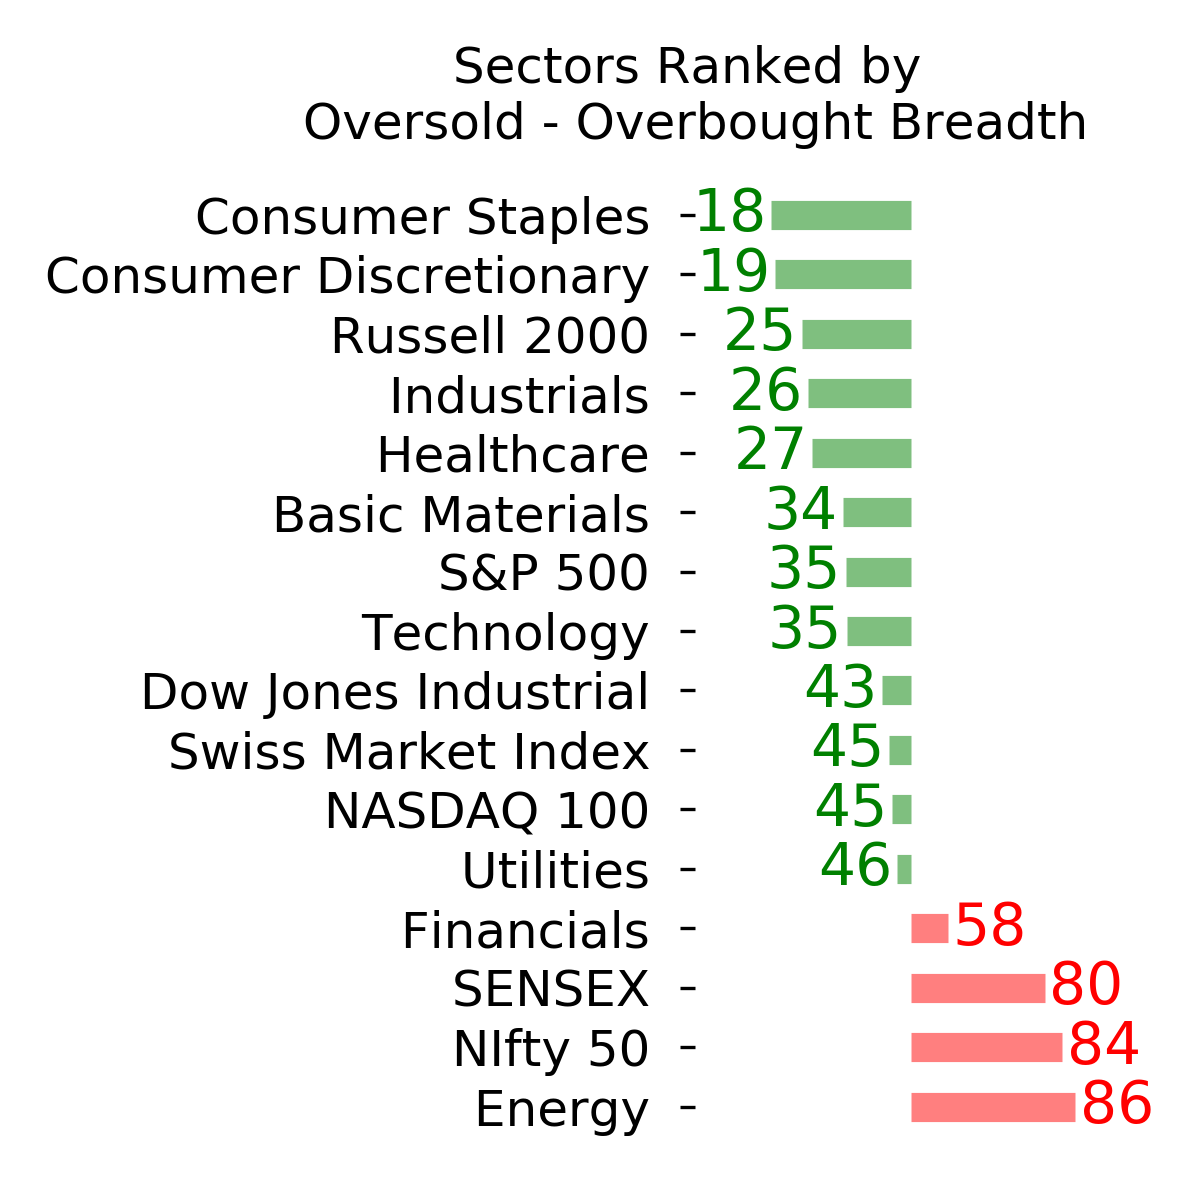
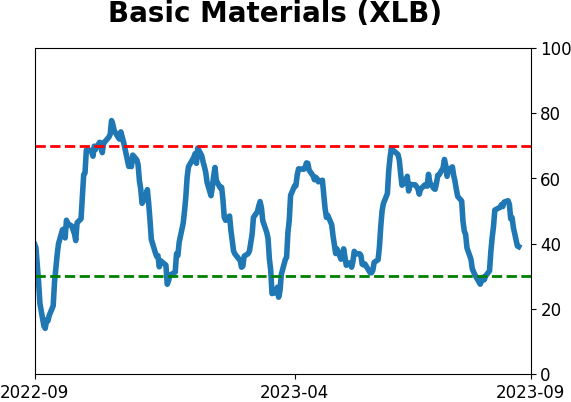
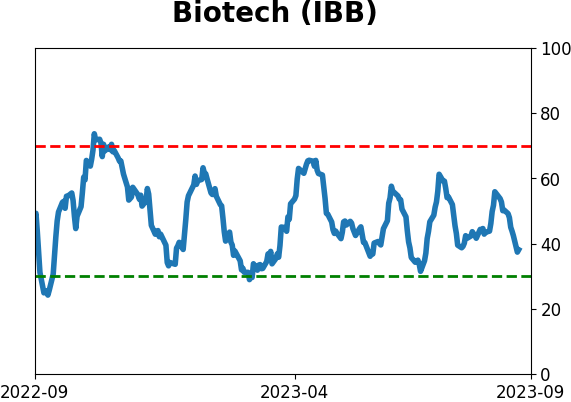
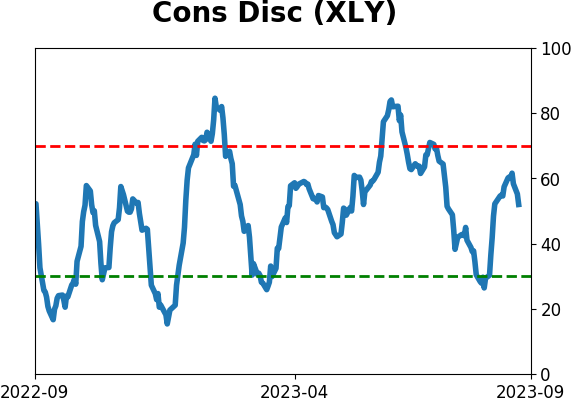
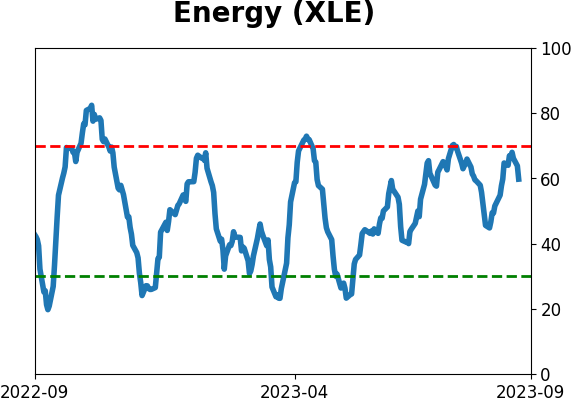
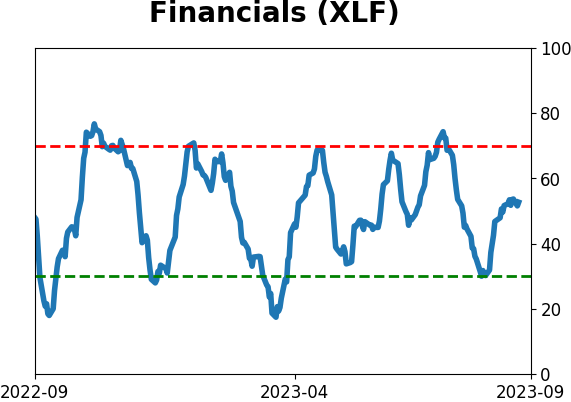
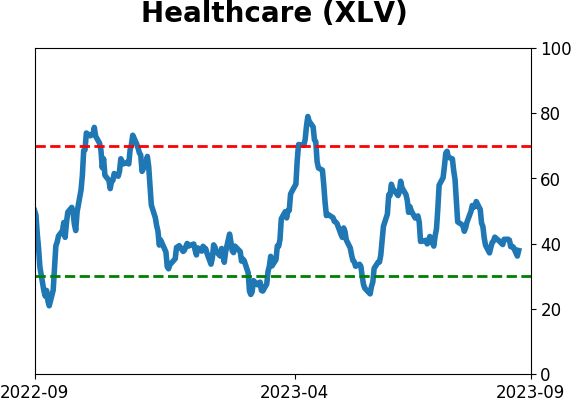
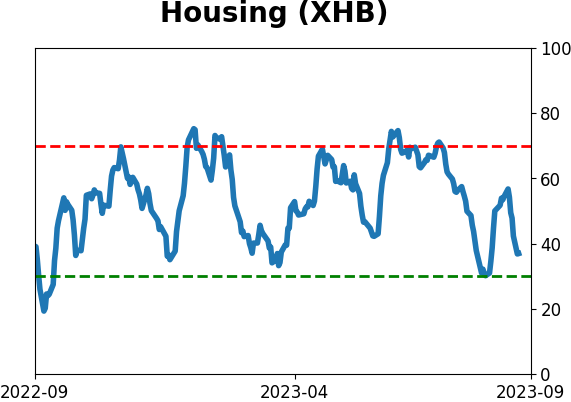
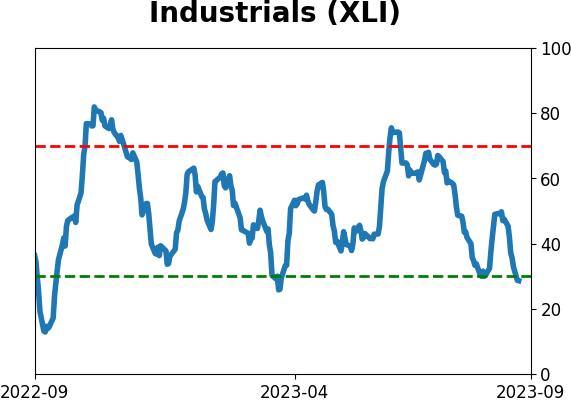
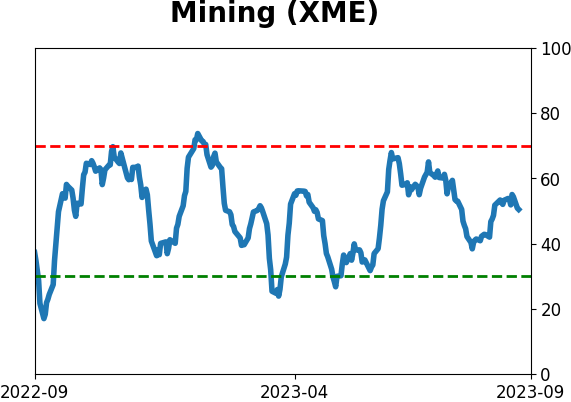
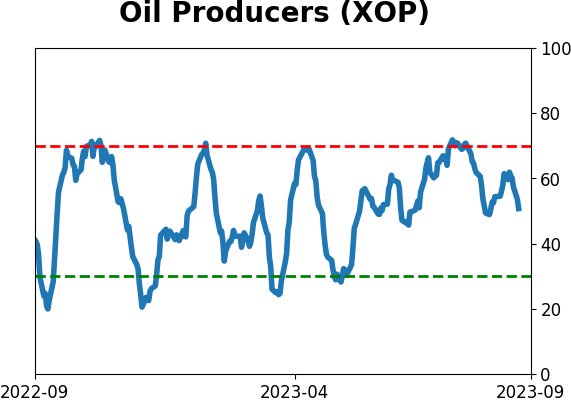
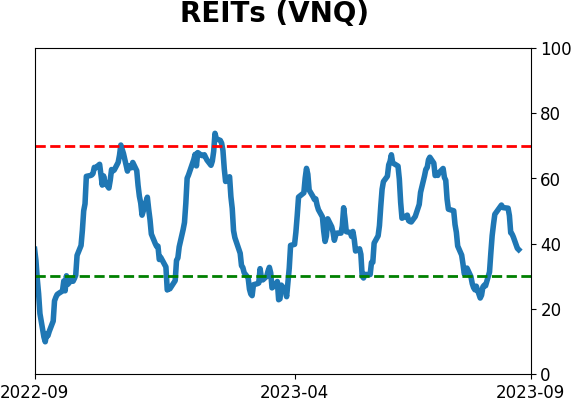
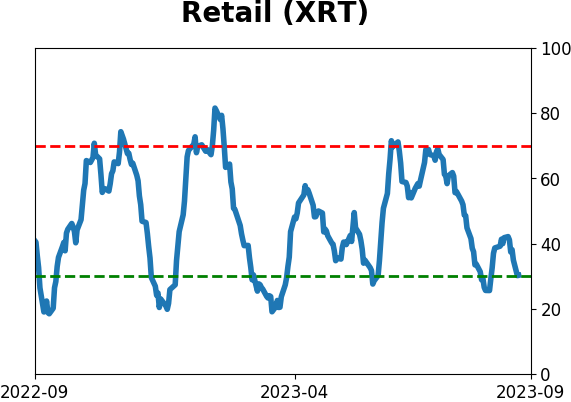
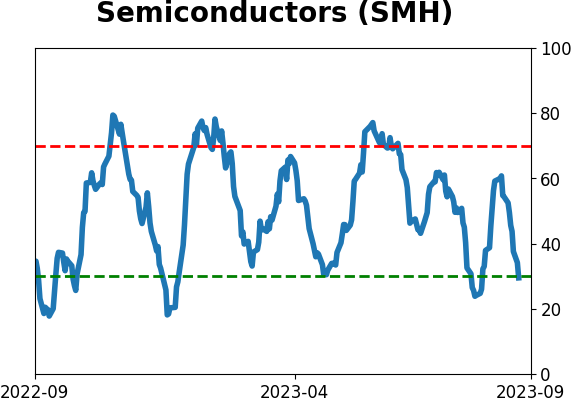
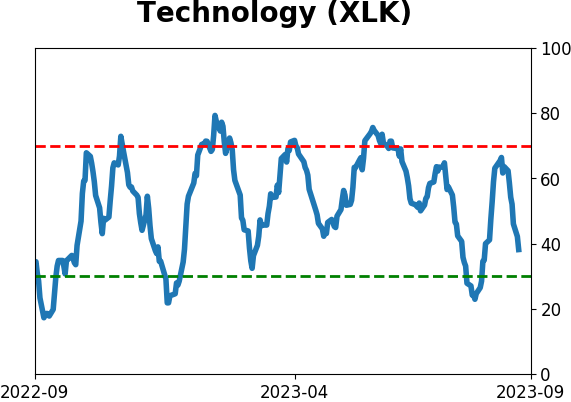
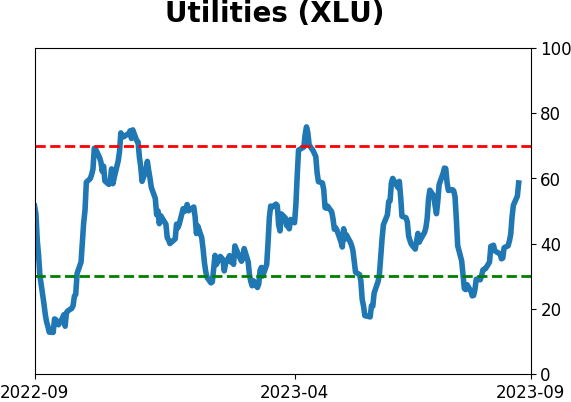
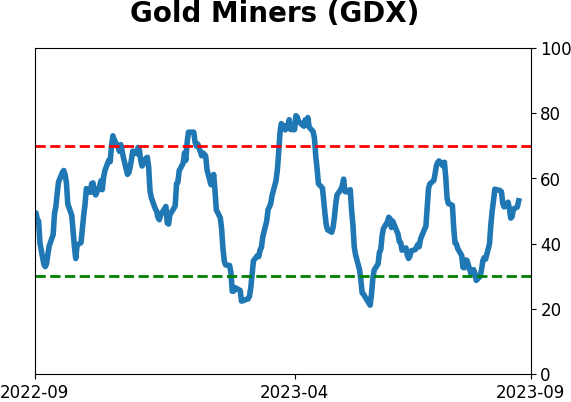
Sector ETF's - 10-Day Moving Average
|
|
|
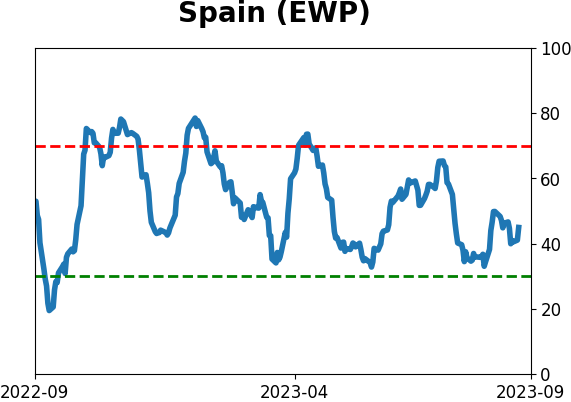
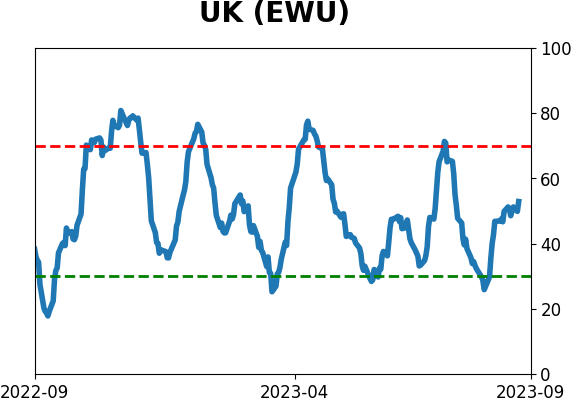
Country ETF's - 10-Day Moving Average
|
|
|
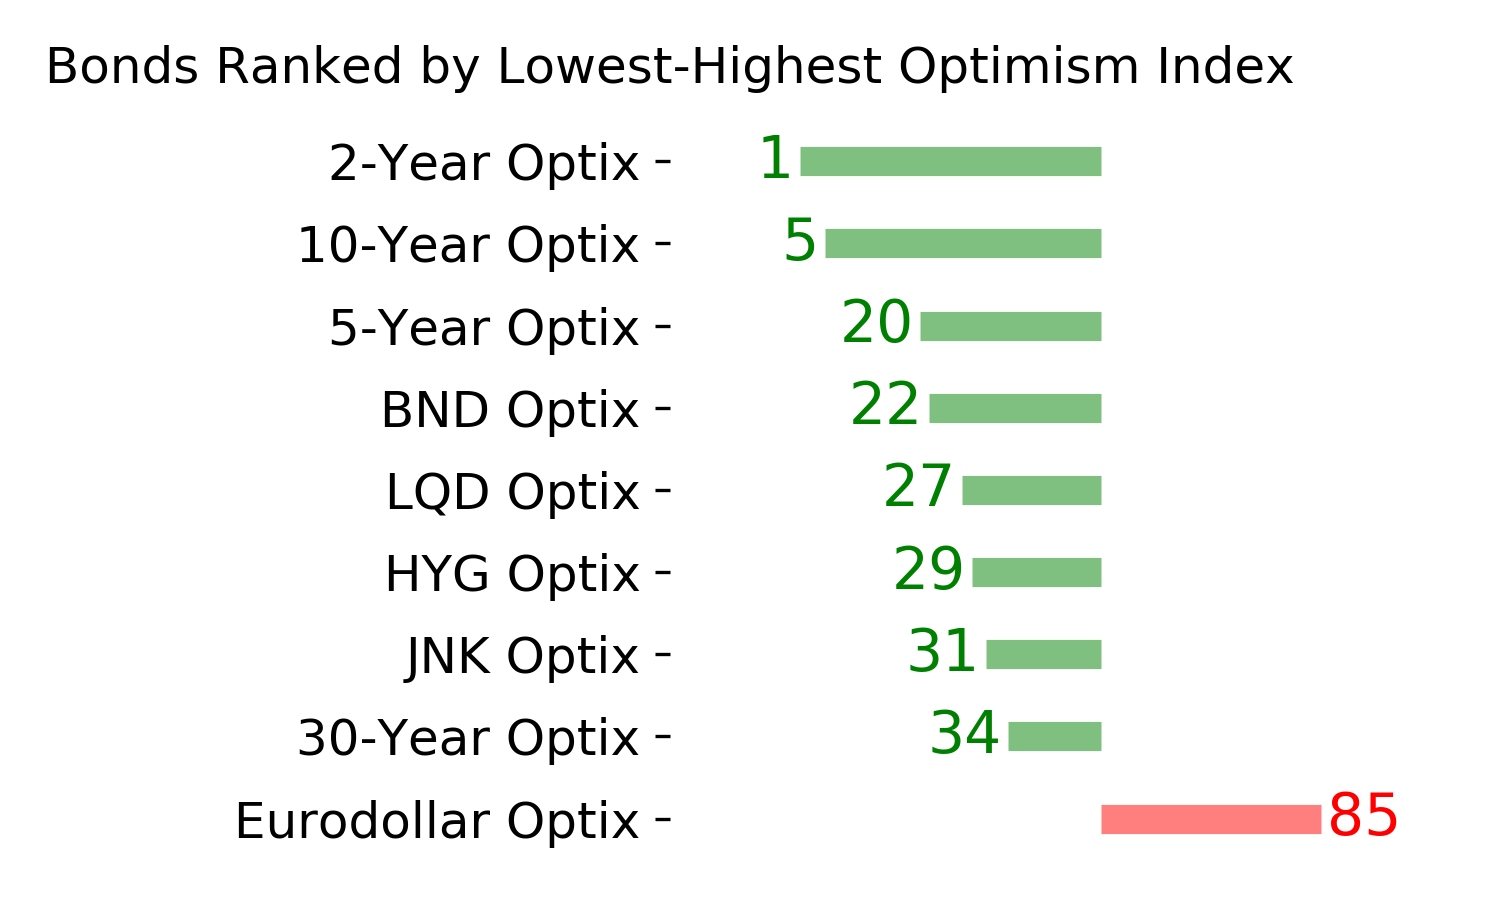
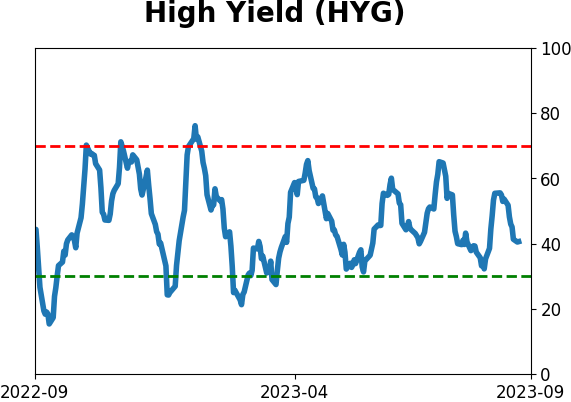
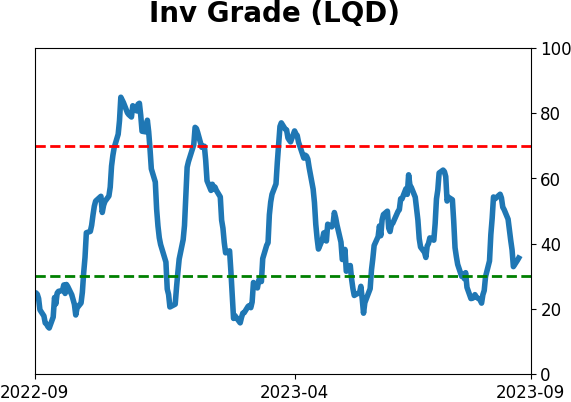
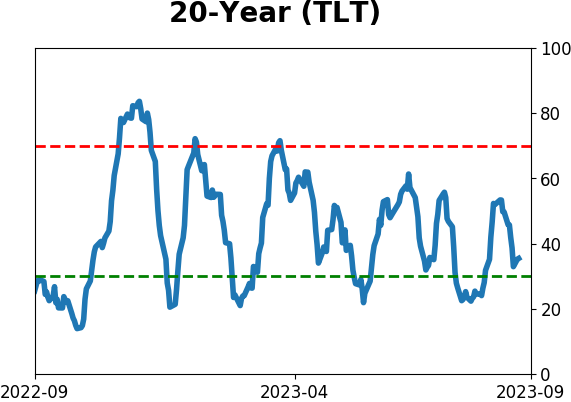
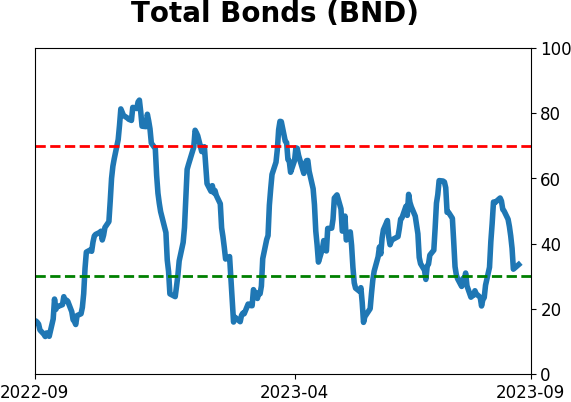
Bond ETF's - 10-Day Moving Average
|
|
|
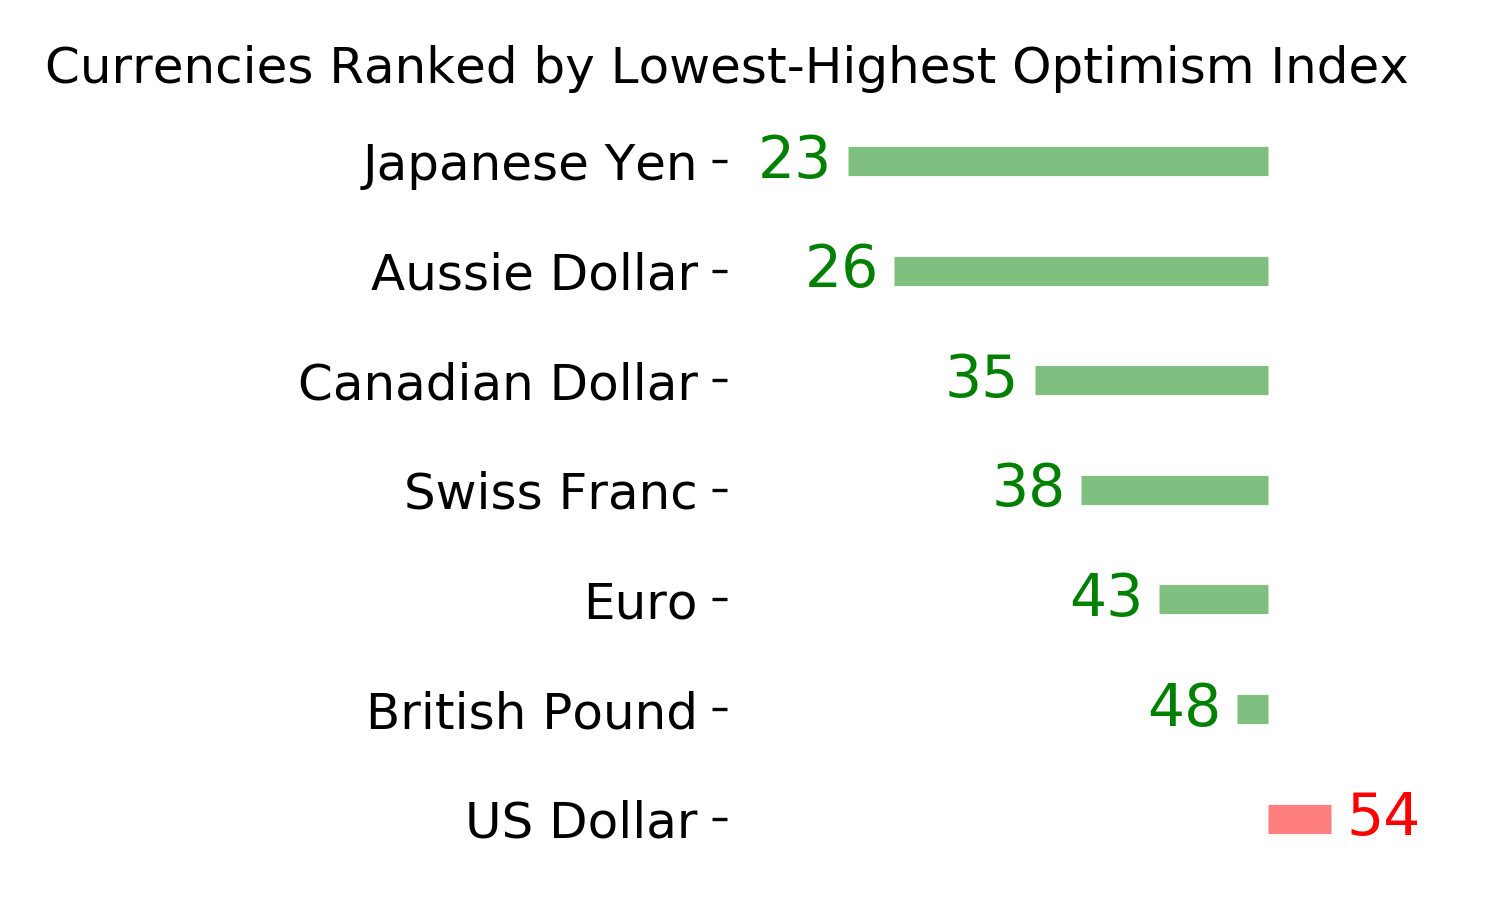
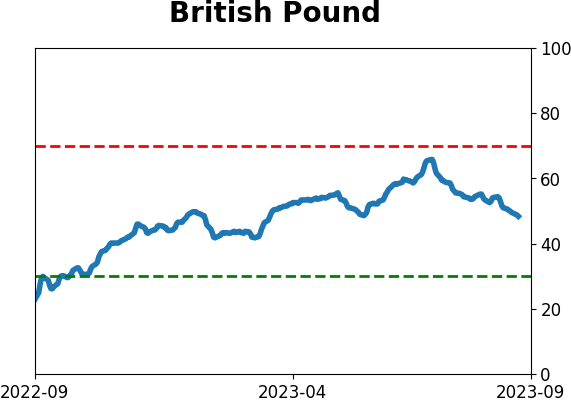
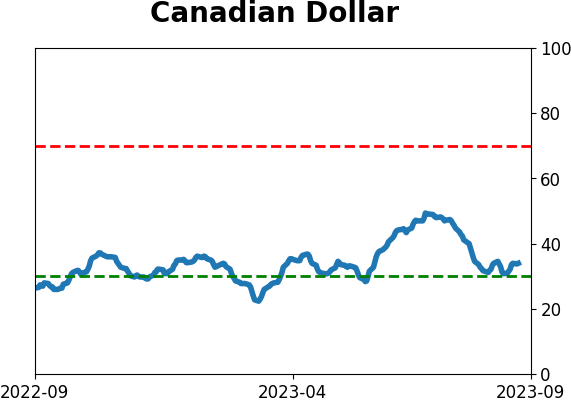
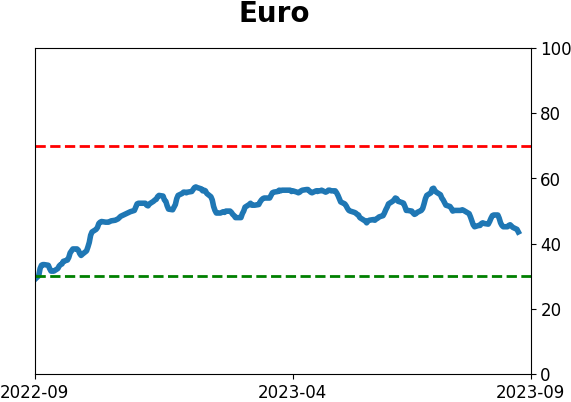
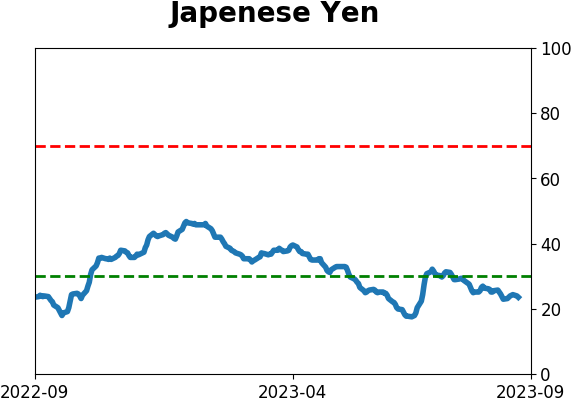
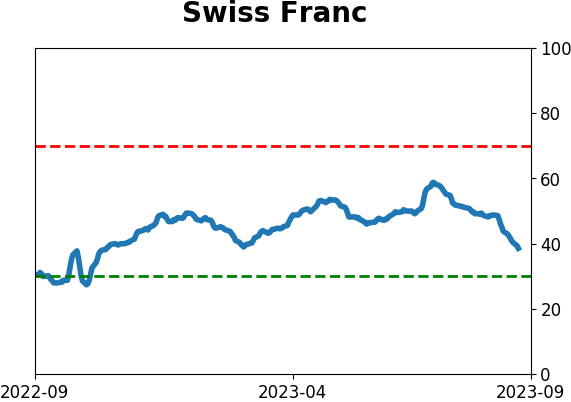
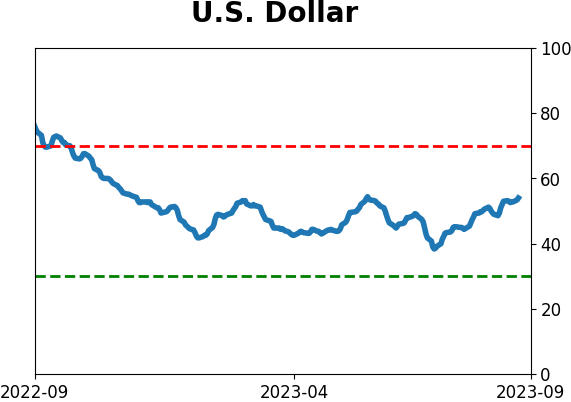
Currency ETF's - 5-Day Moving Average
|
|
|
Commodity ETF's - 5-Day Moving Average
|
|