Headlines
|
|
The S&P is chugging along with fewer members participating:
For more than a month, the S&P 500 has held more than 5% above its 200-day moving average. But no more than 60% of its member stocks have held above their own 200-day averages by any amount. This is highly unusual and is one of the longest divergence streaks since 1928.
|
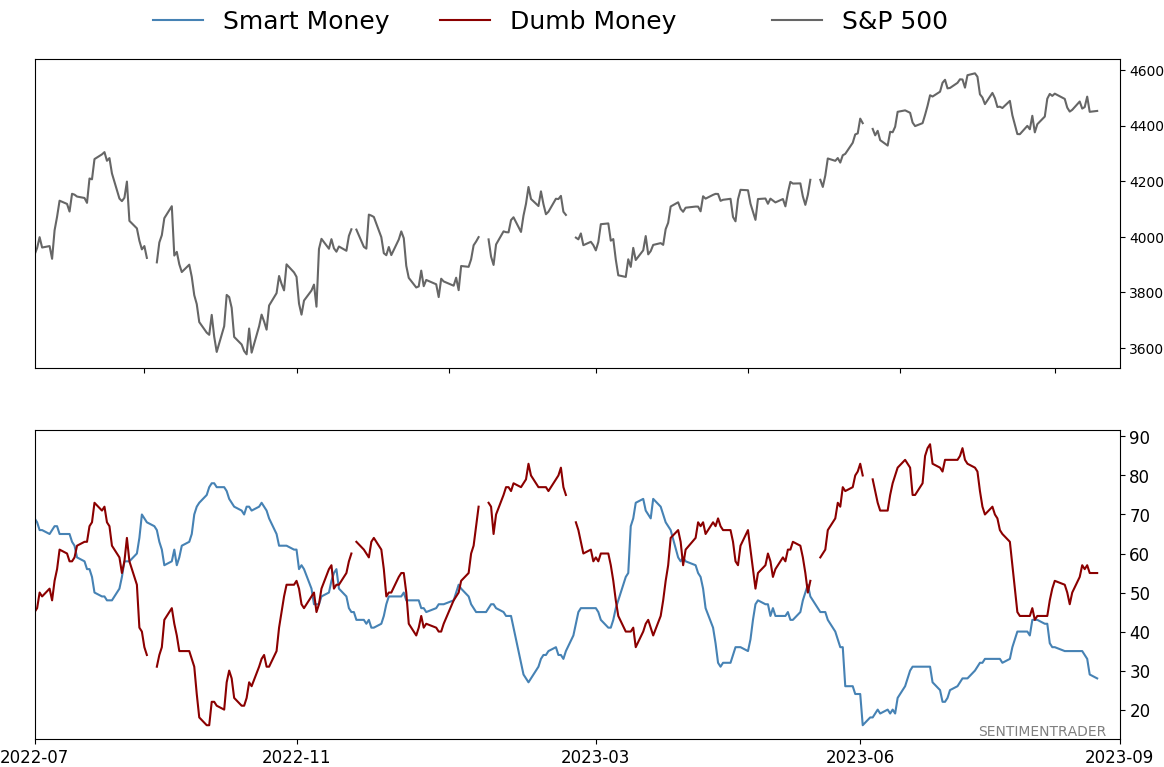
Smart / Dumb Money Confidence
|
Smart Money Confidence: 28%
Dumb Money Confidence: 55%
|
|
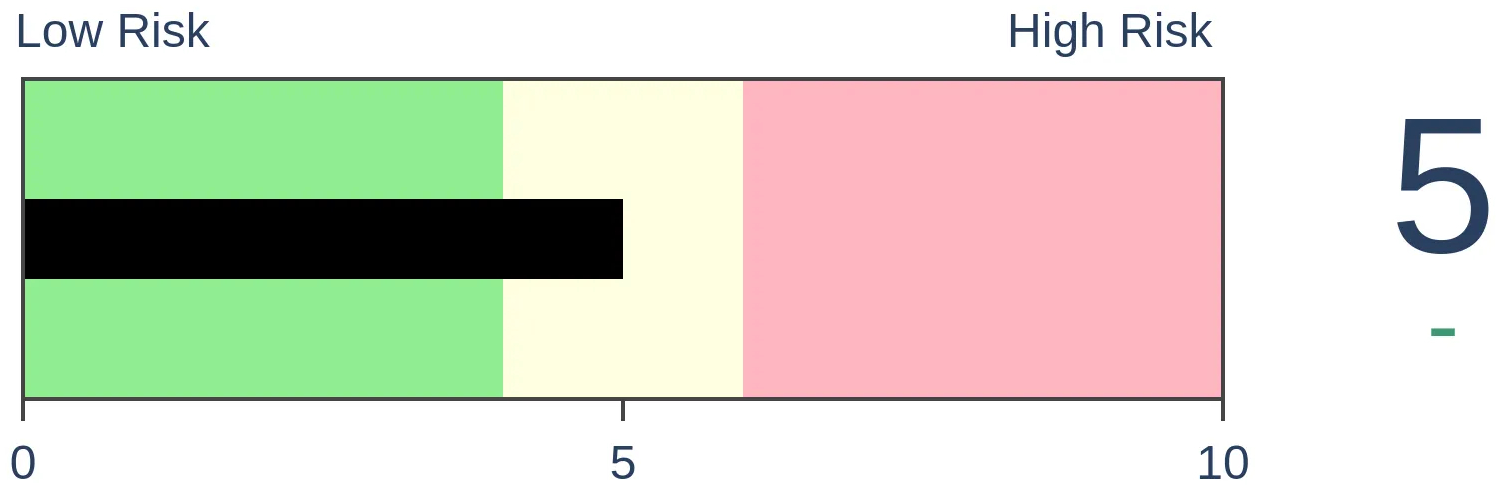
Risk Levels
Stocks Short-Term

|
Stocks Medium-Term
|
|
Bonds
|
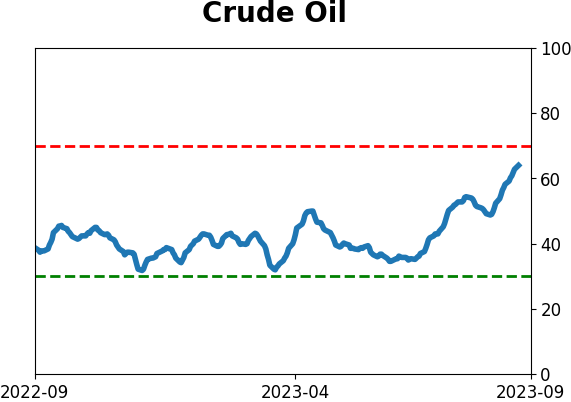
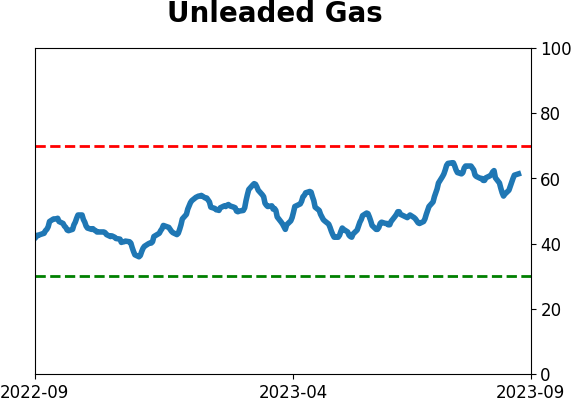
Crude Oil
|
|
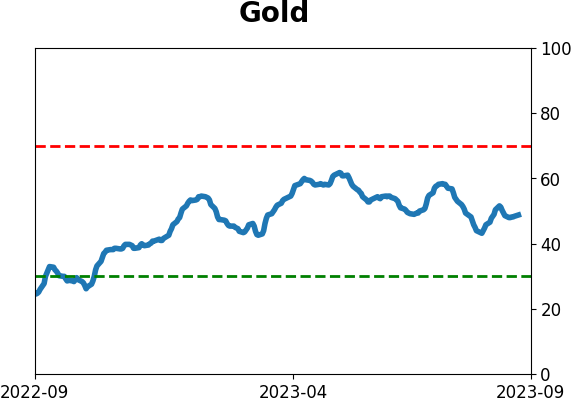
Gold
|
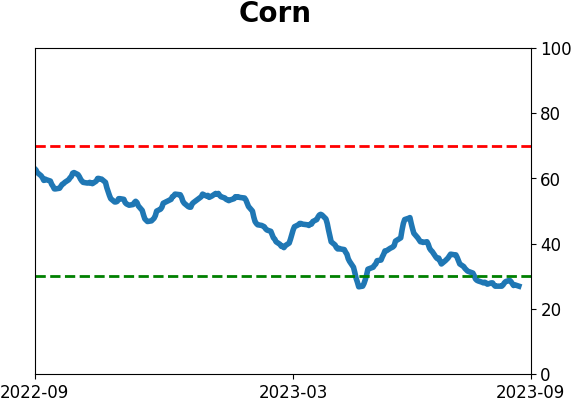
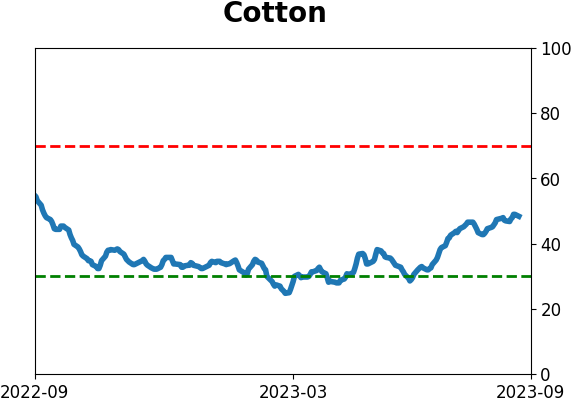
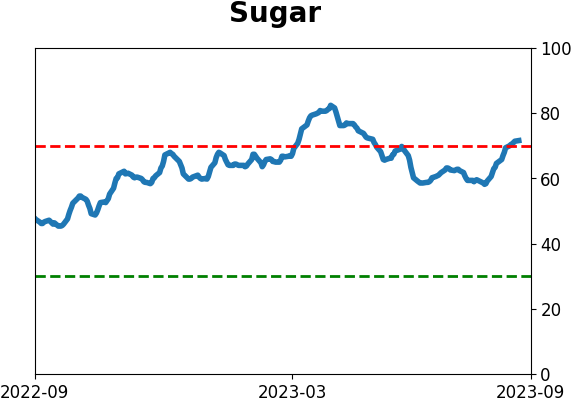
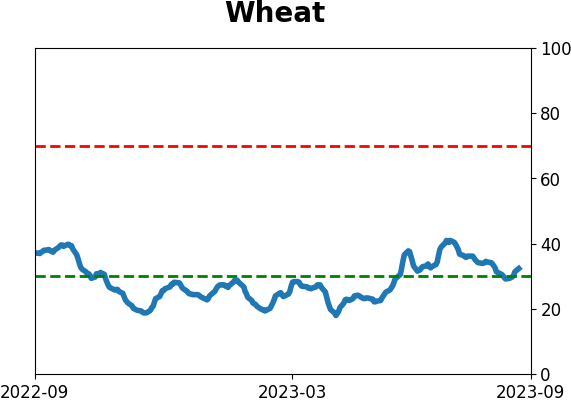
Agriculture

|
|
Research
By Jason Goepfert
BOTTOM LINE
For more than a month, the S&P 500 has held more than 5% above its 200-day moving average. But no more than 60% of its member stocks have held above their own 200-day averages by any amount. This is highly unusual and is one of the longest divergence streaks since 1928.
FORECAST / TIMEFRAME
None
|
Key points:
- The S&P 500 has been holding more than 5% above its 200-day moving average for months
- Lately, fewer than 60% of members in the index are holding above their own averages by any amount
- This is one of the longest divergence streaks since 1928, with some troubling precedents
The index versus its members
There has been a lot of talk lately - well, all year, really - about weak market breadth. The talk was that some of the indexes were doing well, but it was driven solely by a few big stocks pulling them up.
In almost all of our work since October, we haven't really seen the sense in the argument. During the early stages of the rally, breadth was phenomenal, which is precisely what we wanted to see at the beginning of a new bull market.
It's gotten a bit dicier since then.
It's not that breadth is bad per se; it just hasn't been all that great. One of the hallmarks of healthy markets is that long-term trends within stocks in the S&P 500 should remain robust for prolonged periods. More than 60% of stocks in the index should consistently hold above their 200-day moving averages. When the market dips and fewer than 40% of stocks (or close to it) are above their averages, buyers should see an opportunity and return.
We have definitely seen the latter over the past 11 months. We have not seen the former.
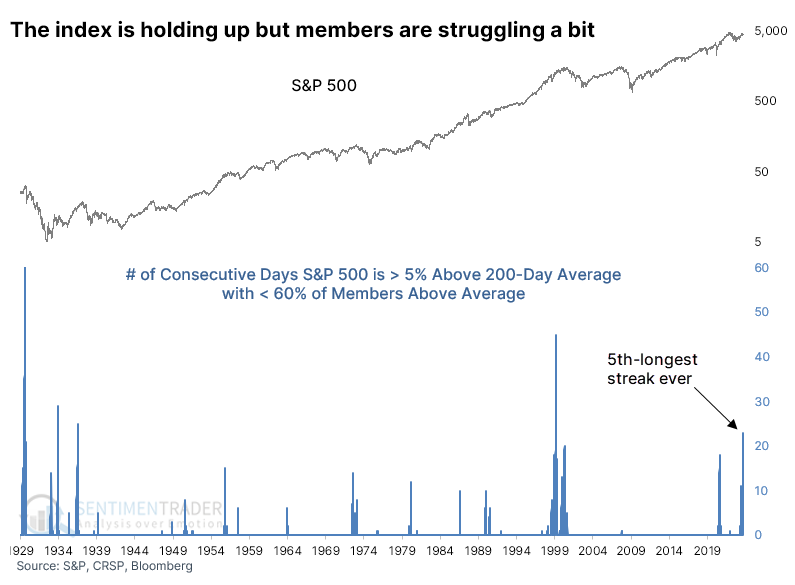
One of the nice things about the new backtesting feature is the ability to add multiple indicators to a single chart. Below, we can see the S&P 500, its deviation from its 200-day moving average, and the percentage of stocks in the index above their own 200-day moving averages. The index has held more than 5% above its average for weeks, while fewer than 60% of members are above their own averages by any amount.
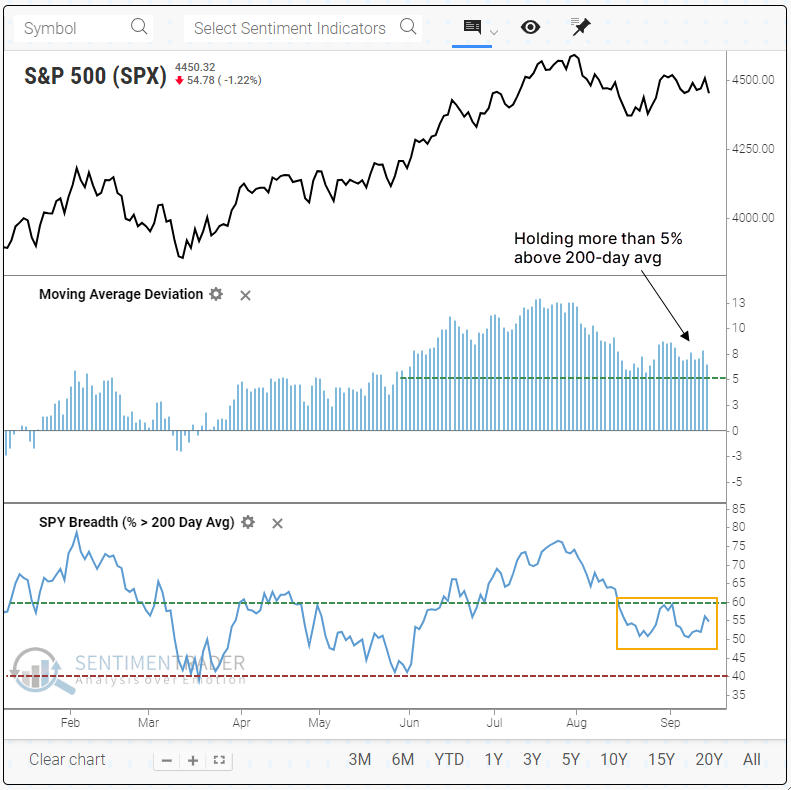
This is unusual - since 1928, when the S&P 500 has been more than 5% above its 200-day moving average, a median of 81% of its stocks were also above their own moving averages. Lately, more than 25% fewer stocks than average have been maintaining their long-term trends.
The chart below shows how long the streak has gone. It shows the number of consecutive days that the S&P was more than 5% above its 200-day, AND fewer than 60% of members in the index were also trading above their 200-day averages at the time. The current streak is 23 days, the 5th-longest in nearly a hundred years.
Extended divergences between the index and its members are troubling
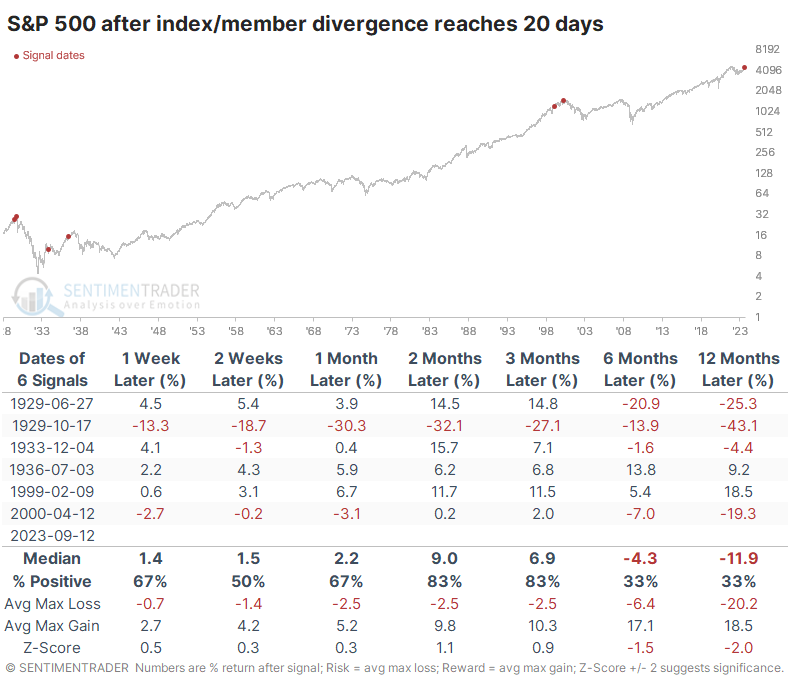
Since the streak is so long, the precedents are few, and the usual caveats about tiny sample sizes apply. For what it's worth, the index tended to pull the members along, and up to three months later, the index was higher after five of the six instances. That one exception was one of the biggest exceptions of all time, though. And none of them were particularly great times to be a long-term investor.
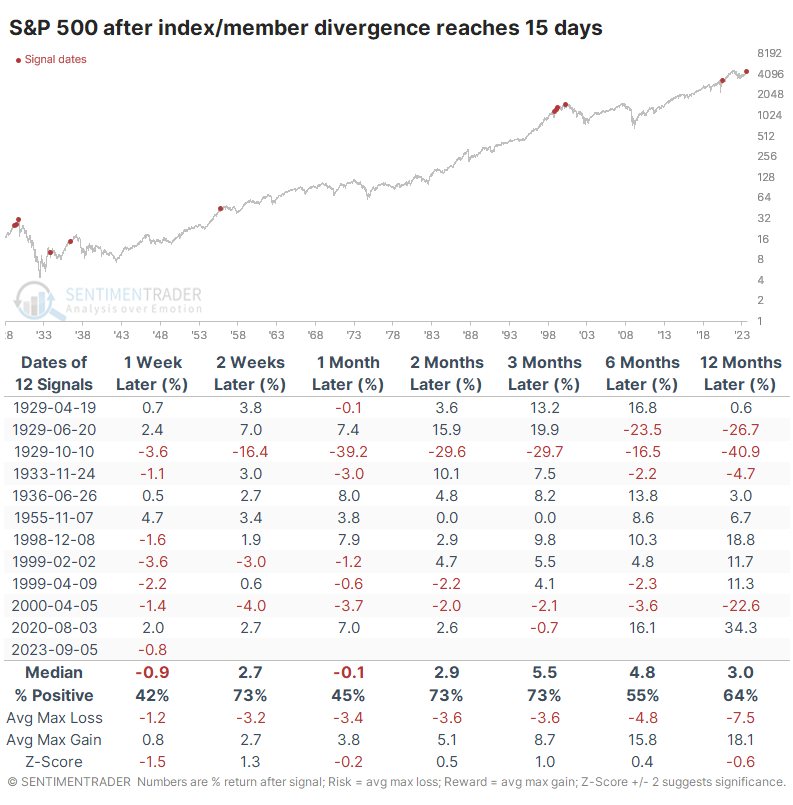
Since the sample is so small, let's look at lesser extremes. The following table shows times when the divergence streak reached 15 trading days. These weren't quite so dire, as it added dates in 1955 and 2020 that preceded decent gains. But still, it was mostly concentrated in the 1920s-30s and ahead of the internet bubble peak.
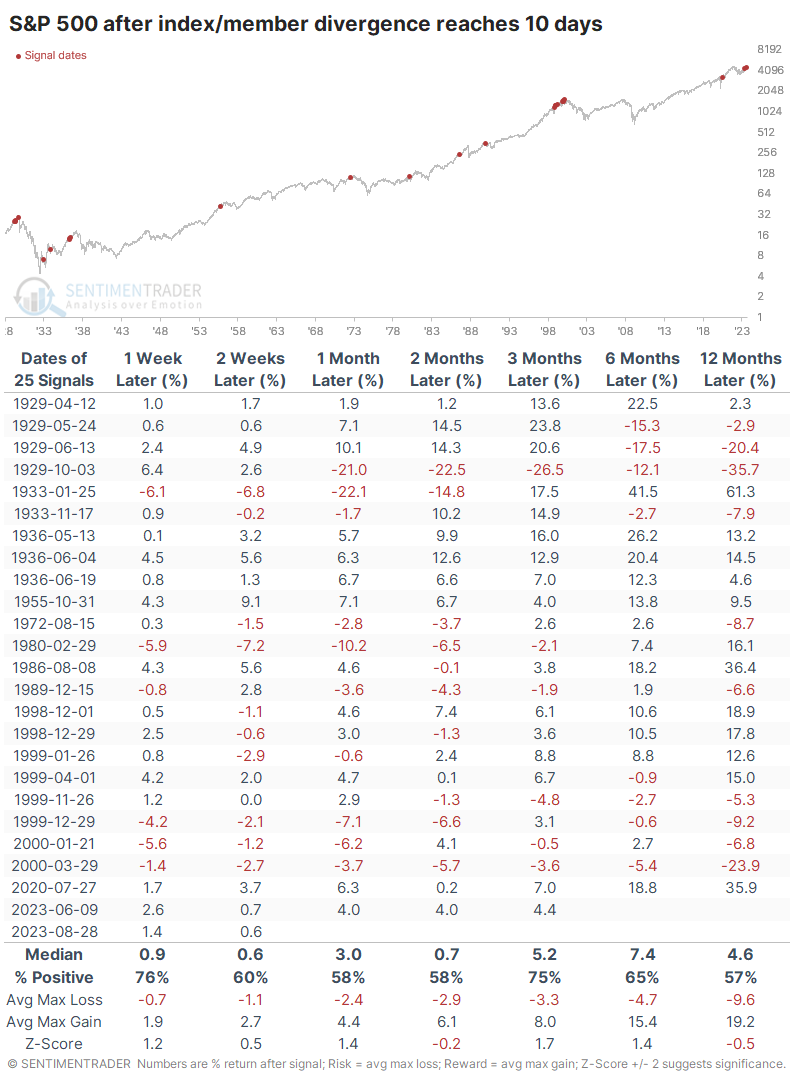
Let's relax the parameters further; the next table shows divergence streaks of 10 days. This adds quite a few more precedents, and they're less ominous. While it ultimately led to bear markets in 1974, 1987, and 1990, overall returns weren't too bad over the next 3-6 months.
What the research tells us...
The "weak breadth" gang has been tilting at windmills for nearly a year. The weaknesses of their "weakness" argument have been fairly obvious, but it's getting less so. While most major indexes have been holding up very well, fewer members are doing the same.
It has reached a point where the last month has seen a lack of stocks managing to hold their long-term uptrends, which is highly unusual given how well the S&P 500 index has been holding up. The precedents for similar behavior are somewhat troubling. It would be a lot more worrisome, however, if we get to a point where fewer than 40% of S&P stocks are holding above their 200-day averages, and bulls show little interest in using that as a buying opportunity.
Indicators at Extremes
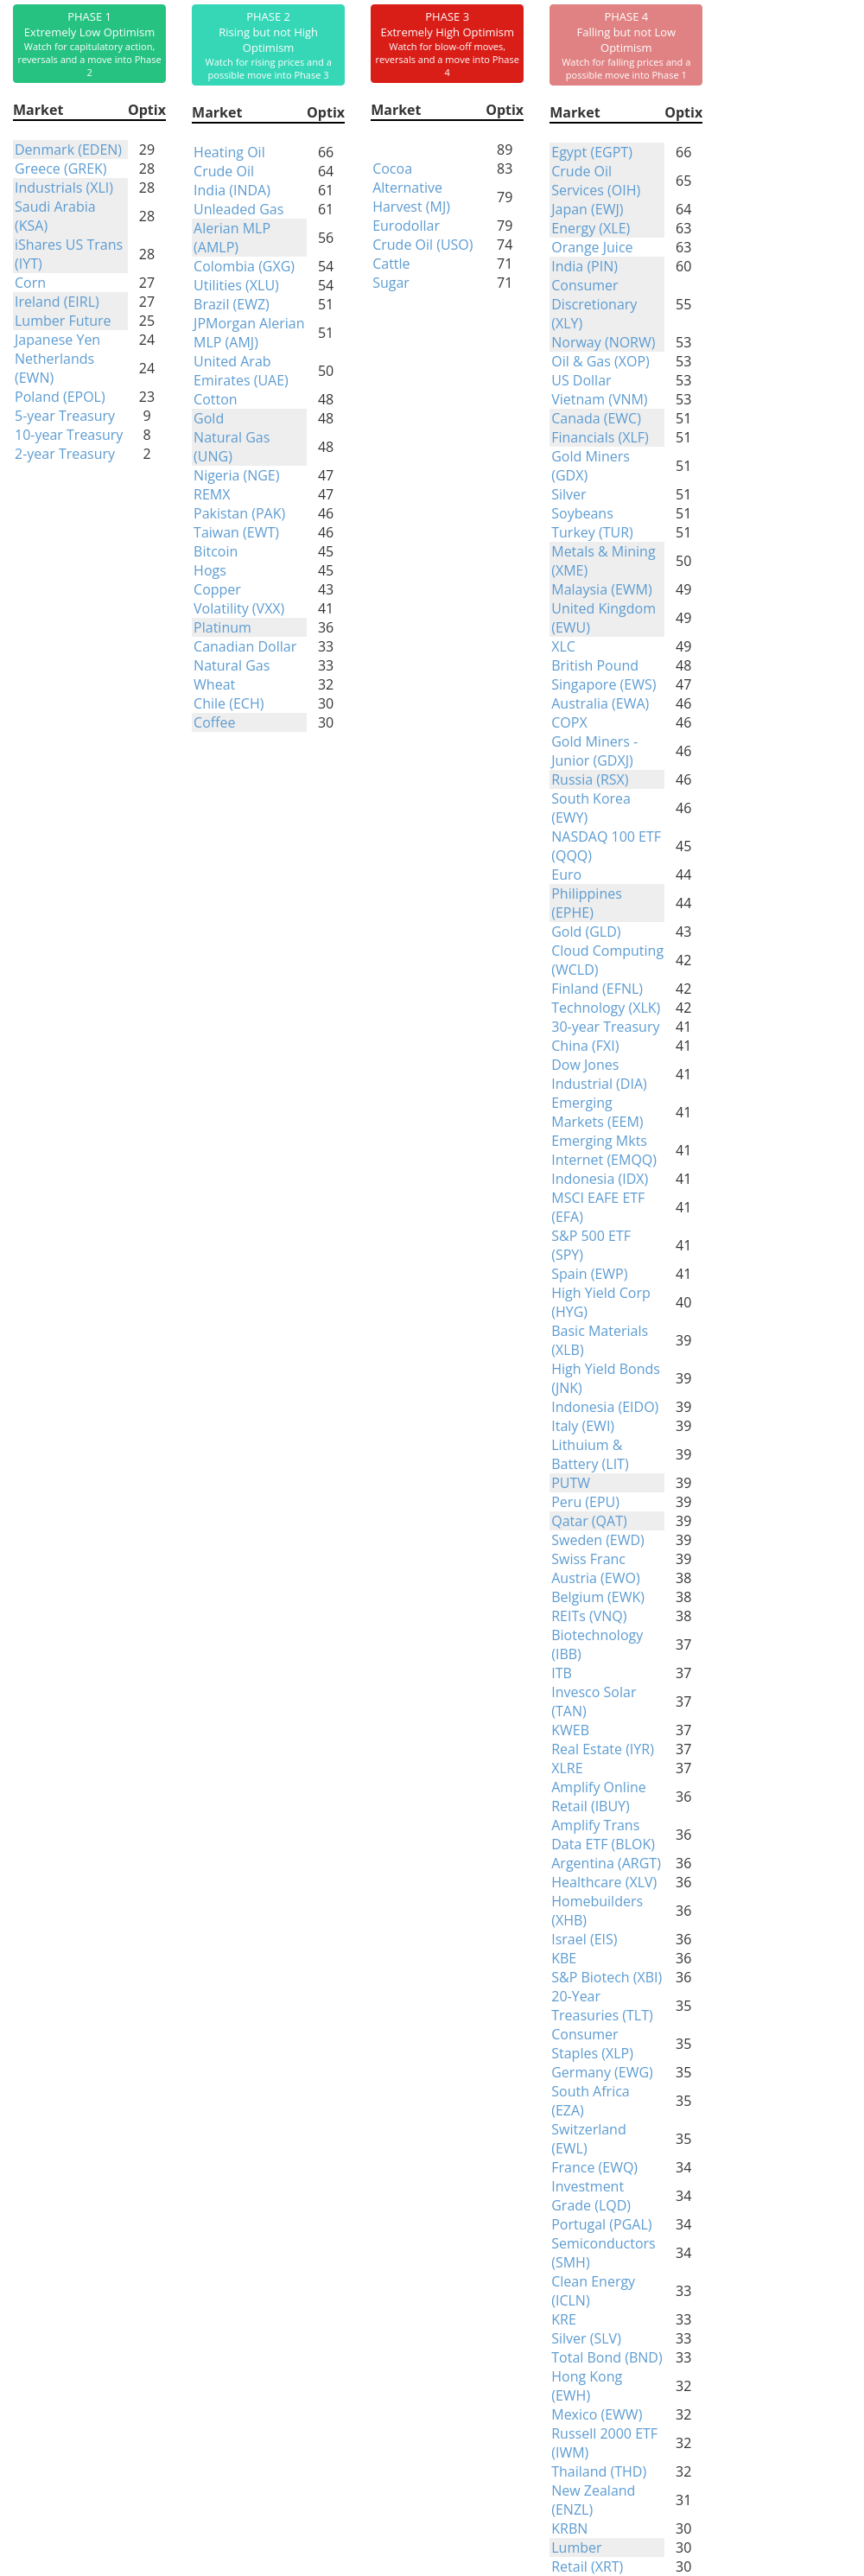
Phase Table
Ranks
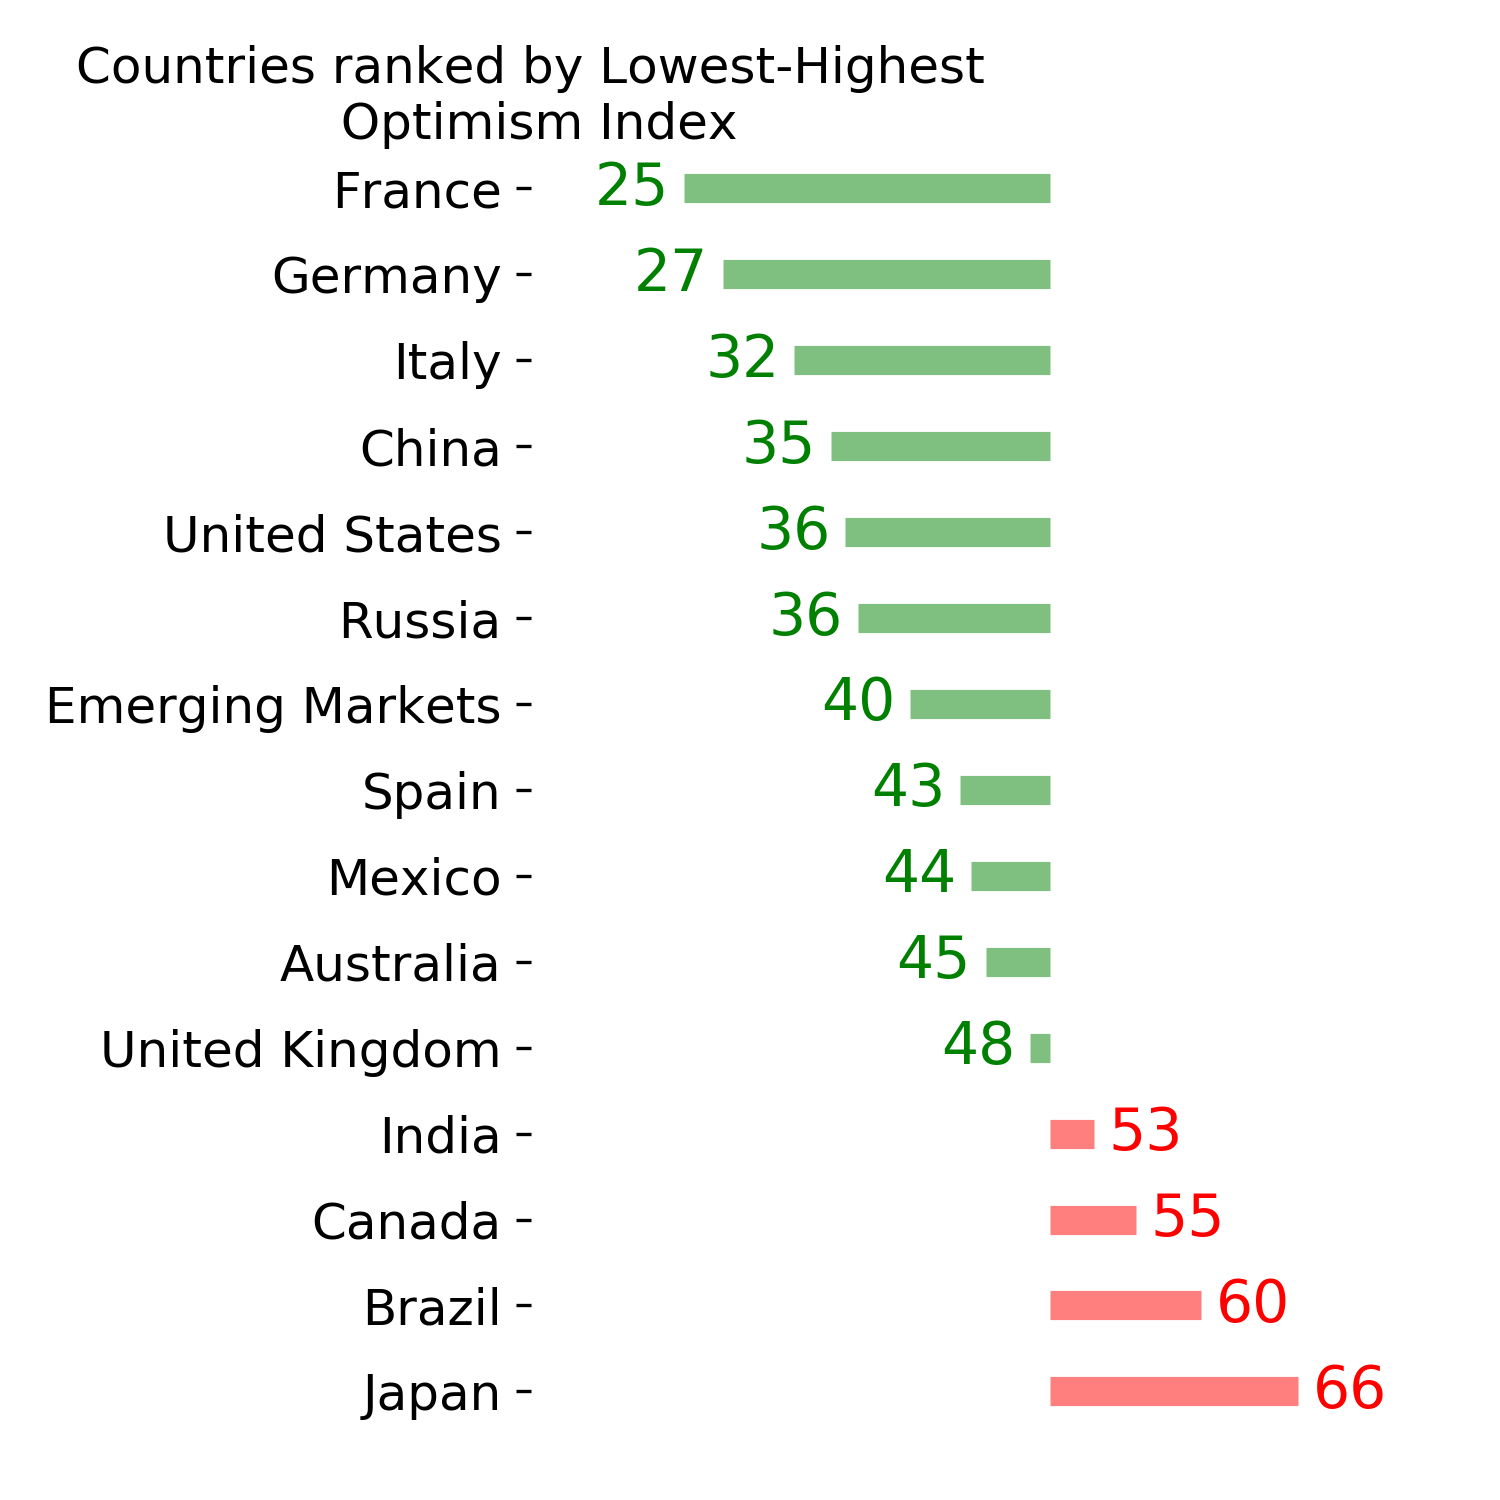
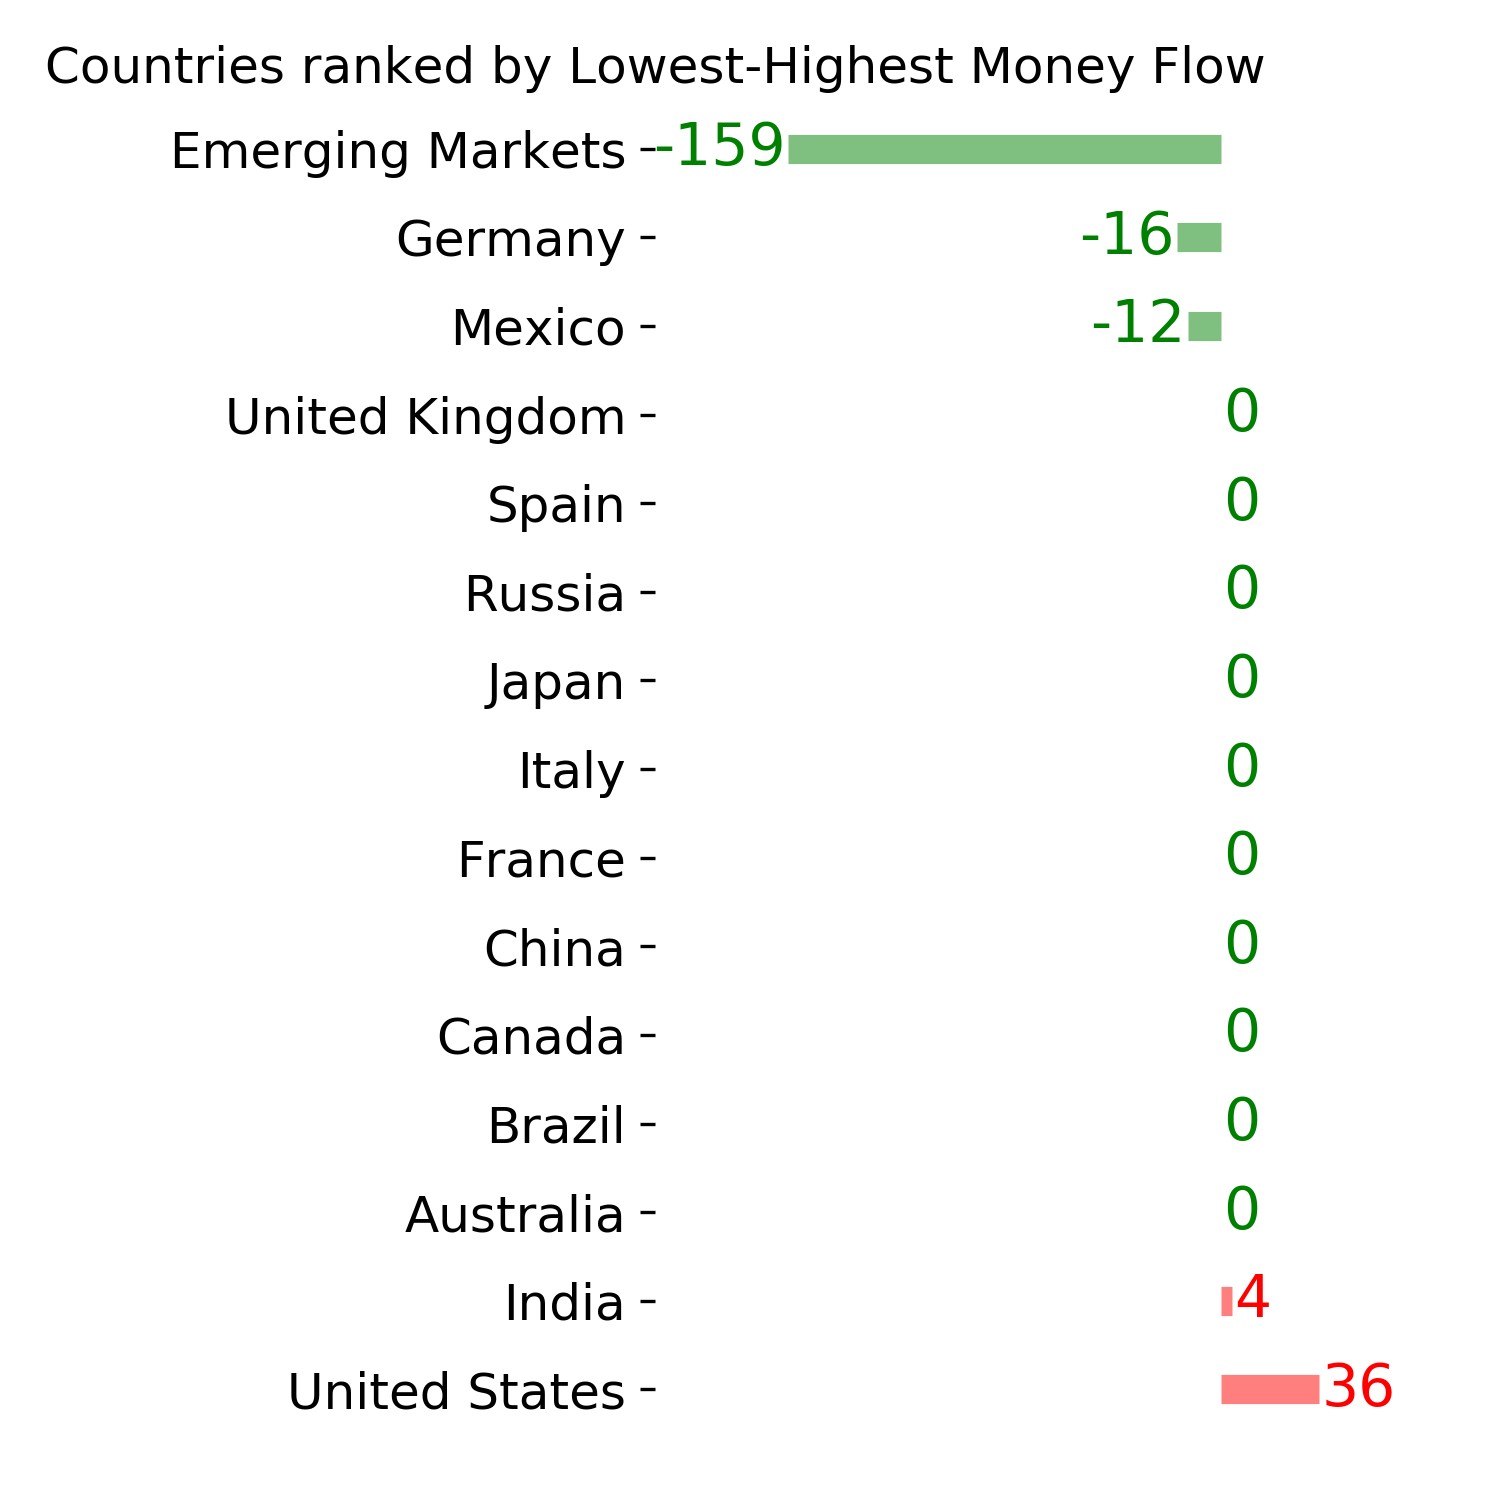
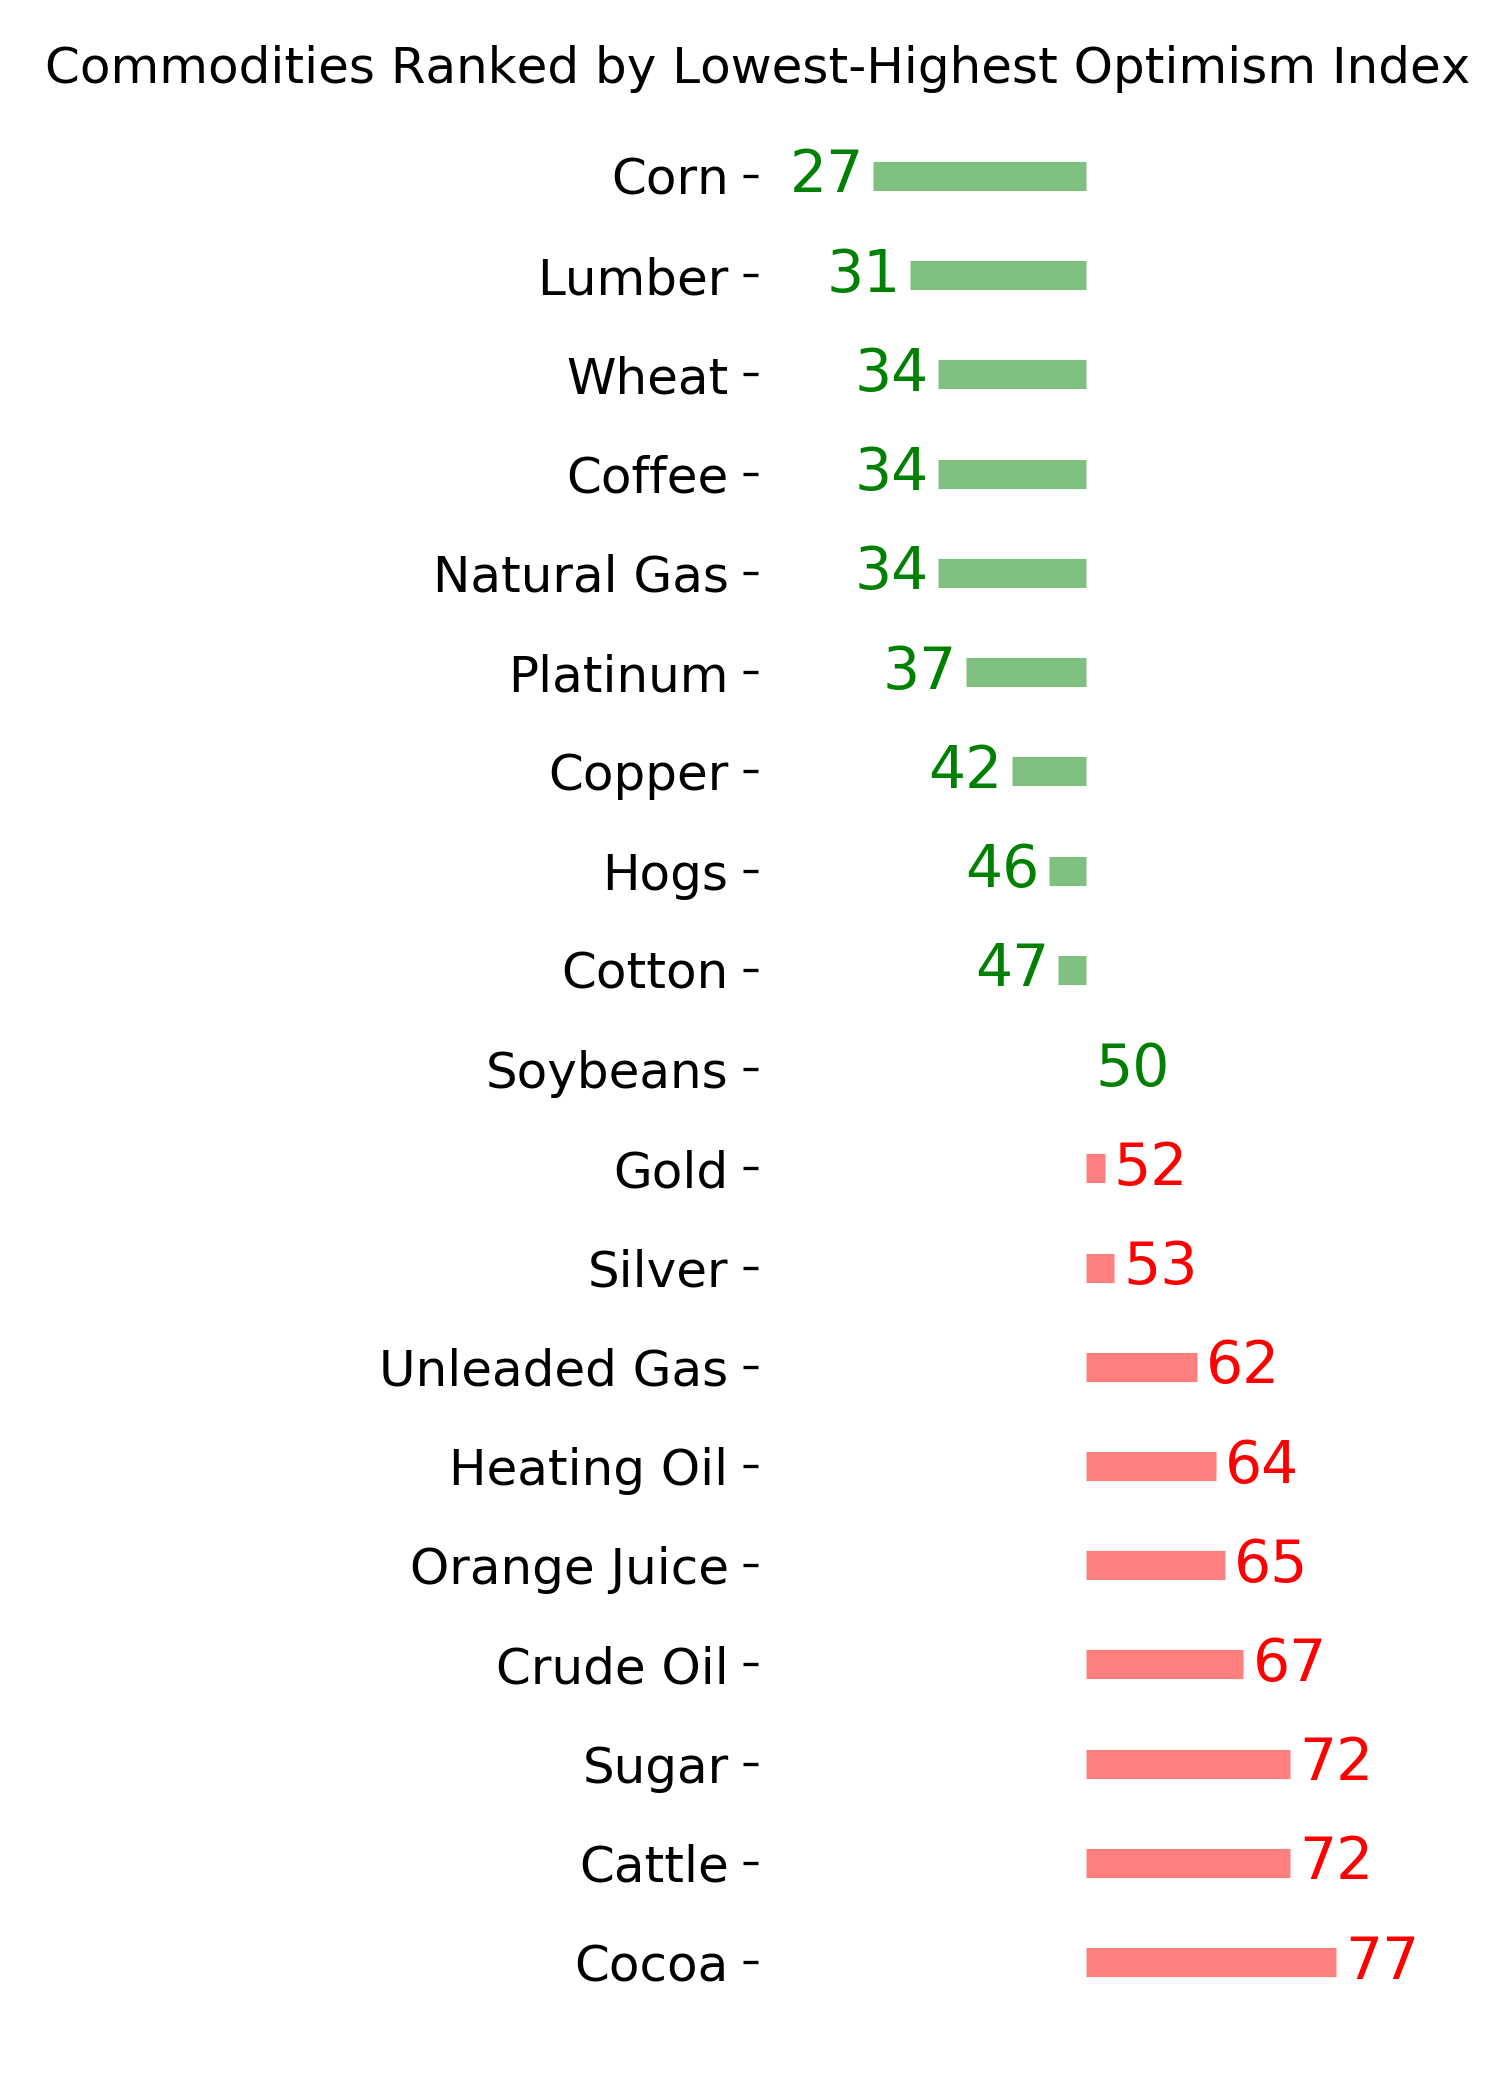
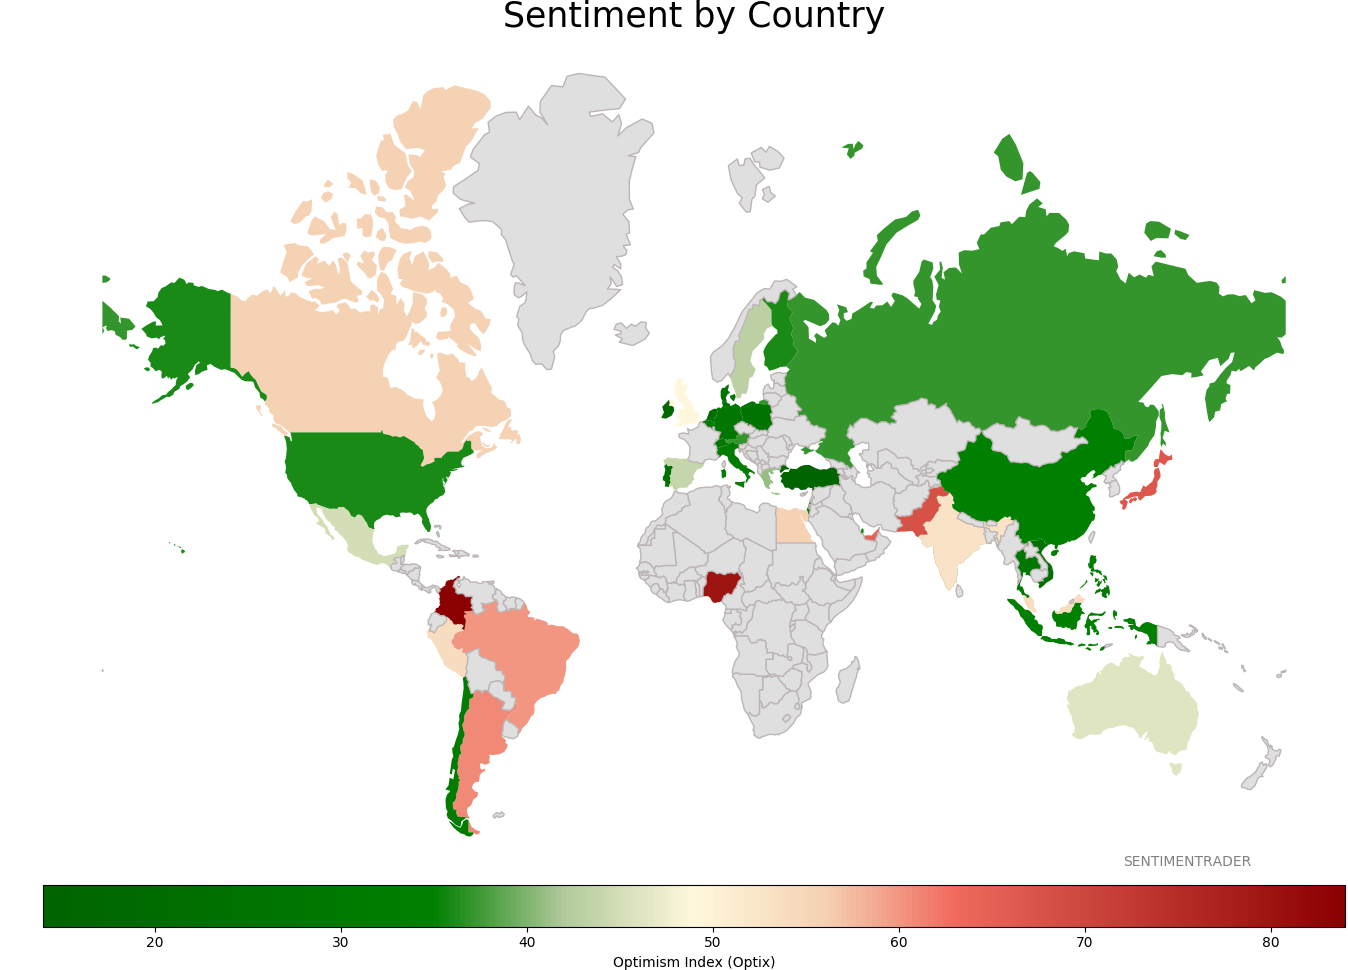
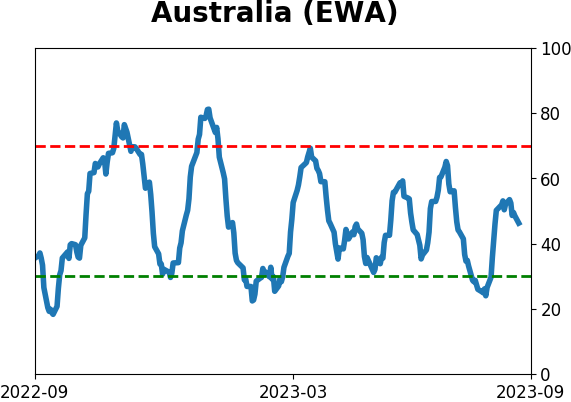
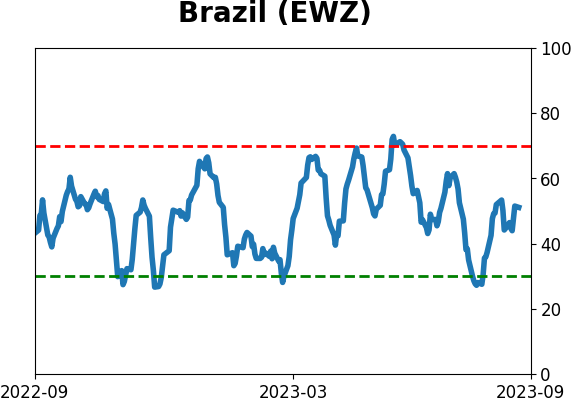
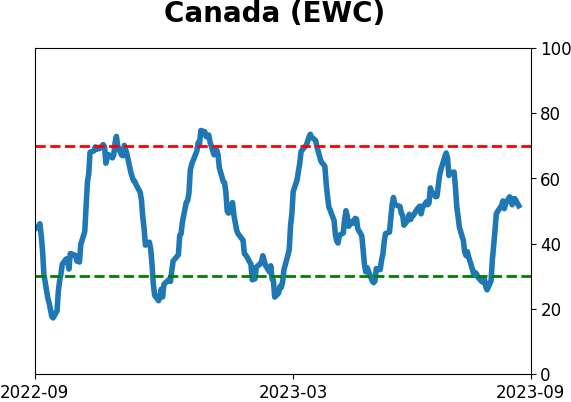
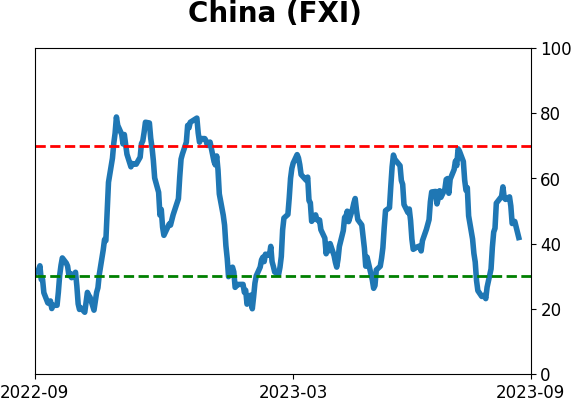
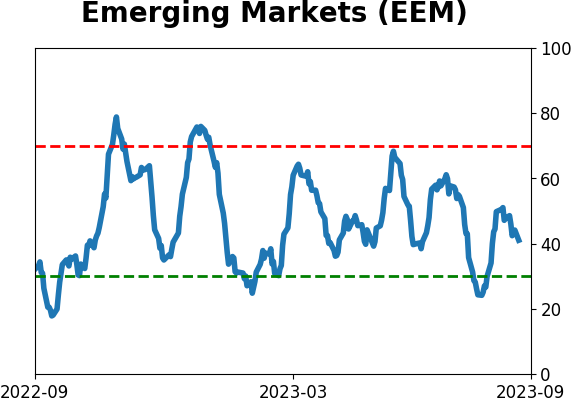
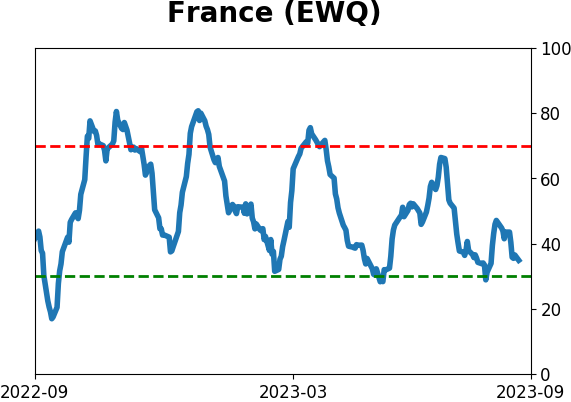
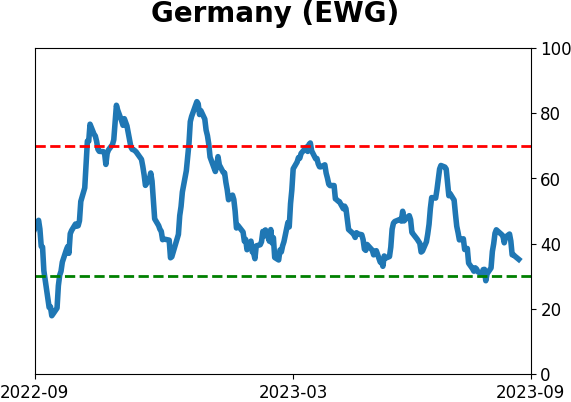
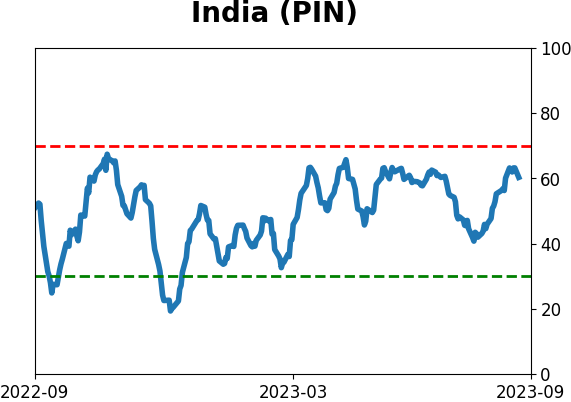
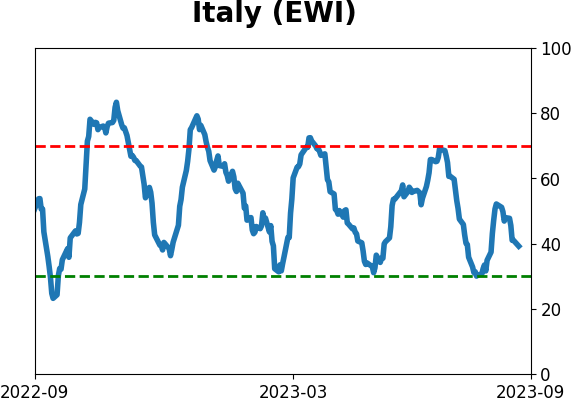
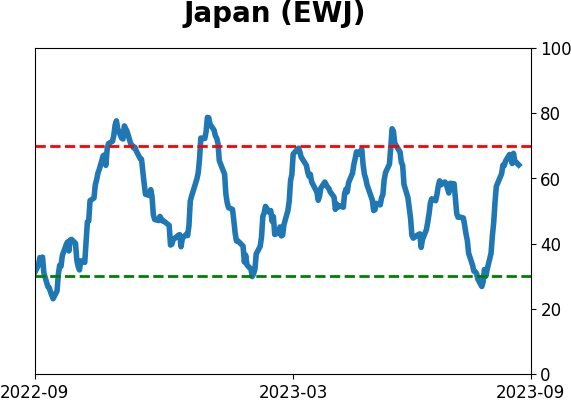
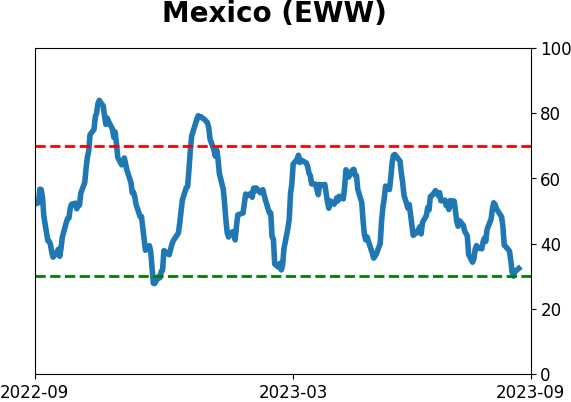
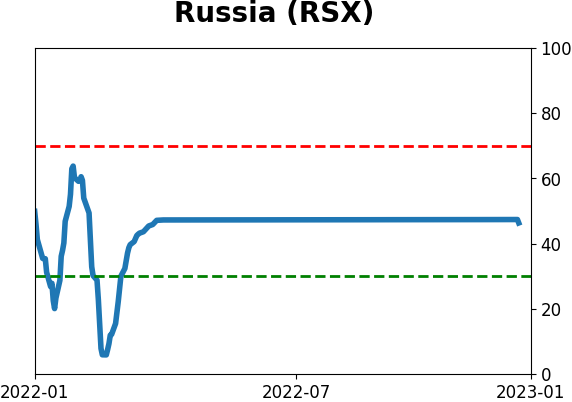
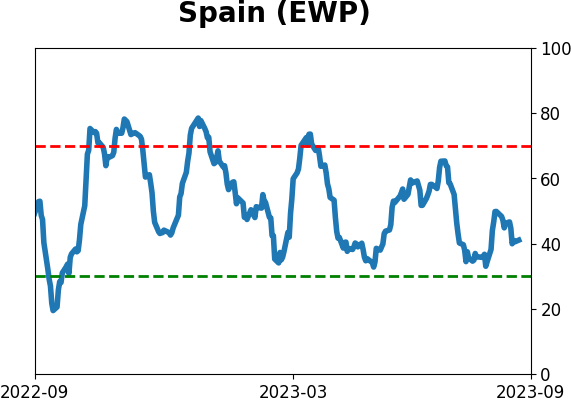
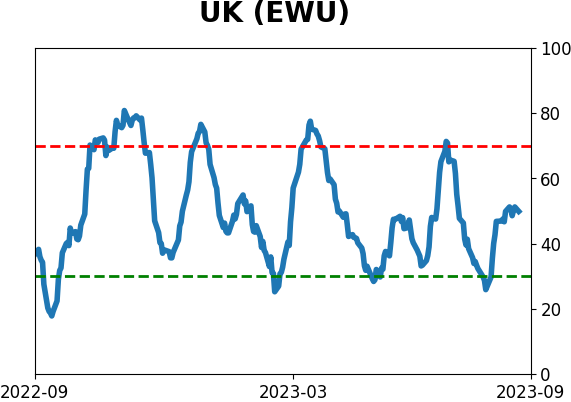
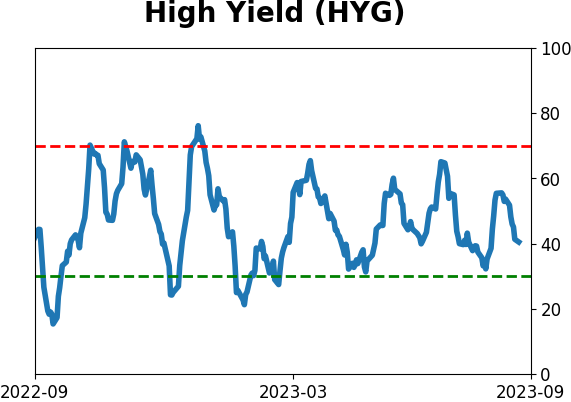
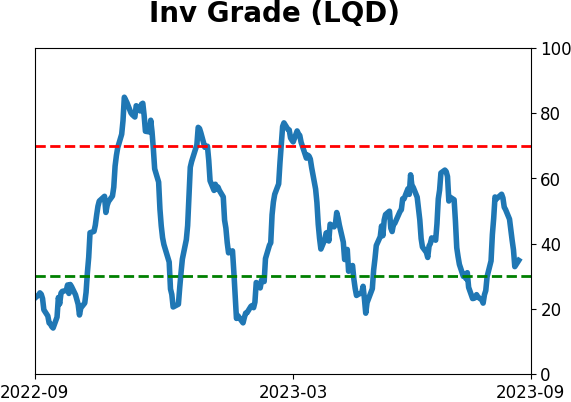
Sentiment Around The World
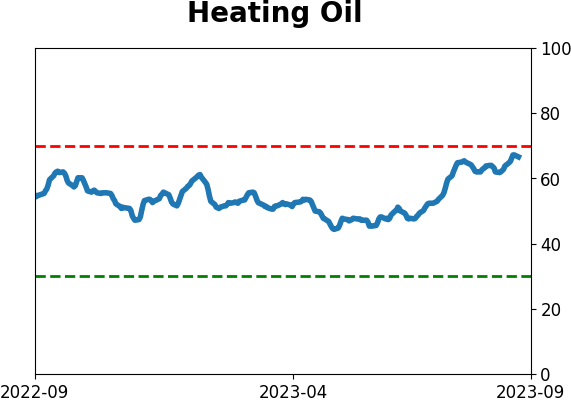
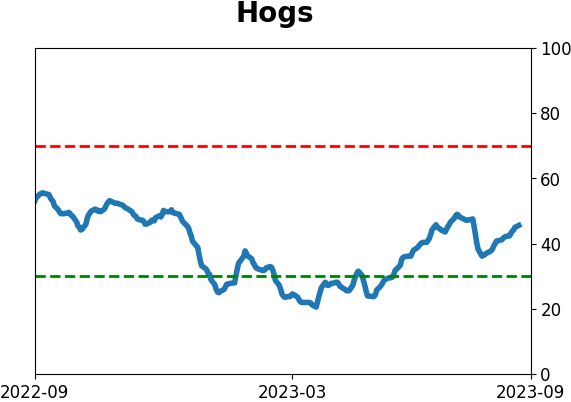
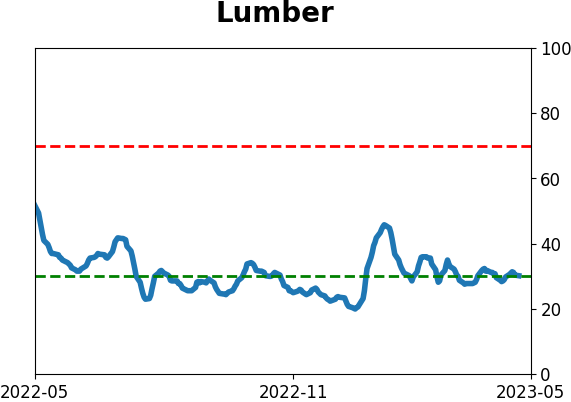
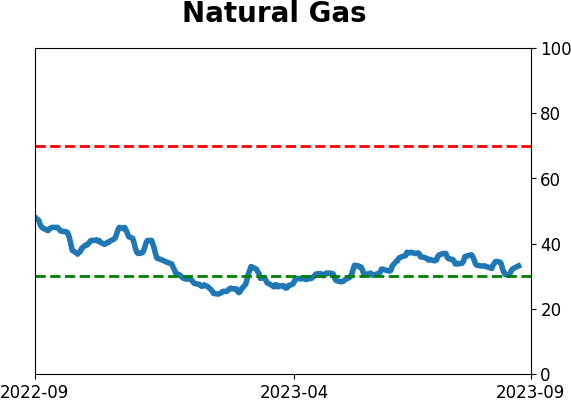
Optimism Index Thumbnails
|
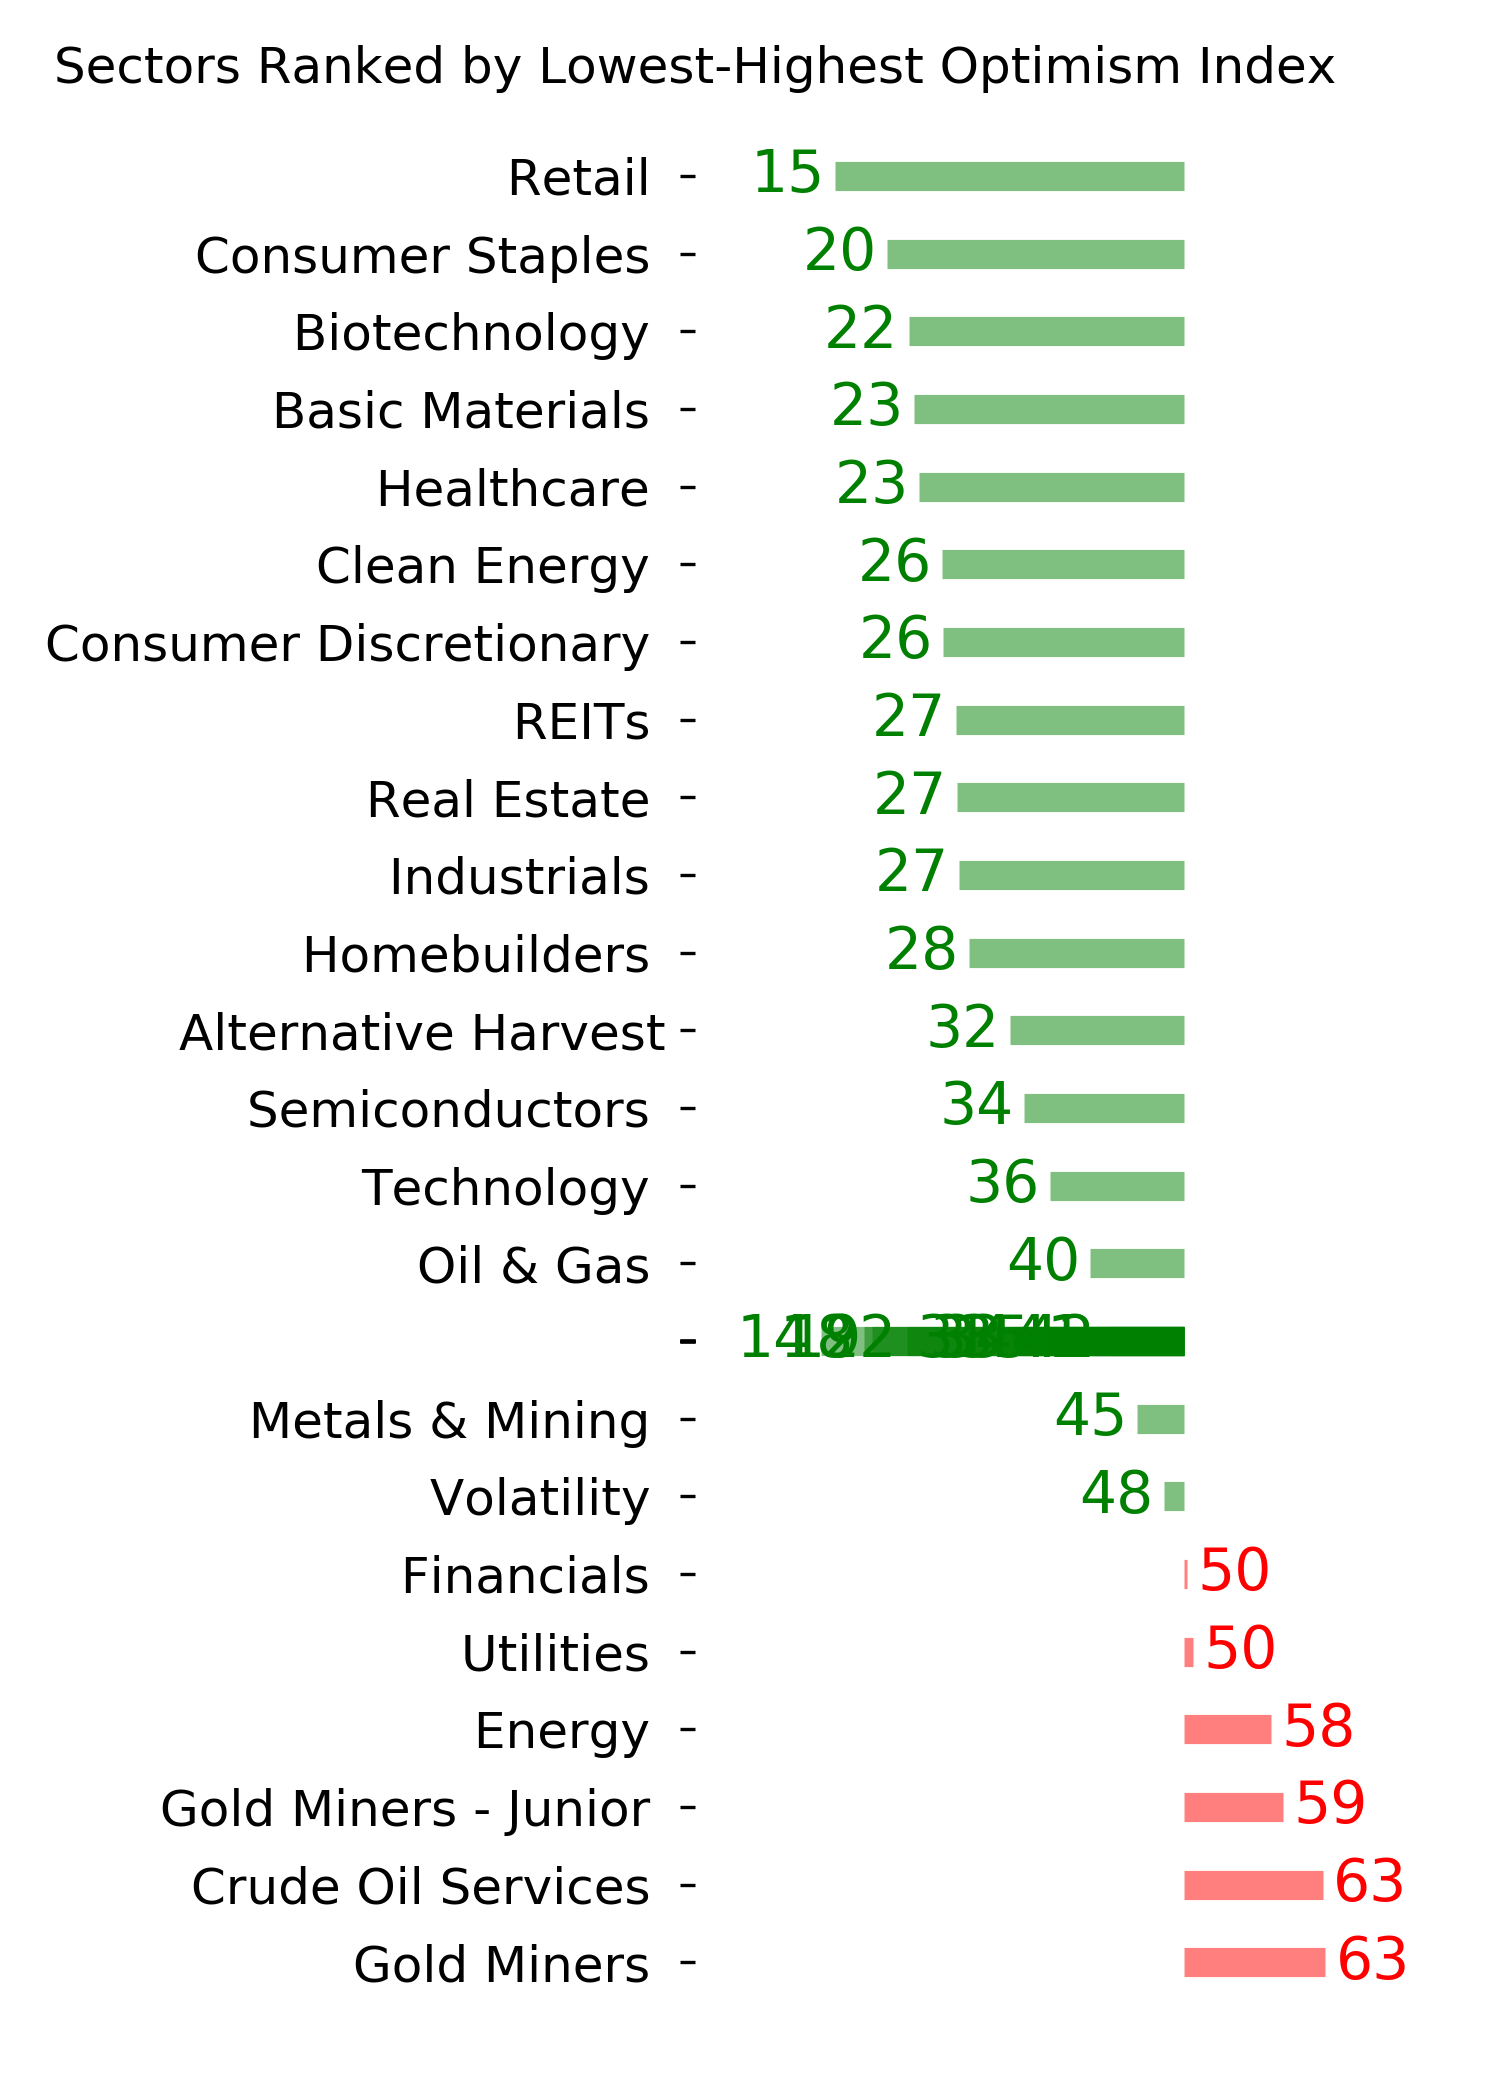
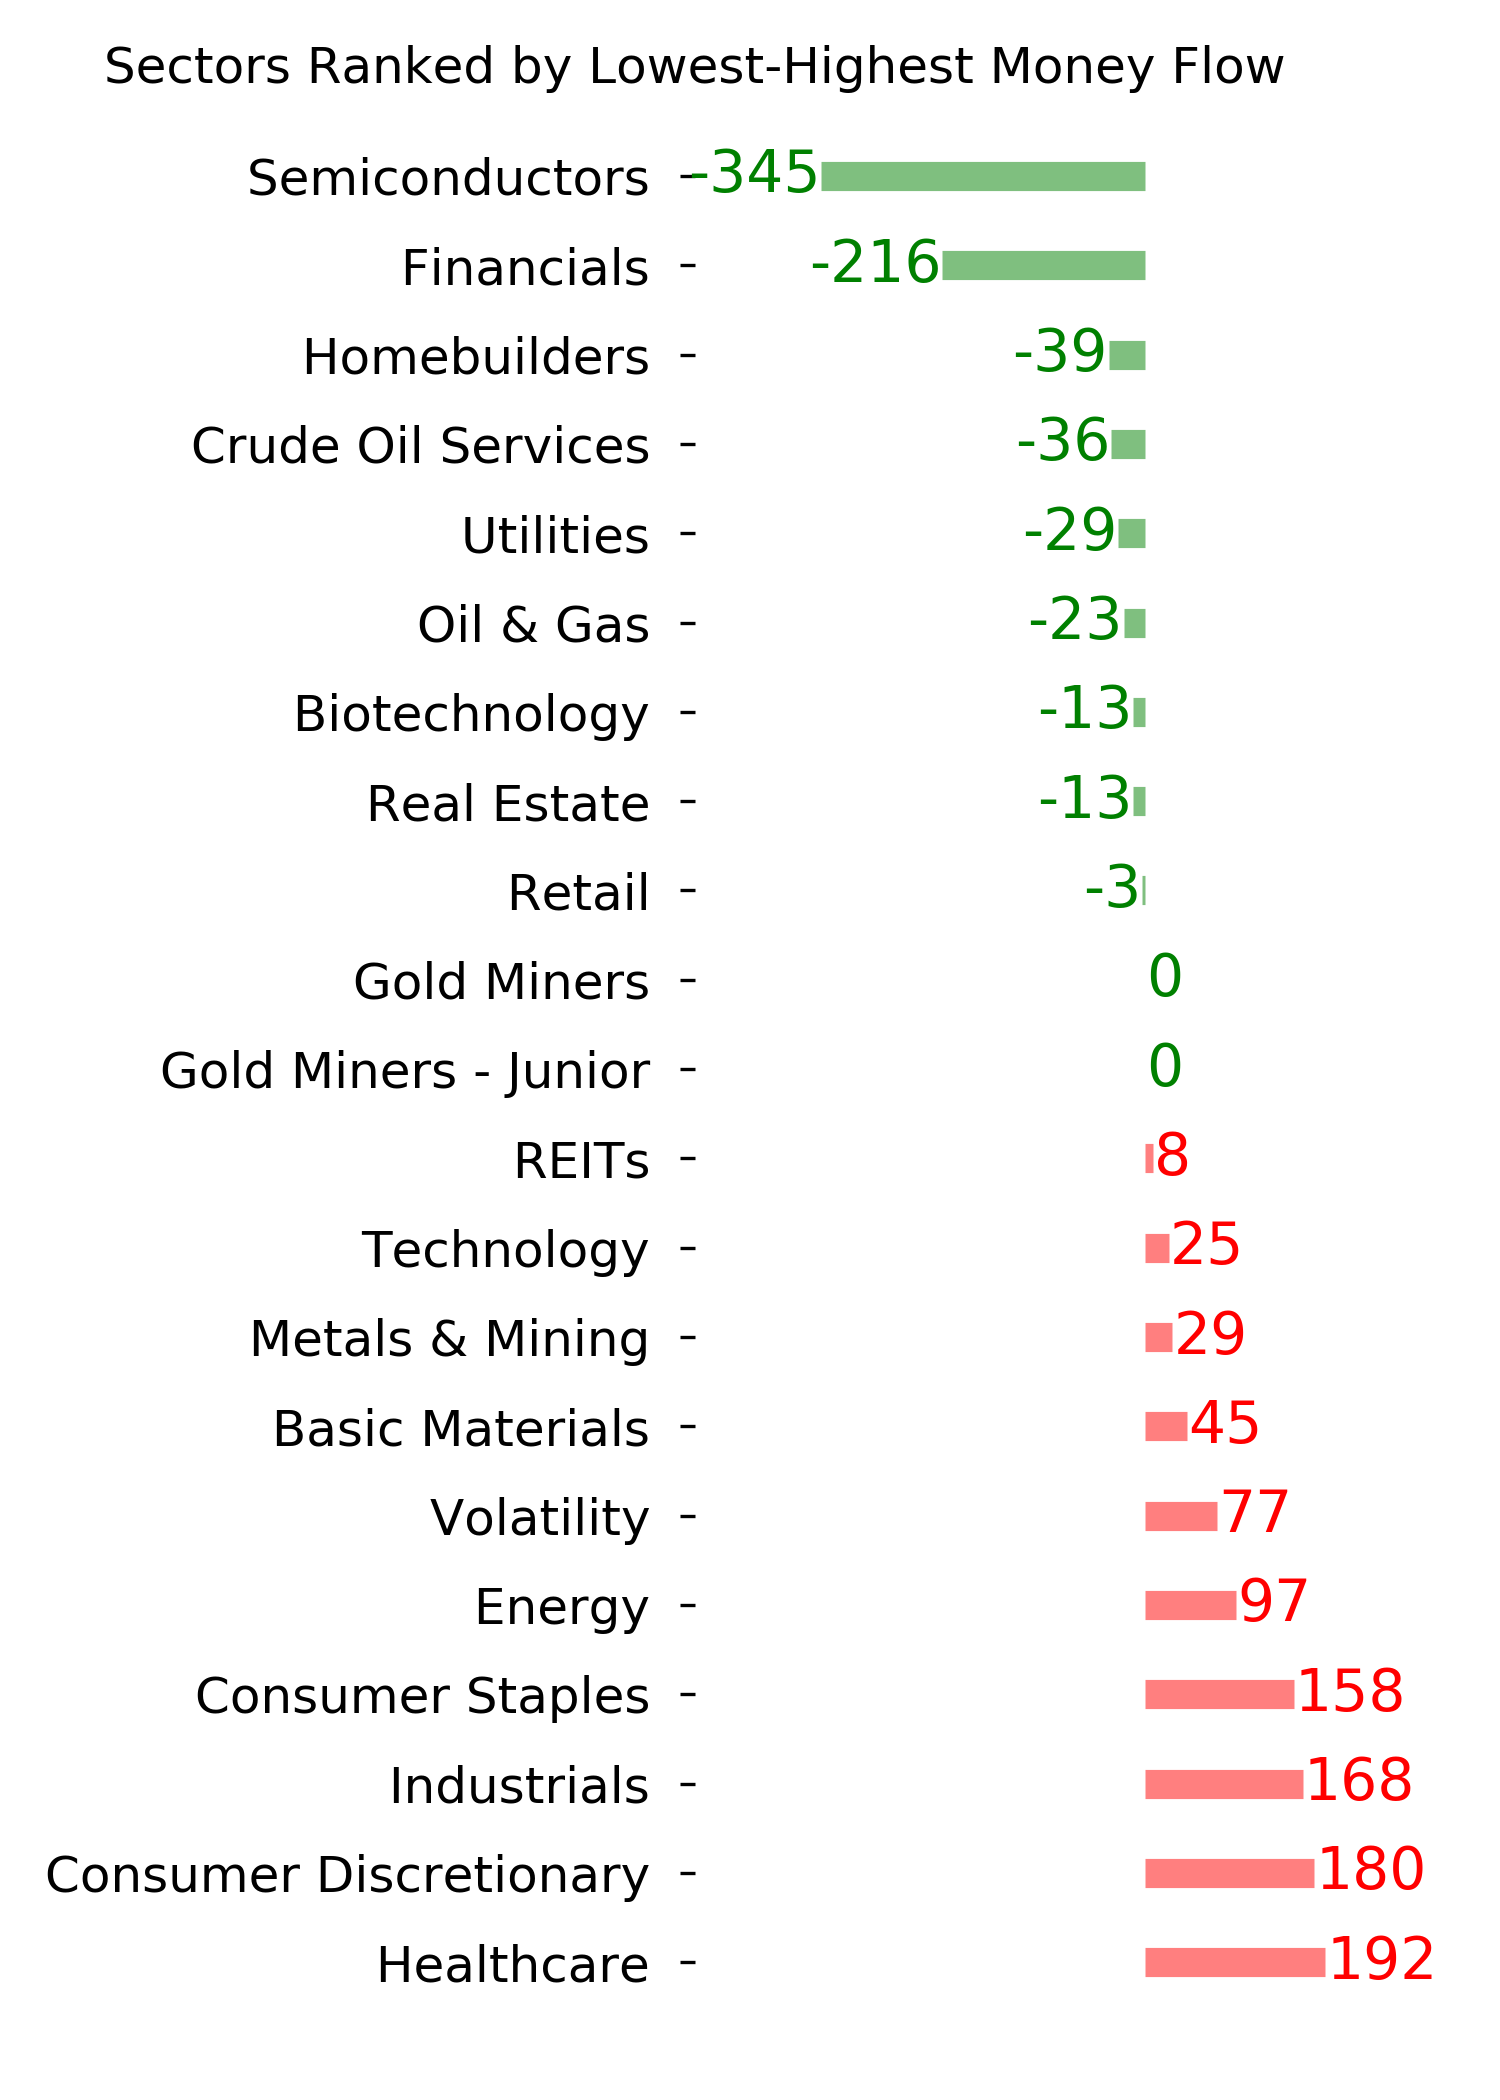
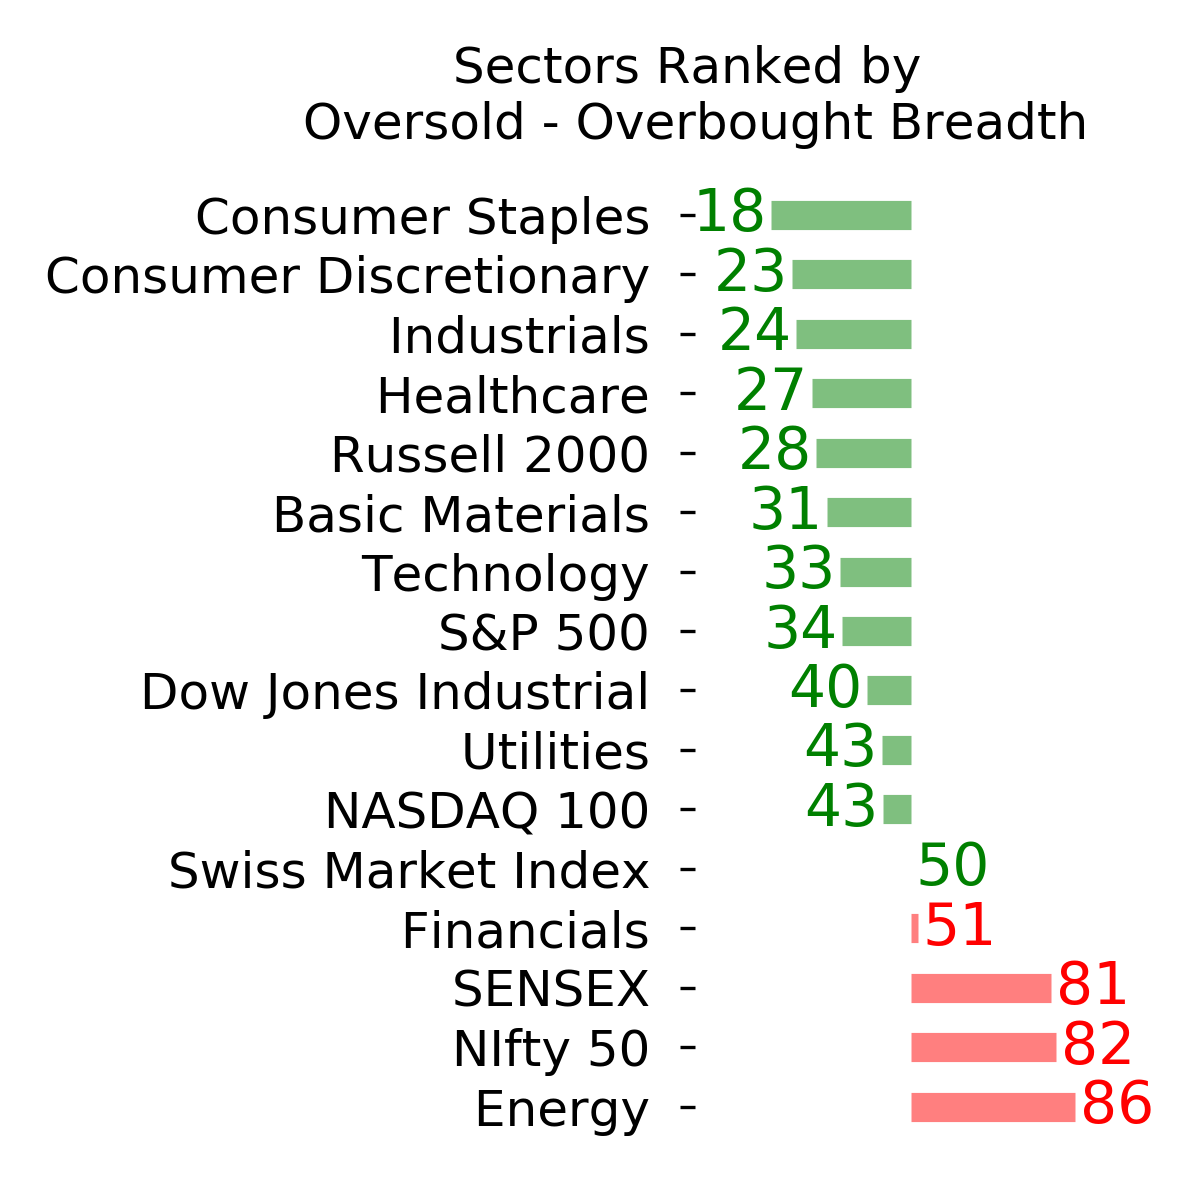
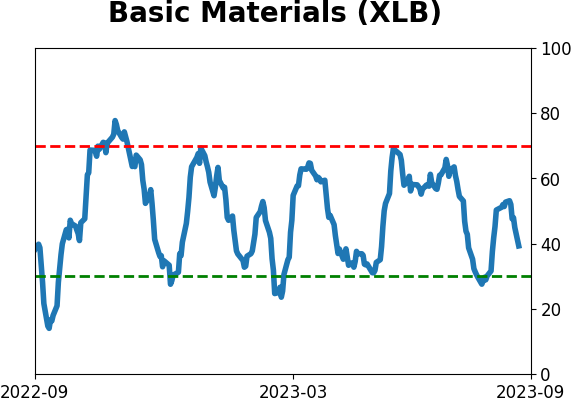
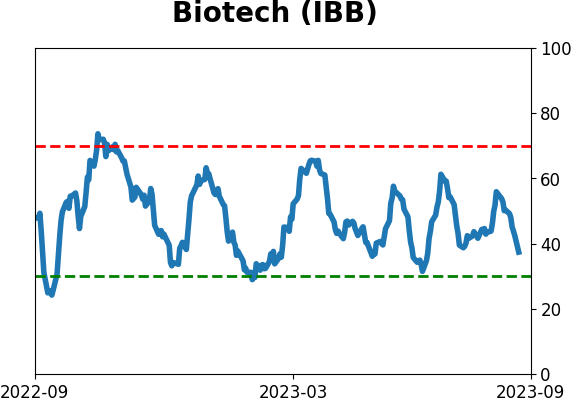
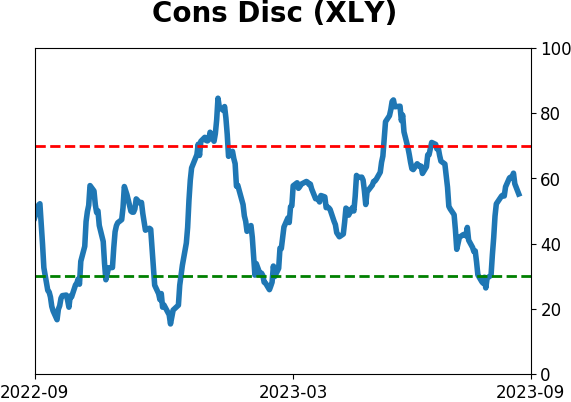
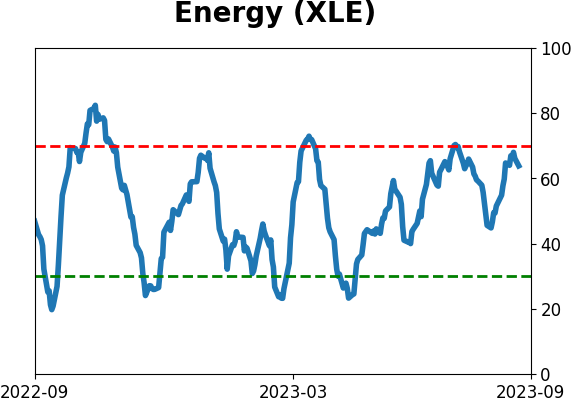
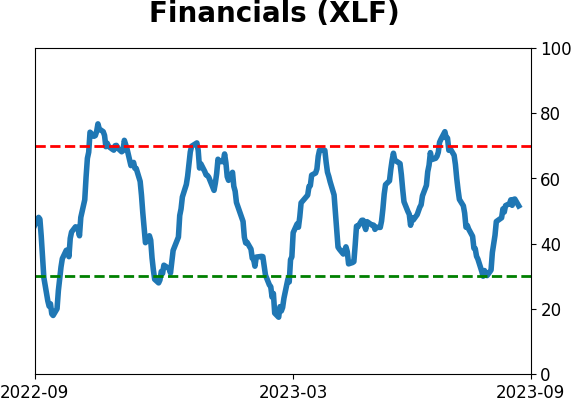
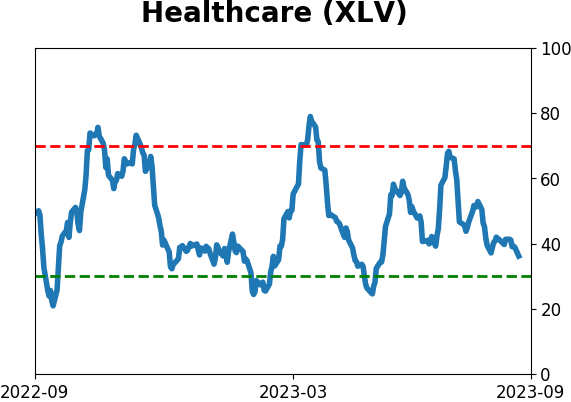
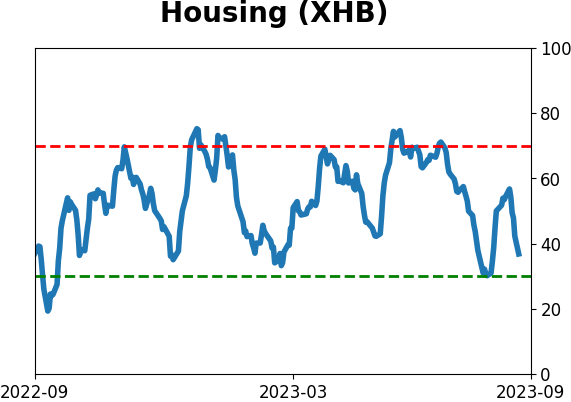
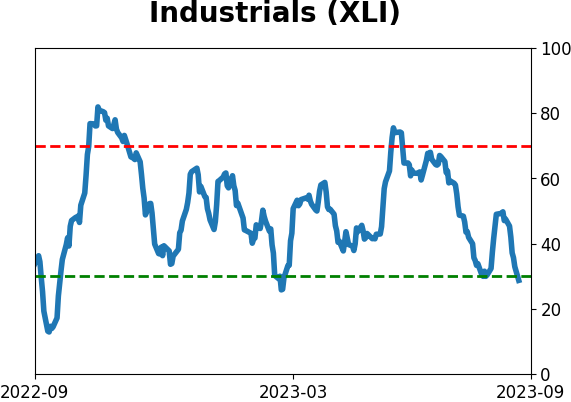
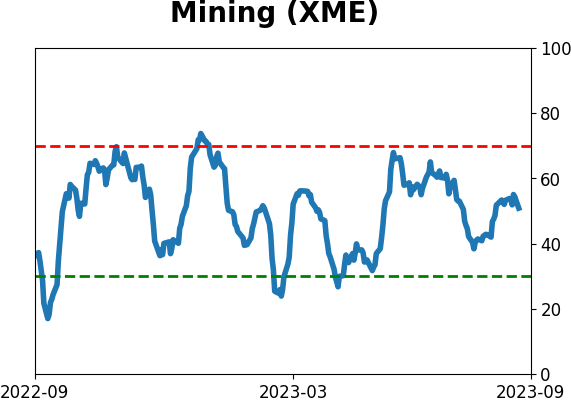
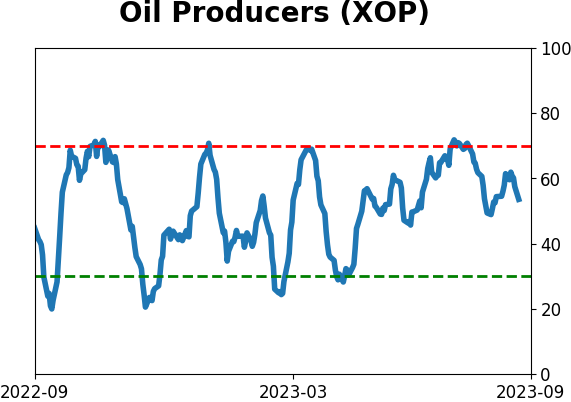
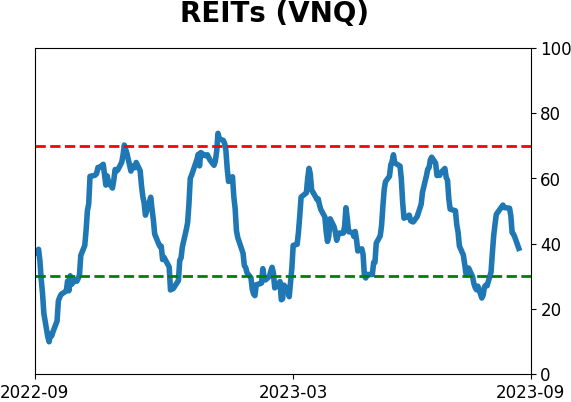
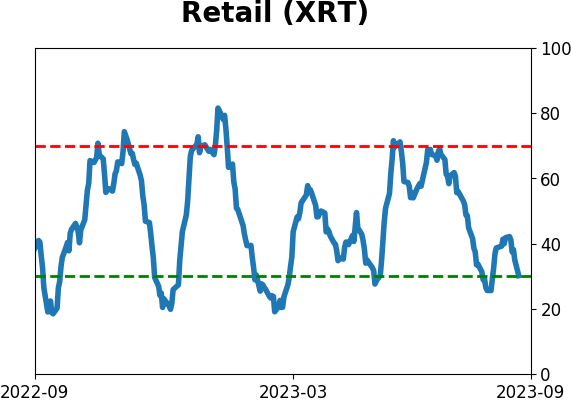
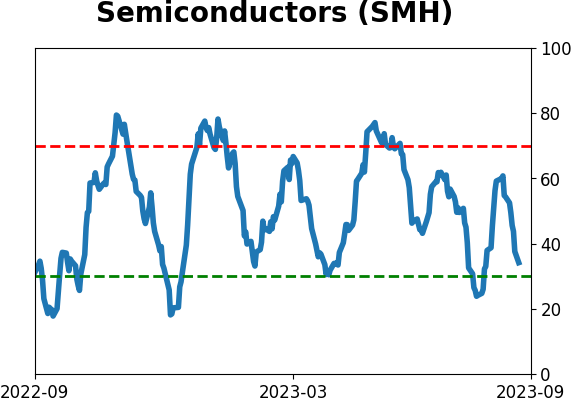
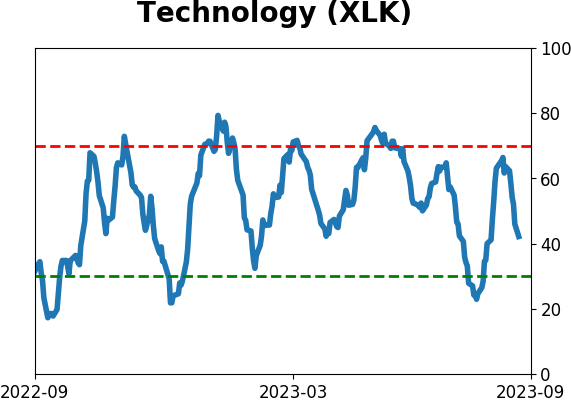
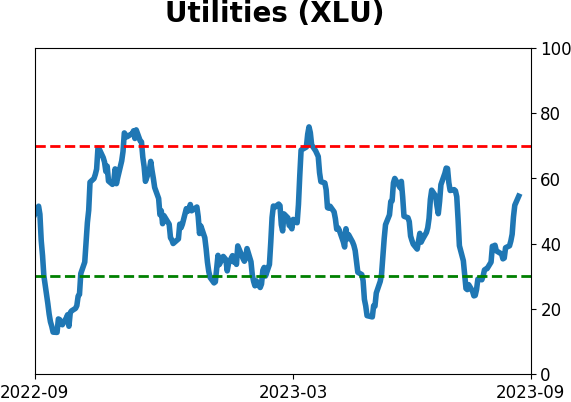
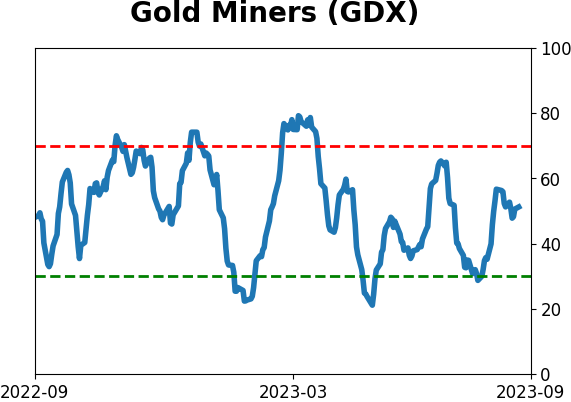
Sector ETF's - 10-Day Moving Average
|
|
|
Country ETF's - 10-Day Moving Average
|
|
|
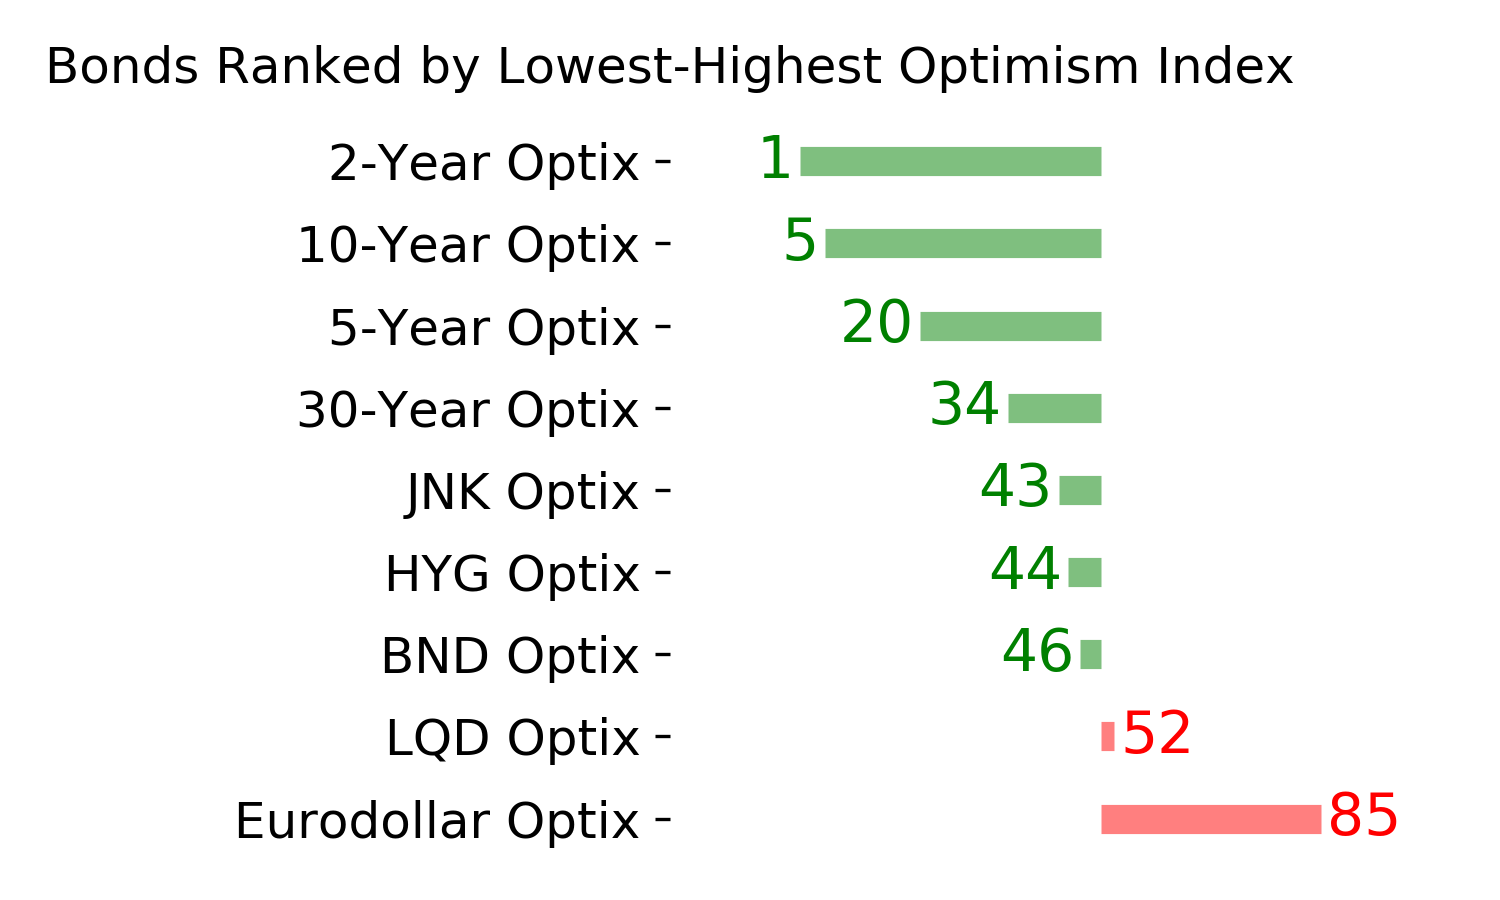
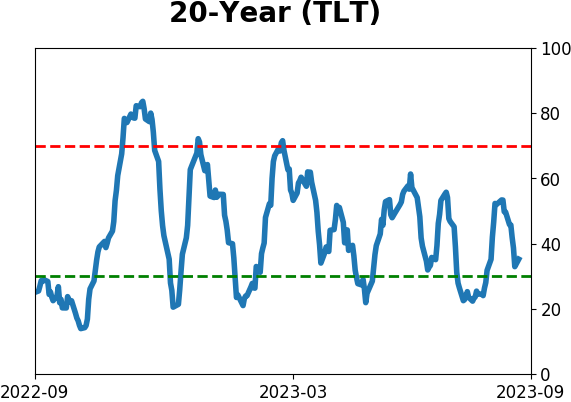
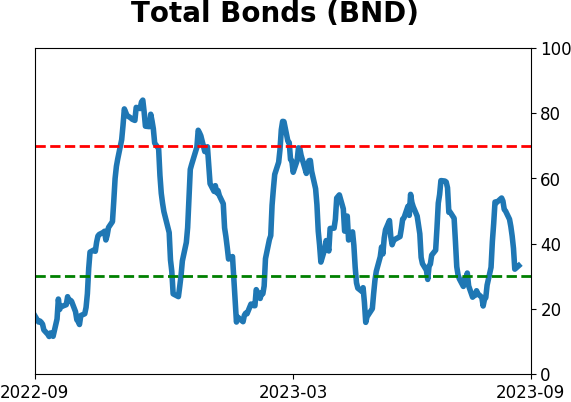
Bond ETF's - 10-Day Moving Average
|
|
|
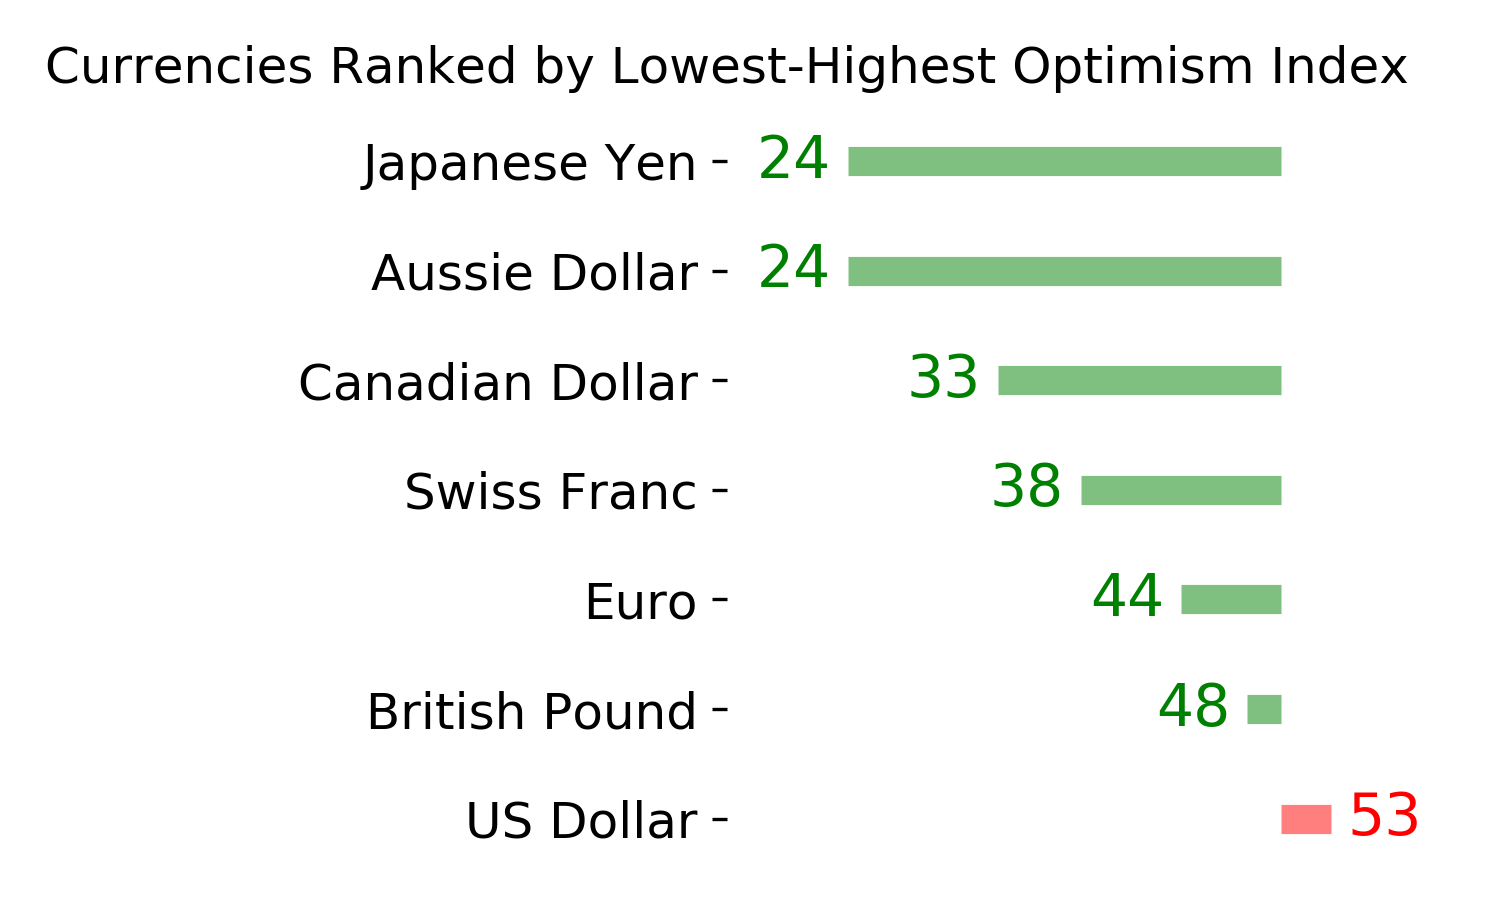
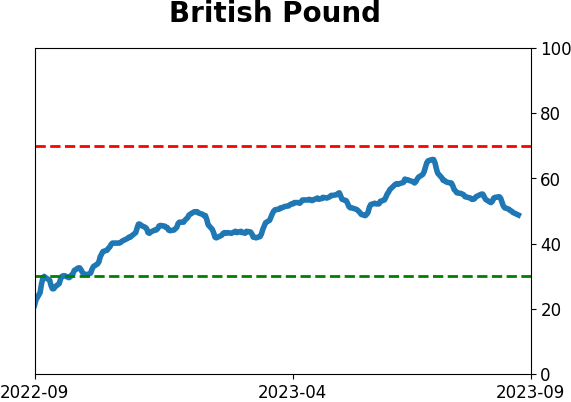
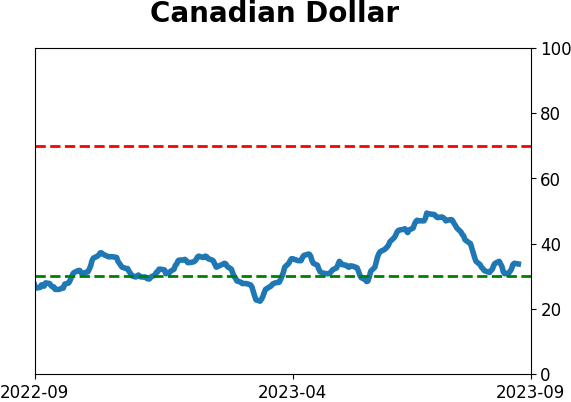
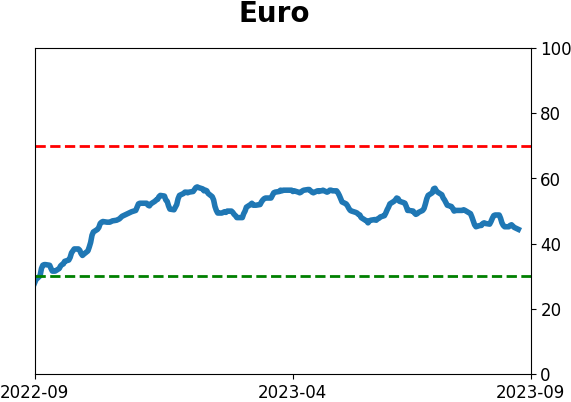
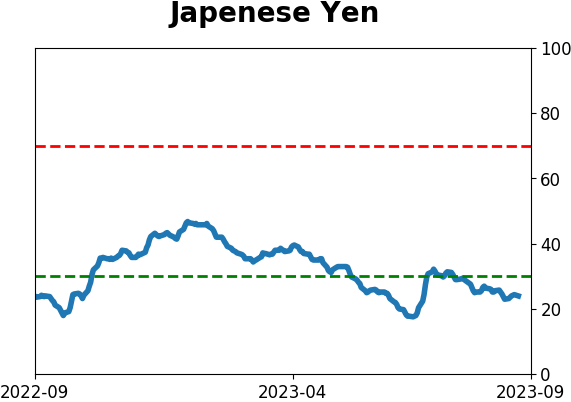
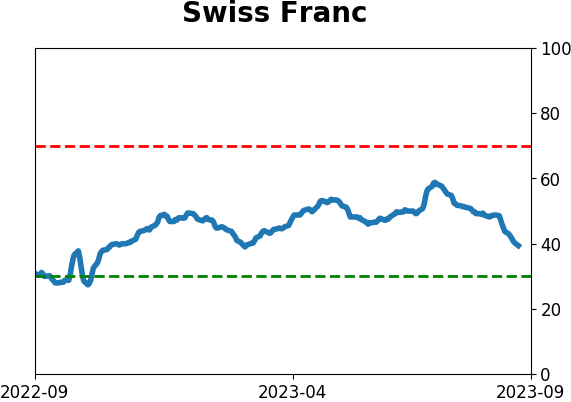
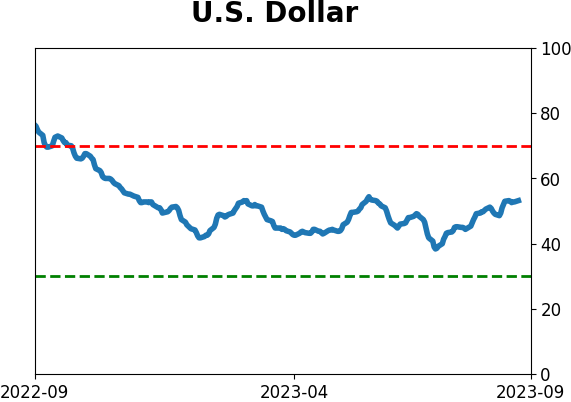
Currency ETF's - 5-Day Moving Average
|
|
|
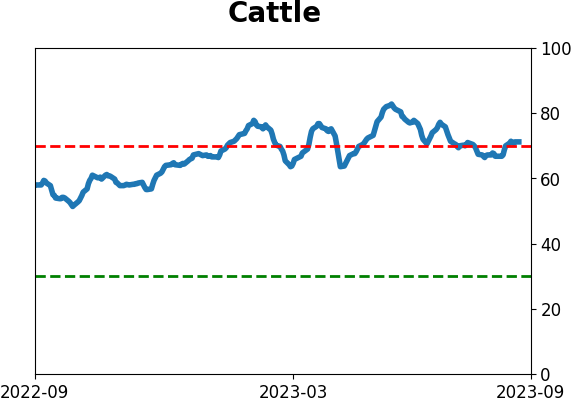
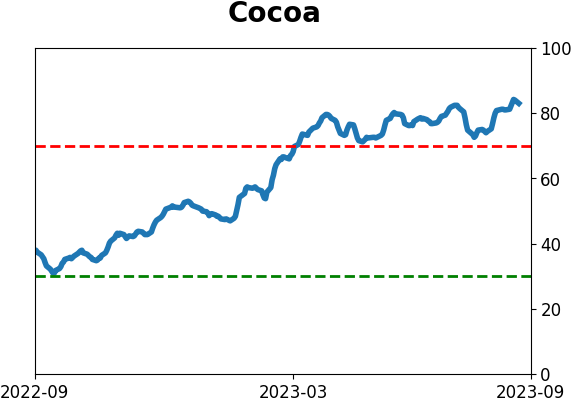
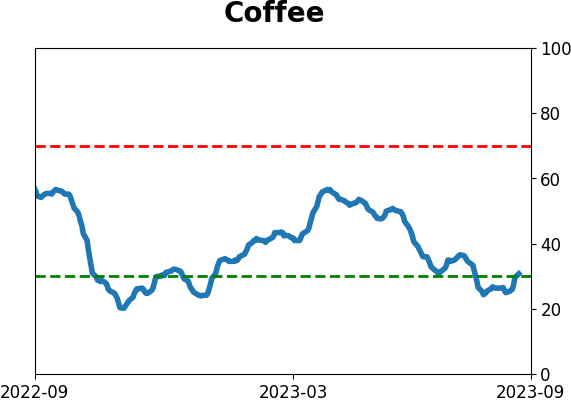
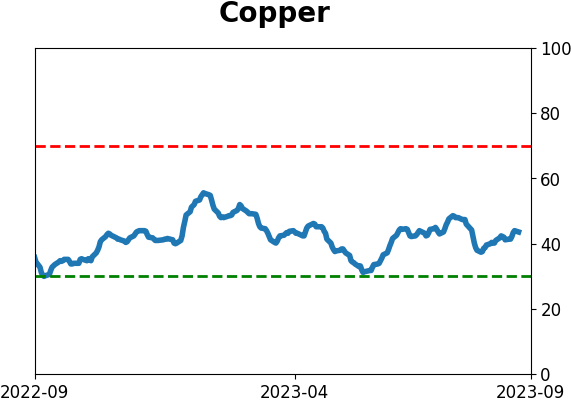
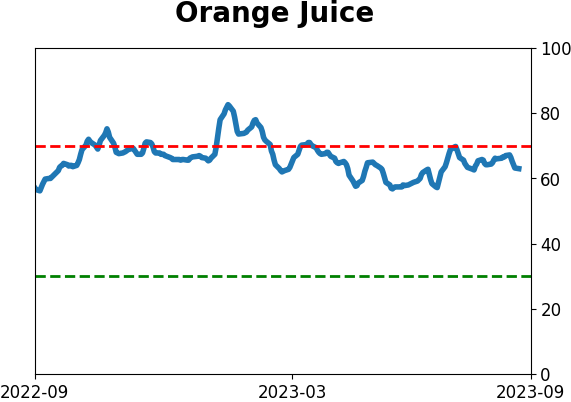
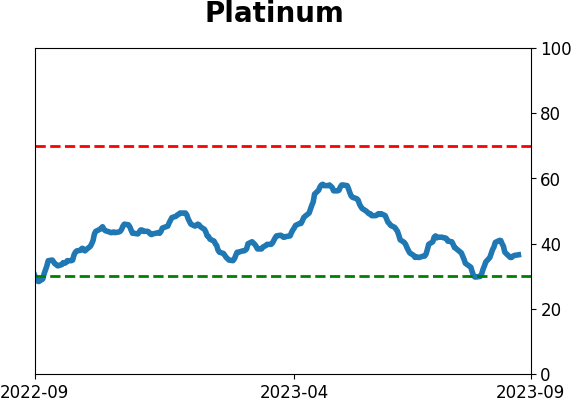
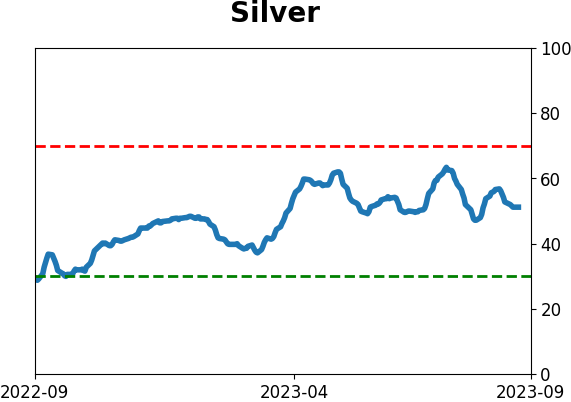
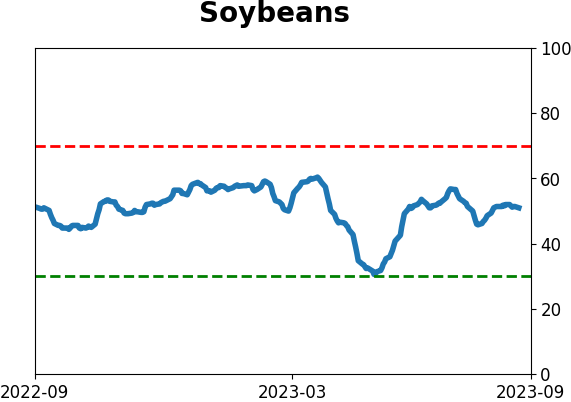
Commodity ETF's - 5-Day Moving Average
|
|