Daily Report : Weekly reversals tend to lead to FOMO

| View/Print a PDF version of this Report |
Headlines
|
Weekly reversals tend to lead to FOMO: FOMO is a real phenomenon, and it looks likely to trigger investors soon. The S&P 500, Nasdaq Composite, and Russell 2000 all reversed large weekly losses while trading near 52-week highs. When the indices behaved like this, investors showed a consistent tendency to bid prices higher in the months ahead. |
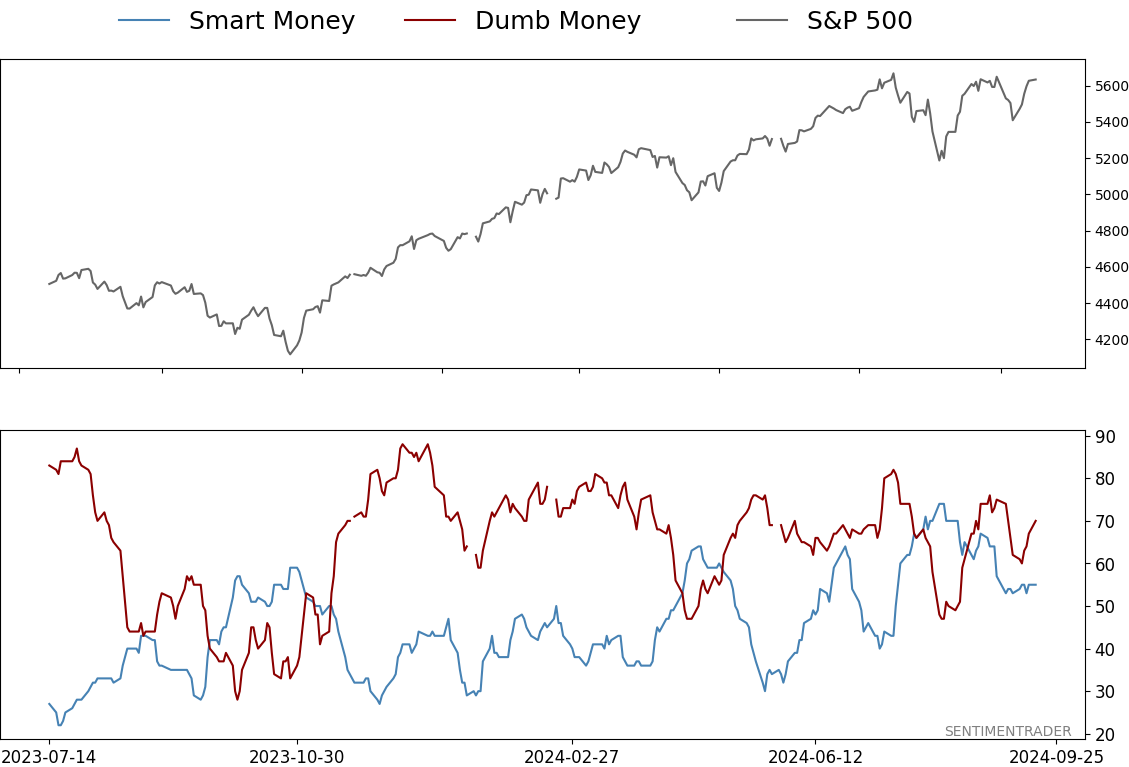
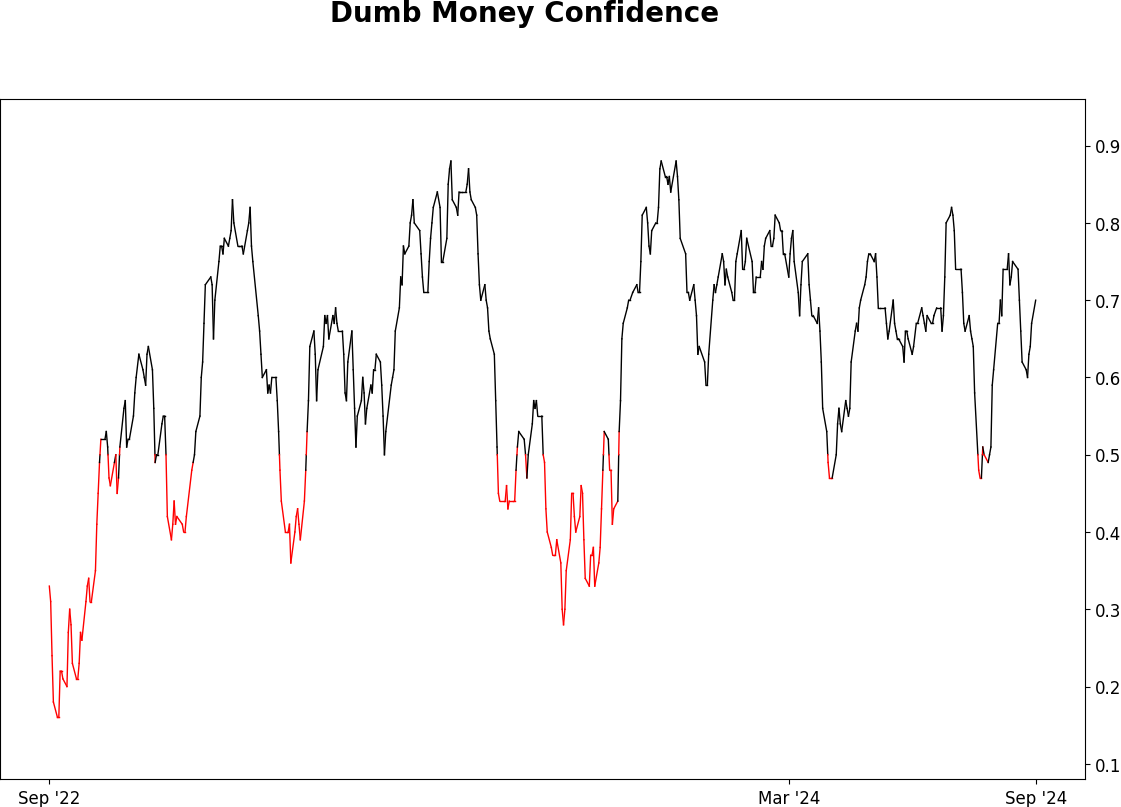
Smart / Dumb Money Confidence
|
|
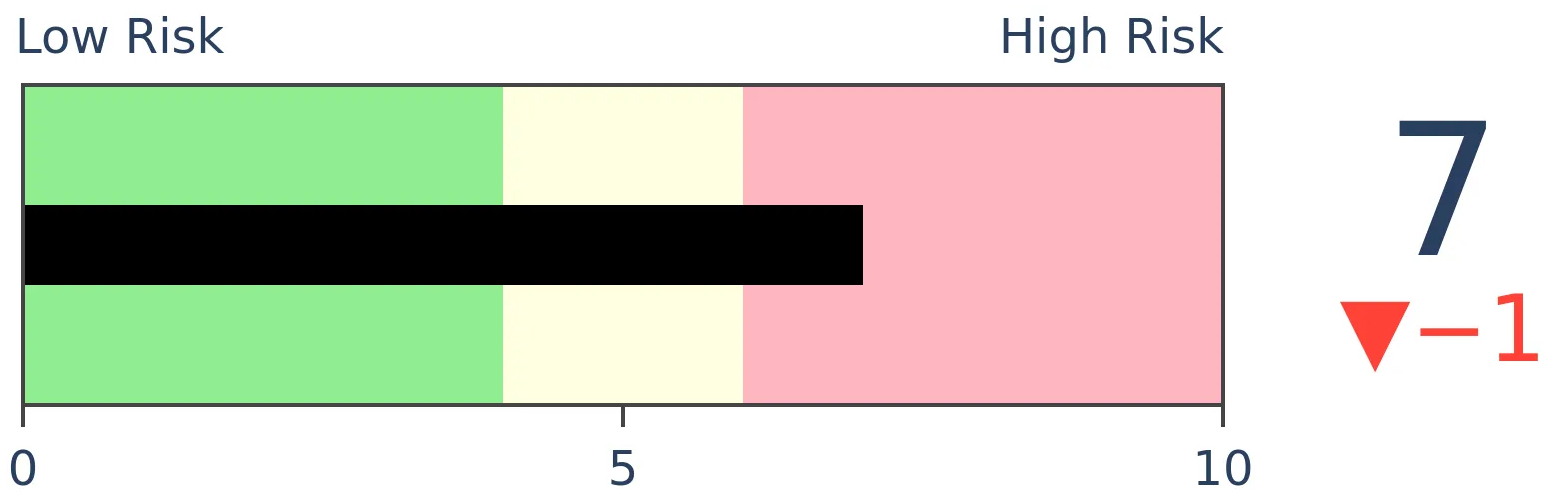
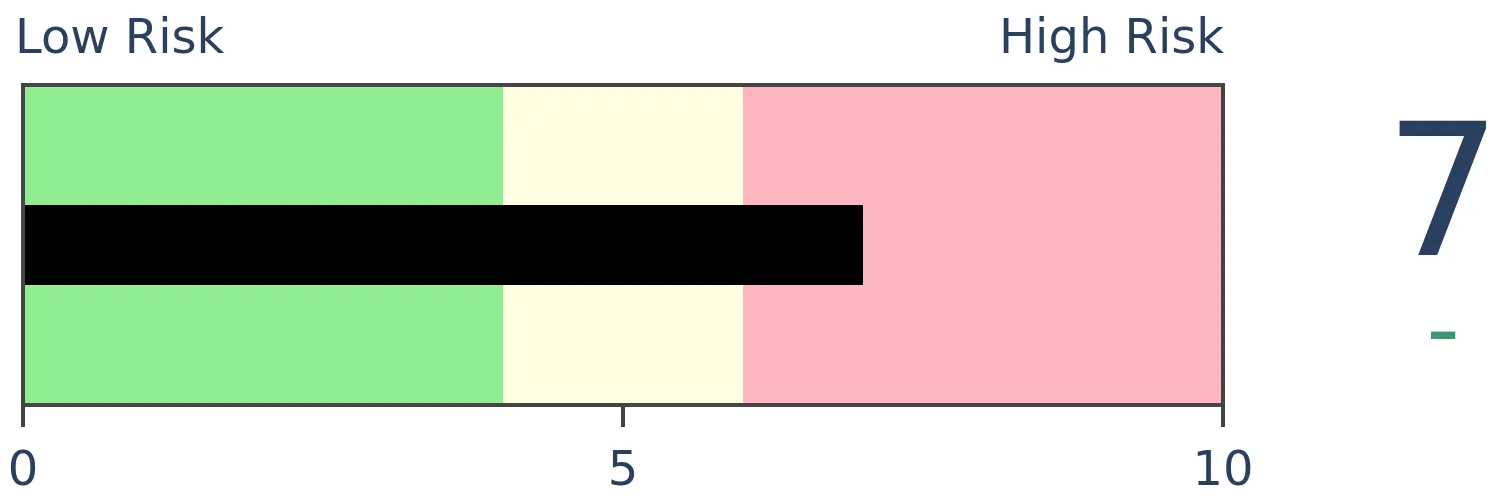
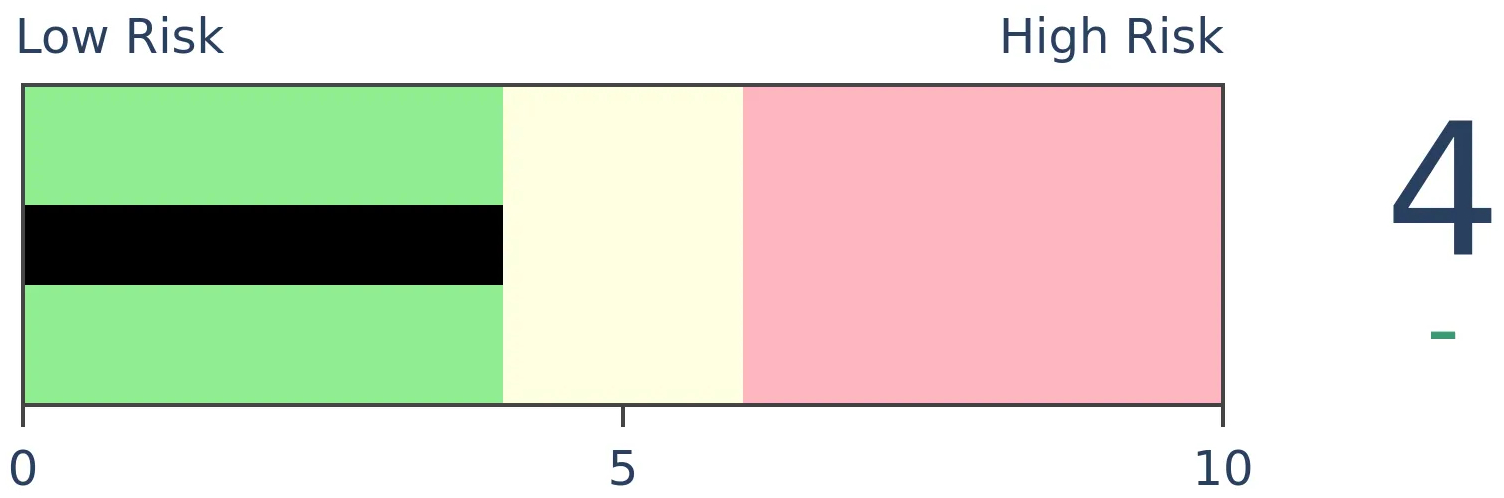
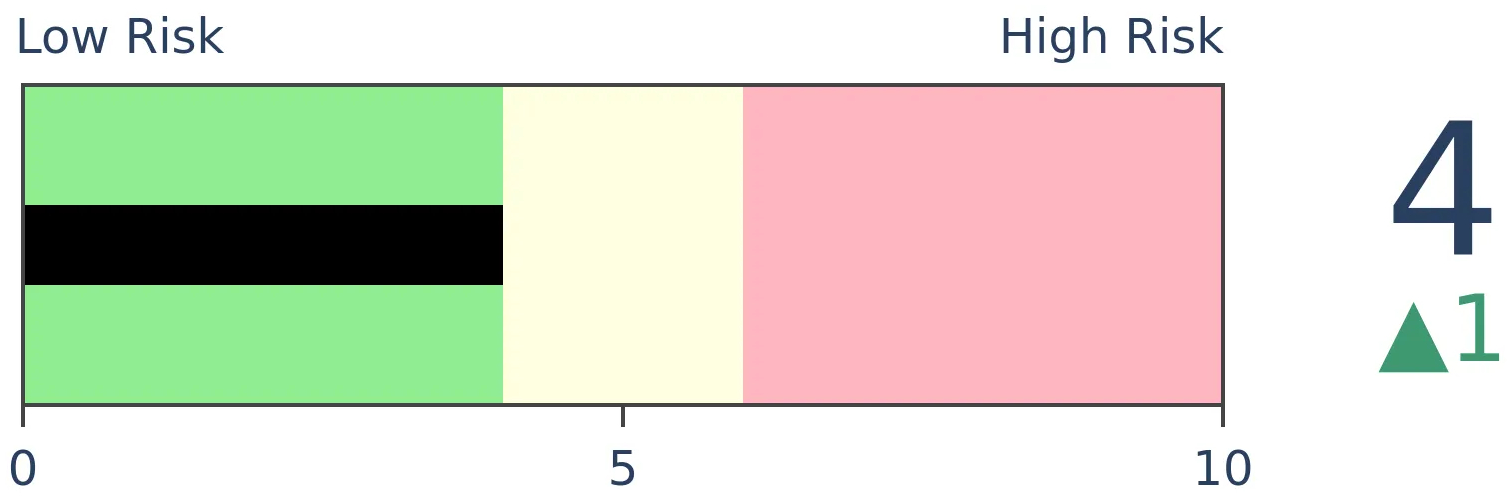
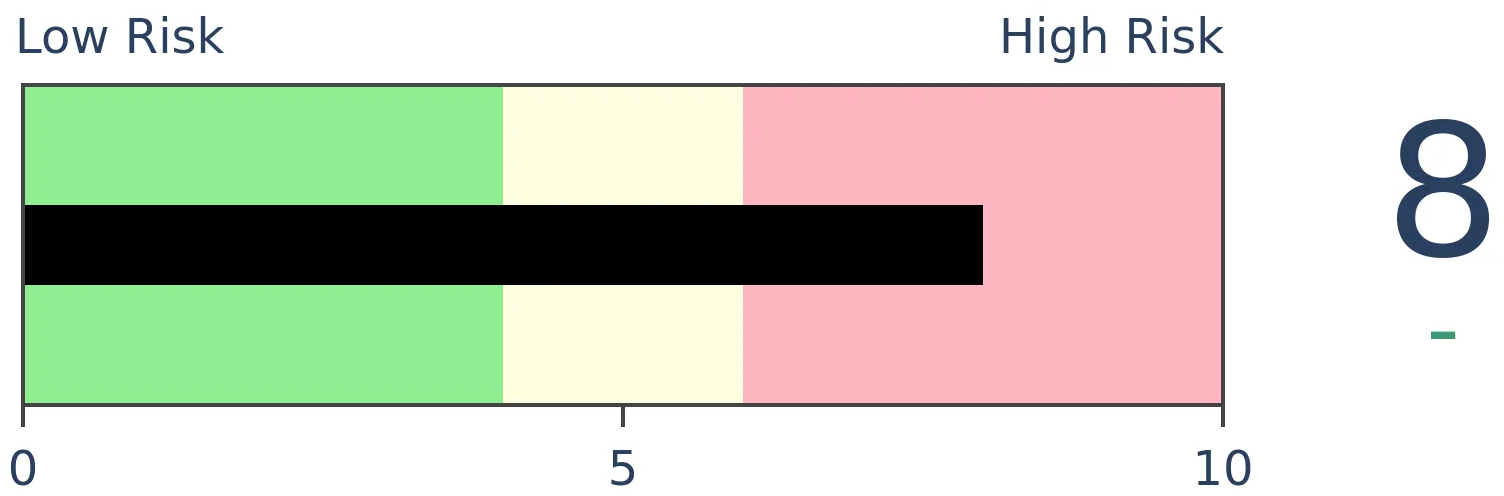
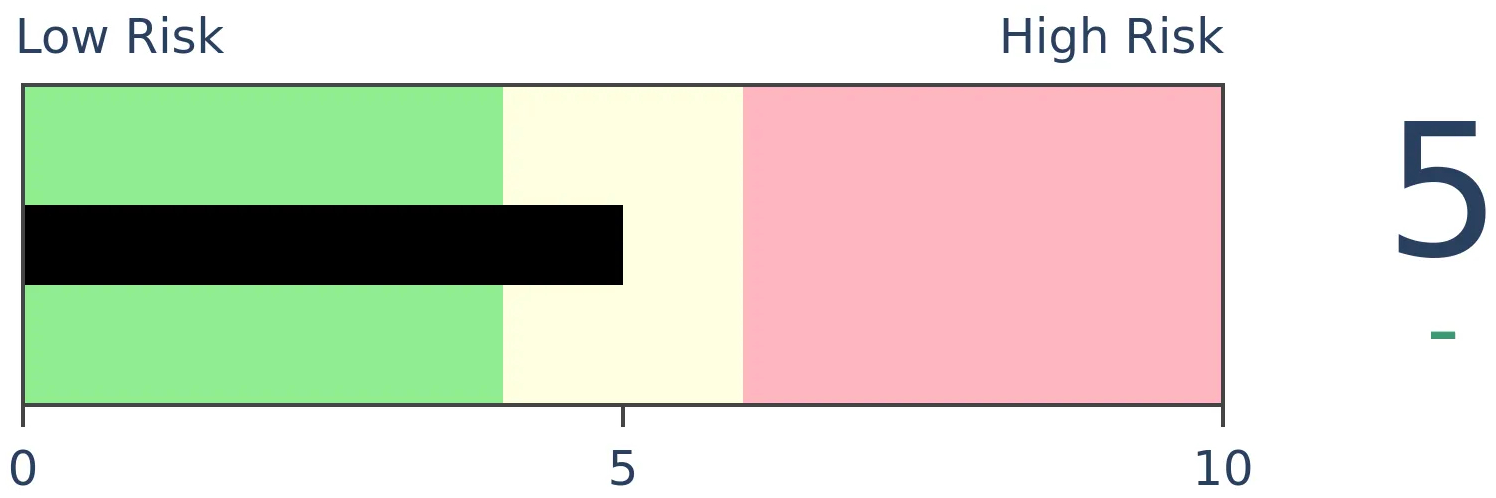
Risk Levels
|
|
|
Research
Weekly reversals tend to lead to FOMOBy Jason GoepfertBOTTOM LINEFOMO is a real phenomenon, and it looks likely to trigger investors soon. The S&P 500, Nasdaq Composite, and Russell 2000 all reversed large weekly losses while trading near 52-week highs. When the indices behaved like this, investors showed a consistent tendency to bid prices higher in the months ahead. FORECAST / TIMEFRAME |
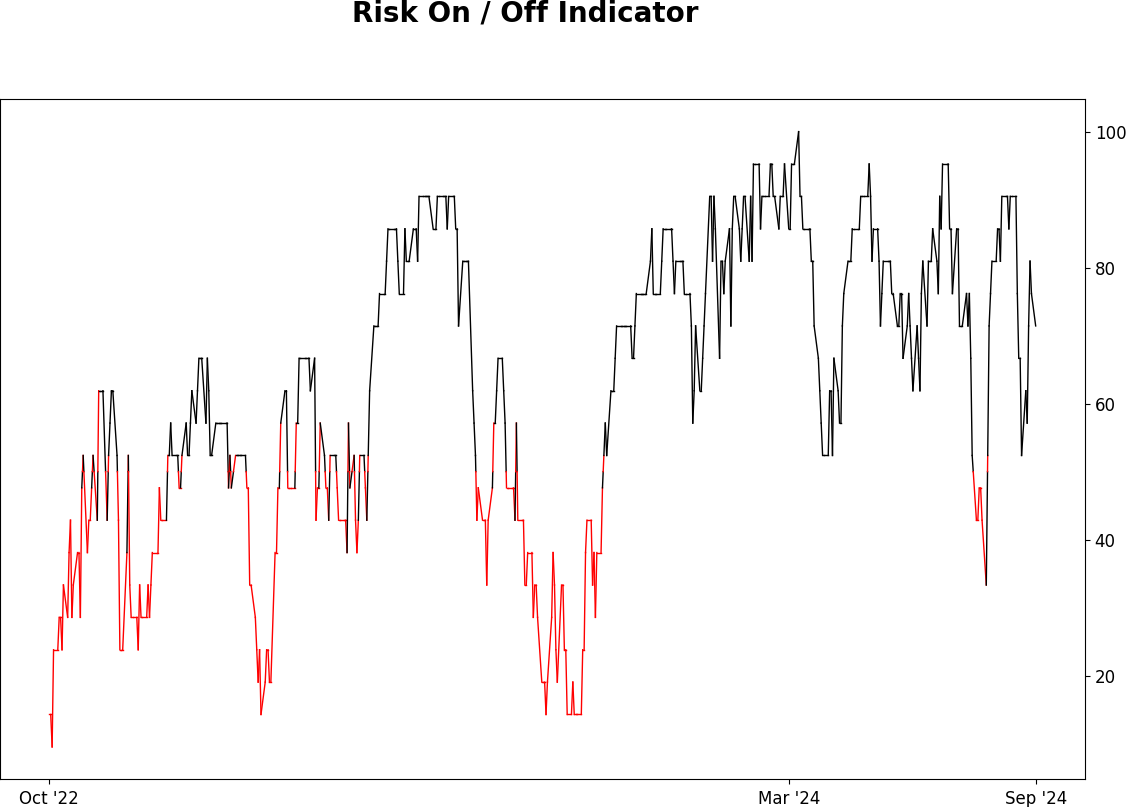
Sentiment Risk On / Risk Off Overview
|
Indicators at Extremes
|
|
|
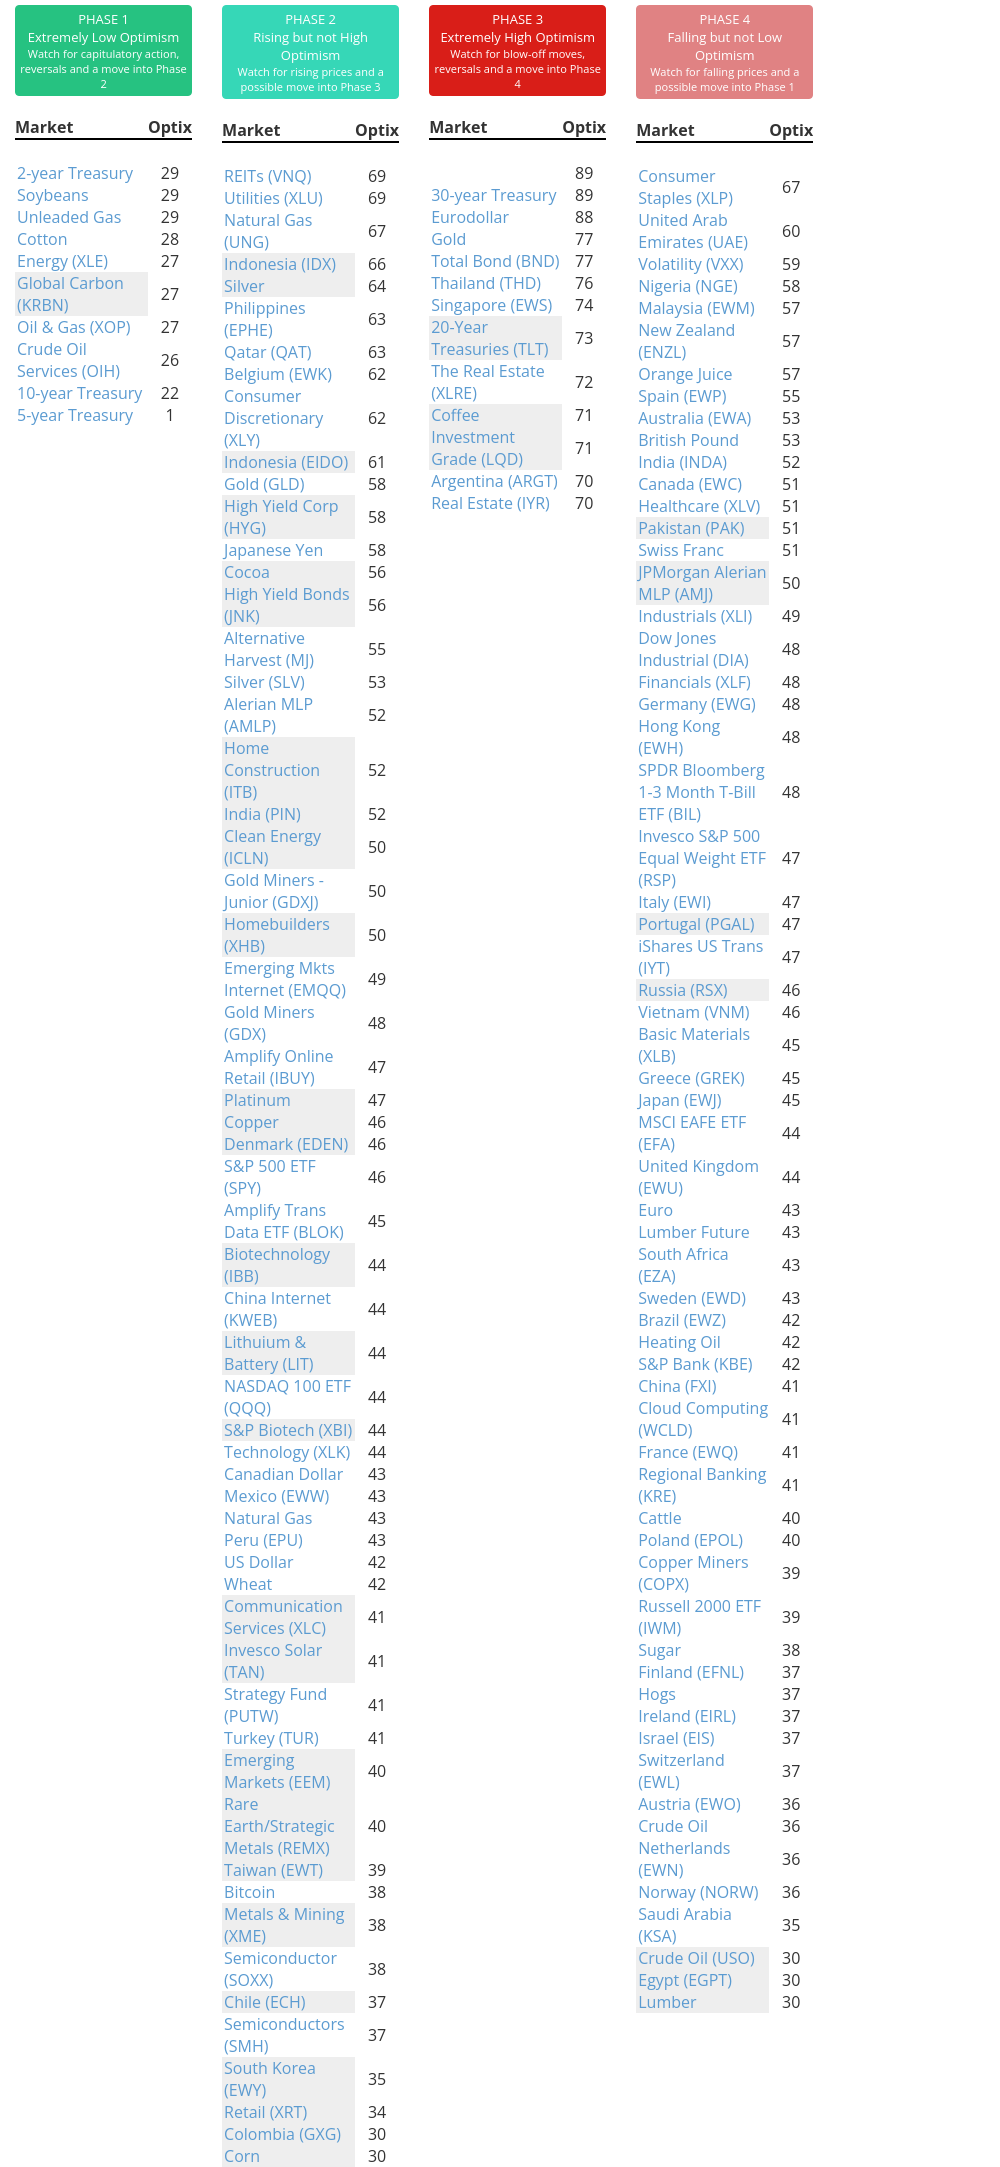
Phase Table
|
|
|
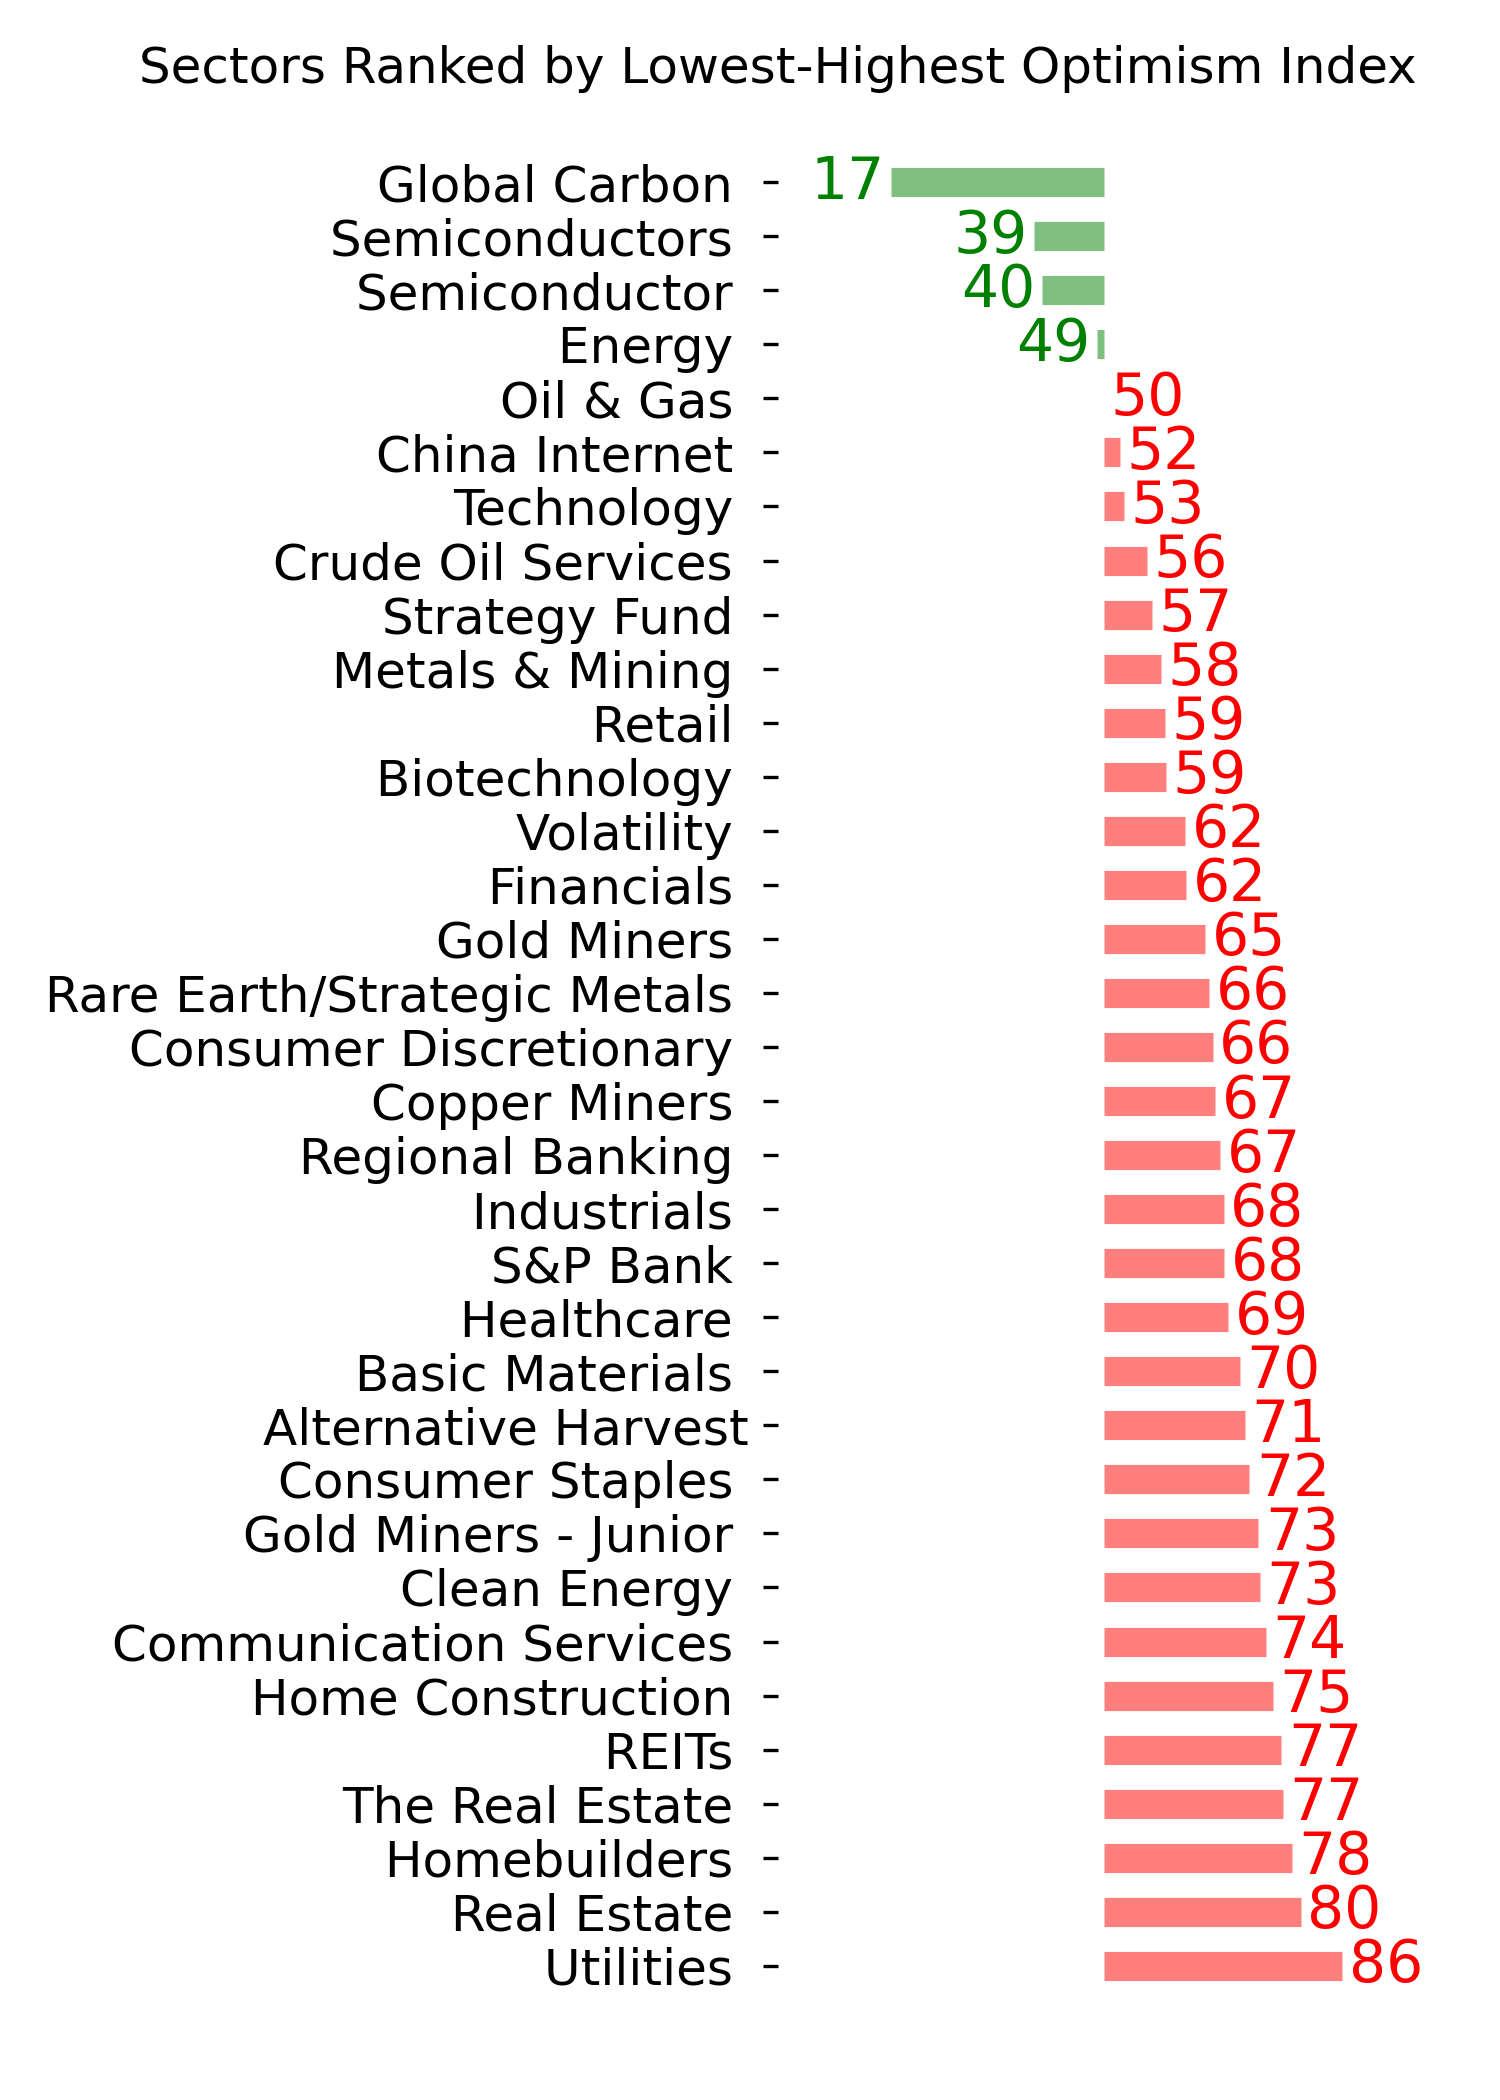
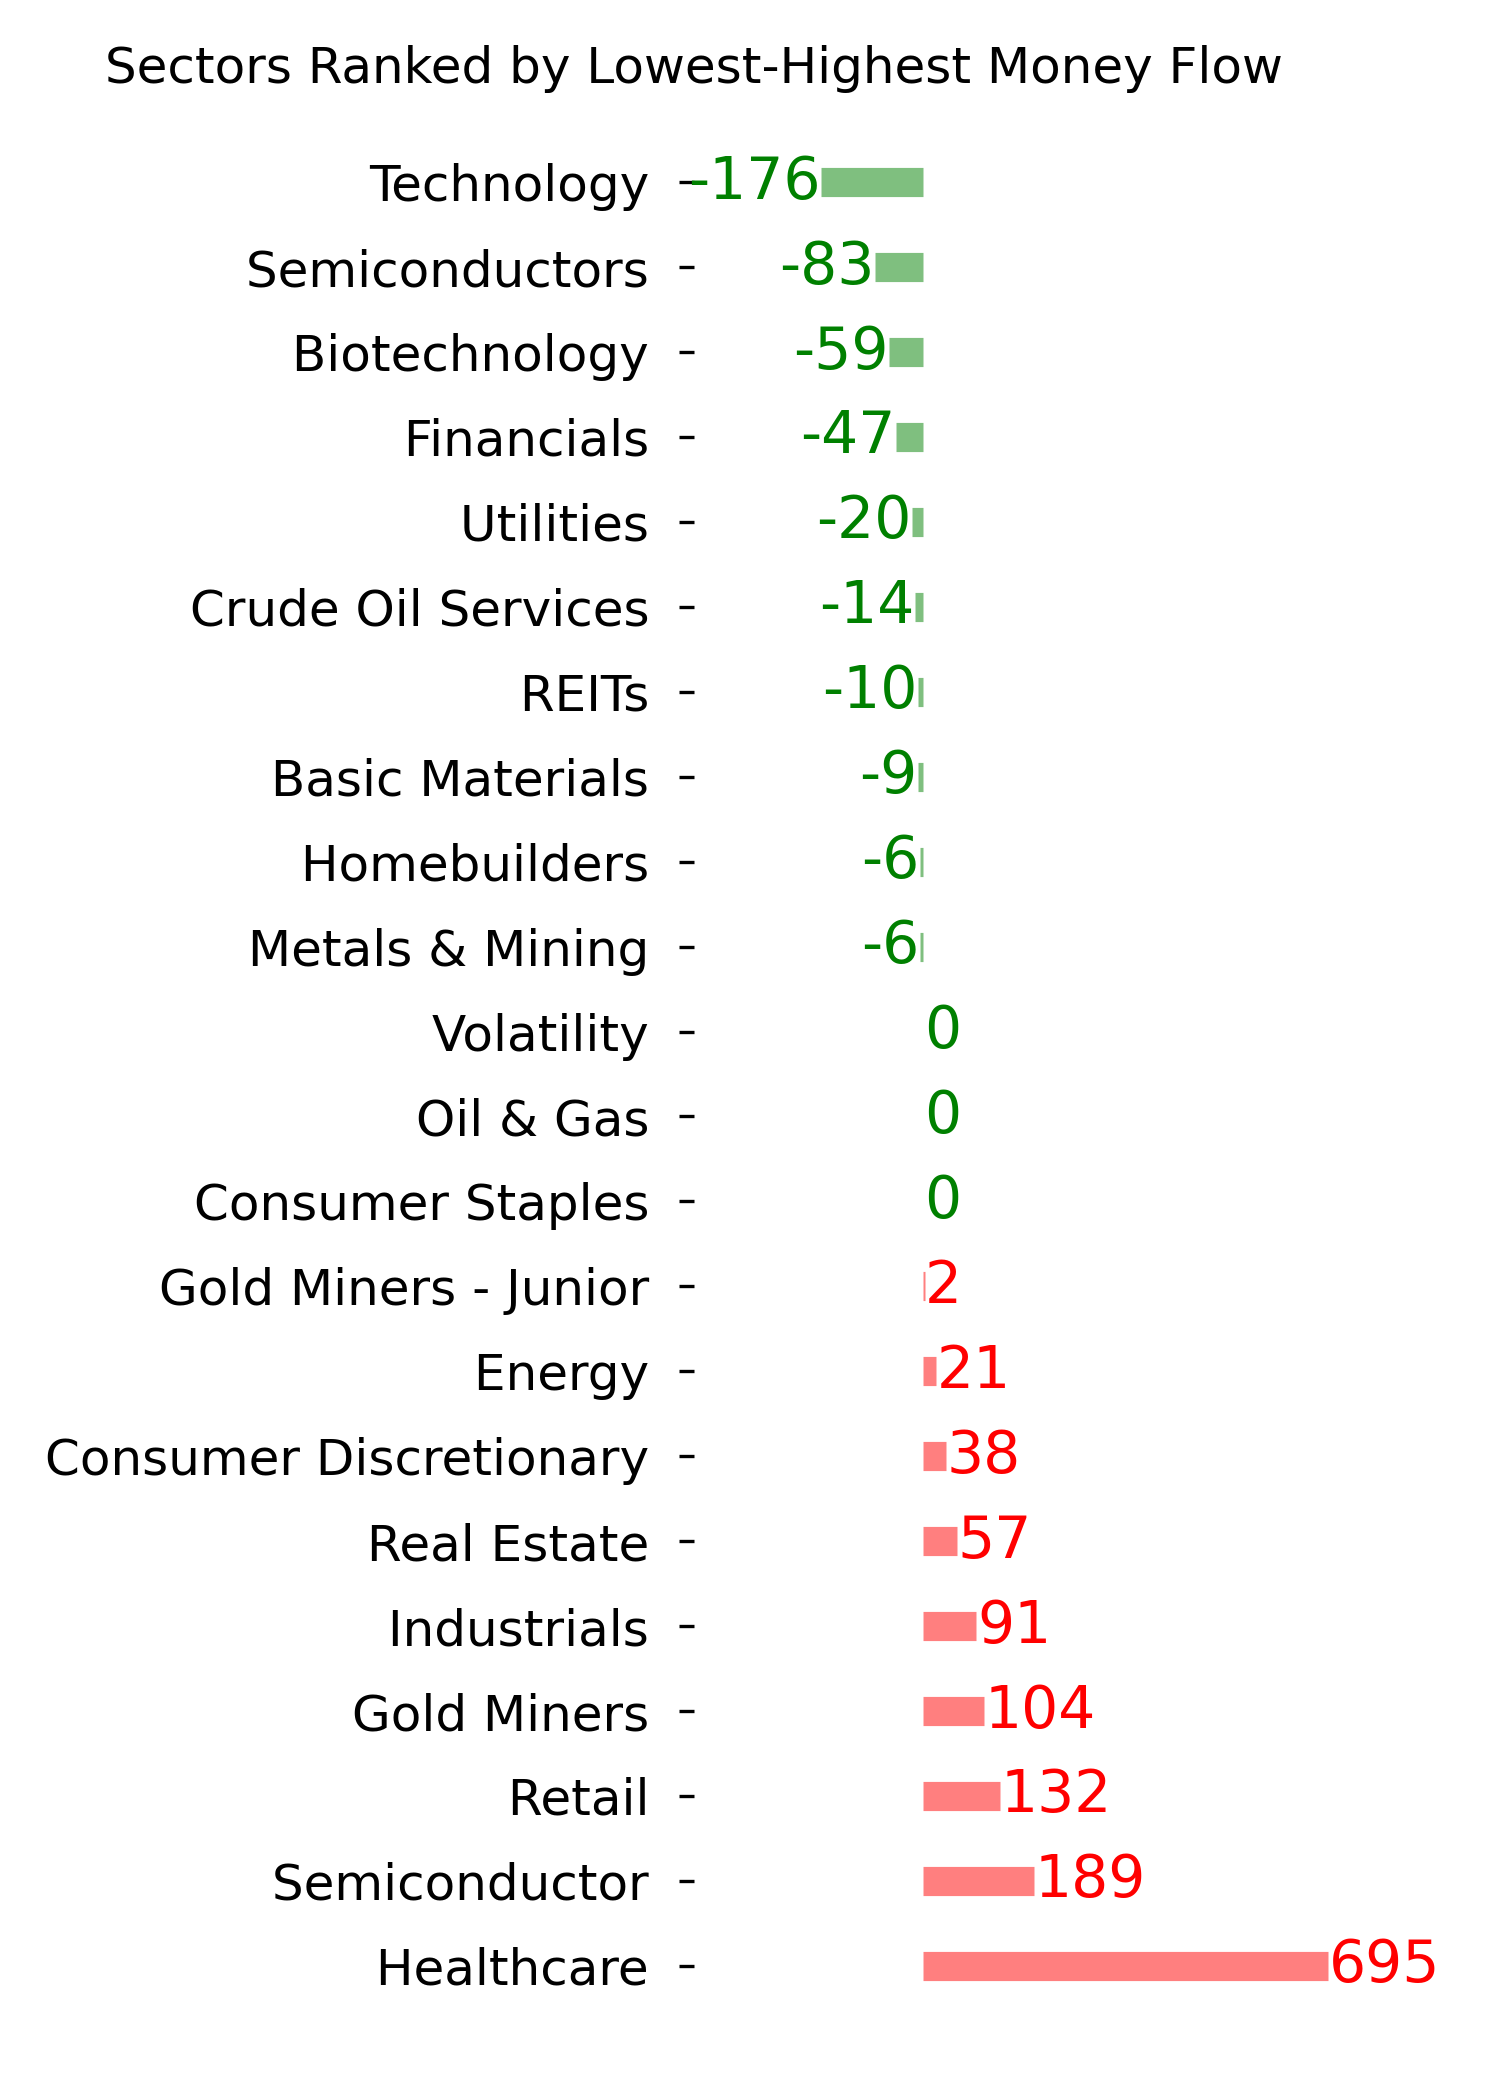
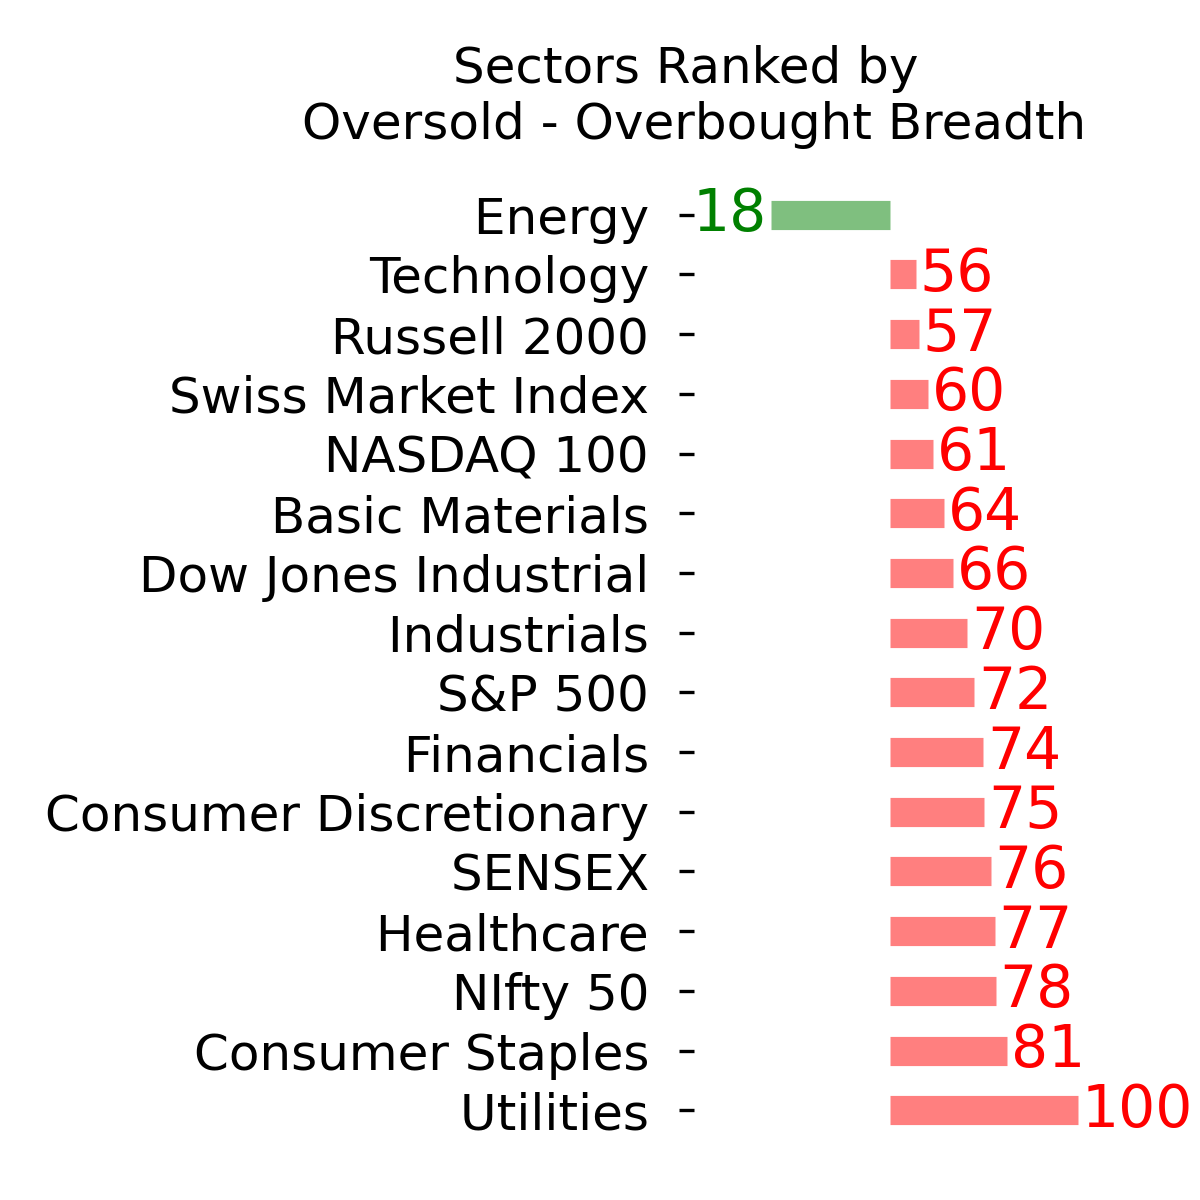
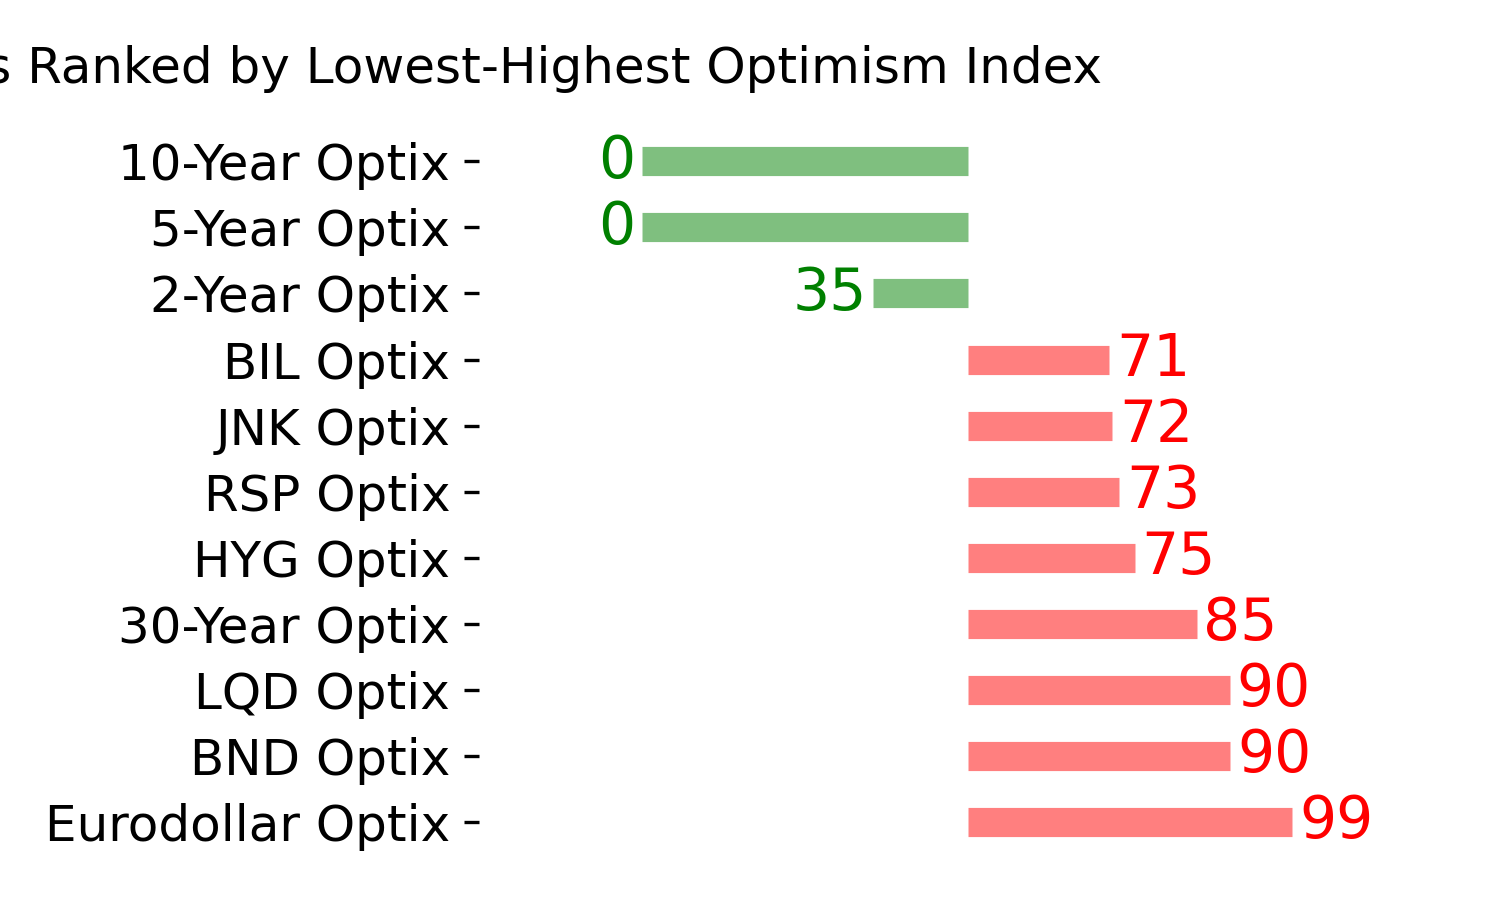
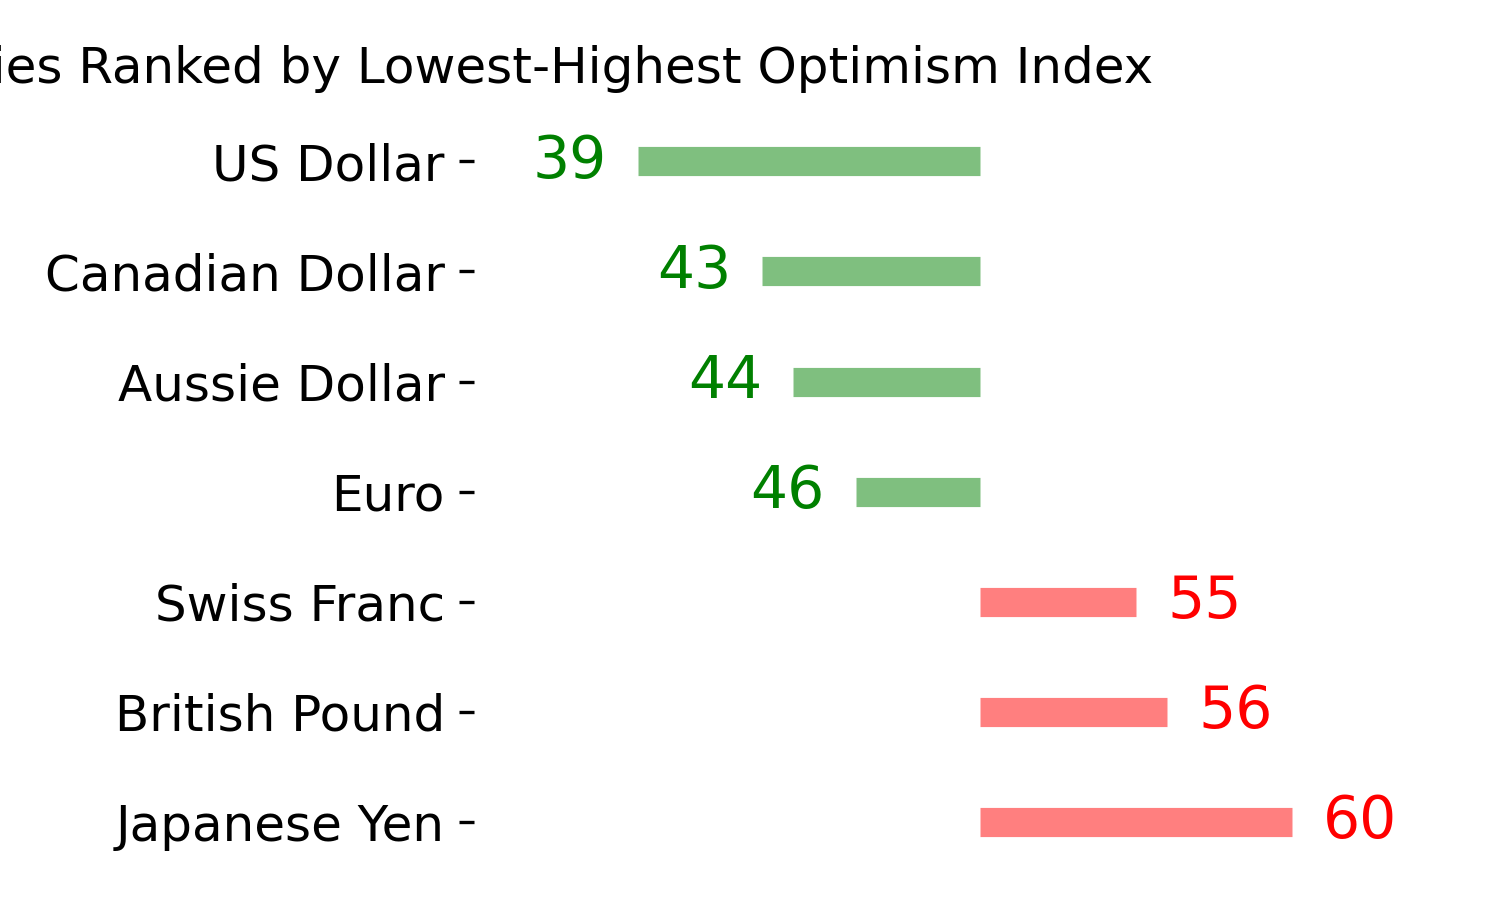
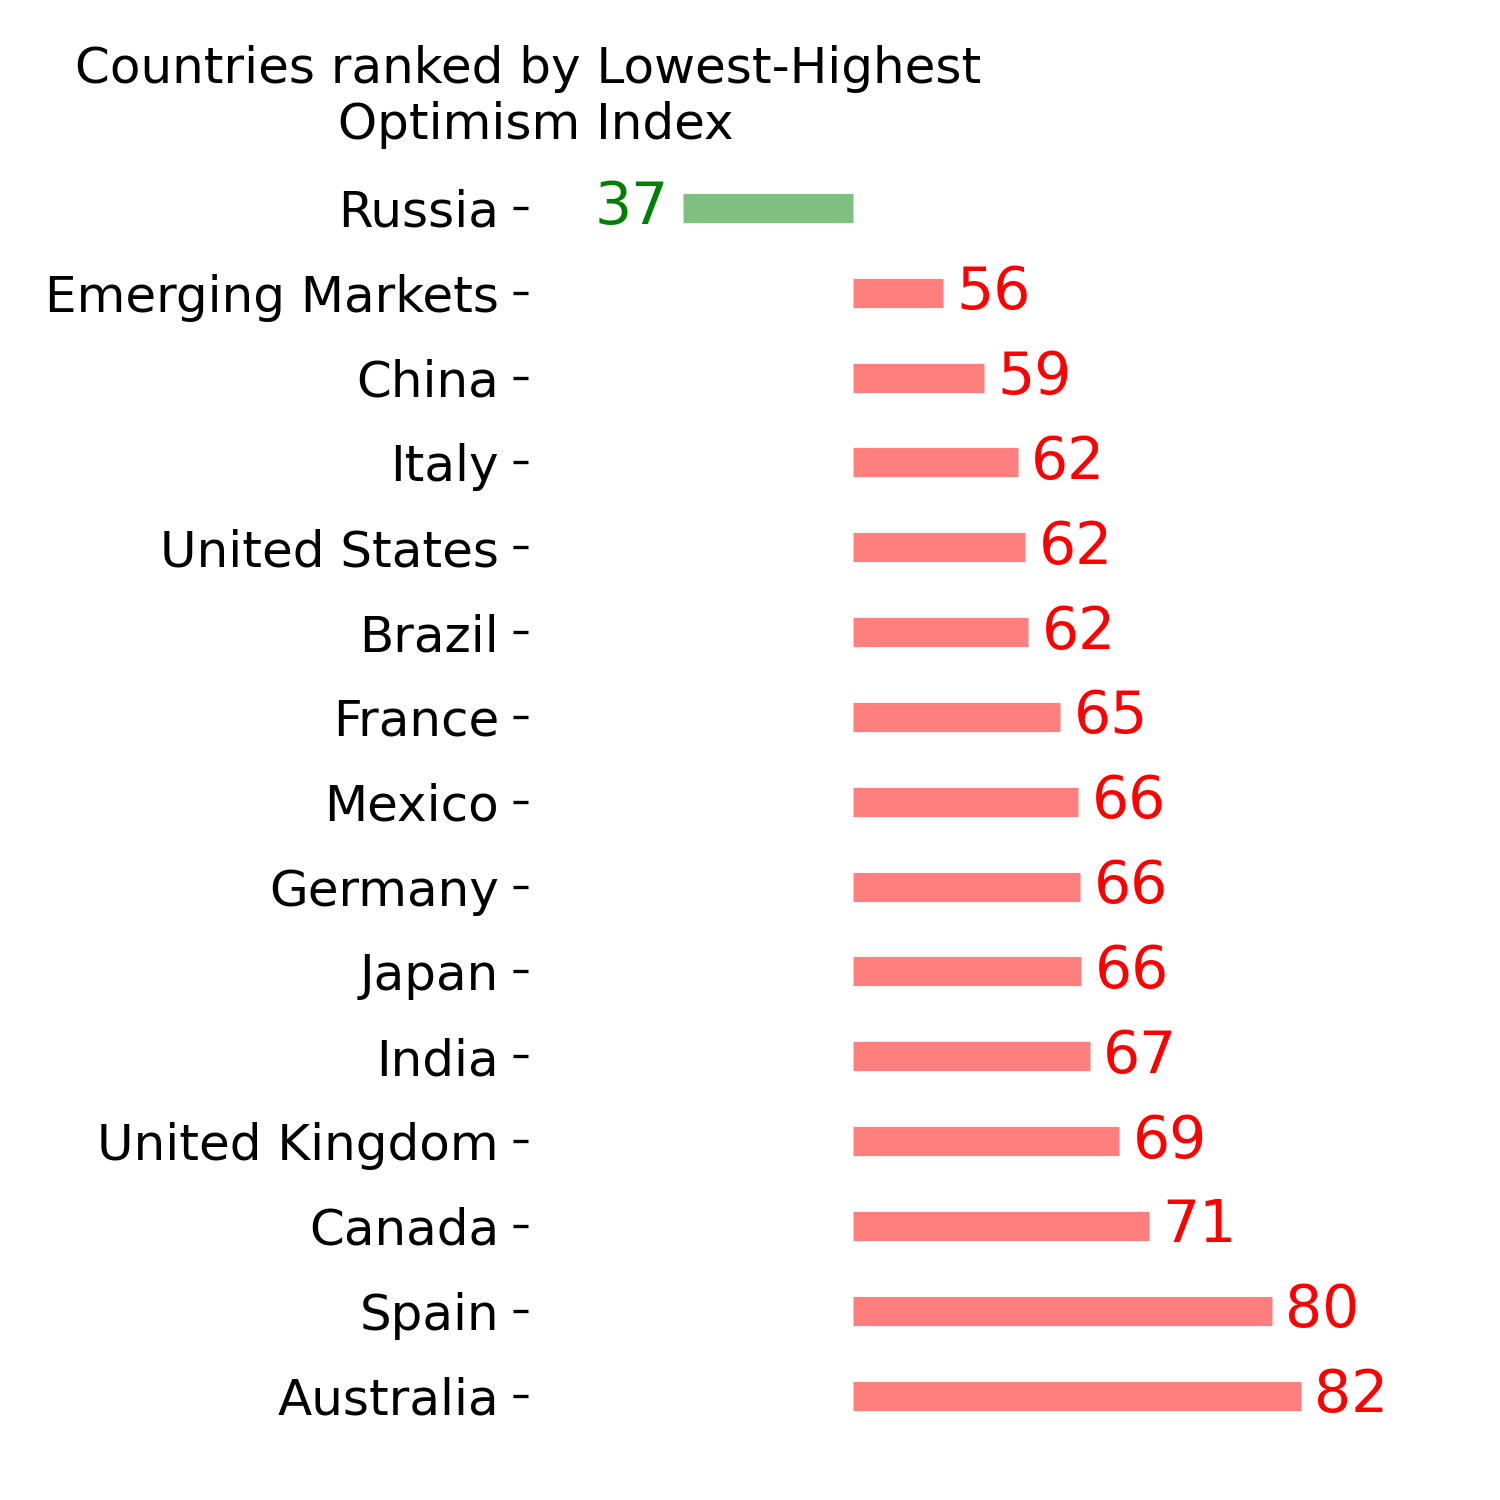
Ranks
|
|
|
|
|
|
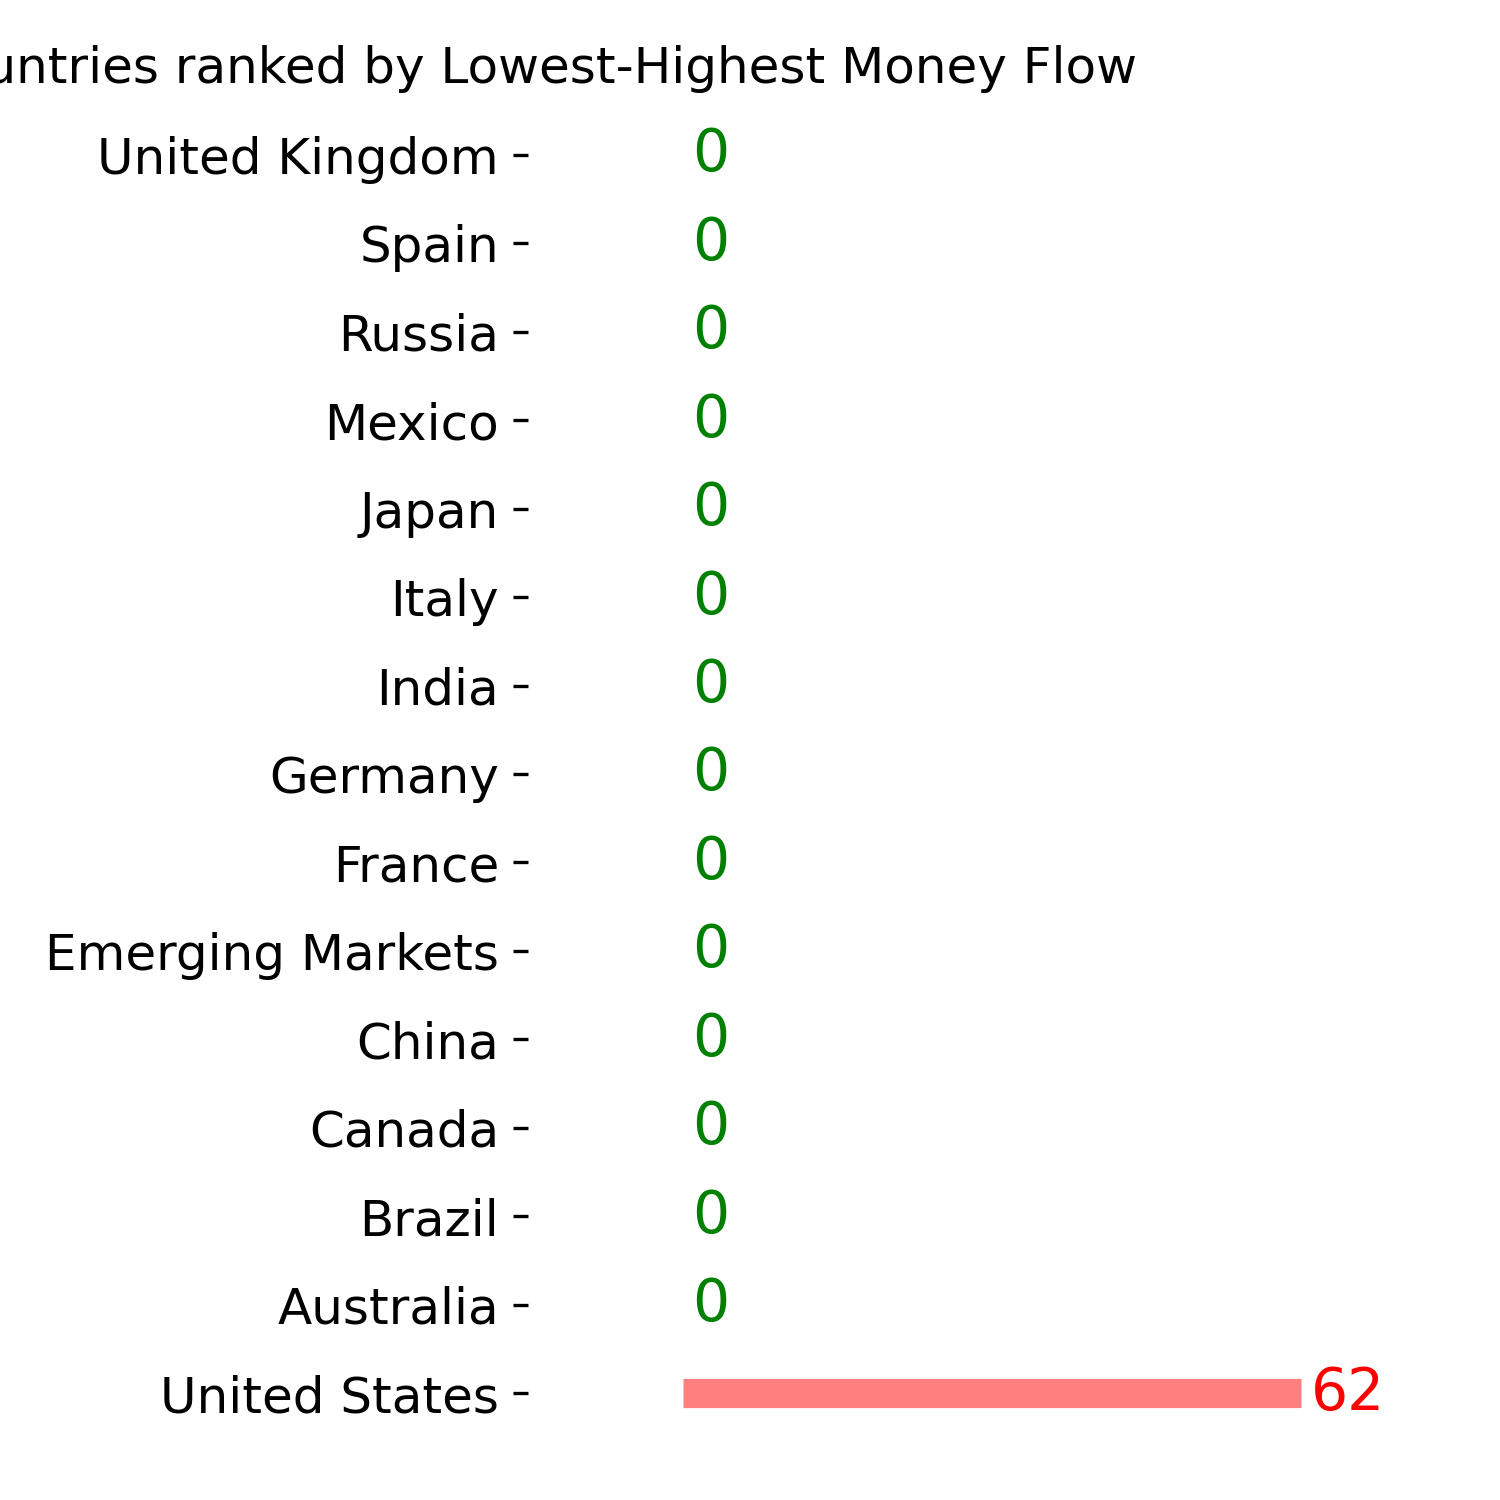
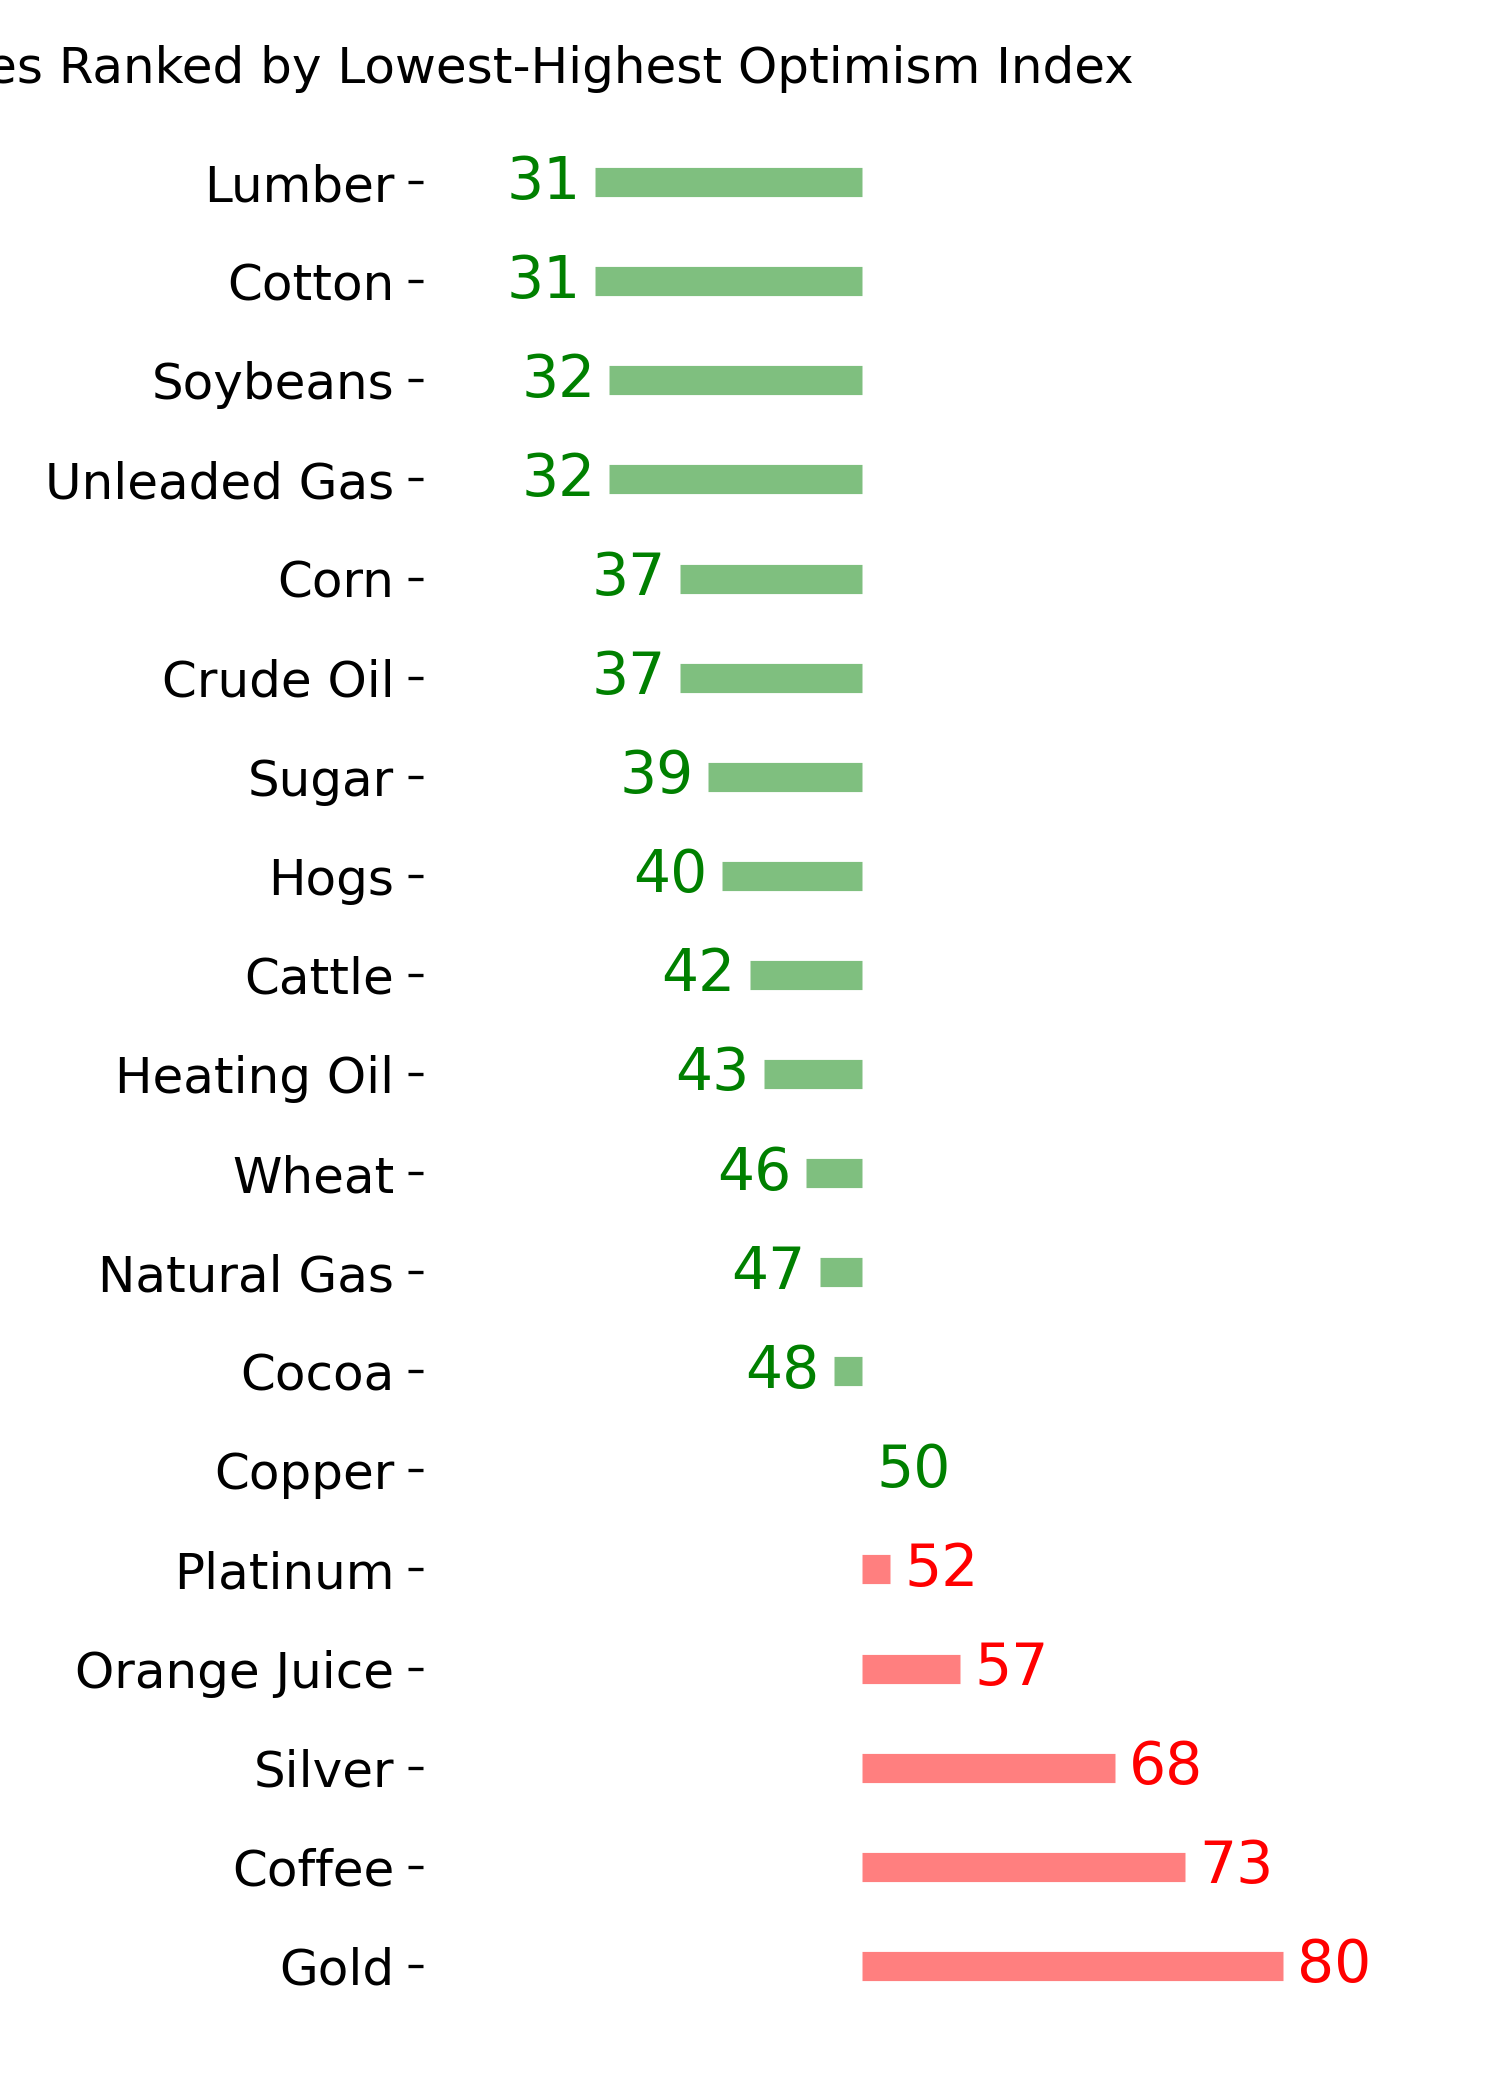
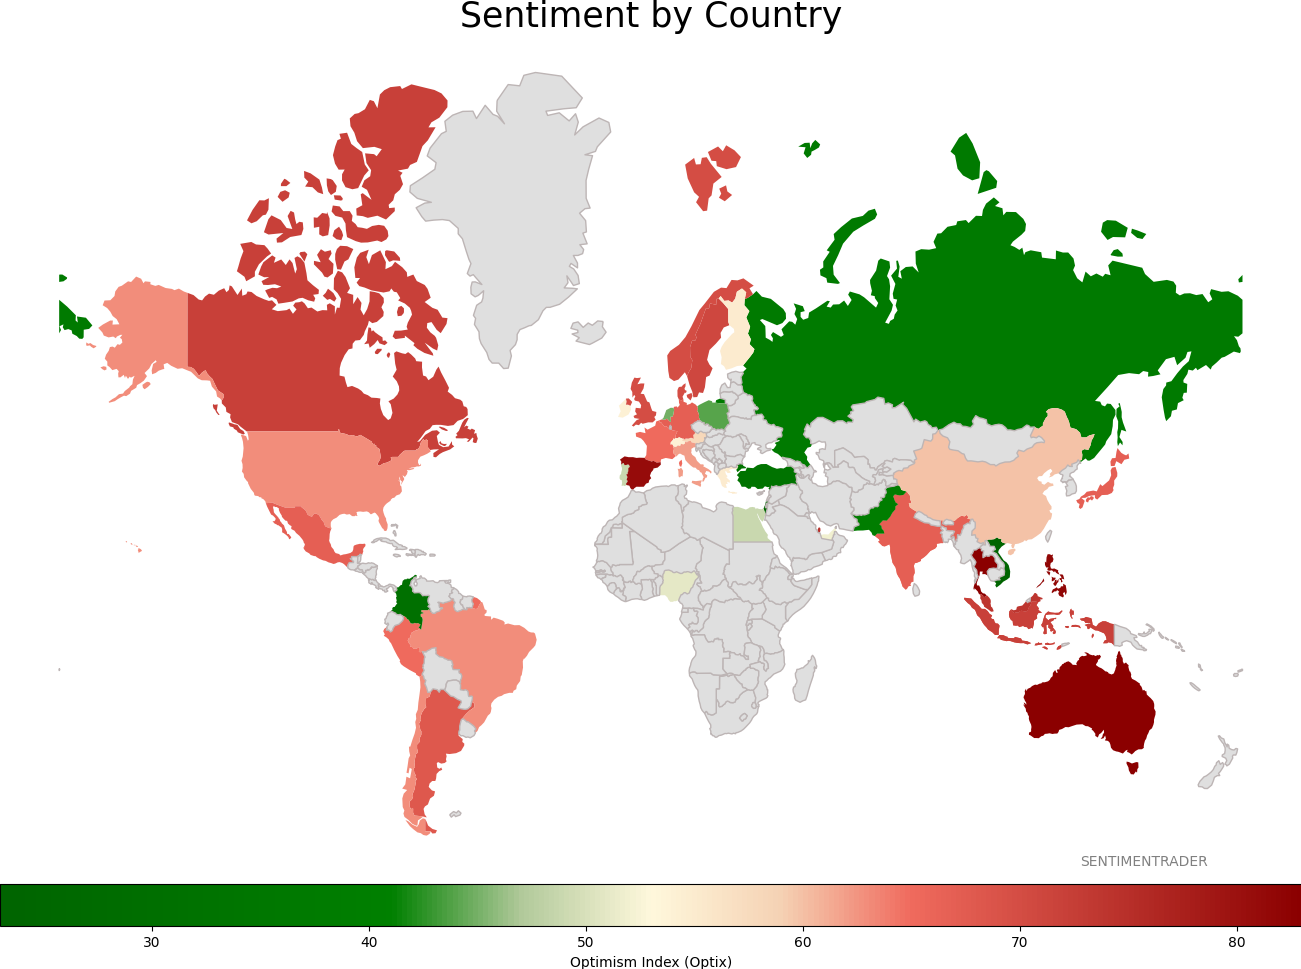
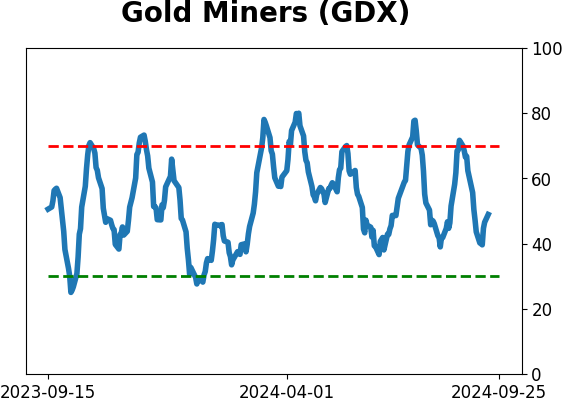
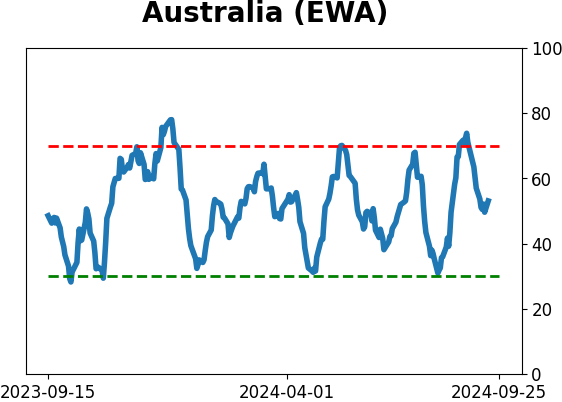
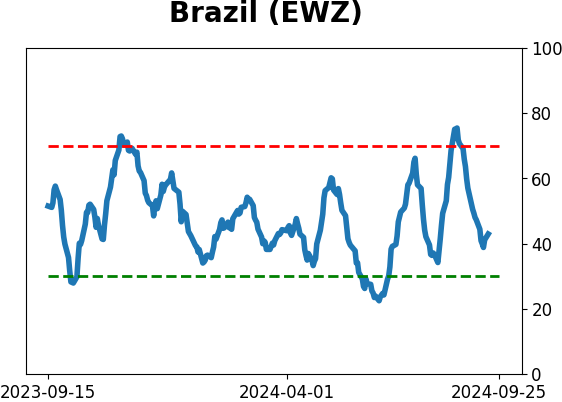
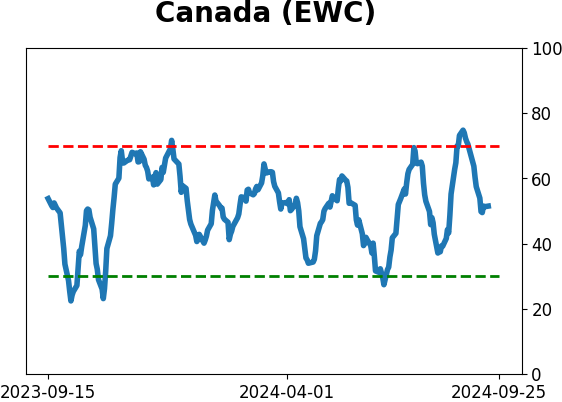
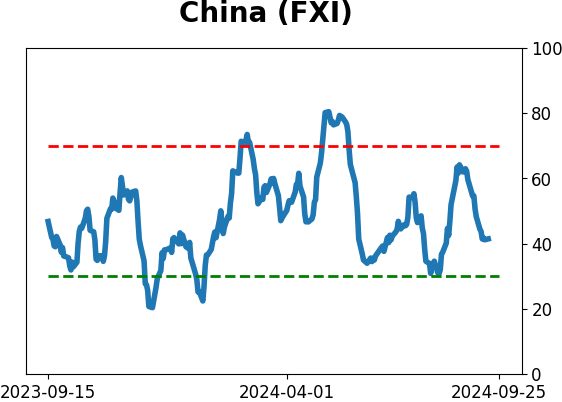
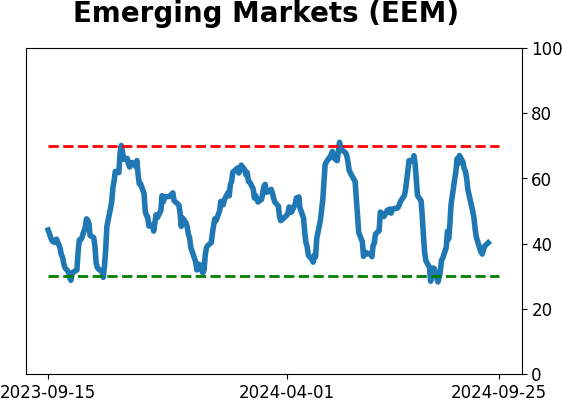
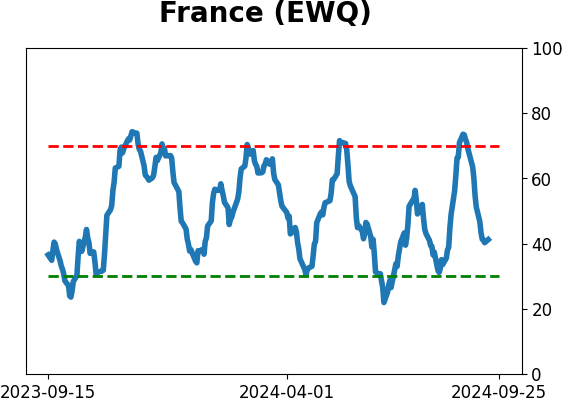
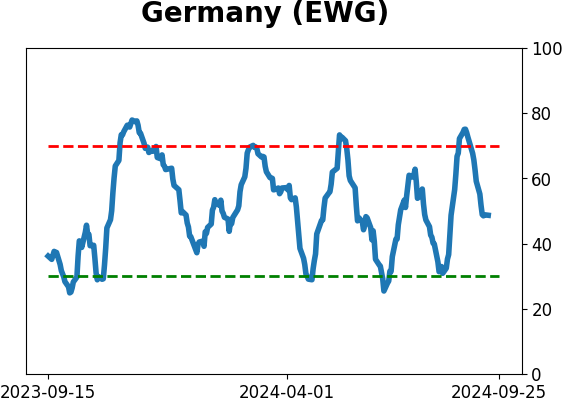
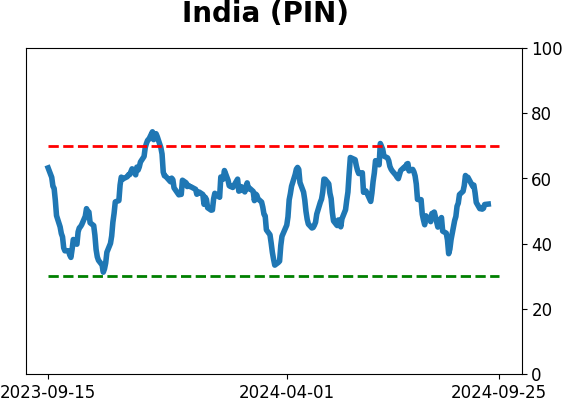
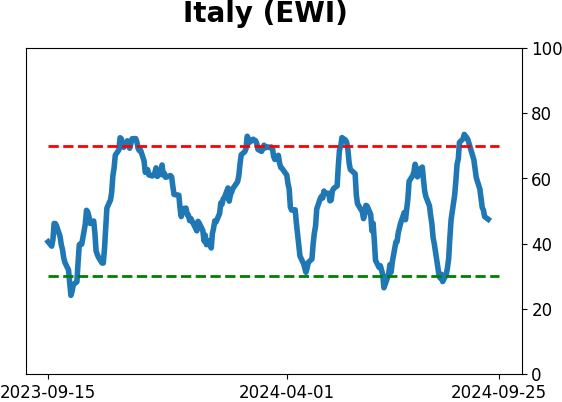
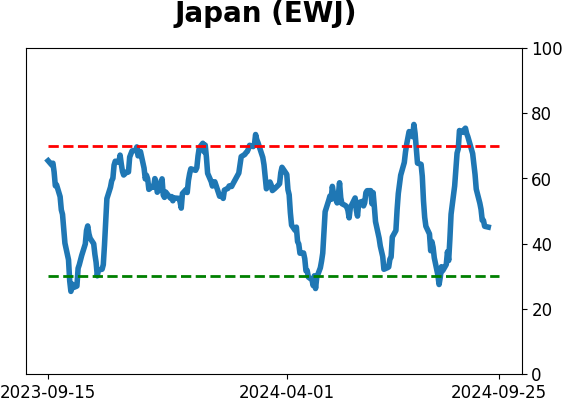
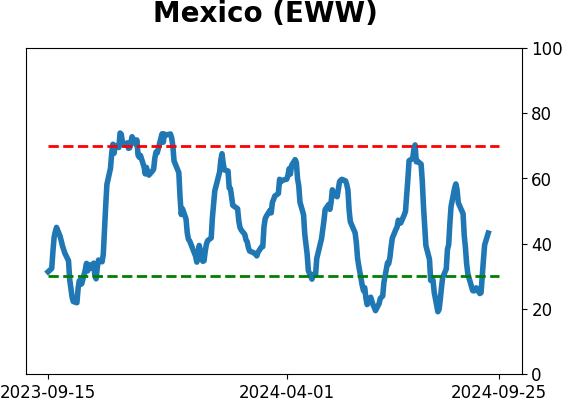
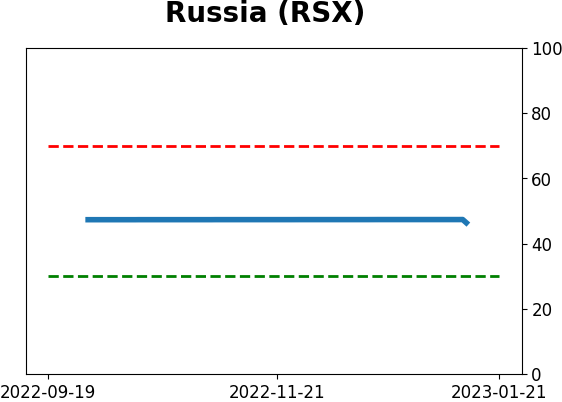
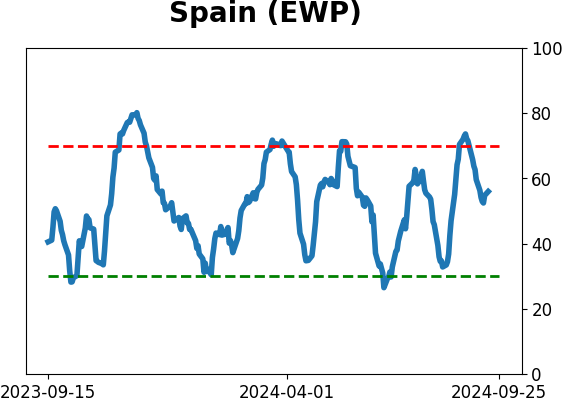
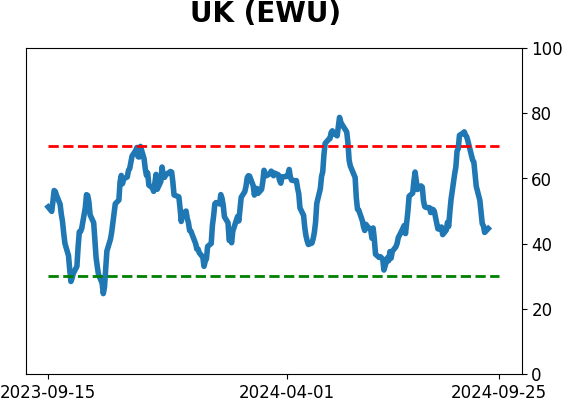
Sentiment Around The World
|
|
|
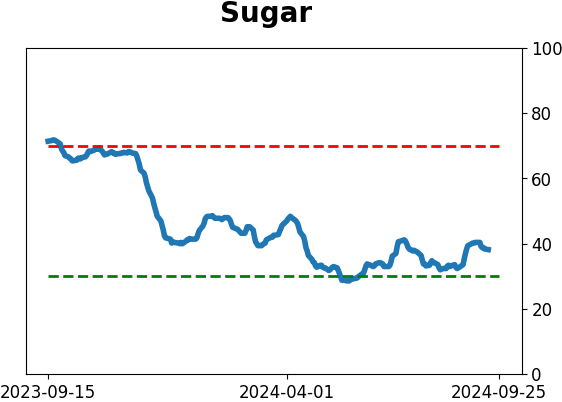
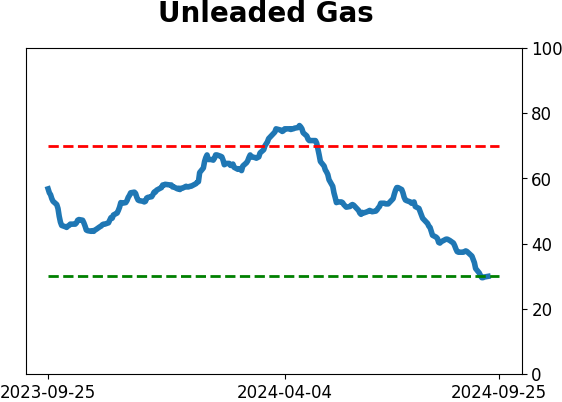
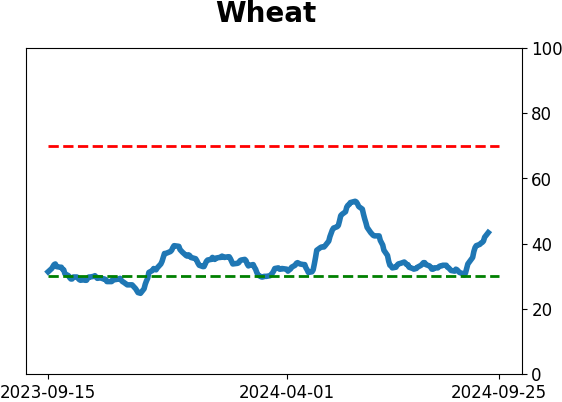
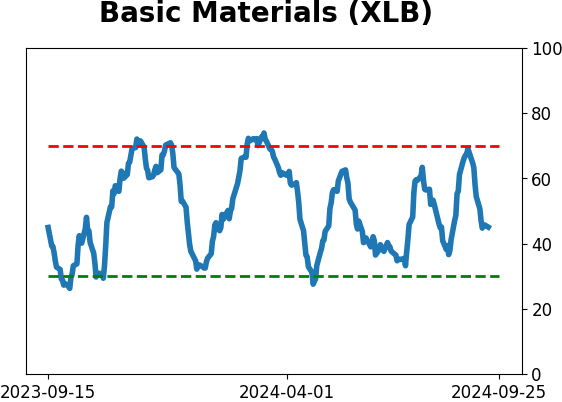
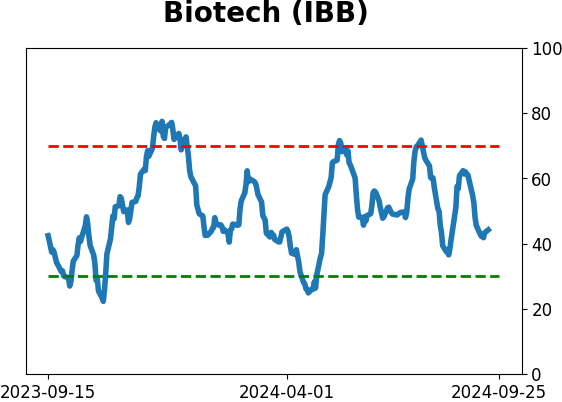
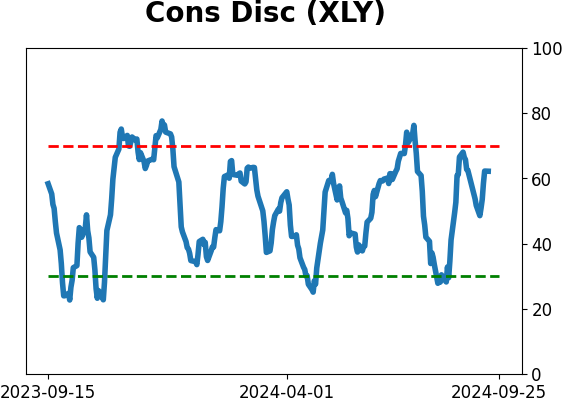
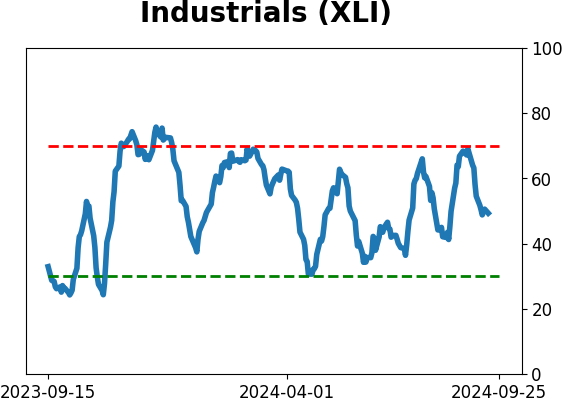
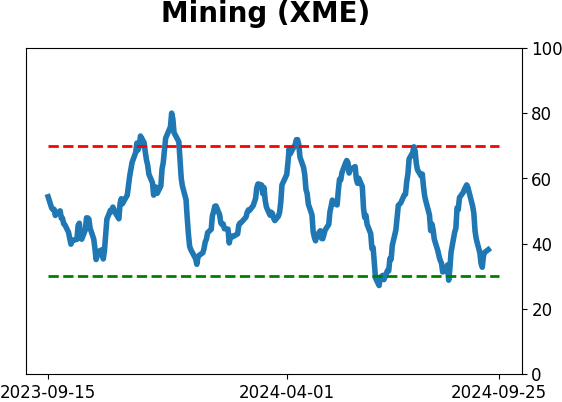
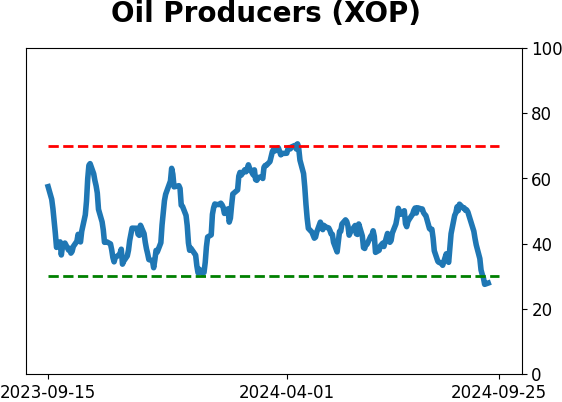
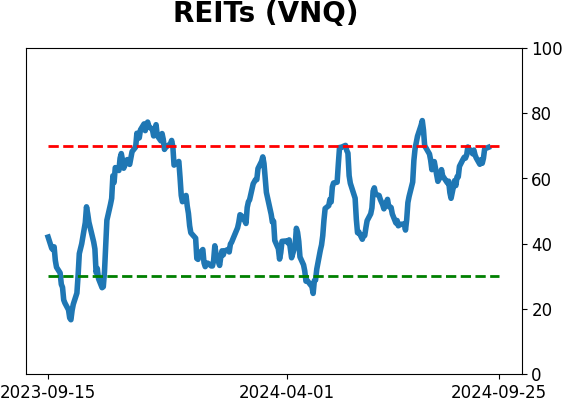
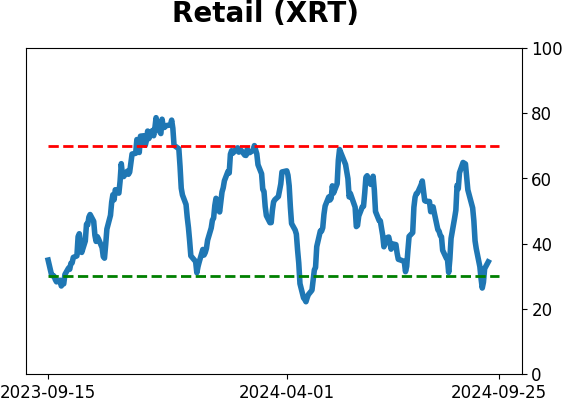
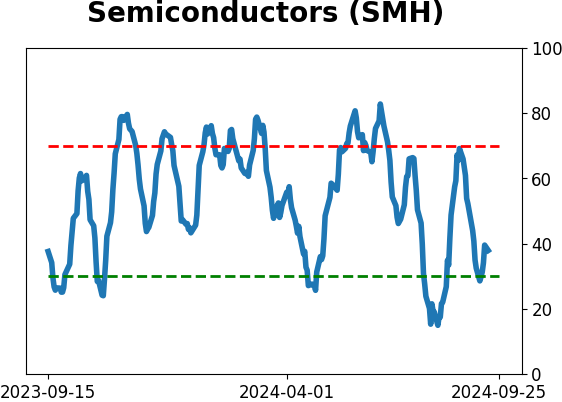
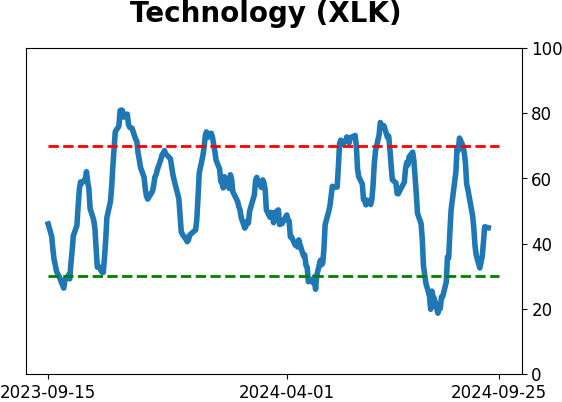
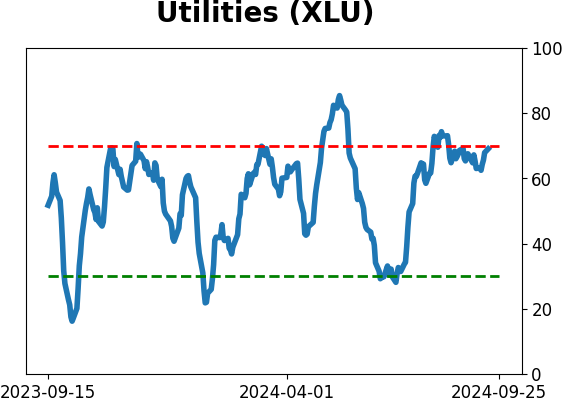
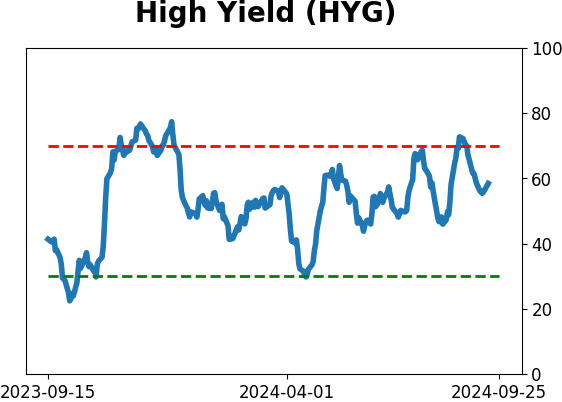
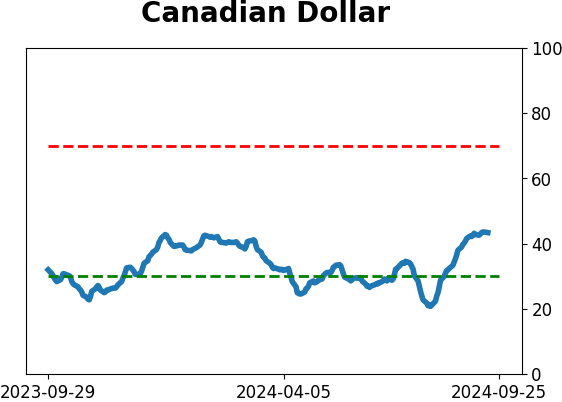
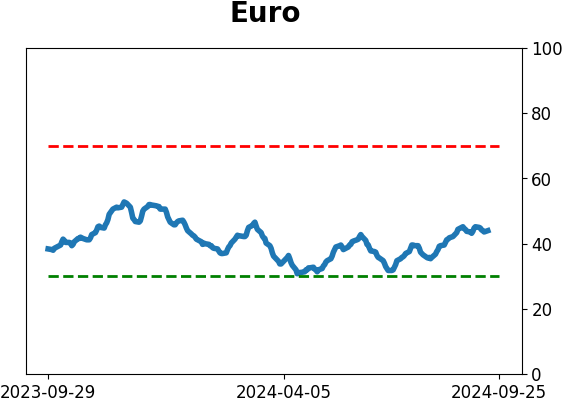
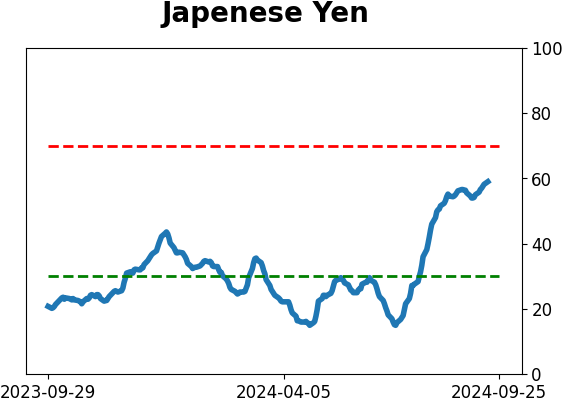
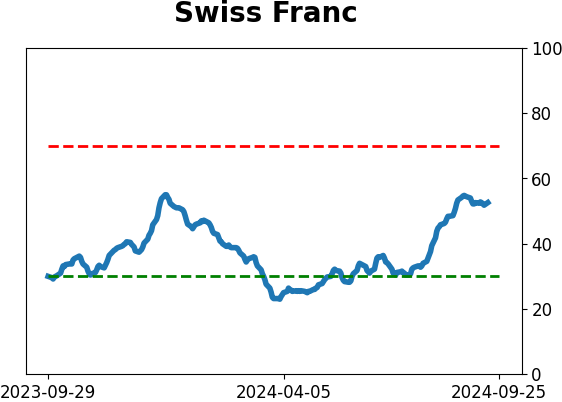
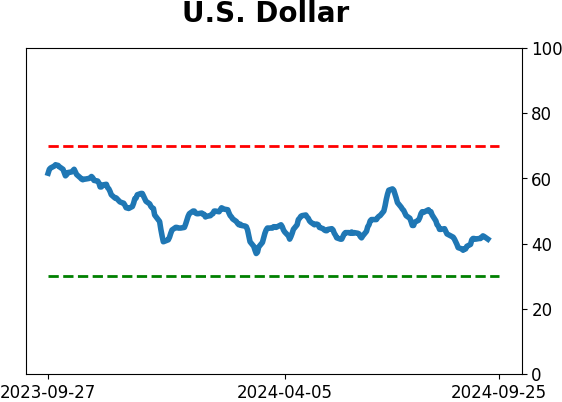
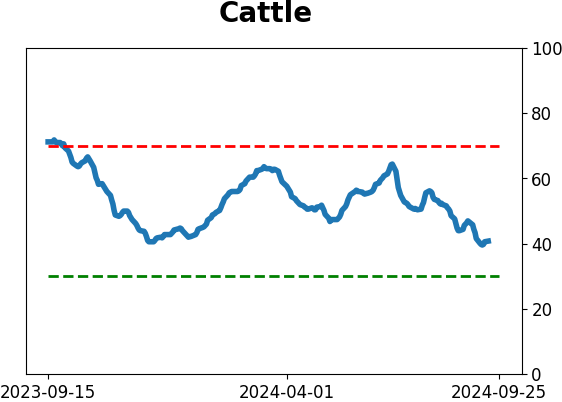
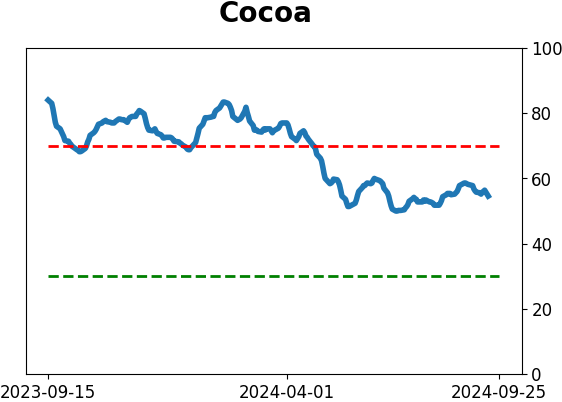
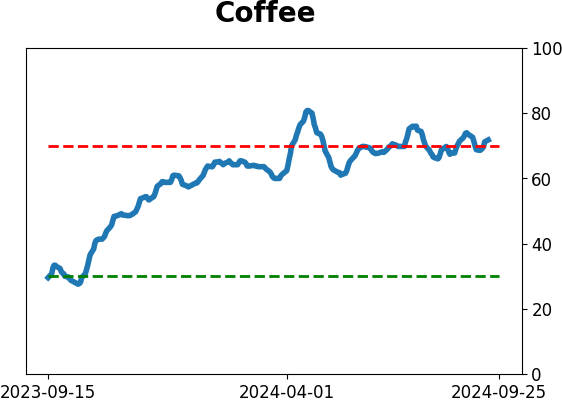
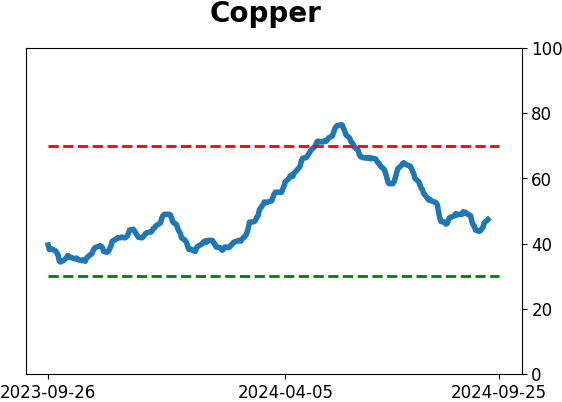
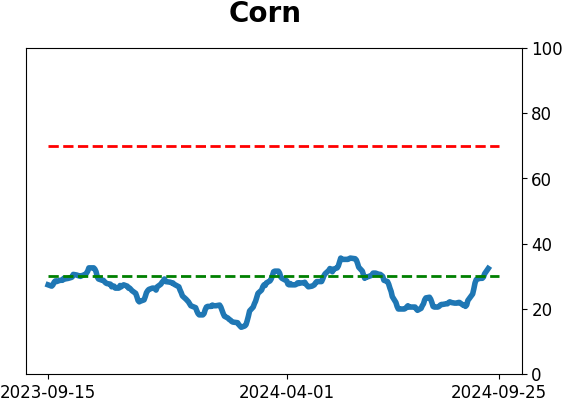
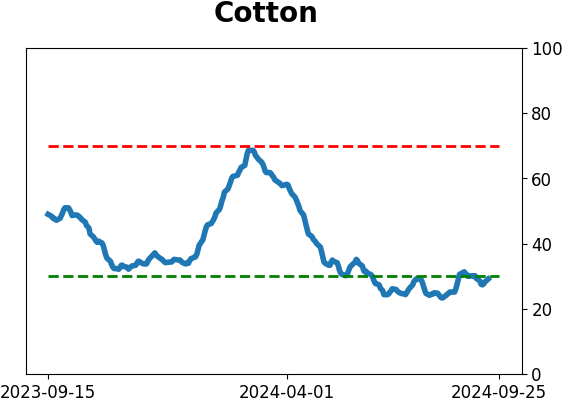
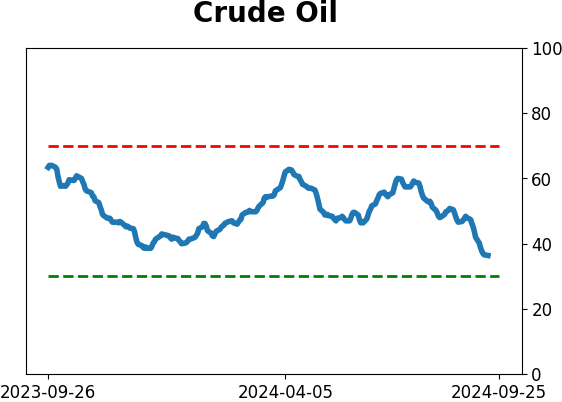
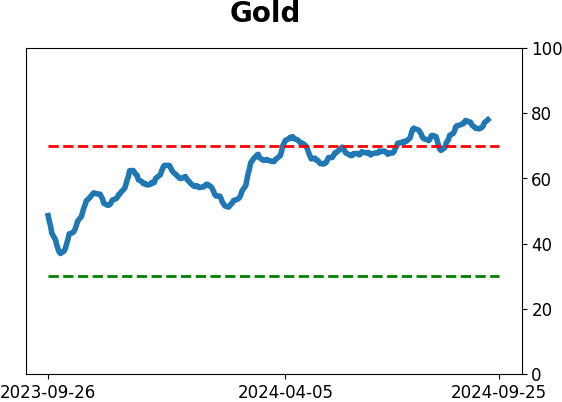
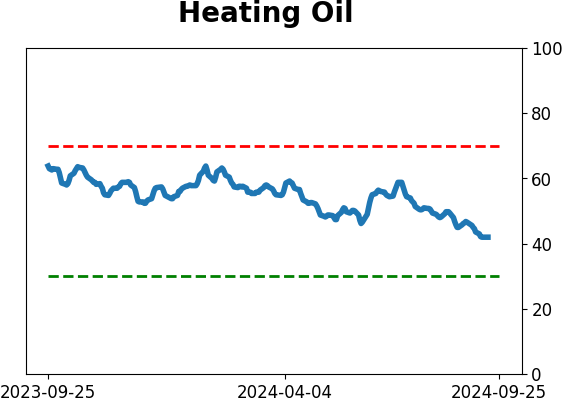
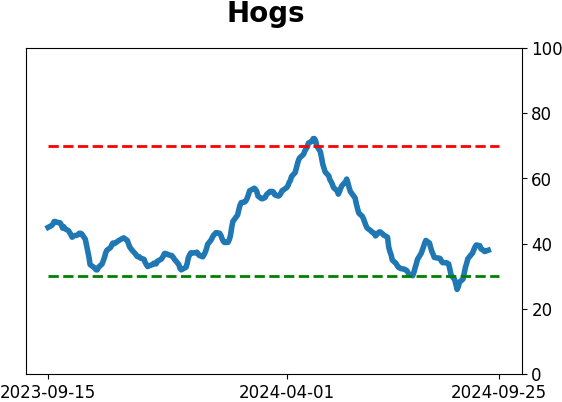
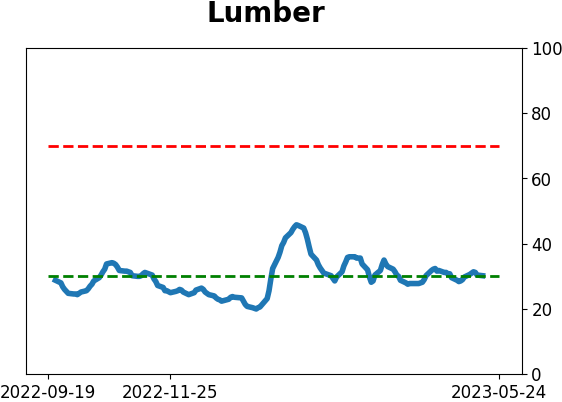
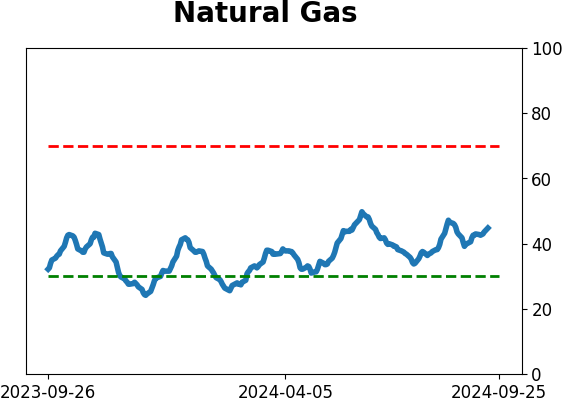
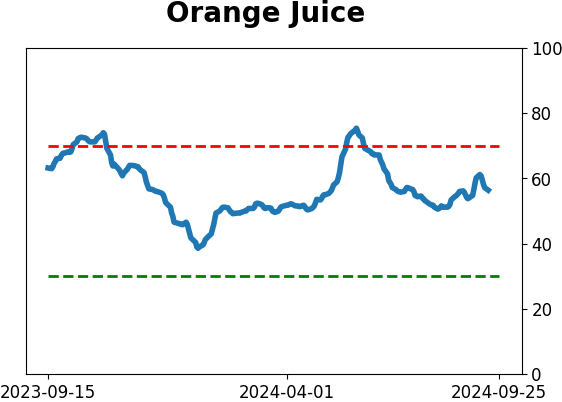
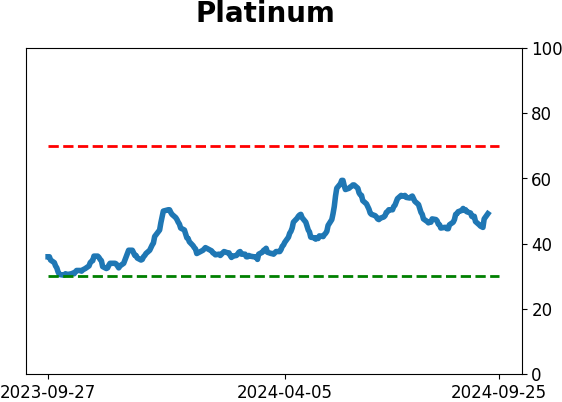
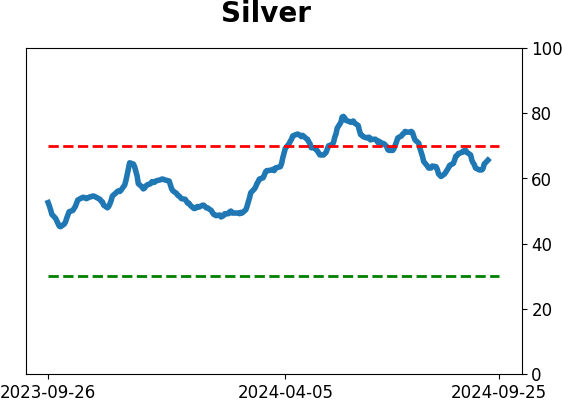
Optimism Index Thumbnails
|
|
|
|
|
|
|
|
|
|
|
|
|
|
|
|
|
|
|
|
|