Daily Report : TradingEdge Weekly for Sep 16 - More hedging activity, massive thrusts, bad reactions, seasonal windows

| View/Print a PDF version of this Report |
Headlines
|
TradingEdge Weekly for Sep 16 - More hedging activity, massive thrusts, bad reactions, seasonal windows: This week, we saw continued massive hedging activity by large options traders in equities. They may have helped trigger recent breadth thrusts, a historically positive sign. Even a big day of selling doesn't typically negate these positive effects. Smart money hedgers have been accumulating Treasury notes during a historic drawdown. Cattle prices have been soaring, while a couple of sectors are entering notable seasonal windows. |
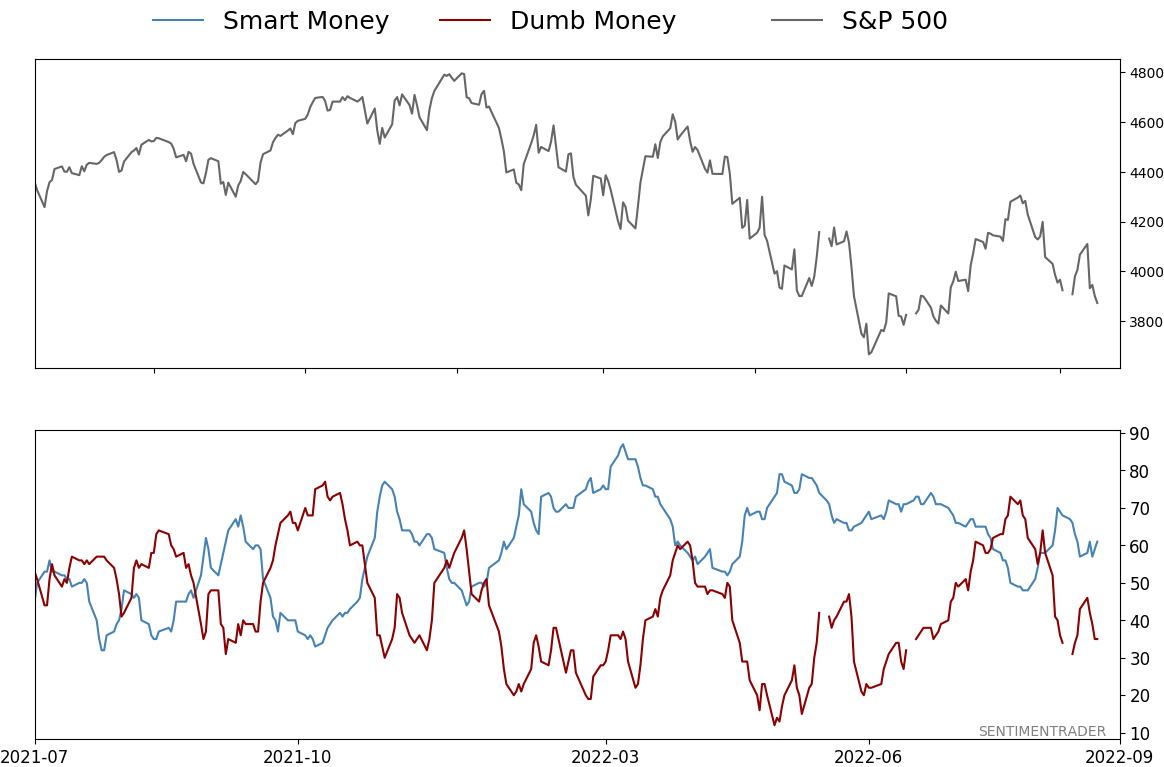
Smart / Dumb Money Confidence
|
|
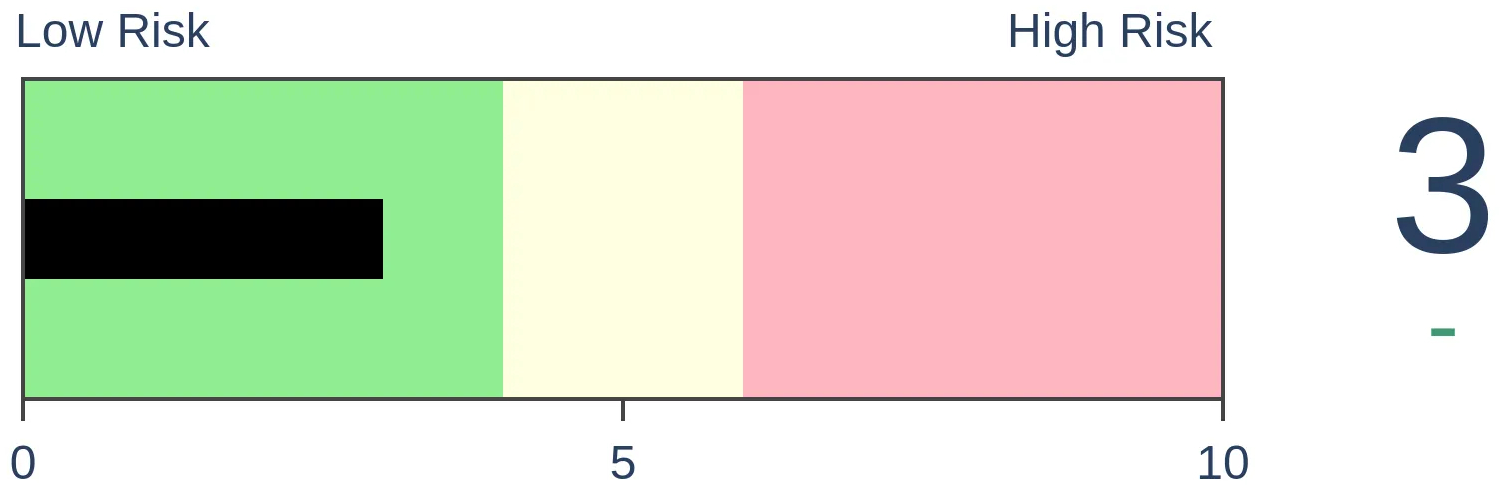
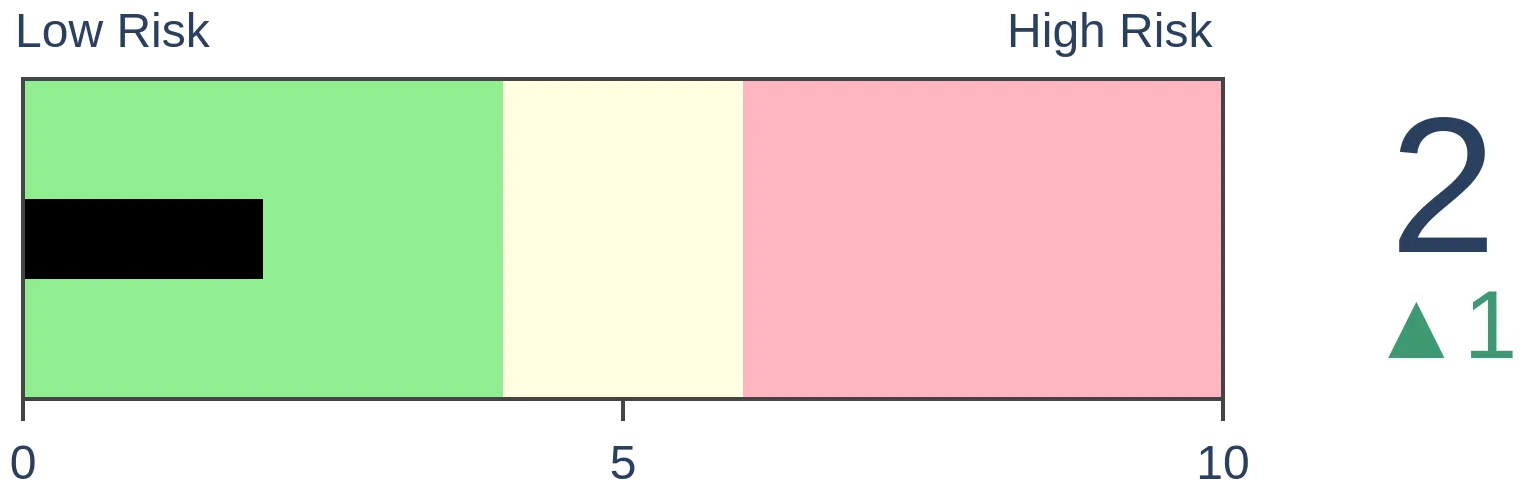
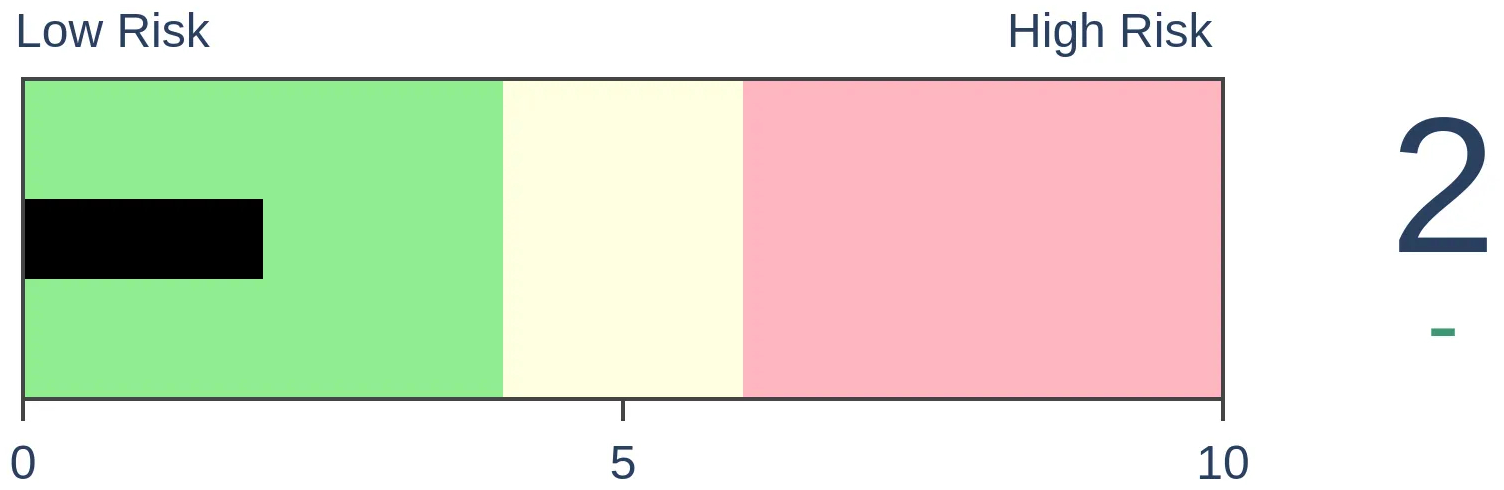
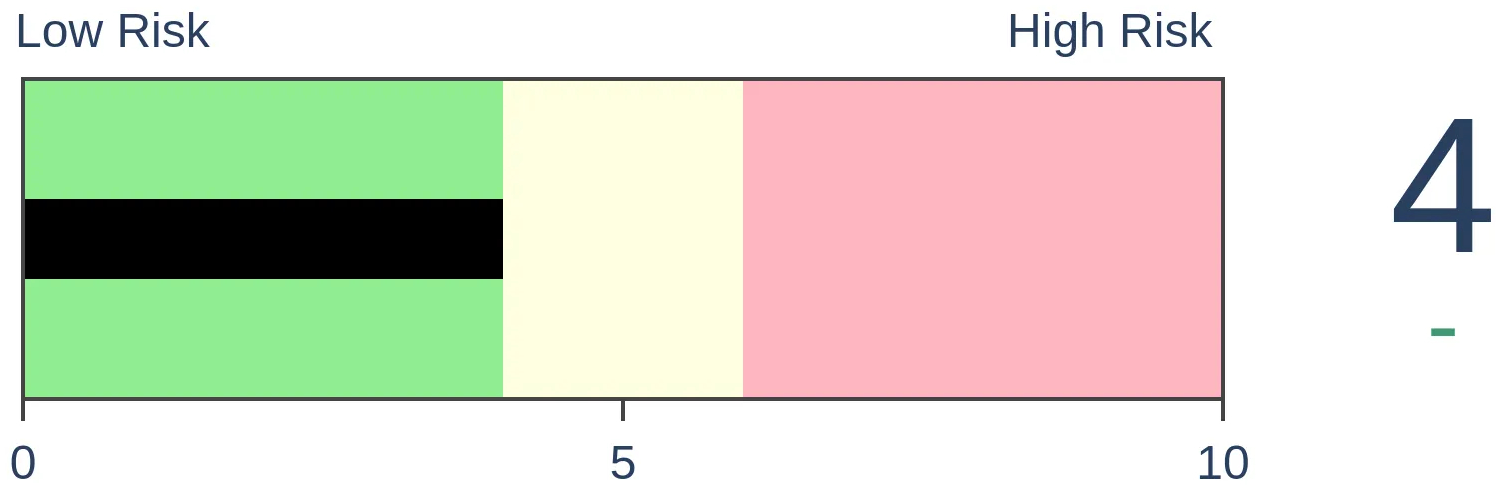
Risk Levels
|

|

|
Research
TradingEdge Weekly for Sep 16 - More hedging activity, massive thrusts, bad reactions, seasonal windowsBy Jason GoepfertBOTTOM LINEThis week, we saw continued massive hedging activity by large options traders in equities. They may have helped trigger recent breadth thrusts, a historically positive sign. Even a big day of selling doesn't typically negate these positive effects. Smart money hedgers have been accumulating Treasury notes during a historic drawdown. Cattle prices have been soaring, while a couple of sectors are entering notable seasonal windows. FORECAST / TIMEFRAME |
Key points:
- Institutional traders continue to tread heavily in options hedges
- That might have helped trigger the recent 3-day thrust in S&P 500 component stocks
- There was a big thrust in broader NYSE securities, too
- Such thrusts have not typically been negated by a day of heavy selling, like Tuesday
- Bad reactions to economic reports have not been a good reason to sell
- The smart money seems to be accumulating short- to medium-term Treasuries
- Homebuilders are about to have a seasonal headwind
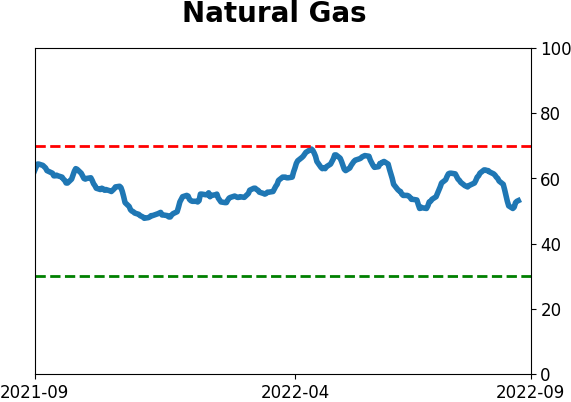
- Natural gas, though, is getting a tailwind
- Gold has formed a double top, which bodes ill for future returns
- Live cattle prices have been soaring
Institutions are still heavy into hedging
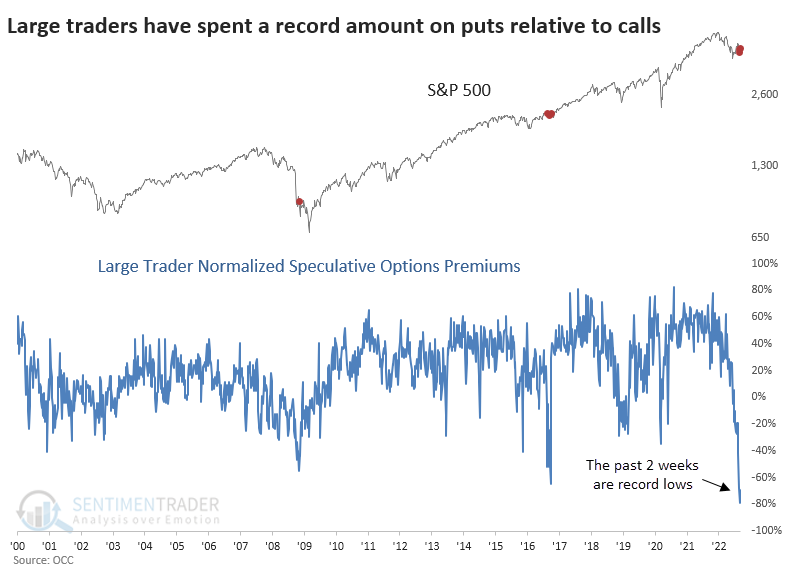
A week ago, we looked at the behavior of institutional options traders. In record fashion, they were betting against stocks. They've backed off a bit but continue to hedge heavily.
Last week, they spent $4.6 billion buying new put options to open. They spent less than $850 million on calls. So, they spent $3.7 billion more on protective put options than speculative call options. That spread is still beyond any other week in 22 years, except the prior week when the spread was more than $7 billion.
We've been more focused on the actual dollar value of these trades. While volume is helpful, looking at the actual, real dollars being exchanged is usually just as or more informative. The chart below normalizes the volume. The formula used in the chart is:
(Call buys to open - Put buys to open) / (Call buys to open + Put buys to open)
Last week and the week before witnessed these traders' most extreme put buying ever.
"Okay, okay," another criticism goes. "They're buying a lot of puts, but they're probably selling a lot of puts, too, so it doesn't mean anything."
We already looked at that last week, but here's another shot. The chart below shows how premiums on puts these traders bought relative to how many puts they sold and how many calls they bought and sold (total premiums). We're looking at opening transactions only, no closing transactions.
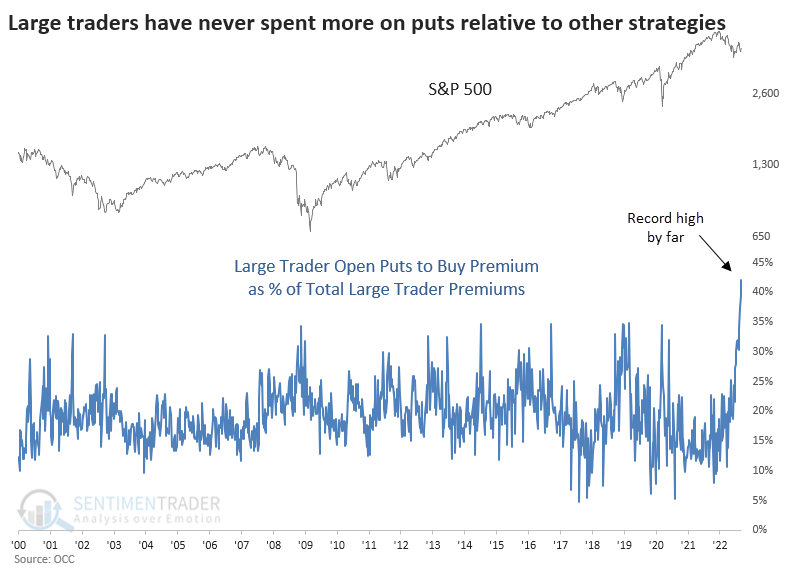
Last week, large traders spent $4.6 billion on opening put buys. They spent $10.5 billion on all opening strategies (call buying, call selling, put buying, and put selling). That means that 42% of the money changing hands was for buying puts to open.
That's a record high. It's even higher than the week before, which was 39%.
Maybe offsides positioning triggered the recent breadth thrust
Once again, investors just can't get enough of stocks. Over the three sessions ending last Friday, an average of more than 87% of S&P 500 stocks have advanced. That's the 2nd-highest rate in six years, barely eked out by March 26, 2020.
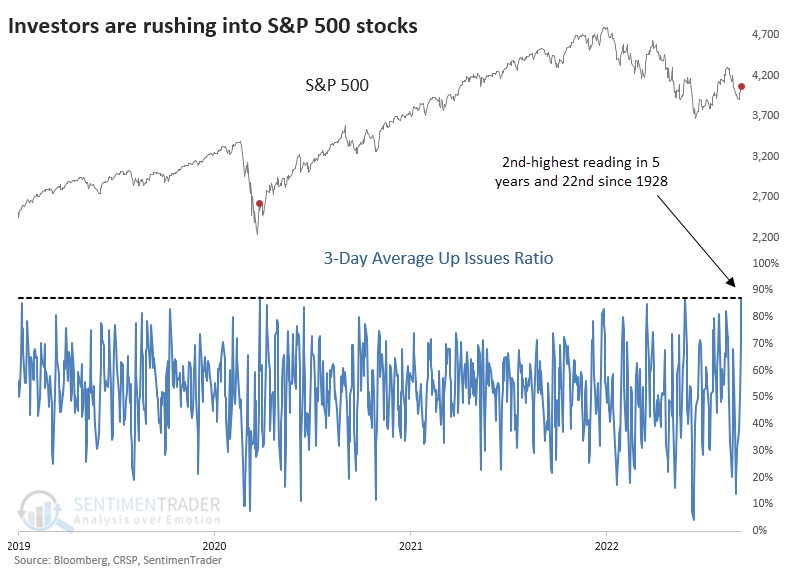
Since inception, there have been twenty unique times when the 3-day ratio of Up Issues in the S&P exceeded 87%. All but one of those dates witnessed the S&P rising over the next year.
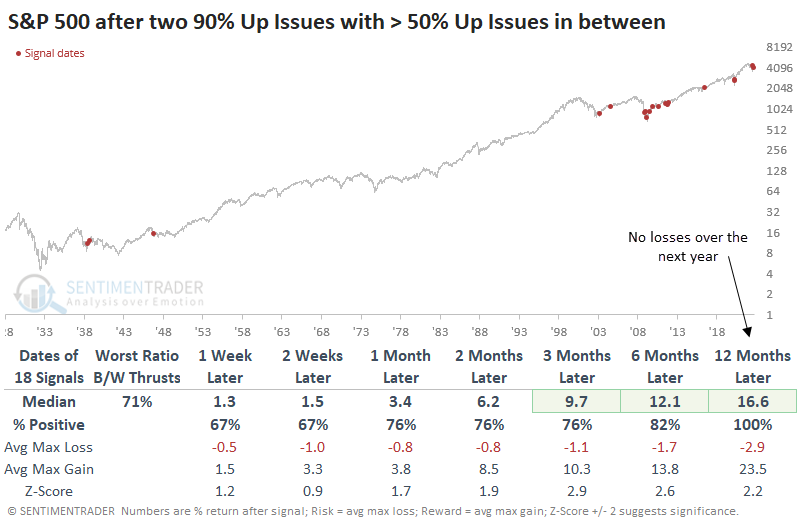
Perhaps even more remarkable is that more than 90% of stocks rose during two out of the past three sessions, and the intervening session on Thursday didn't see net selling pressure. Meaning that even when investors took a break, more stocks advanced than declined. After similar behavior, the S&P never declined during the following year.
Even on the broader NYSE, securities were surging
Dean noted that the internal participation from constituent members was impressive on Friday, especially on the New York Stock Exchange. On that exchange, volume flowing into advancing securities as a percentage of total volume exceeded 90%.
The lopsided volume has now occurred for the fourth time in two months. Historically, a cluster of 90% up volume days is bullish for the broad market as it represents overwhelming demand for stocks.
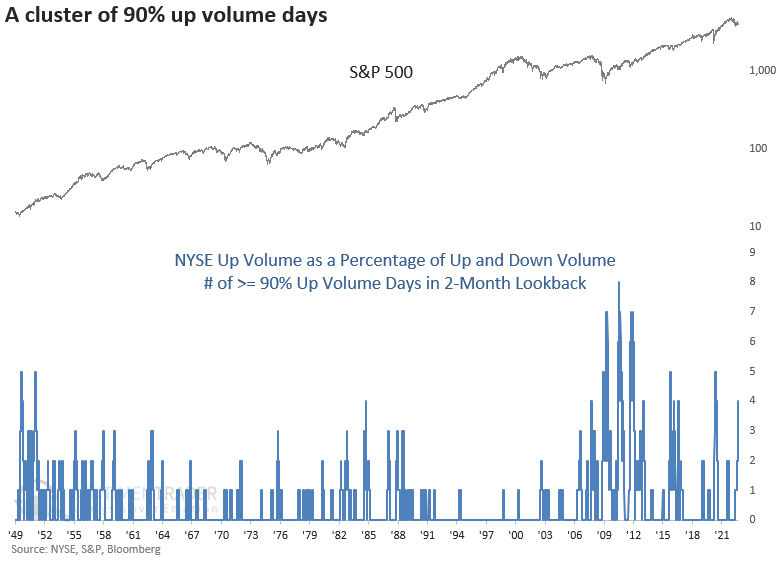
Other clusters of four NYSE up volume days of 90% in two months led to a bullish long-term outcome for the S&P 500. The only signal that didn't lead to positive six- and twelve-month returns was during the financial crisis.
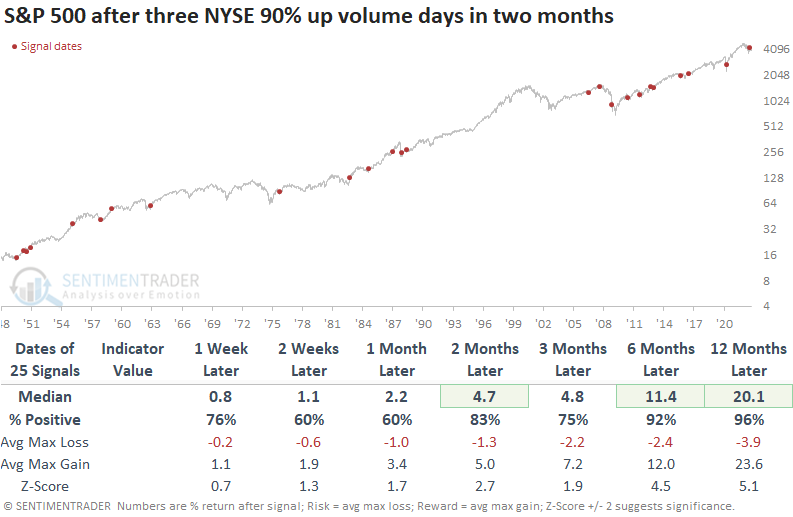
If we lower the threshold to three NYSE 90% up volume days in two months (instead of four), the sample size expands, and the results look even better. Drawdowns were minimal except for the couple that triggered during the global financial crisis.
Even a threshold of two NYSE 90% up volume days in two months looks impressive, with significance across all time frames.
But then a historic amount of selling pressure hit
Like other thrusts since December, though, this one landed with a splat.
Tuesday's reaction to the CPI release led to some of the worst selling pressure ever, with few stocks escaping the damage. This year has been littered with days when fewer than 5% of stocks in the S&P 500 managed to rise.
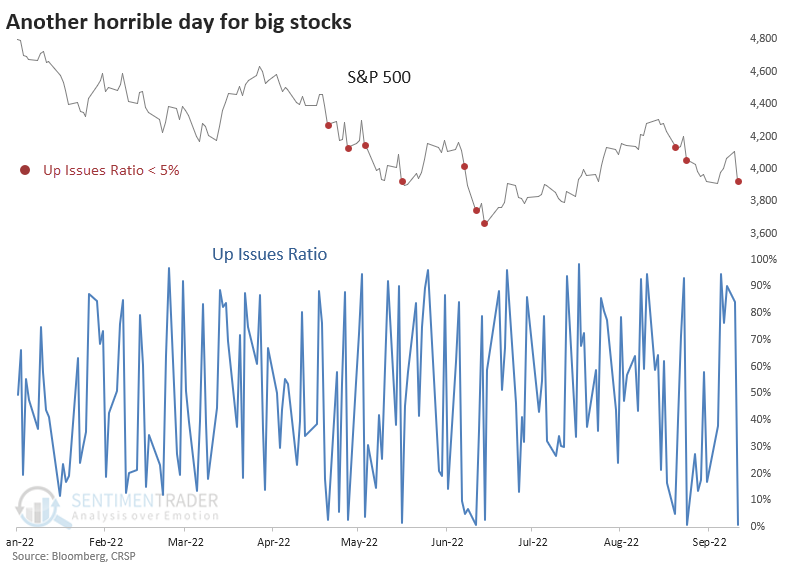
Selling pressure within the S&P was so overwhelming on Tuesday that fewer than 1% of stocks in the index advanced. That ranks among the worst days in its history.
What's most curious about this one is that few other times in history had breadth been so positive heading into a day with such overwhelming selling pressure. Through Monday, the 5-day average Up Issues Ratio on the S&P was 77%. The table below shows other times when the 5-day average was above 70%, and then those buyers got whacked with a day of overwhelming selling pressure.
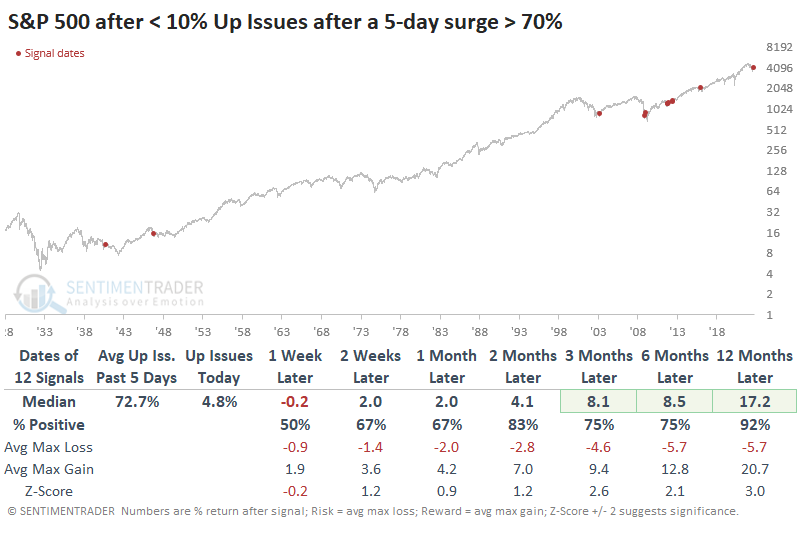
These bad reactions to what had been impressive thrusts did not necessarily negate the positivity. Over the next few months, the S&P rose almost every time, though some significant interim losses were mixed in there. Over the next year, only a signal in 1946 showed a (slight) loss.
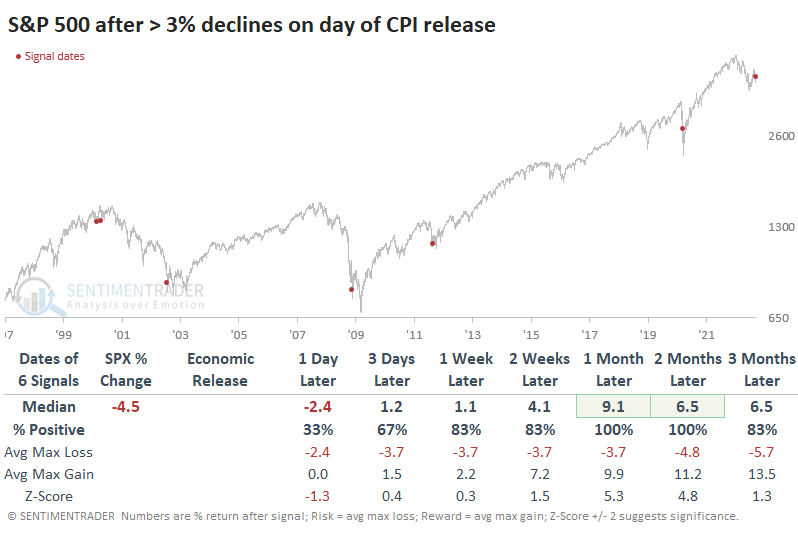
Unpleasant reactions to economic reports have not been reliable
Over the decades, we've often cautioned against reading too much into knee-jerk reactions to news events or economic releases. Time and time again, that initial move proves to be a fake-out, with investors stepping in after traders panic buy or sell.
After 3% or larger declines on the day of a major economic release, the S&P 500 tended to stay weak for a few days, then rebound, even though bad reactions tend to occur during the worst market environments.
Returns improve if we focus solely on bad reactions to the CPI report. Over the next one to two months, the S&P rebounded all six times.
The smart money seems to be betting on a bond rebound
Extremes in positioning among smart money commercial hedgers in stocks and commodities tend to generate a lot of attention, often for a good reason. Their positions in bonds tend to generate less interest, also for a good reason - they're not as reliable in that market.
Still, the latest readings in short- and intermediate-term Treasury notes are interesting - all are at extremes.
When we aggregate their positions in 2-, 5-, and 10-year Treasury note futures contracts, we see that hedgers are net long nearly 1.6 million contracts. That's the highest in several years and nearing that record from 2018.
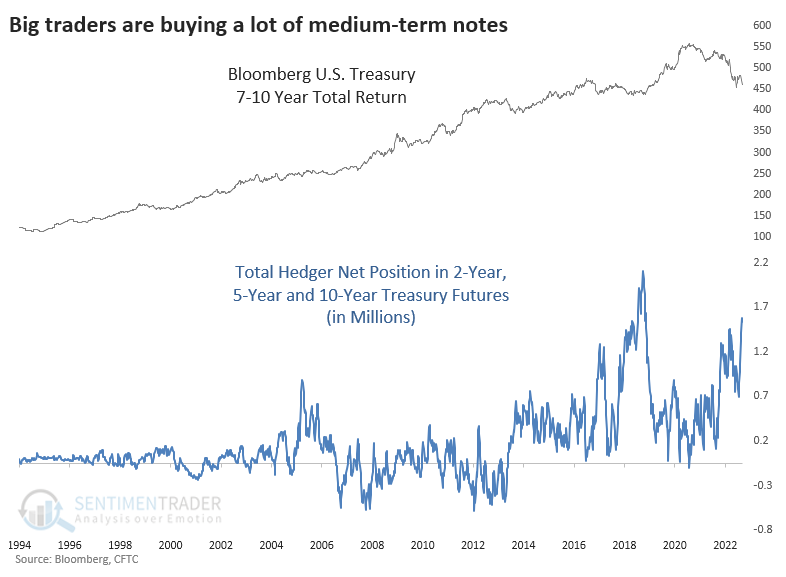
Since the positions have changed in magnitude over the years, it can be more effective to use a relative measure like the z-score. The z-score looks at the current reading versus the average and standard deviation over the past three years to determine how extreme the positions are relative to recent history.
Returns in the Bloomberg 7-10 Year Treasury Total Return Index after extremes like we're seeing now were mostly negative short-term and mostly positive in the medium- to long-term.
Hedgers take the opposite side of speculators, which means the latter is heavily short Treasuries. And it's hard to blame them given recent trends. The one-year drawdown in 2-year Treasury futures is nearing a 30-year extreme at -6%. In 5-year notes, the drawdown is about twice as severe and is the 2nd-worst on record. There is more history for 10-year note futures, and while the drawdown is a bit more extreme than in 5-year notes, there were several other precedents. Again, there was a secular bull market this entire time, so they all ultimately served as good buying opportunities.
When we average the drawdowns in 2-, 5-, and 10-year Treasury note futures, it's just beyond -10%. That's on par with 1994 but less extreme than 2000.
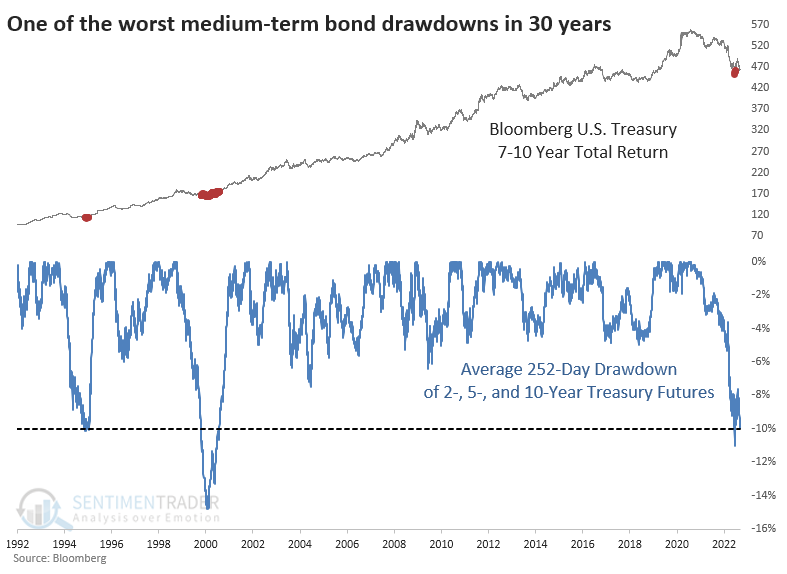
Positioning in note futures is one-sided, which suggests a possible short-covering rally in the months ahead. The problem is that the data isn't terribly reliable, and extremes haven't worked so well this year. More than anything, the performance and positions suggest that those betting on a further drop in bonds (and rise in rates) should be careful pressing those bets.
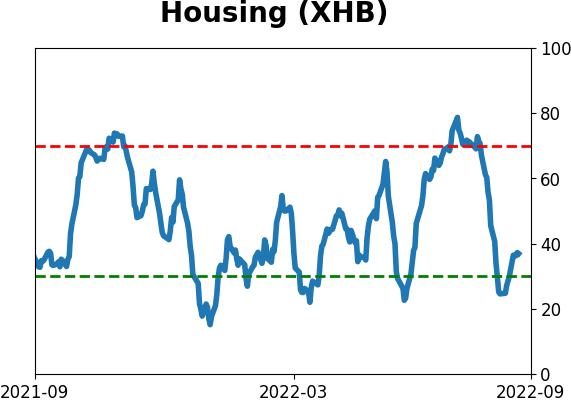
Homebuilders are about to have a headwind
The homebuilders' sector has a history of moving in a highly cyclical fashion. Jay showed that sitting out this sector during seasonally unfavorable periods can allow investors to avoid downside volatility. The weakest period of the year begins in mid-September and will last until late November.
The chart below shows the annual seasonal trend for the SPDR S&P Homebuilders ETF (XHB). The green and red boxes highlight alternating favorable and unfavorable seasonal periods, respectively.
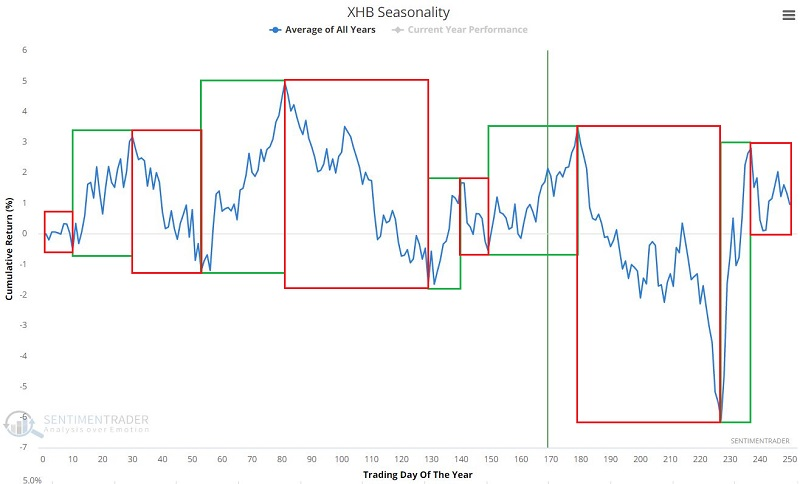
The five unfavorable periods for XHB are:
- TDY #30 through TDY #53
- TDY #81 through TDY #131
- TDY #140 through TDY #149
- TDY #179 through TDY #227
- TDY #237 through TDY #10 of the following year
The next unfavorable period - historically the weakest period of the year - starts on September 19 and ends on November 25.
From 2006 through 2022 (so far), the cumulative loss during the red box unfavorable periods was -94% versus +55% for a buy-and-hold approach.
To get a better sense of results since 2008, the chart below displays the cumulative return during the red box unfavorable periods starting in January 2009 through the present.
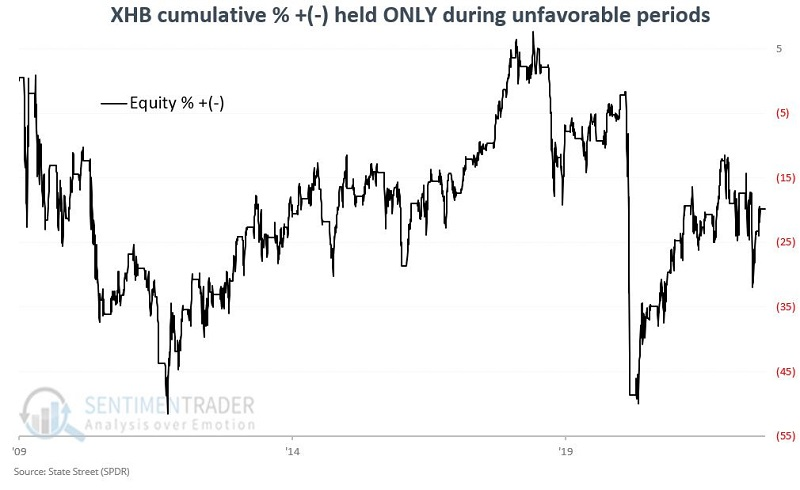
While post-2008 results are not nearly as awful as 2006-2008, an investor still could have avoided a great deal of downside volatility (and a cumulative -19.8% net loss) by not holding homebuilders during unfavorable periods post-2008.
Natural gas, however, is getting a tailwind
Jay noted that natural gas also has a history of moving in a highly cyclical fashion. Being aware of the current seasonal status can help keep traders on the right side of this volatile market. The strongest seasonal period of the year begins in mid-September and will last until late October.
The chart below shows the annual seasonal trend for natural gas futures. The green and red boxes highlight alternating favorable and unfavorable seasonal periods. There are two favorable periods (green boxes) and two unfavorable periods (red boxes).
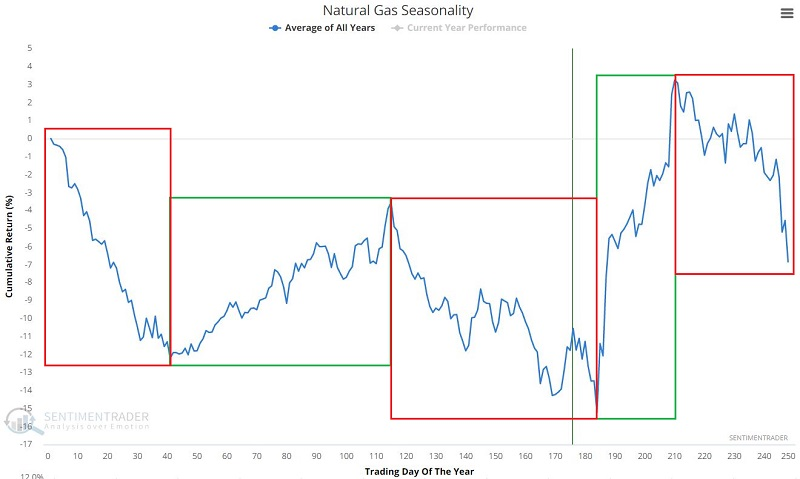
In the tests below, each period is referenced by its "Trading Days of the Year" (or TDY for short). Each period begins or ends at the close of trading for the TDY referenced. Our data counts any day on which electronic trading occurs.
The two favorable periods for natural gas are:
- TDY #41 through TDY #115
- TDY #184 through TDY #210
The next favorable period - historically, the strongest period of the year - starts on 2022-09-16 and ends on 2022-10-24. The chart below displays the cumulative $ loss for natural gas futures held long only during this period each year.
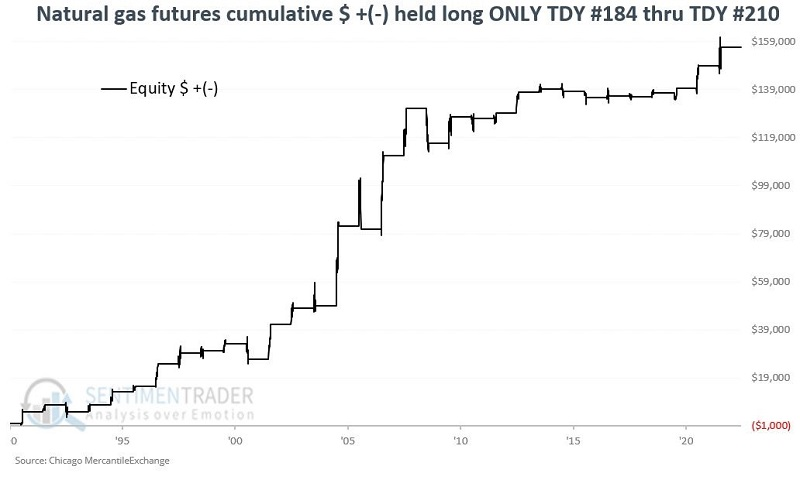
These stretches showed a gain 24 times and a loss only 8 times. The average, median, and maximum gains were all more than twice as large as the average, median, and maximum declines.
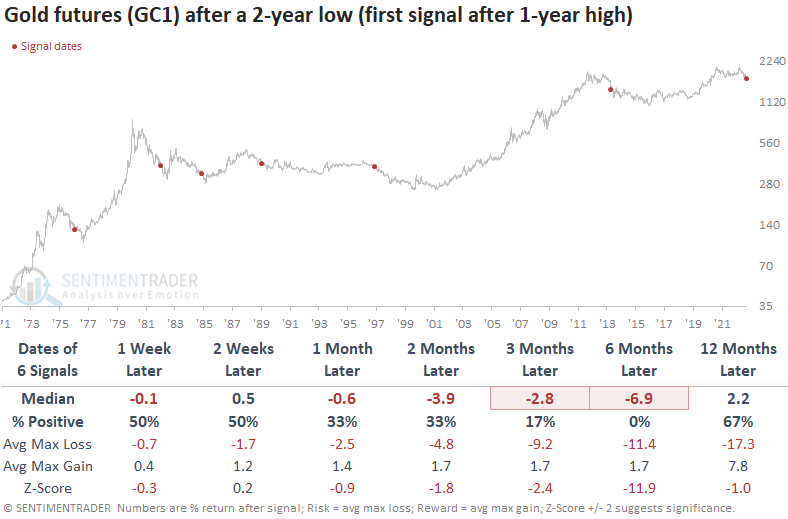
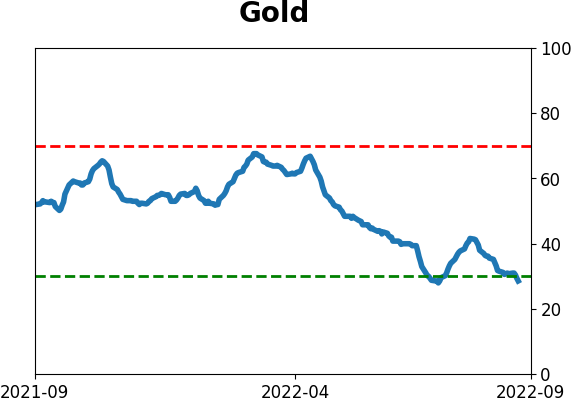
Gold has formed a double top
Gold futures closed at a new 2-year low on Thursday. Dean noted that the low is the first occurrence after a 1-year high and confirms a bearish price pattern known as a double top.
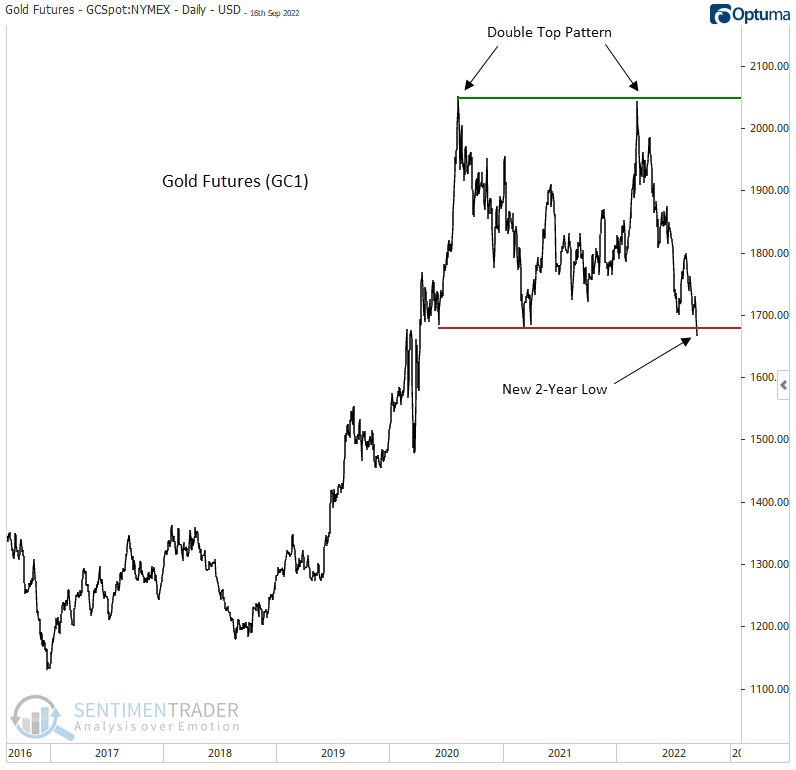
The first two-year low in gold futures after a 1-year high does not bode well for the shiny metal. Returns, win rates and z-scores look unfavorable across most short and medium-term time frames. Six months later, gold was lower 100% of the time.
Gold miners don't look much better with flat to negative returns across short and medium-term time frames. The 1976 signal is the only time the miners traded higher across all periods.
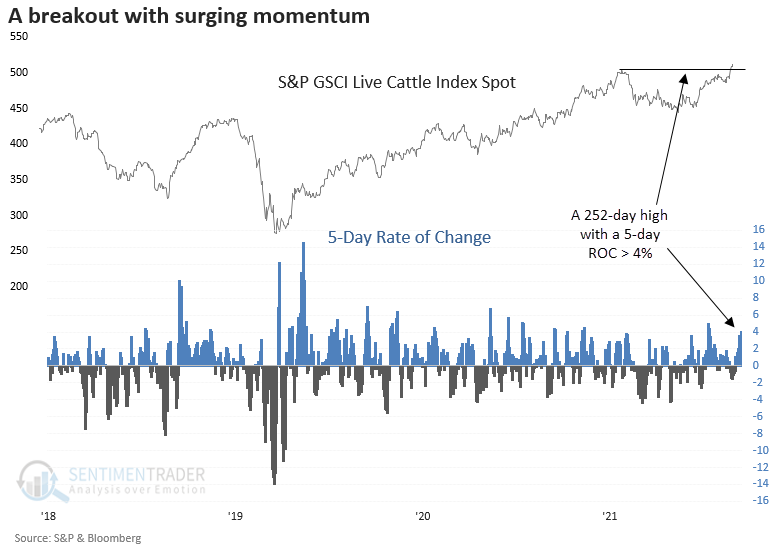
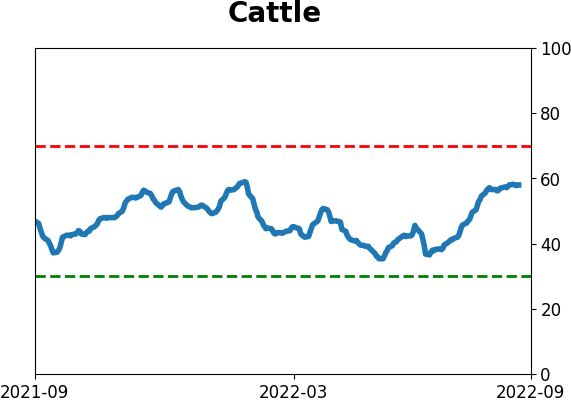
Live cattle prices have been heading to the mooooon
Live cattle are full-grown cattle that get slaughtered for meat and other products when they reach a certain weight. Dean showed that spot prices for them closed at a new high this week on solid short-term momentum.
While the 1-month time frame suggests the recent momentum could continue in the near term, a longer-term view looks unfavorable, especially the six-month window. Between 1979 and 2008, the six-month time frame showed a loss in 15 consecutive instances.
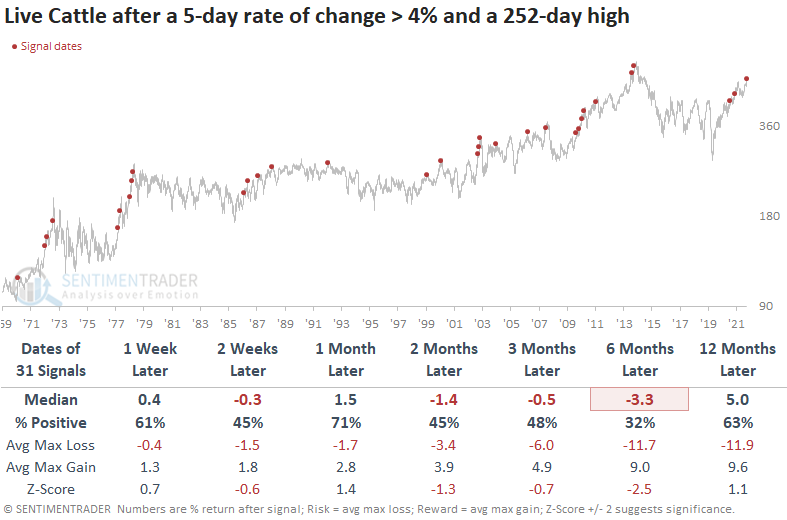
A sustained uptrend, whereby the two-year rolling return exceeds 66%, is extremely rare, with only two other instances since 1971. In both cases, the momentum continued in the near term. However, cattle closed lower at some point over the next three to six months.
For those in the U.S., one of the purest plays on this index is the iPath Series B Bloomberg Livestock Subindex Total Return ETN (COW). This is not a comment on the acceptability of COW as a trading or investment vehicle; rather it's simply to note that it is one of the few ways for non-futures traders to bet on or against livestock prices.
About TradingEdge Weekly...
The goal of TradingEdge Weekly is to summarize the research published to SentimenTrader over the past week. Sometimes there is a lot to digest and this summary is meant to highlight the highest conviction or most compelling ideas we discussed. This is NOT the full research that's published, rather it pulls out some of the most relevant parts. It includes links to the published research for convenience; if you don't subscribe to those products it will present the options for access.
Indicators at Extremes
|
|
|
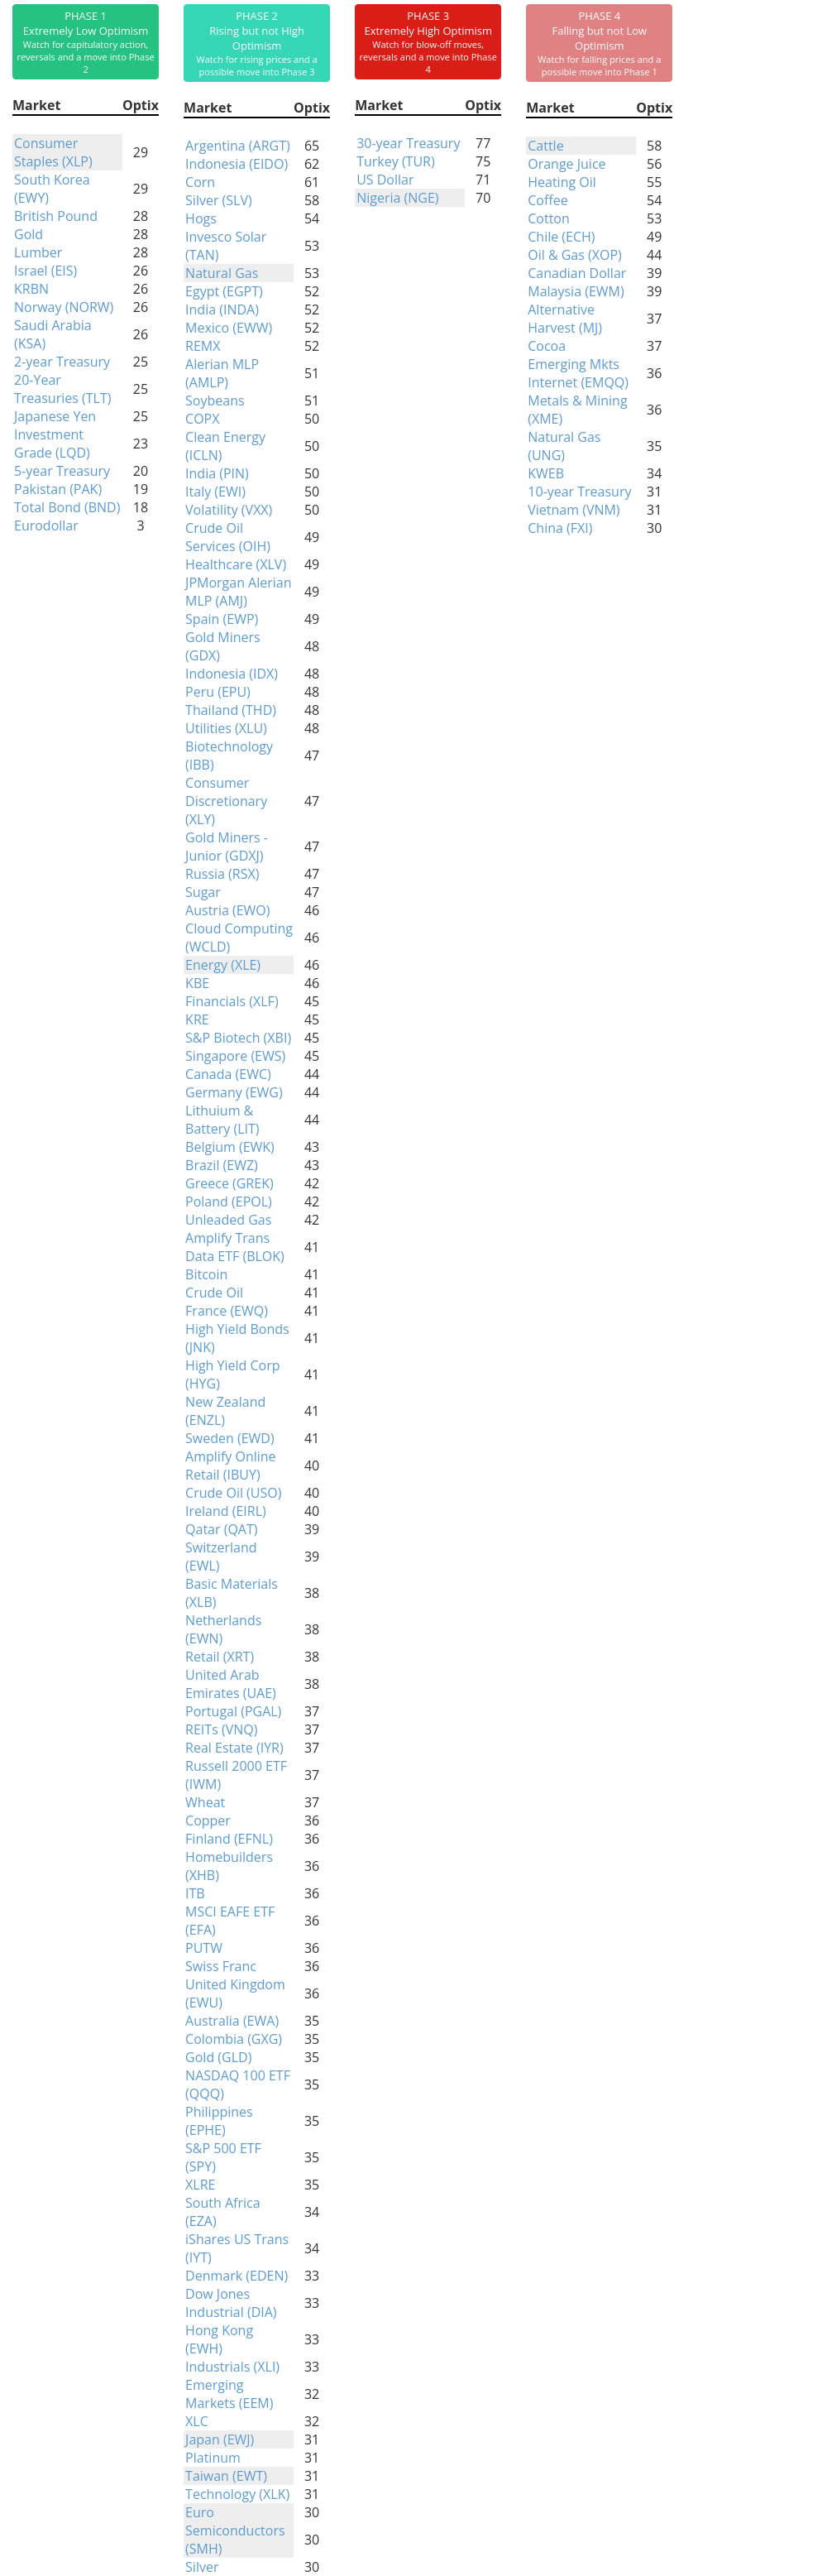
Phase Table
|
|
|
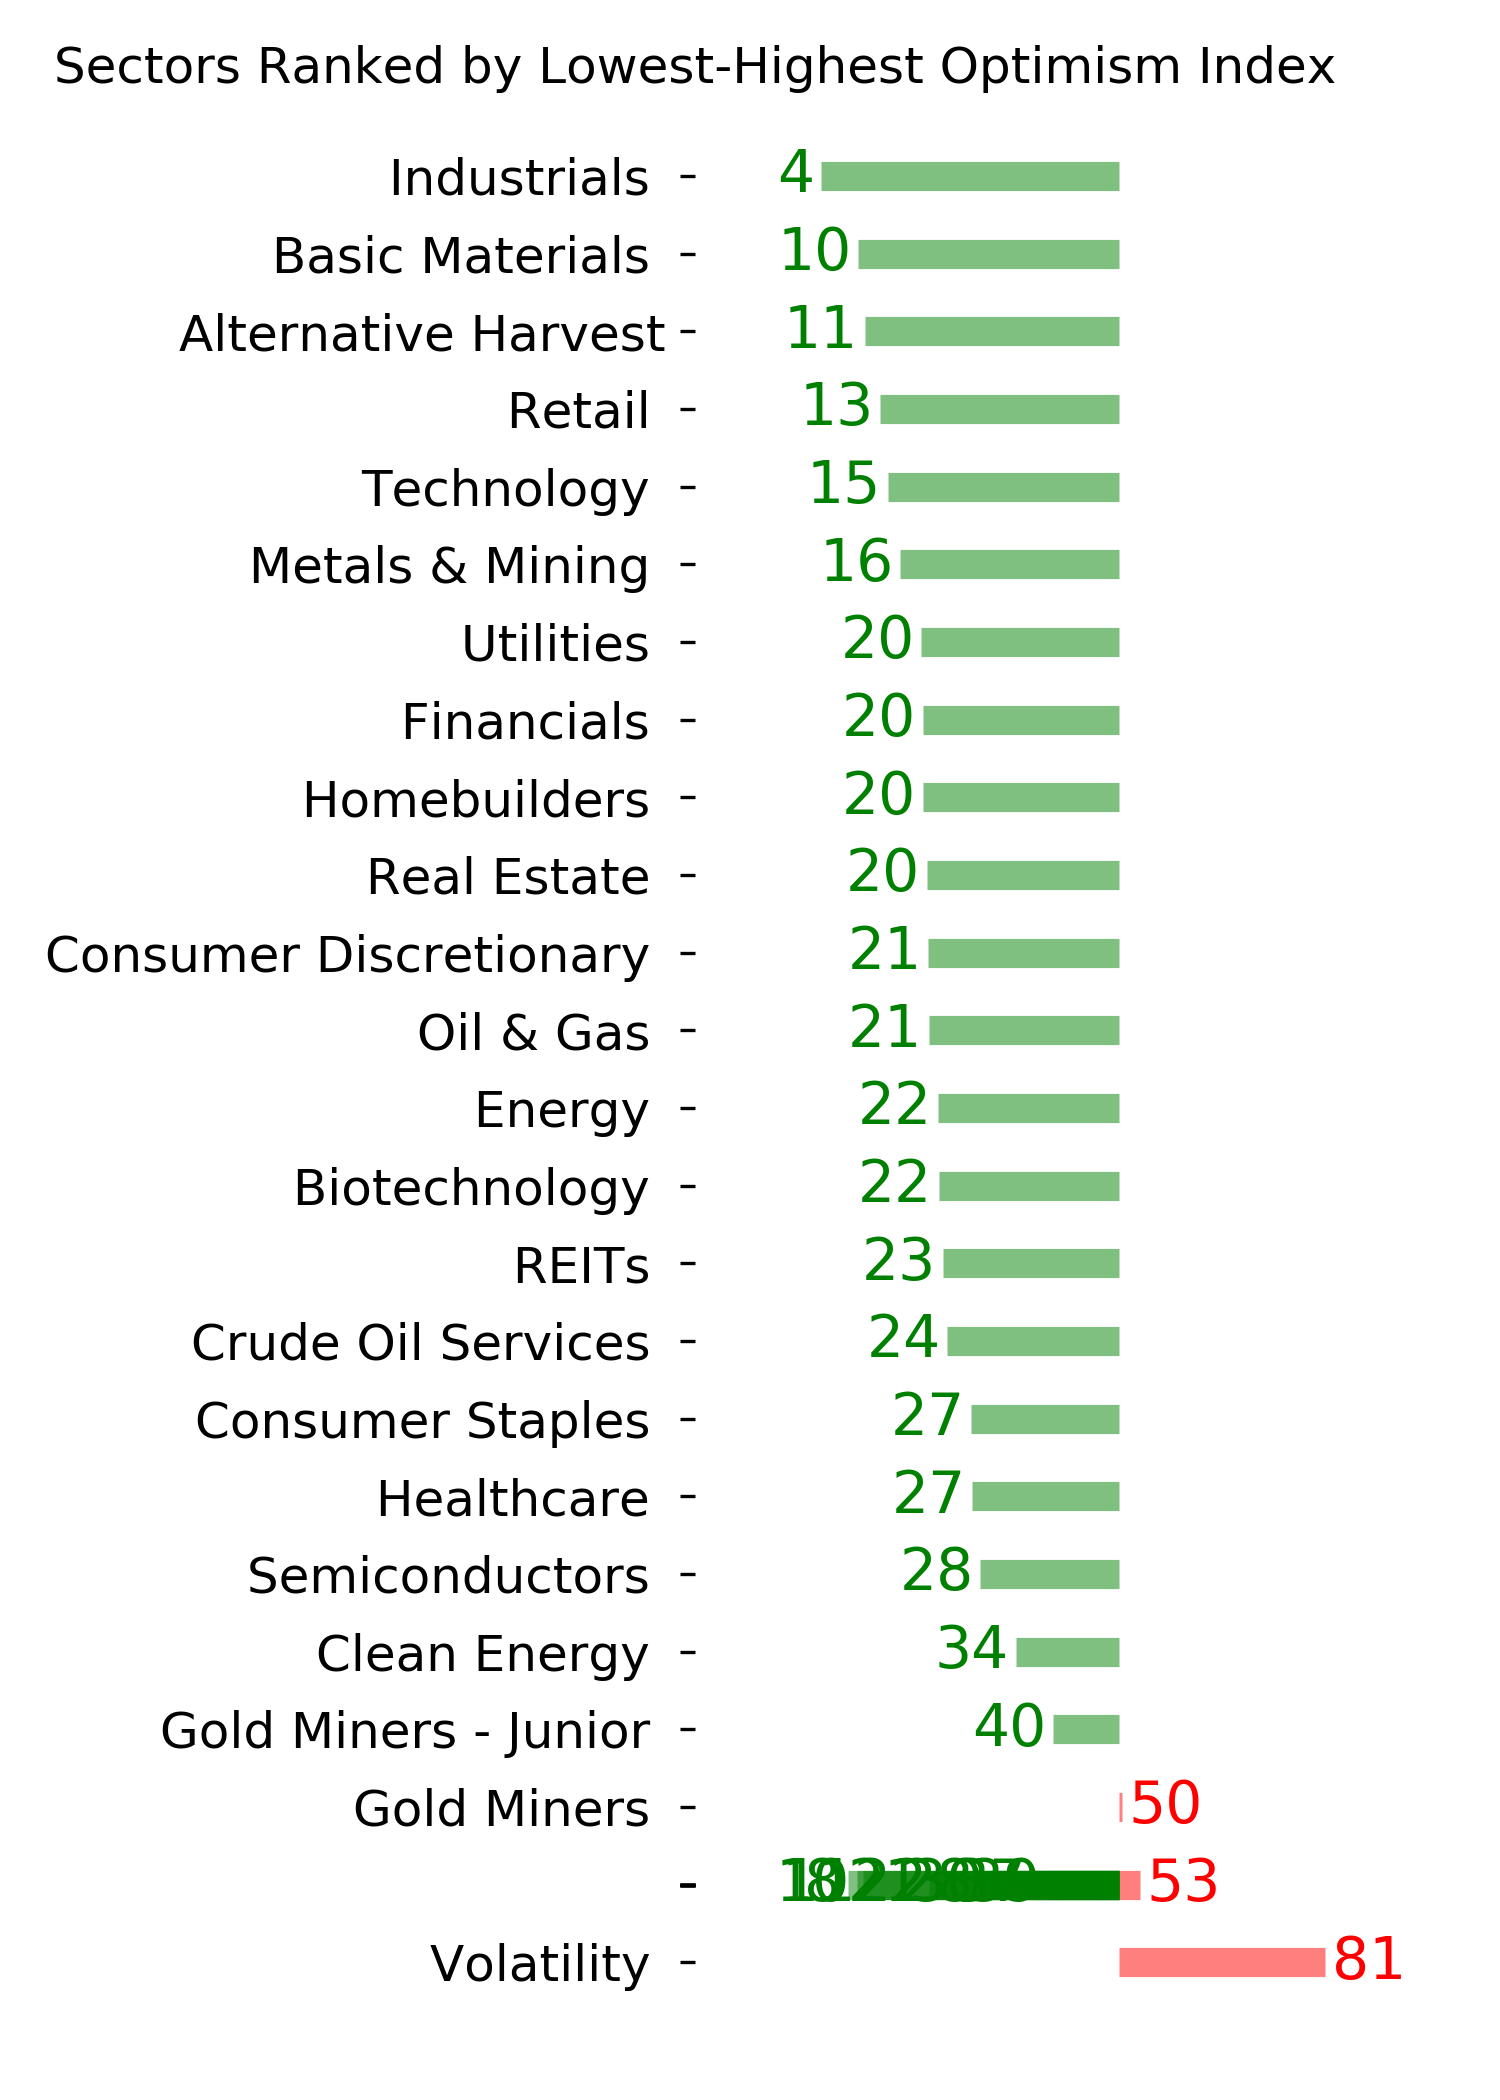
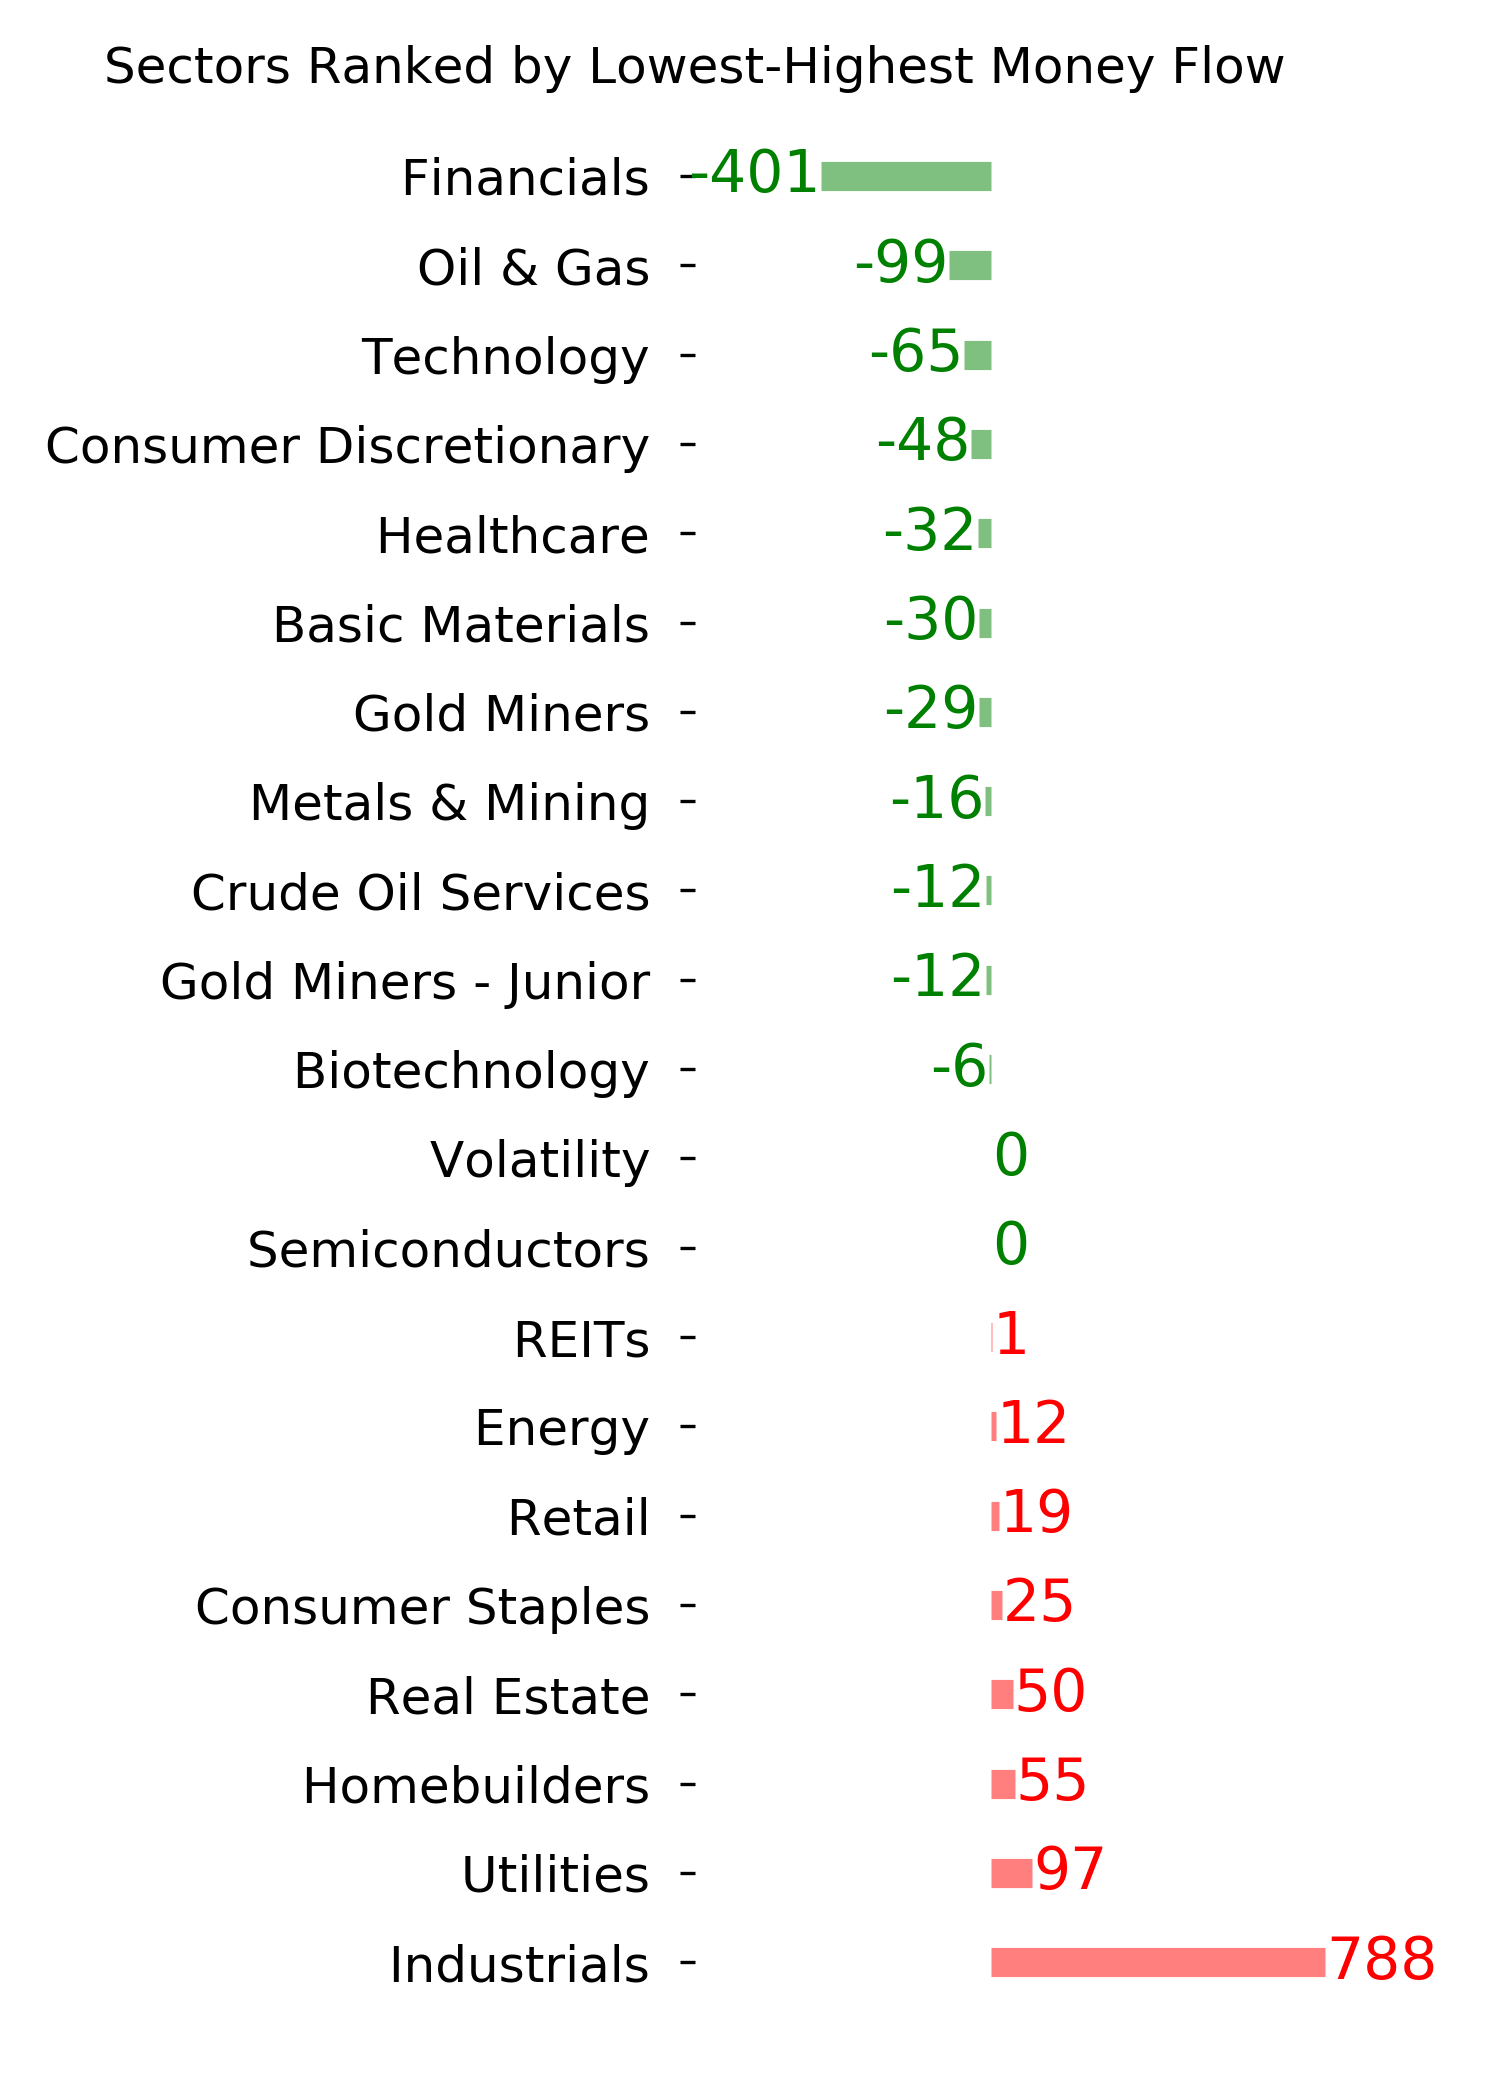
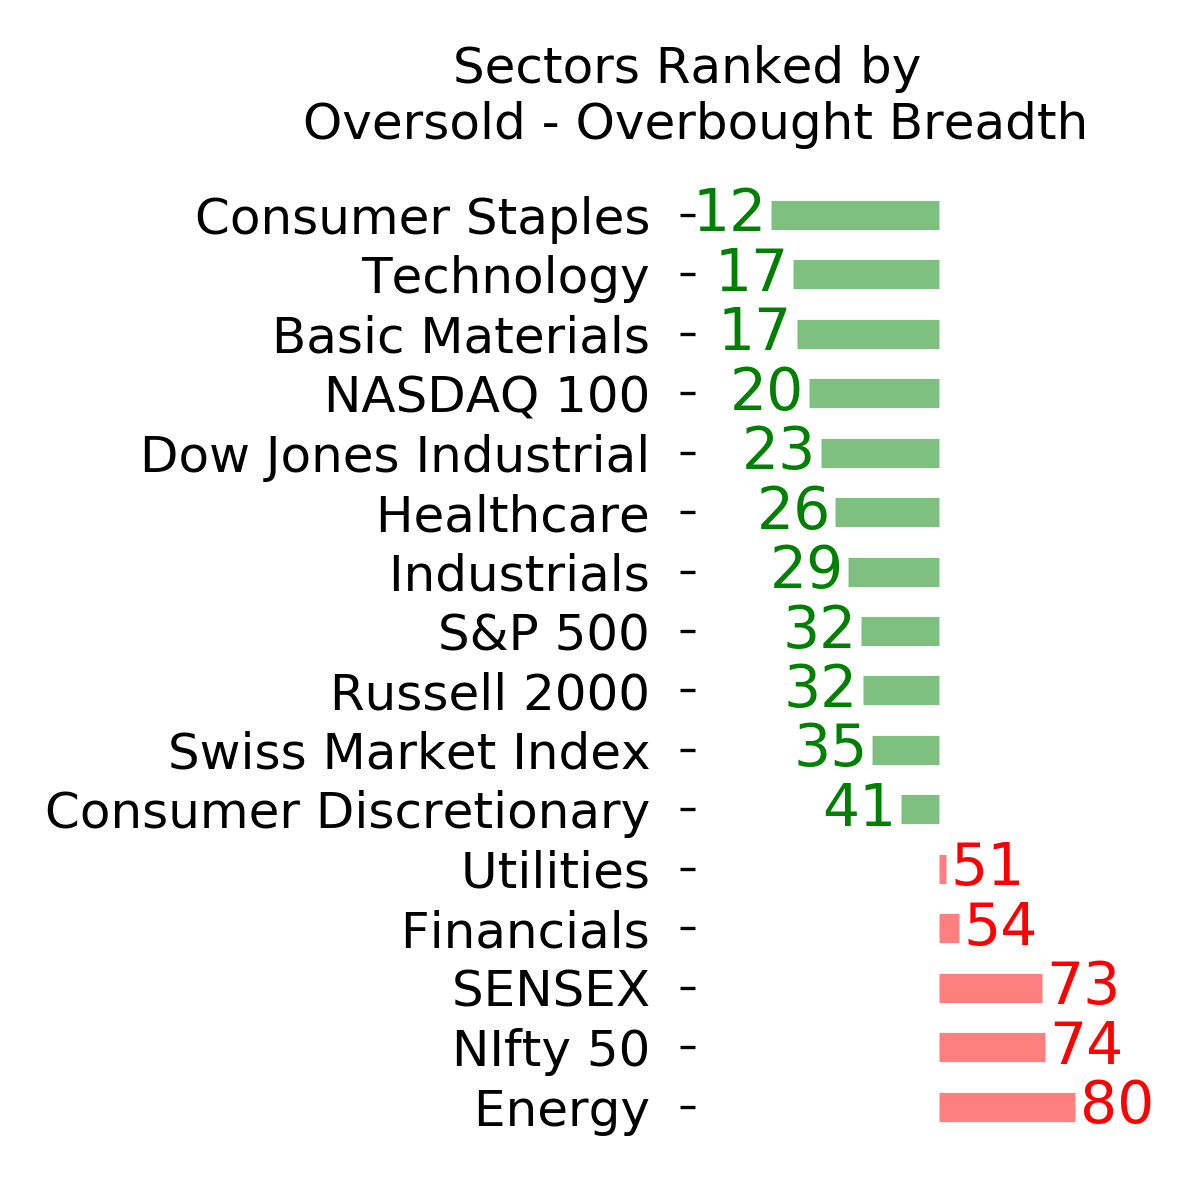
Ranks
|
|
|
|
|
|
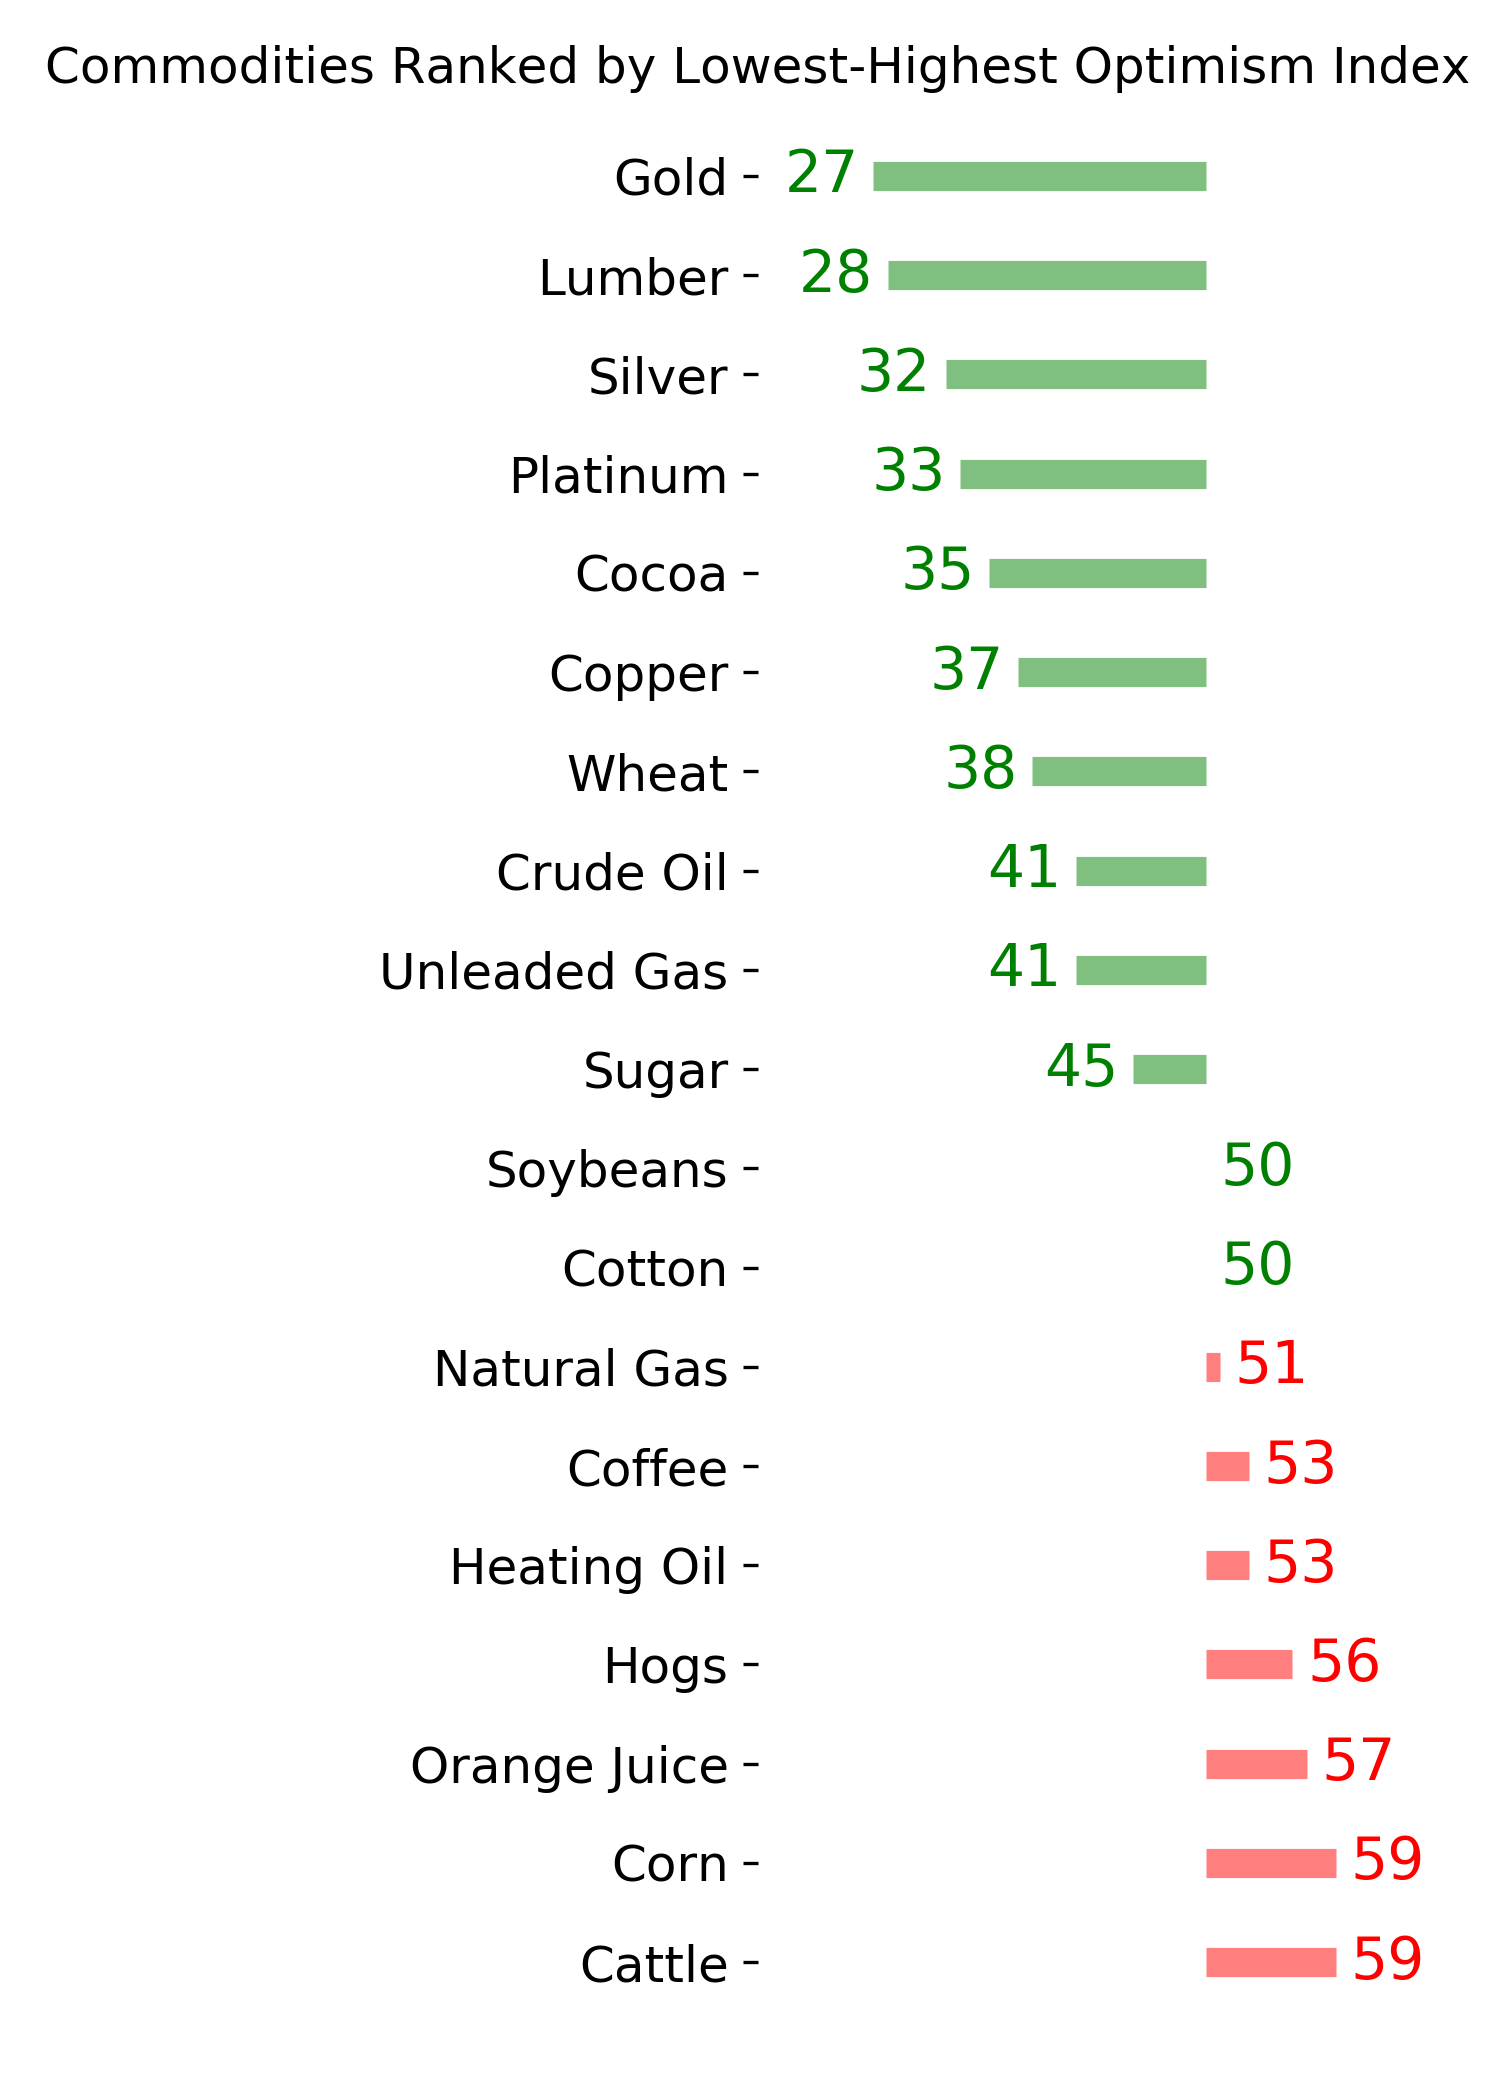
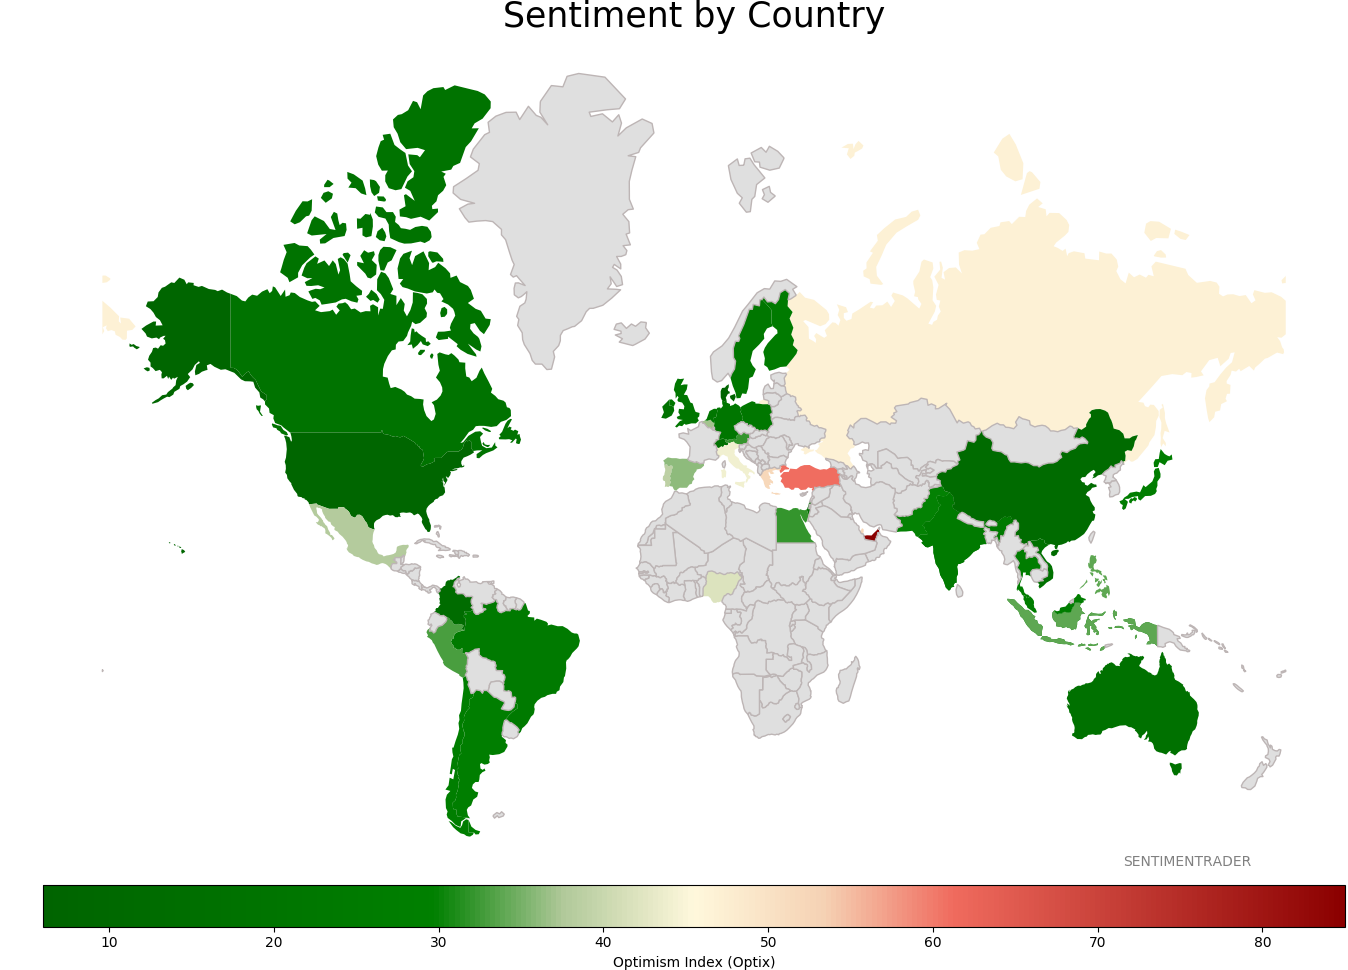
Sentiment Around The World
|
|
|
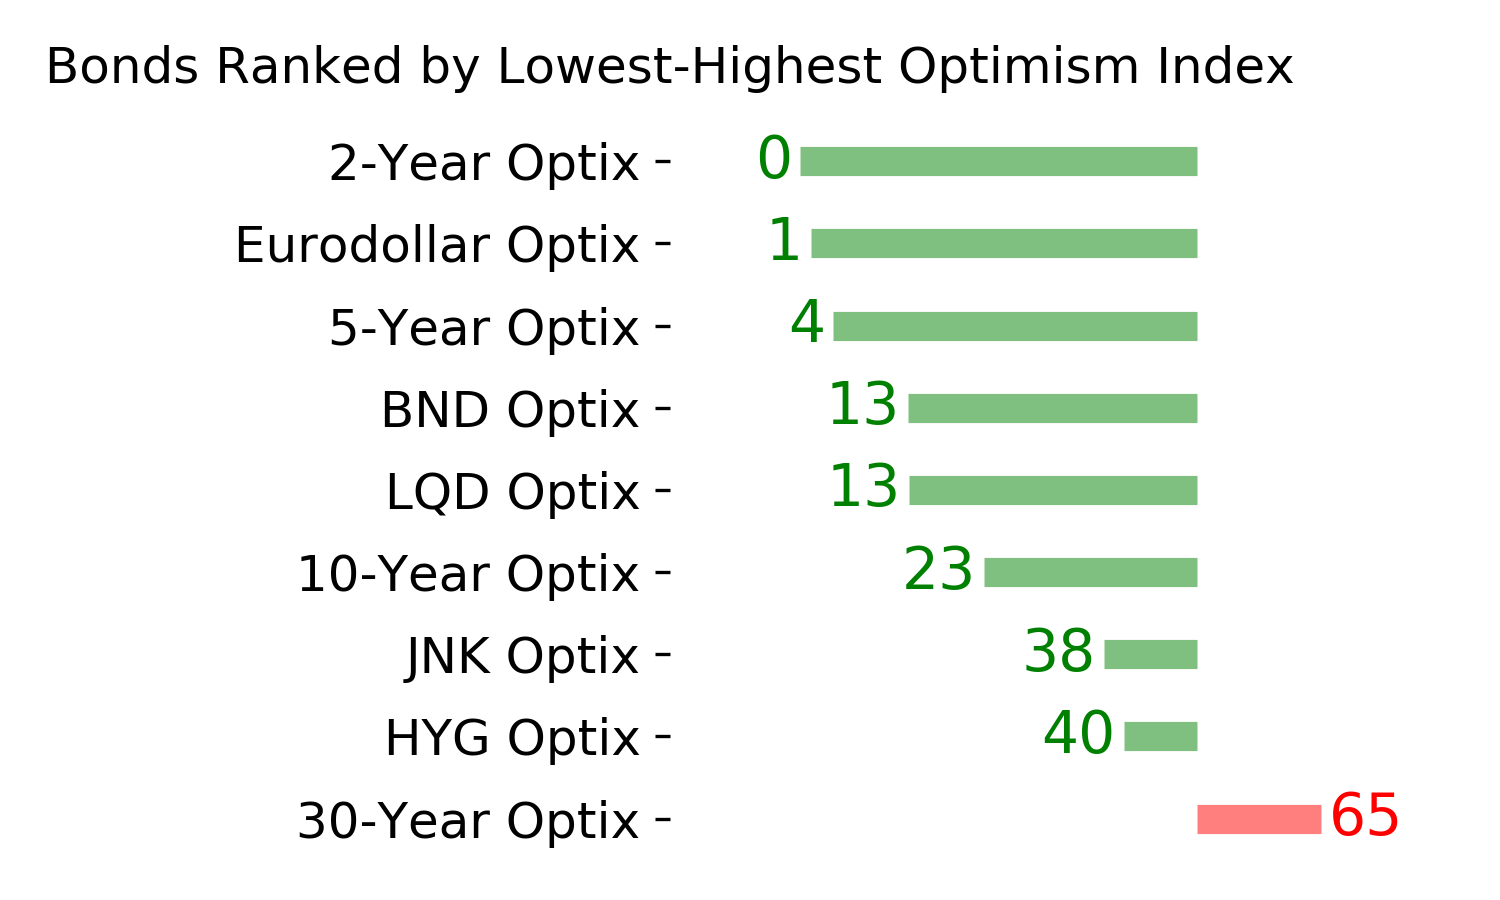
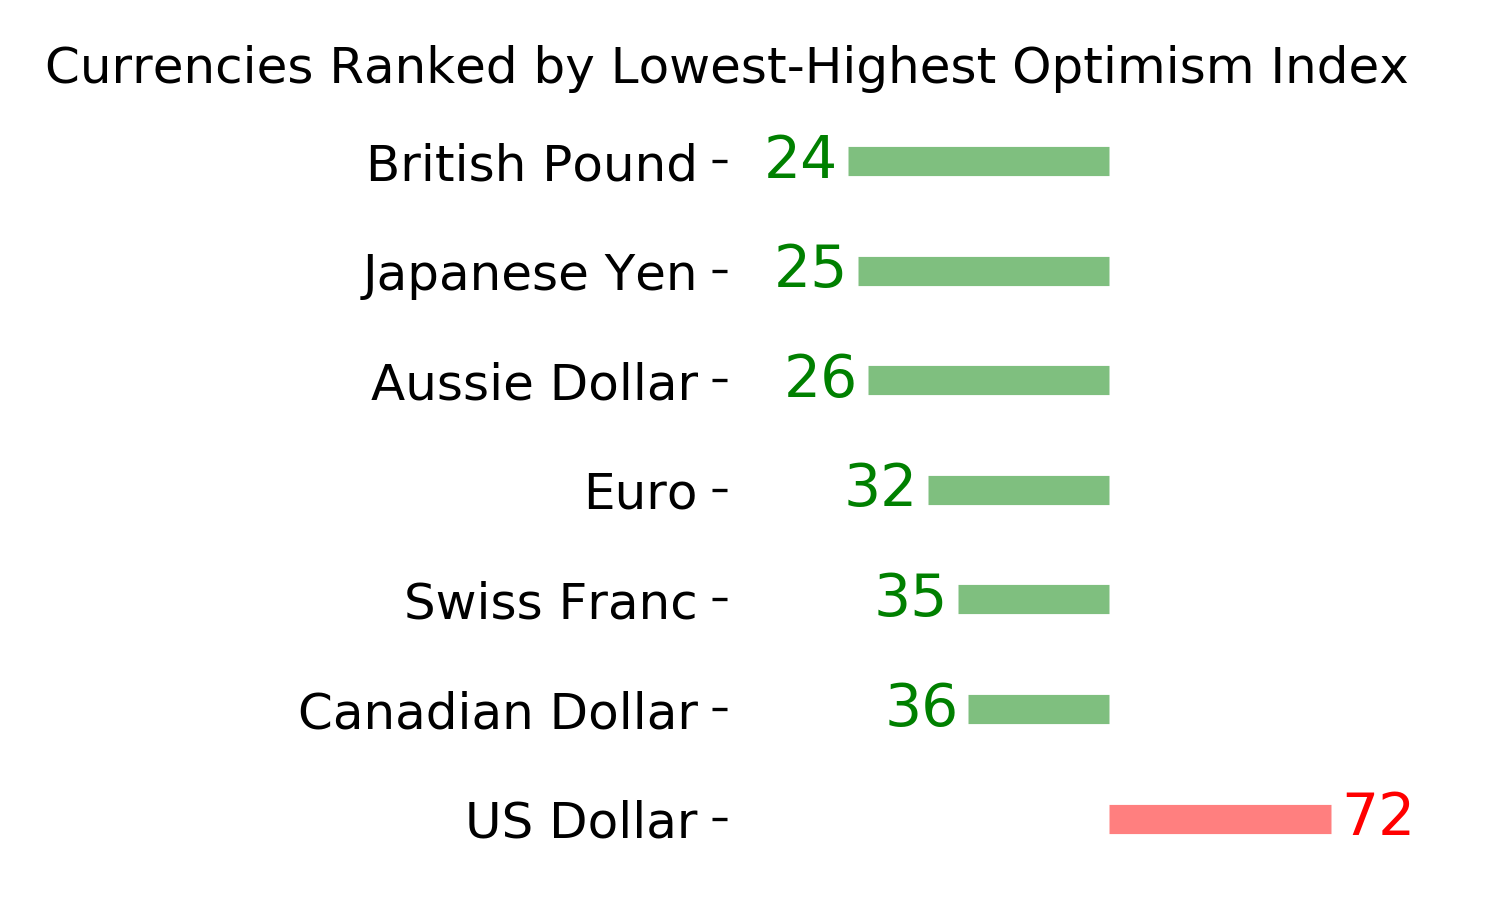
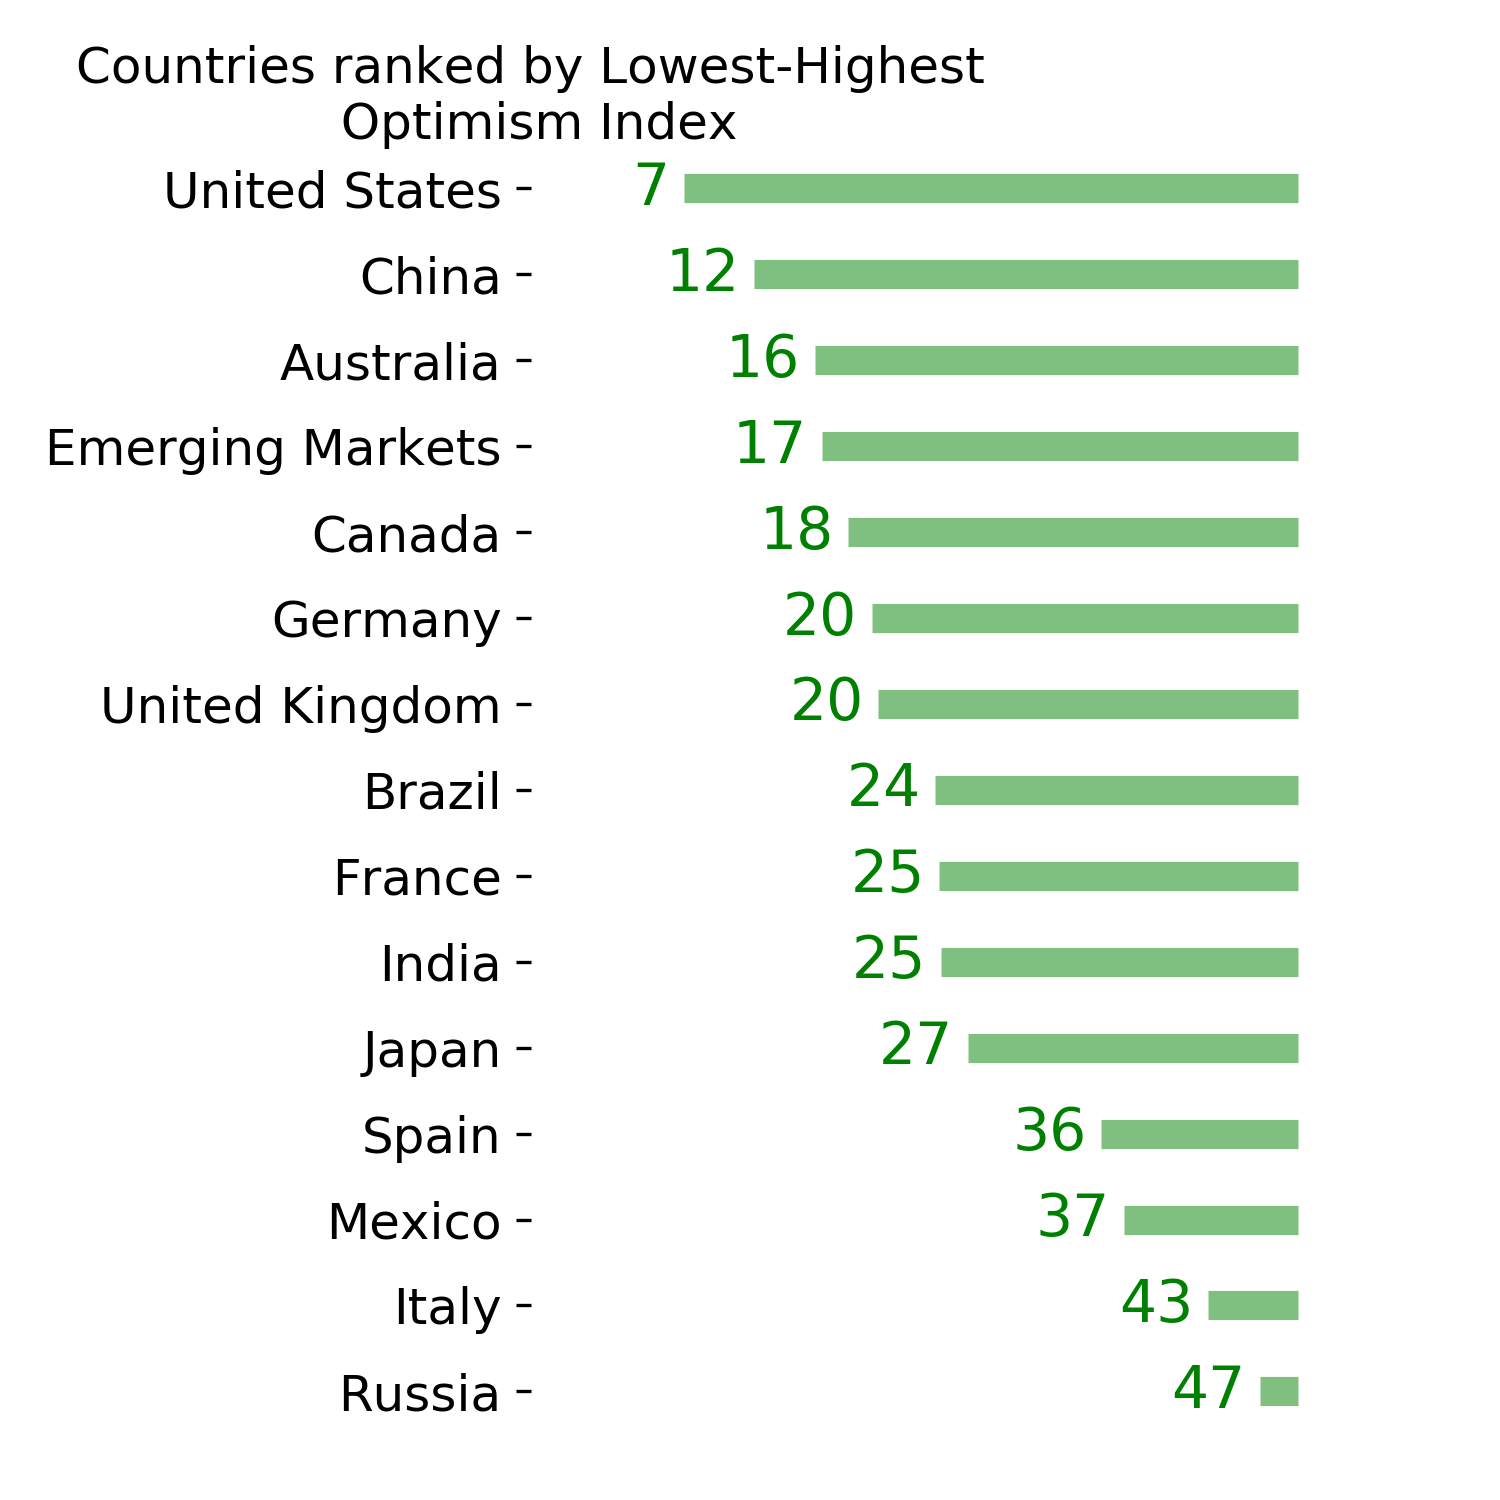
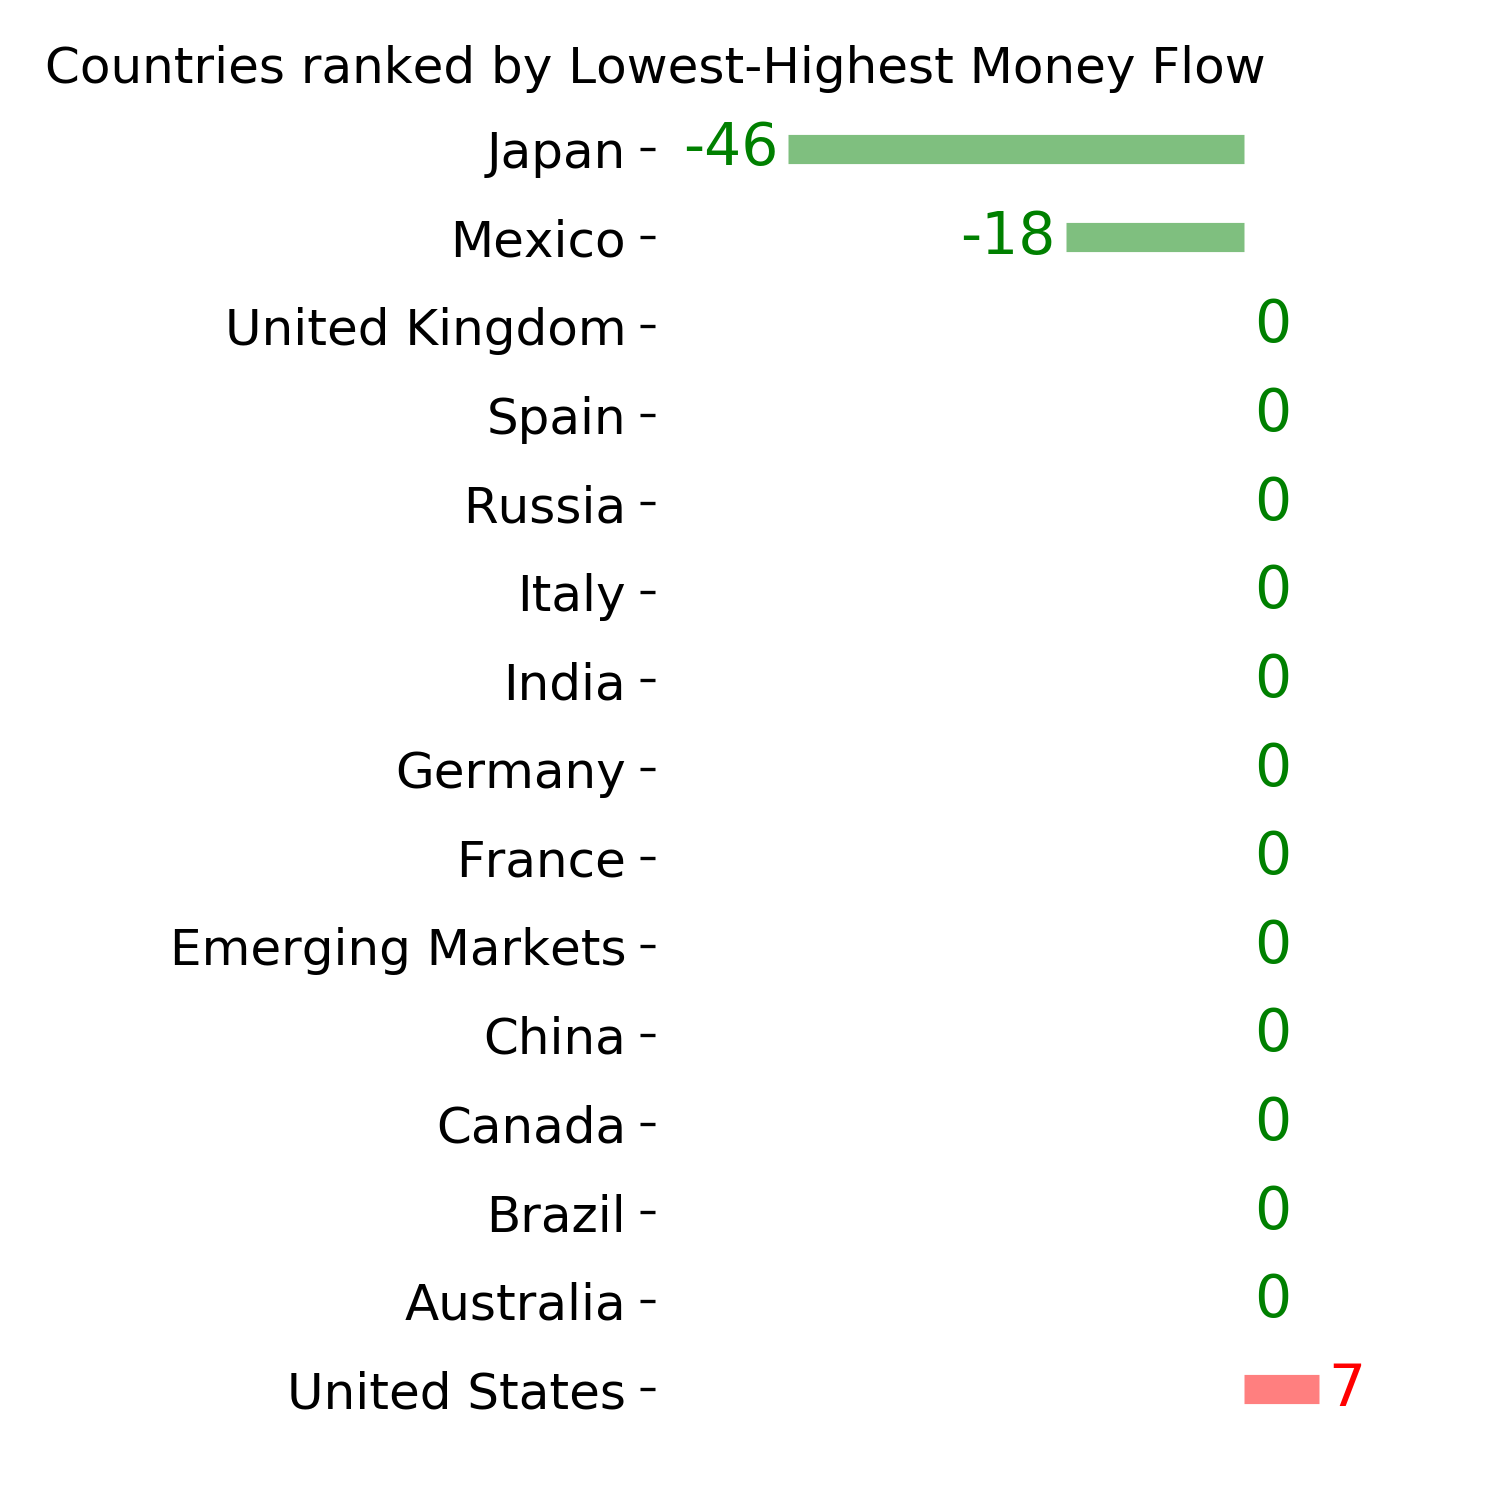
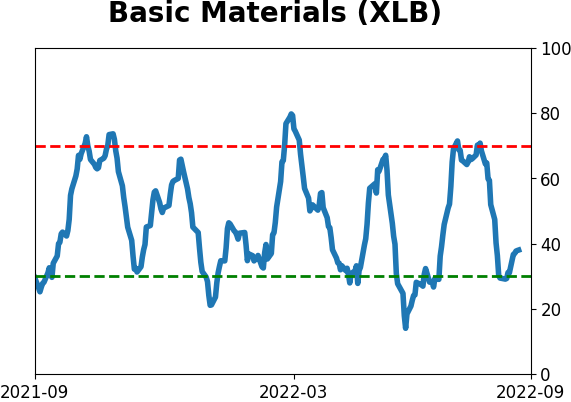
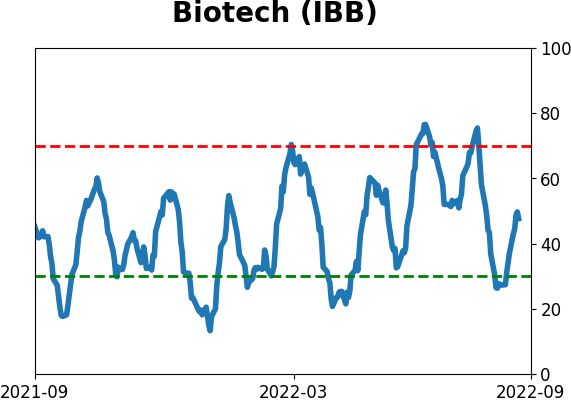
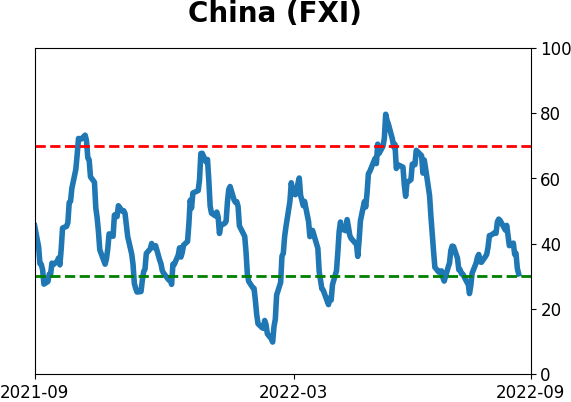
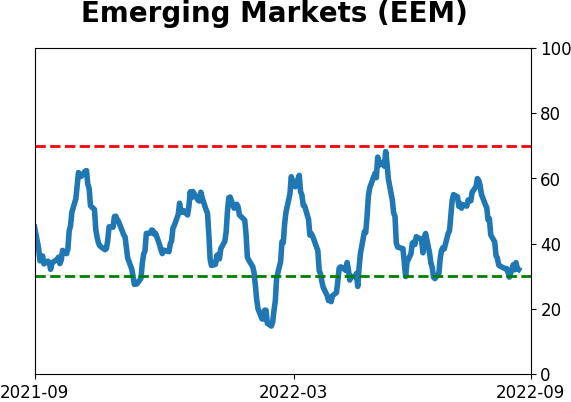
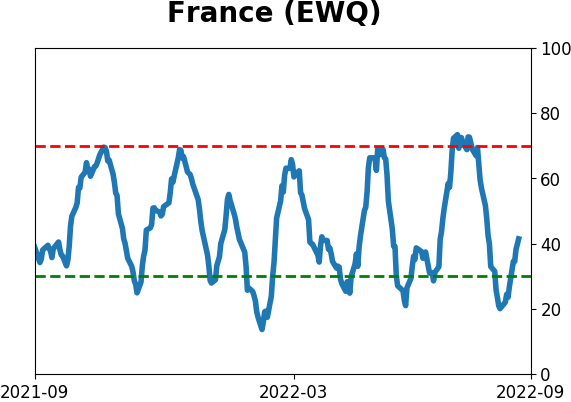
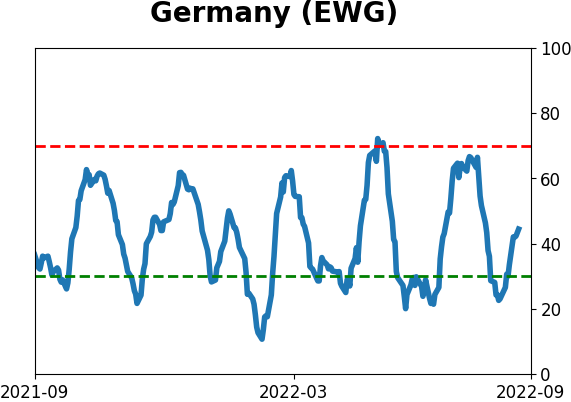
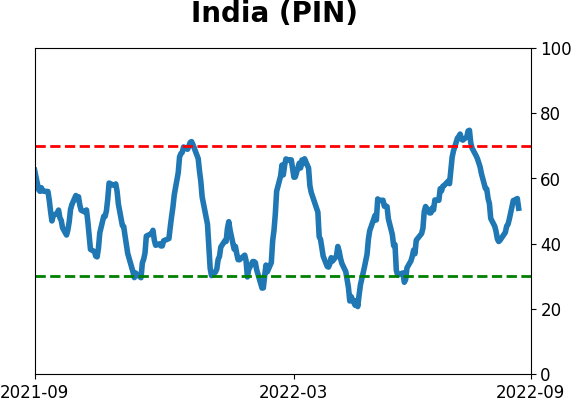
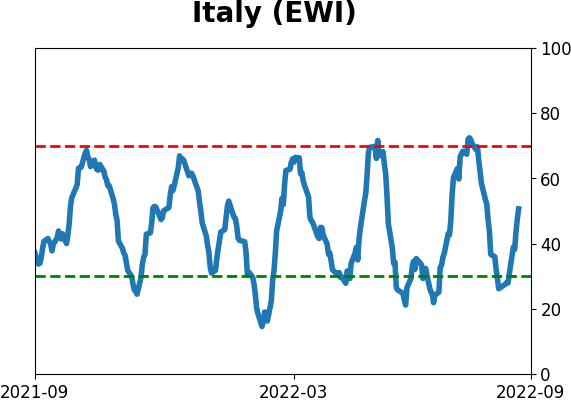
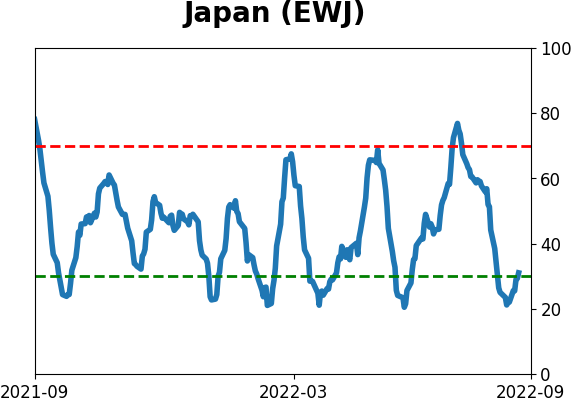
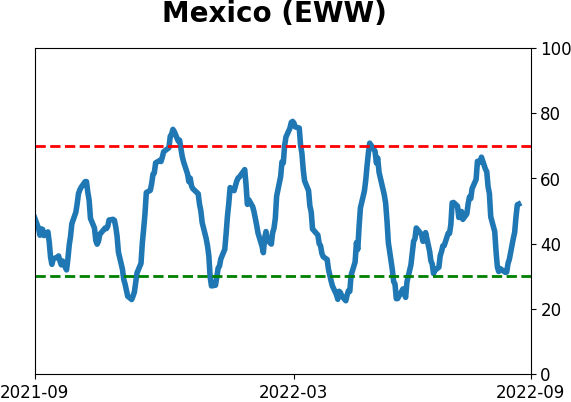
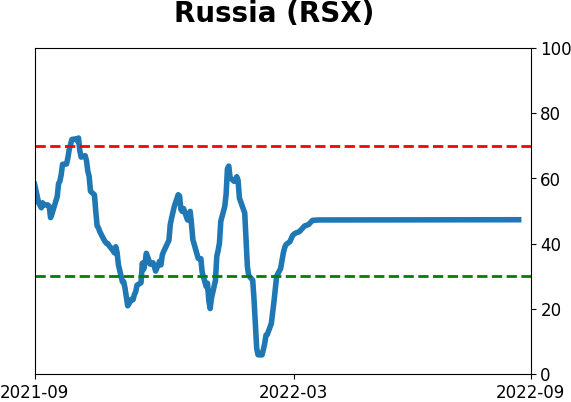
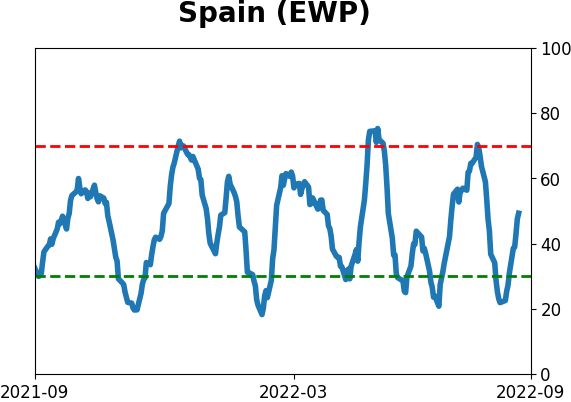
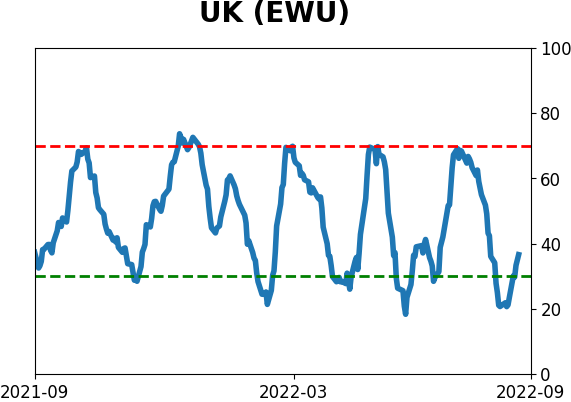
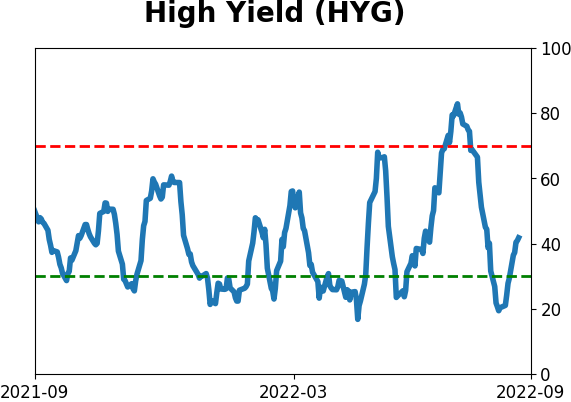
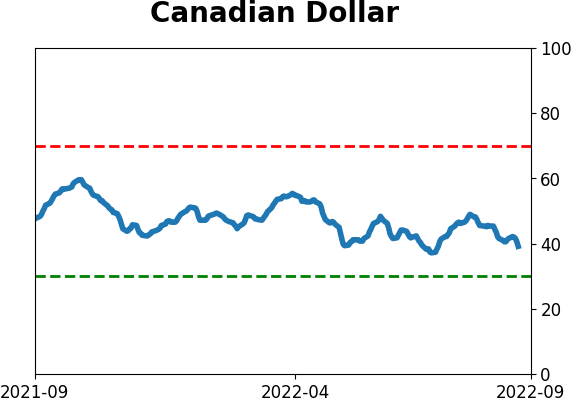
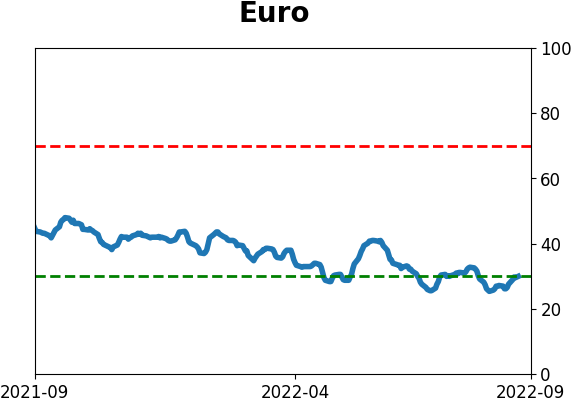
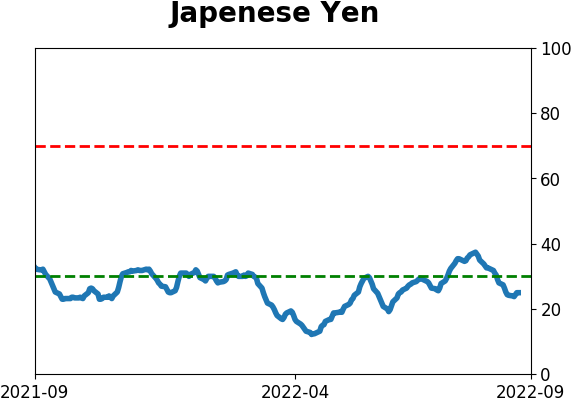
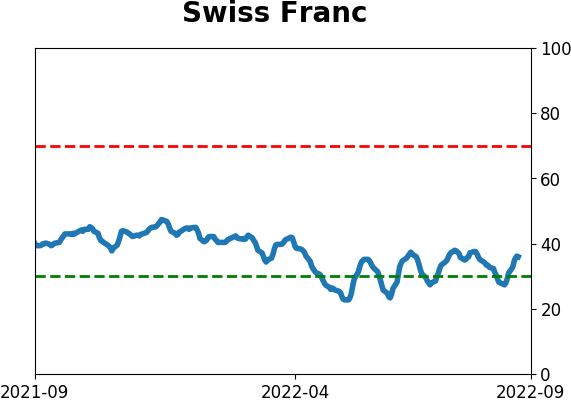
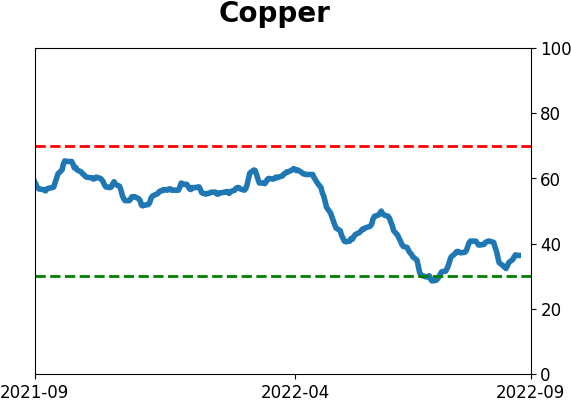
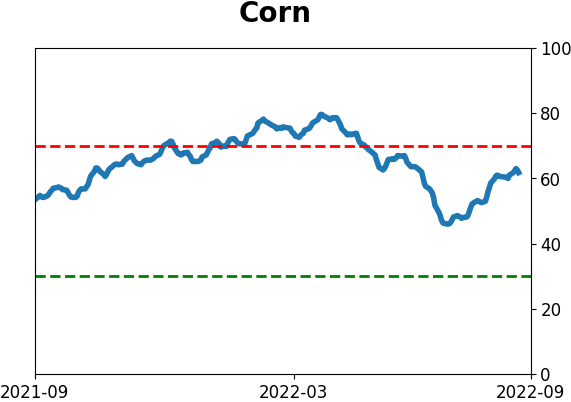
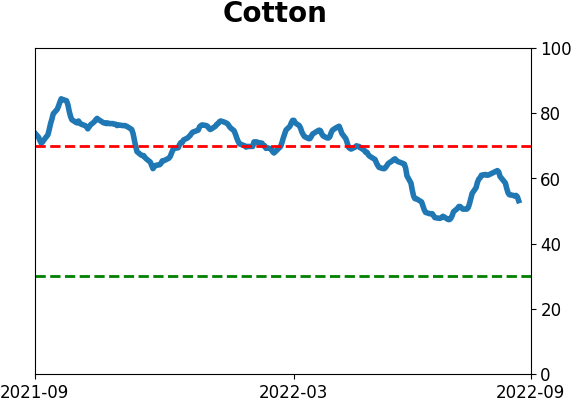
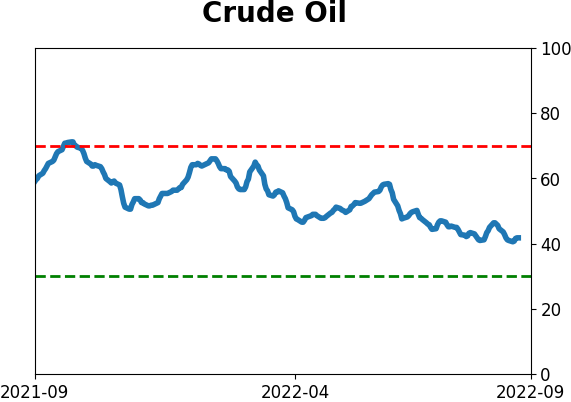
Optimism Index Thumbnails
|
|
|
|
|
|
|
|
|
|
|
|
|
|
|
|
|
|
|
|
|