Headlines
|
|
Smart money buys notes as drawdowns near records:
Smart money commercial hedgers in 2-, 5-, and 10-year Treasury note futures have built up near-record long exposure in those contracts. The data are not as reliable as it is for some other markets, but Treasuries have usually rallied after they build up big net long positions. They appear to be betting that near-record drawdowns in those contracts are nearing an end.
|
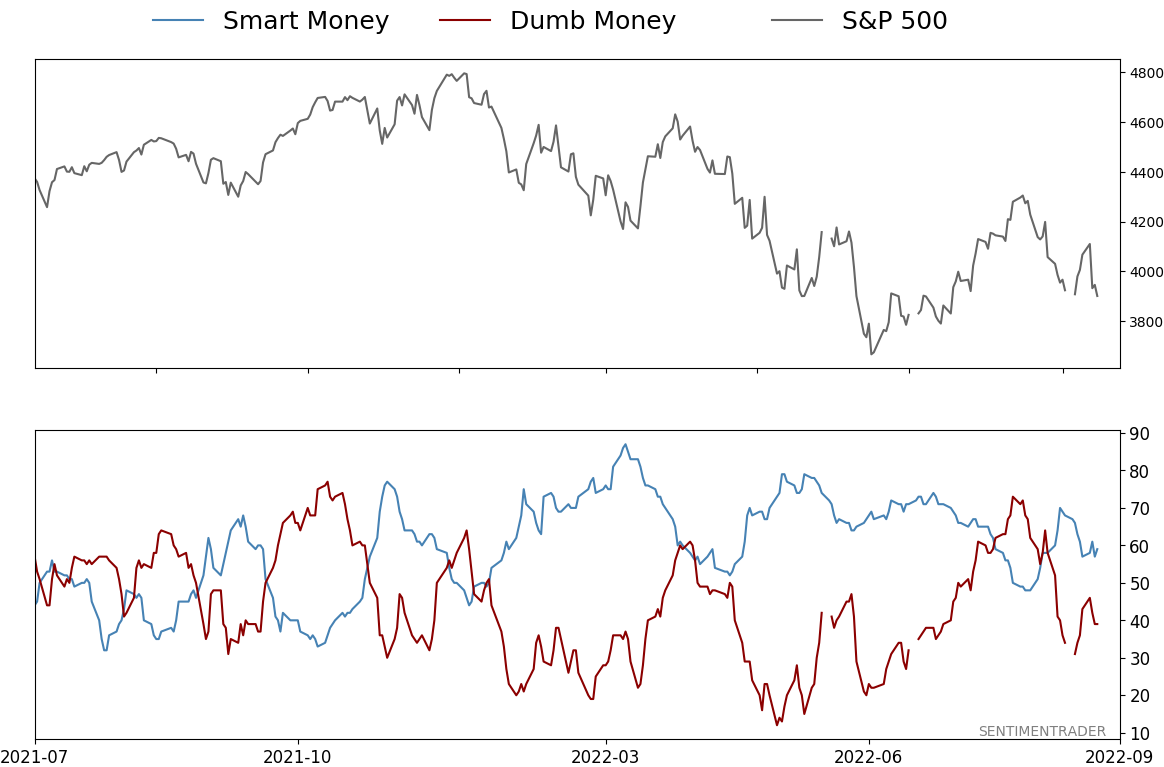
Smart / Dumb Money Confidence
|
Smart Money Confidence: 59%
Dumb Money Confidence: 39%
|
|
Risk Levels
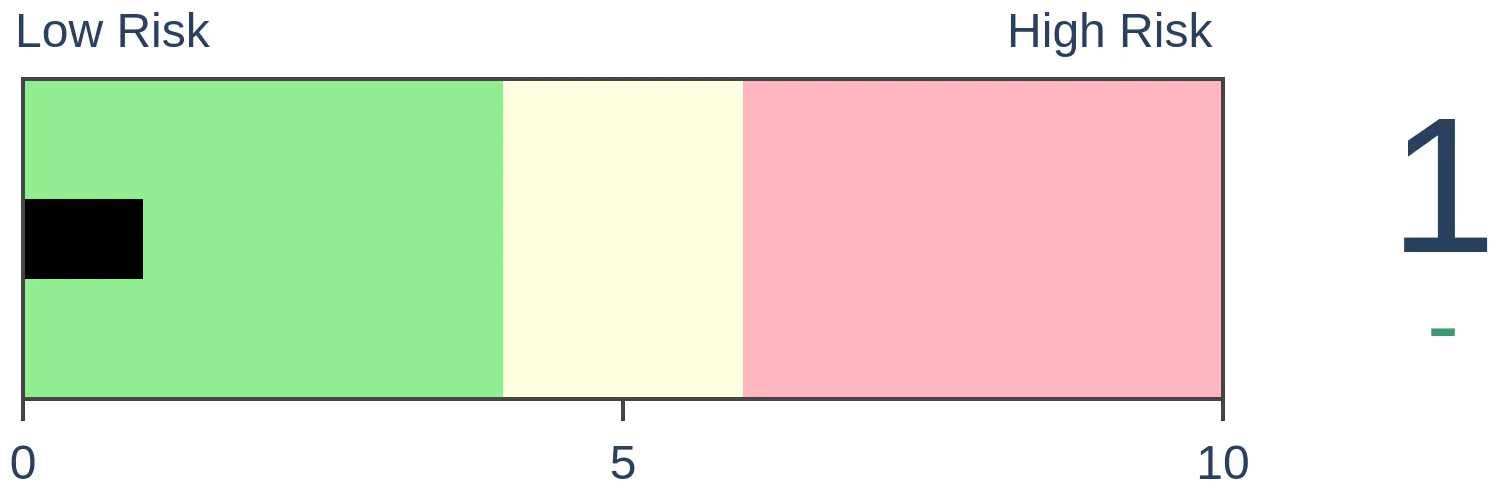
Stocks Short-Term

|
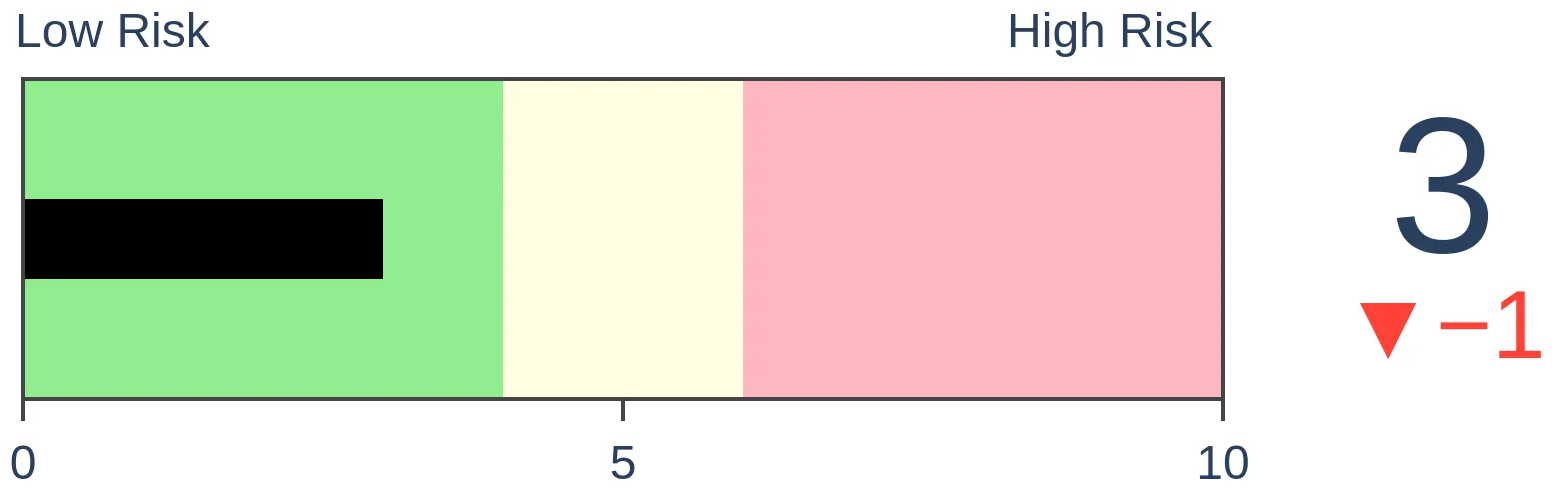
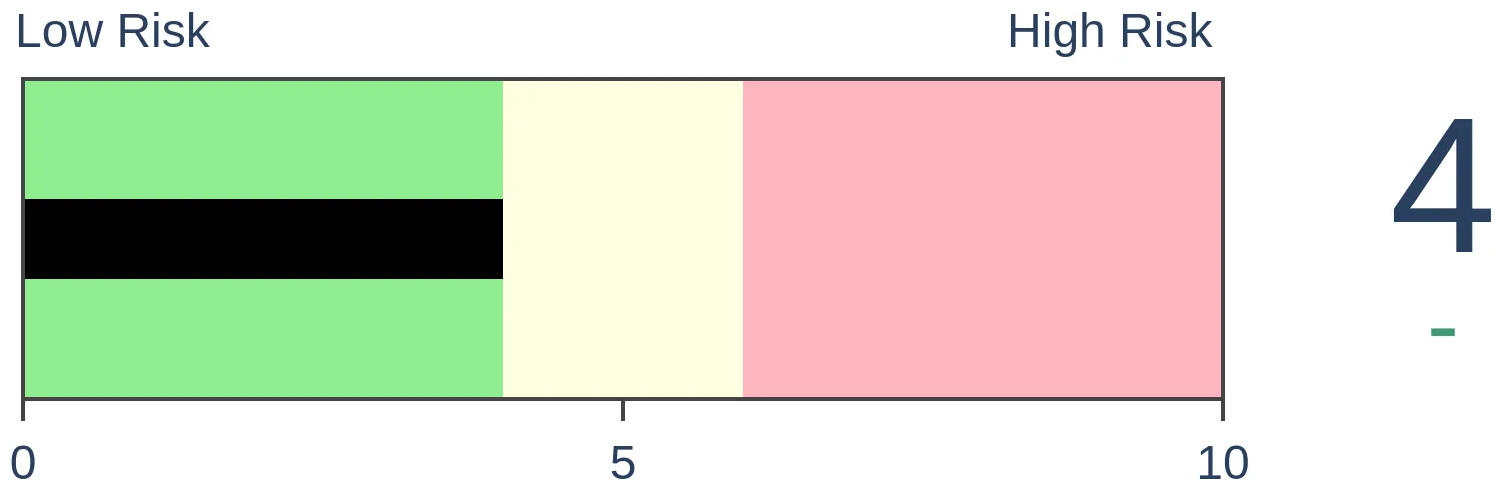
Stocks Medium-Term

|
|
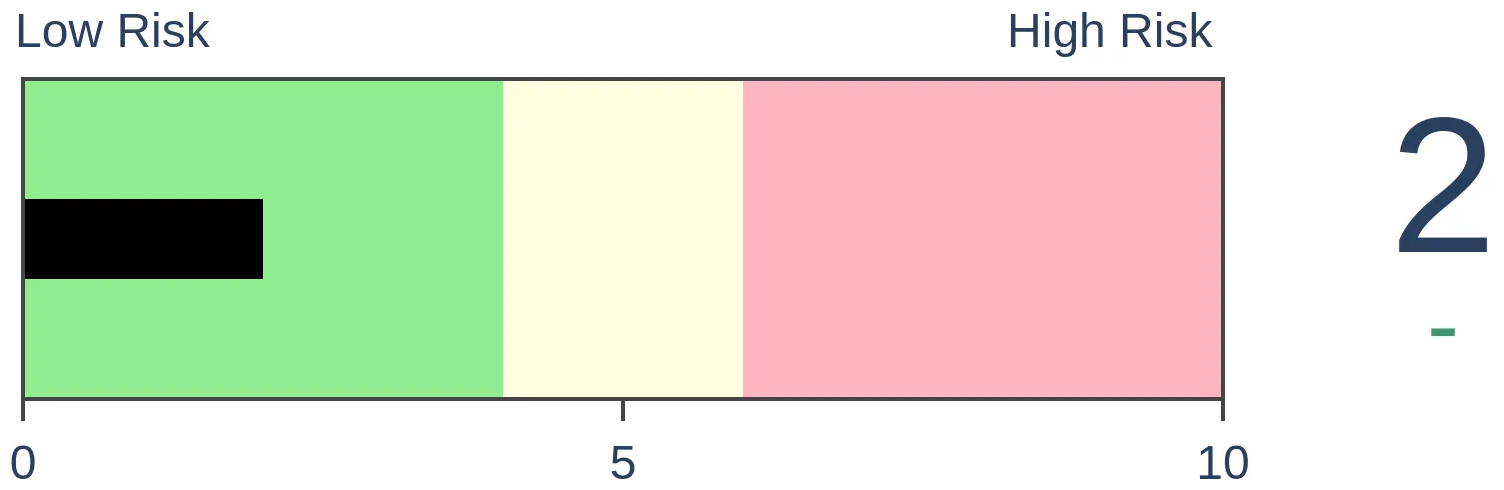
Bonds
|
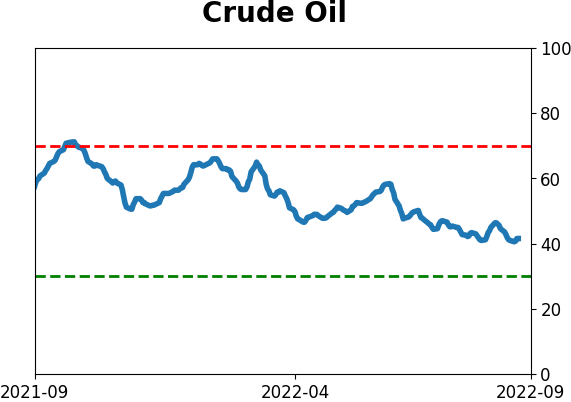
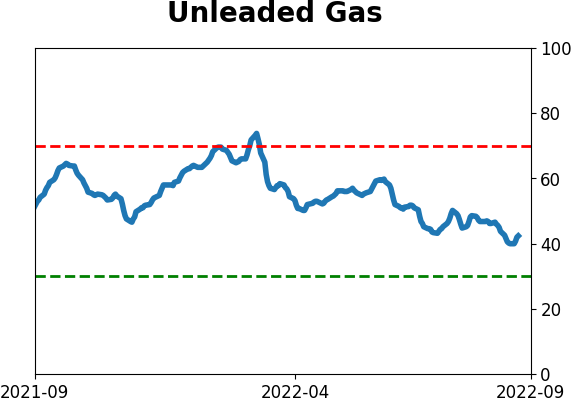
Crude Oil
|
|
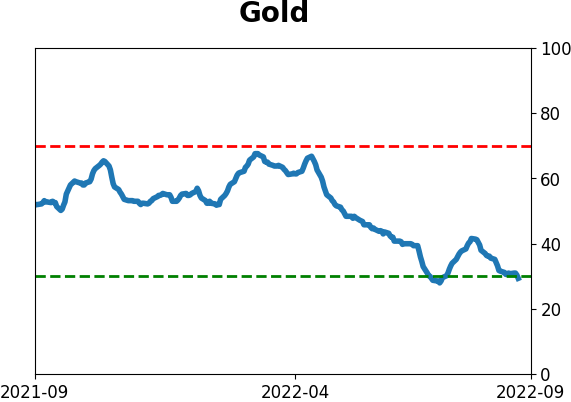
Gold
|
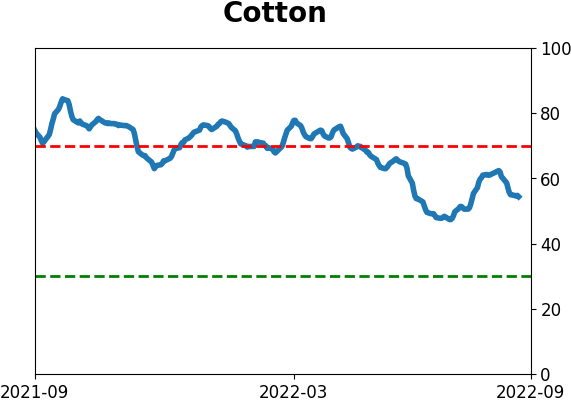
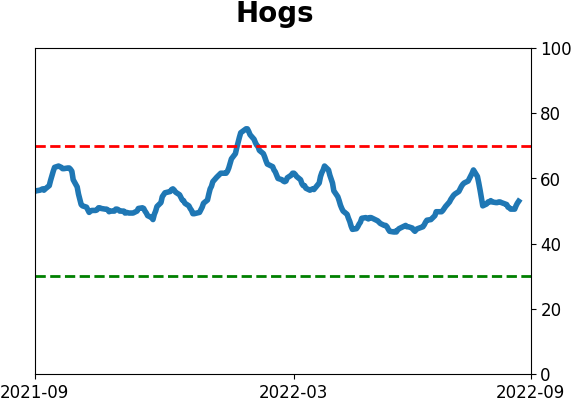
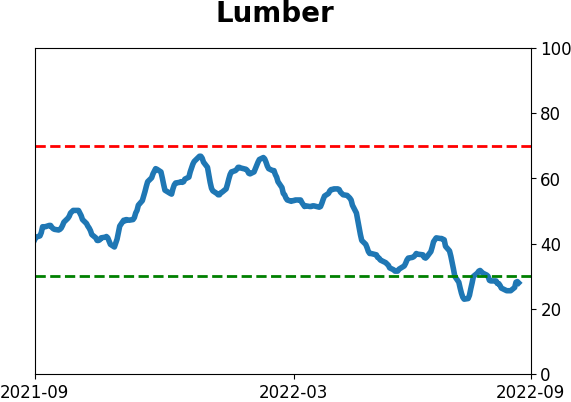
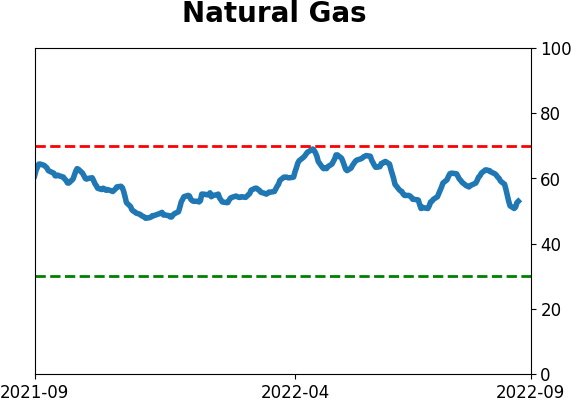
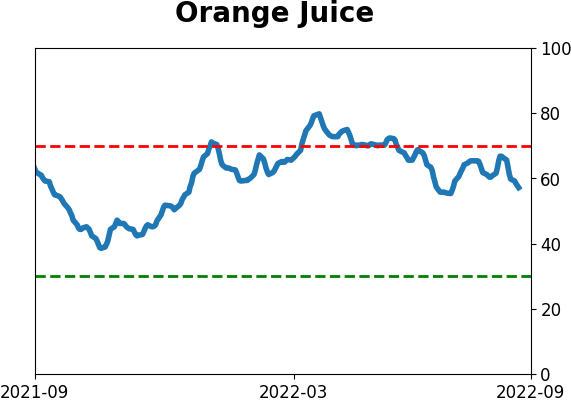
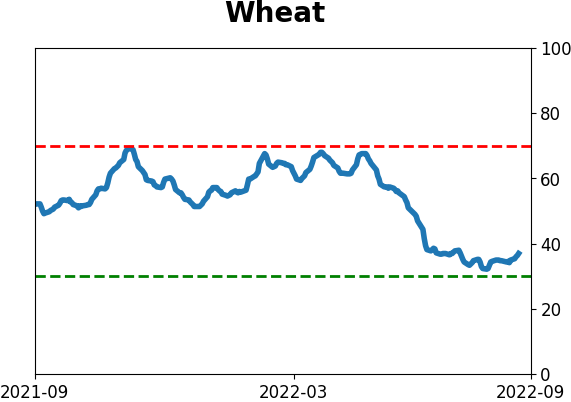
Agriculture
|
|
Research
By Jason Goepfert
BOTTOM LINE
Smart money commercial hedgers in 2-, 5-, and 10-year Treasury note futures have built up near-record long exposure in those contracts. The data are not as reliable as it is for some other markets, but Treasuries have usually rallied after they build up big net long positions. They appear to be betting that near-record drawdowns in those contracts are nearing an end.
FORECAST / TIMEFRAME
None
|
Key points:
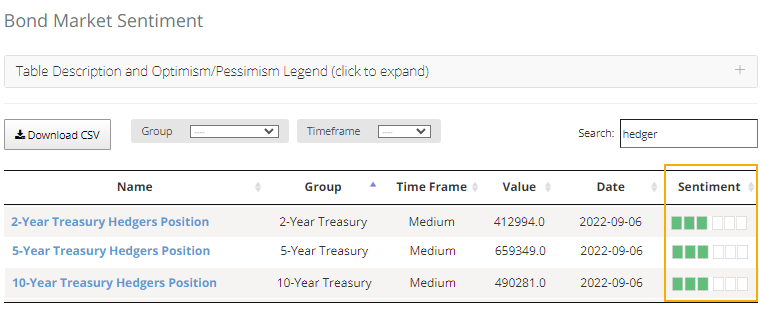
- Commercial hedgers in 2-, 5-, and 10-year Treasury futures are nearing record exposure
- Extremes in these positions have a decent record of preceding longer-term gains (with caveats)
- They seem to be betting that near-record drawdowns in those futures are nearing an end
Hedgers are building up longs in Treasury notes
Extremes in positioning among smart money commercial hedgers in stocks and commodities tend to generate a lot of attention, often for a good reason. Their positions in bonds tend to generate less interest, also for a good reason - they're not as reliable in that market.
Still, the latest readings in short- and intermediate-term Treasury notes are interesting. All are at extremes.
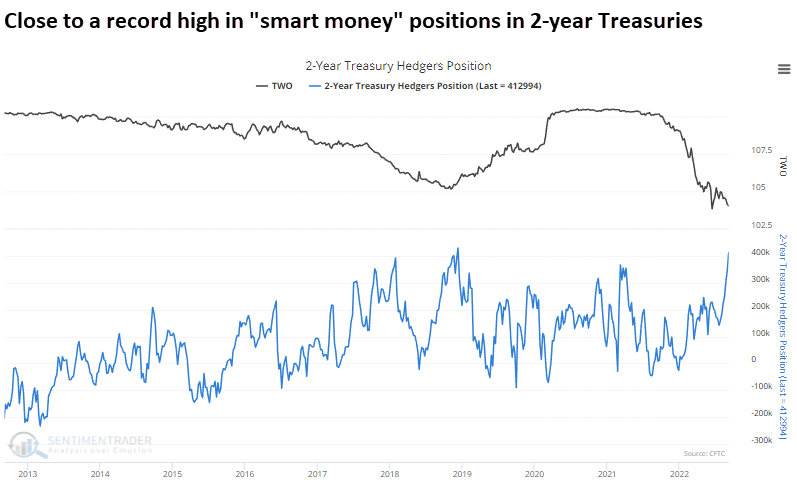
If we pull up the chart for 2-year Treasuries, hedgers' positions are knocking on the door of an all-time high. They're close to eclipsing the current record from late 2018.
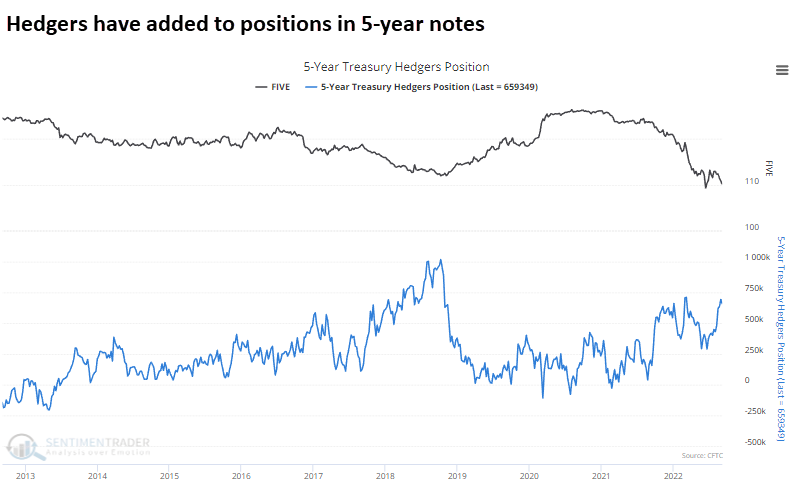
While not as extreme, it's a similar situation in 5-year Treasuries.
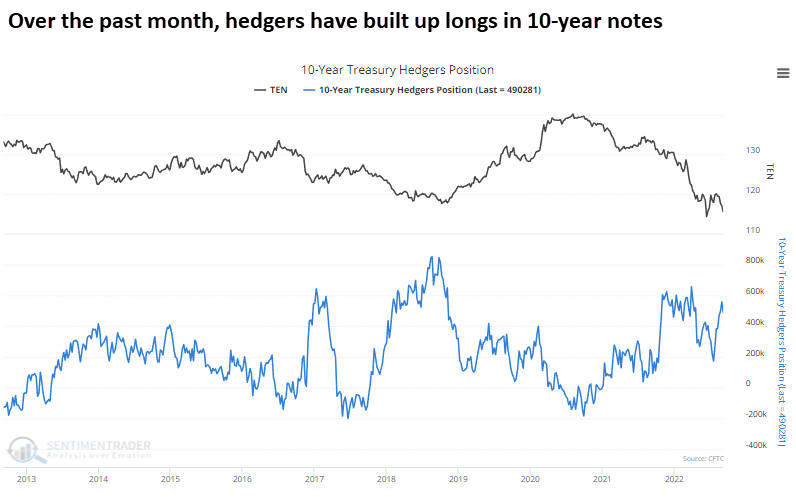
And 10-year Treasuries.
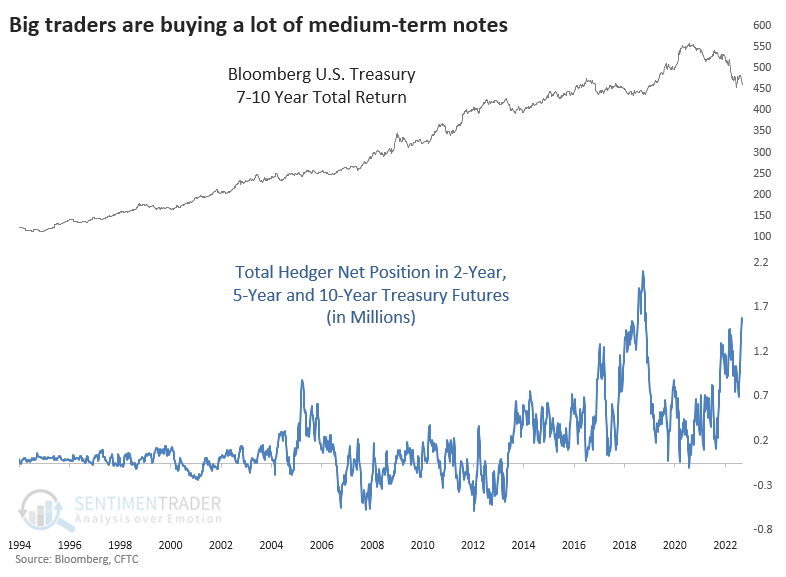
When we aggregate their positions in those three contracts, we see that hedgers are net long nearly 1.6 million contracts. That's the highest in several years and nearing that record from 2018.
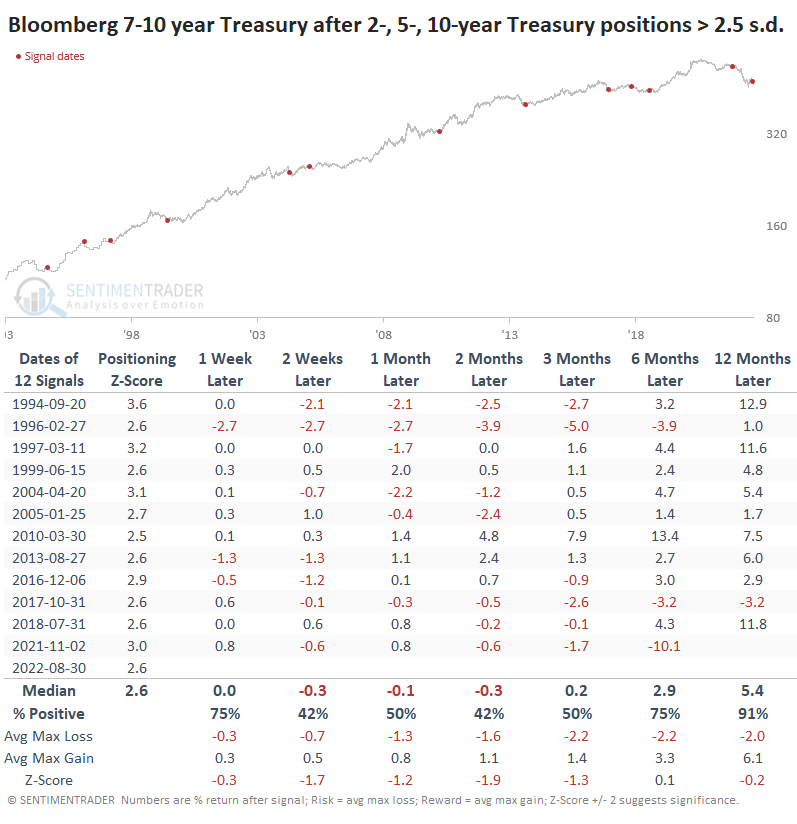
Since the positions have changed in magnitude over the years, it can be more effective to use a relative measure like the z-score. The z-score looks at the current reading versus the average and standard deviation over the past three years to determine how extreme the positions are relative to recent history.
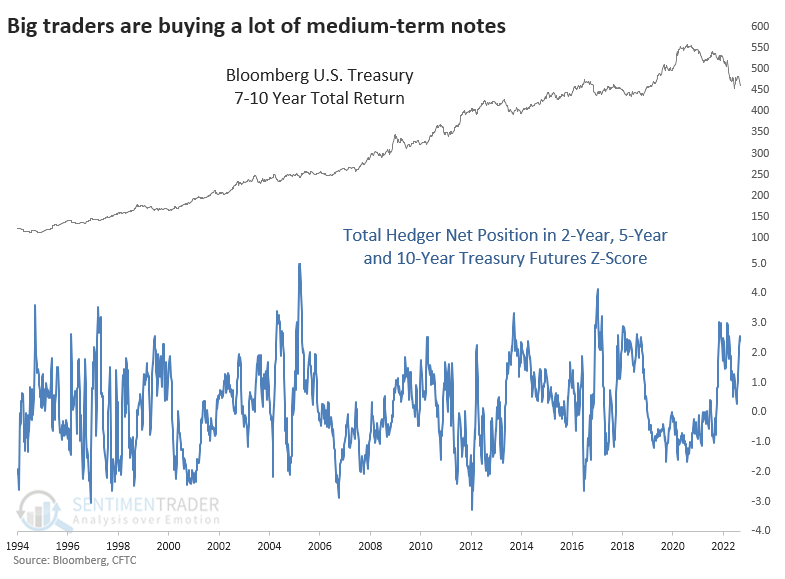
Returns in the Bloomberg 7-10 Year Treasury Total Return Index after extremes like we're seeing now are below. They were mostly negative short-term and mostly positive in the medium- to long-term. That's not a surprise, given the bond bull market of the last 30 years, which is presumed to be over.
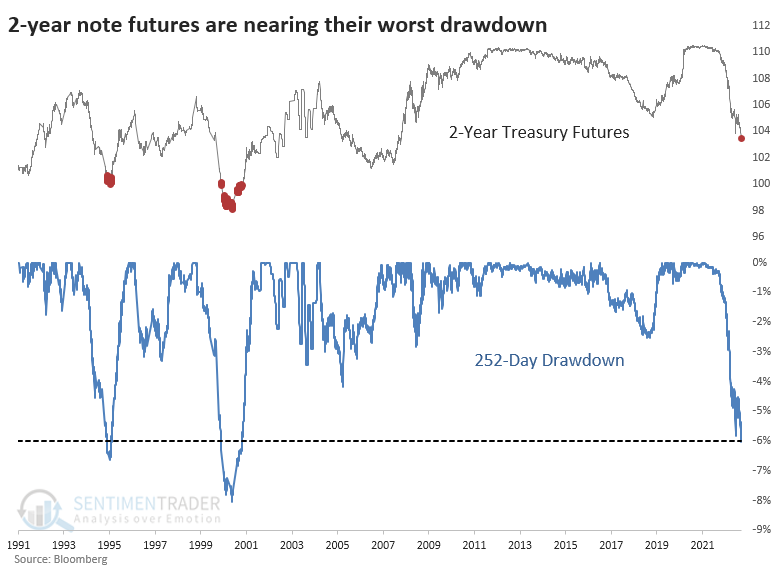
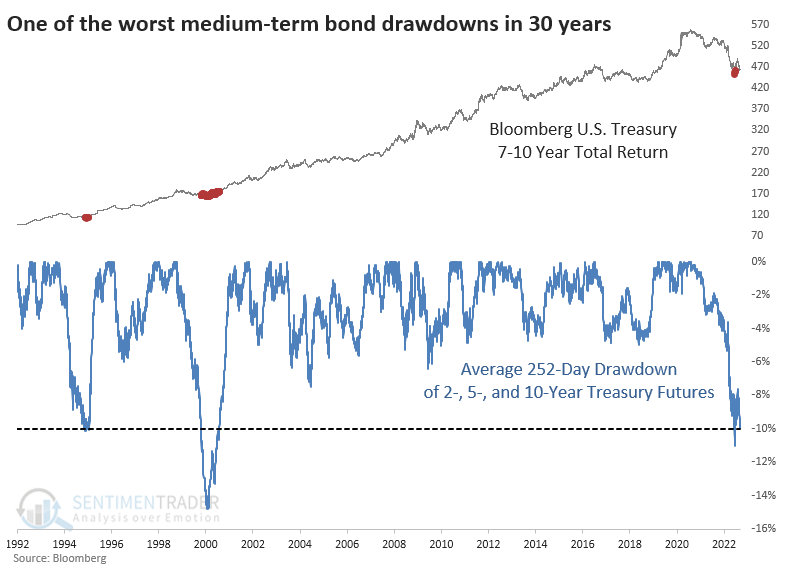
Notes are in one of their worst drawdowns
Hedgers take the opposite side of speculators, which means the latter is heavily short Treasuries. And it's hard to blame them given recent trends. The one-year drawdown in 2-year Treasury futures is nearing a 30-year extreme at -6%.
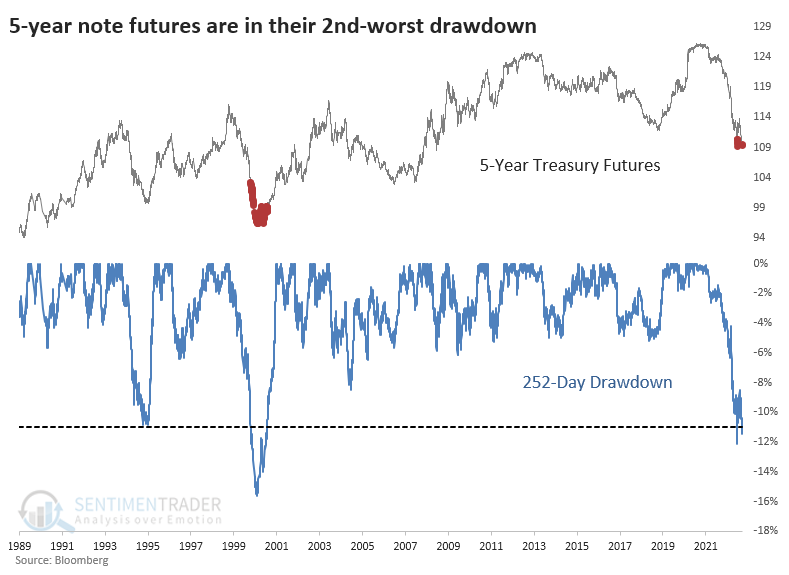
In 5-year notes, the drawdown is about twice as severe and is the 2nd-worst on record.
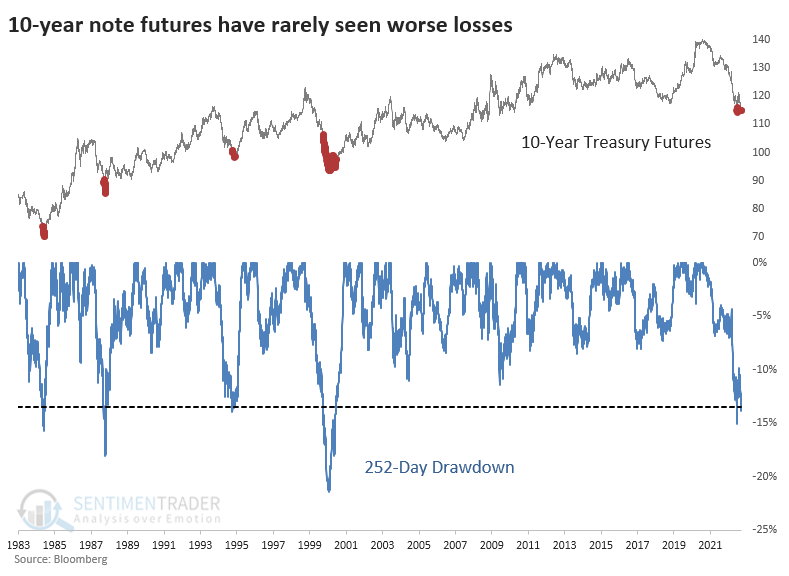
There is more history for 10-year note futures, and while the drawdown is a bit more extreme than in 5-year notes, there were several other precedents. Again, there was a secular bull market this entire time, so they all ultimately served as good buying opportunities.
When we average the drawdowns in 2-, 5-, and 10-year Treasury note futures, it's just beyond -10%. That's on par with 1994 but less extreme than 2000.
What the research tells us...
The global macro crowd, who seems to believe that "this time is different" every time, maybe finally has a winner. The bond market across maturities has done things no current generation of investors (or the one before that) has seen before. A drawdown of more than -10% in 10-year futures had historically been an excellent buying opportunity. And yet here we are plumbing lower lows.
Positioning in note futures is one-sided, which suggests a possible short-covering rally in the months ahead. The problem is that the data isn't terribly reliable, and extremes haven't worked so well this year. More than anything, the performance and positions suggest that those betting on a further drop in bonds (and rise in rates) should be careful pressing those bets.
Indicators at Extremes
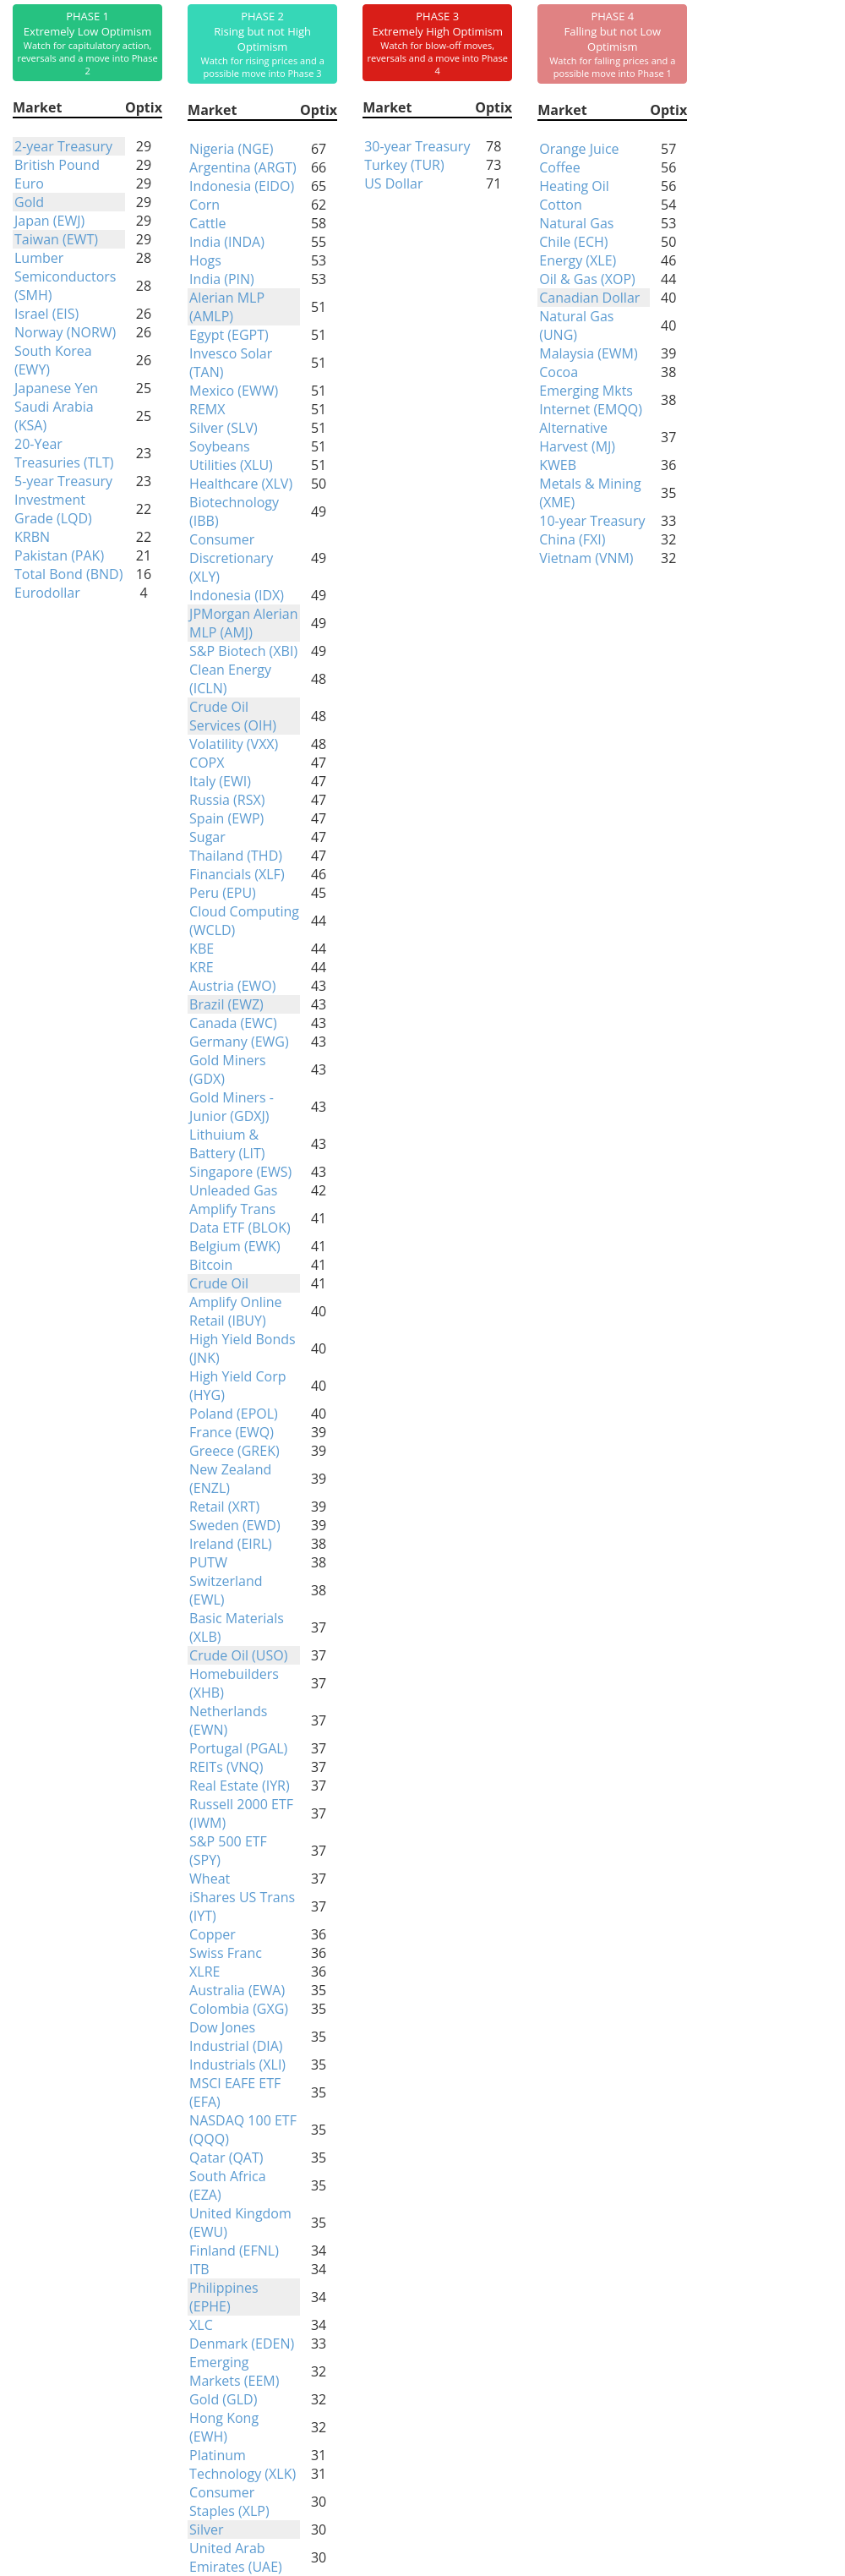
Phase Table
Ranks
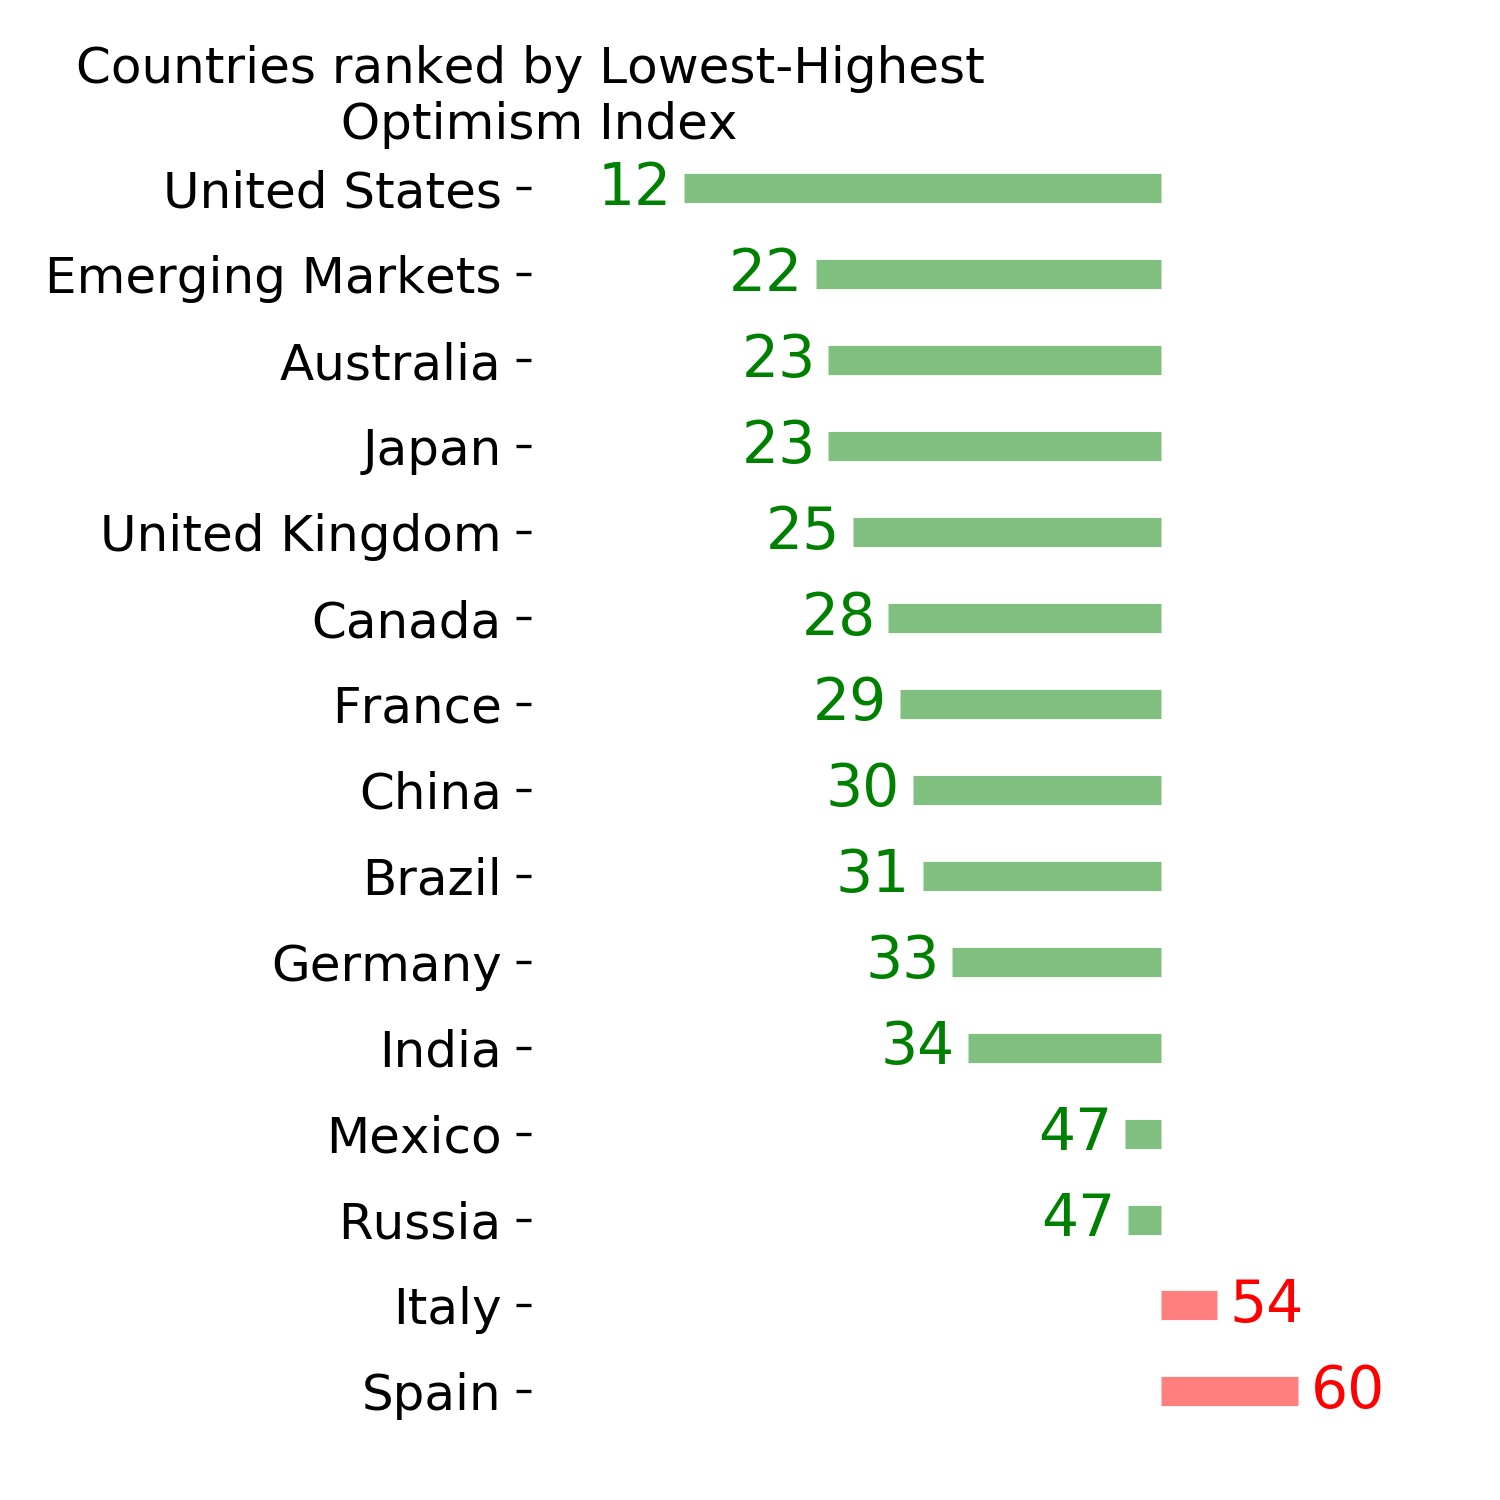
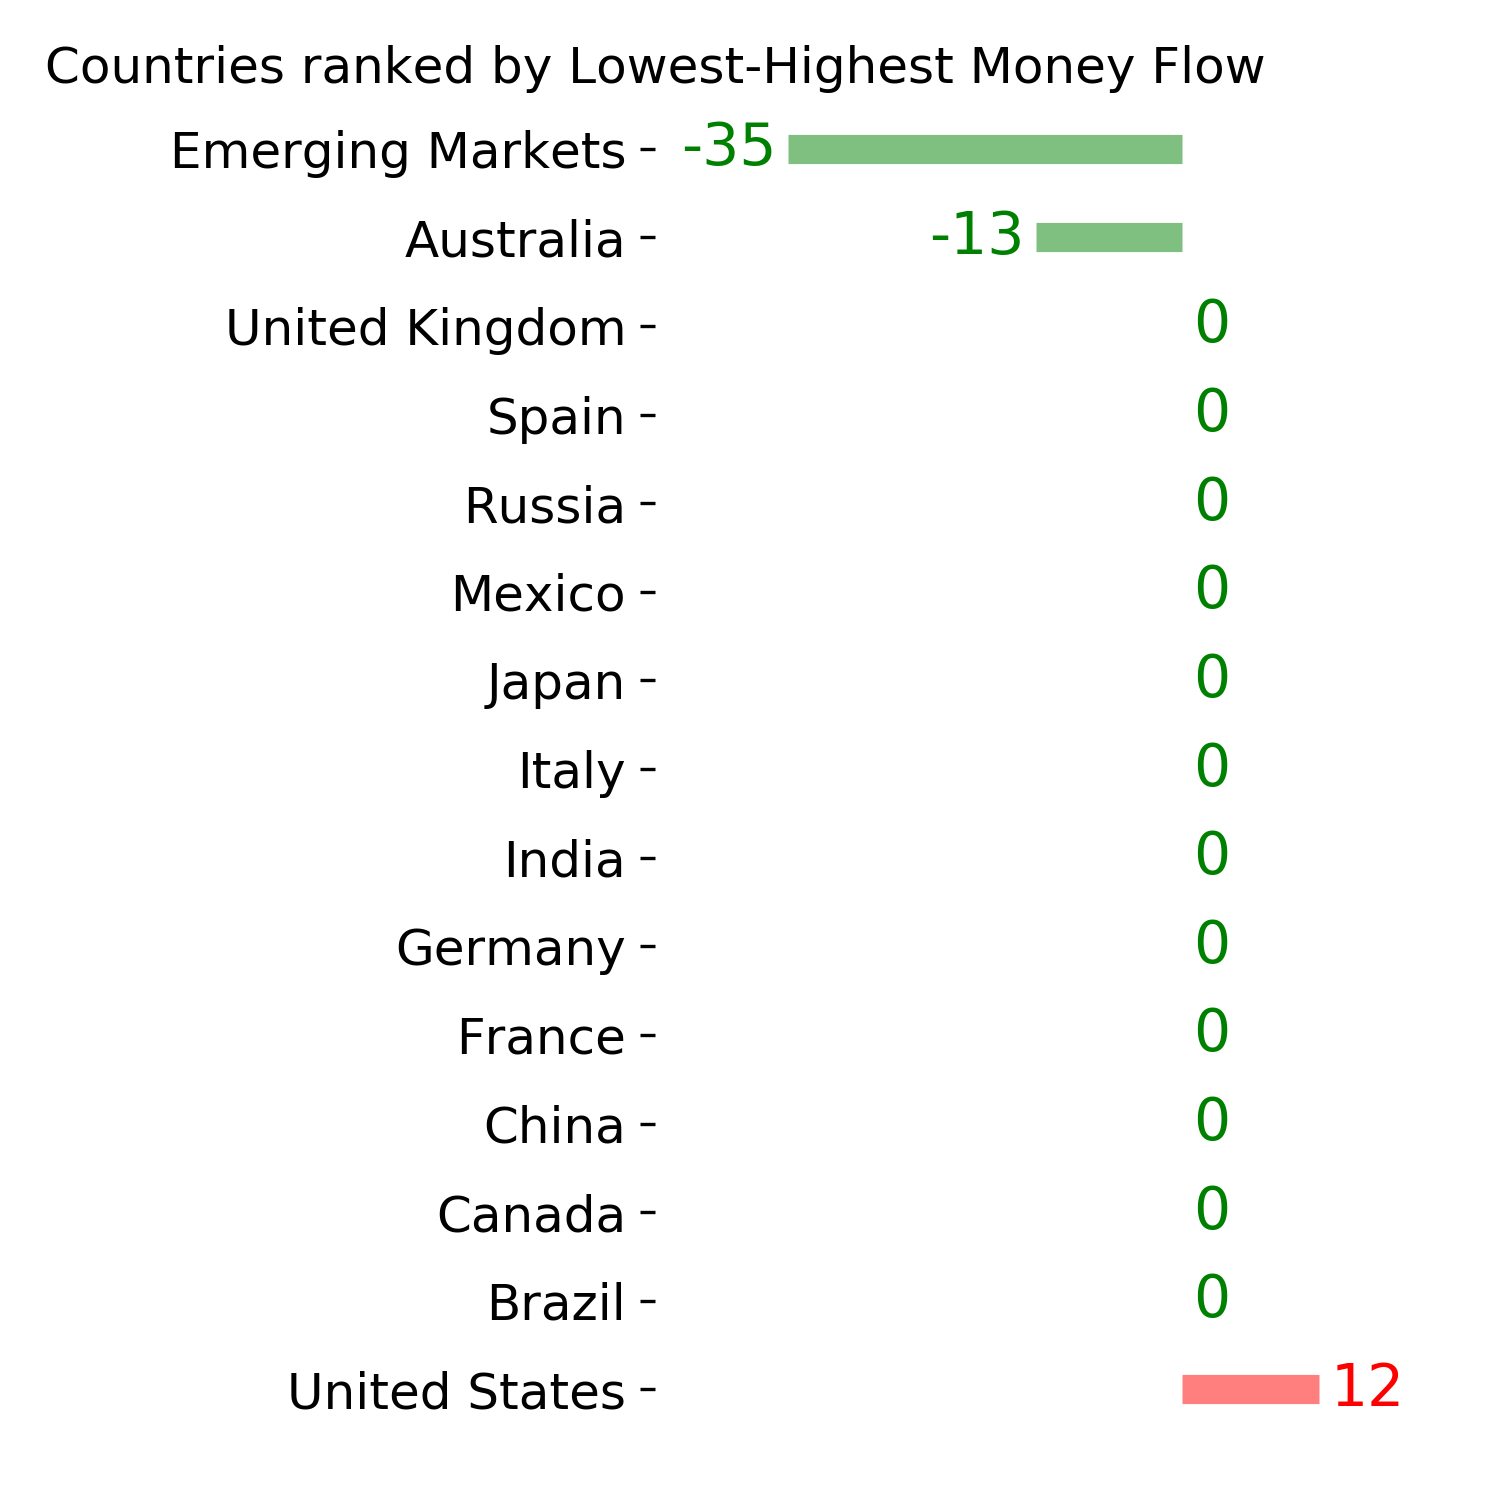
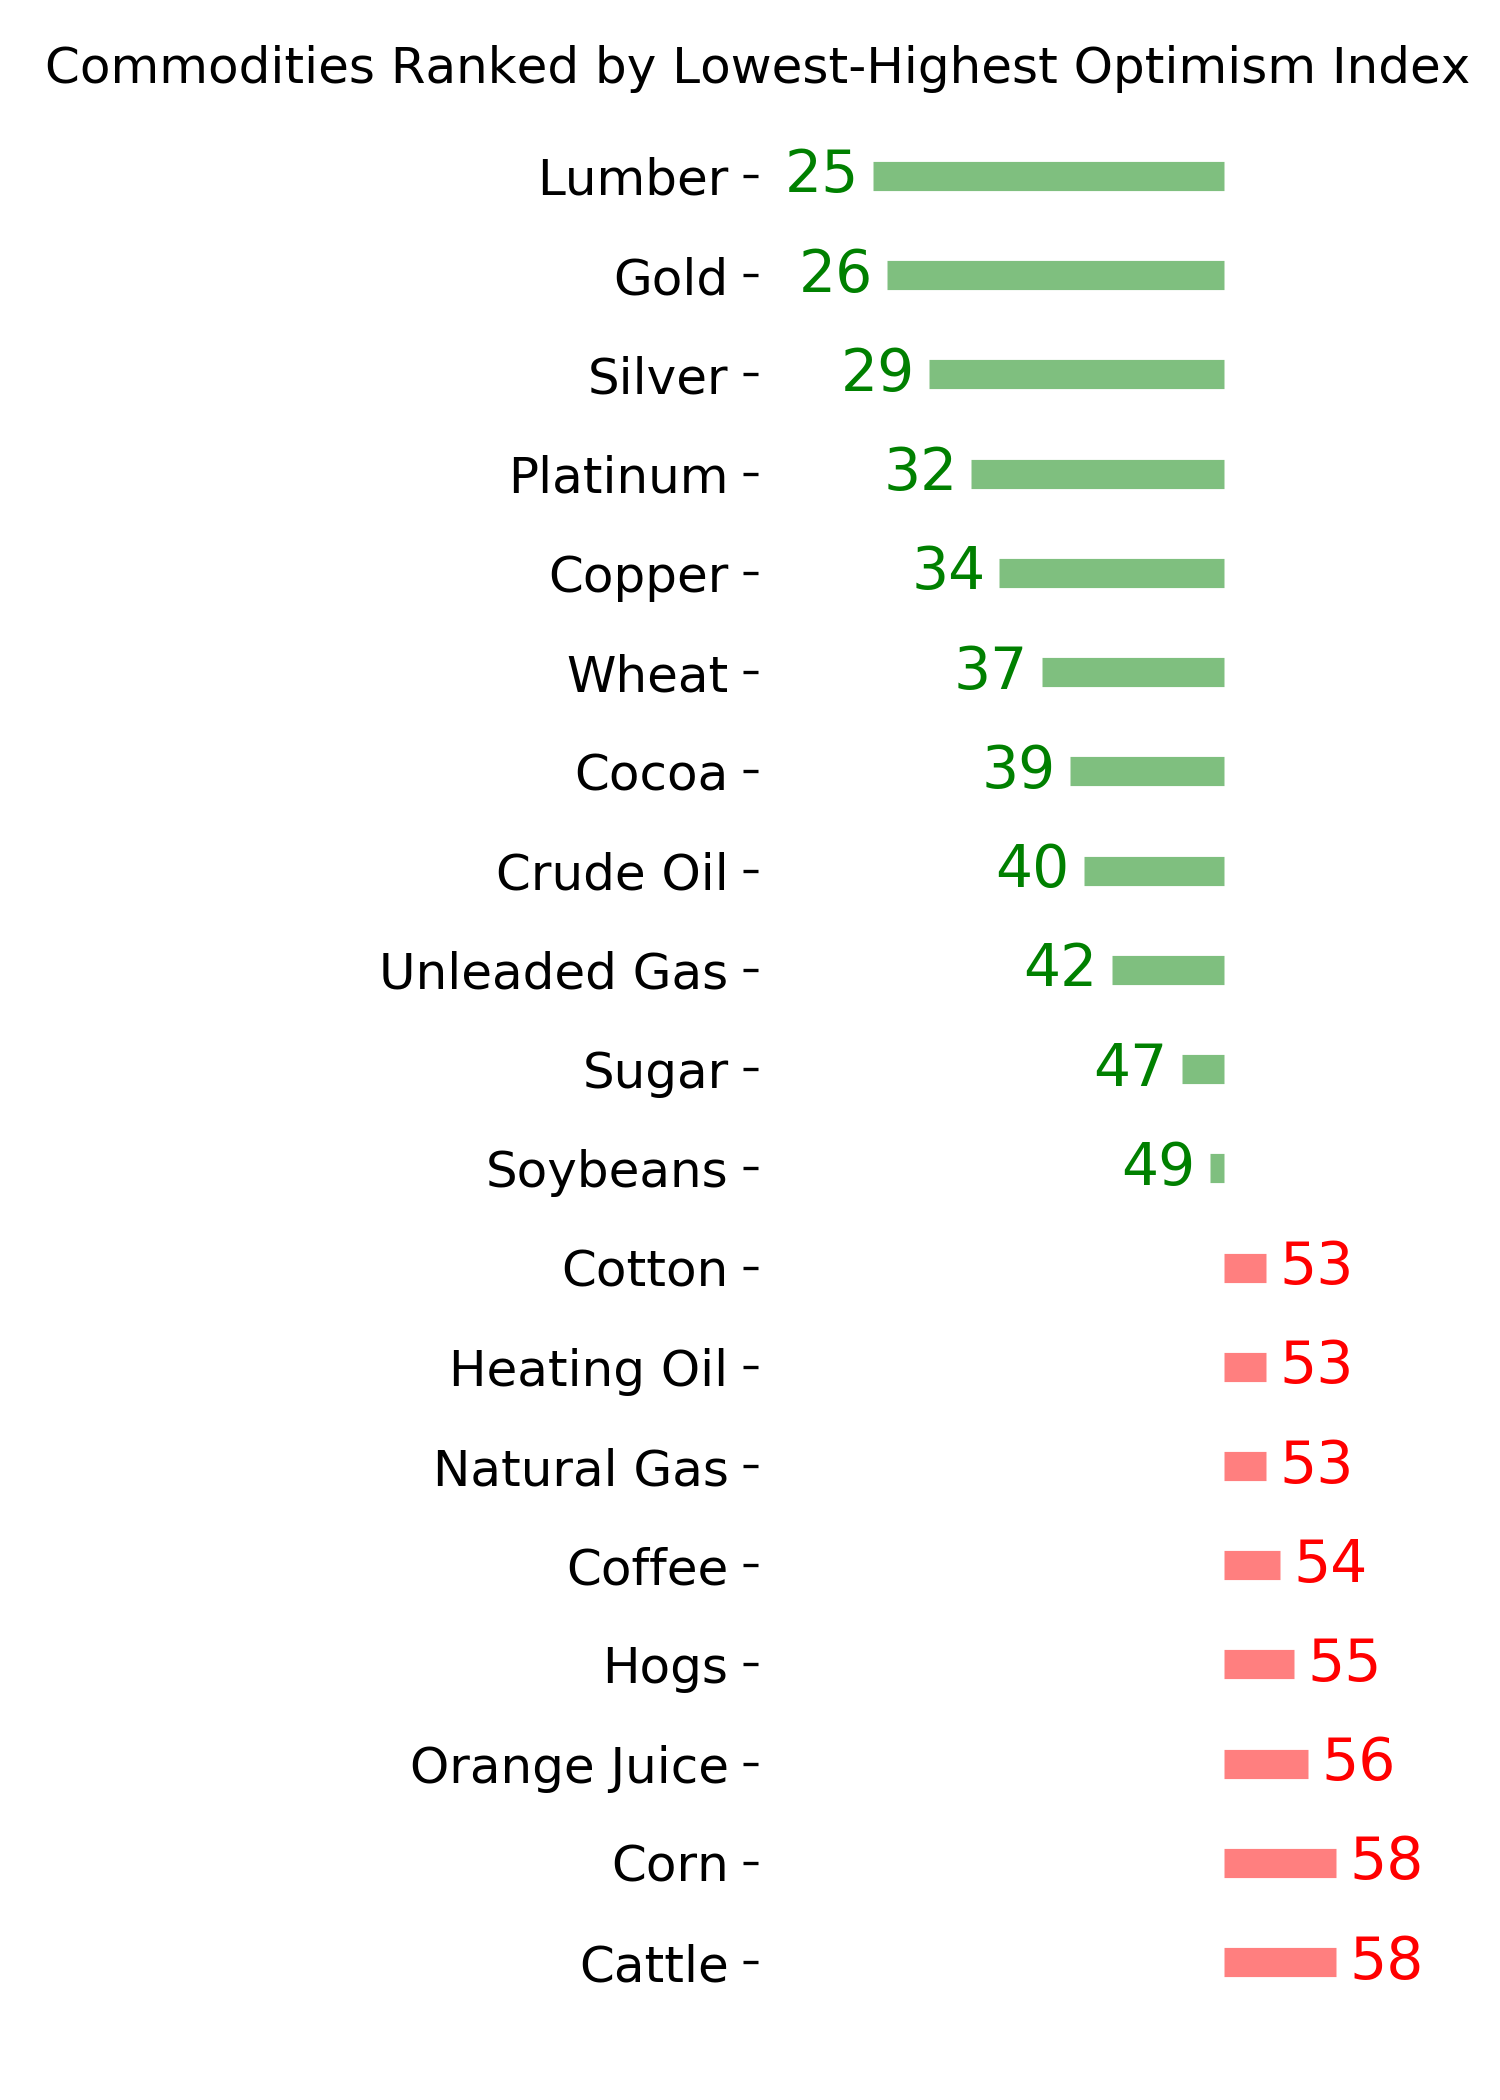
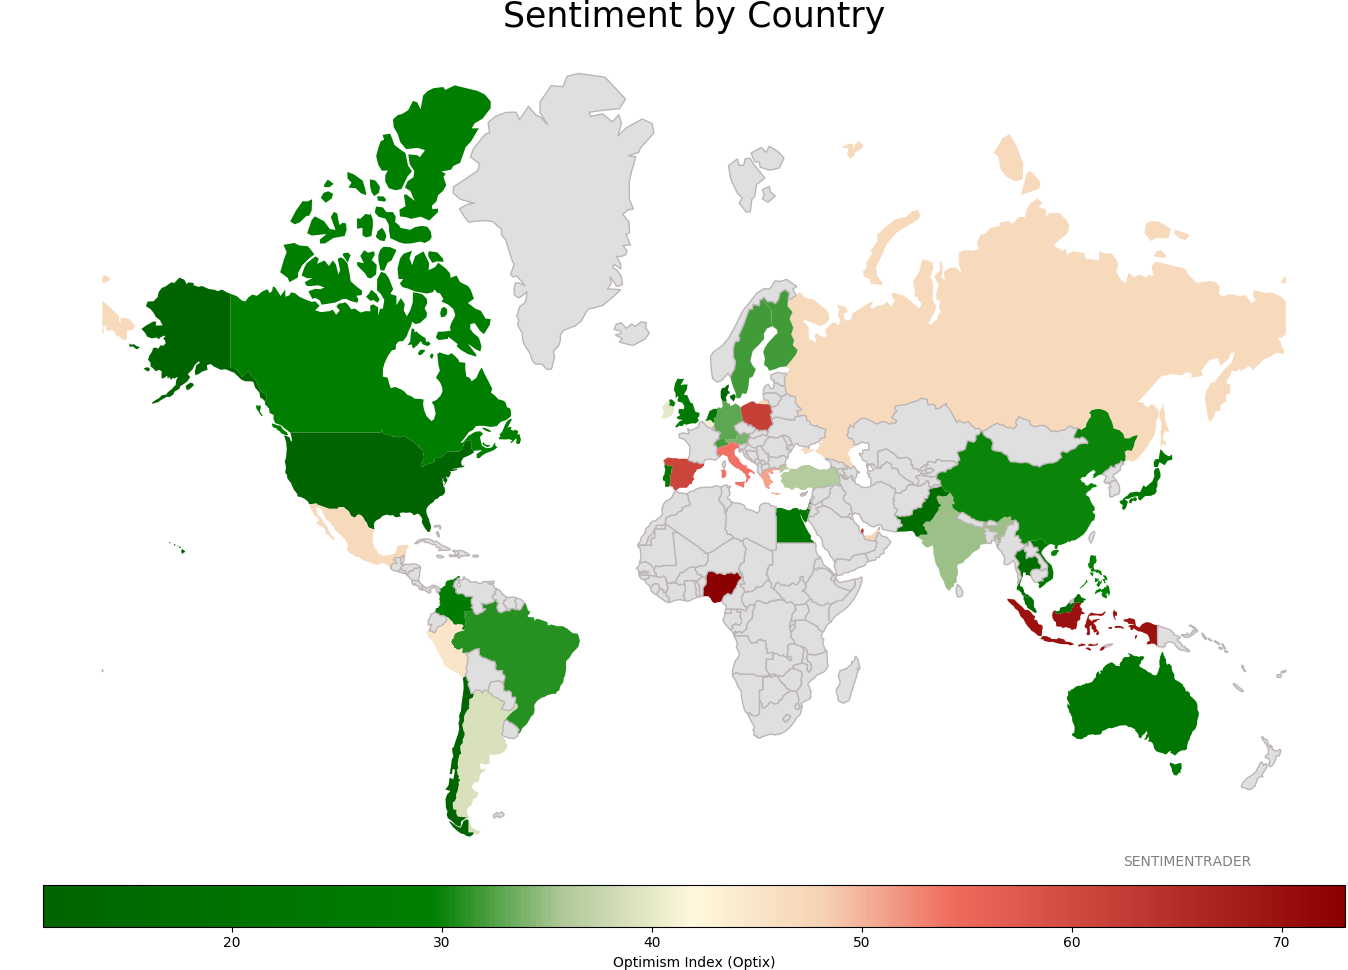
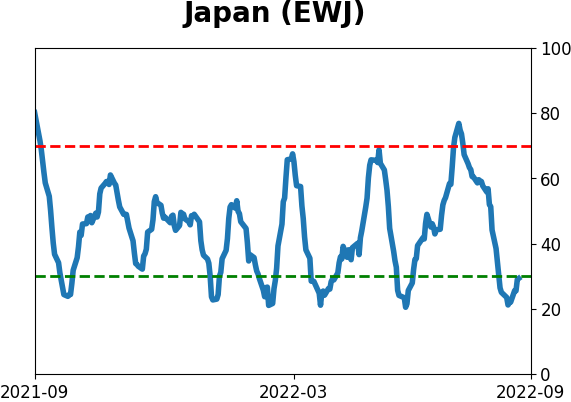
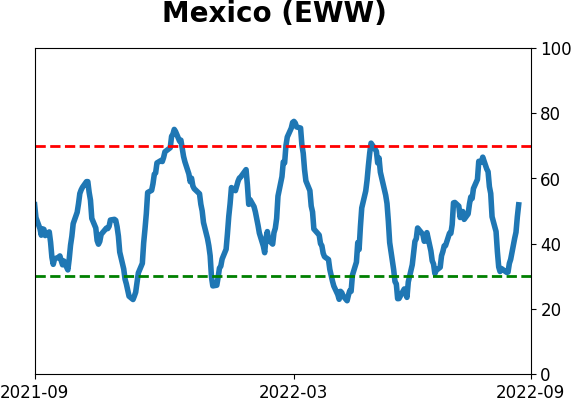
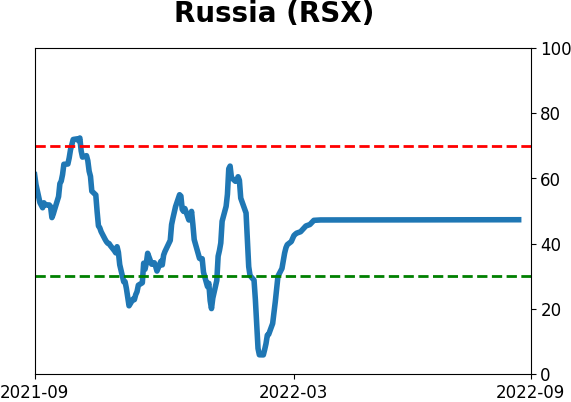
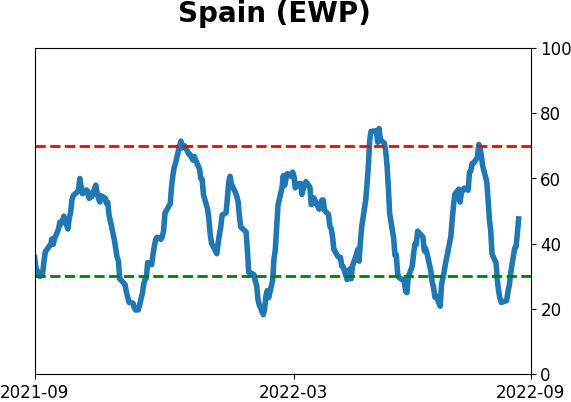
Sentiment Around The World
Optimism Index Thumbnails
|
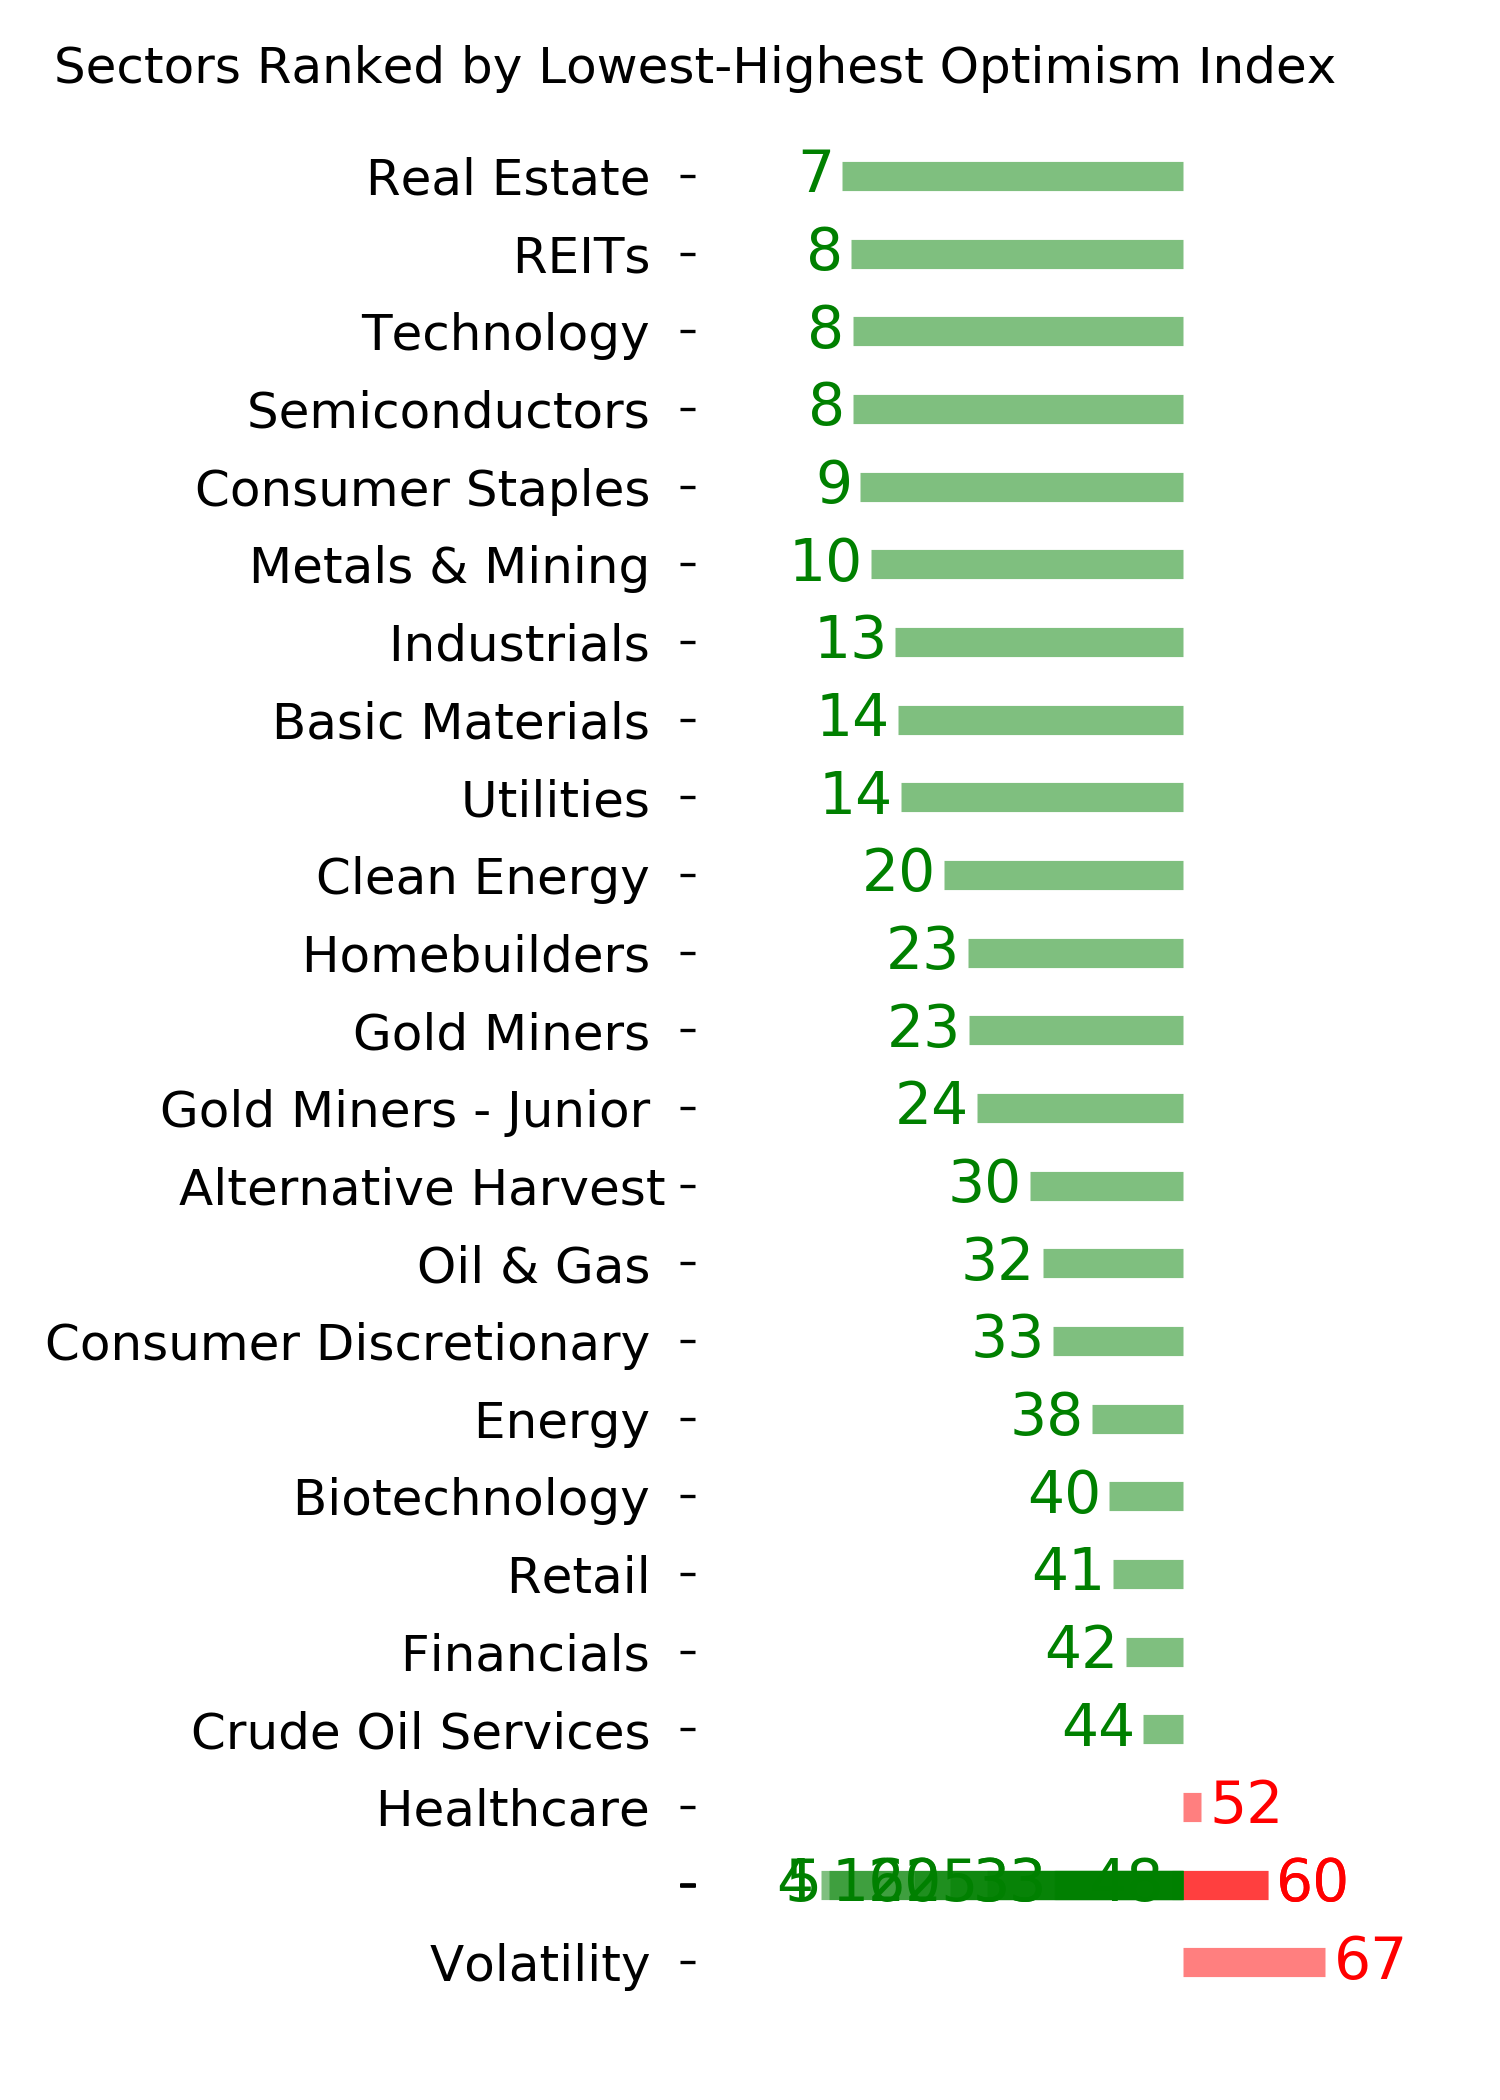
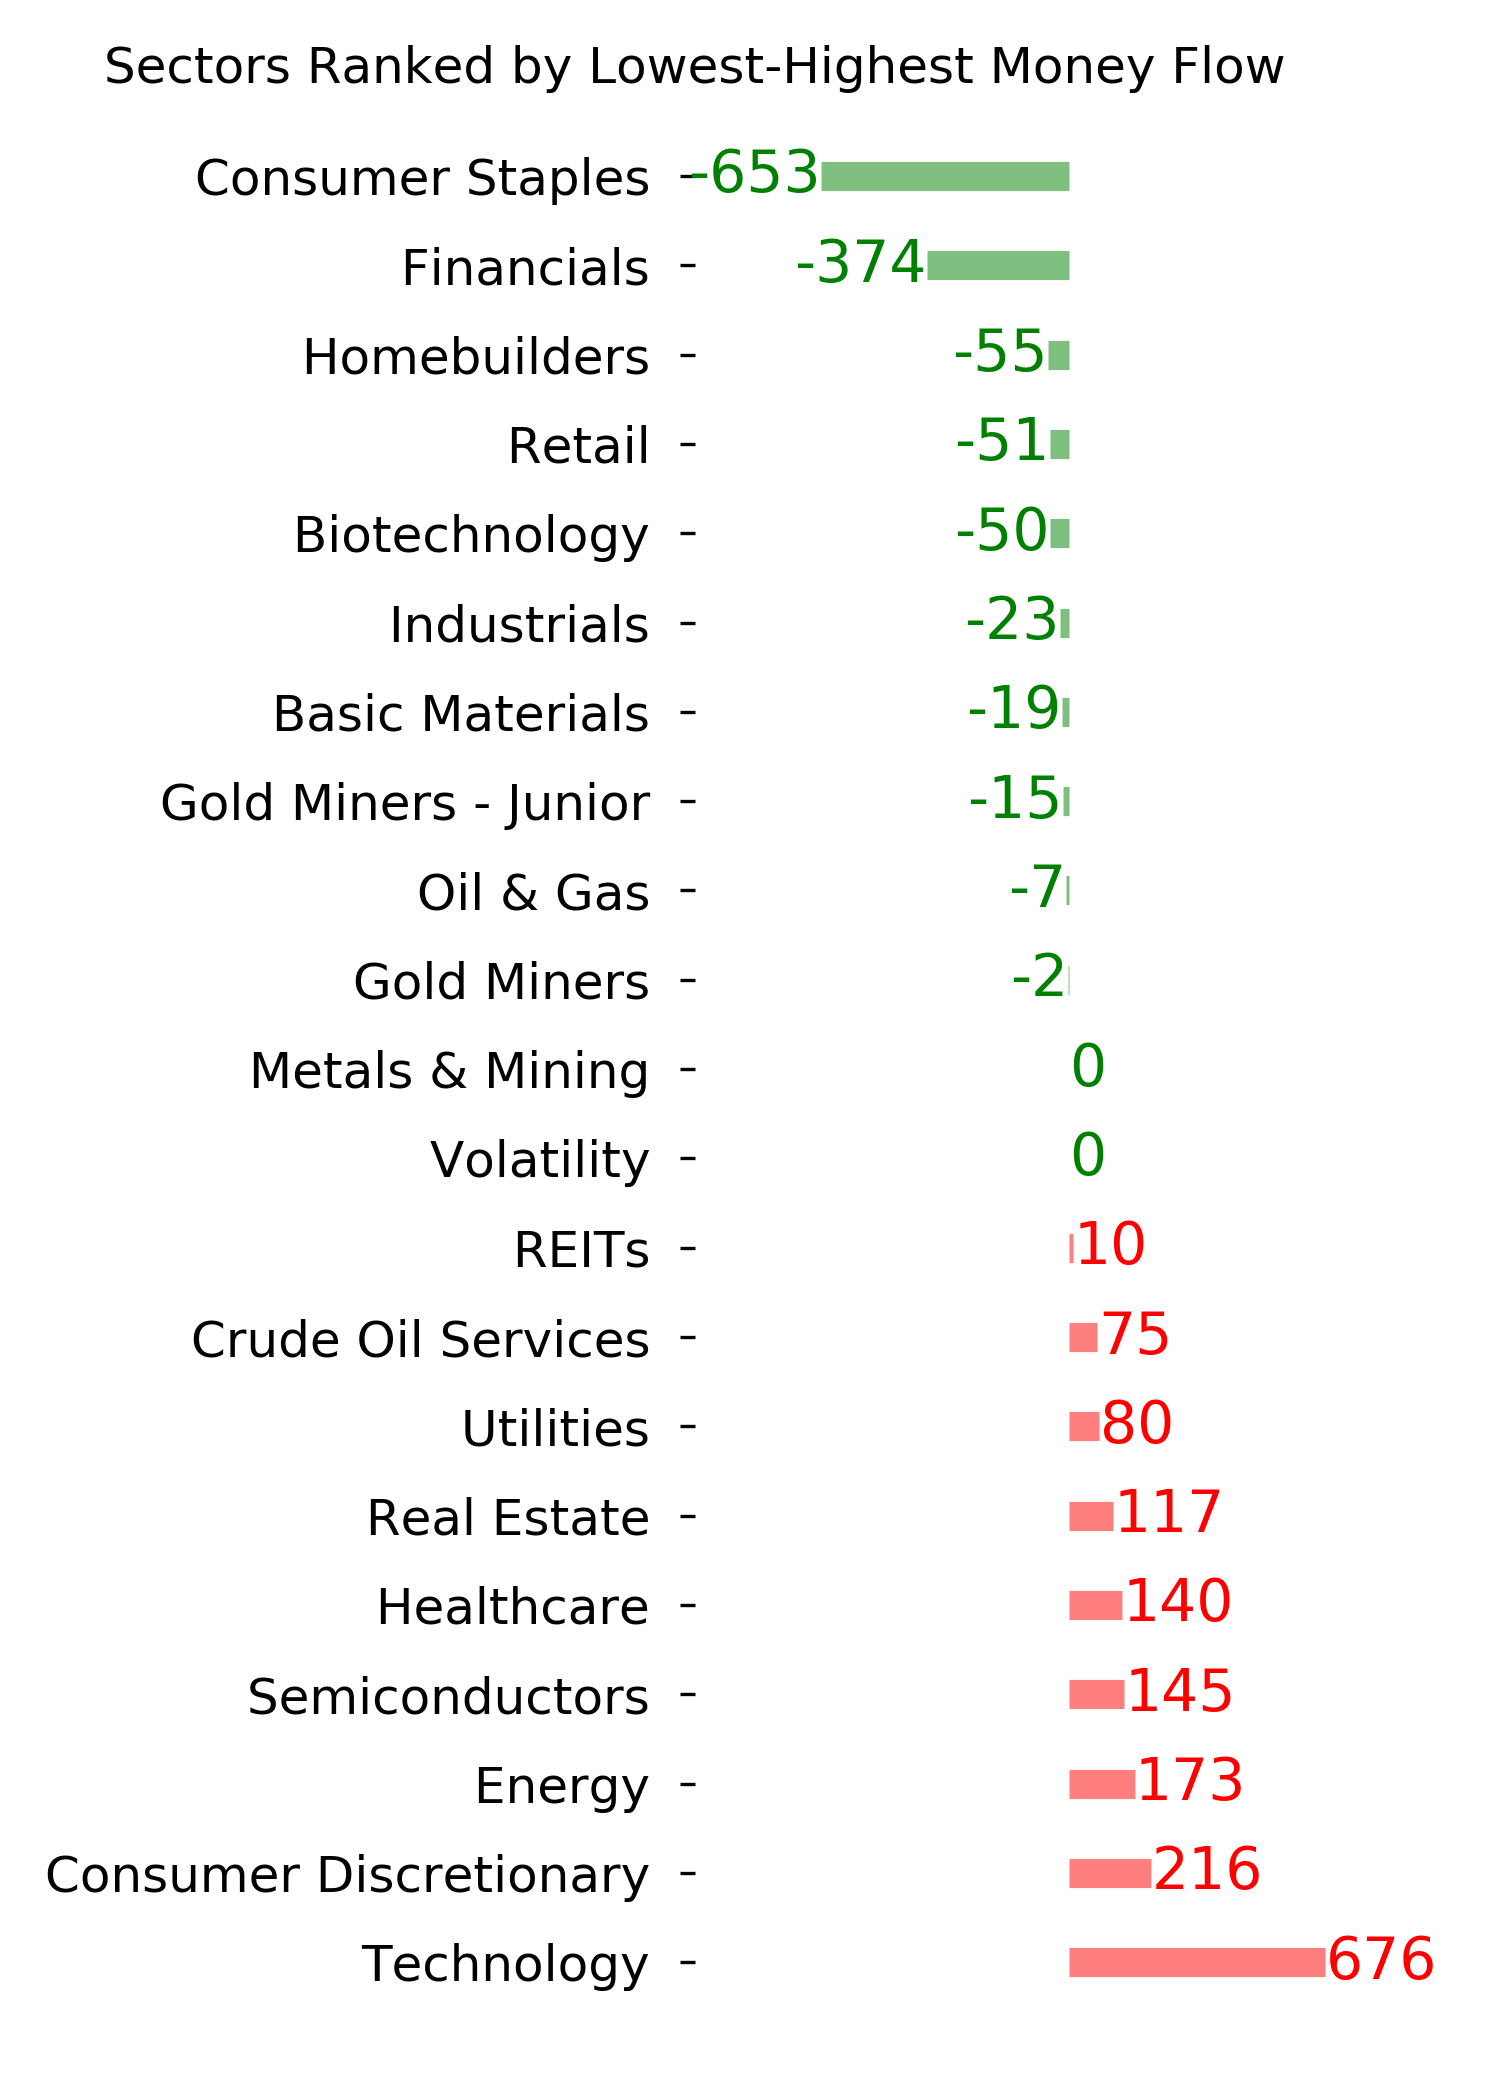
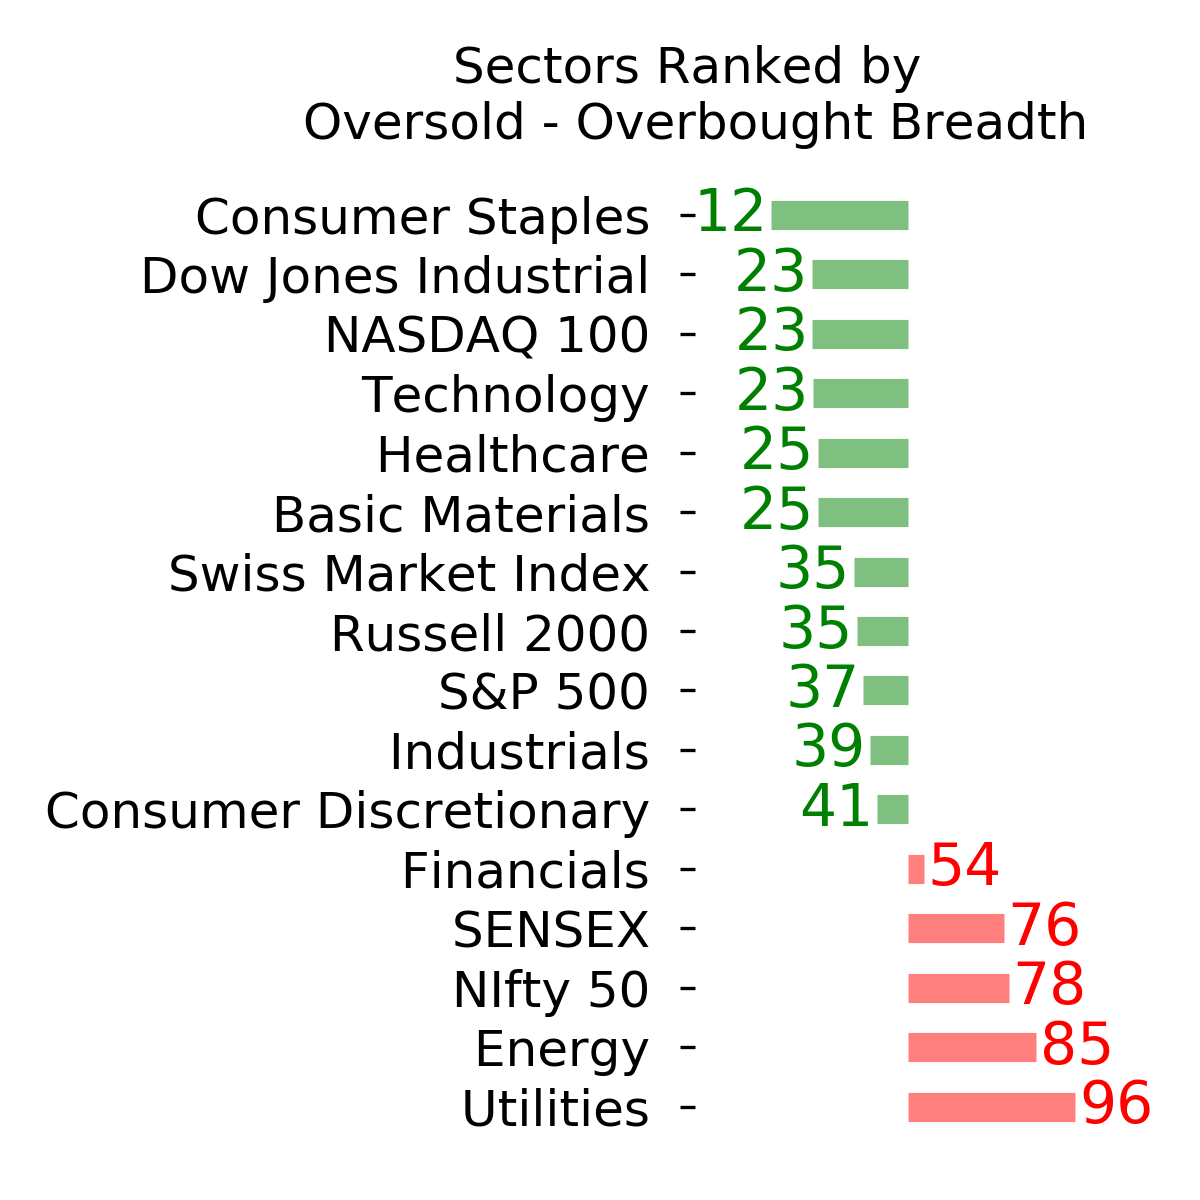
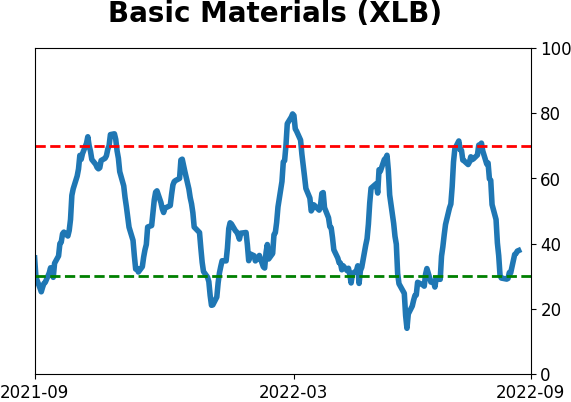
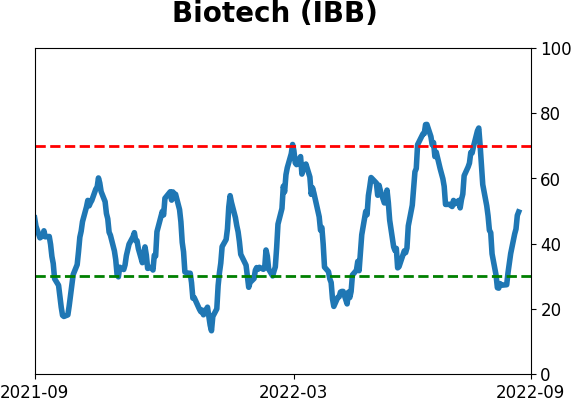
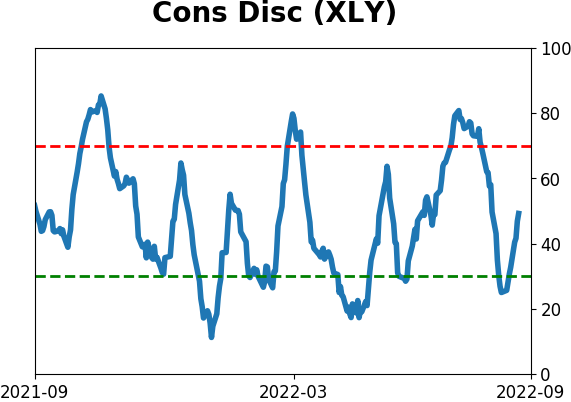
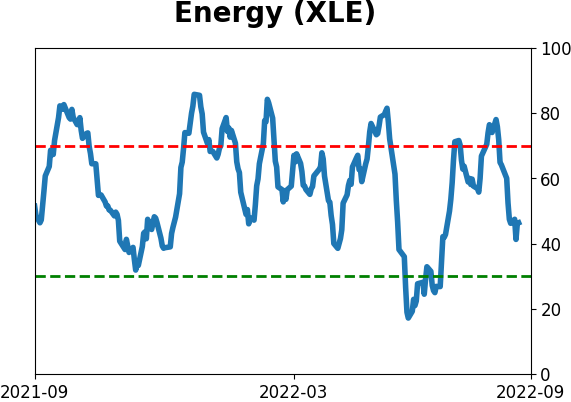
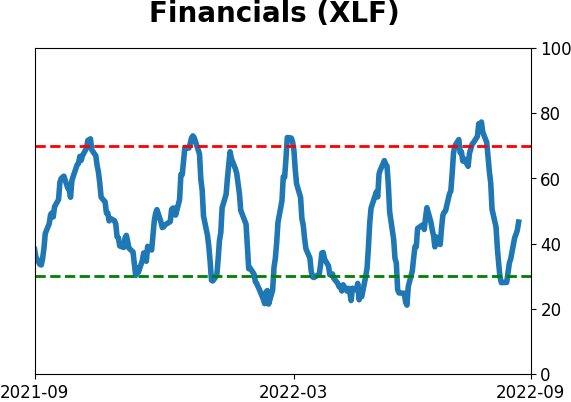
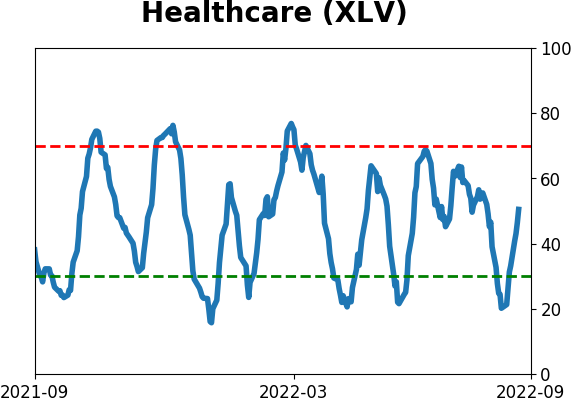
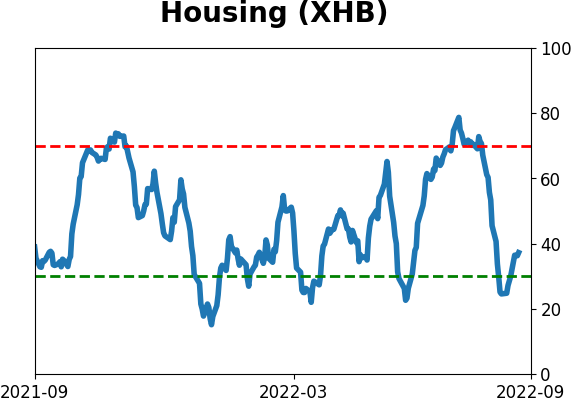
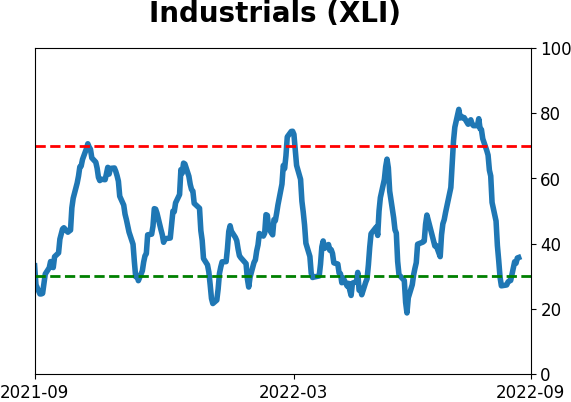
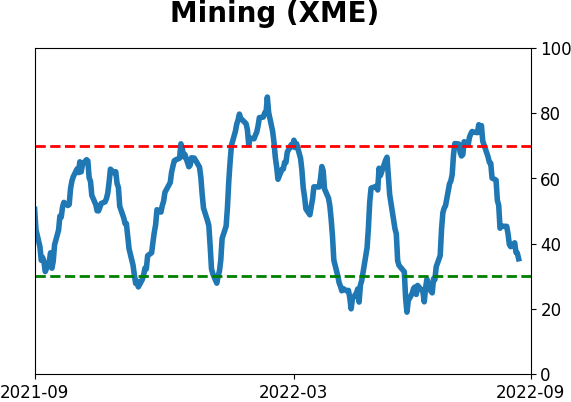
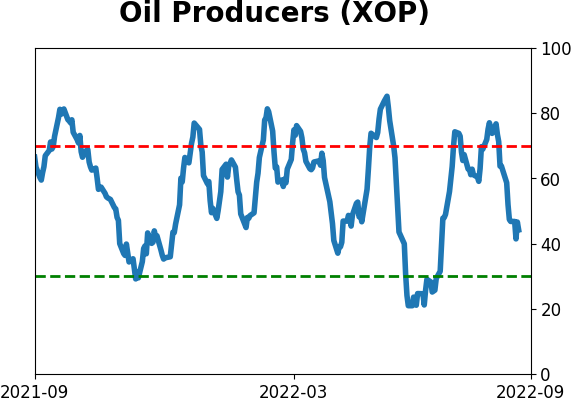
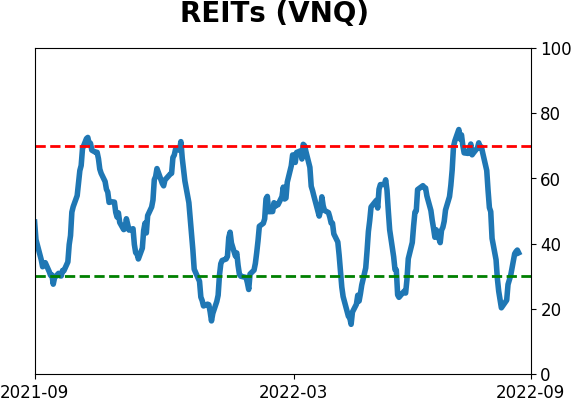
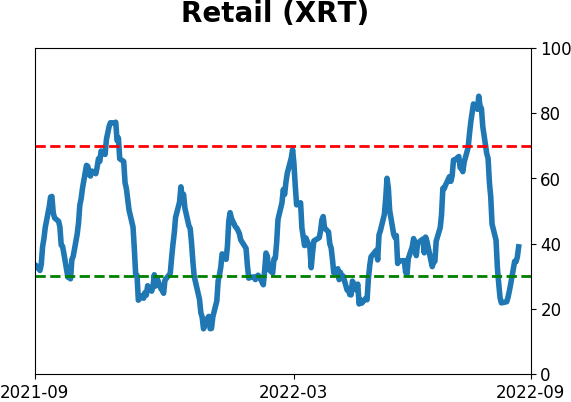
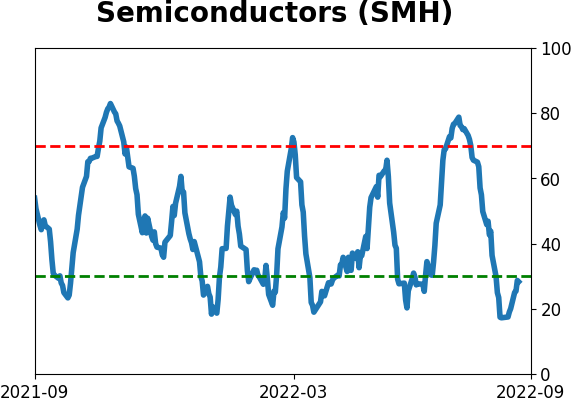
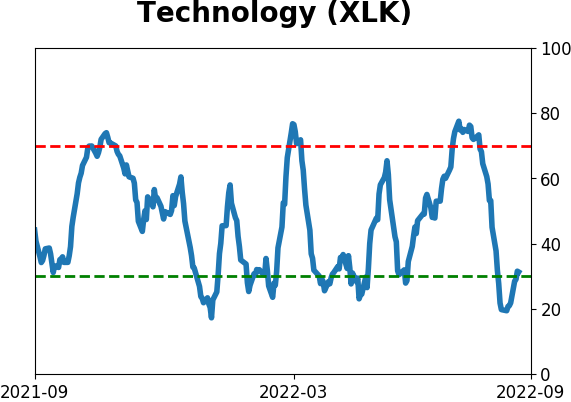
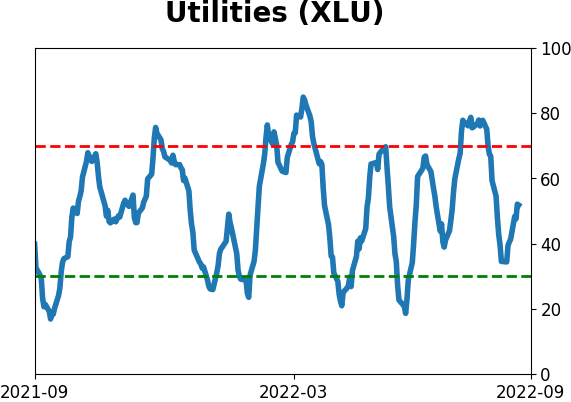
Sector ETF's - 10-Day Moving Average
|
|
|
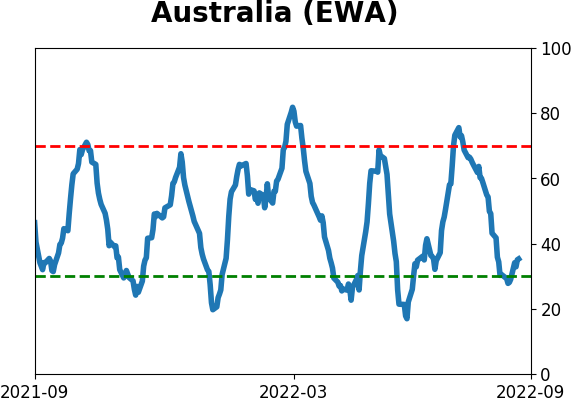
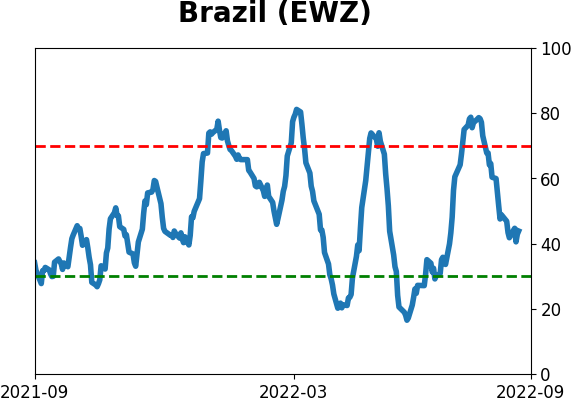
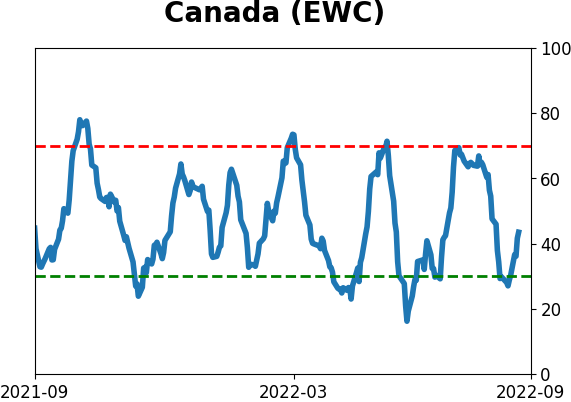
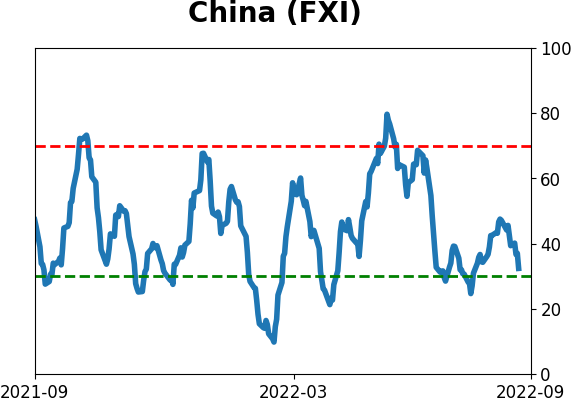
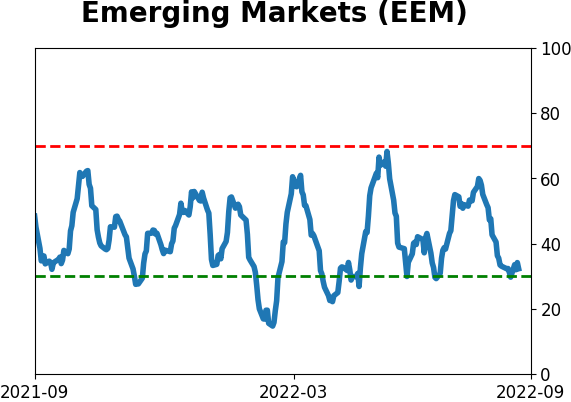
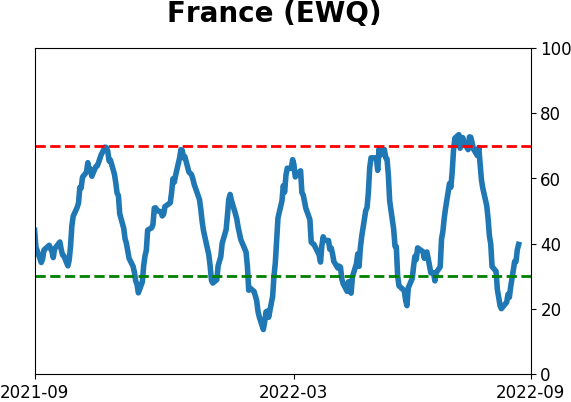
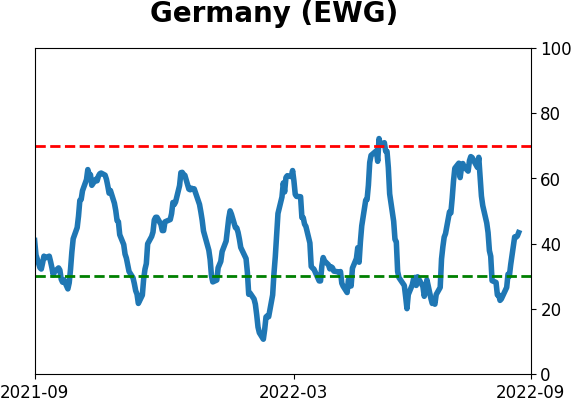
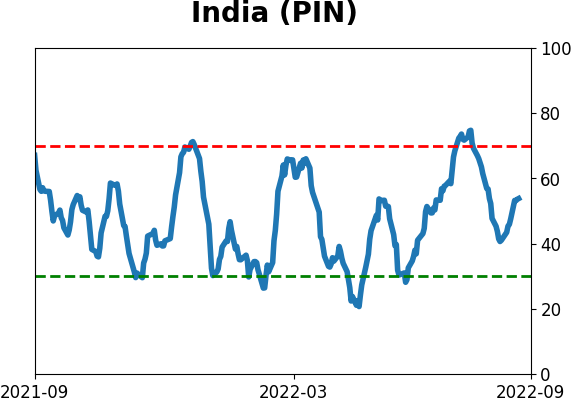
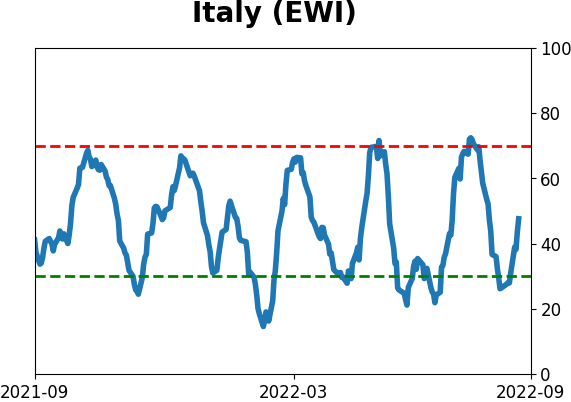
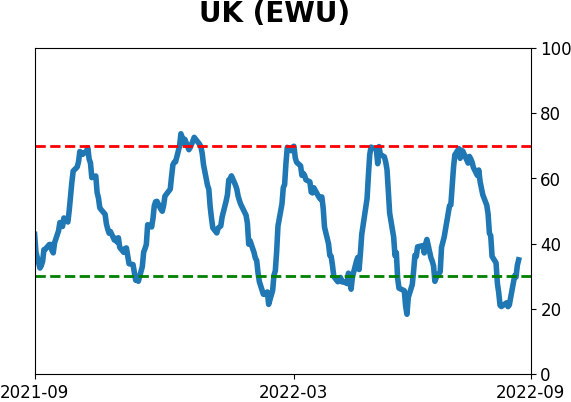
Country ETF's - 10-Day Moving Average
|
|
|
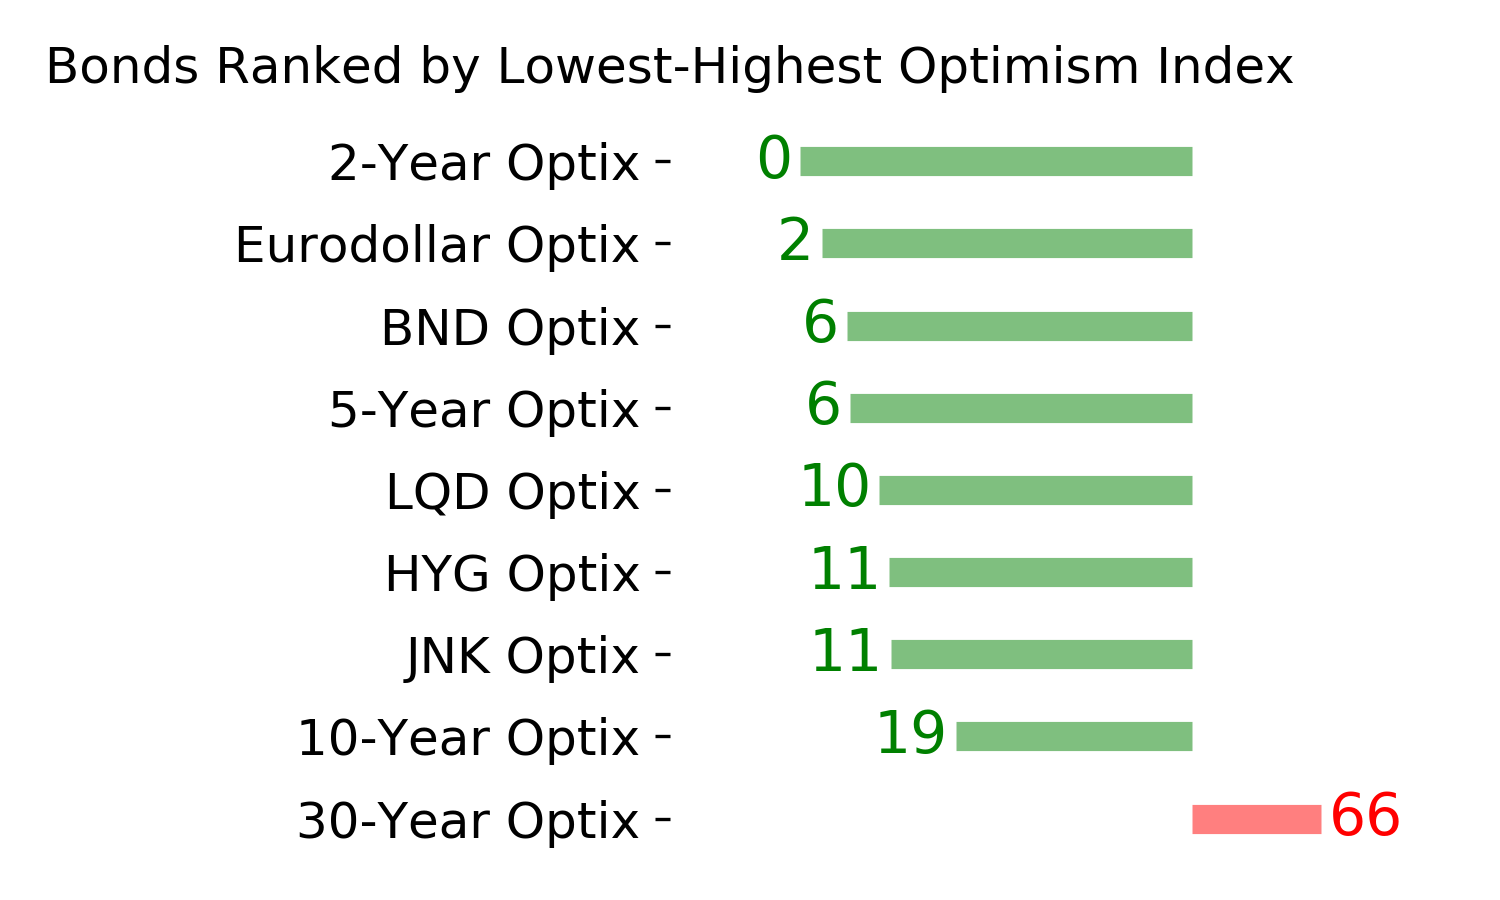
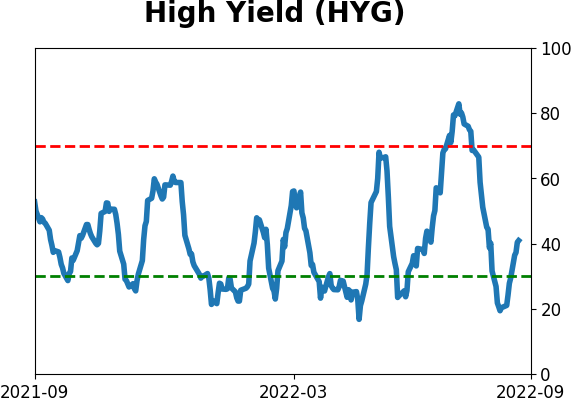
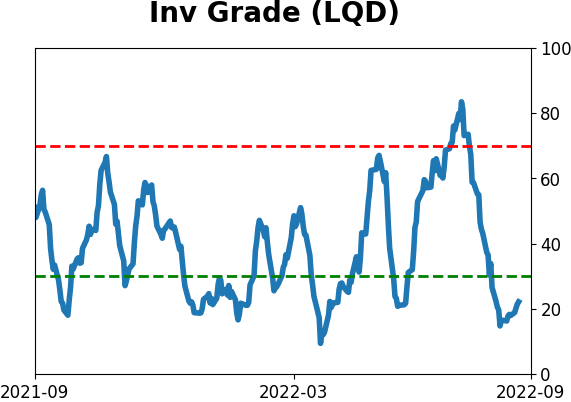
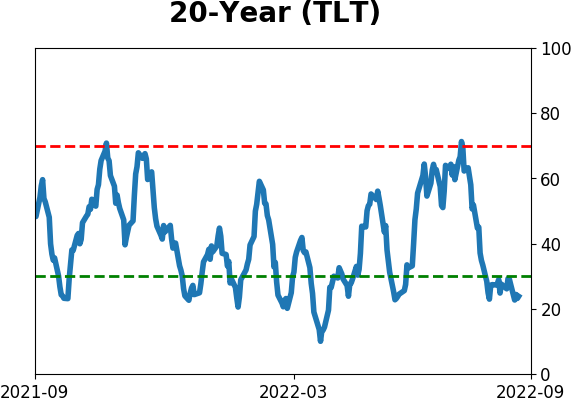
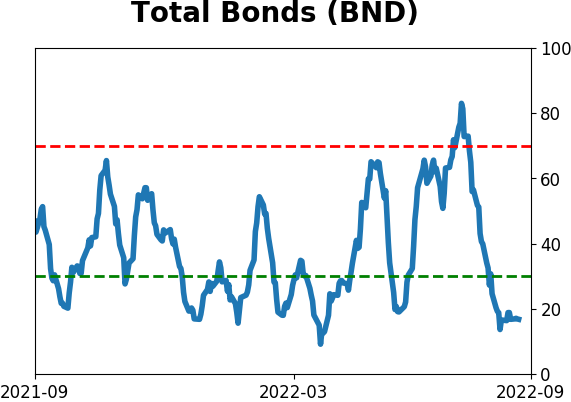
Bond ETF's - 10-Day Moving Average
|
|
|
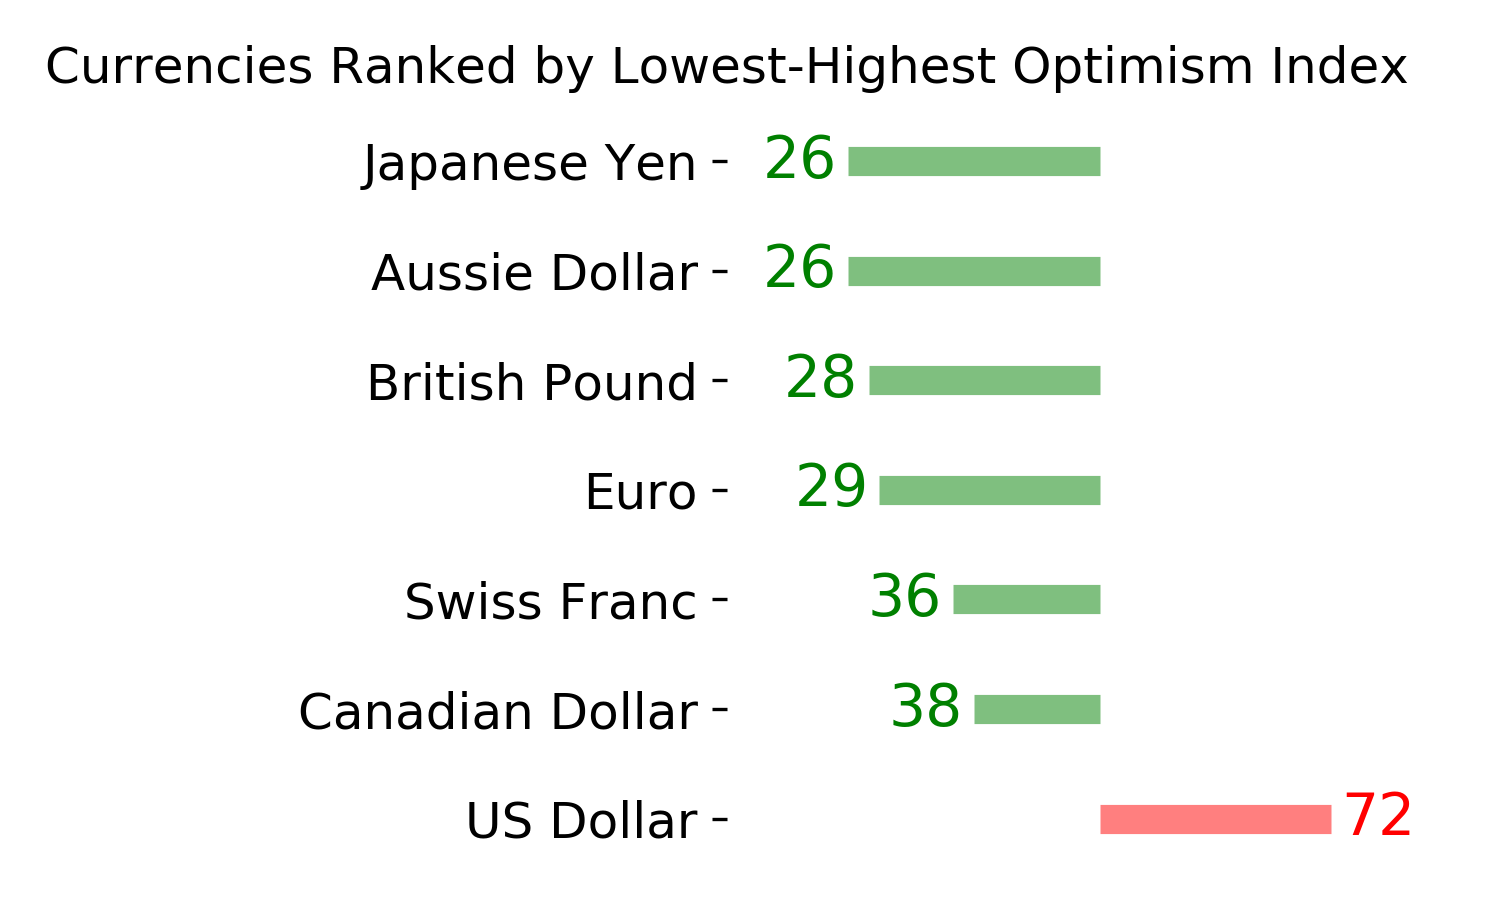
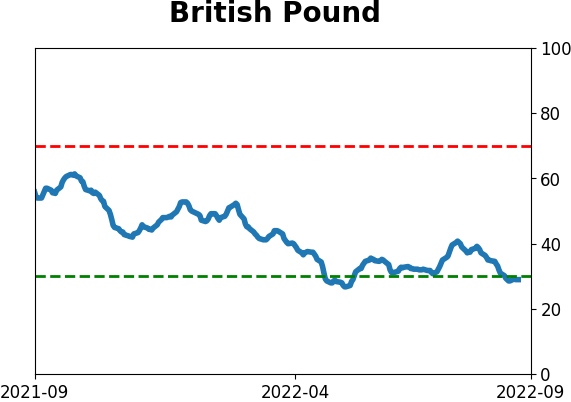
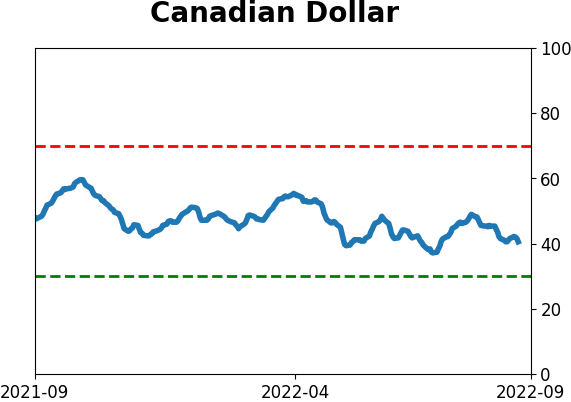
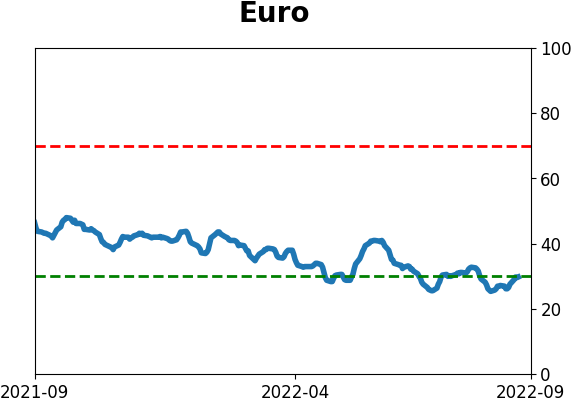
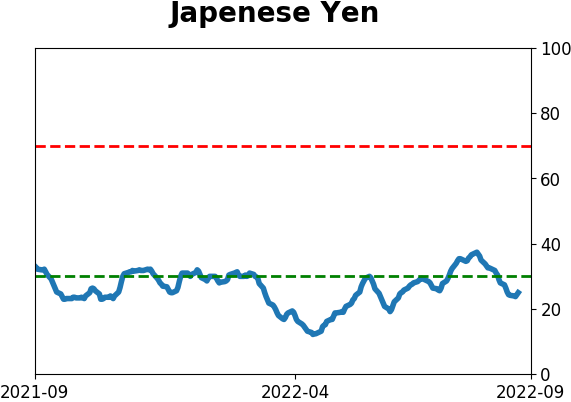
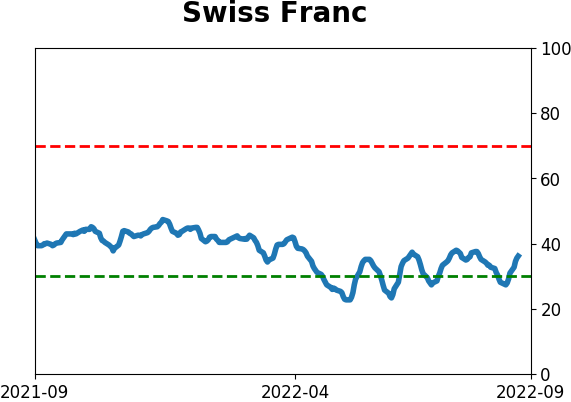
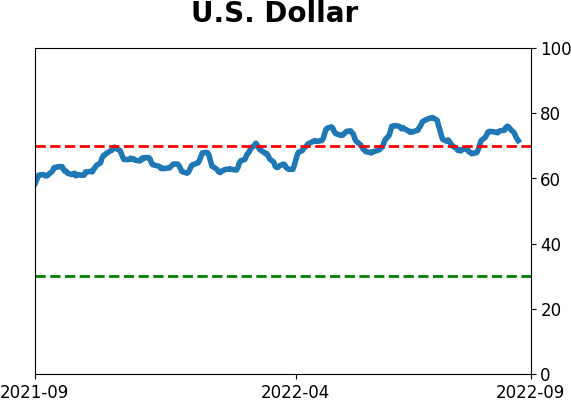
Currency ETF's - 5-Day Moving Average
|
|
|
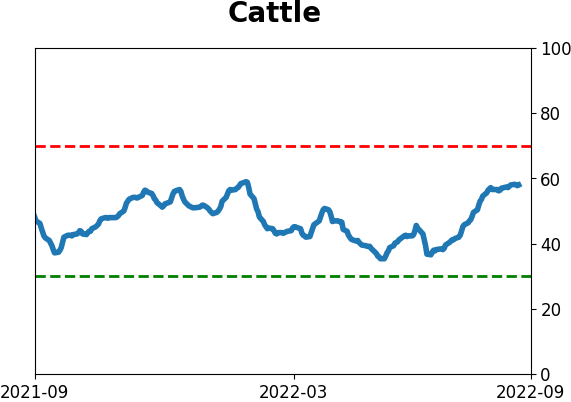
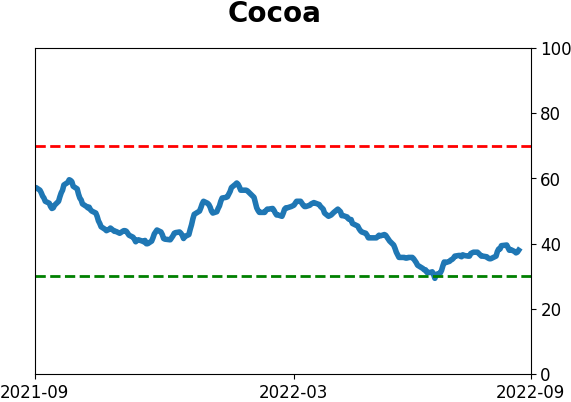
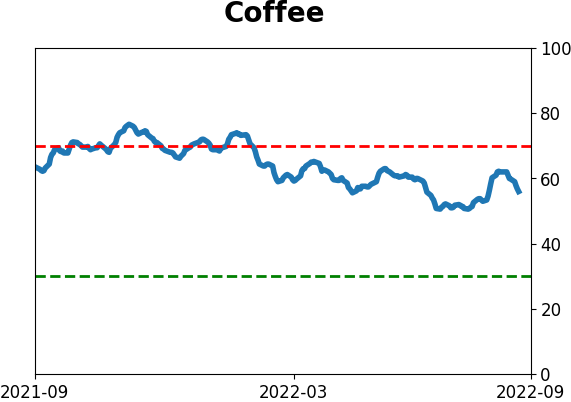
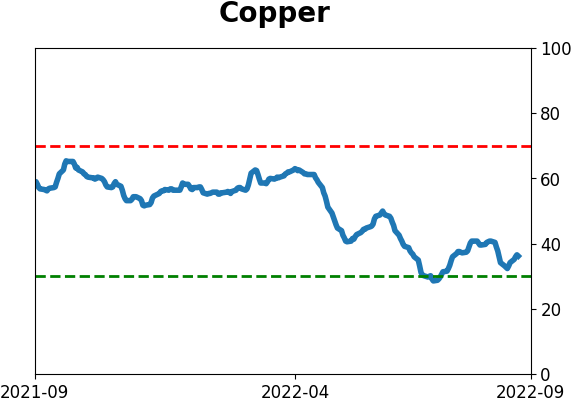
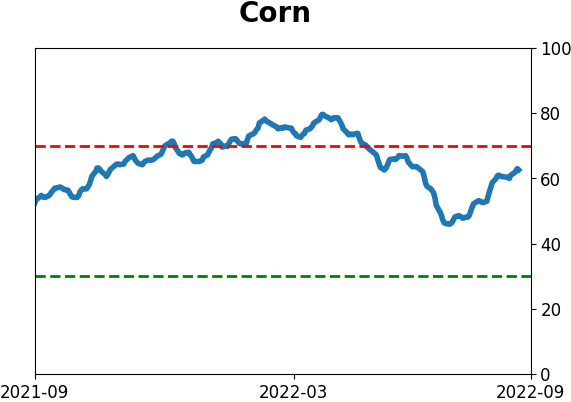
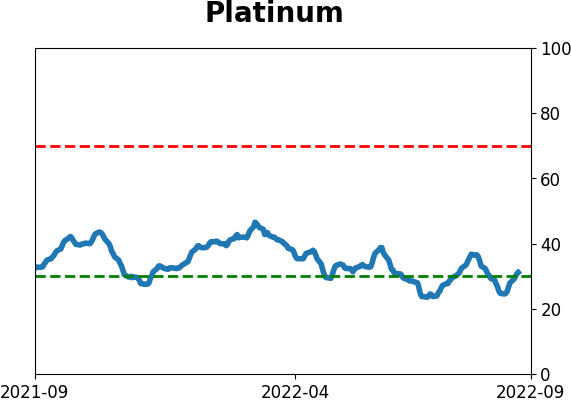
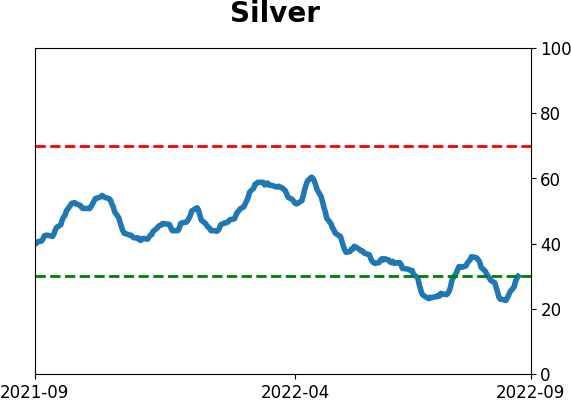
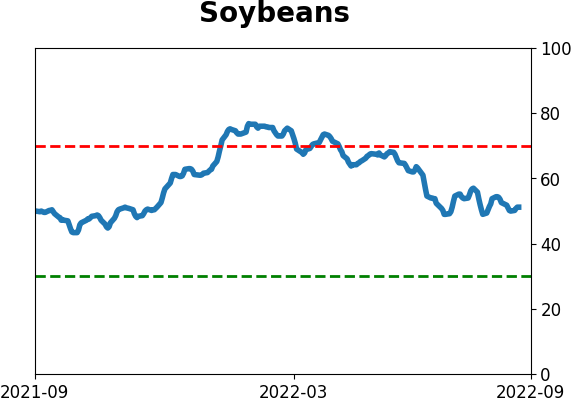
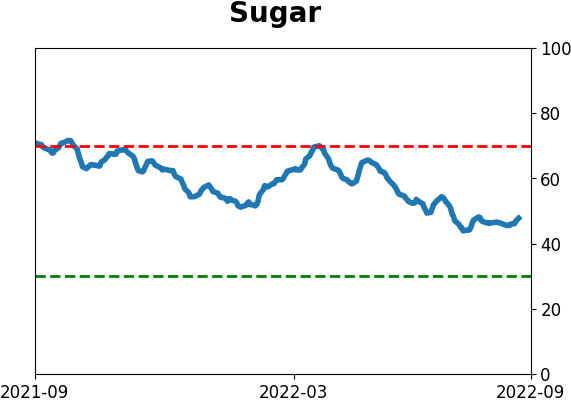
Commodity ETF's - 5-Day Moving Average
|
|