Headlines
|
|
Now a negative thrust after bad economic data:
After a week of heavy buying interest, stocks suffered one of the worst selling days in 90 years. That doesn't necessarily negate the implications of the buying interest, as similar reactions mostly preceded medium- to long-term gains. So did bad reactions to major economic reports, especially the CPI.
|
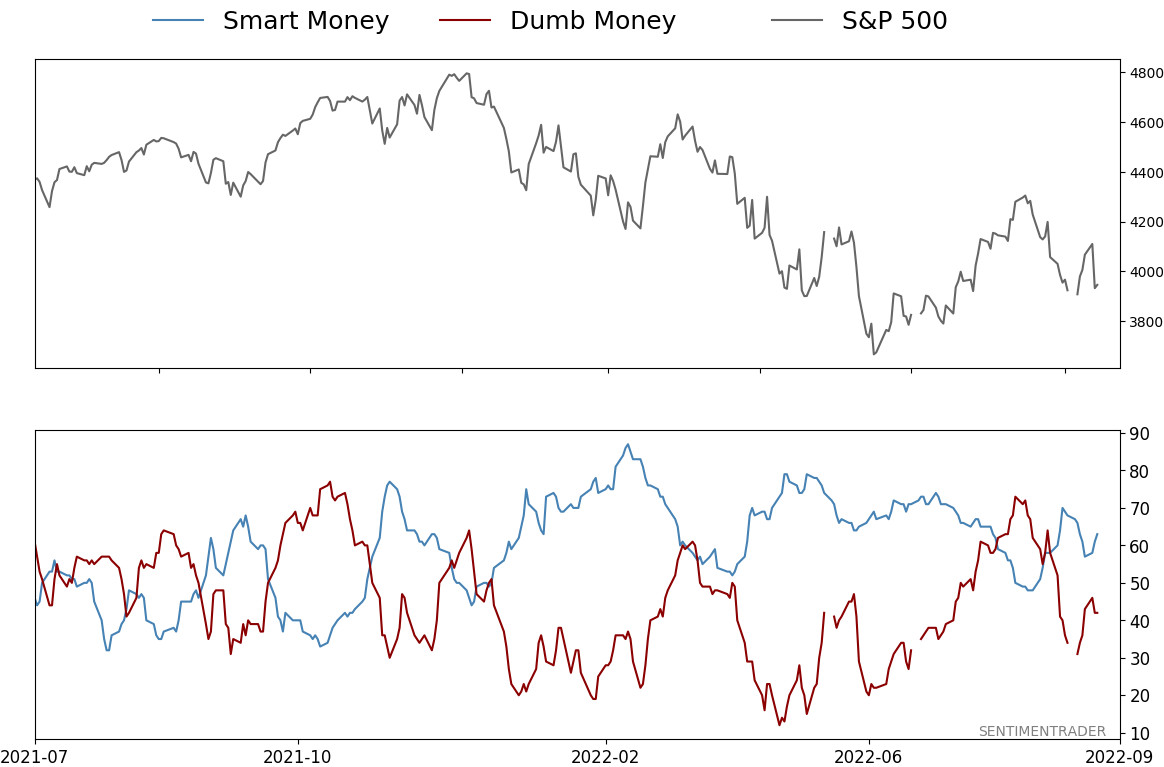
Smart / Dumb Money Confidence
|
Smart Money Confidence: 63%
Dumb Money Confidence: 42%
|
|
Risk Levels
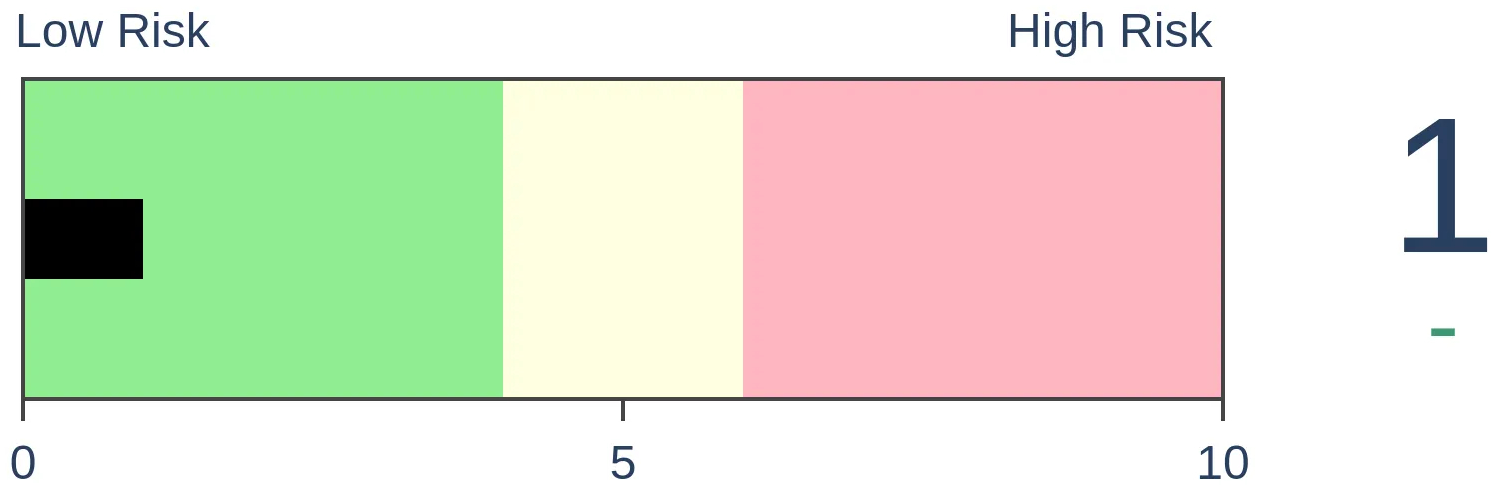
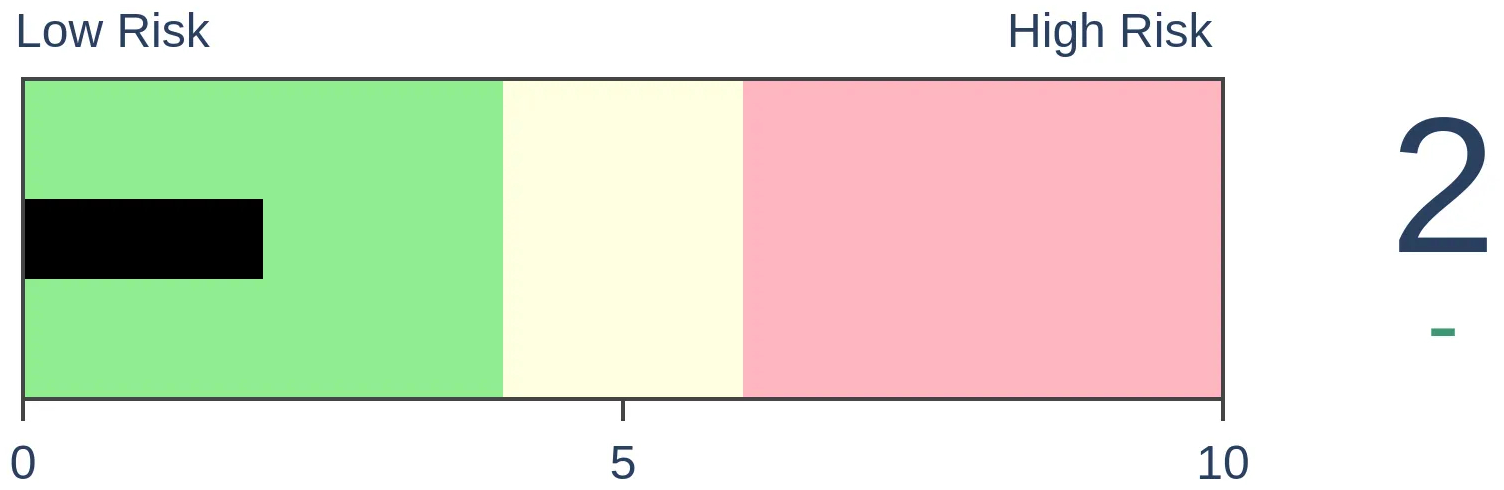
Stocks Short-Term
|
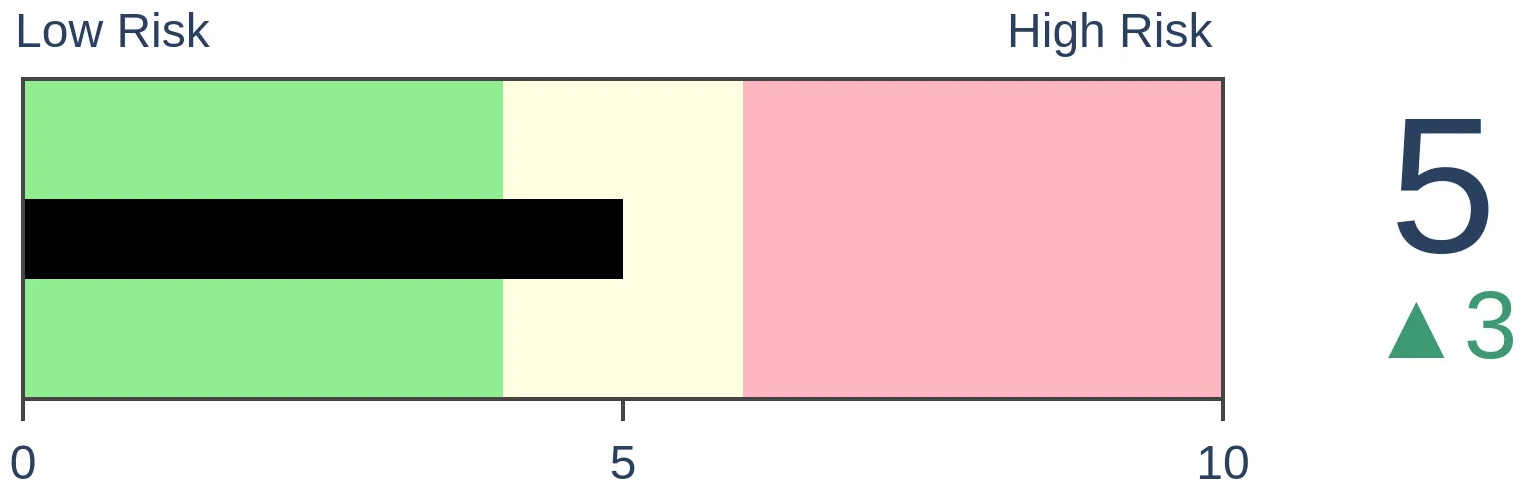
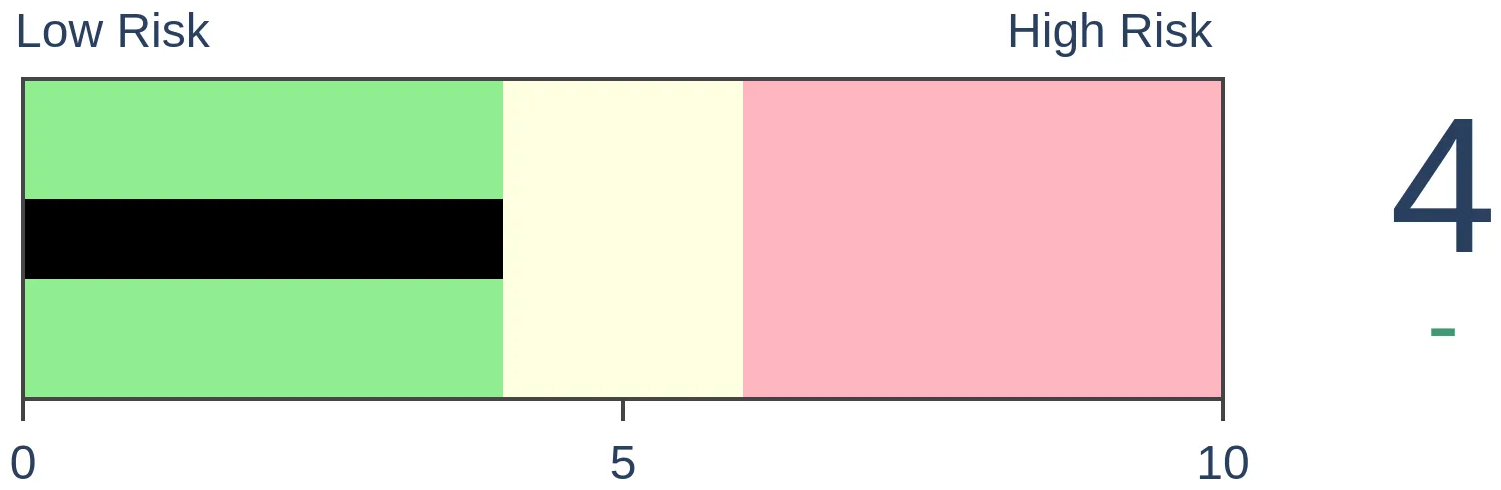
Stocks Medium-Term

|
|
Bonds
|
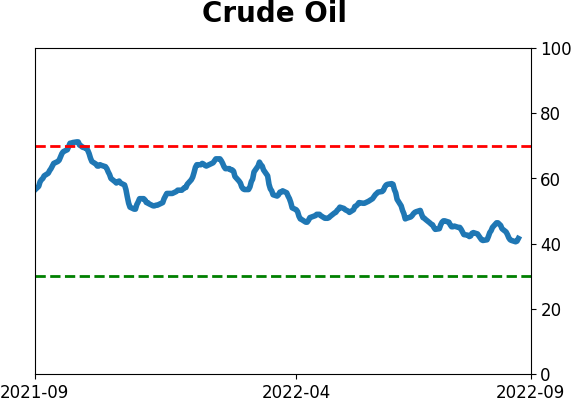
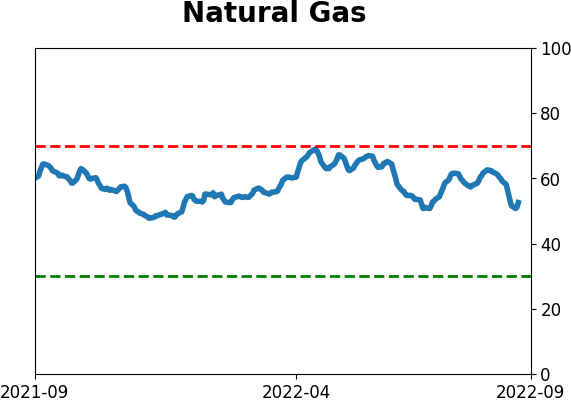
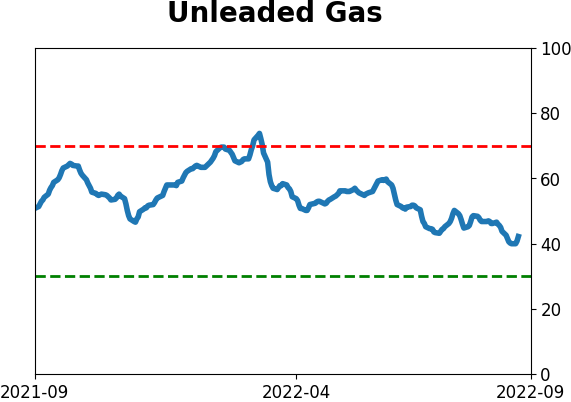
Crude Oil
|
|
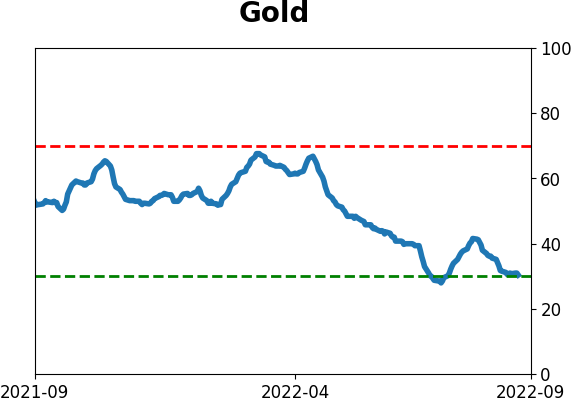
Gold
|
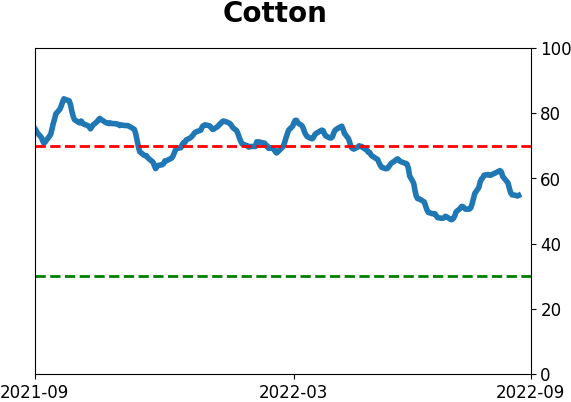
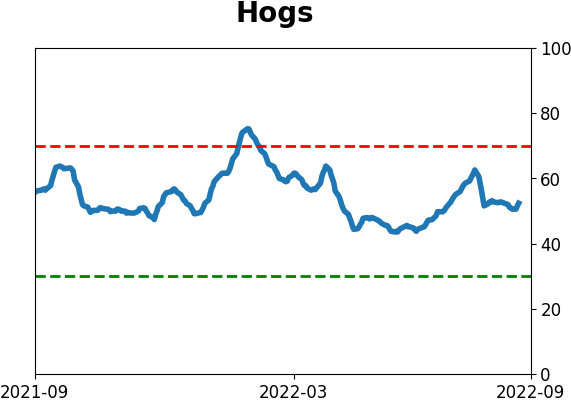
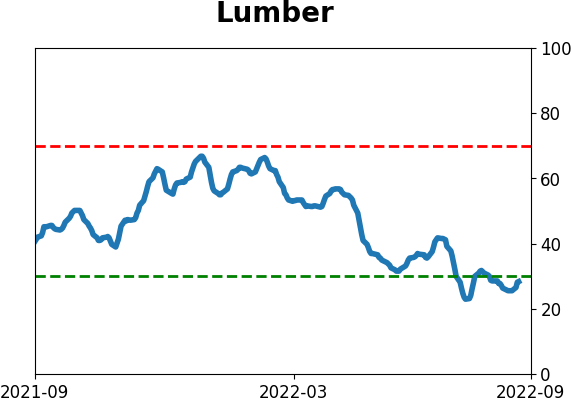
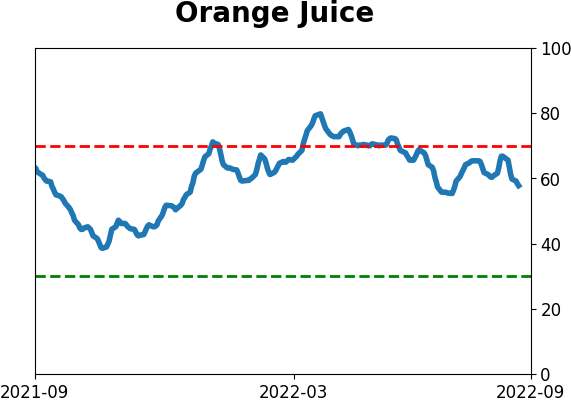
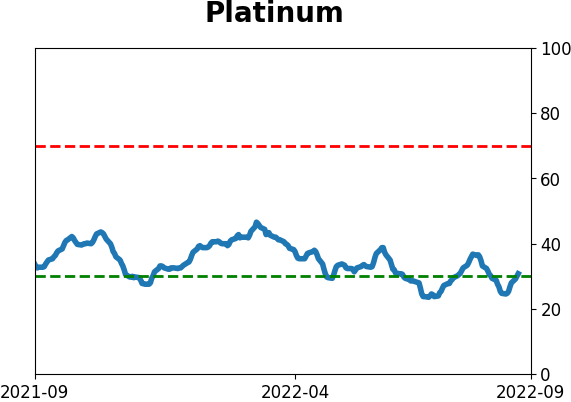
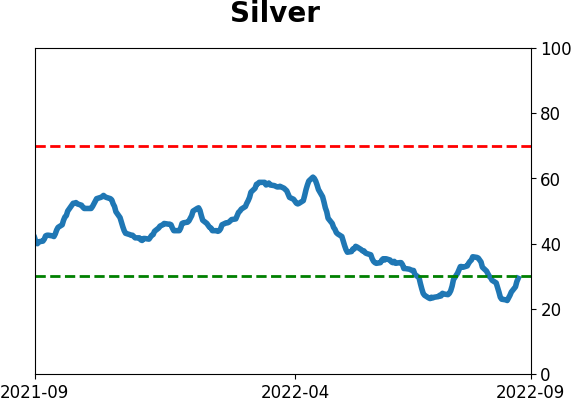
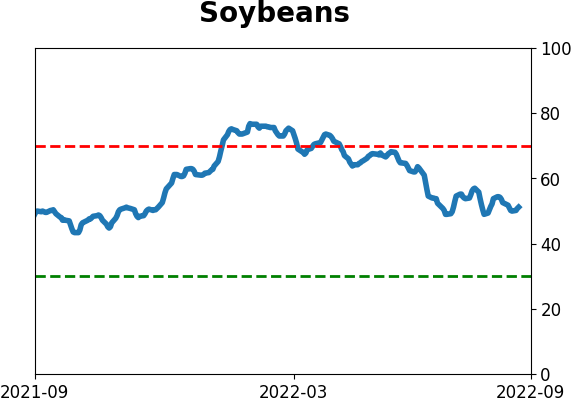
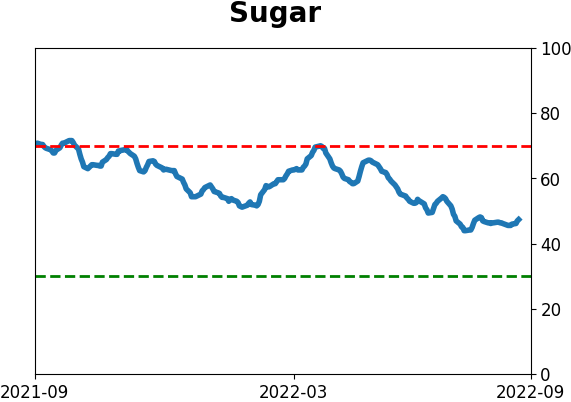
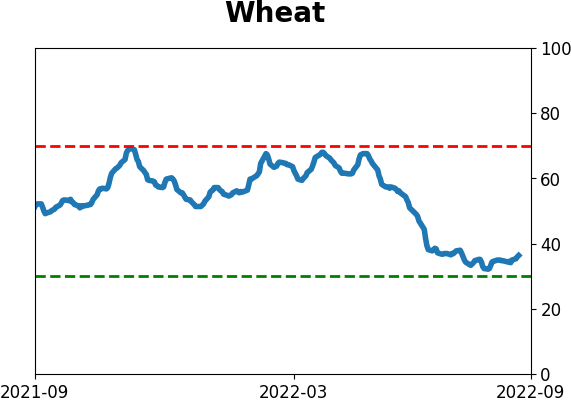
Agriculture

|
|
Research
By Jason Goepfert
BOTTOM LINE
After a week of heavy buying interest, stocks suffered one of the worst selling days in 90 years. That doesn't necessarily negate the implications of the buying interest, as similar reactions mostly preceded medium- to long-term gains. So did bad reactions to major economic reports, especially the CPI.
FORECAST / TIMEFRAME
None
|
Key points:
- After a multi-day breadth thrust, stocks suffered a day with overwhelming selling pressure
- Bad reactions to a breadth thrust didn't necessarily negate their positive implications
- Neither did bad reactions to major economic reports, especially the CPI
So much for that breadth thrust
Heading into Tuesday's inflation report, buyers were in clear control, triggering thrusts within the S&P 500 and broader NYSE exchange. While short-term returns after other thrusts were mixed, medium- to long-term results were clear. And clearly positive.
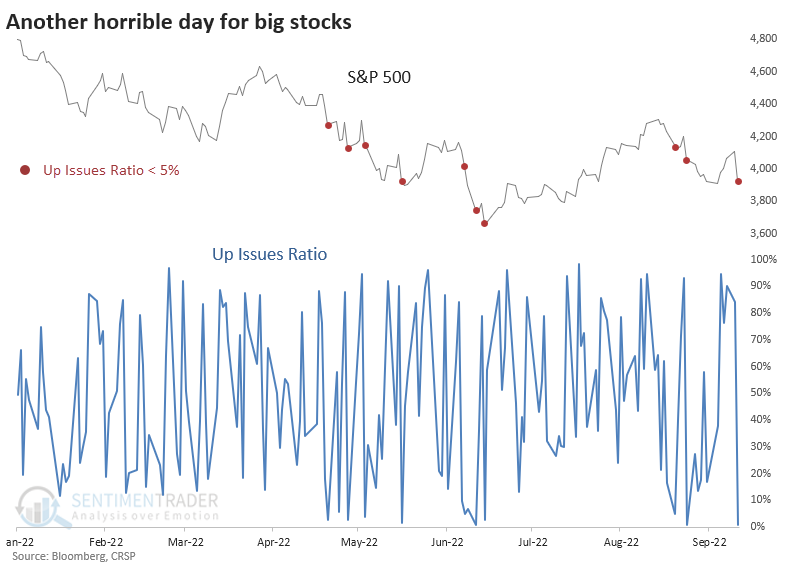
Like other thrusts since December, though, this one has landed with a splat. Tuesday's reaction to the CPI release led to some of the worst selling pressure ever, with few stocks escaping the damage. This year has been littered with days when fewer than 5% of stocks in the S&P 500 managed to rise.
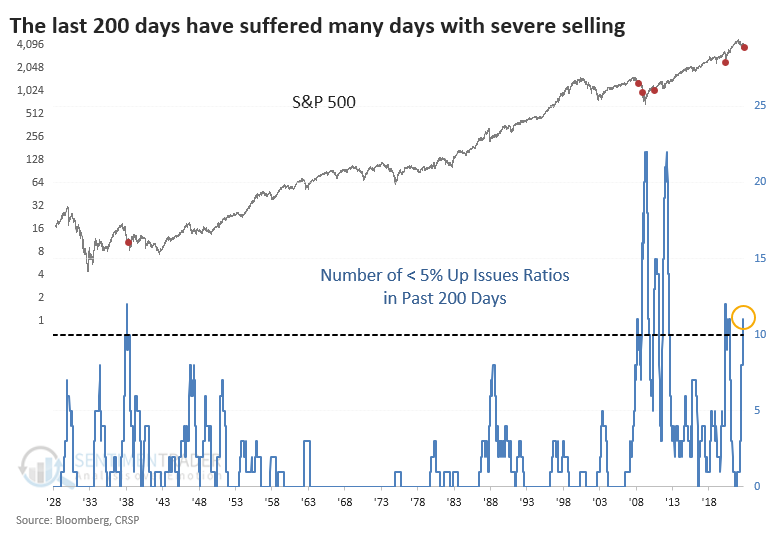
Tuesday continued a 200-day stretch with among the most days of truly overwhelming selling pressure ever. It was the 11th session when fewer than 5% of stocks advanced, ranking among the few times in history that investors suffered ten or more such days in a 200-day window.
It was even worse than that, though. Selling pressure within the S&P was so overwhelming on Tuesday that fewer than 1% of stocks in the index advanced. That ranks among the worst days in its history.
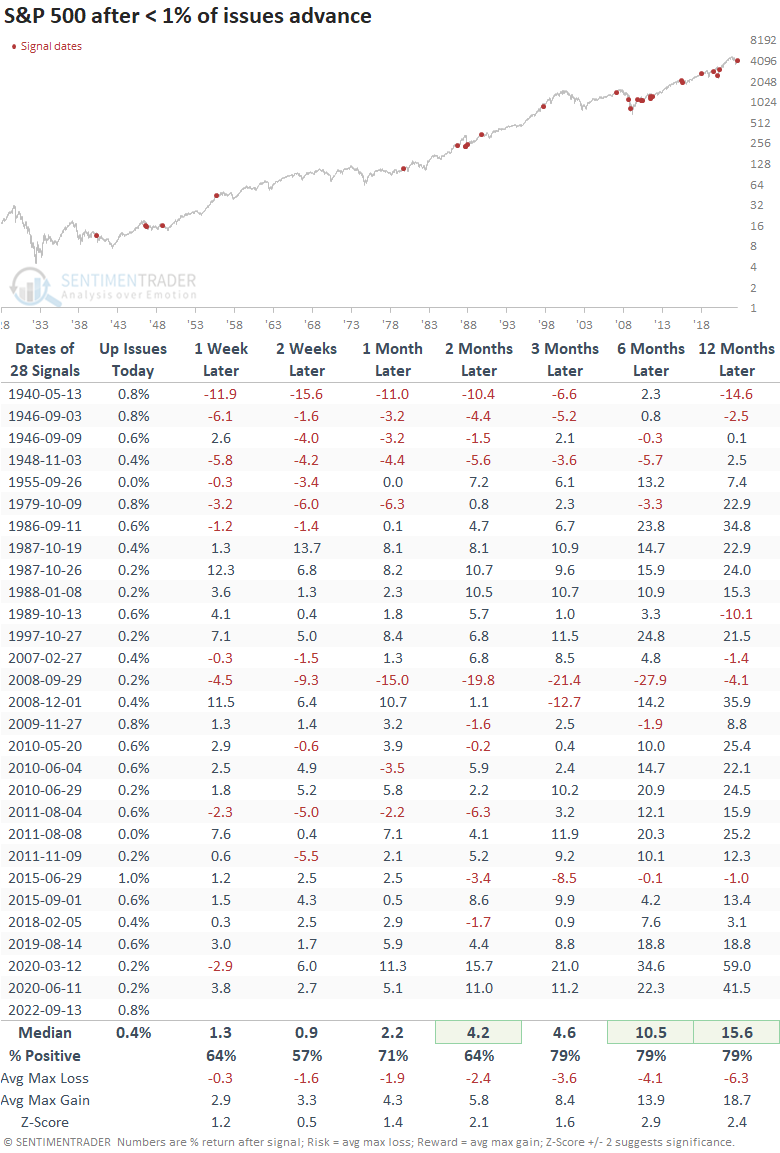
What's most curious about this one is that few other times in history had breadth been so positive heading into a day with such overwhelming selling pressure.
Through Monday, the 5-day average Up Issues Ratio on the S&P was 77%. The table below shows other times when the 5-day average was above 70%, and then those buyers got whacked with a day of overwhelming selling pressure.
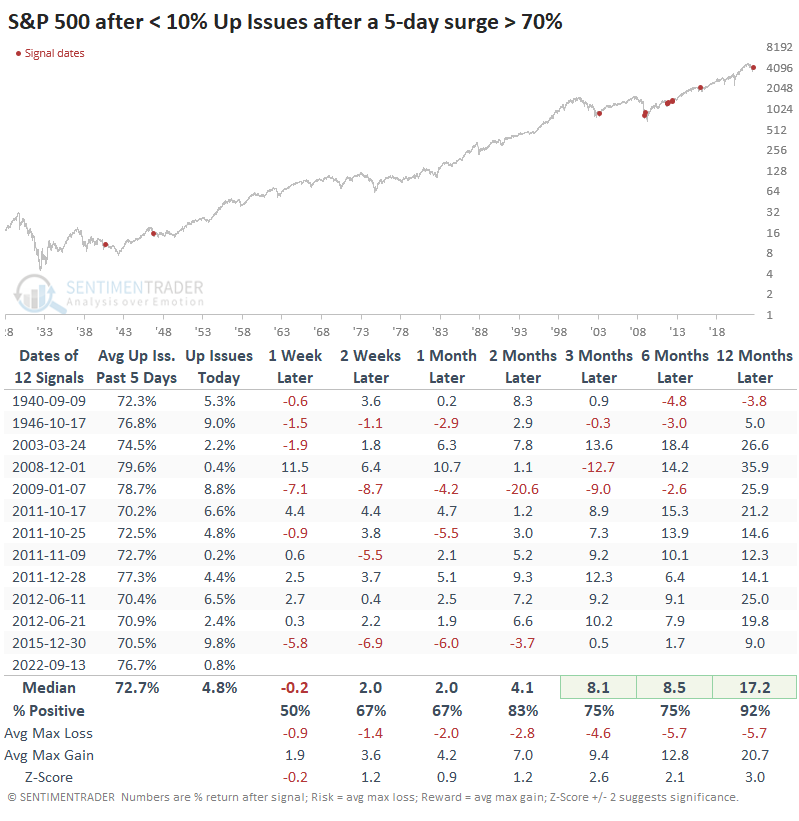
These bad reactions to what had been impressive thrusts did not necessarily negate the positivity. Over the next few months, the S&P rose almost every time, though some significant interim losses were mixed in there. Over the next year, only a signal in 1946 showed a (slight) loss.
The lousy reaction was due to an economic release
Over the decades, we've often cautioned against reading too much into knee-jerk reactions to news events or economic releases. Time and time again, that initial move proves to be a fake-out, with investors stepping in after traders panic buy or sell.
Still, it's hard to shake the idea that such a large move after such a critical report shifted the narrative that investors have relied on for months, or at least the last couple of weeks. It was undoubtedly one of the most severe declines after any major economic release in the past 25 years.
Below, we look at the S&P 500's worst reactions after the economic reports that have tended to move markets the most:
- Nonfarm Payrolls
- Gross Domestic Product (GDP)
- Consumer Price Index (CPI)
- Retail Sales
- Durable Goods Orders
- Conference Board Consumer Confidence
- FOMC Meetings
The table looks at times when the S&P dropped 3% or more on a day one of those reports was released to the public.
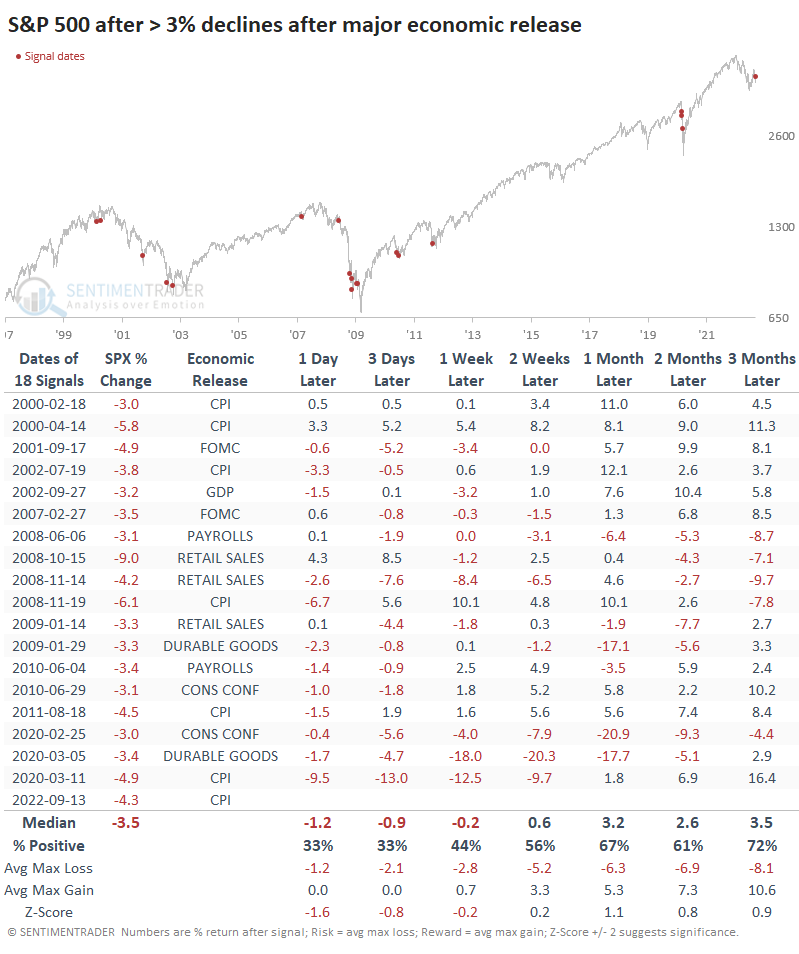
Stocks tended to stay weak for a few days, then rebound, even though bad reactions tend to occur during the worst market environments. That makes sense because volatility, in general, tends to be higher during bear markets.
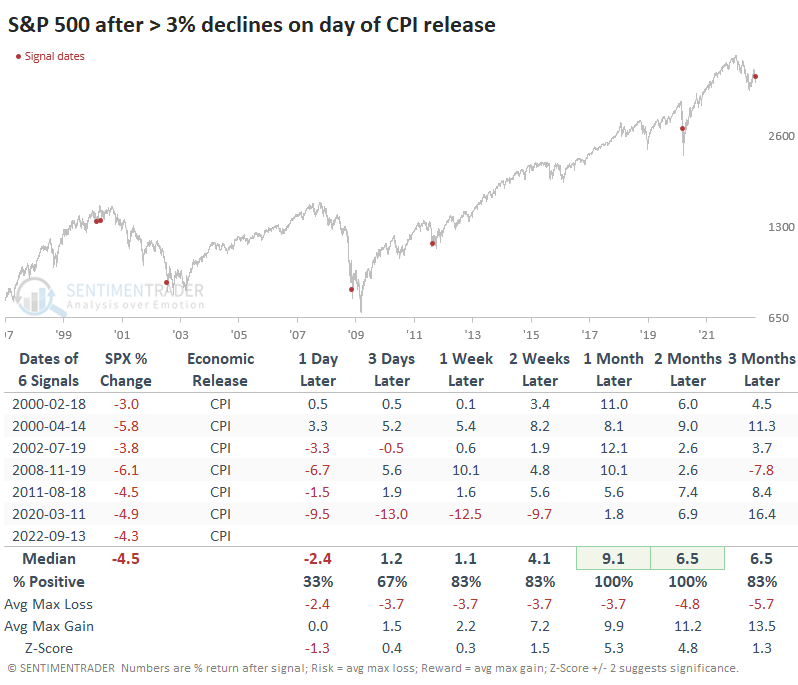
Returns improve if we focus solely on bad reactions to the CPI report. Over the next one to two months, the S&P rebounded all six times.
What the research tells us...
During bear markets, it's tempting to focus continually on oversold indicators. While that can work on shorter time frames, it can also lead to that dreaded extreme-can-get-more-extreme scenario. It's discouraging that every time since December when buyers have come in with overwhelming force, there is no follow-through. That is classic bear market behavior, and it should be acknowledged.
That kind of behavior needs to change, and there is no evidence of it so far. That doesn't mean it can't happen or even is less likely. As noted above, heavy selling following a breadth thrust doesn't necessarily negate it. Neither does a horrible reaction to a major economic report. If anything, both tended to lead to more favorable returns.
Indicators at Extremes
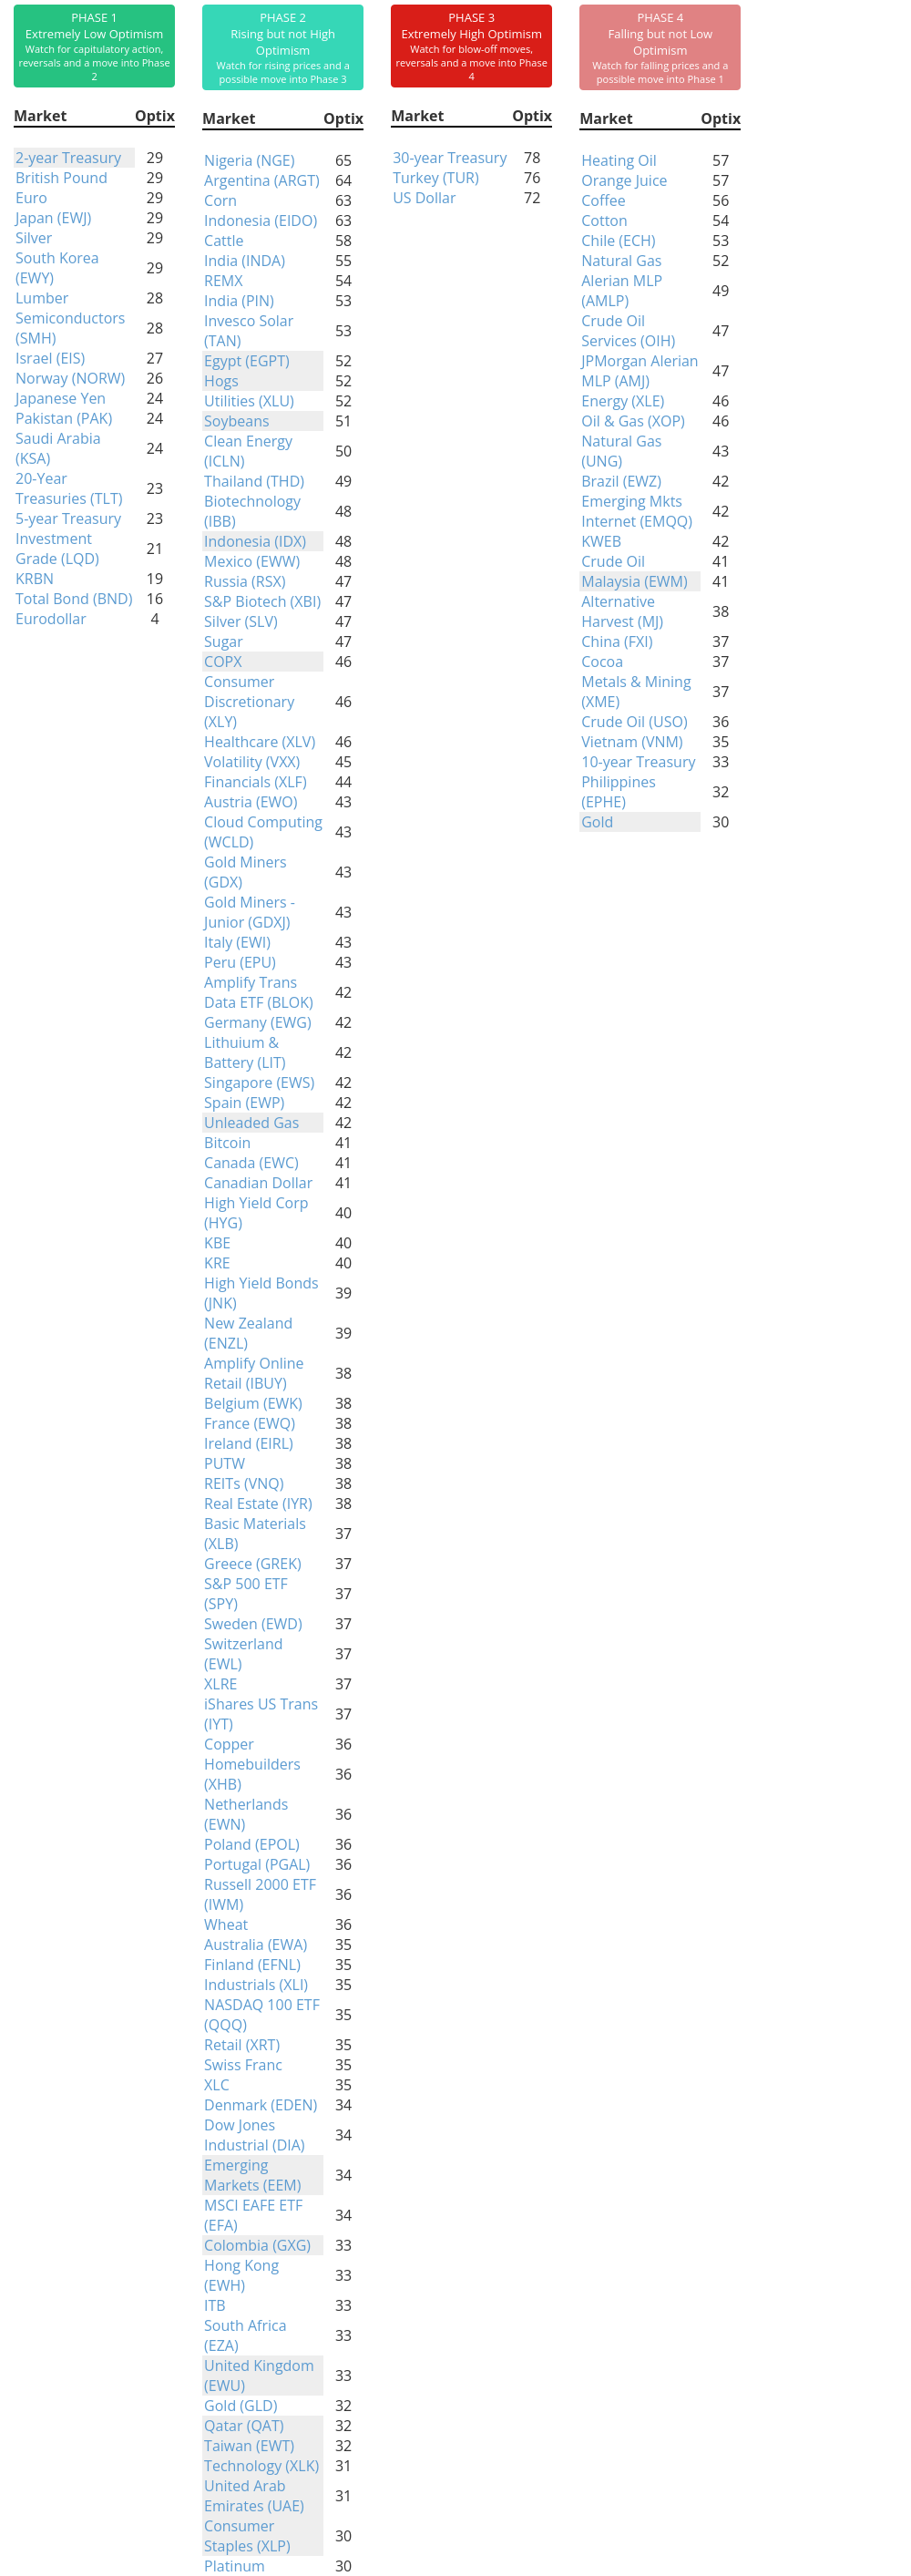
Phase Table
Ranks
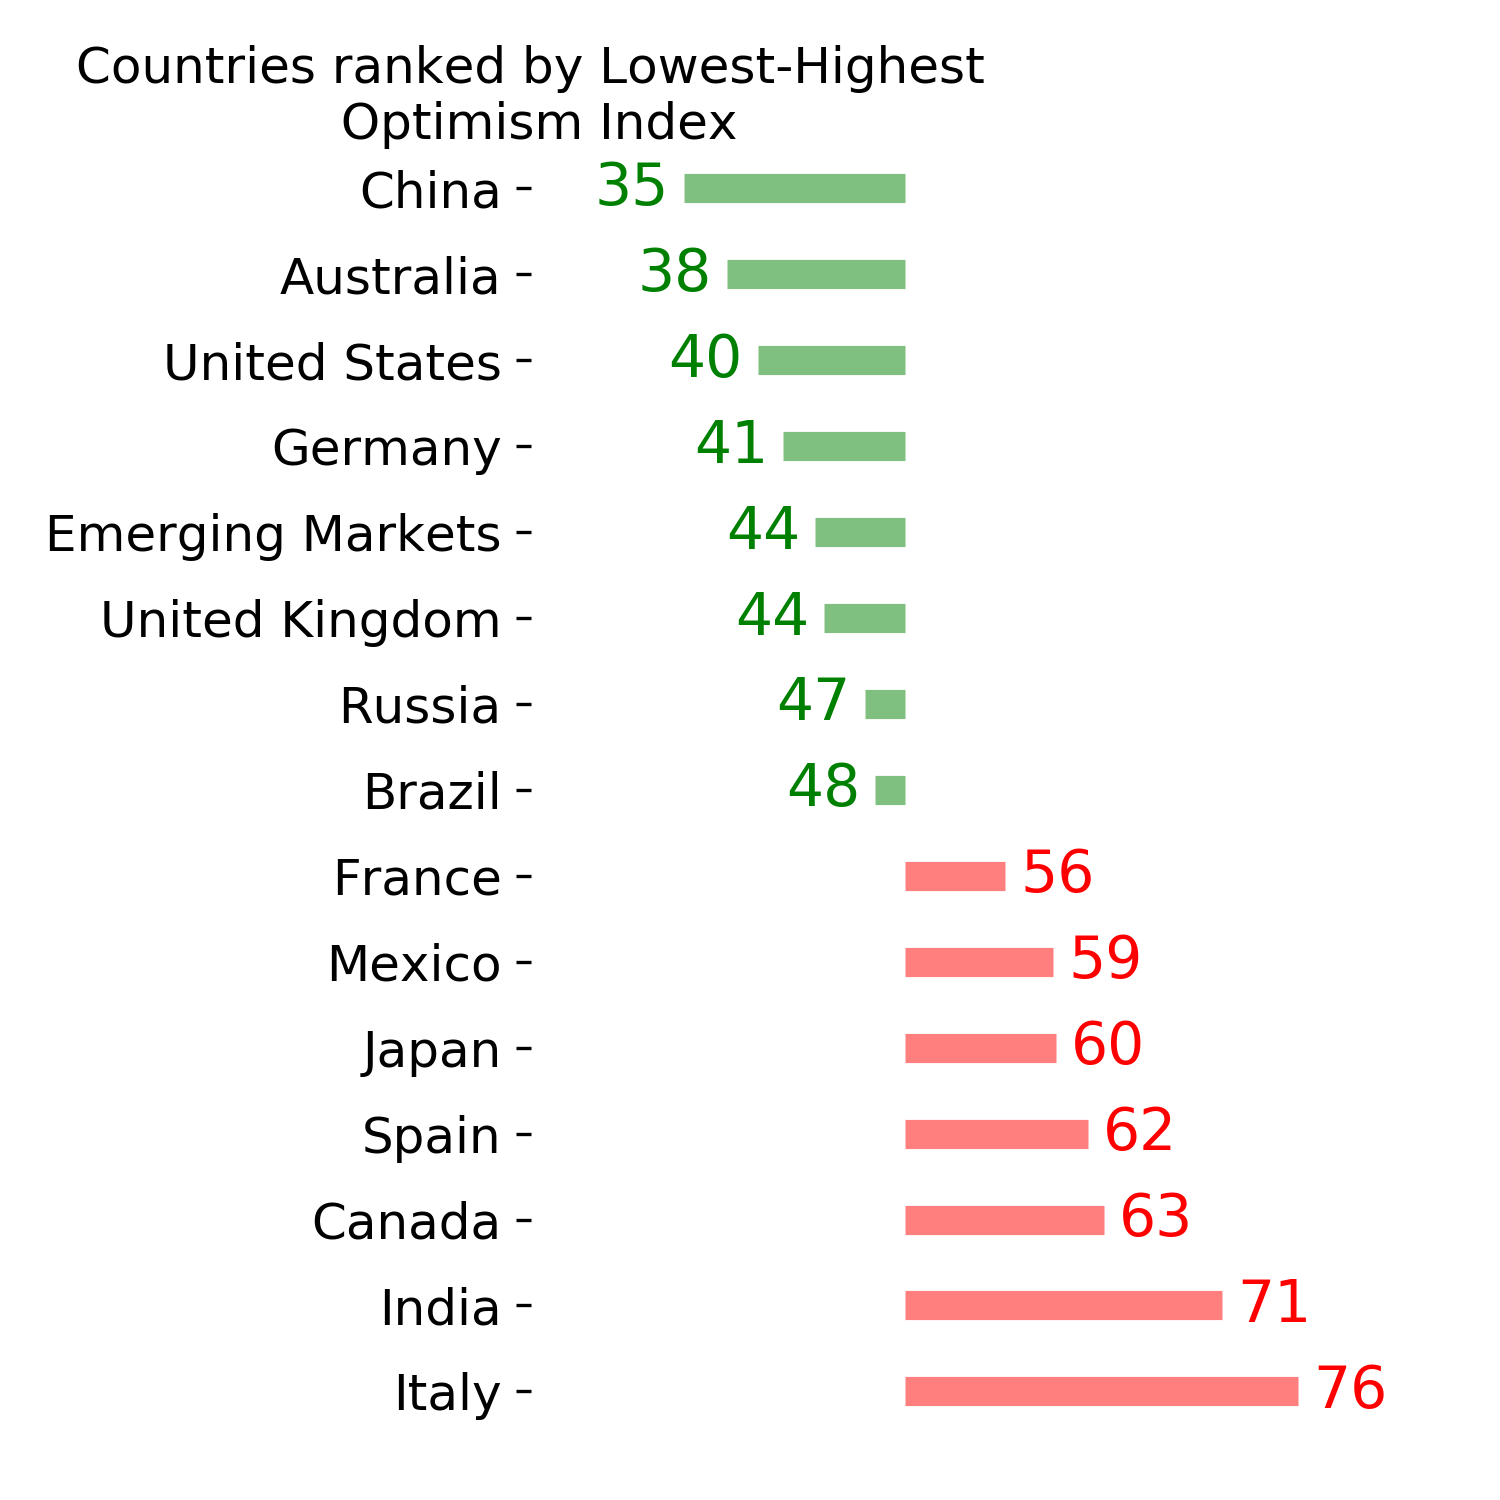
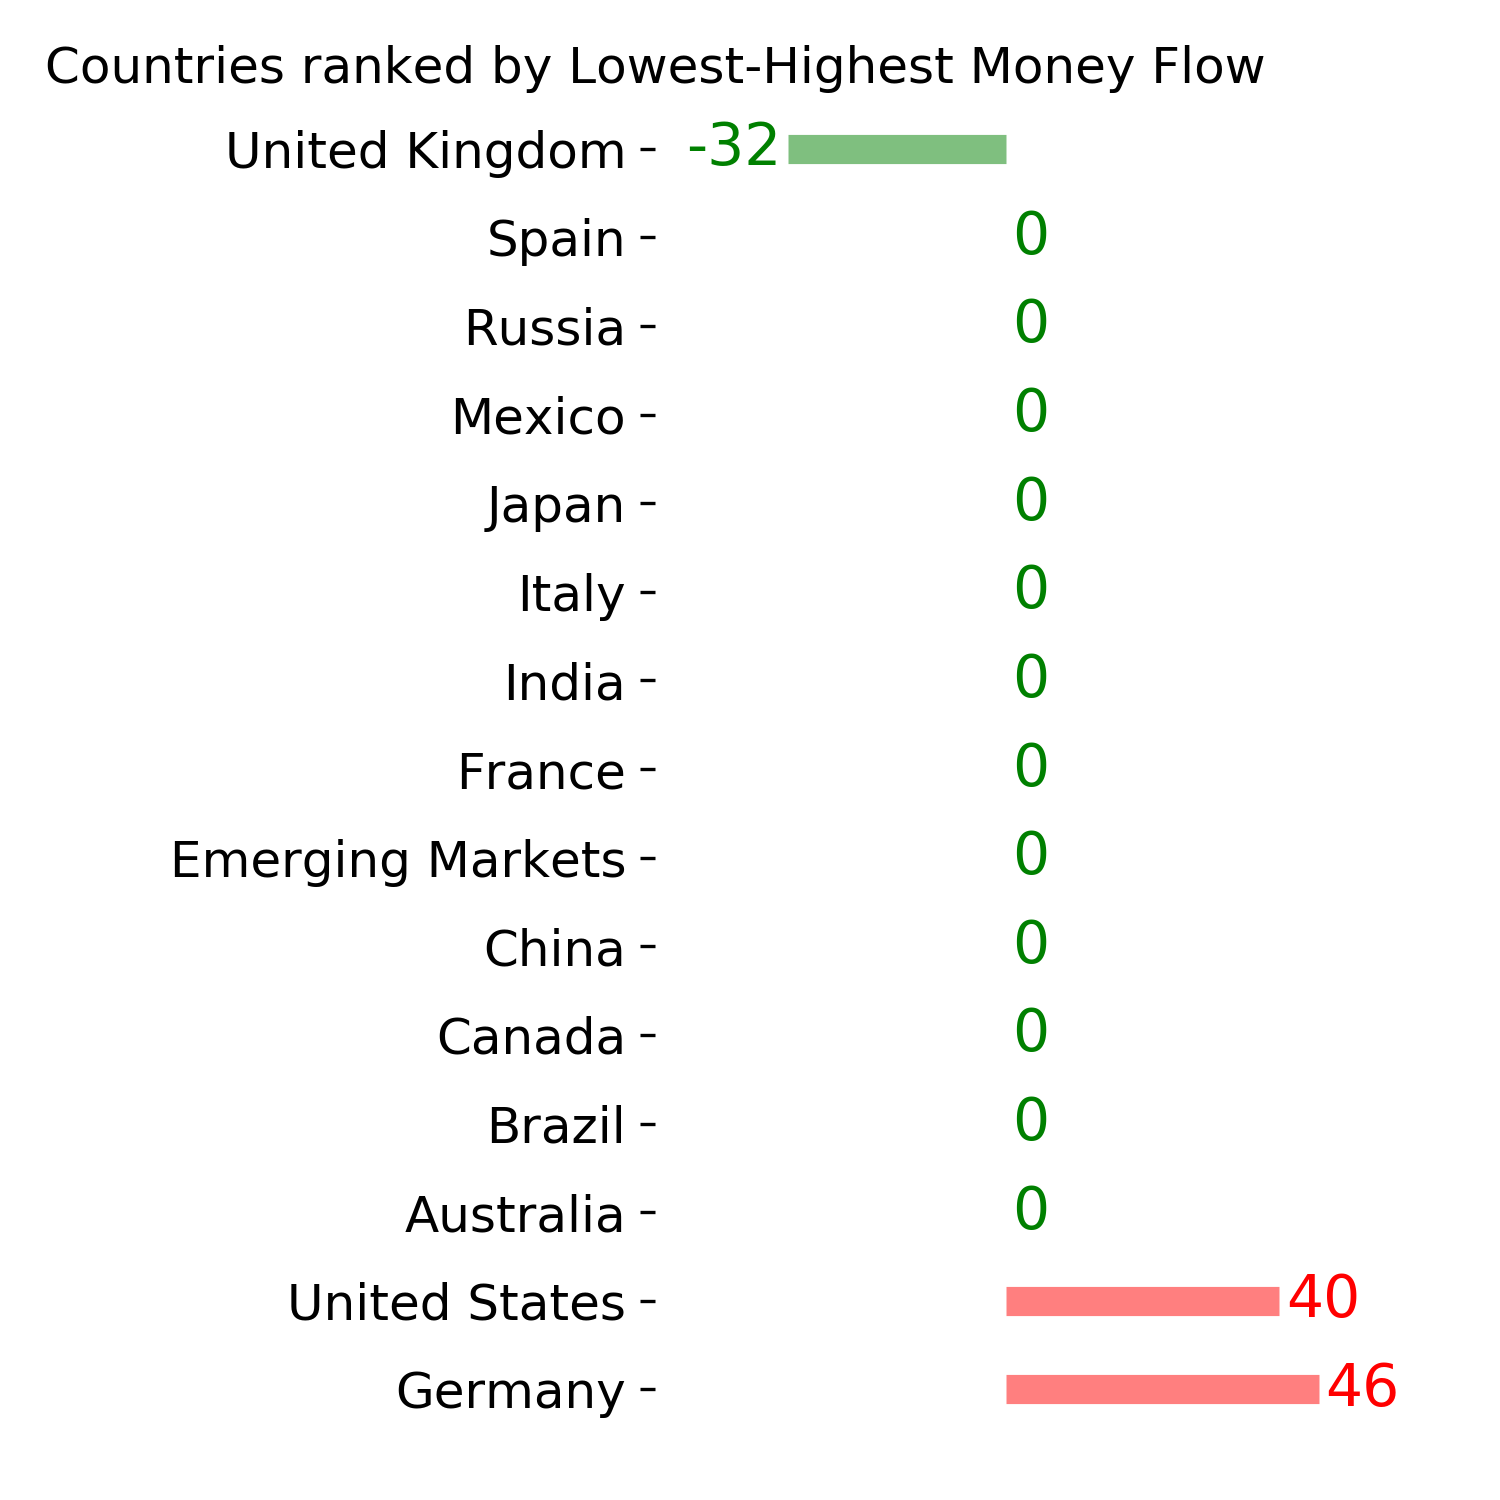
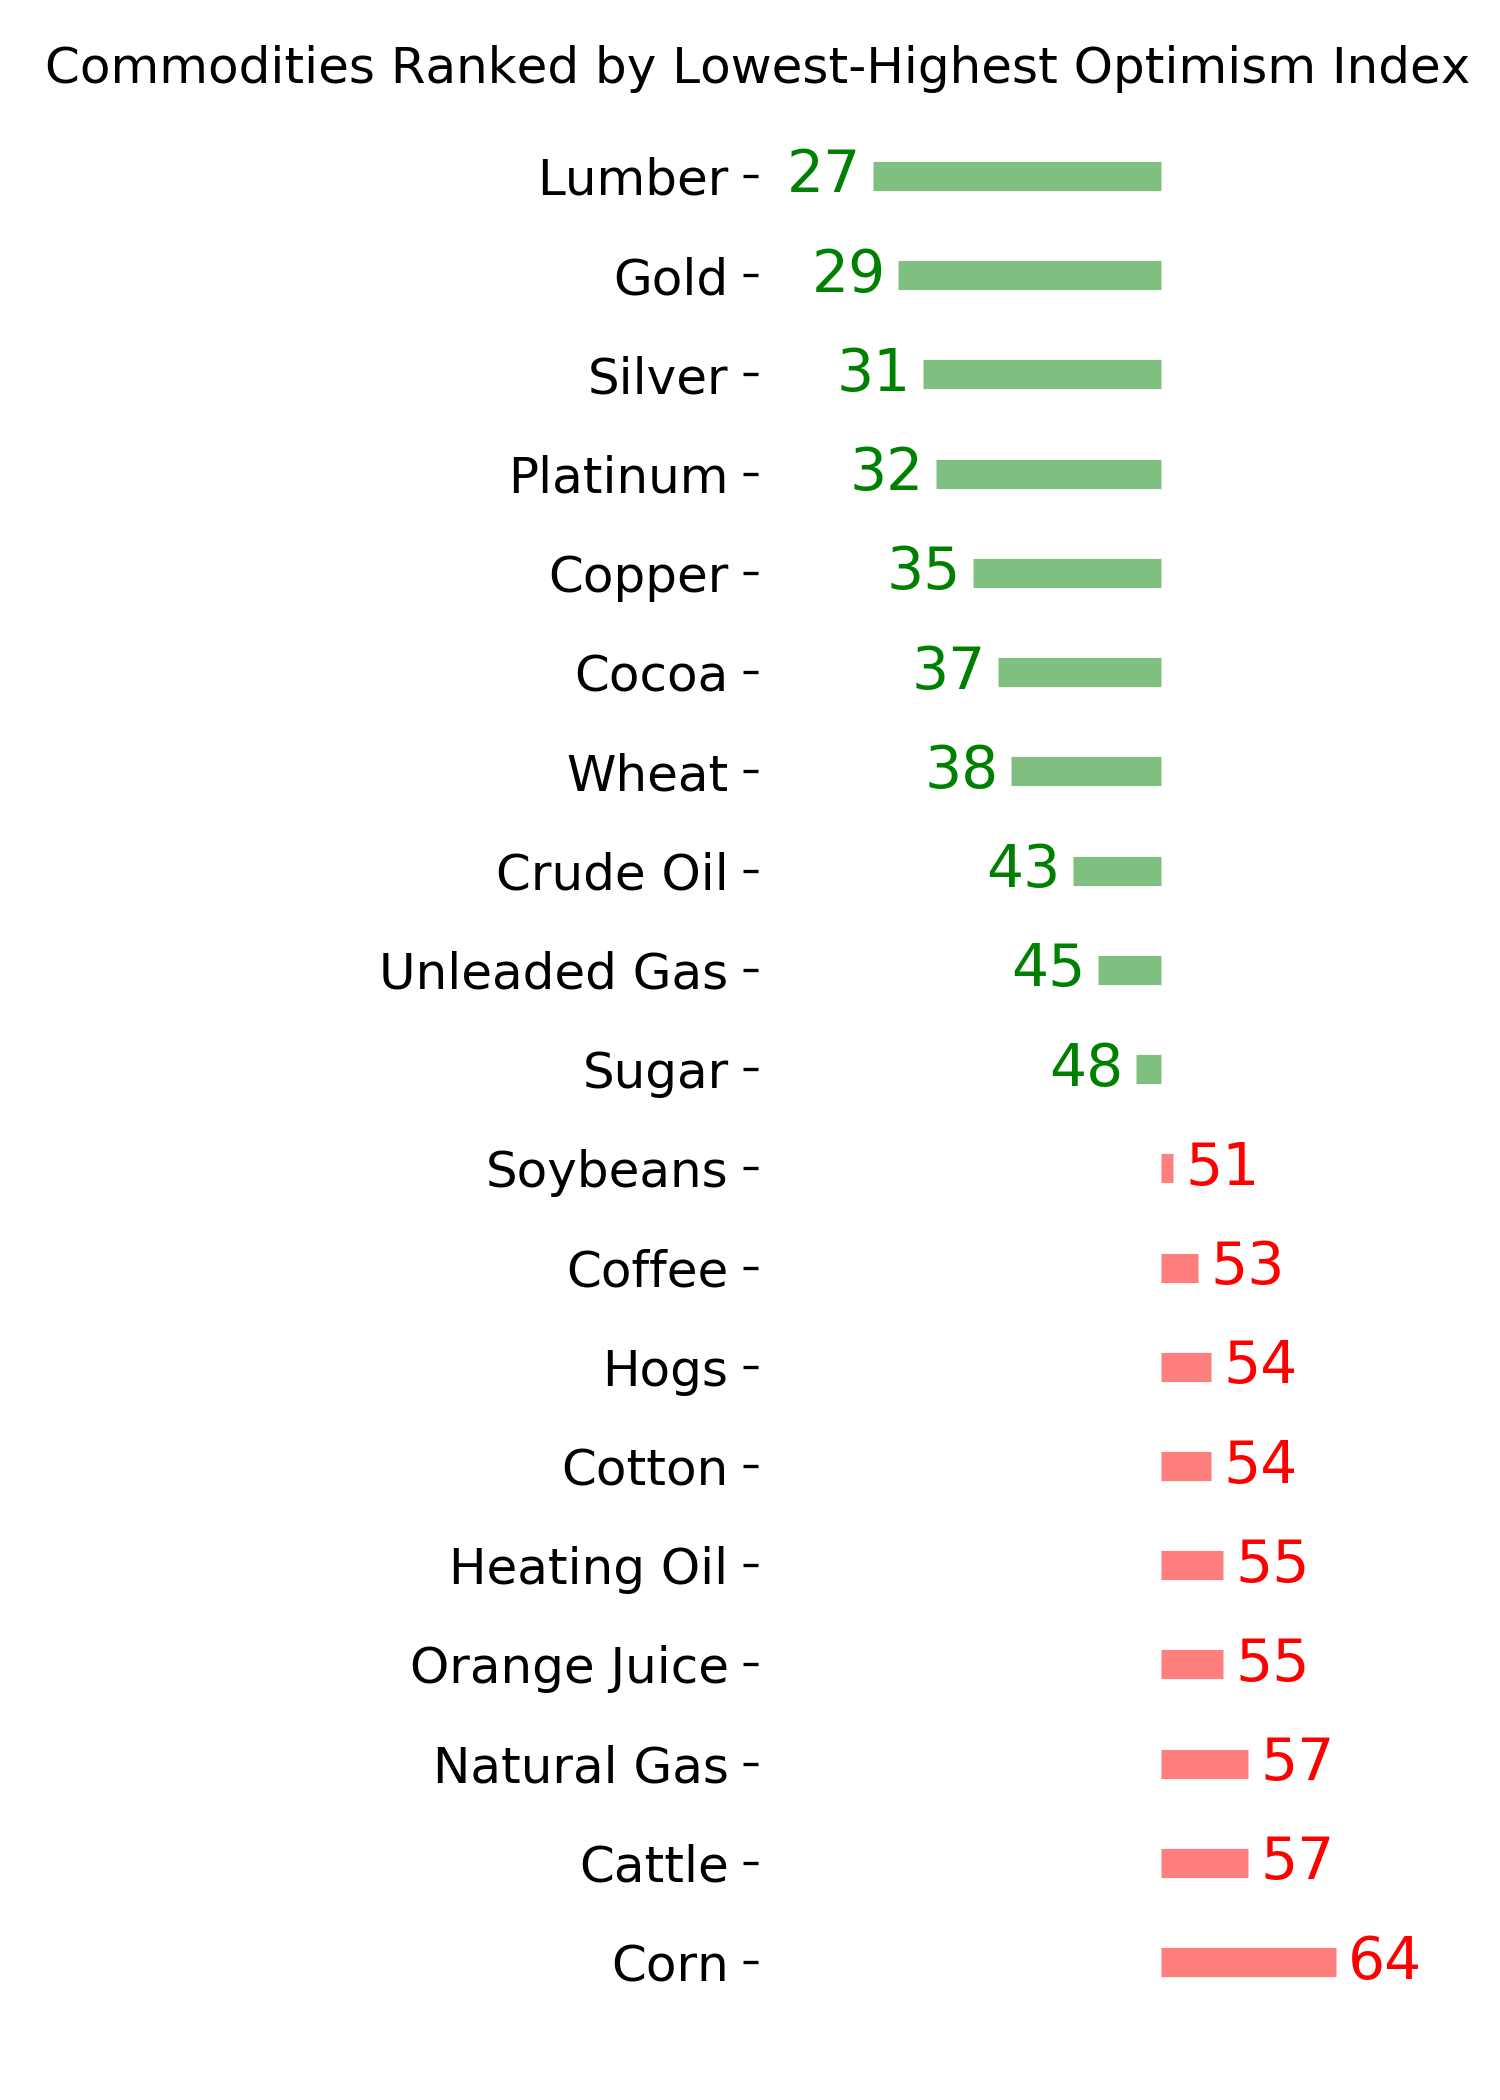
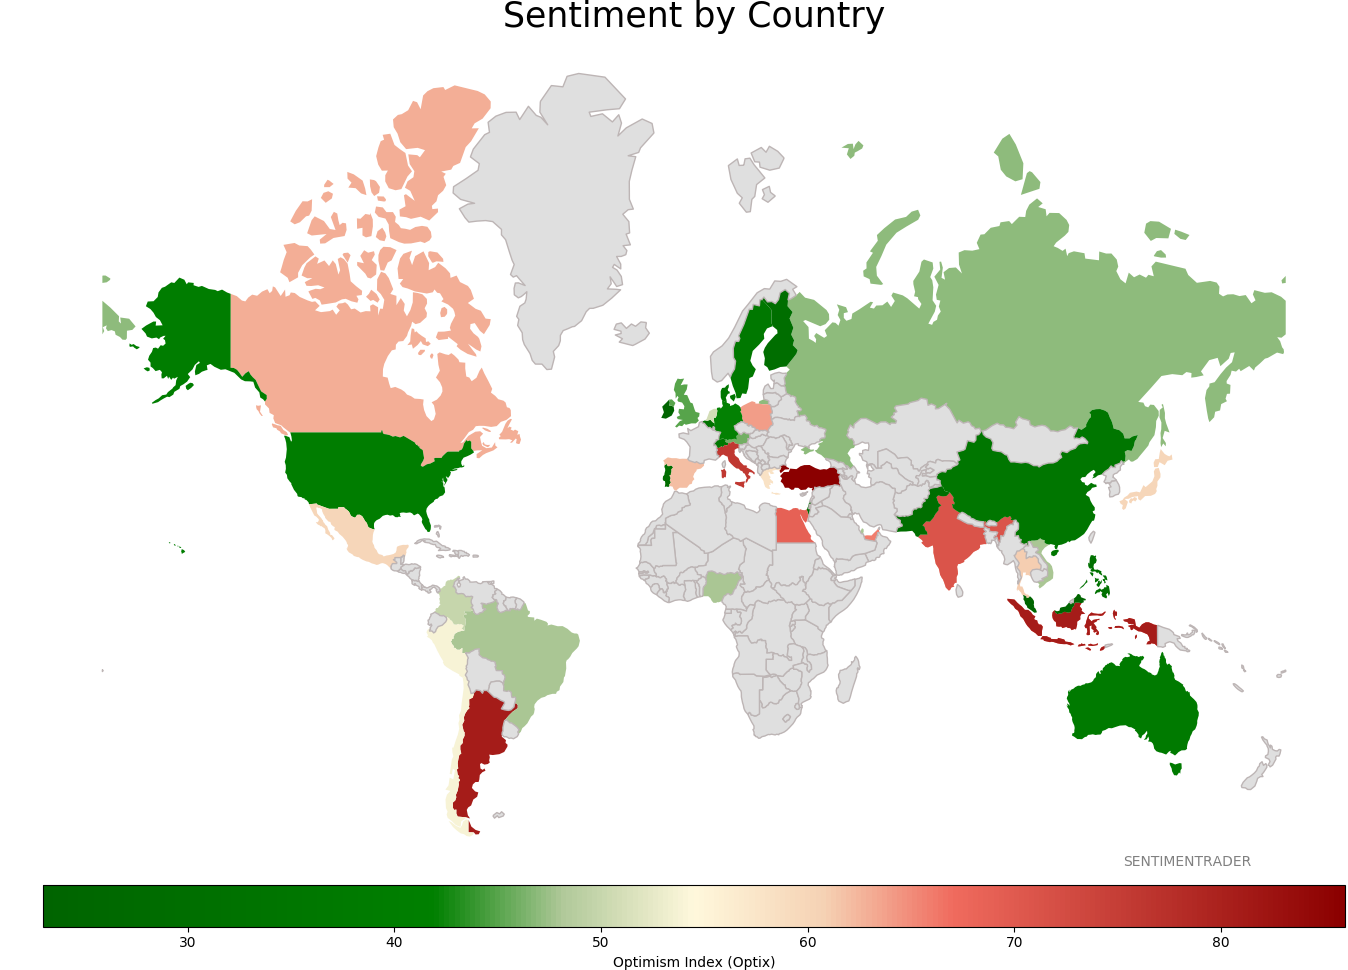
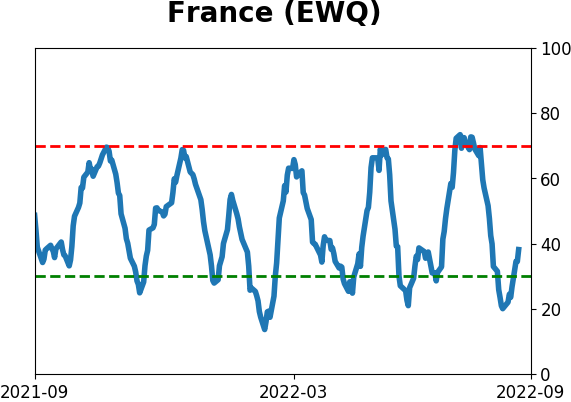
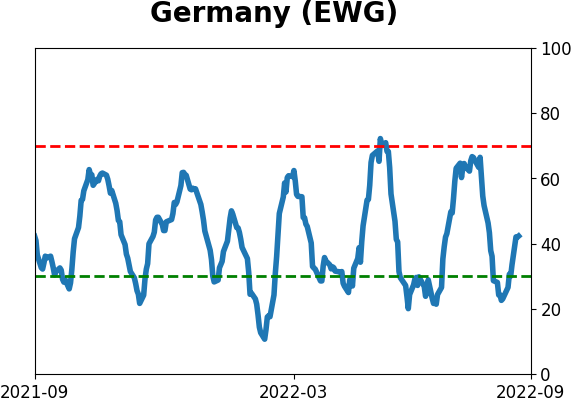
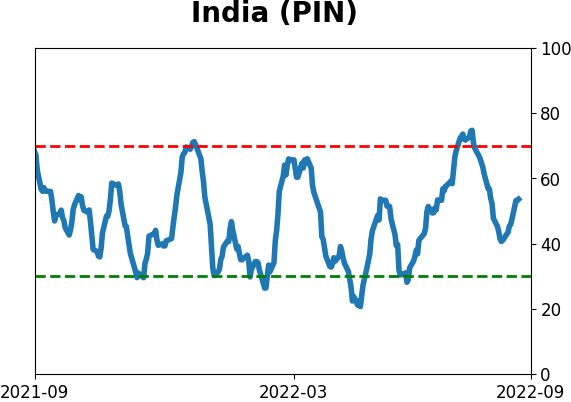
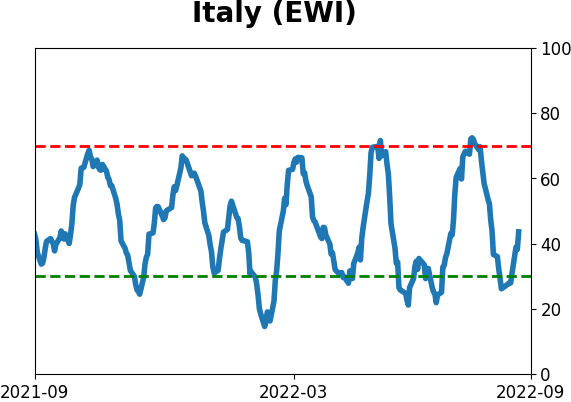
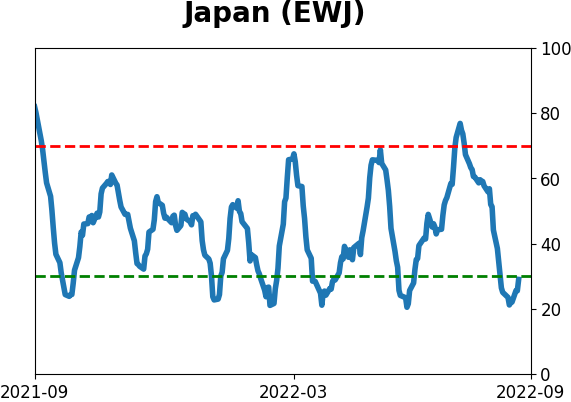
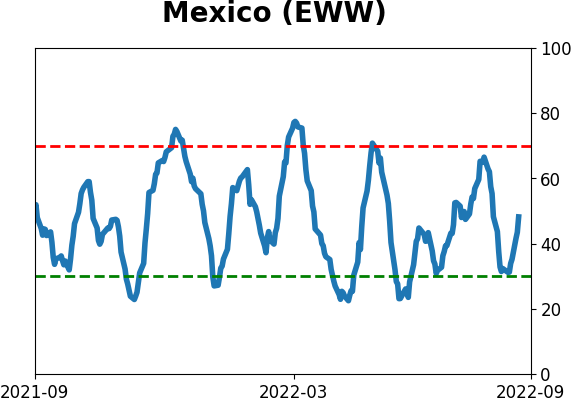
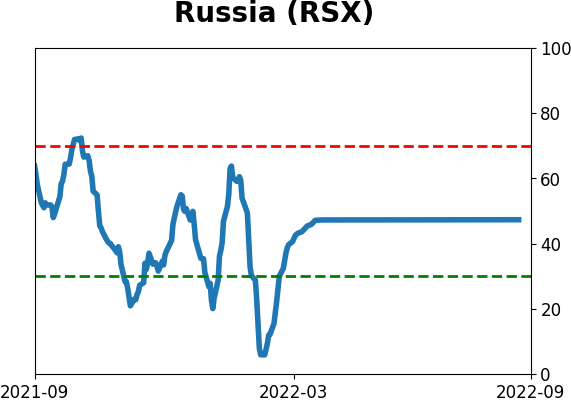
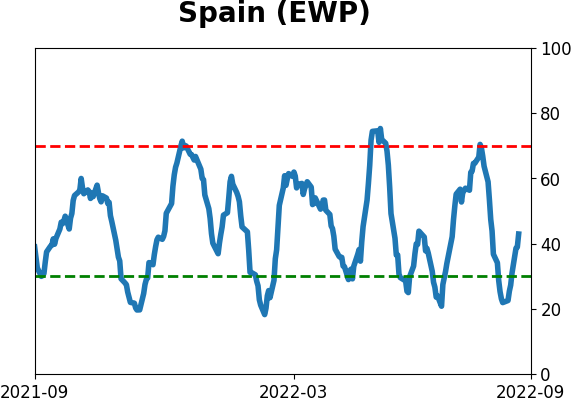
Sentiment Around The World
Optimism Index Thumbnails
|
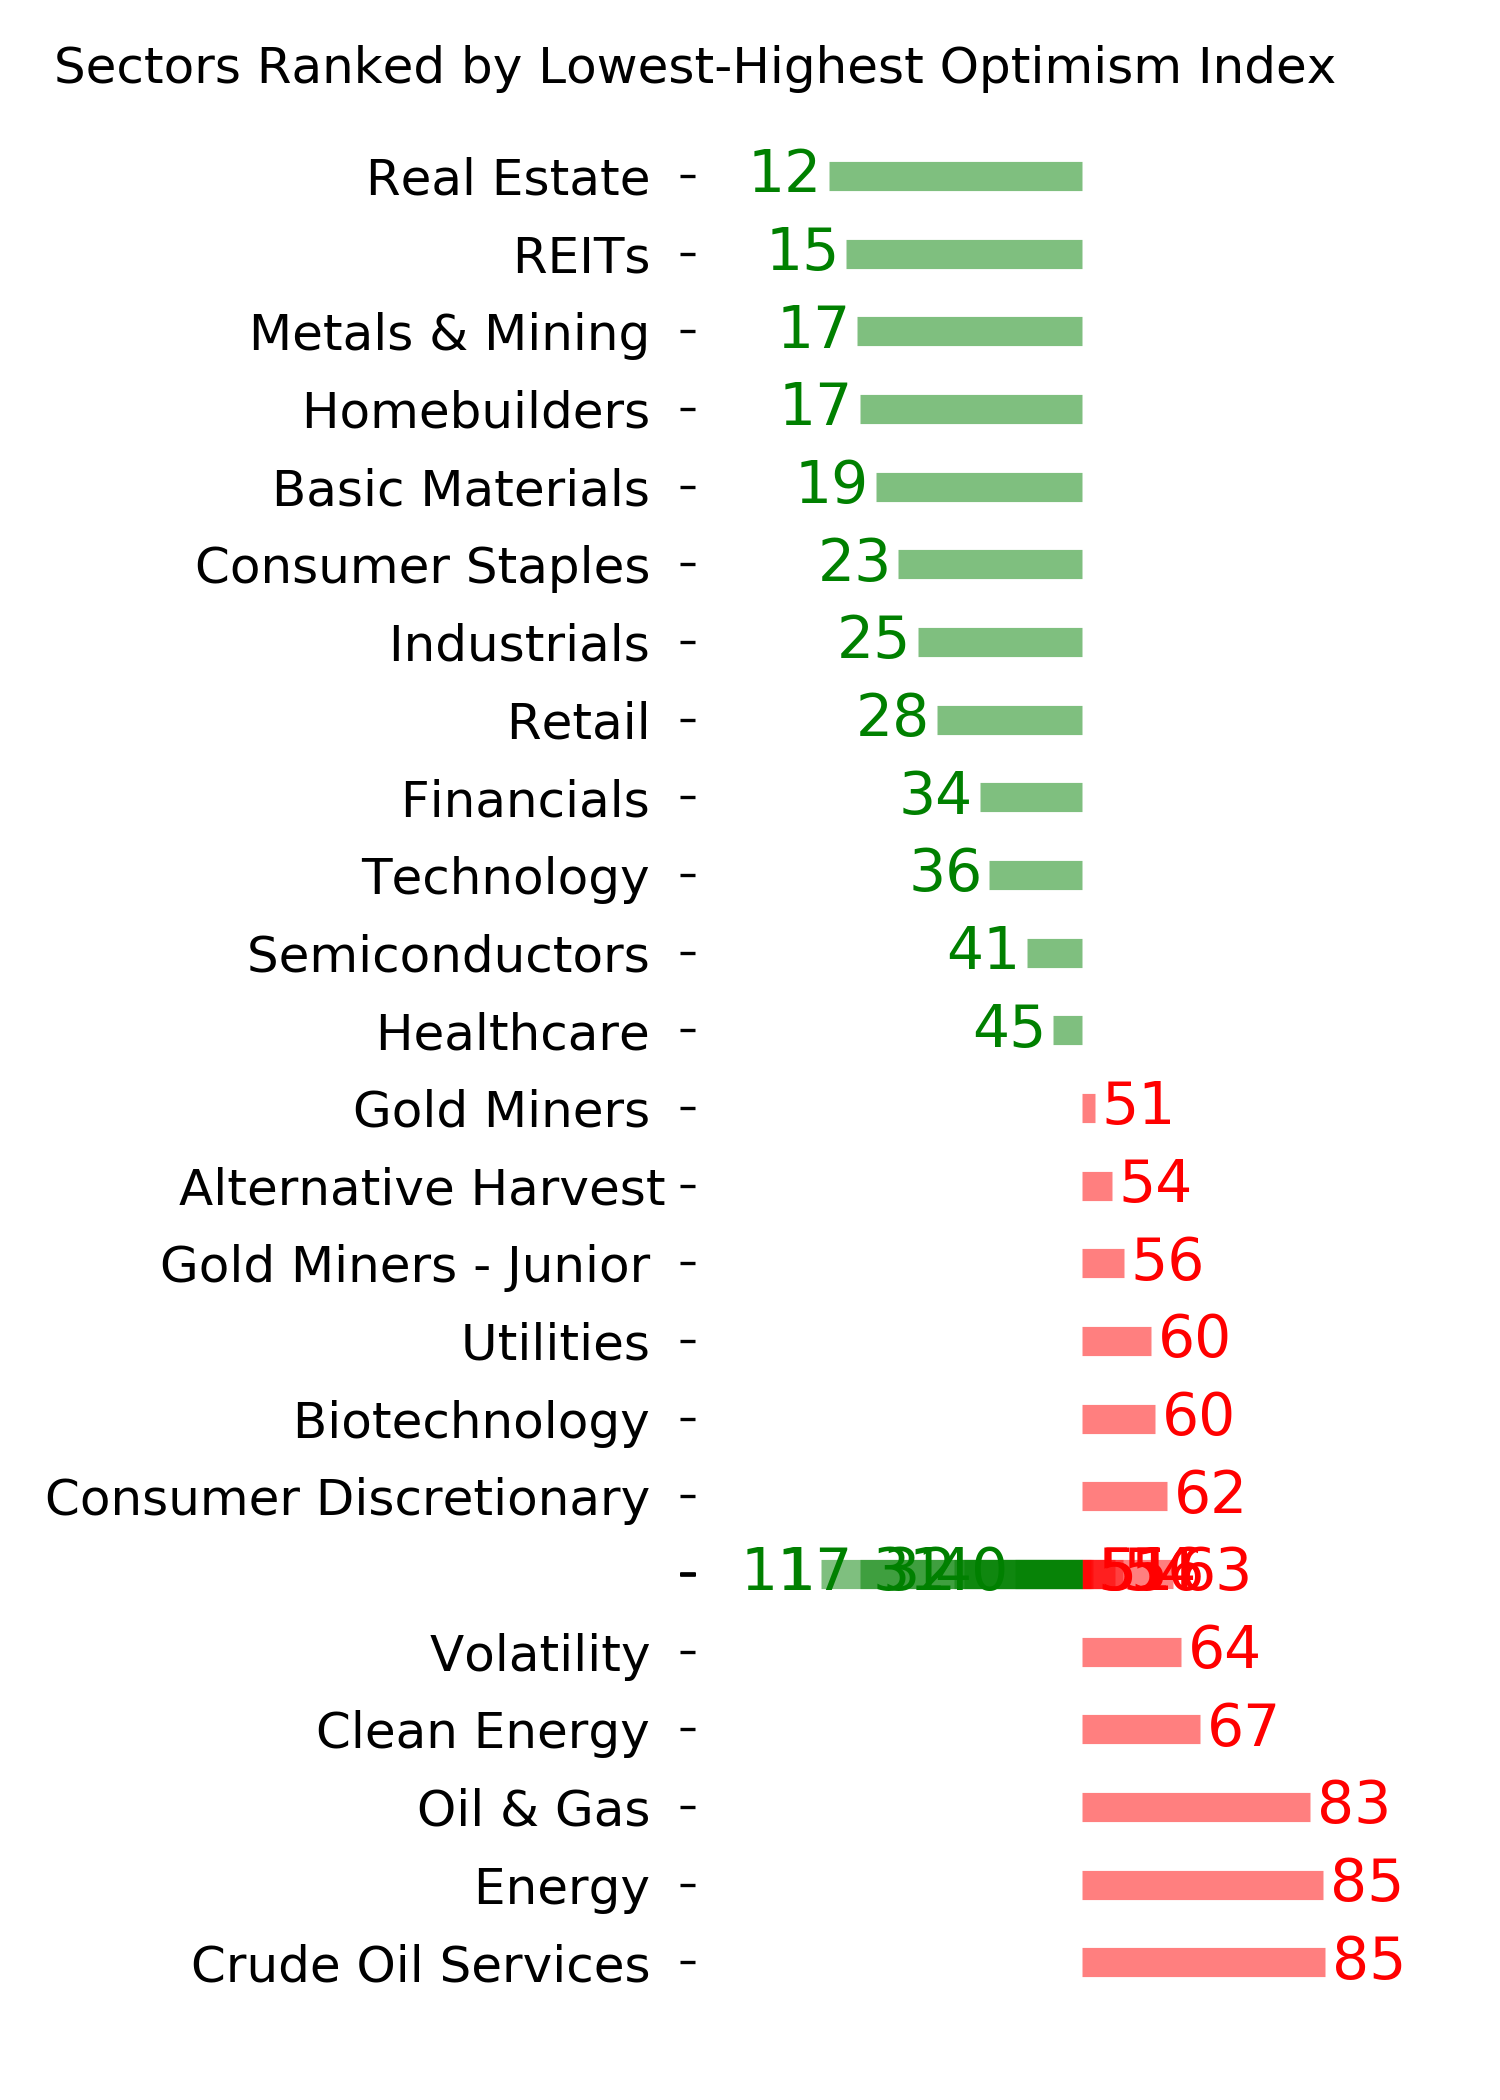
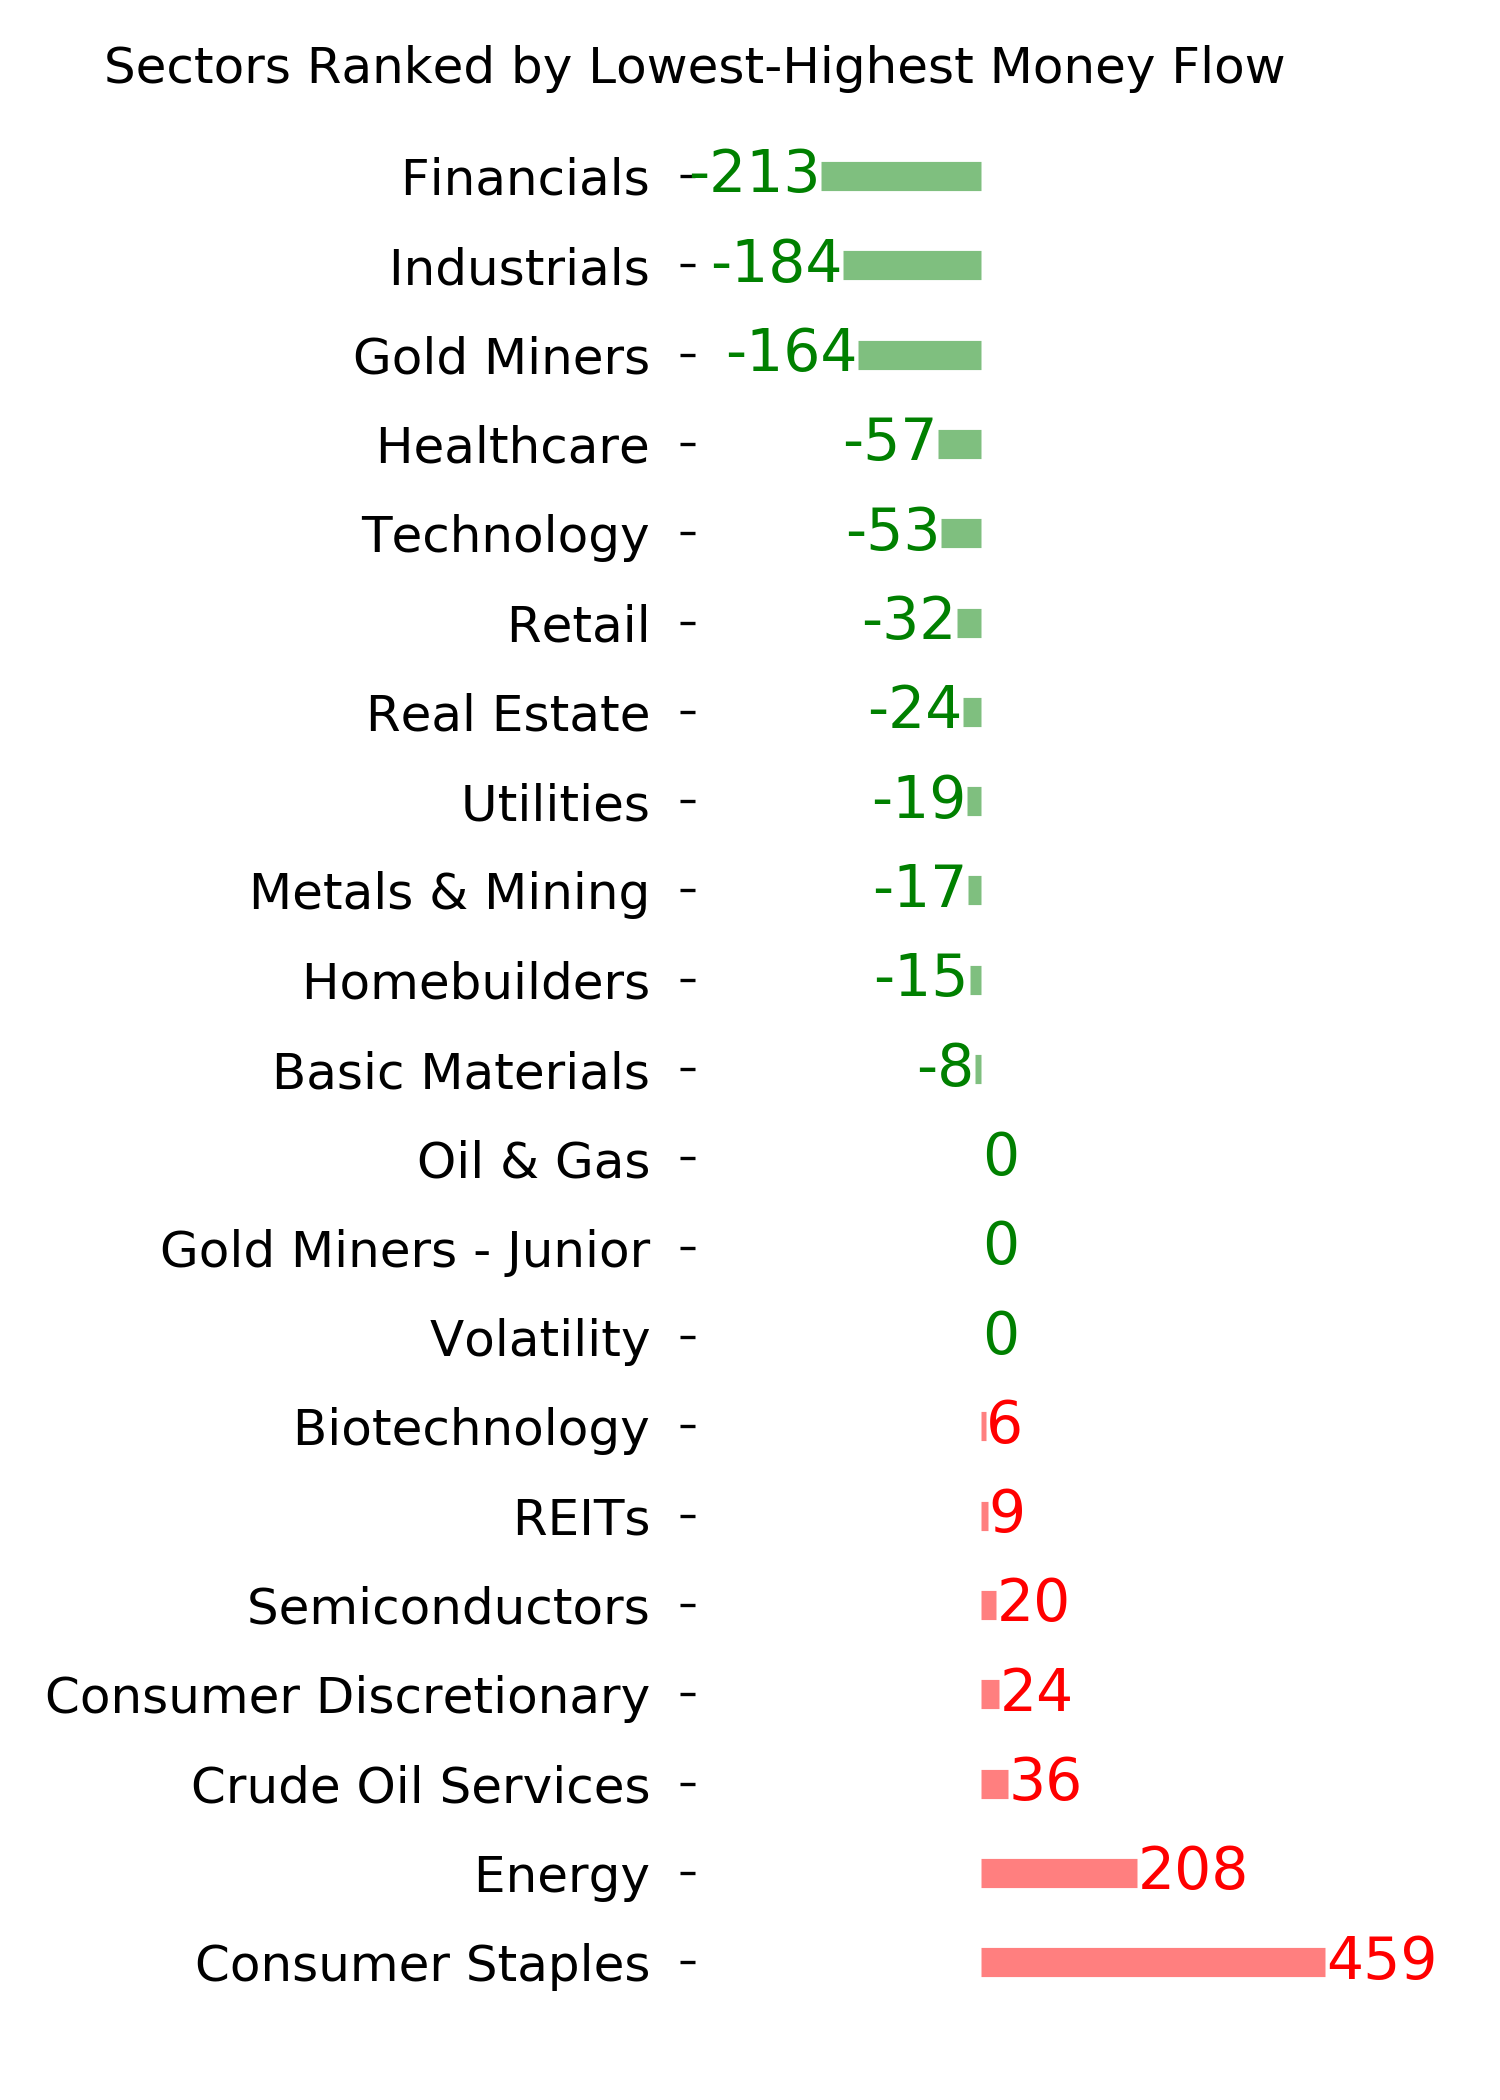
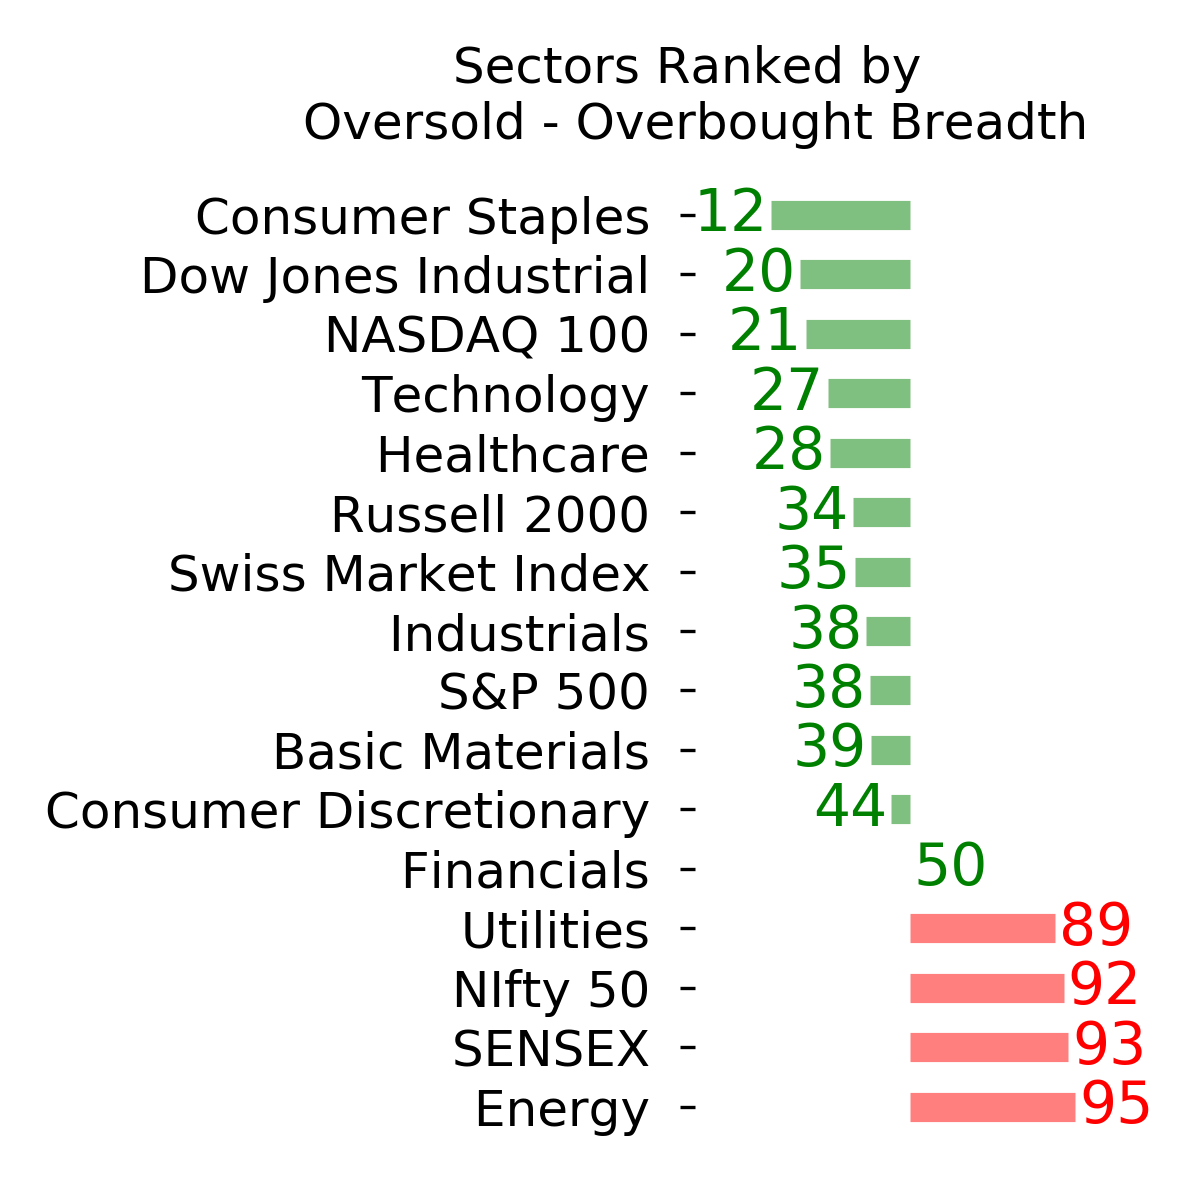
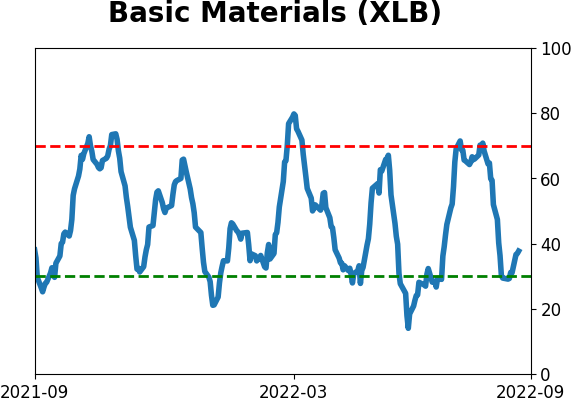
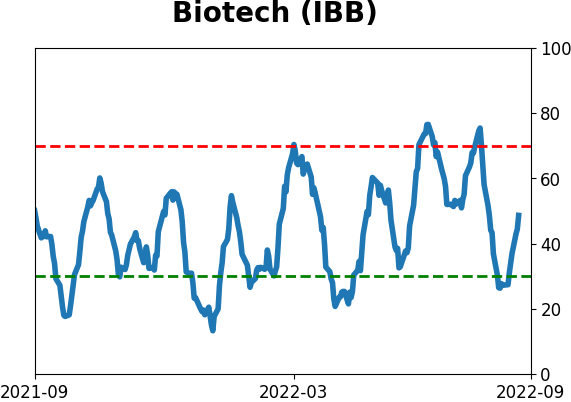
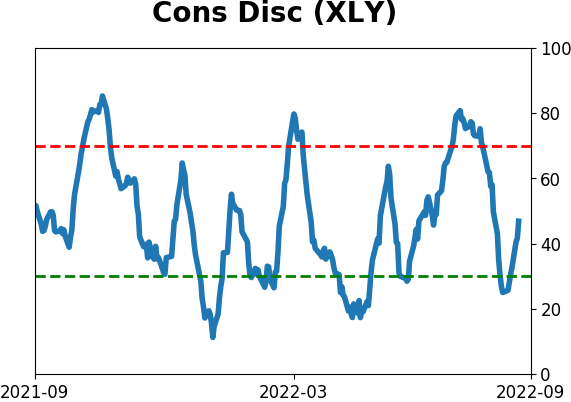
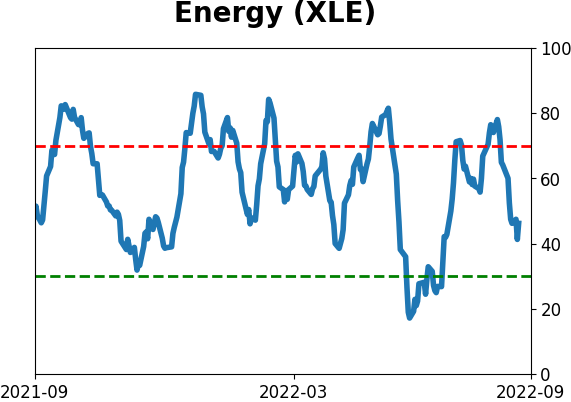
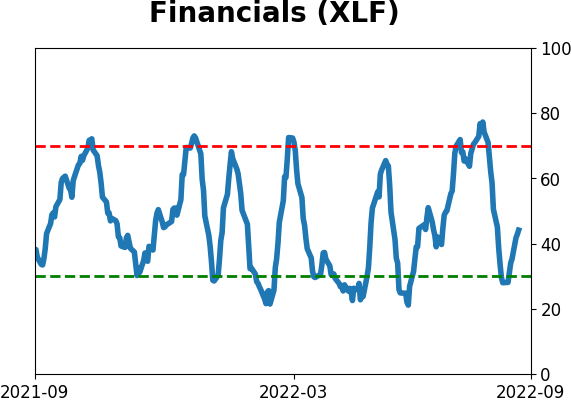
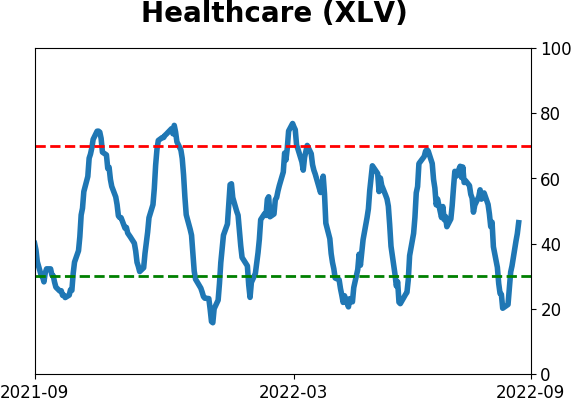
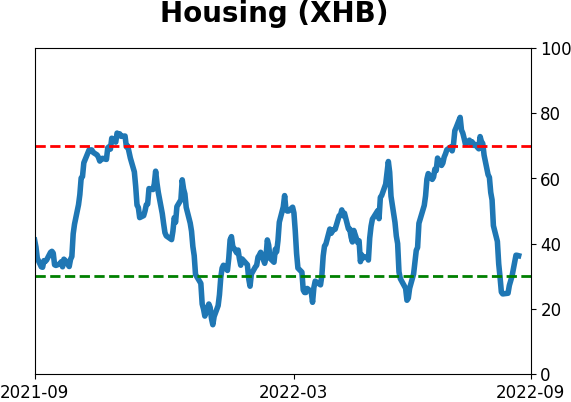
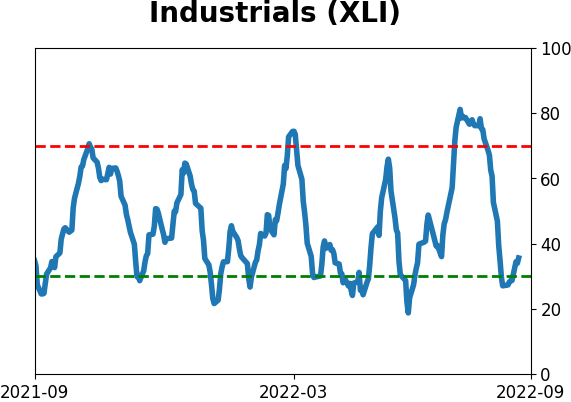
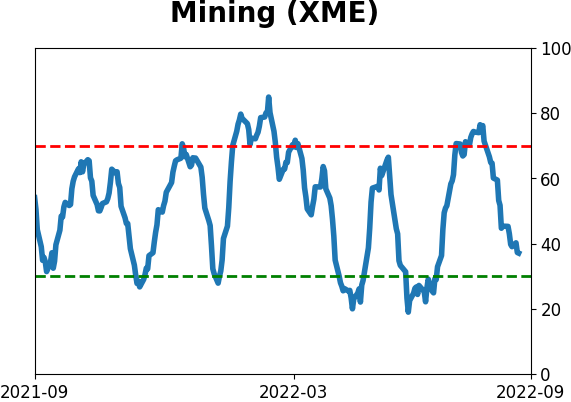
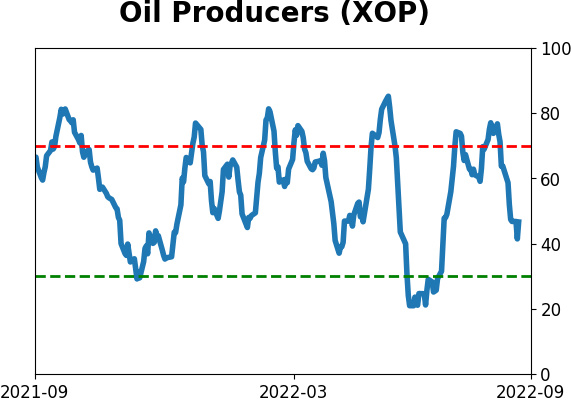
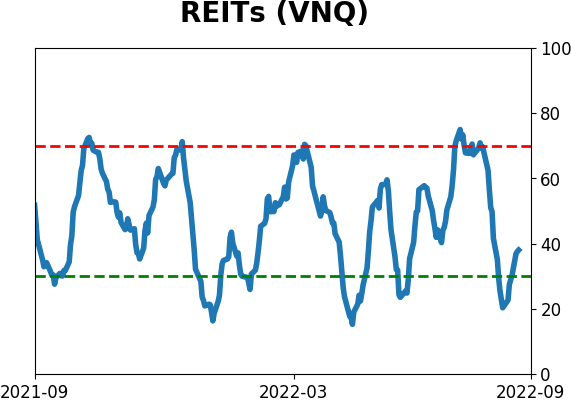
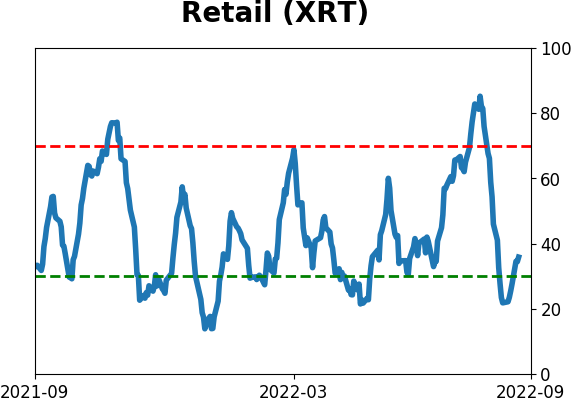
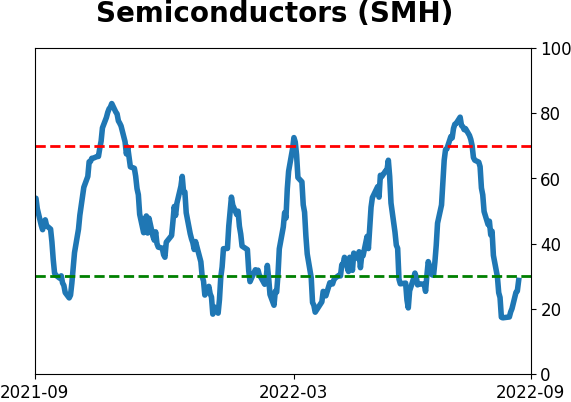
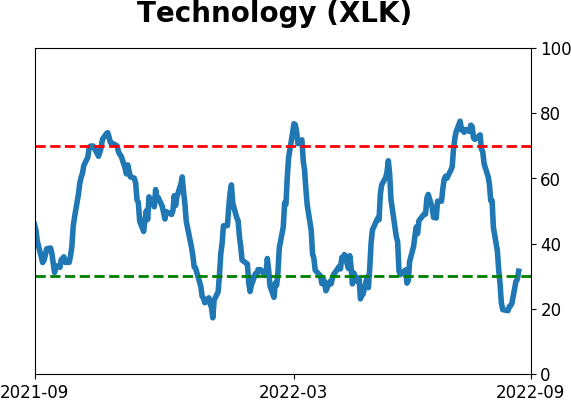
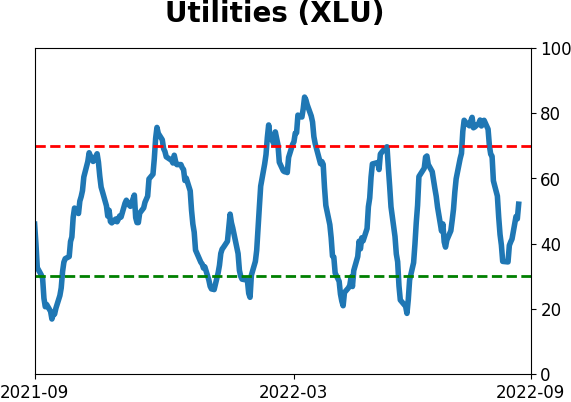
Sector ETF's - 10-Day Moving Average
|
|
|
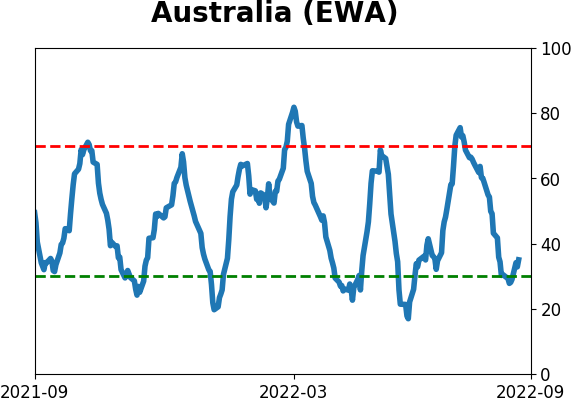
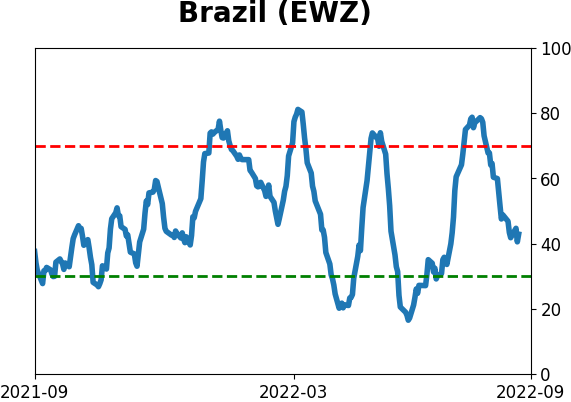
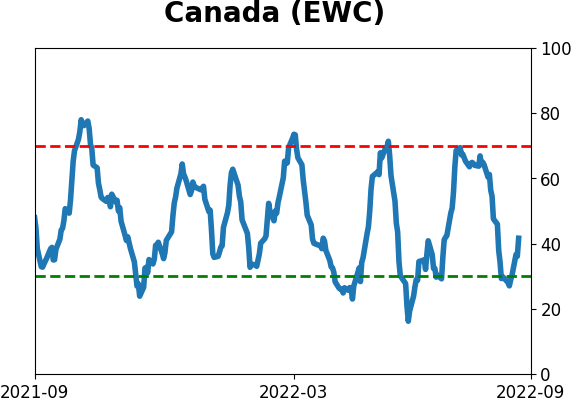
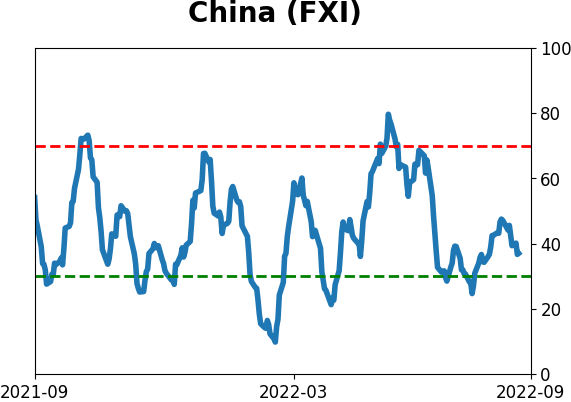
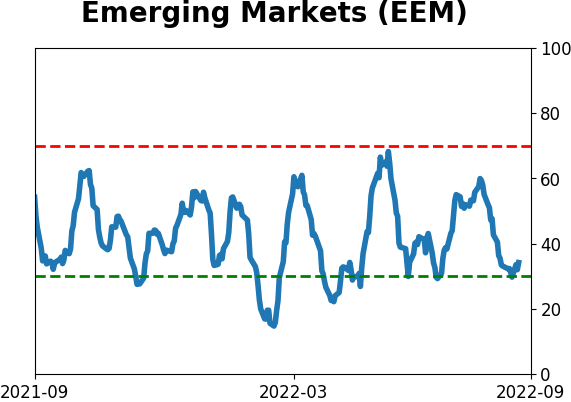
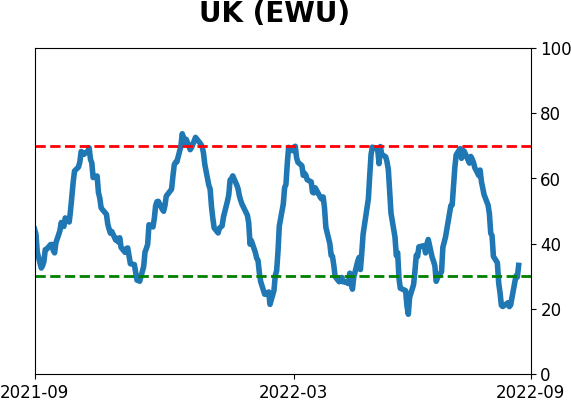
Country ETF's - 10-Day Moving Average
|
|
|
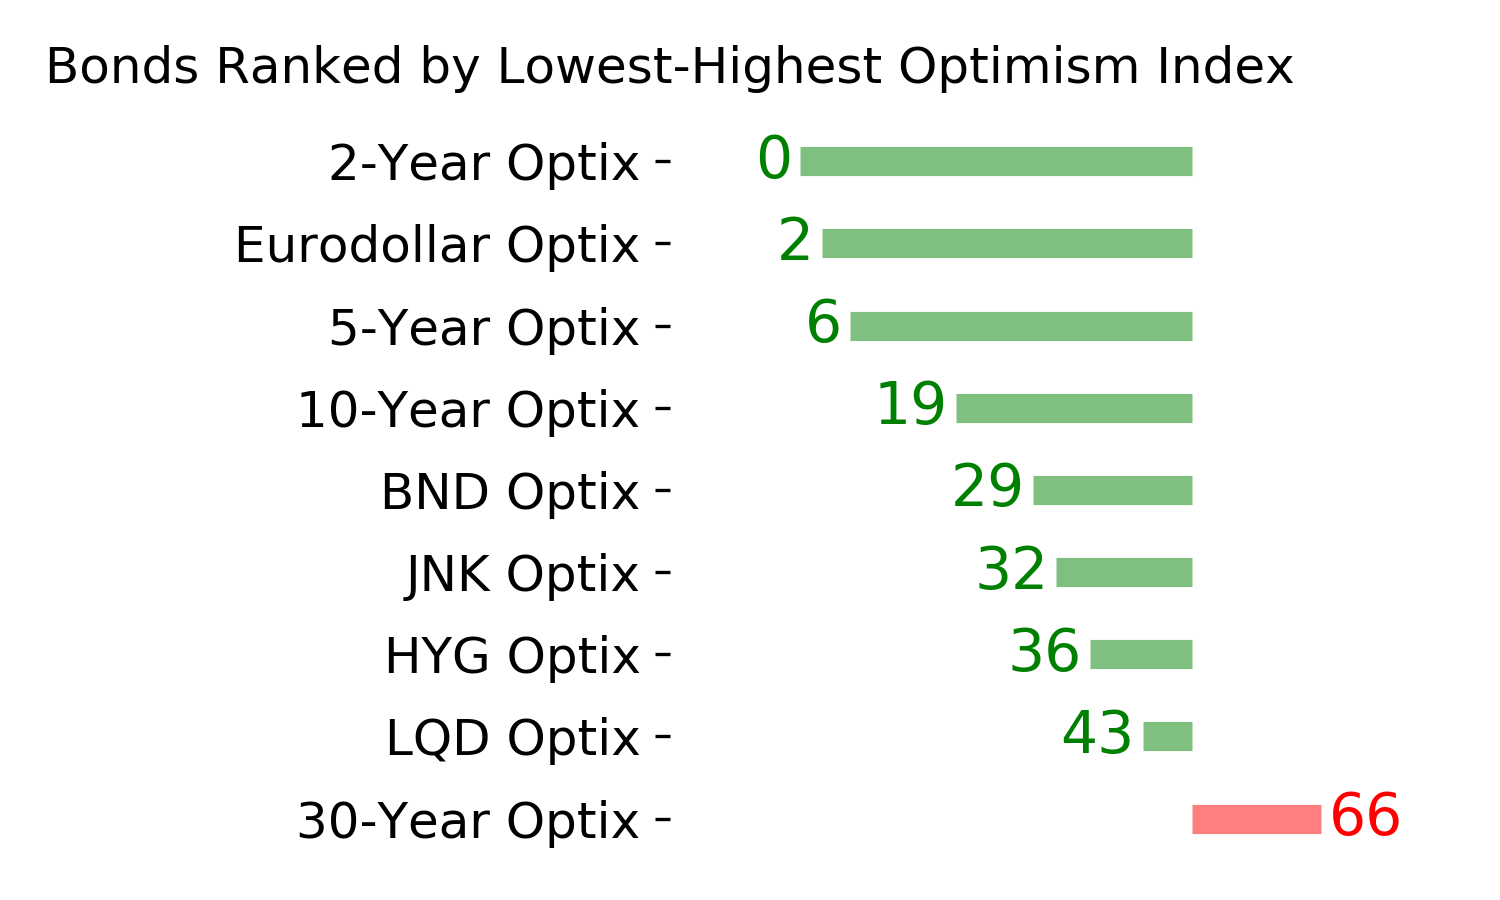
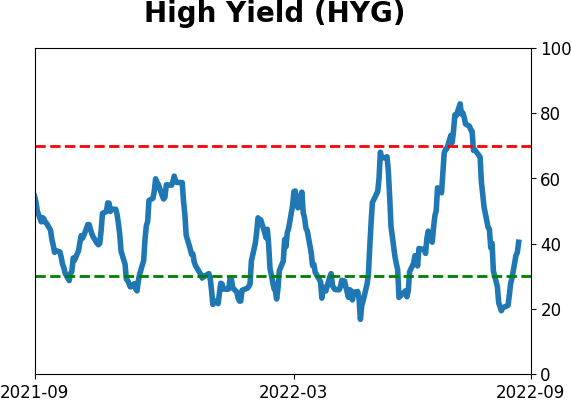
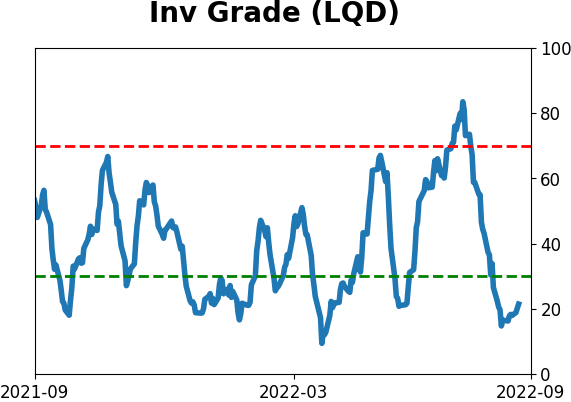
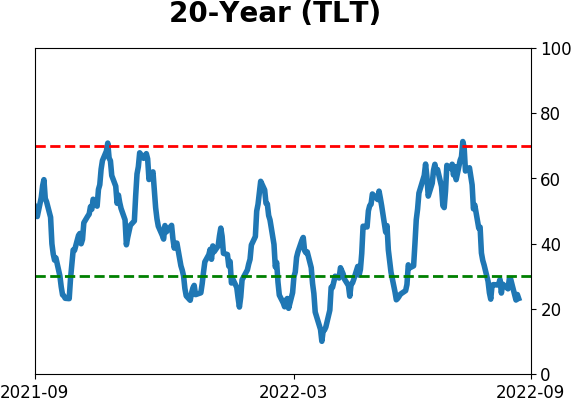
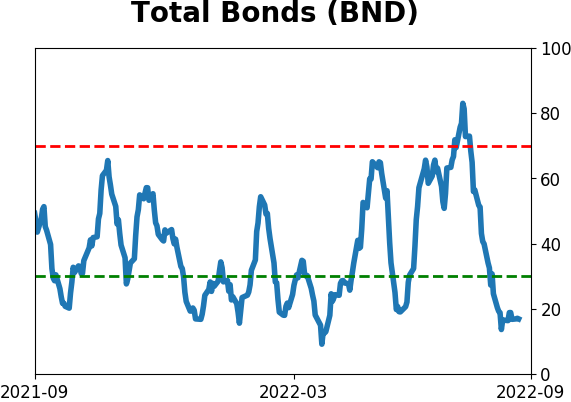
Bond ETF's - 10-Day Moving Average
|
|
|
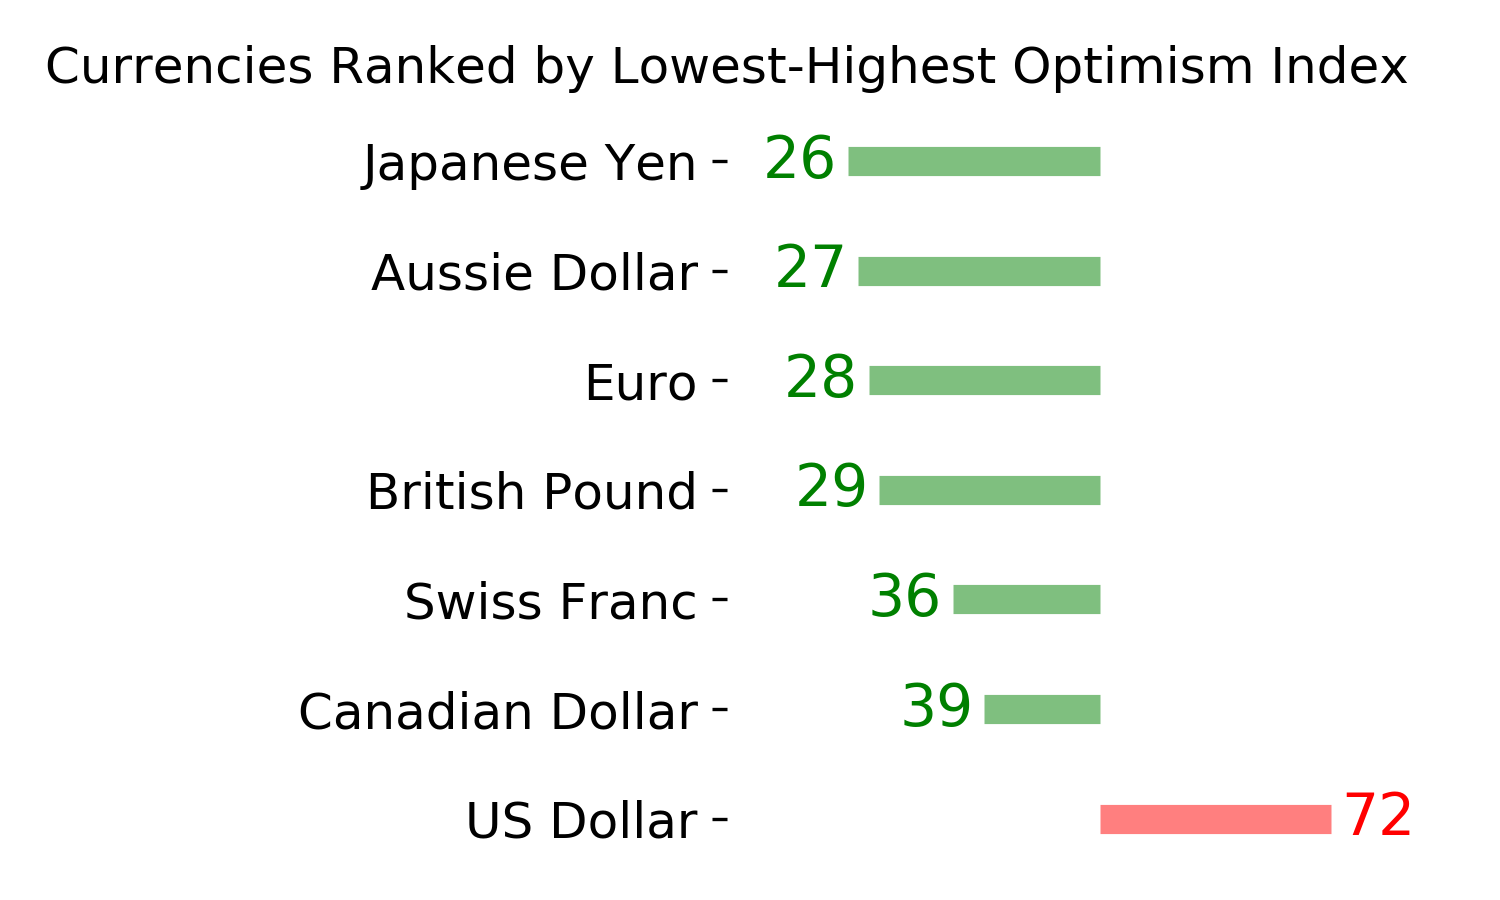
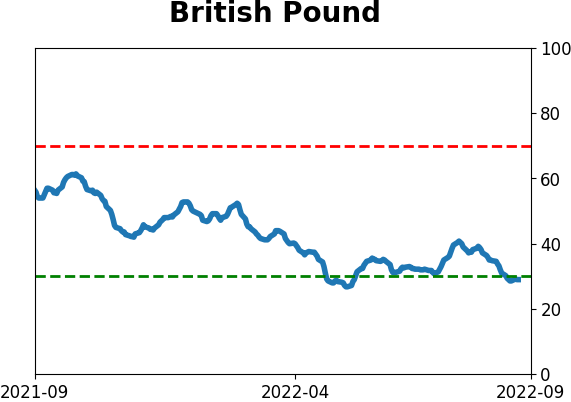
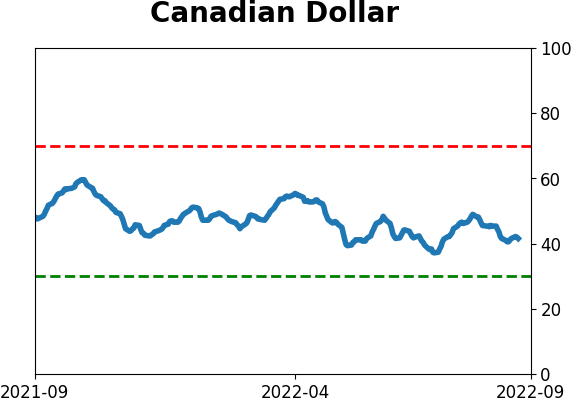
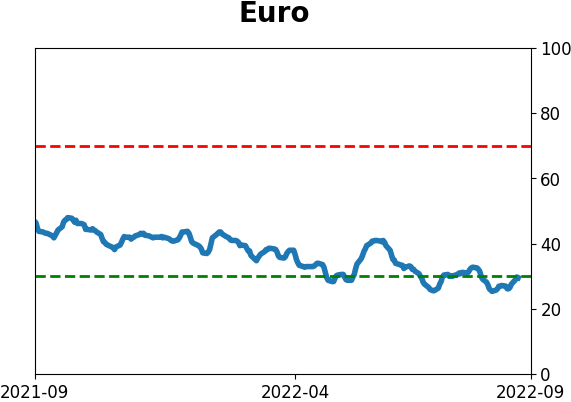
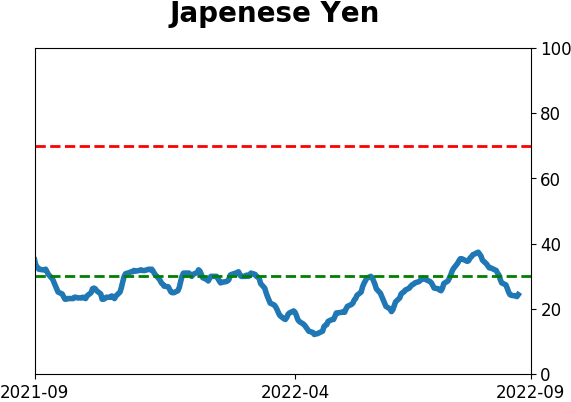
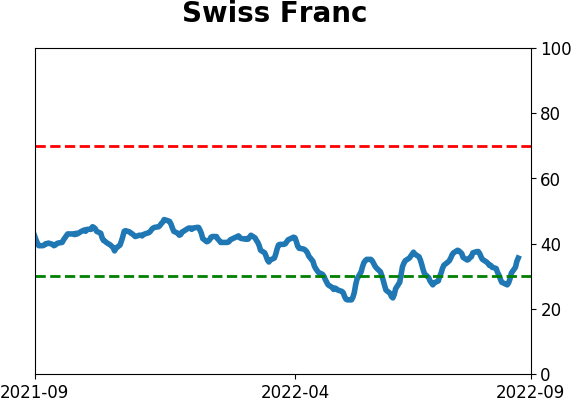
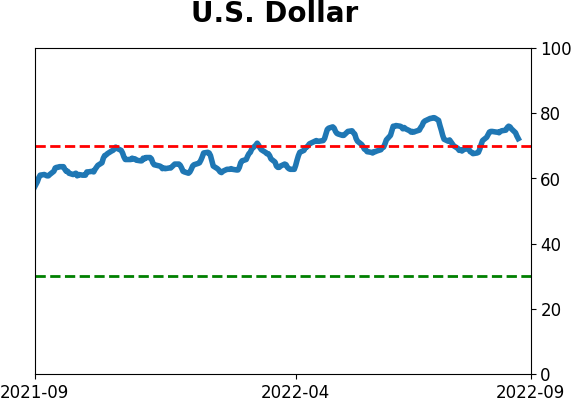
Currency ETF's - 5-Day Moving Average
|
|
|
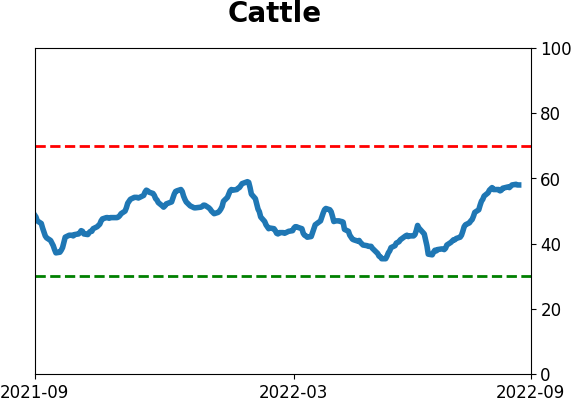
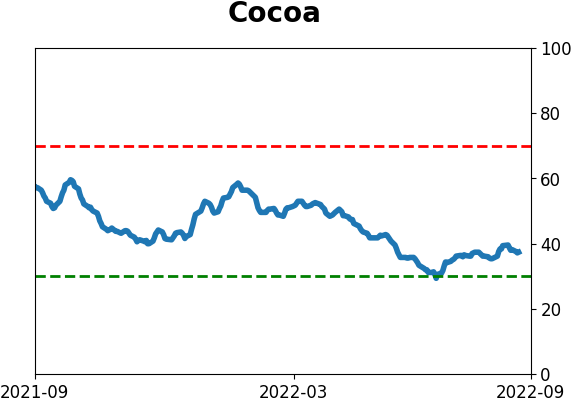
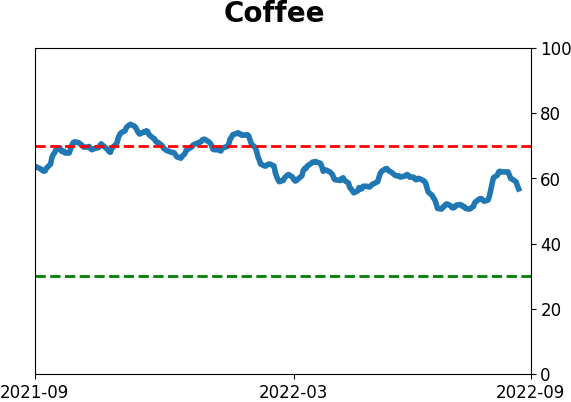
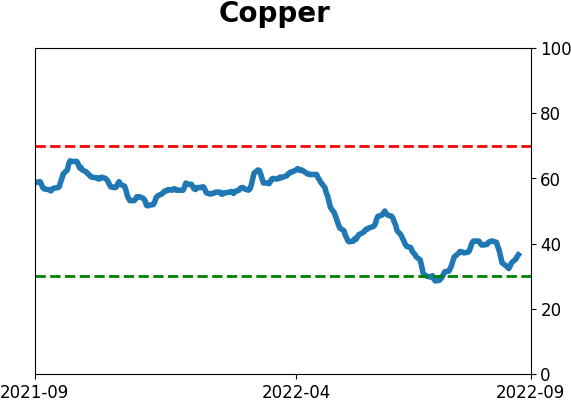
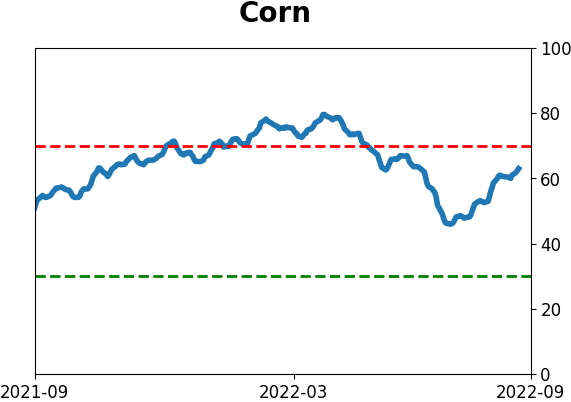
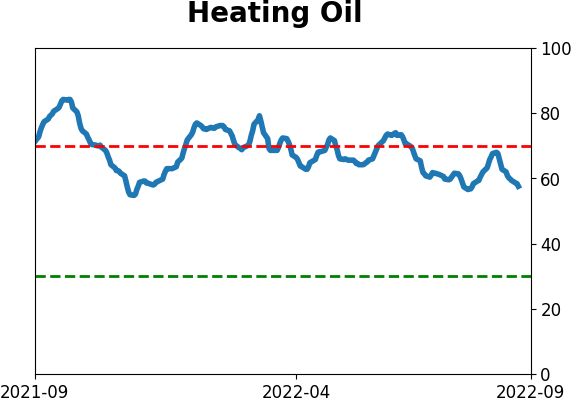
Commodity ETF's - 5-Day Moving Average
|
|