Headlines
|
|
Bubbling crude triggers a rush toward optimism:
The rally in oil has triggered a jump in optimism for further gains. High optimism has not been kind to oil prices. Neither have rising speculator exposure, premiums on short-term contracts, or low volatility. That's especially the case as oil heads into its worst seasonal stretch of the year.
|
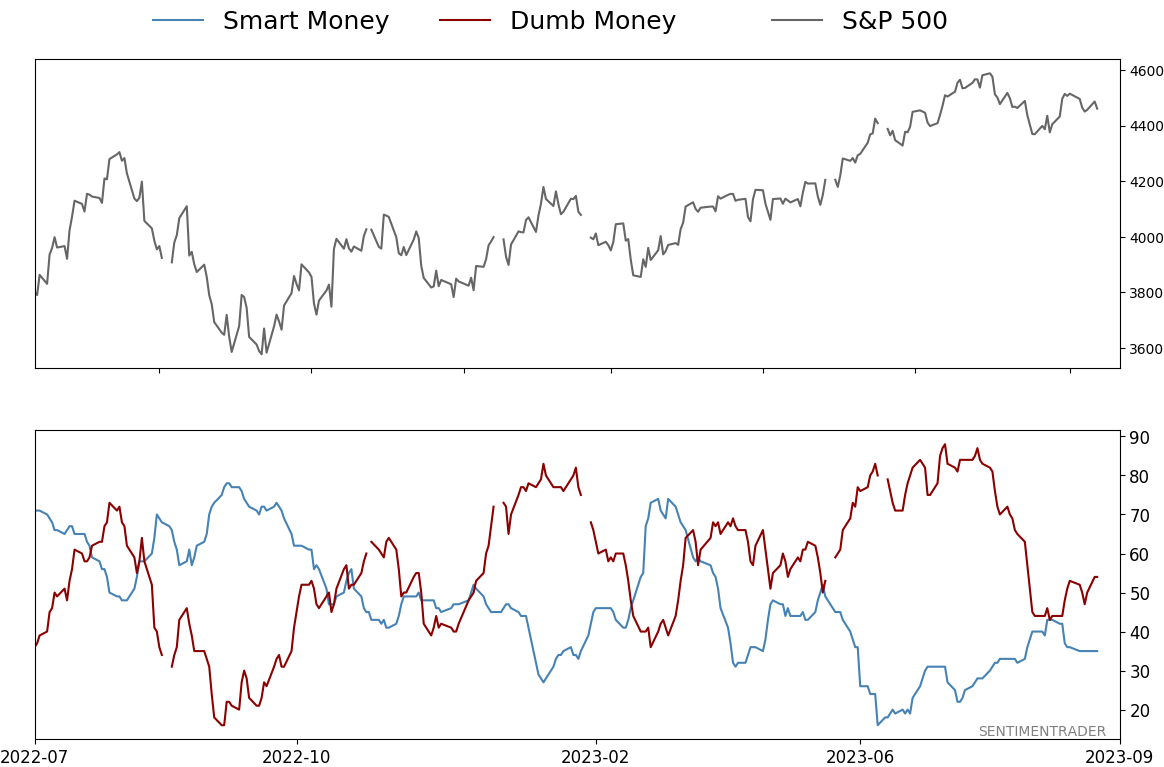
Smart / Dumb Money Confidence
|
Smart Money Confidence: 35%
Dumb Money Confidence: 54%
|
|
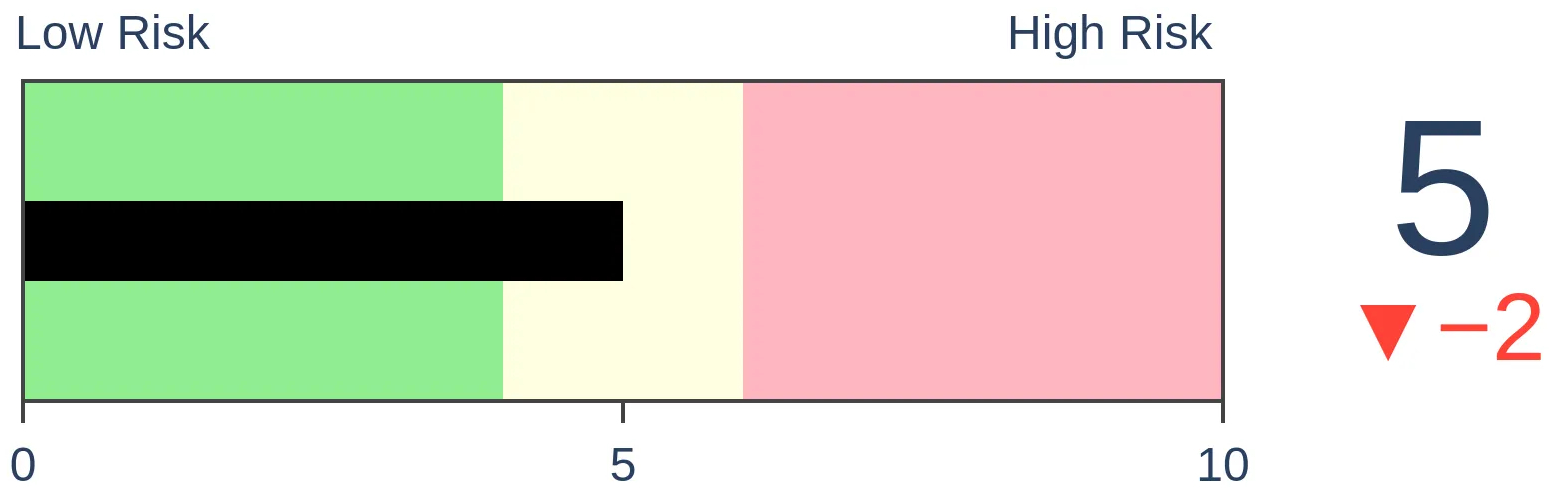
Risk Levels
Stocks Short-Term
|
Stocks Medium-Term

|
|
Bonds
|
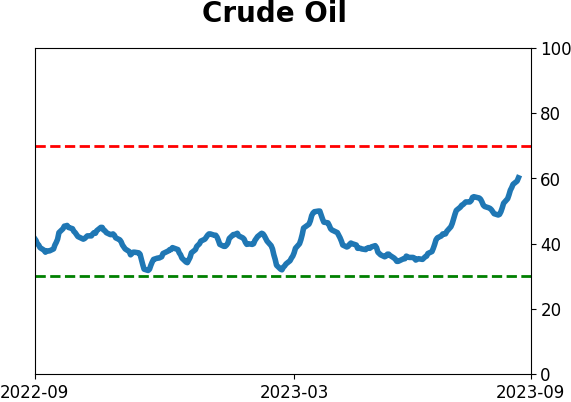
Crude Oil
|
|
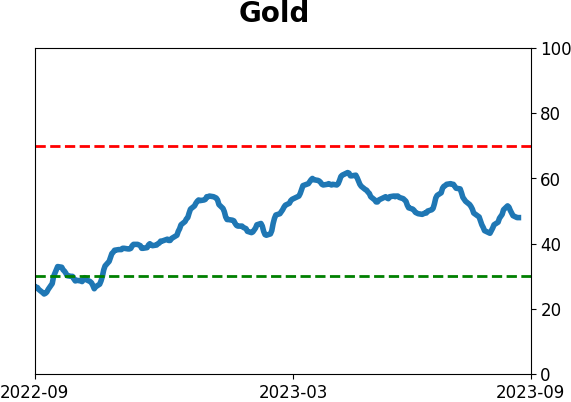
Gold
|
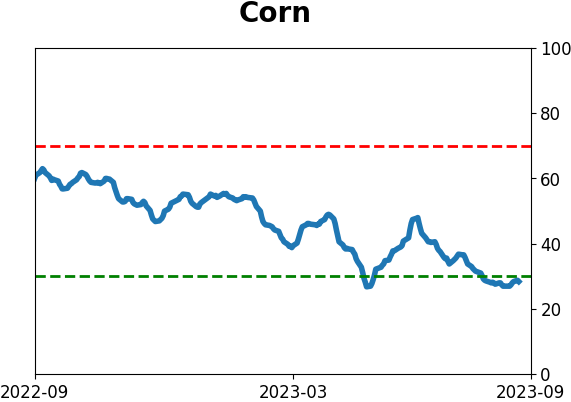
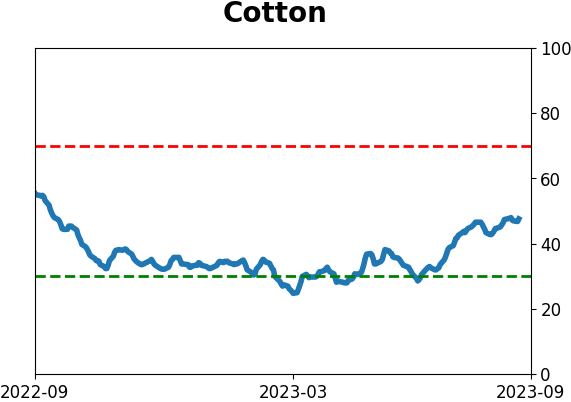
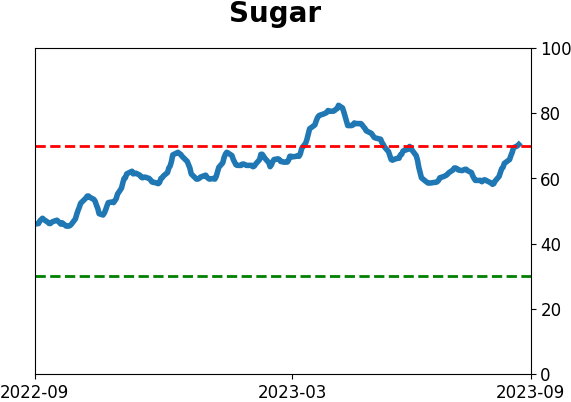
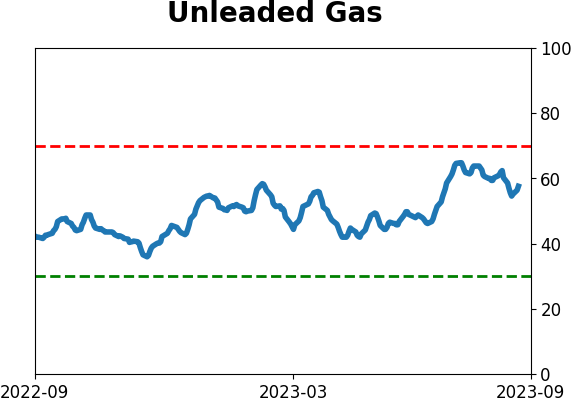
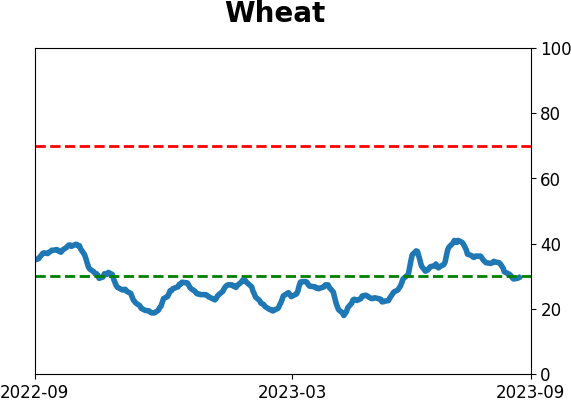
Agriculture

|
|
Research
By Jason Goepfert
BOTTOM LINE
The rally in oil has triggered a jump in optimism for further gains. High optimism has not been kind to oil prices. Neither have rising speculator exposure, premiums on short-term contracts, or low volatility. That's especially the case as oil heads into its worst seasonal stretch of the year.
FORECAST / TIMEFRAME
None
|
Key points:
- Optimism on oil has cycled into excessive optimism territory after being moderately depressed
- Speculators are jumping on board, the term structure is getting out of whack, and volatility has plunged
- Similar conditions preceded weak returns, especially during this part of the year
As oil rallies, so do expectations
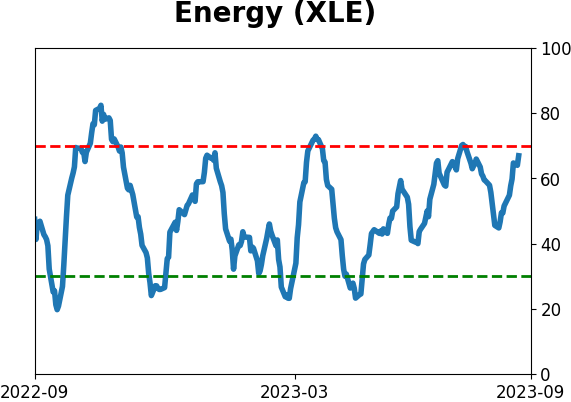
Energy stocks have been on an impressive run, fueled in large part by a coincident rise in their primary product, crude oil. As happens for pretty much every financial asset in the history of the human race, investors have become more optimistic about oil's future prospects because it has already rallied.
The result is that the Optimism Index for oil has reversed from modest pessimism to optimism, the highest reading in over a year. Oil is an unusual market that shows negative annualized returns when optimism is high or low. It does best when traders don't really care too much one way or the other.

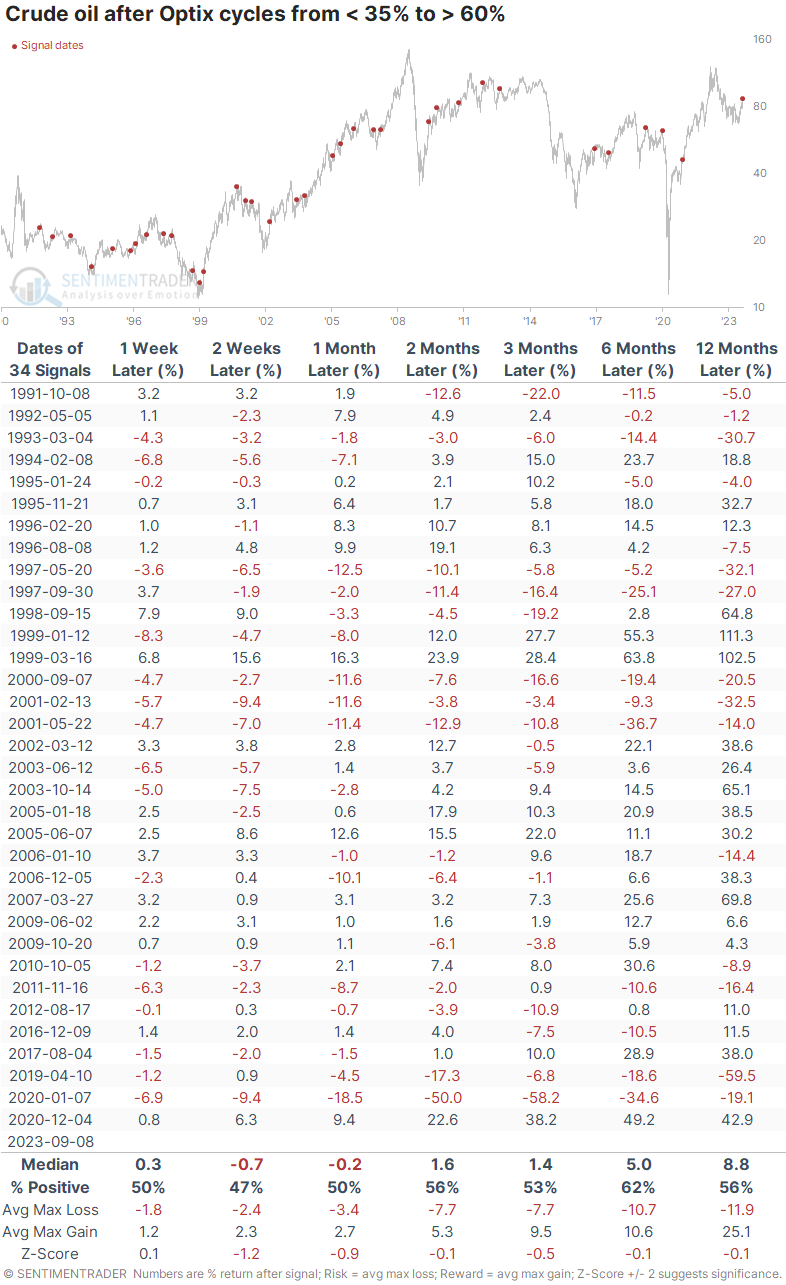
The table below shows other times since 1990 when the Optix for crude cycled from 35% or below to 60% or above. Most of the cycles happened quicker than the current one, but regardless, future returns were mediocre. It did tend to struggle over the next couple of weeks in particular.
There was a +0.4 correlation (out of a scale from -1.0 to +1.0) between crude's return two weeks later and one year later, mildly suggesting that if traders continue to push the commodity higher despite already-high optimism, then there is a decent chance that this only the beginning of one of those sustained trend changes.
Other indicators show a tougher road ahead
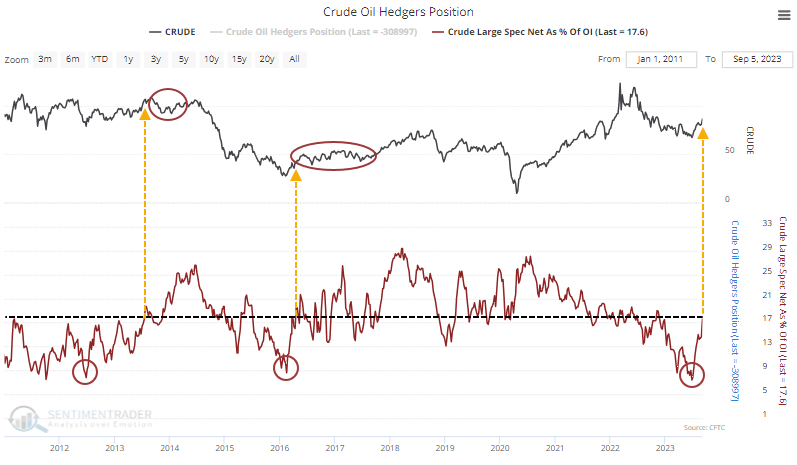
In the futures market, large speculators (who are on the opposite side of commercial hedgers) have only recently started adding to what had been a decade-low exposure to crude oil. This has been a decent contrary indicator in the past, and they have a long way to go before it would suggest they're overly exposed.
Still, the two other times in the past decade when they cycled from holding less than 10% of open interest net long to more than 17%, crude struggled in the months ahead.
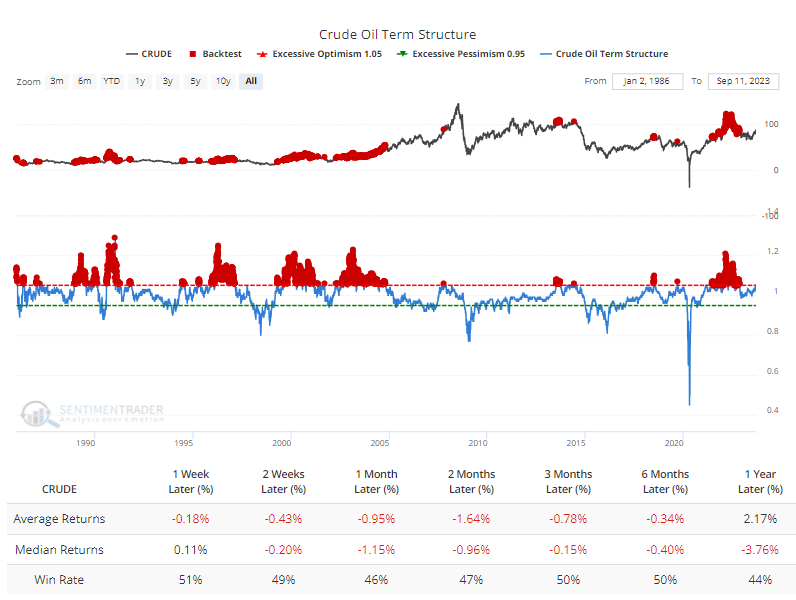
Renewed optimism has pushed the term structure for crude to a relatively high level, meaning that traders are putting more of a premium on shorter-term contracts than longer-term ones. The Backtest Engine shows that when the front-month contract was at least 5% pricier than the contract six months out, crude tended to show poor returns in the weeks and months ahead.
Crude has gone on multi-month runs even when the spread was wider than it is now, but several important peaks during 2010 - 2020 happened with a premium about where it is now.
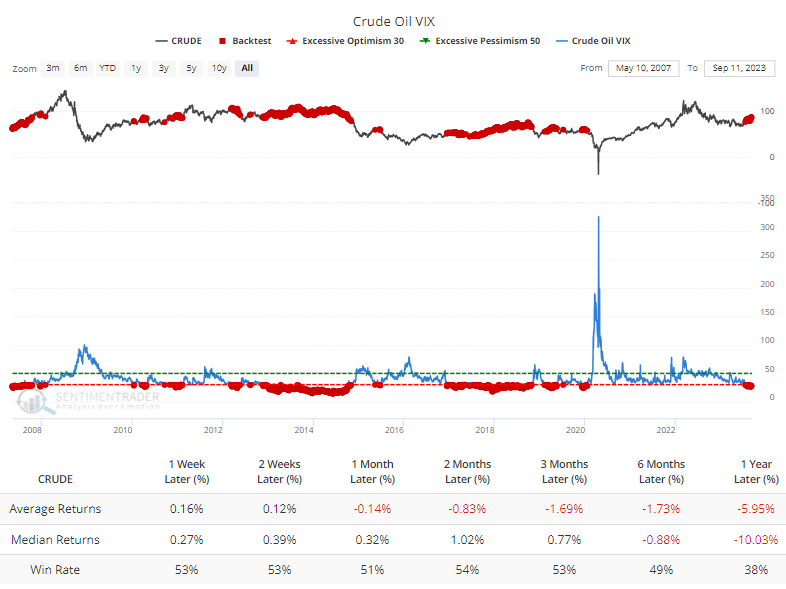
Implied volatility in crude contracts has dropped significantly to about half what it was in March. The Backtest Engine shows that when the VIX for oil was 30% or below, crude averaged negative returns from one month and beyond.
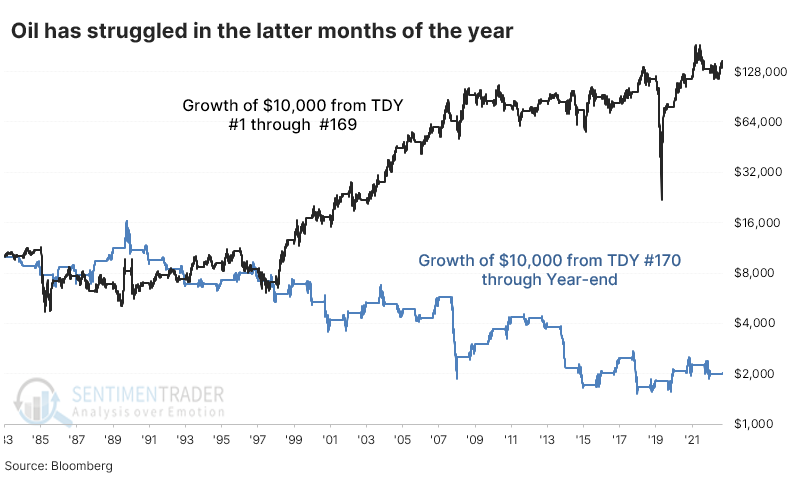
Our seasonality chart for crude shows oddly spiky behavior in April due to some issues with futures contract rollover, but the general trend in the latter part of the year is a bit troubling for oil bulls. The contract's worst months have consistently been October and November, which are right around the corner.
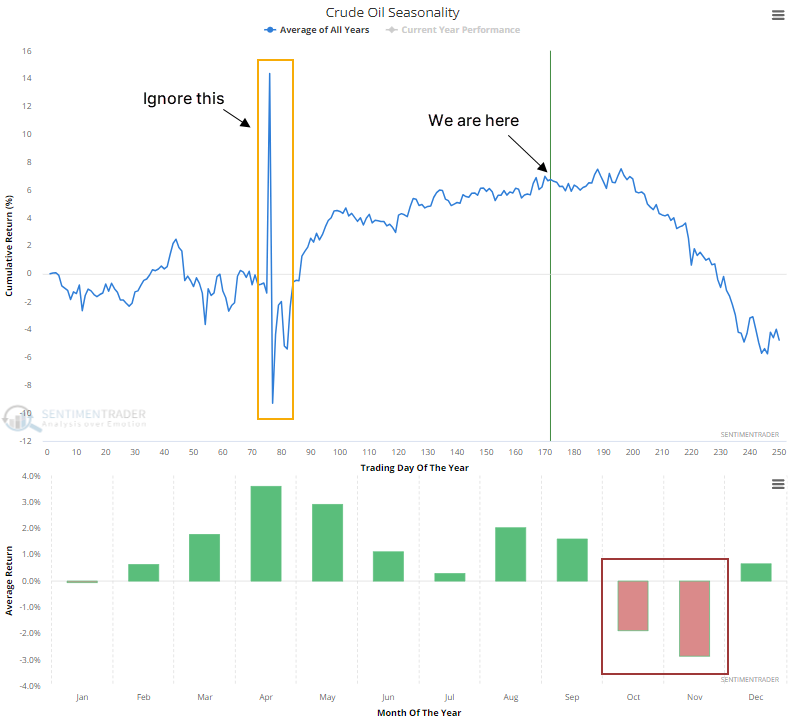
The chart below shows the growth of $10,000 invested in crude oil futures since 1984.
The black line shows the growth from the first Trading Day of the Year (TDY) through day #169. The $10,000 grew to $148,358. The blue line shows the "growth" from day #170 through year-end, during which $10,000 turned into just $2,014.
What the research tells us...
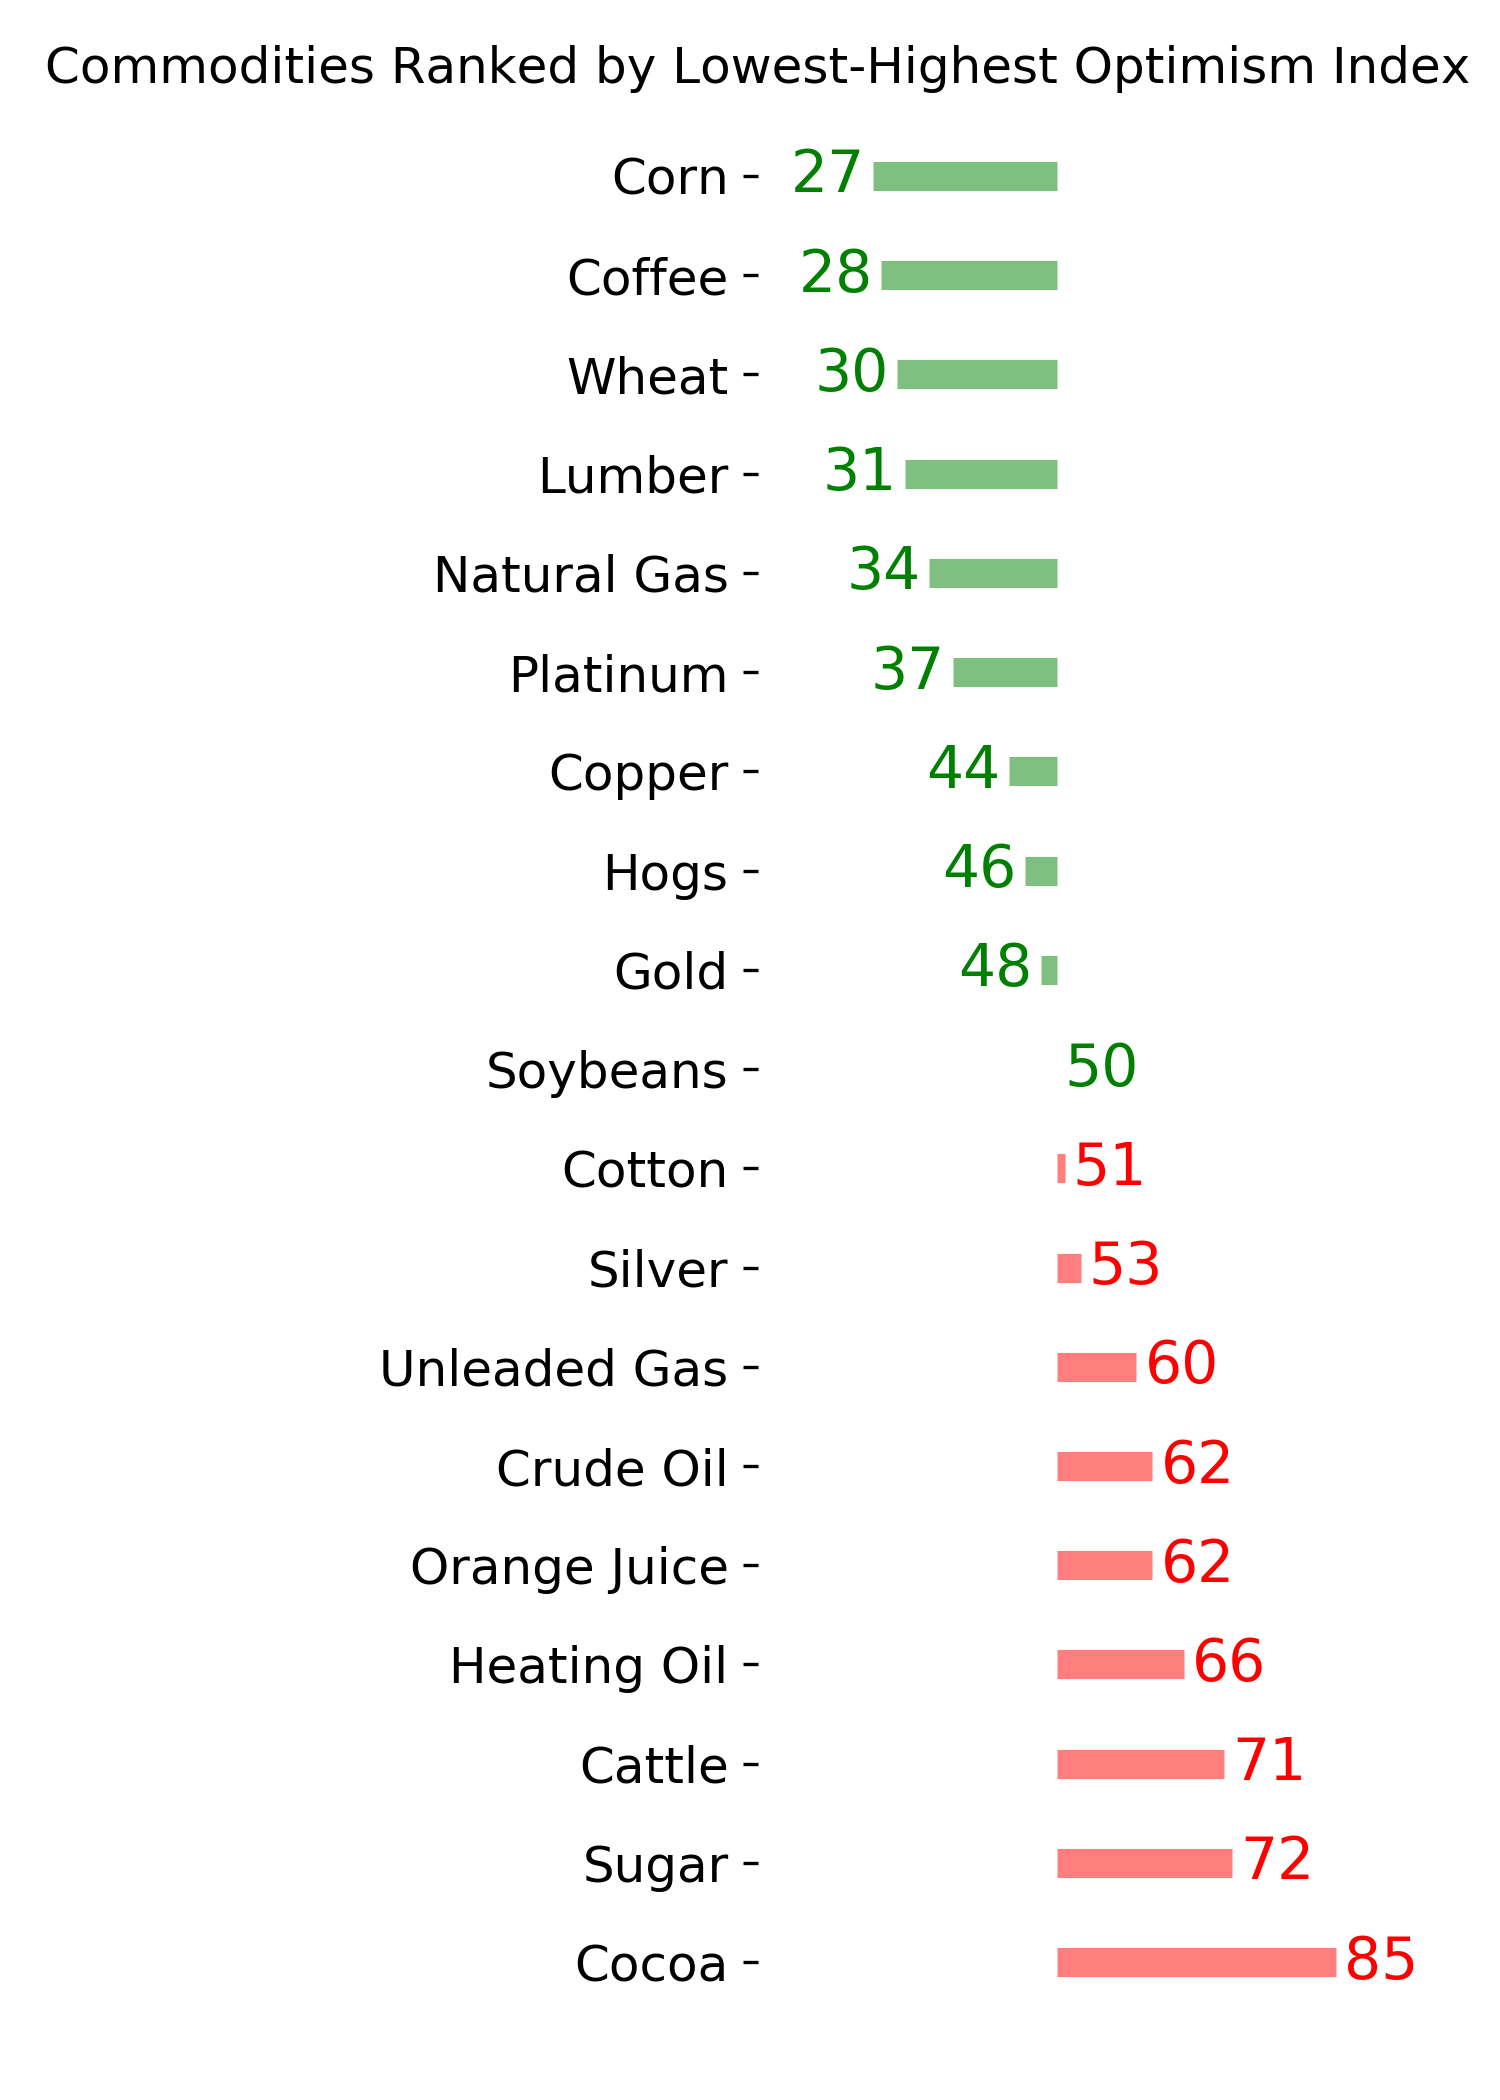
Among the most widely held broad investment categories, currencies tend to be the least responsive to extremes in sentiment. Commodities are next in line. While they usually "behave," they also can be easily overrun by structural factors like weather, planting conditions, and geopolitical machinations that overpower historical extremes.
Perhaps crude oil is in the midst of one of those periods, in which case further gains over the next couple of weeks should give us a decent heads-up. If not, then by historical standards, it would typically run into trouble at any moment. The latter months of the year have been tough for sustained gains, and a handful of indicators suggest that the move has potentially run ahead of itself.
Indicators at Extremes
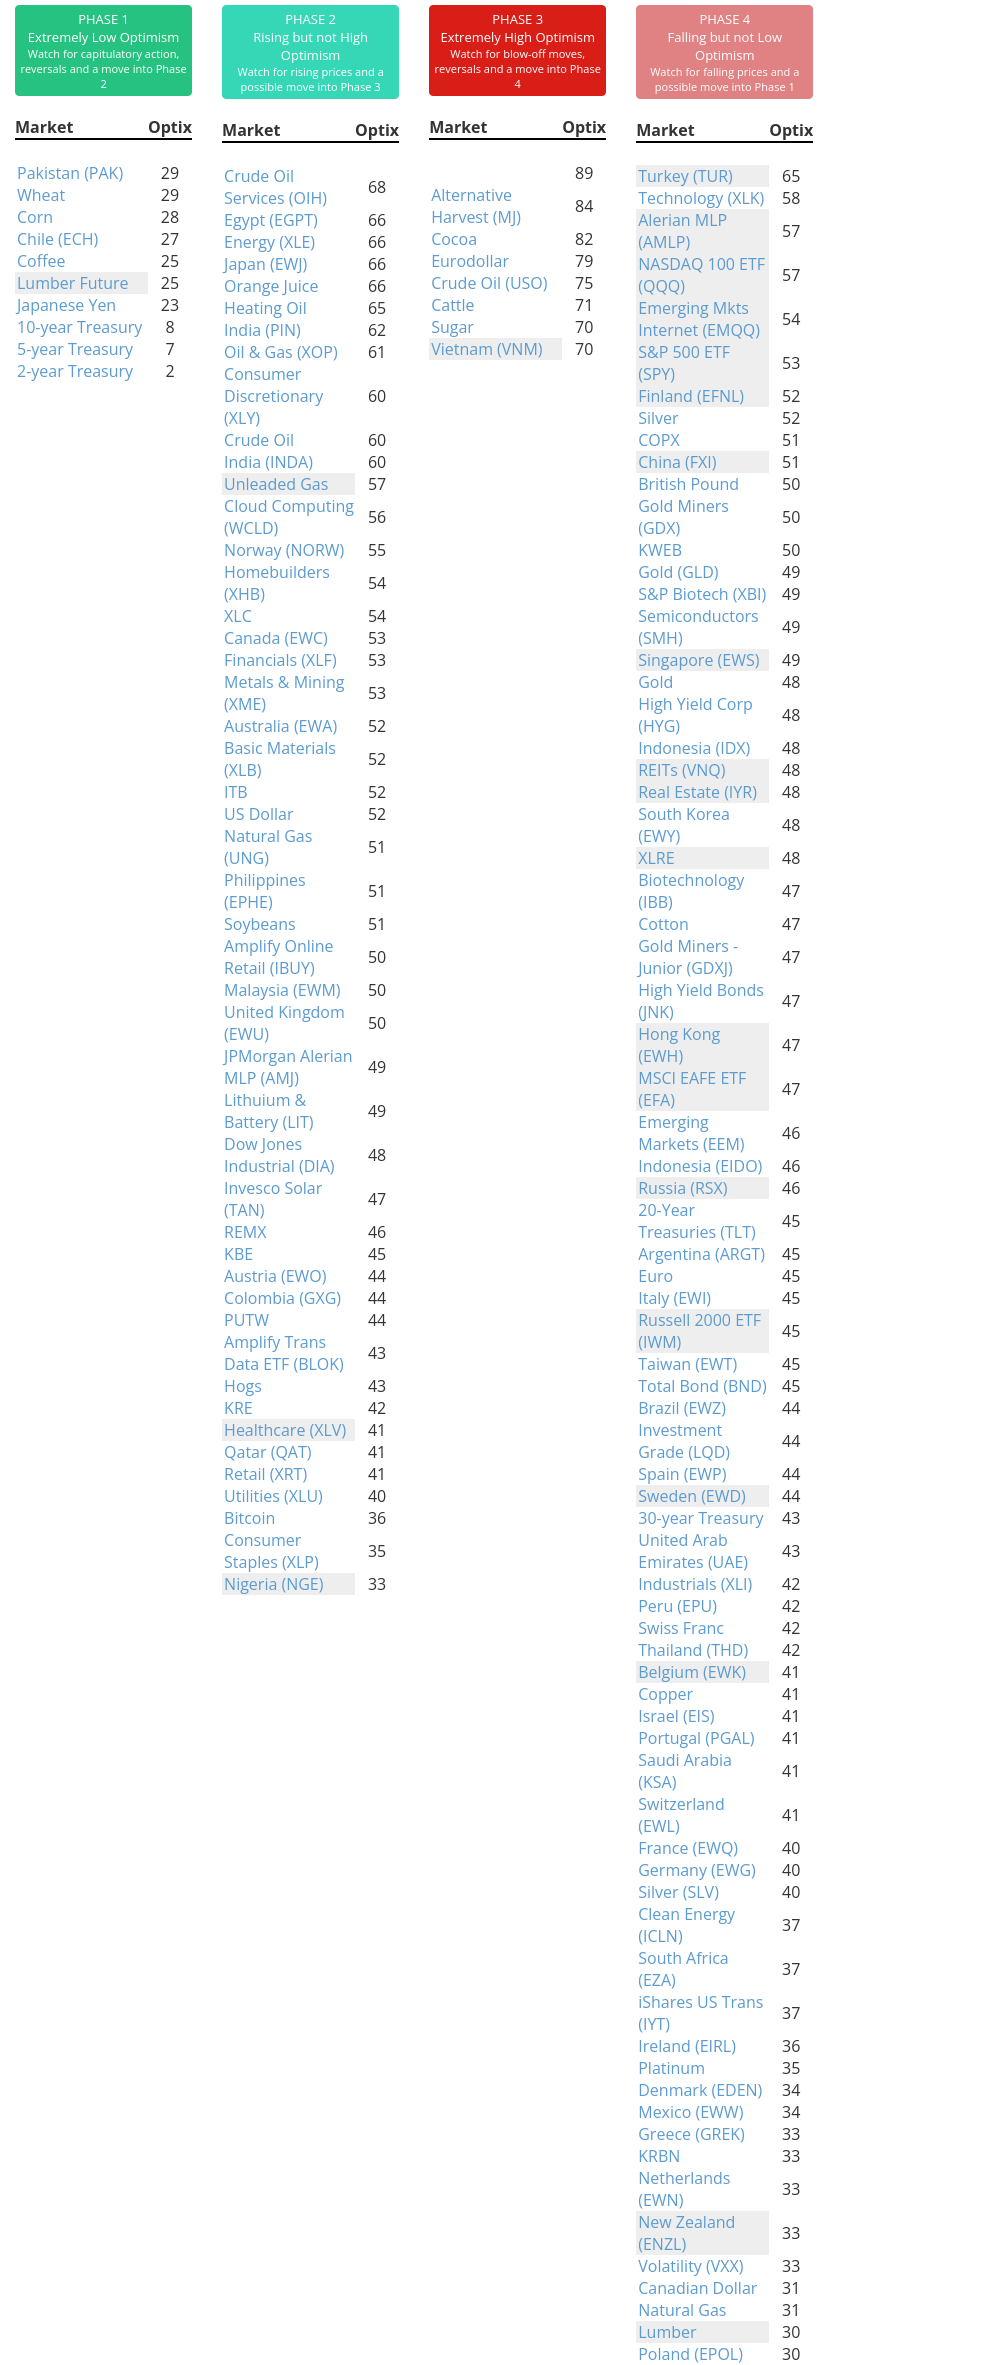
Phase Table
Ranks
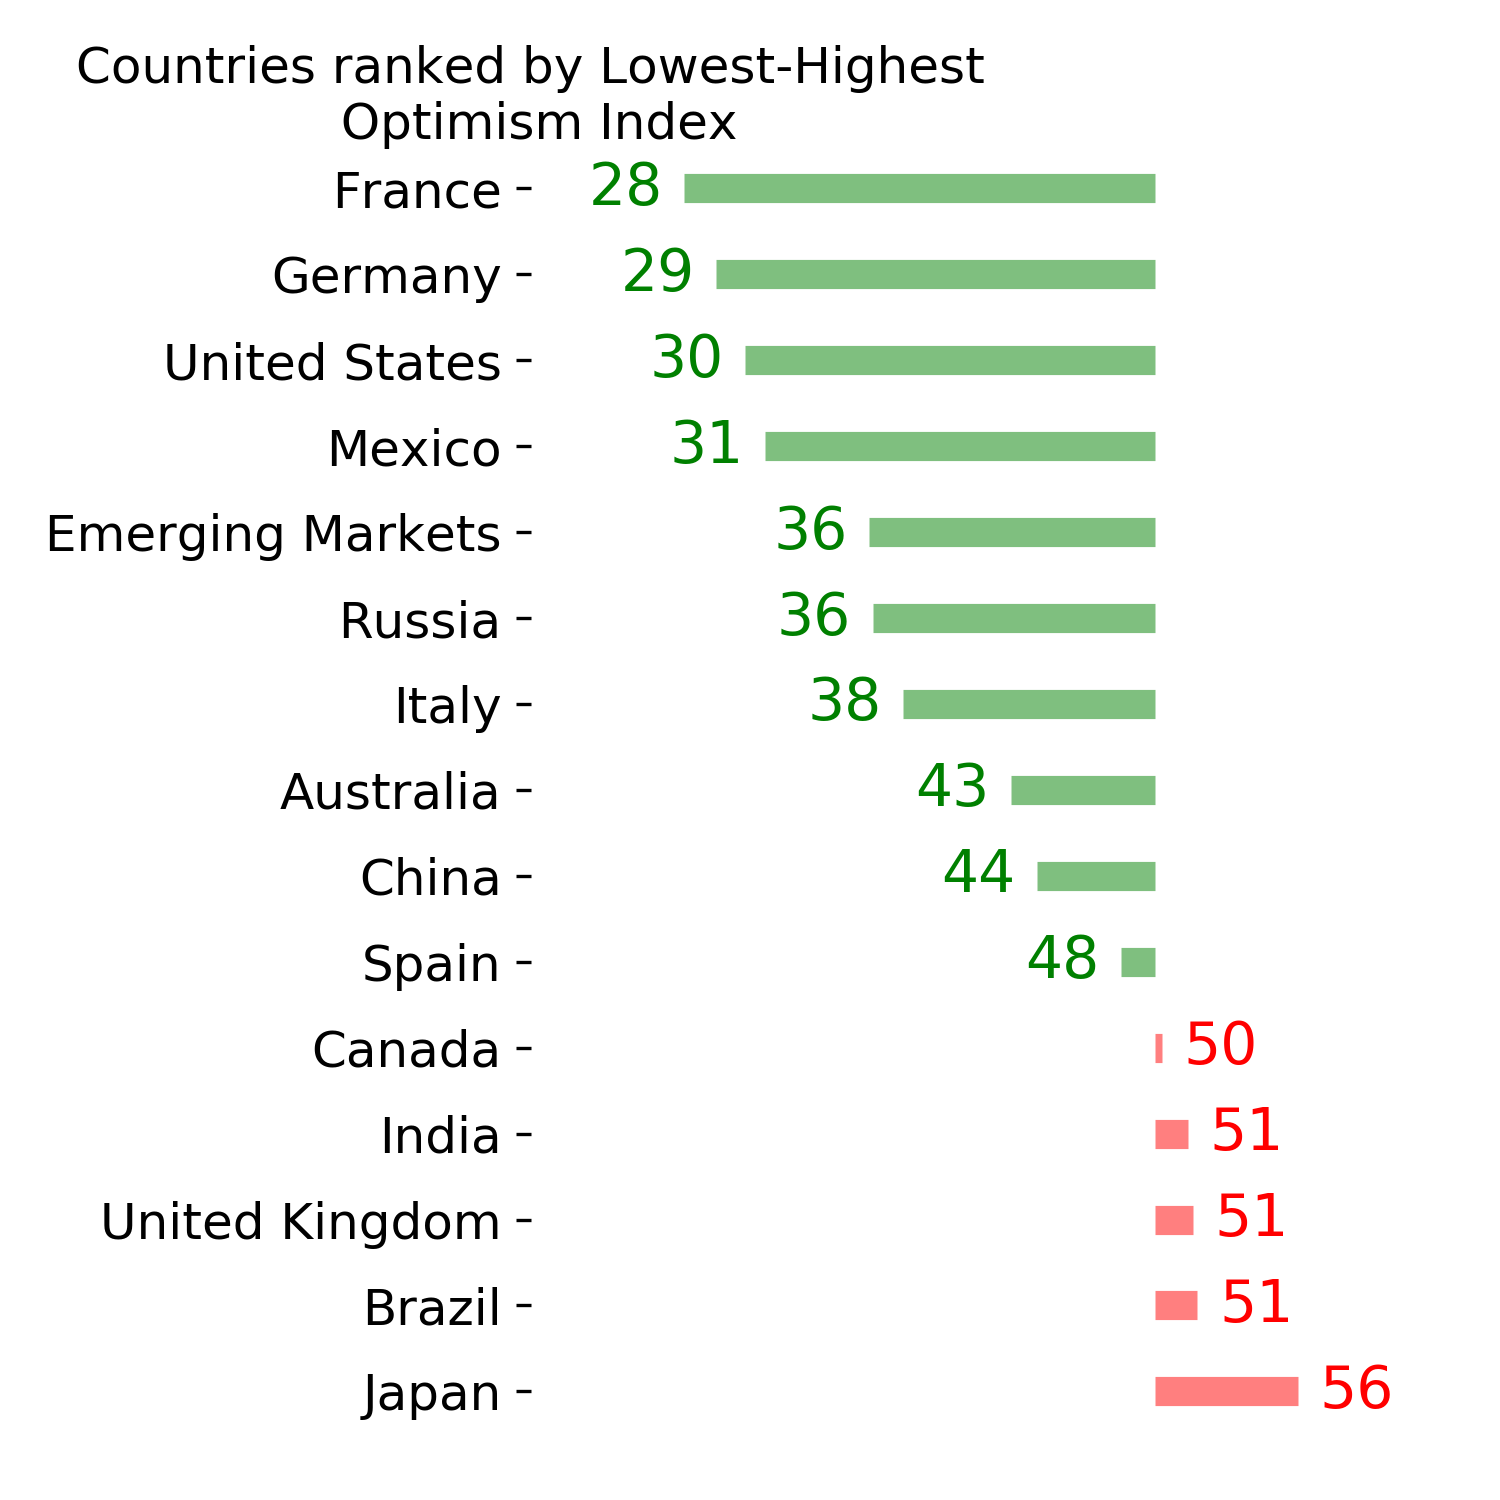
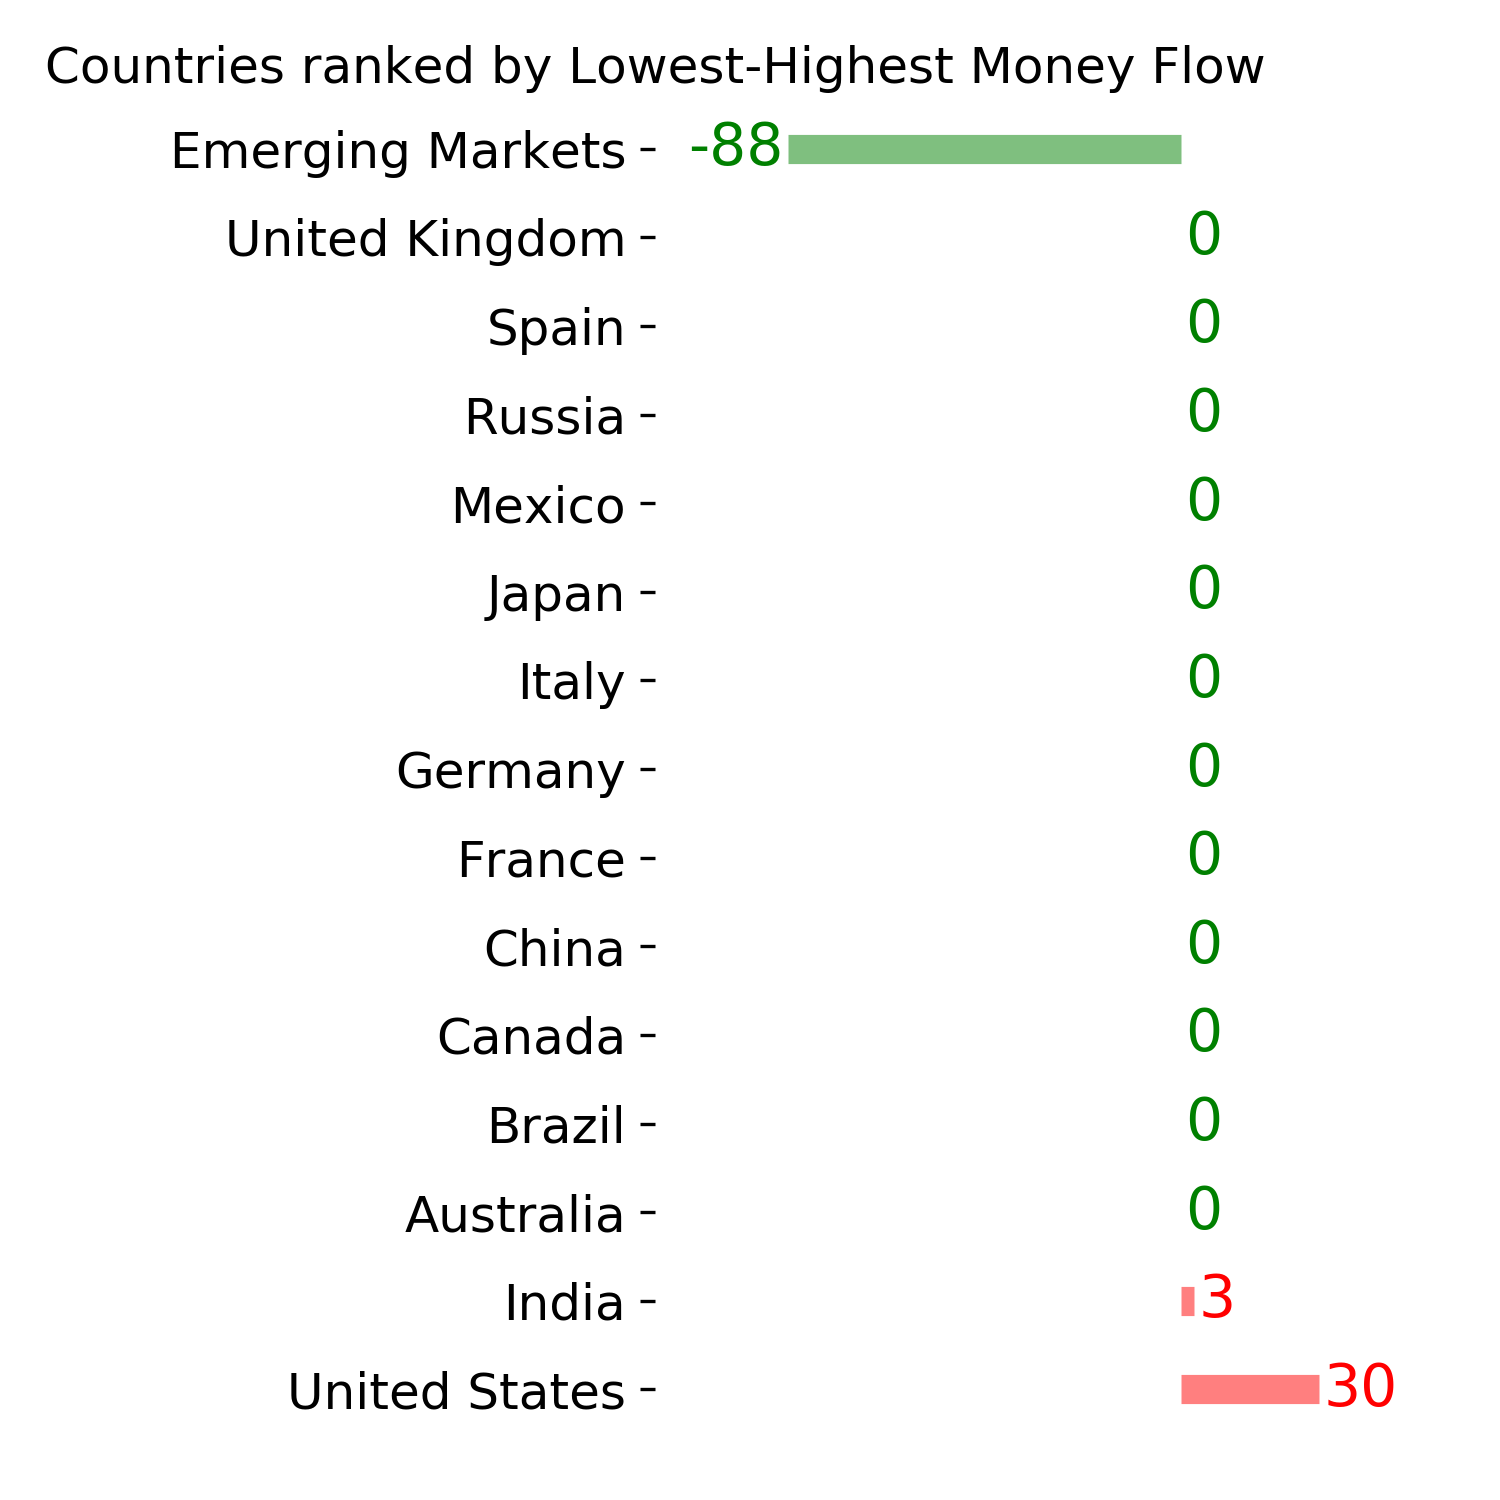
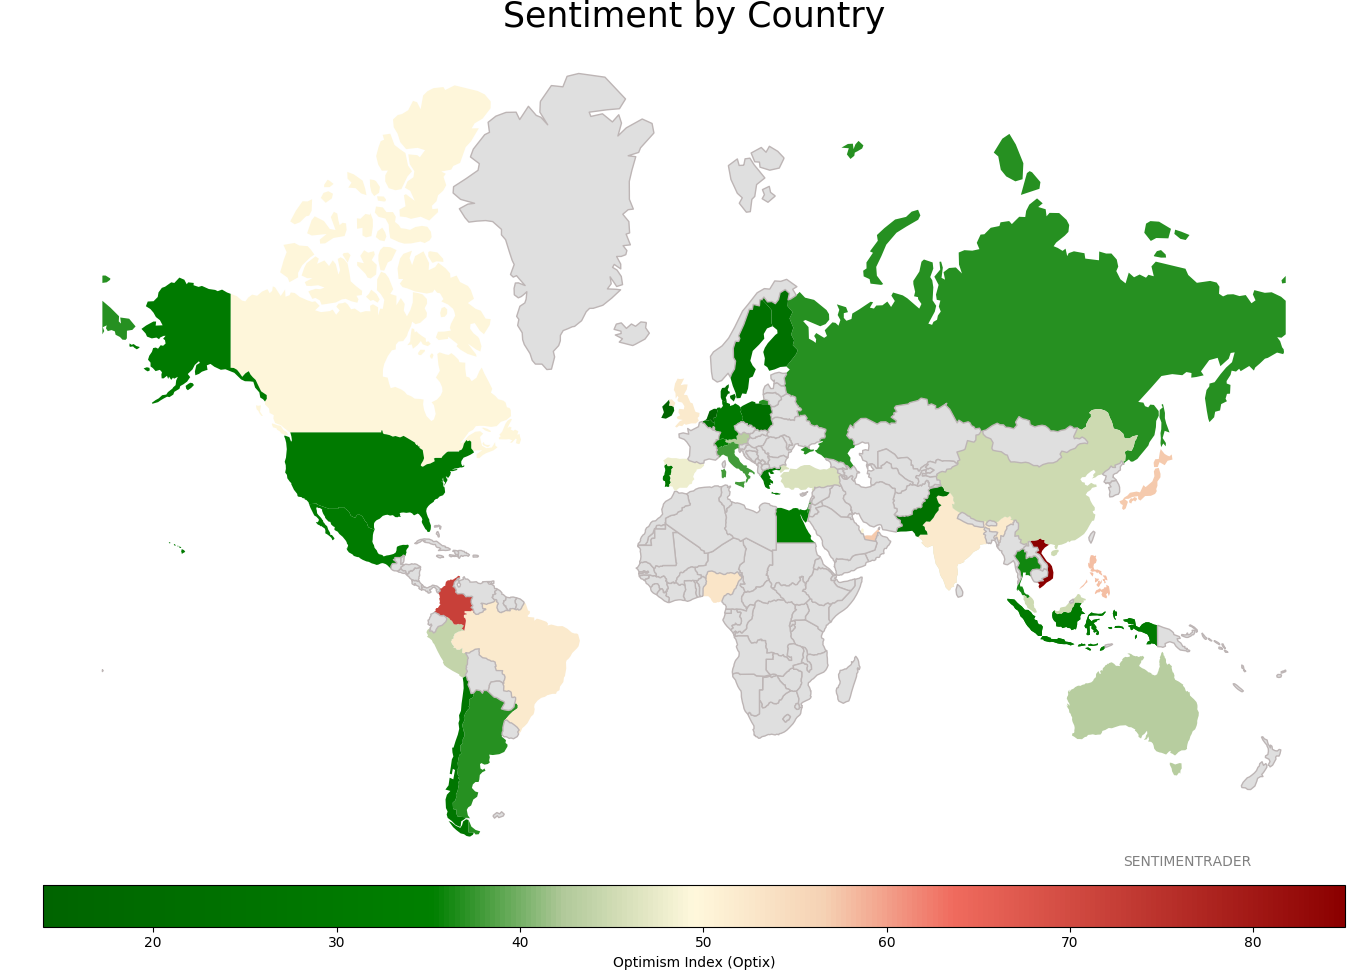
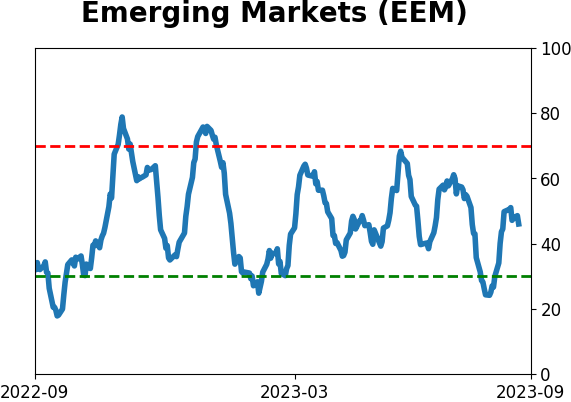
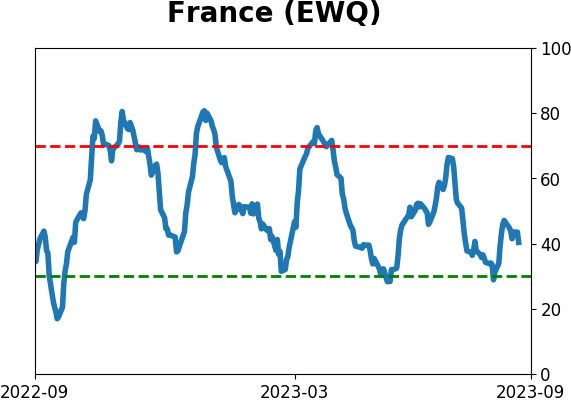
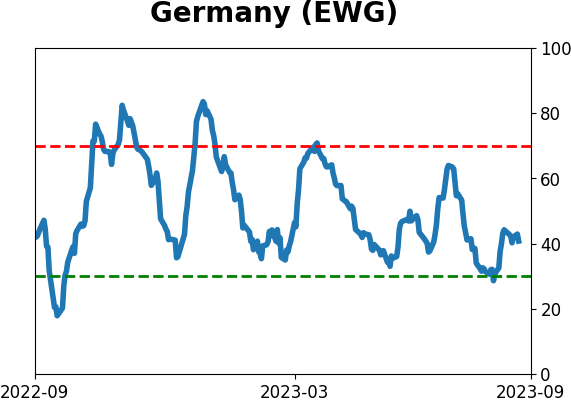
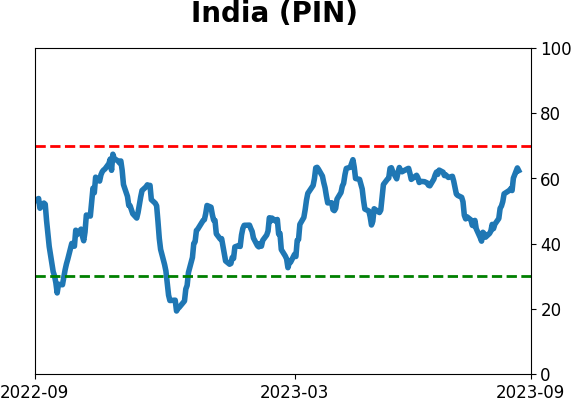
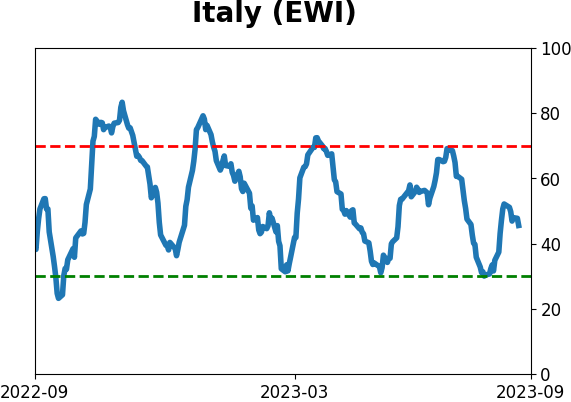
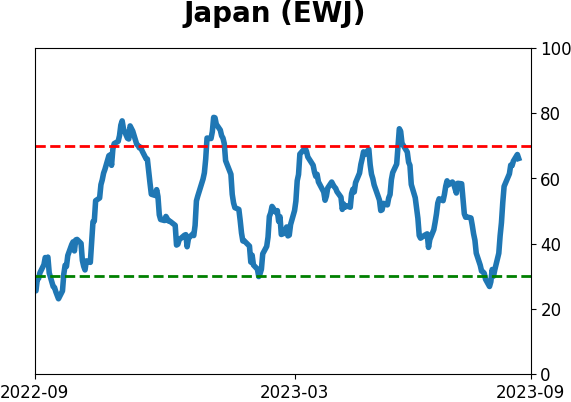
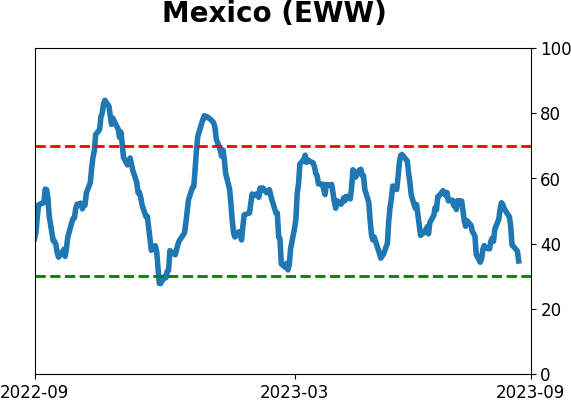
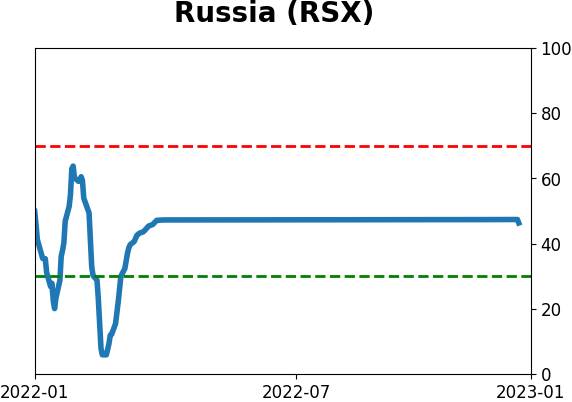
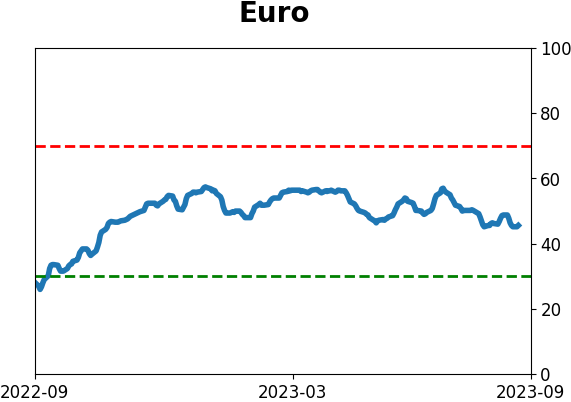
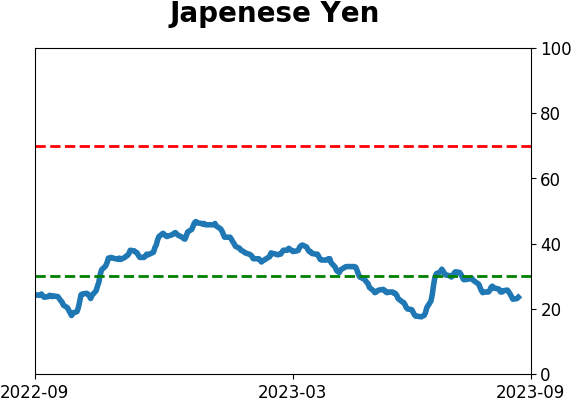
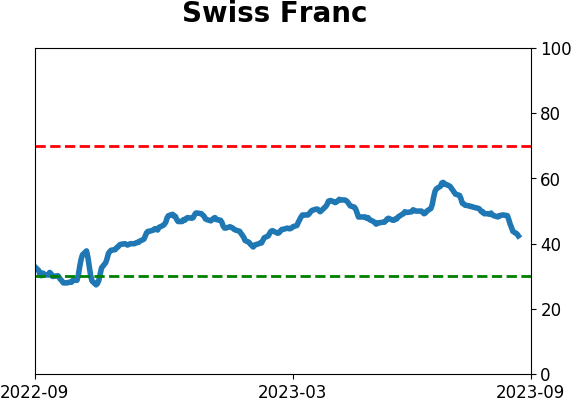
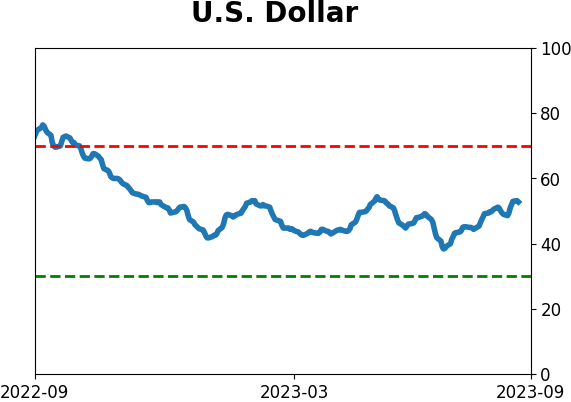
Sentiment Around The World
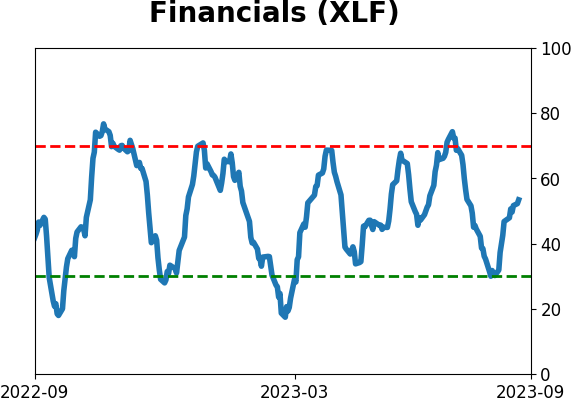
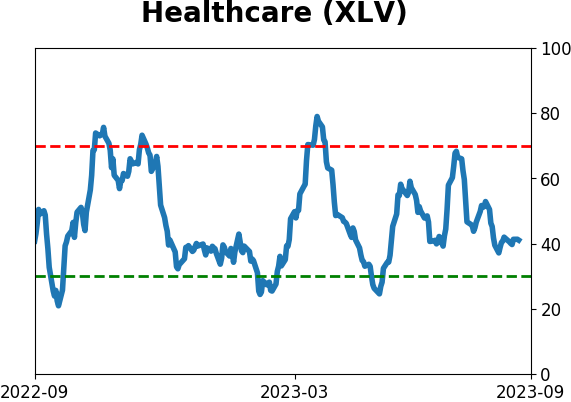
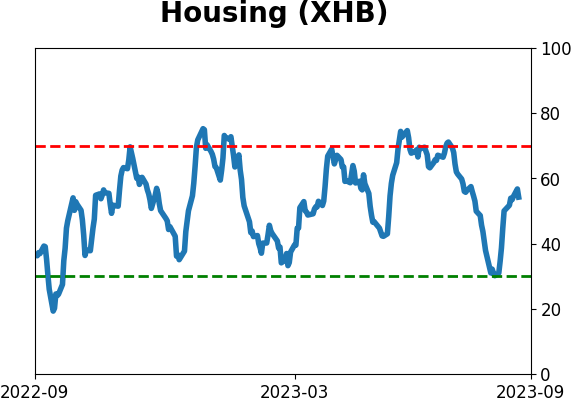
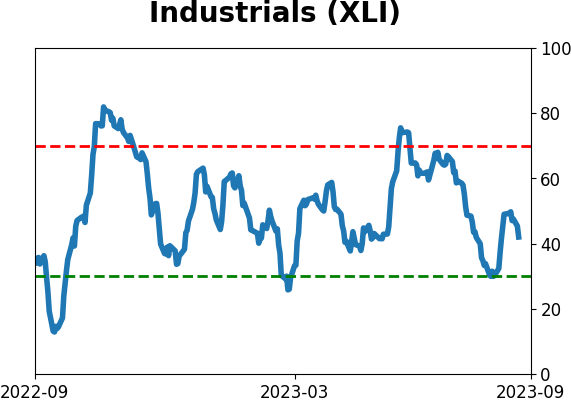
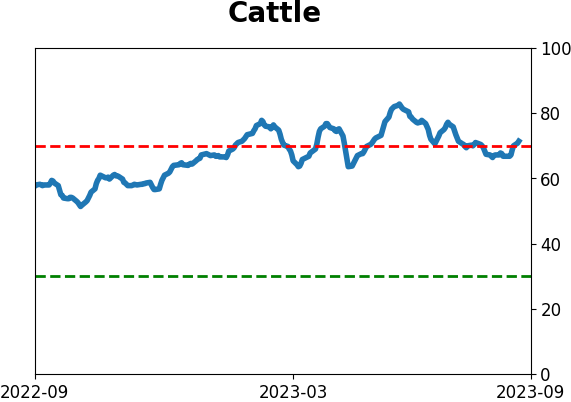
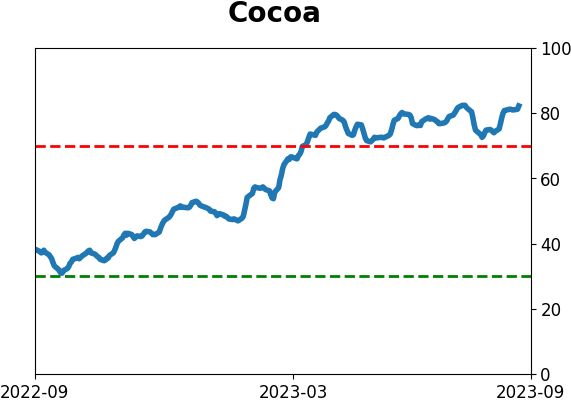
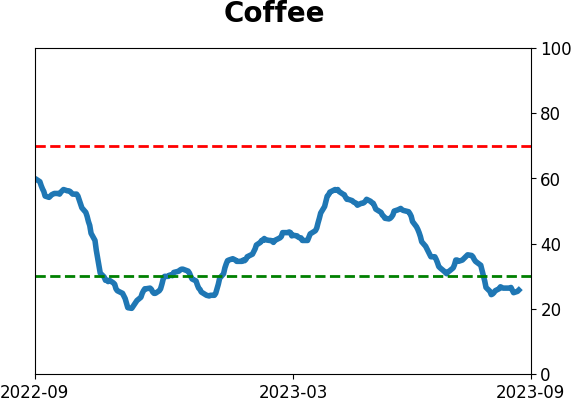
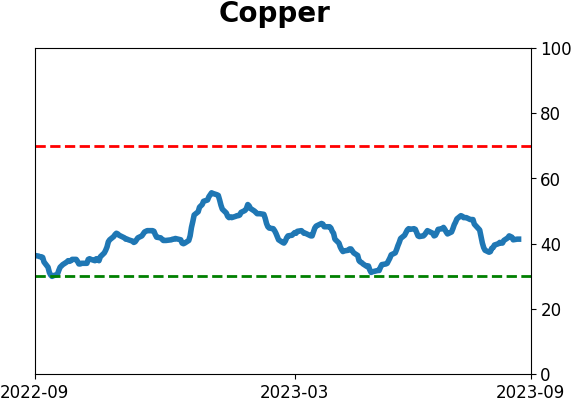
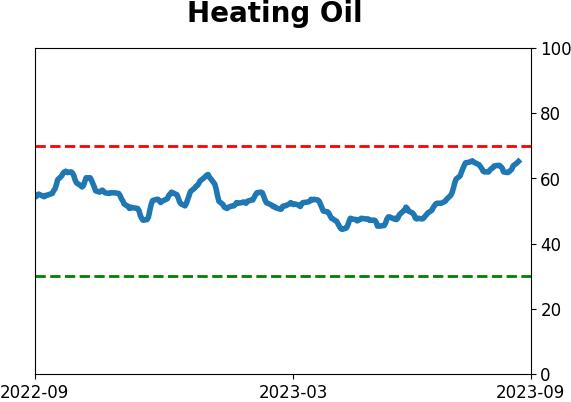
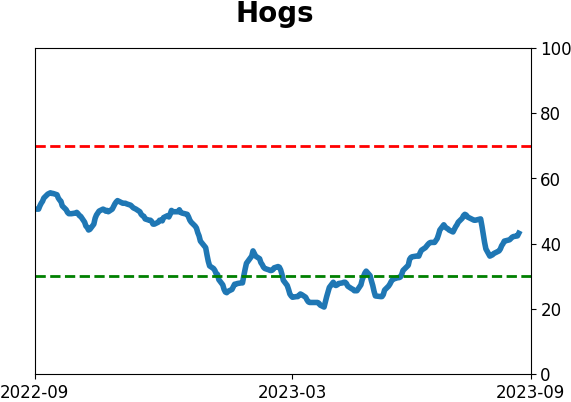
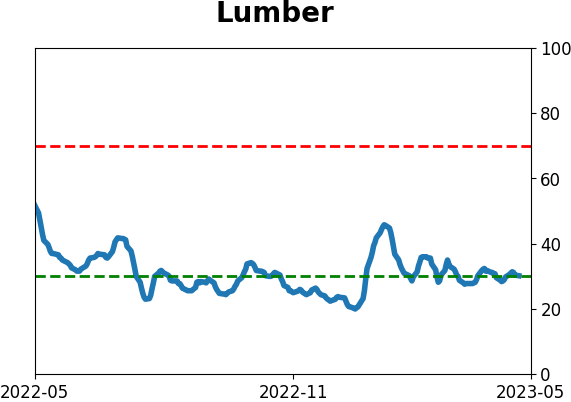
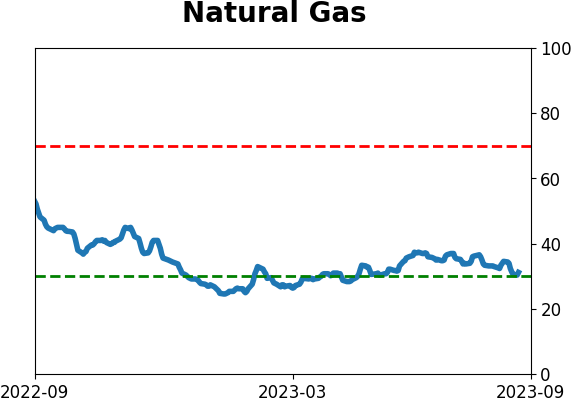
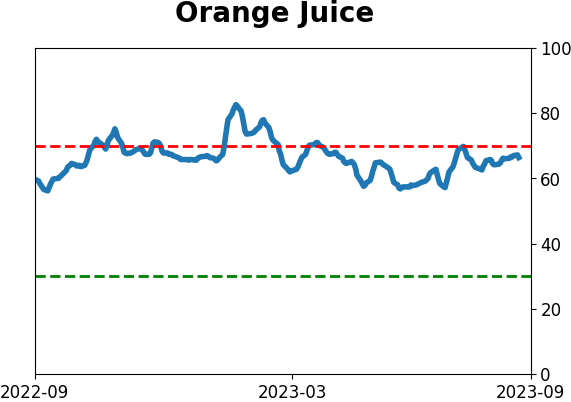
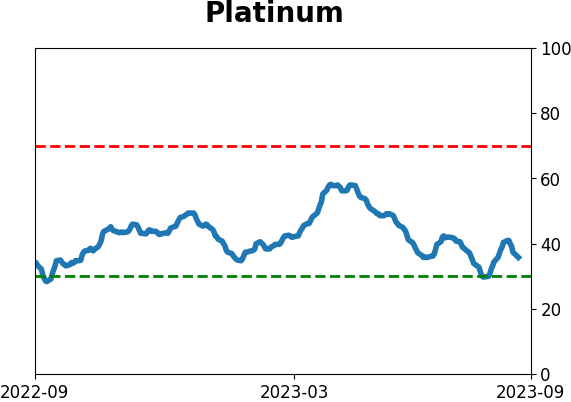
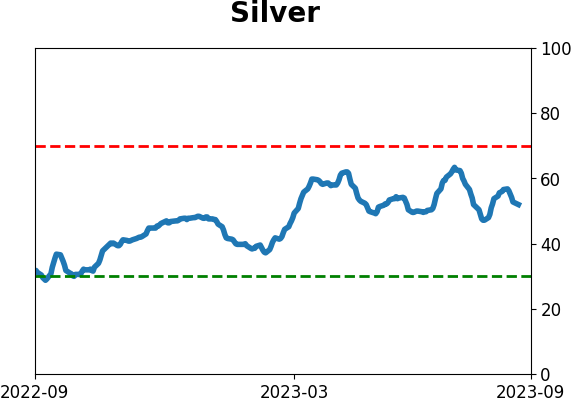
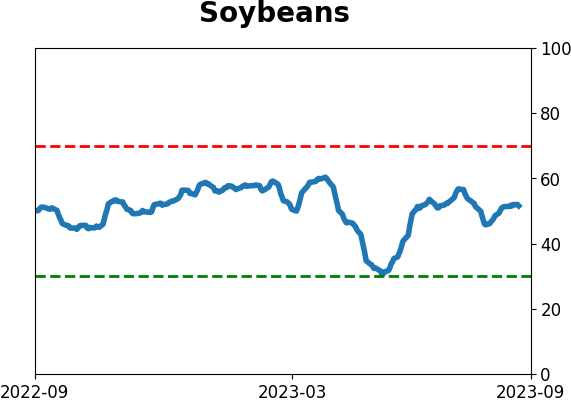
Optimism Index Thumbnails
|
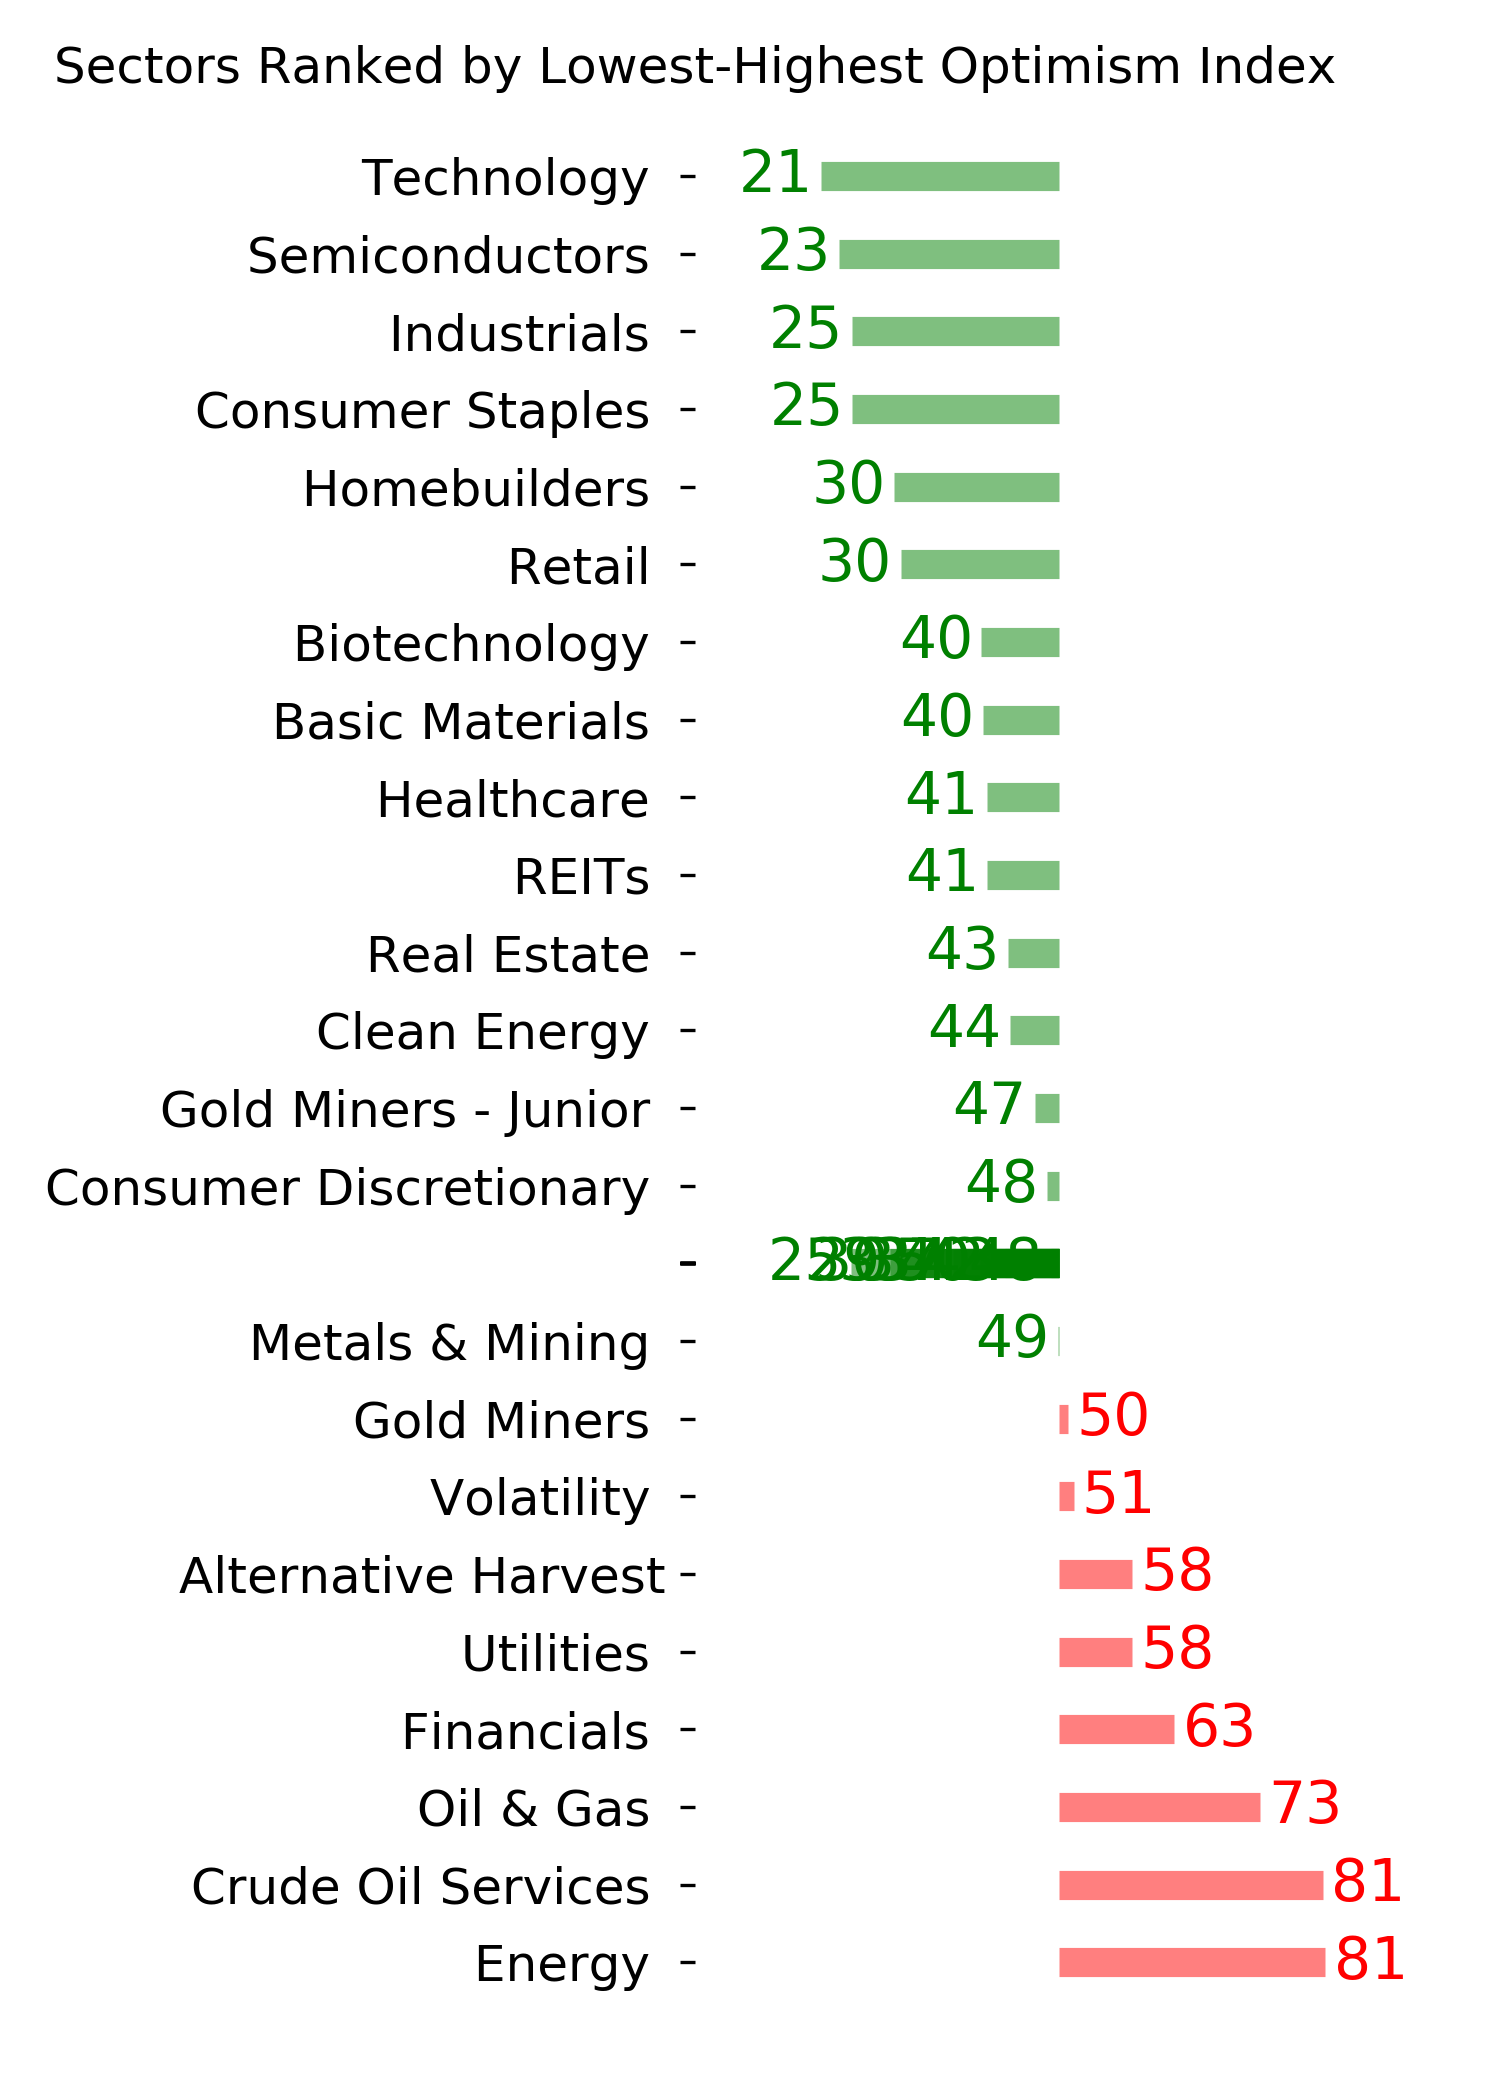
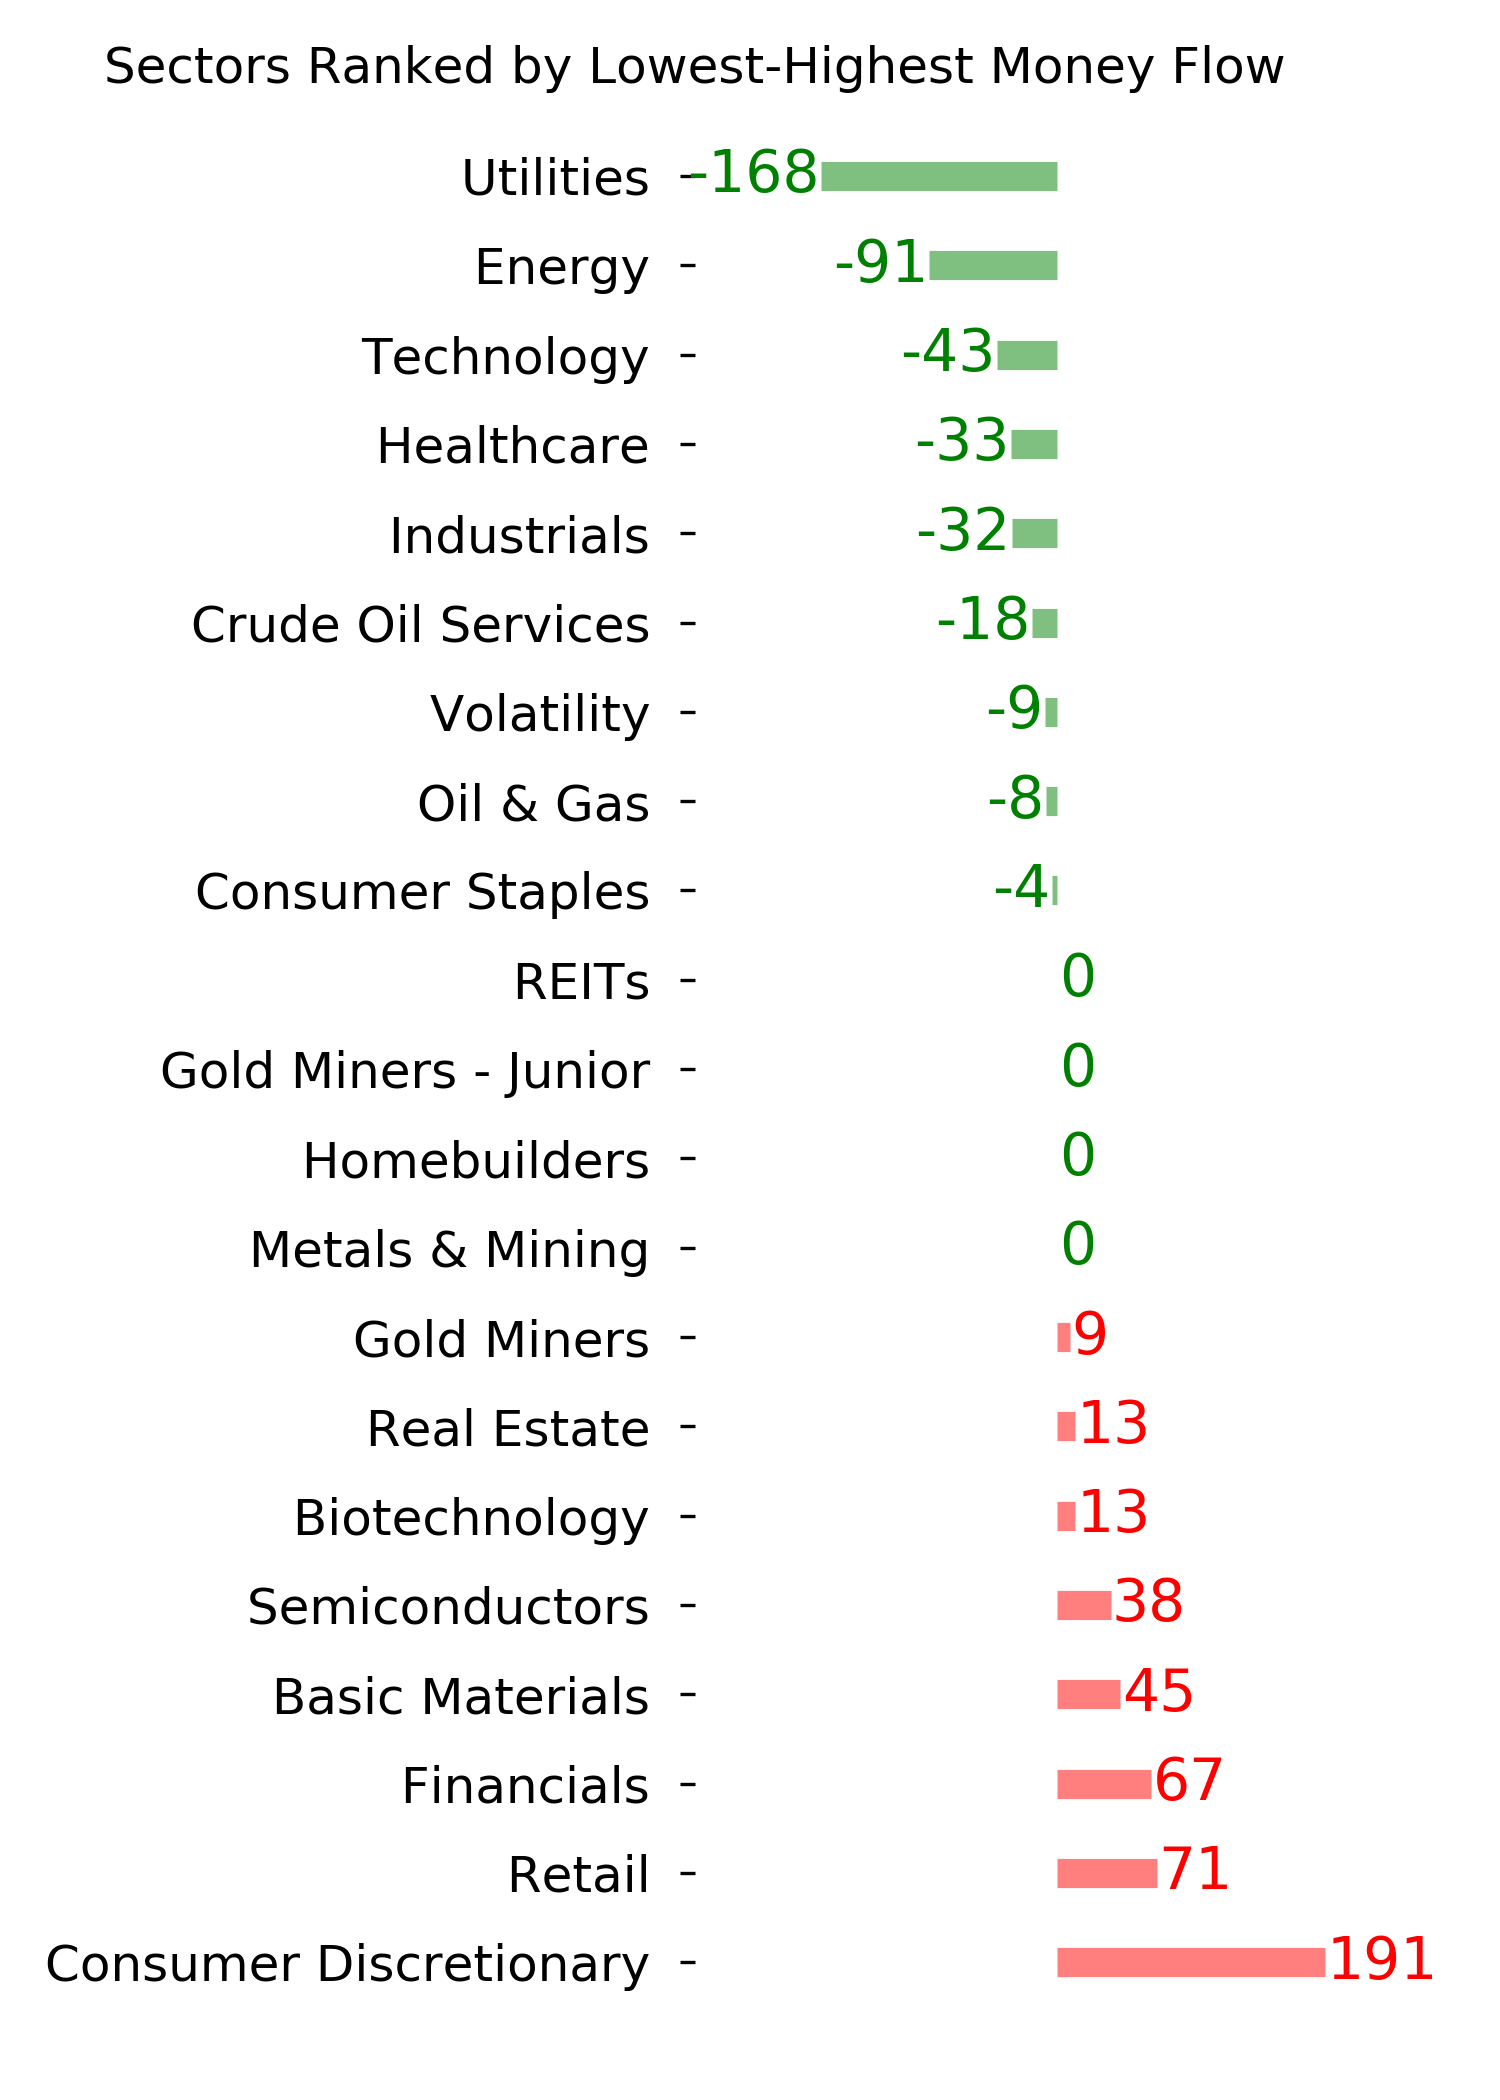
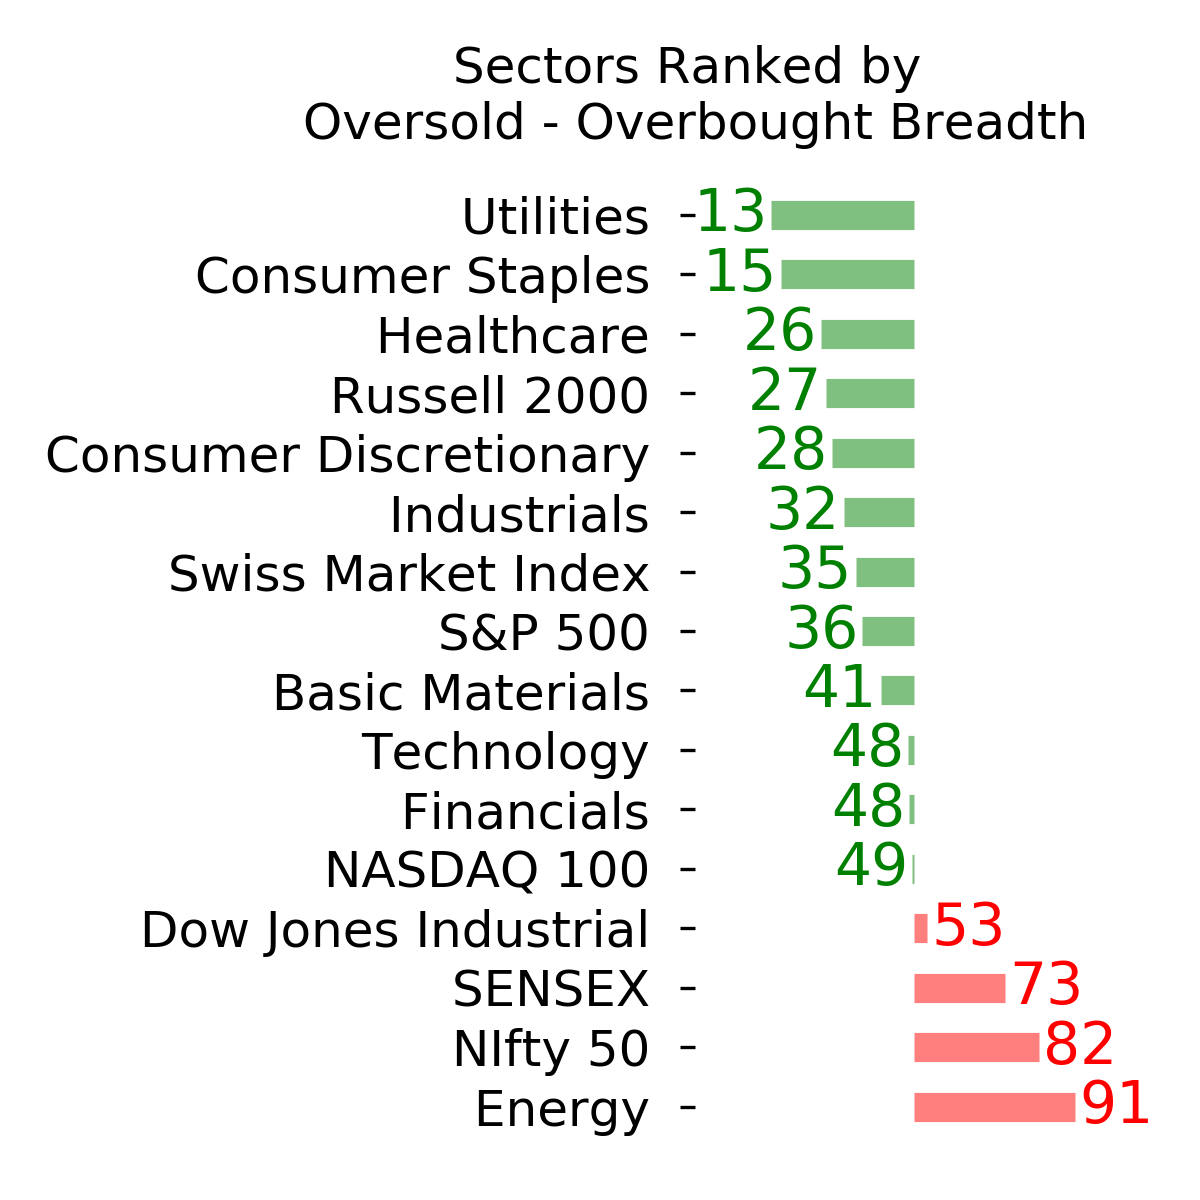
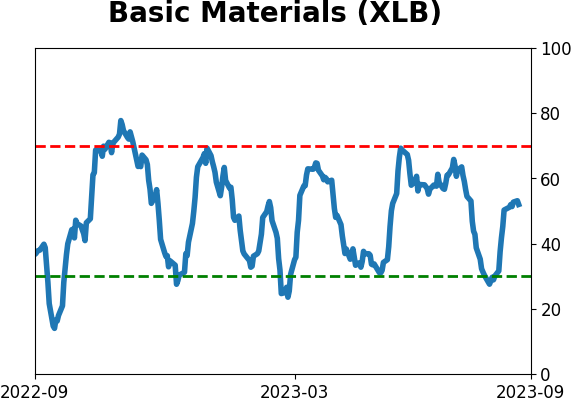
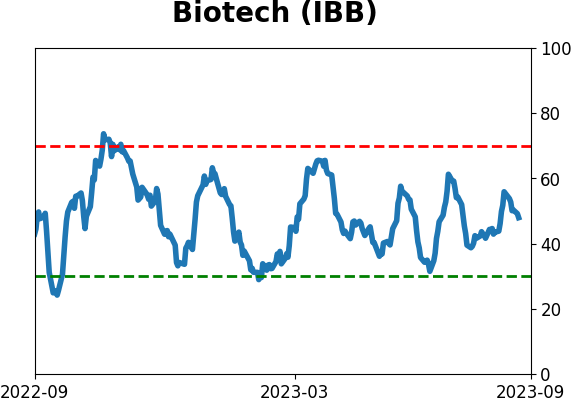
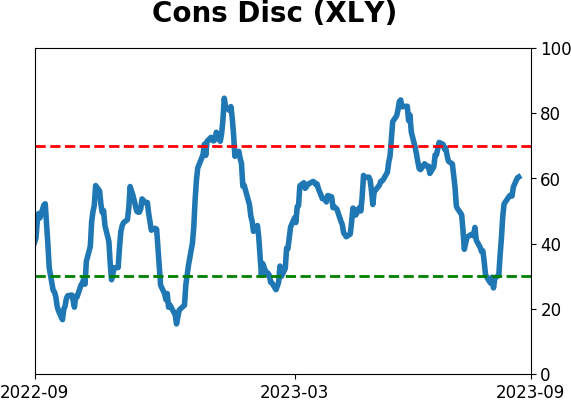
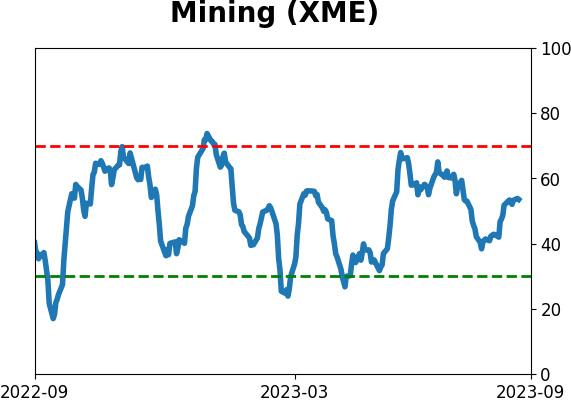
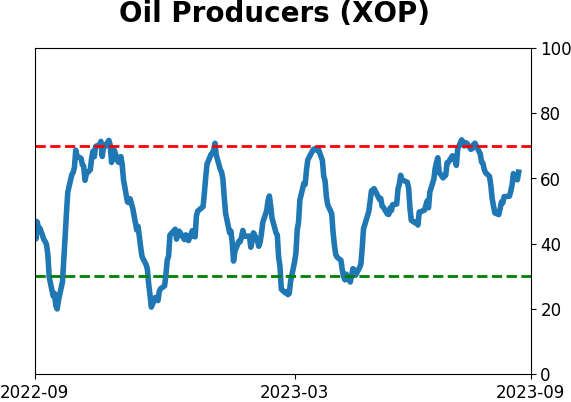
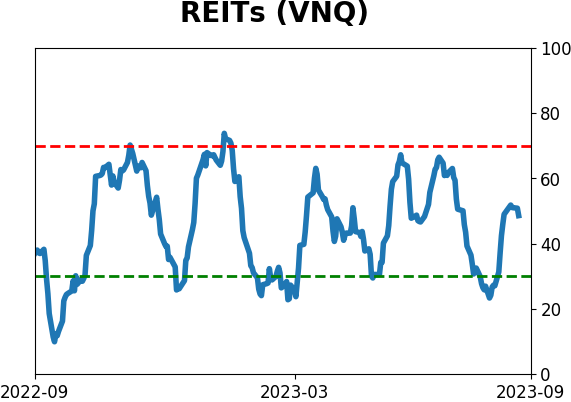
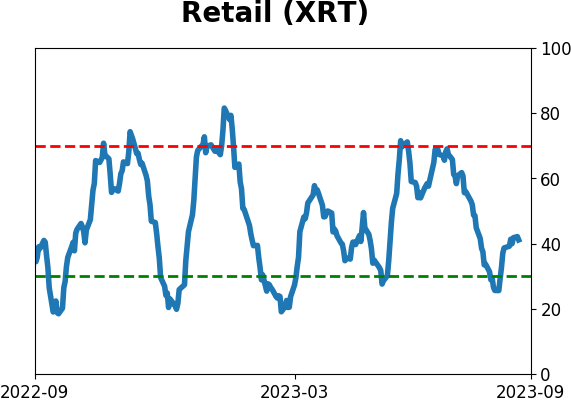
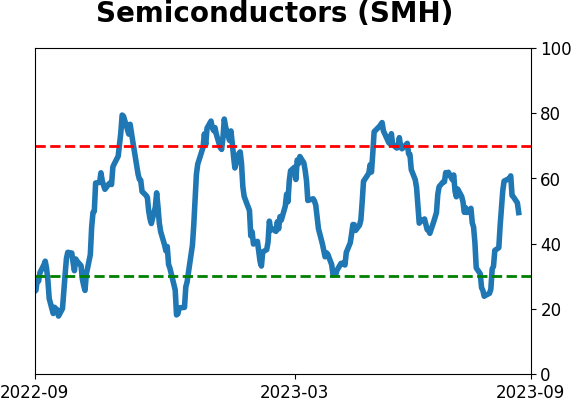
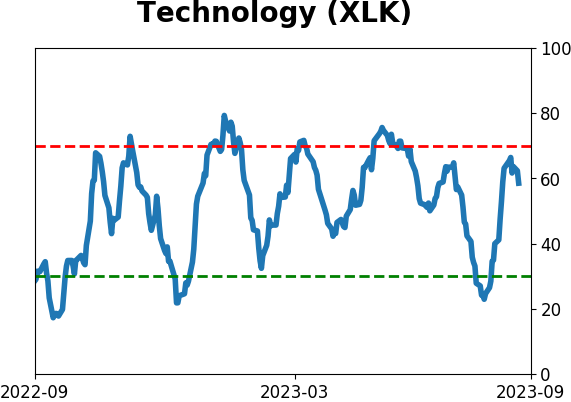
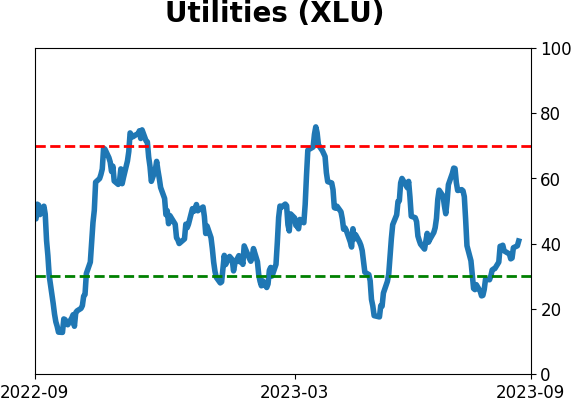
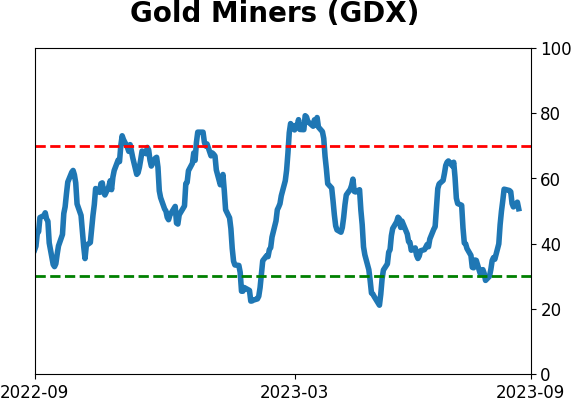
Sector ETF's - 10-Day Moving Average
|
|
|
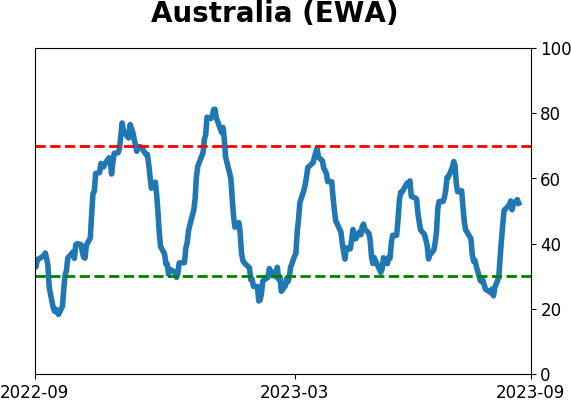
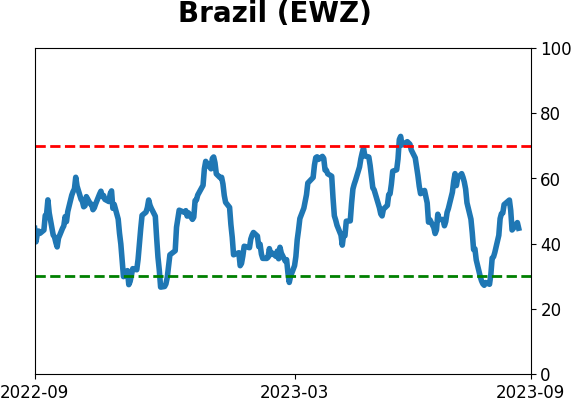
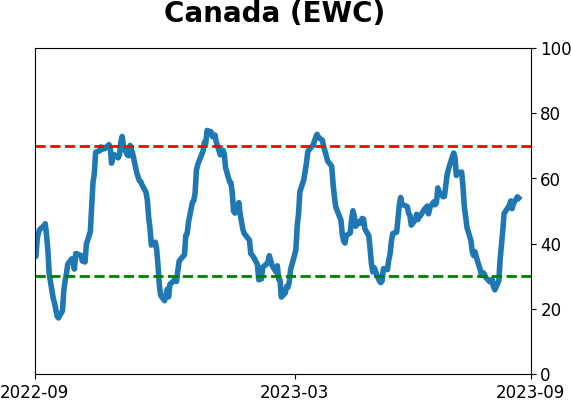
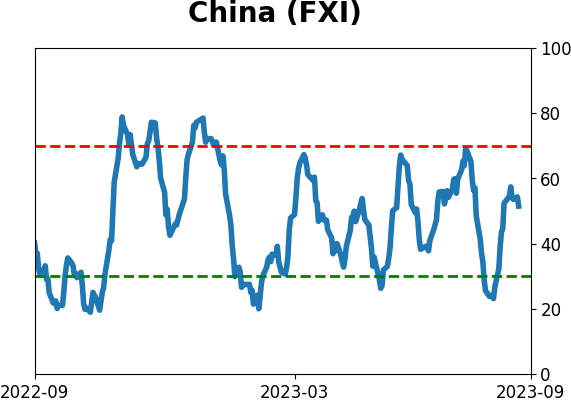
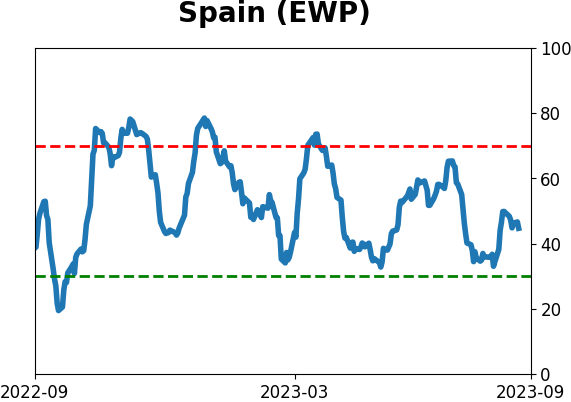
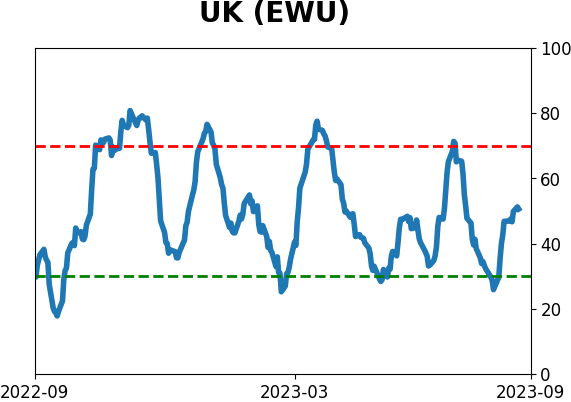
Country ETF's - 10-Day Moving Average
|
|
|
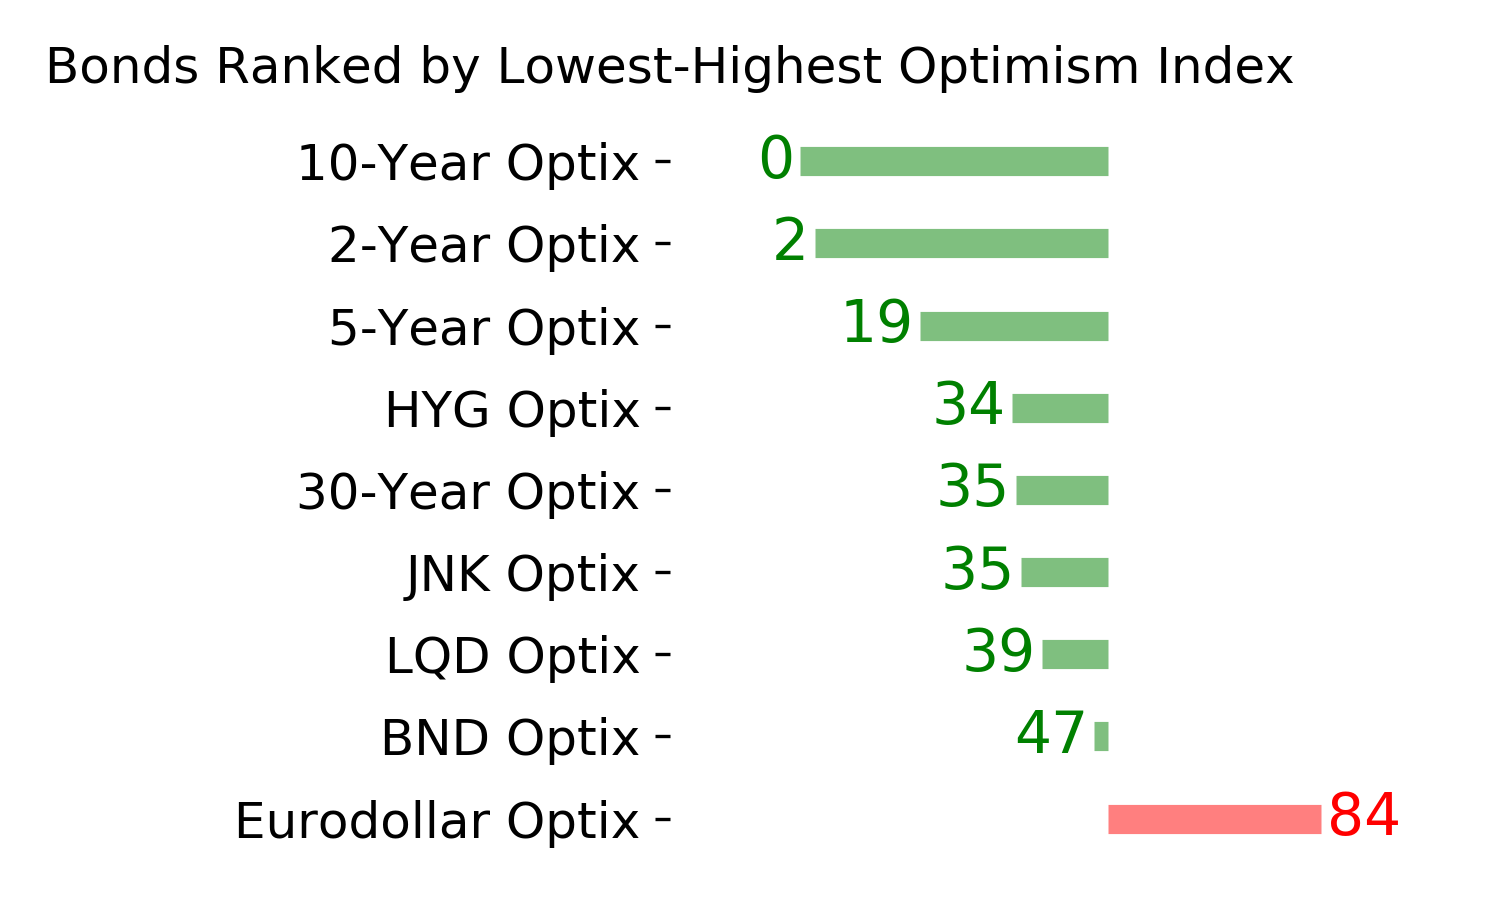
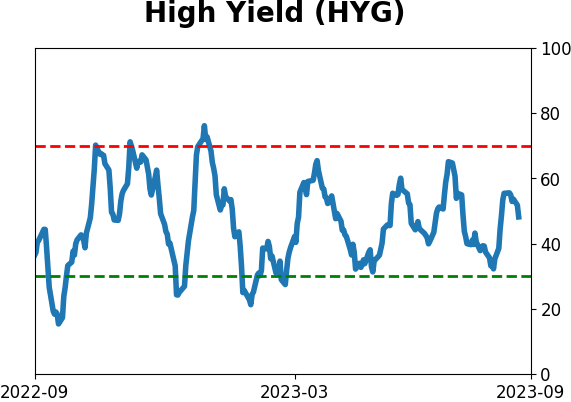
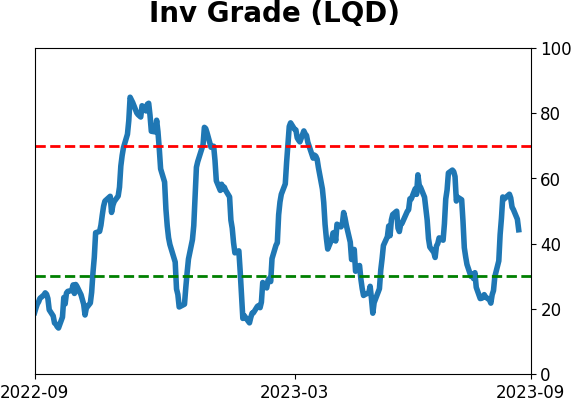
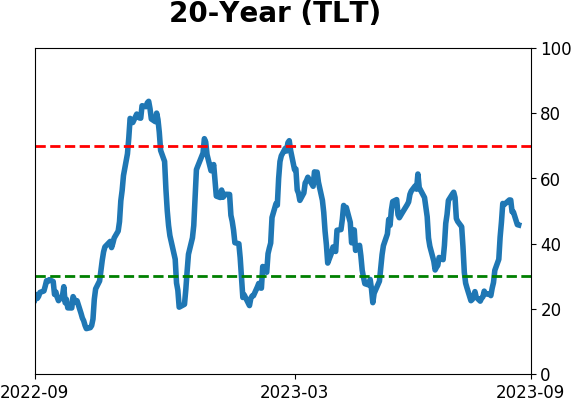
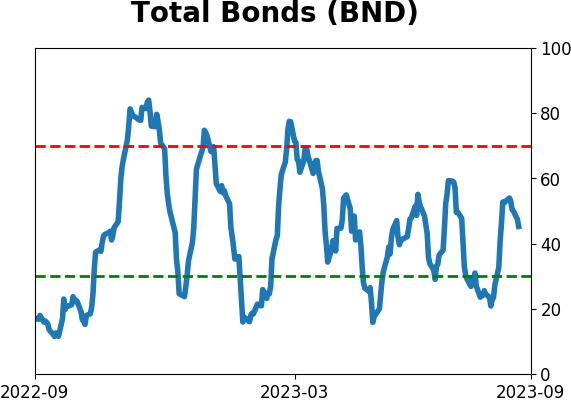
Bond ETF's - 10-Day Moving Average
|
|
|
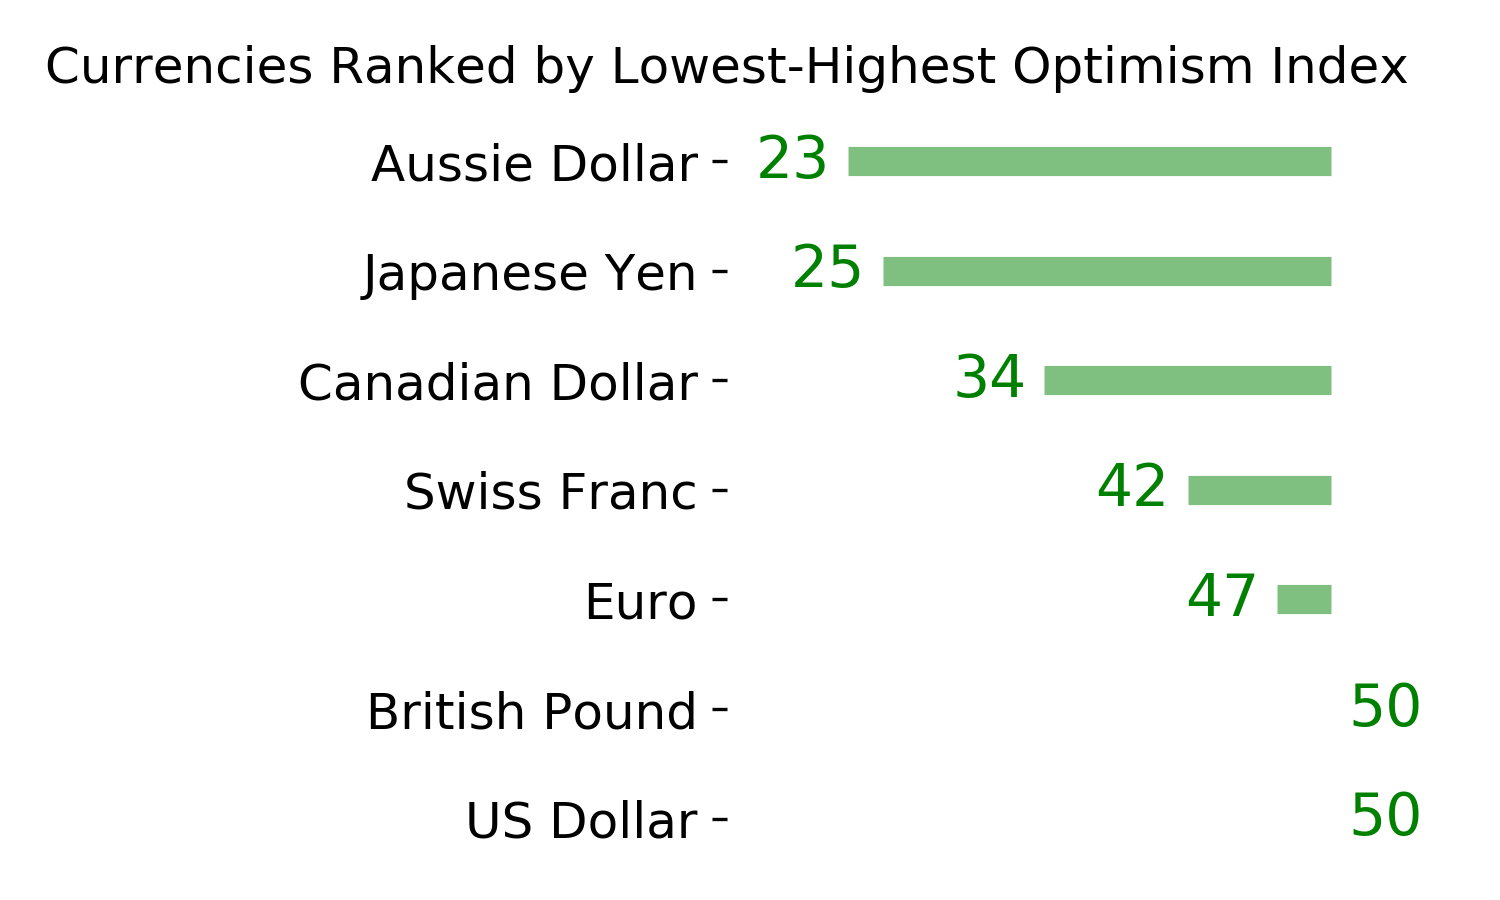
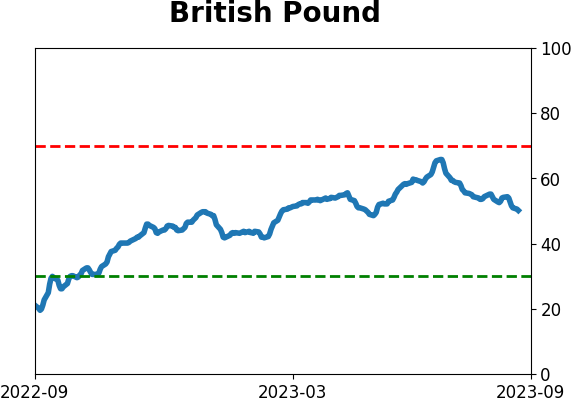
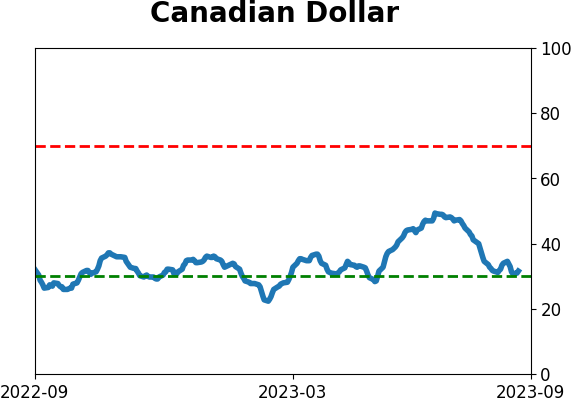
Currency ETF's - 5-Day Moving Average
|
|
|
Commodity ETF's - 5-Day Moving Average
|
|