Headlines
|
|
The dollar bucks its tendencies to see new uptrend:
The U.S. dollar rallied for 8 straight weeks and has held above its 200-day moving average for more than a month after having been below it for more than six months. Similar reactions tended to lead to modest further gains in the dollar, and other assets struggled to gain over the following month.
|
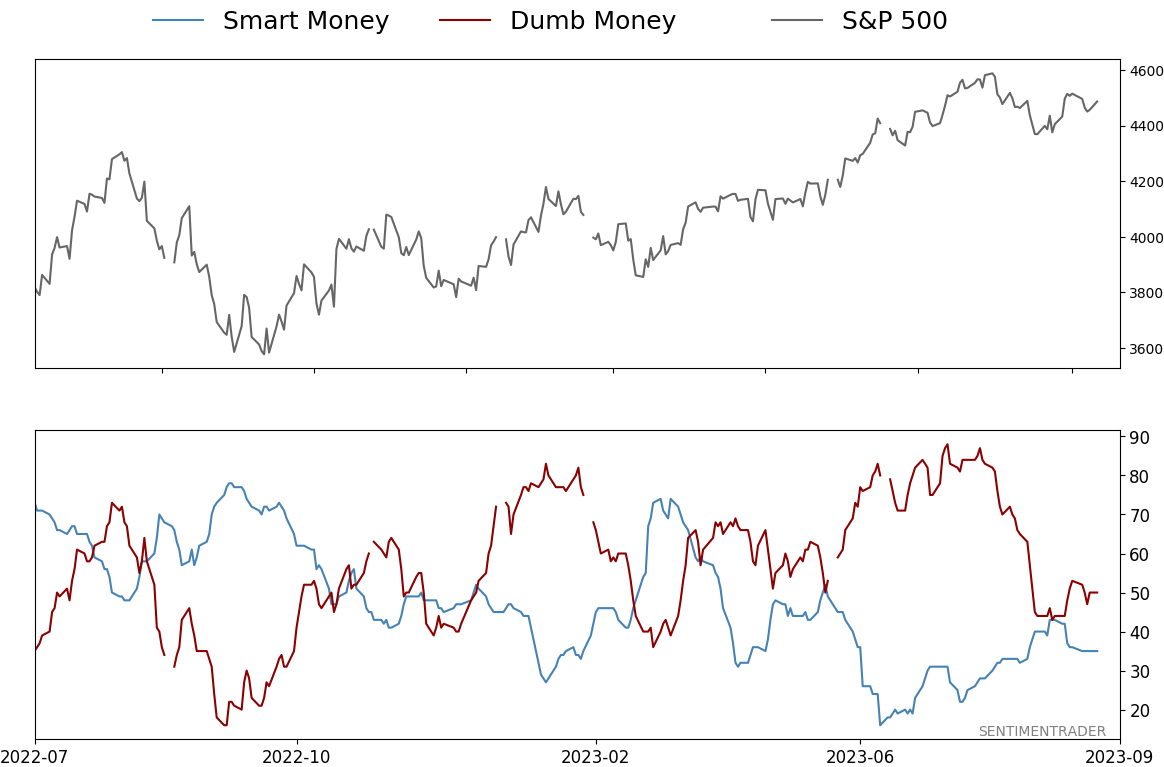
Smart / Dumb Money Confidence
|
Smart Money Confidence: 35%
Dumb Money Confidence: 50%
|
|
Risk Levels
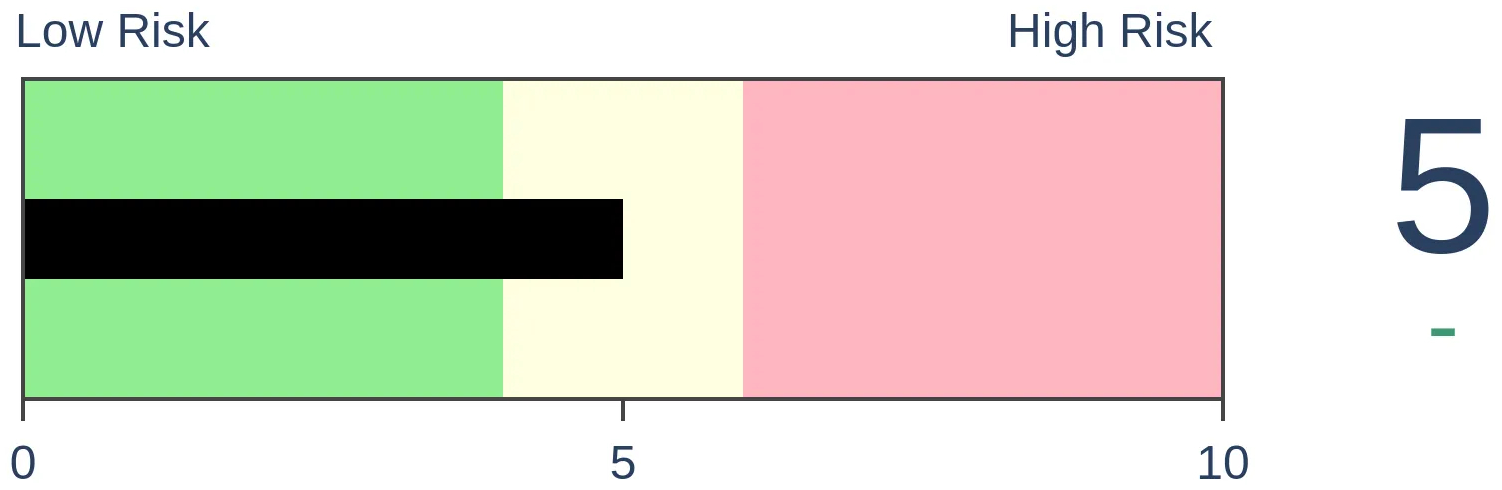
Stocks Short-Term
|
Stocks Medium-Term
|
|
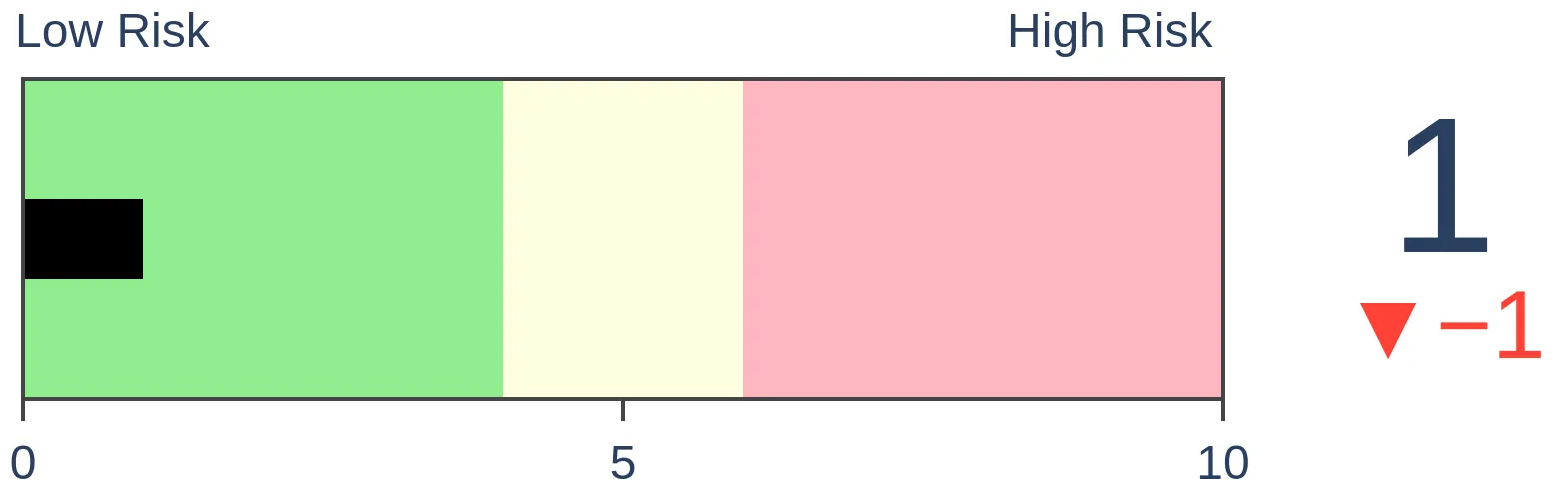
Bonds
|
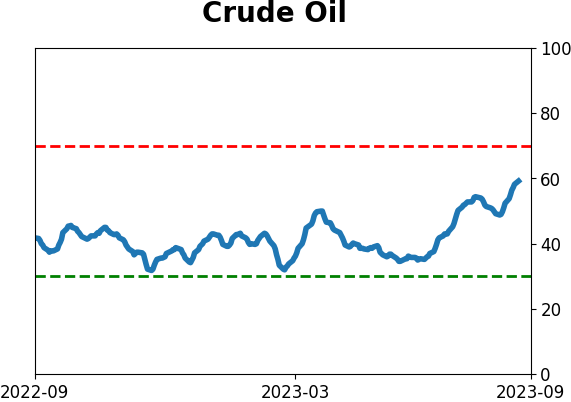
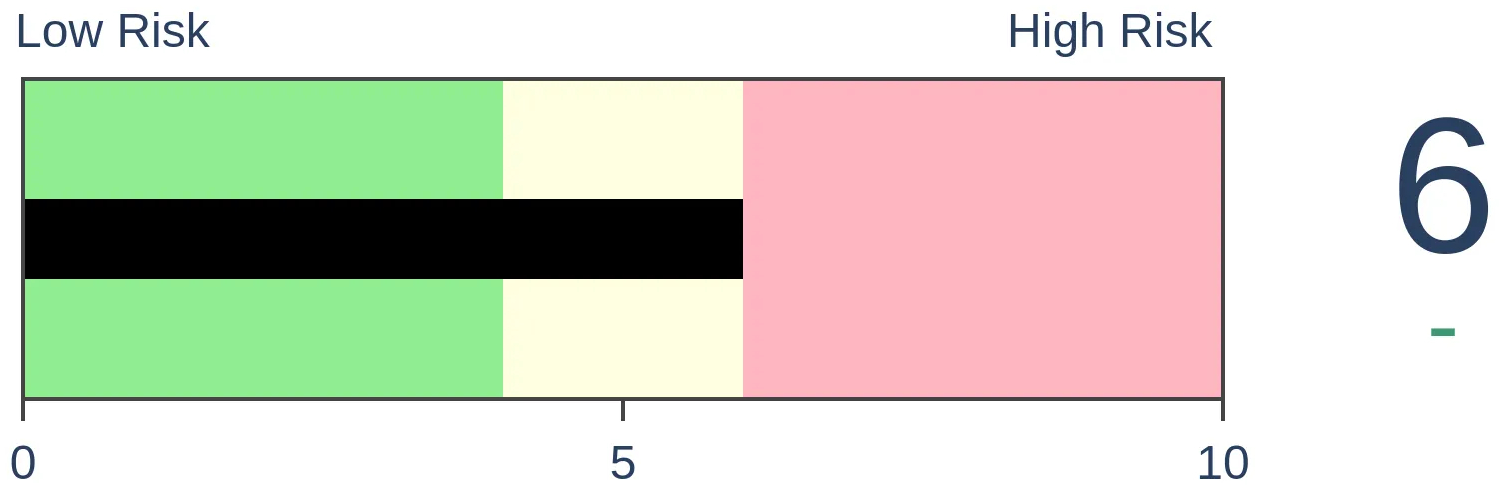
Crude Oil
|
|
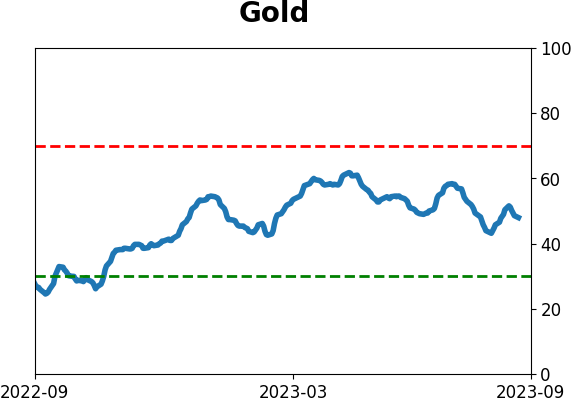
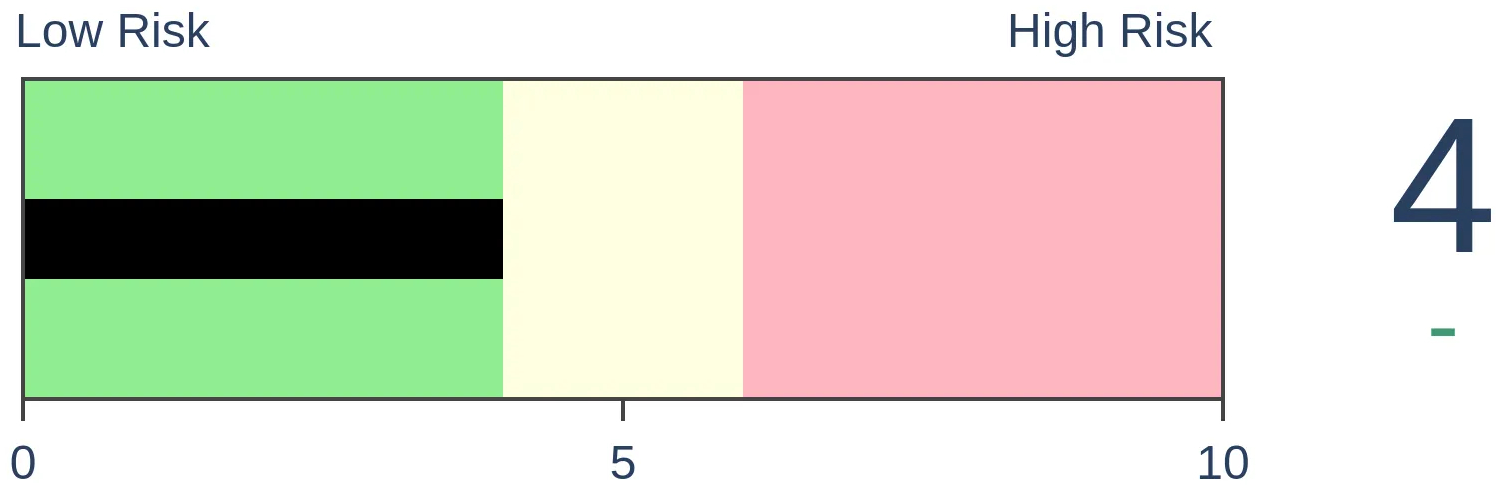
Gold
|
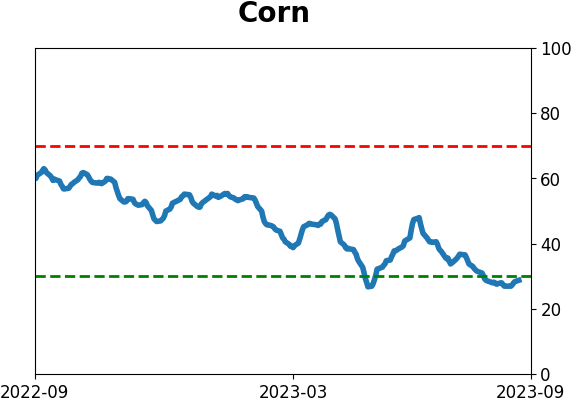
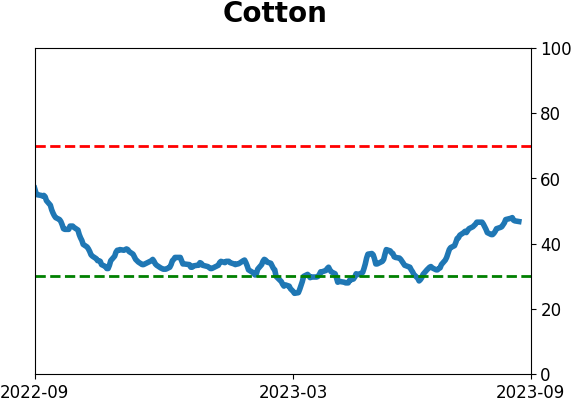
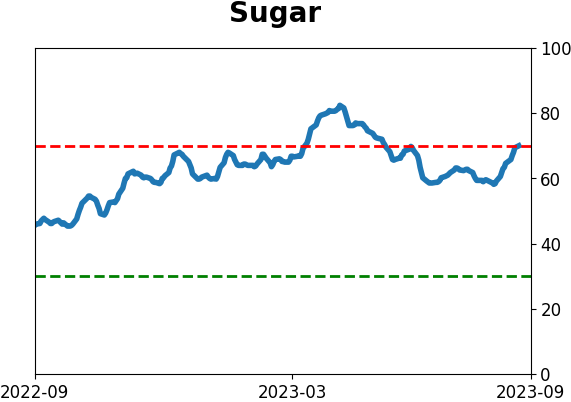
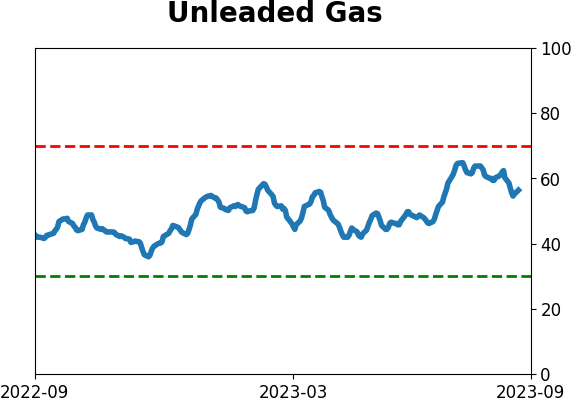
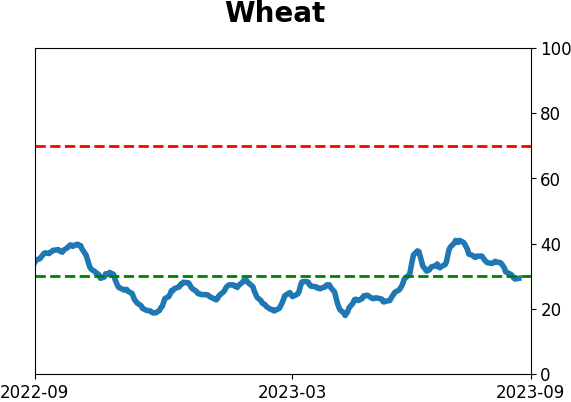
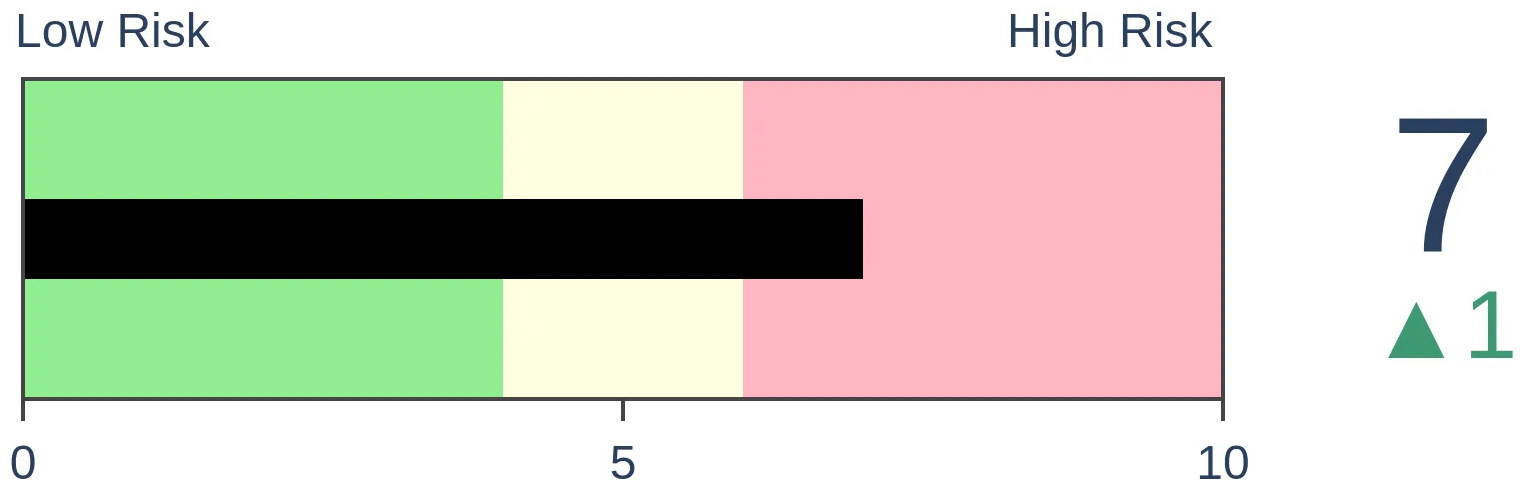
Agriculture

|
|
Research
By Jason Goepfert
BOTTOM LINE
The U.S. dollar rallied for 8 straight weeks and has held above its 200-day moving average for more than a month after having been below it for more than six months. Similar reactions tended to lead to modest further gains in the dollar, and other assets struggled to gain over the following month.
FORECAST / TIMEFRAME
None
|
Key points:
- The U.S. dollar rose for 8 straight weeks and has held above its 200-day average for a month
- Similar behavior tended to lead to modest further increases in the dollar
- Other assets struggled a bit, especially over the following month
The buck has enjoyed a historic win streak
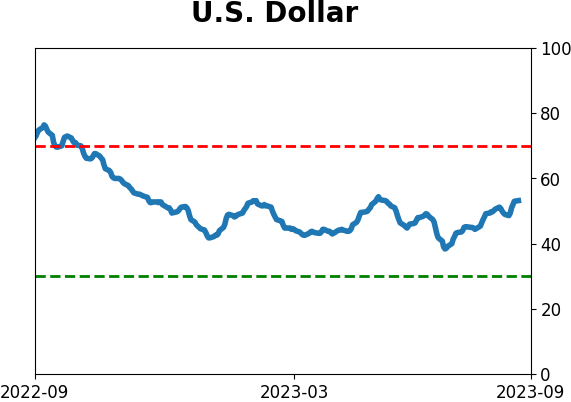
In mid-July, we looked at how optimism on the U.S. dollar was slipping after it had just suffered a week of heavy losses and a new 52-week low. Similar conditions tended to show even more losses in the weeks and months ahead.
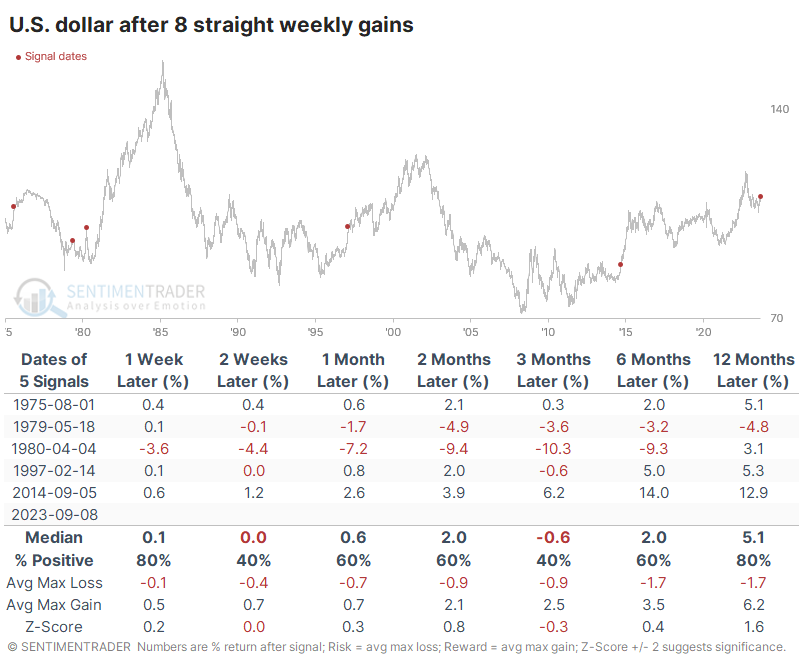
Man, was that ever wrong. It pretty much marked the bottom for the decline. Since then, the buck has gained for eight consecutive weeks, one of its best runs in history.
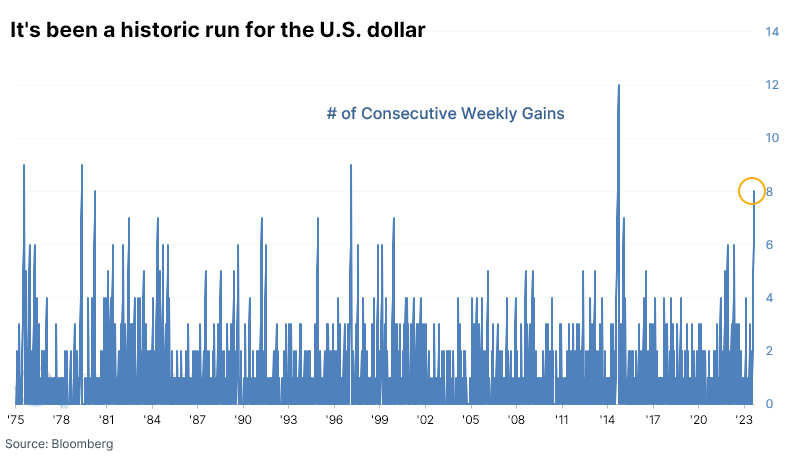
The dollar's reaction after similar bouts of momentum was mixed. The sample size is necessarily tiny, so for what it's worth, the dollar continued to consistently gain in the months ahead twice while faltering three times. Not much to see there.
A month in a new trend
As part of the streak of weekly gains, the dollar has climbed back above its long-term 200-day moving average and is on the cusp of staying there for a month after spending more than six months below average. The last time it did this was in the spring of 2018, which marked a long-term change in trend. It was close to doing this in 2021 before another historic run but didn't qualify for the study because of a brief false breakout earlier in the year.
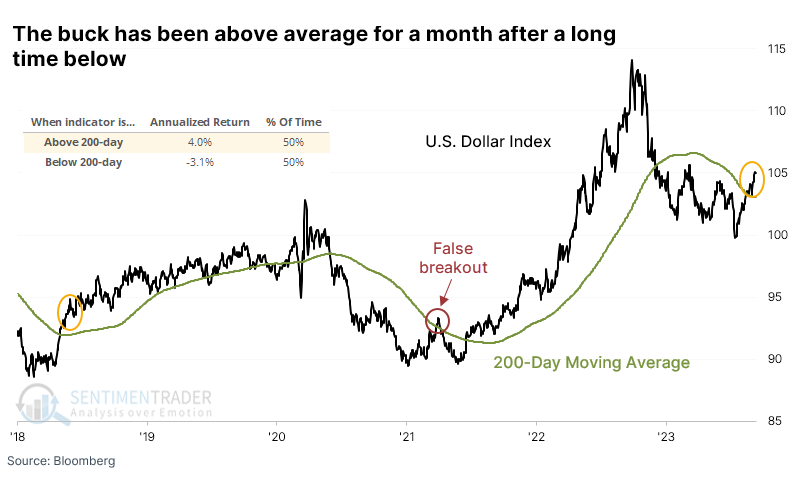
Over the past 50 years, the dollar has spent almost half its trading days above the 200-day average and half below. When it has been above its average, the dollar's next-day performance returned an annualized +4.0% versus -3.1% when below average. This is indicative of a market that shows persistent trends.
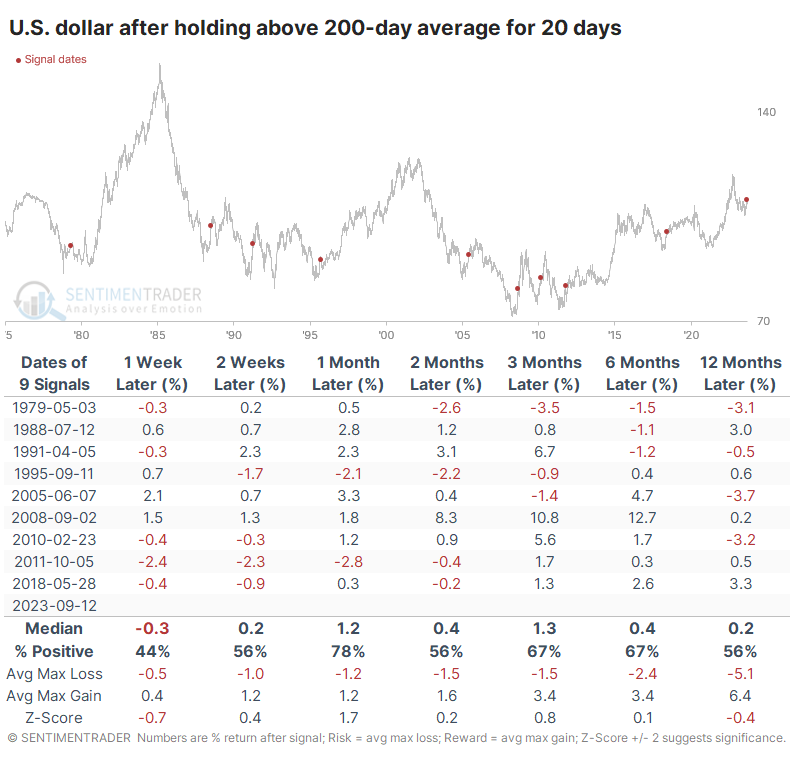
After other sustained breakouts above its average for the first time in six months, the dollar tended to keep rising. Its best performance was over the following month, when it gained 78% of the time, with a median return well above random. It suffered two losses over that time frame, and both were reversed in the months after. We're assuming here that the dollar doesn't suffer a historic drop over the next couple of sessions.
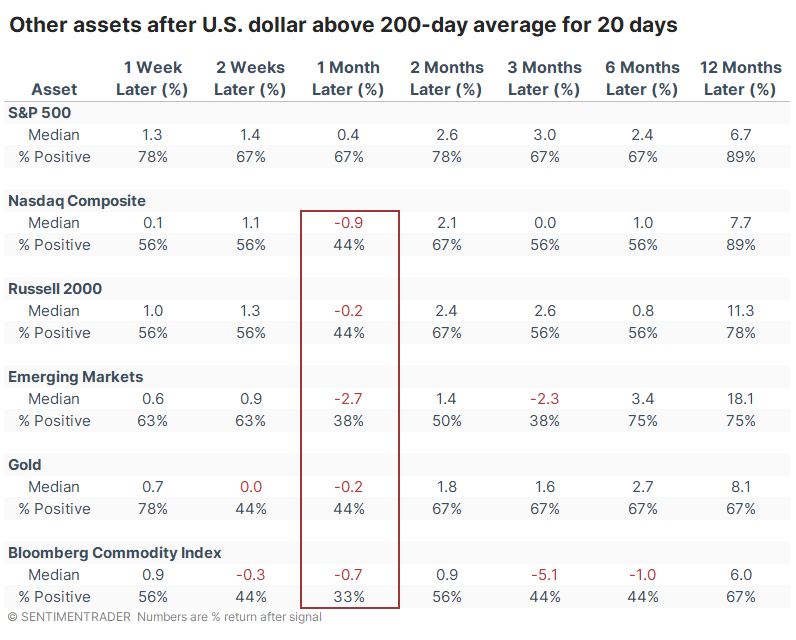
Other assets had some difficulty during that next month, except for the S&P 500. Other stock indexes and commodities didn't react all that well to a continually rising dollar. The potential negative impact tended to be focused on that time frame, though, and most showed decent medium- to long-term returns, other than emerging markets and a broad basket of commodities.
What the research tells us...
Movements in the dollar tend to get a lot of attention, though their impacts on most markets tend to be overstated. The dollar has a clear and significant impact on certain assets like emerging markets and broad commodities, but it's less clear regarding domestic stocks and - often - even gold. The buck reversed course in historic fashion after a horrid drop in July, and its momentum has been impressive. The currency tends to go on protracted runs after long-term trend changes, and initial signs are that it's in the midst of such a thing.
Indicators at Extremes
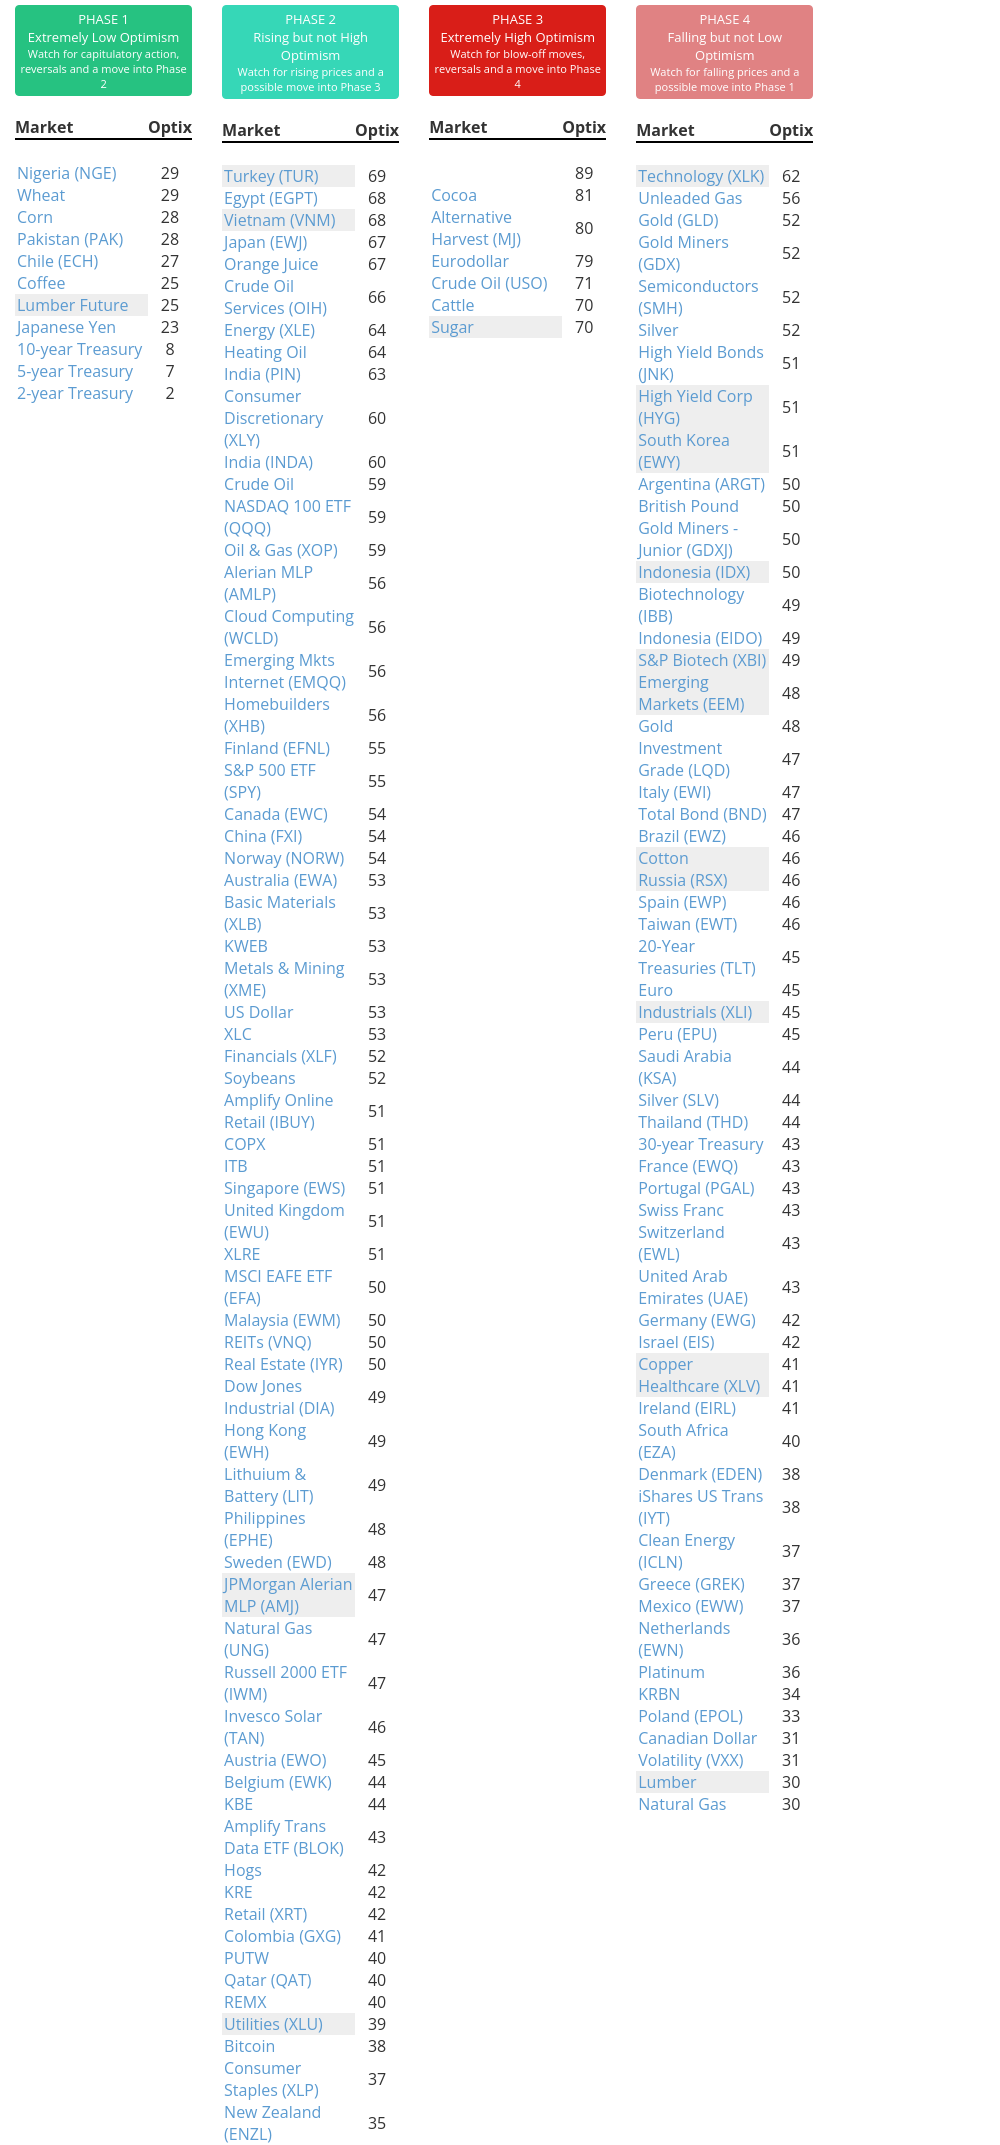
Phase Table
Ranks
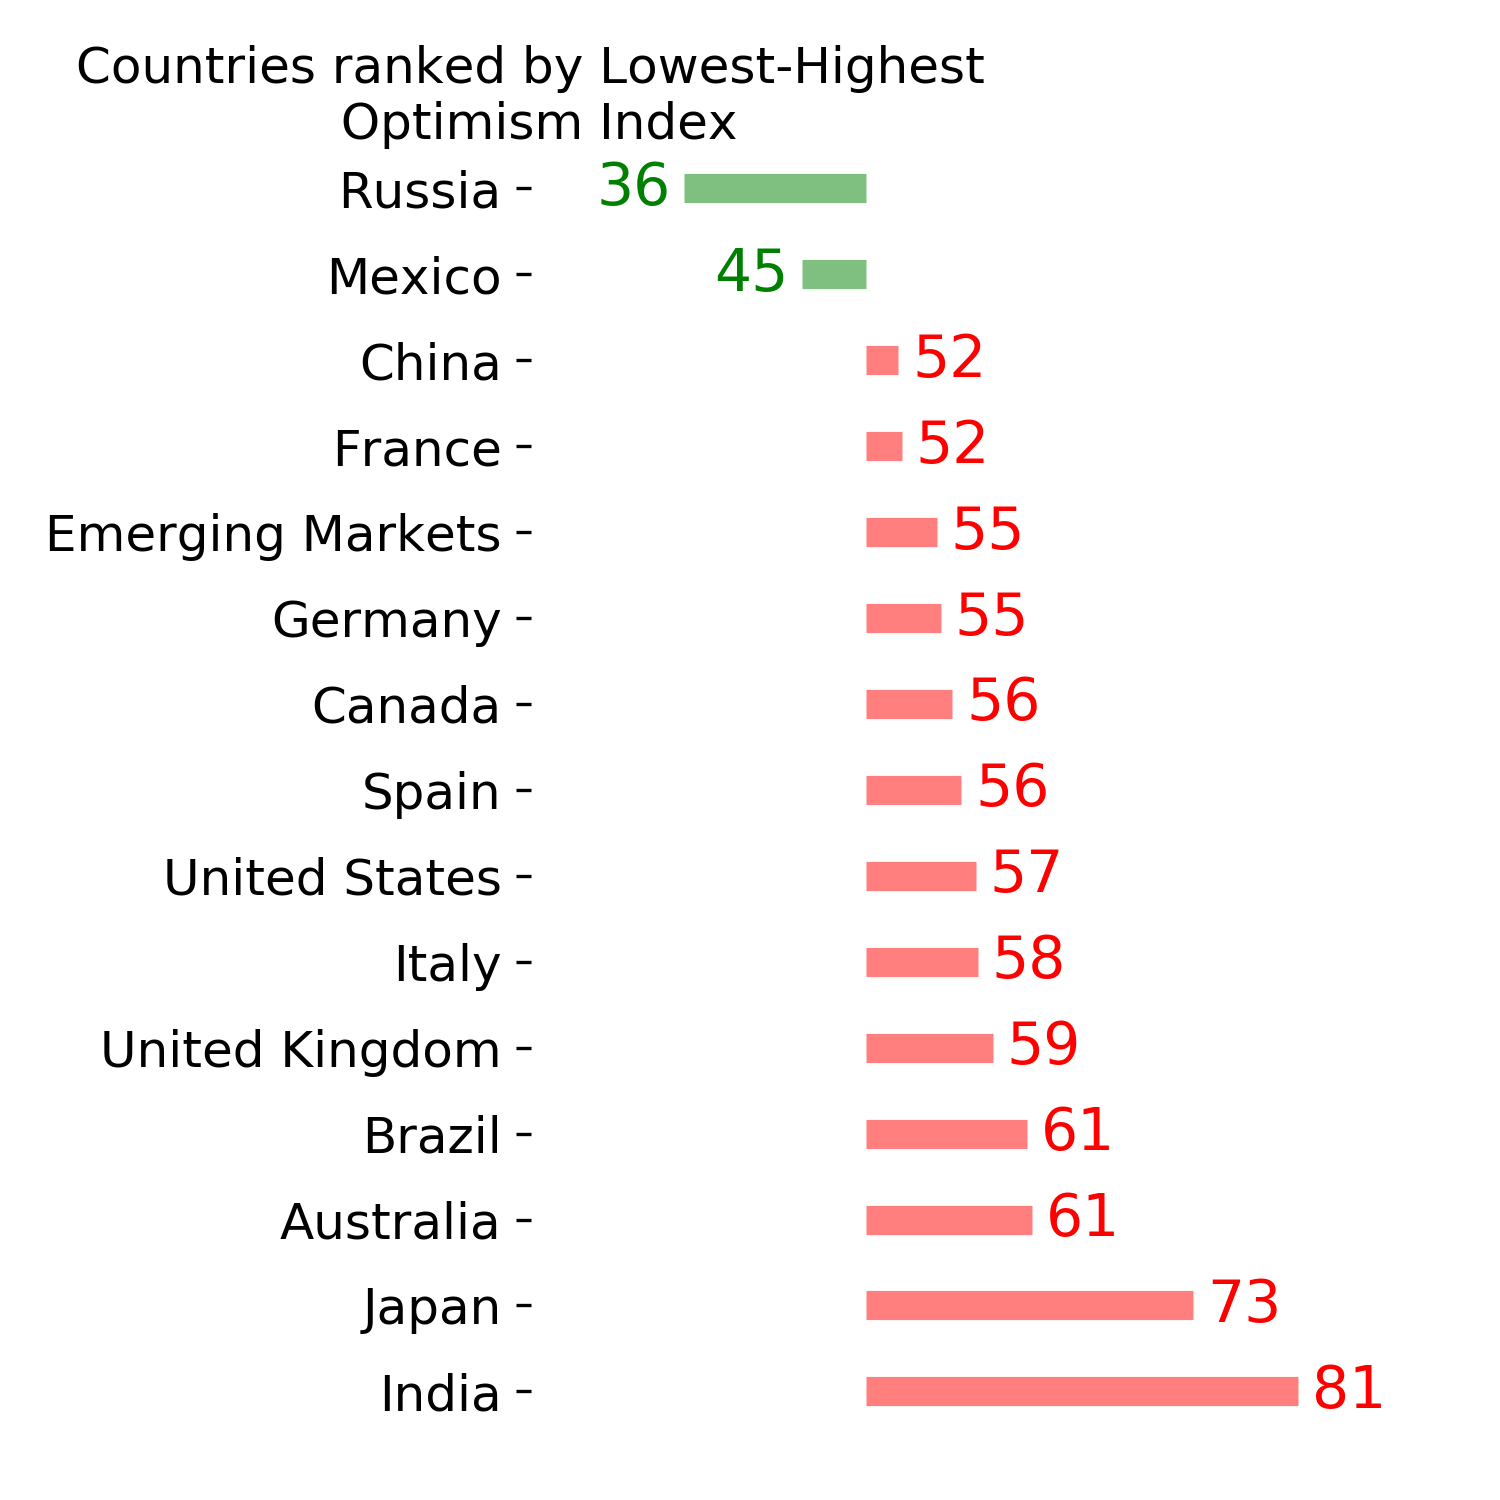
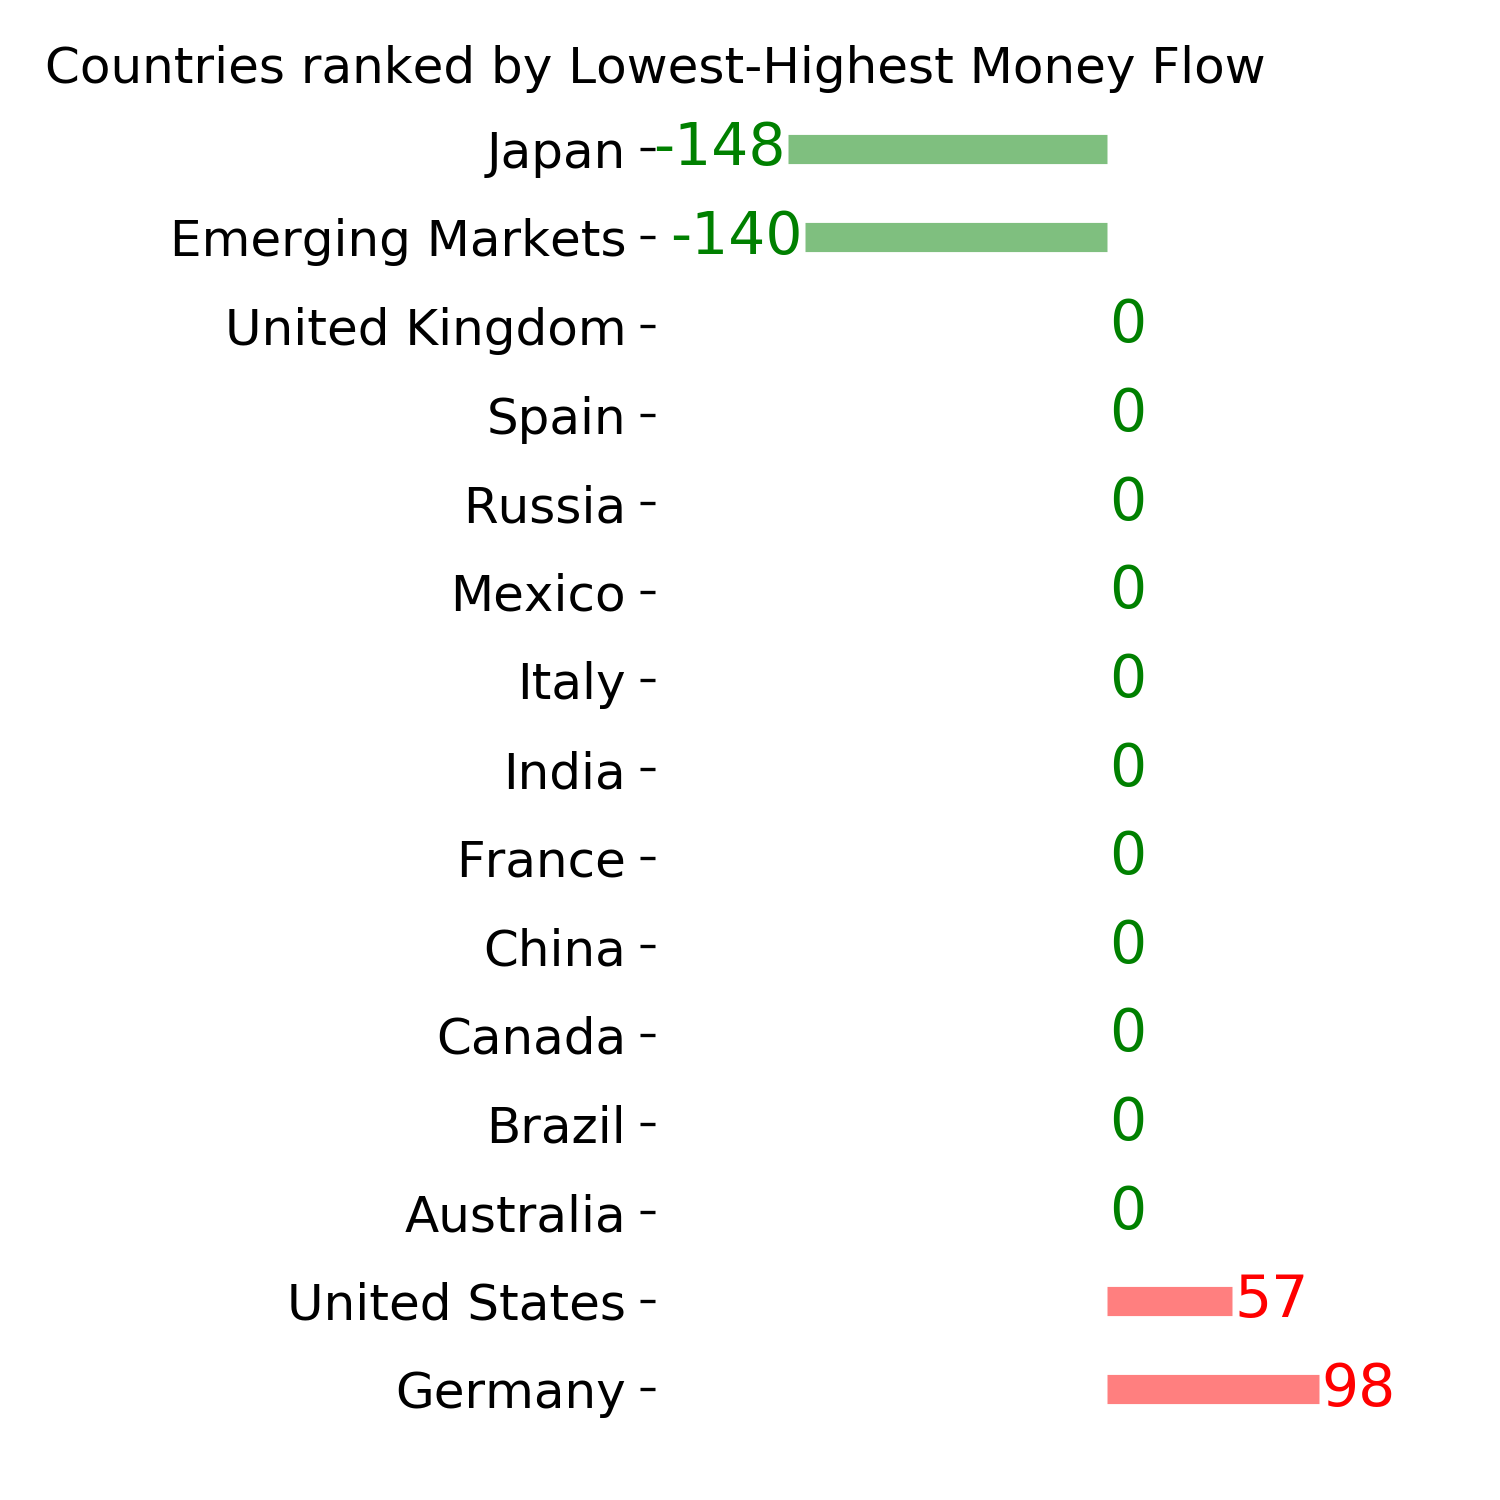
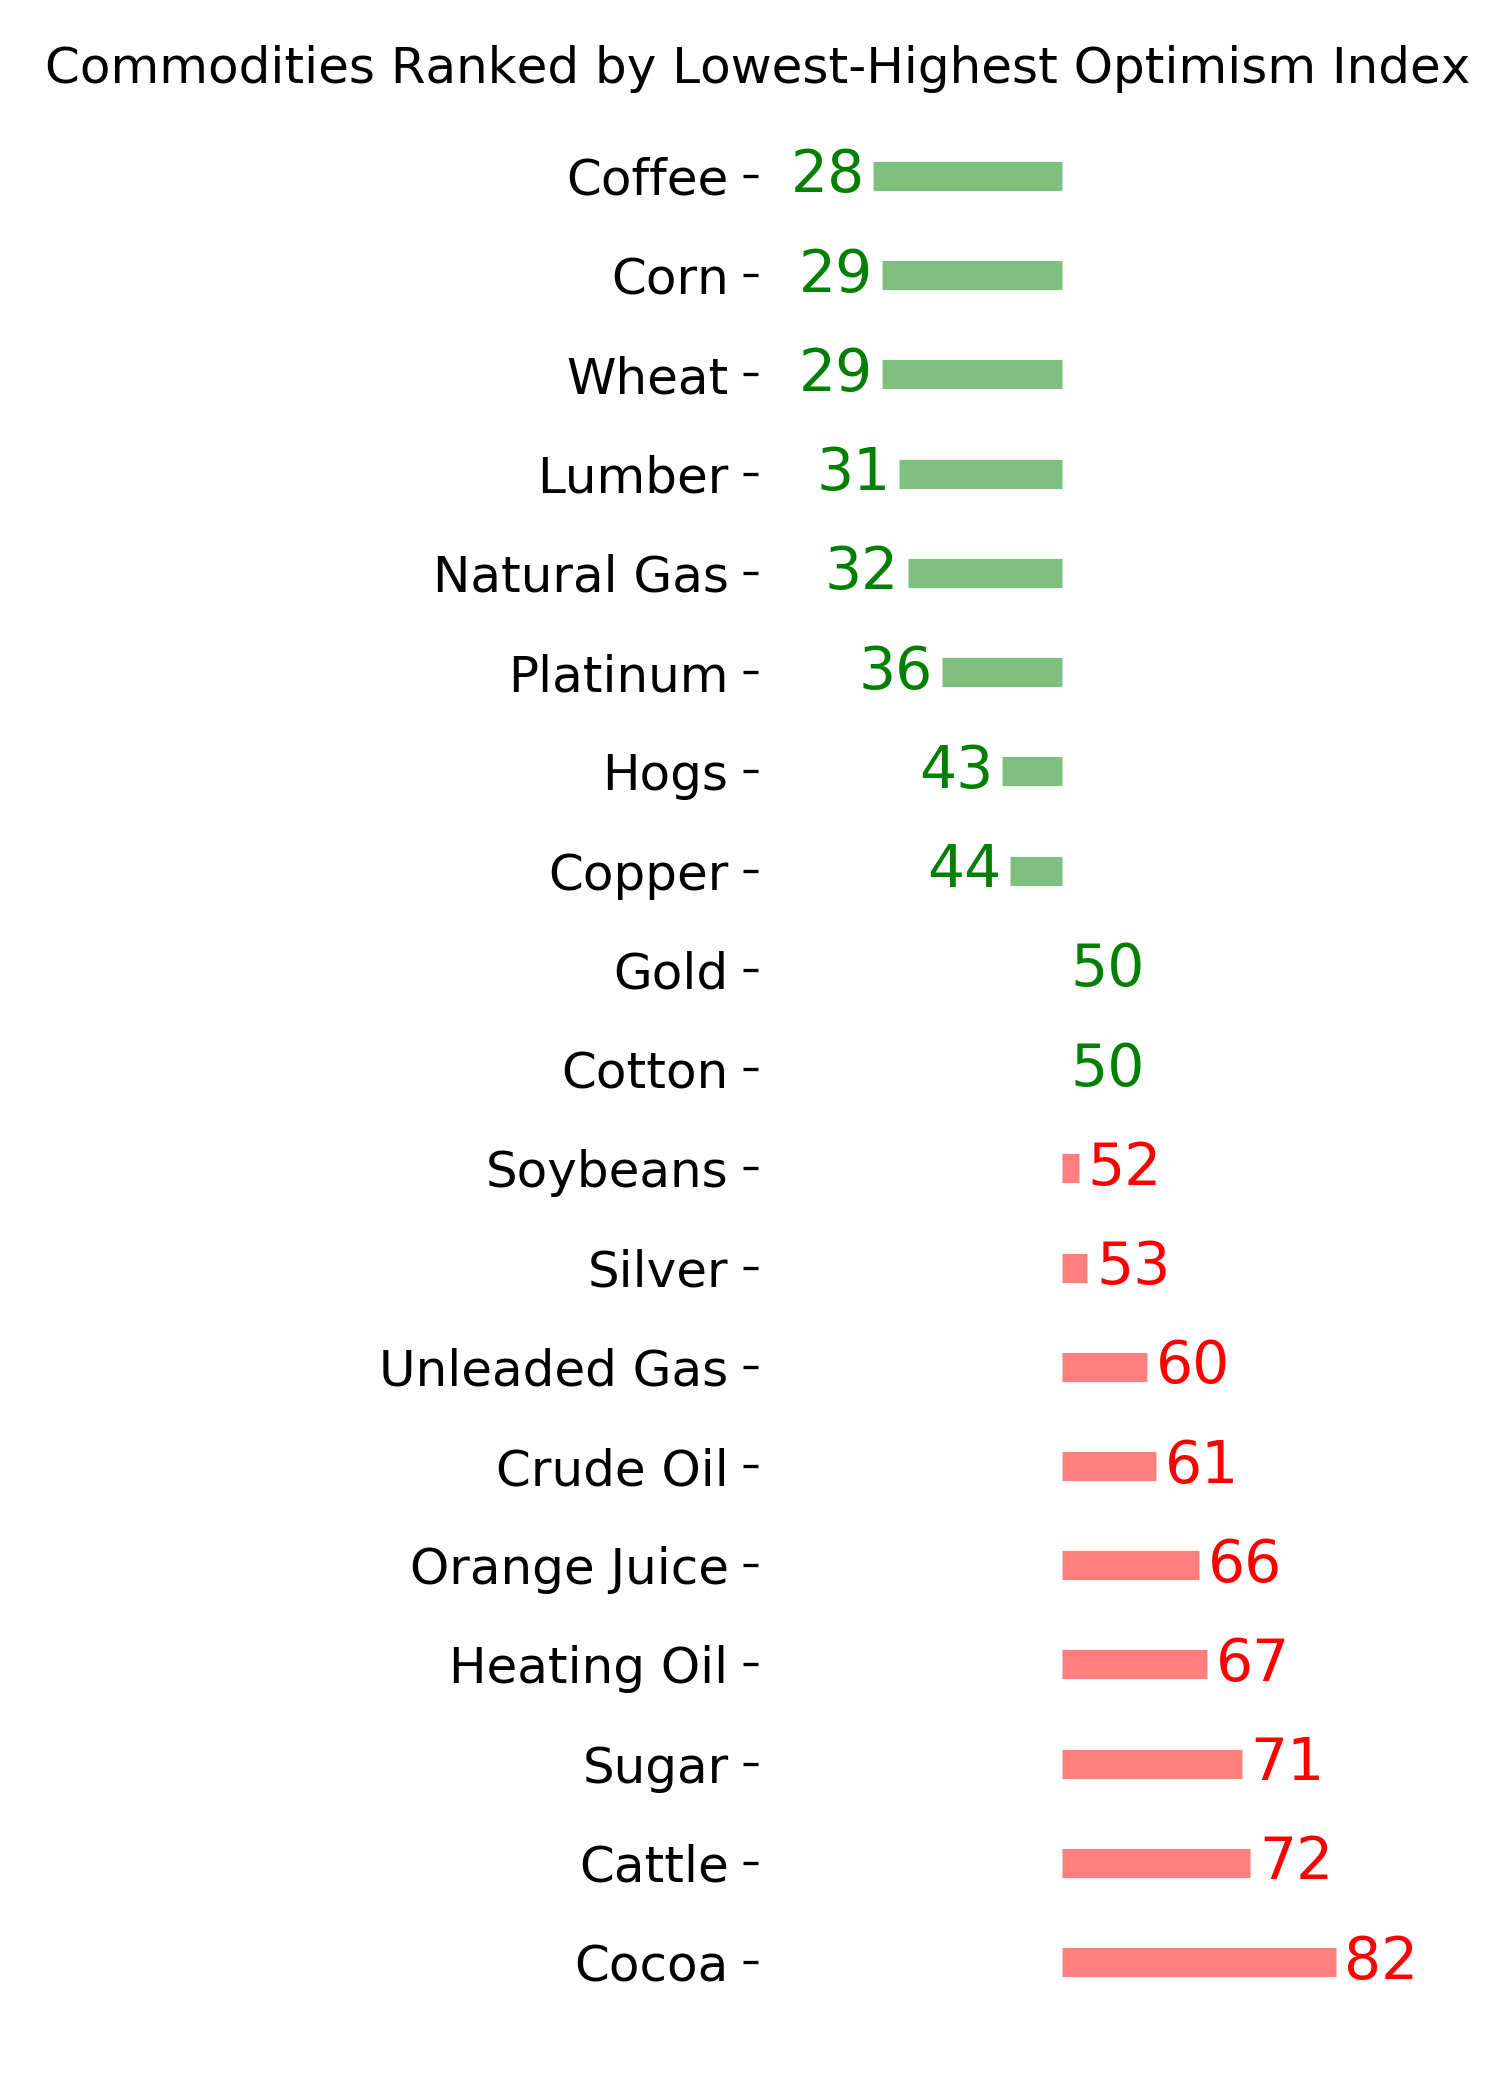
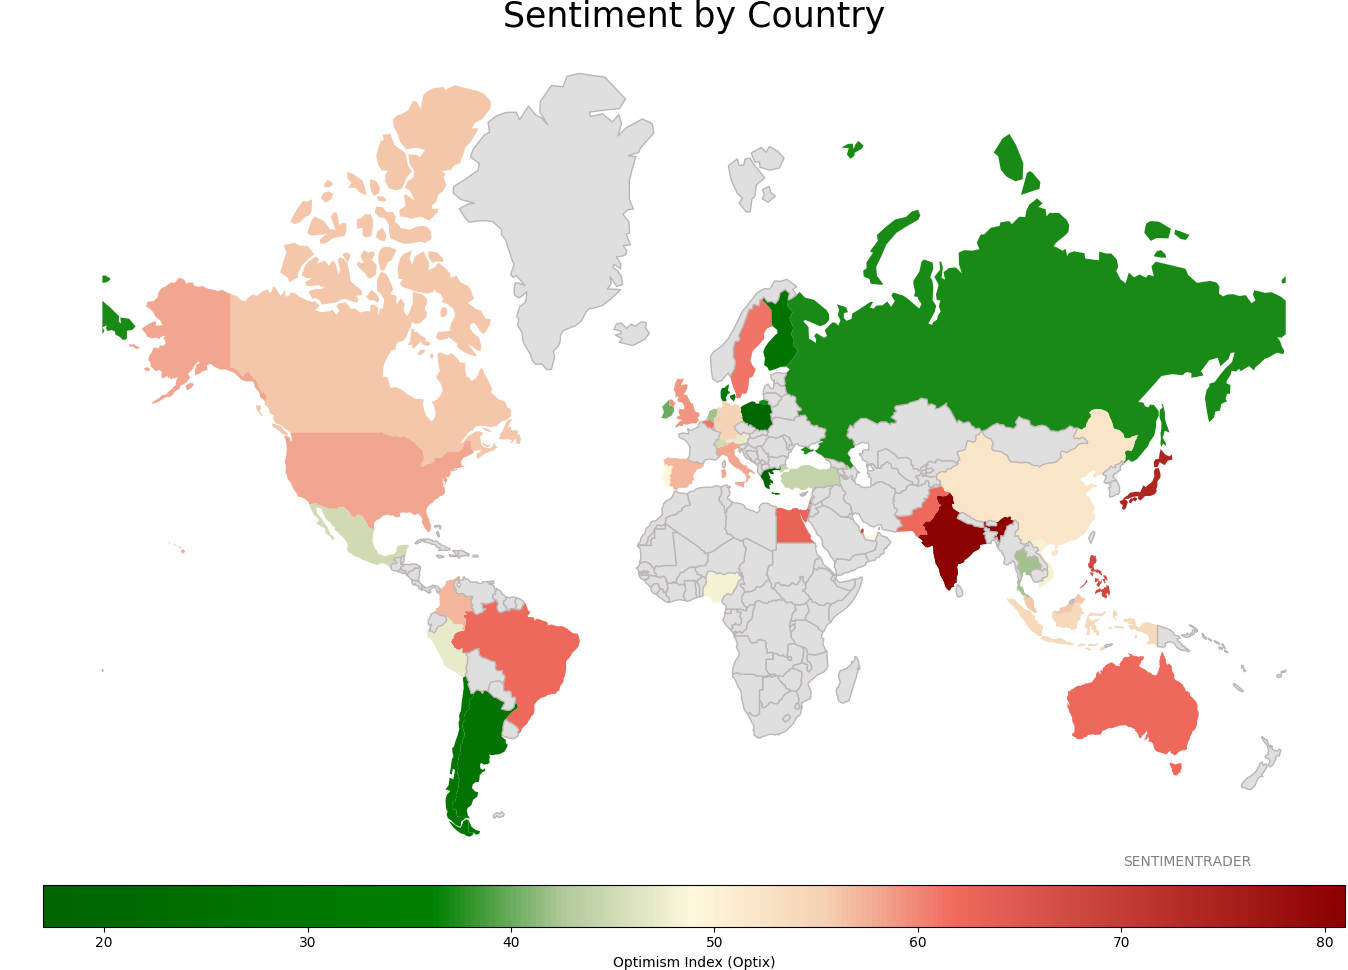
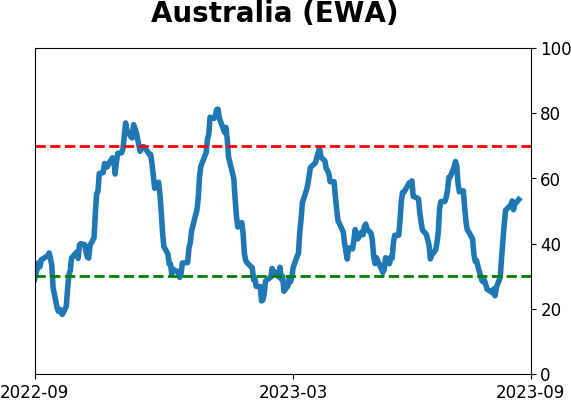
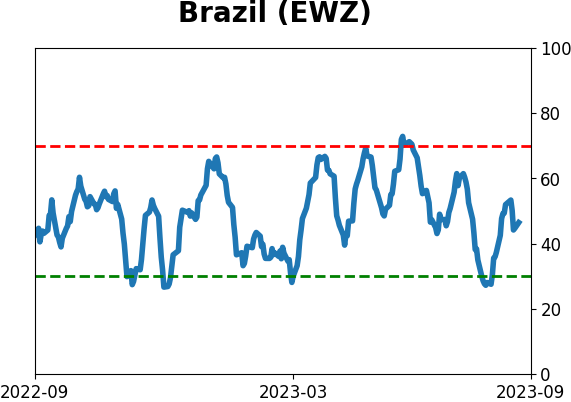
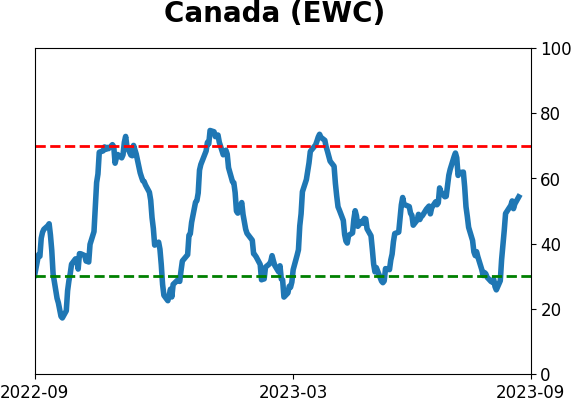
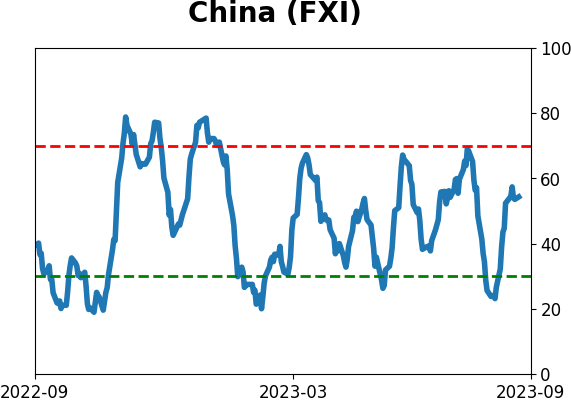
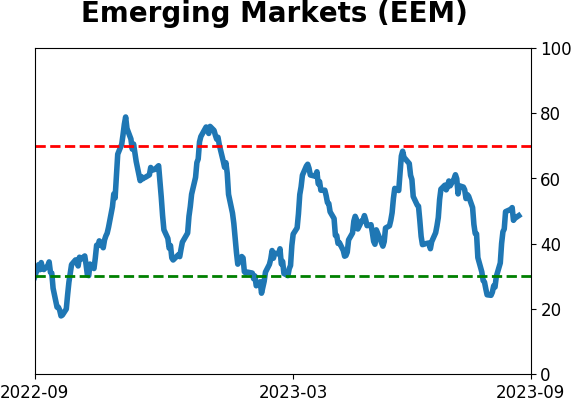
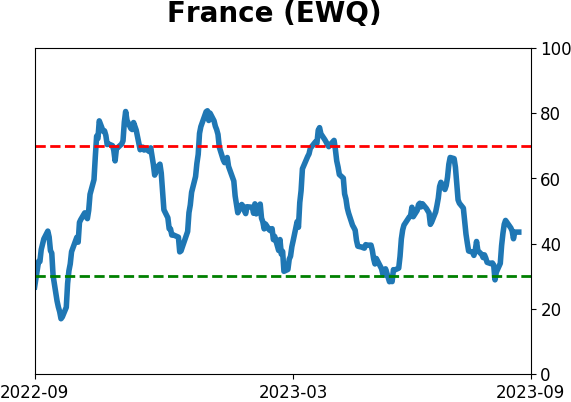
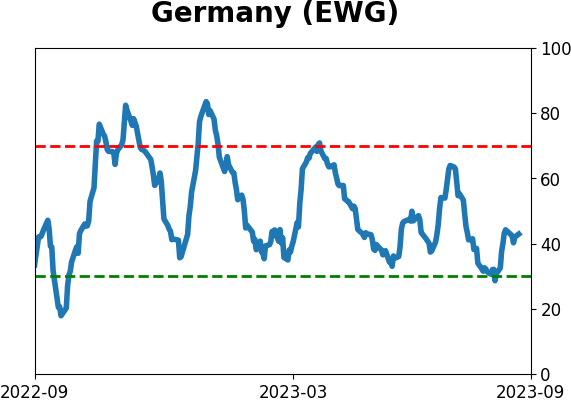
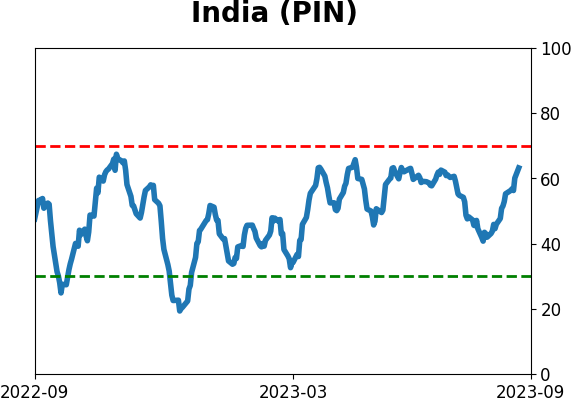
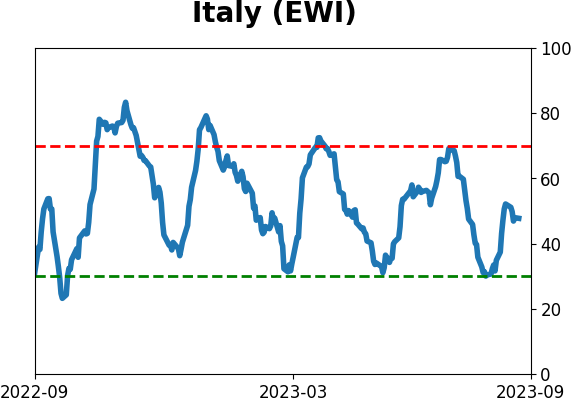
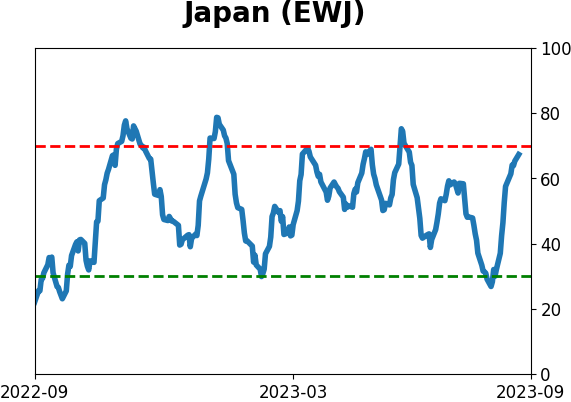
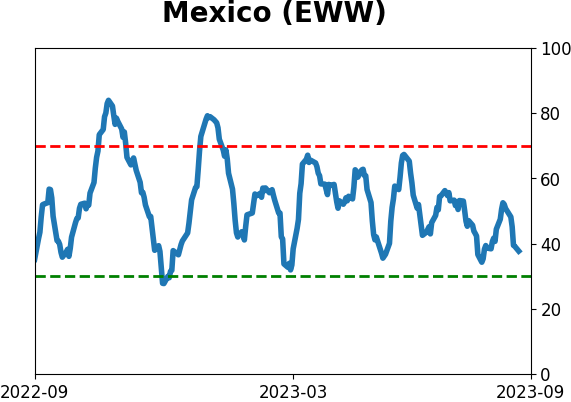
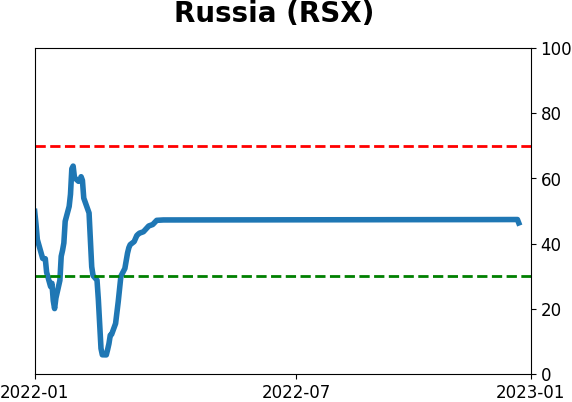
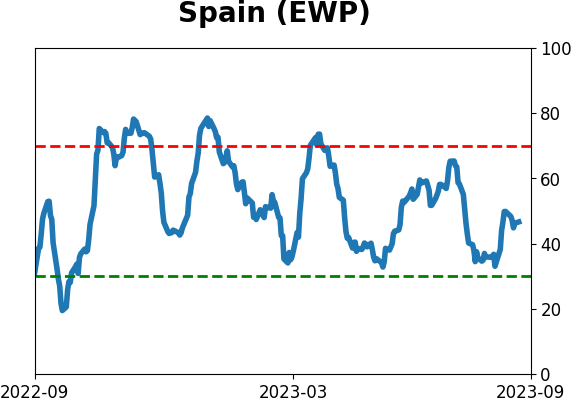
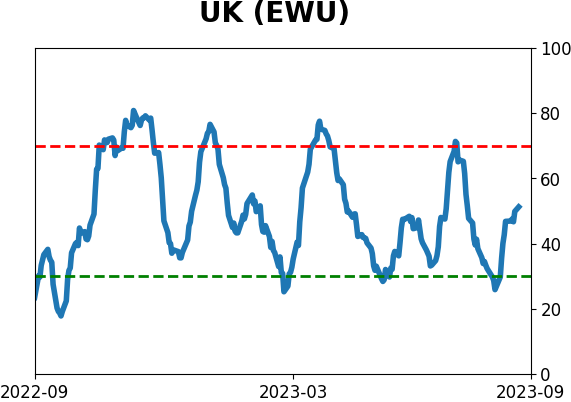
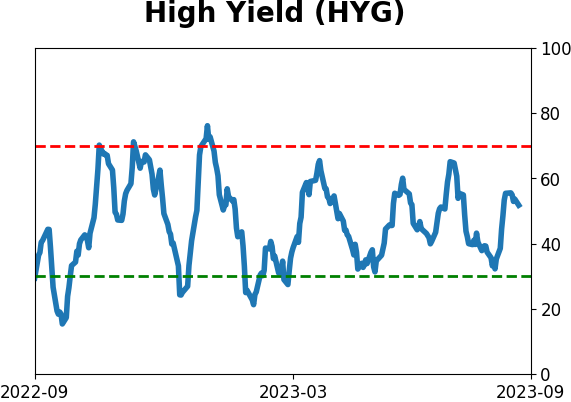
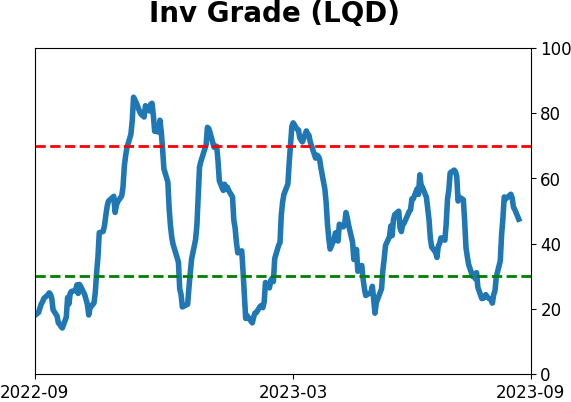
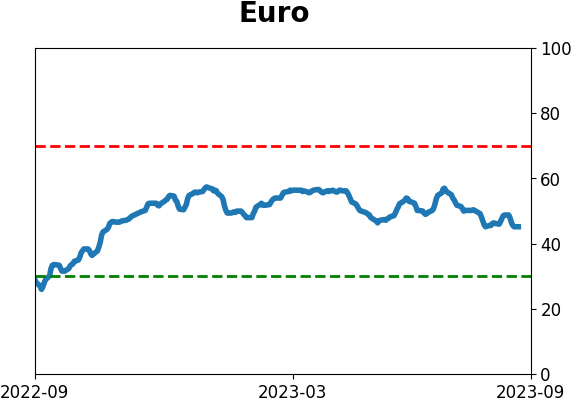
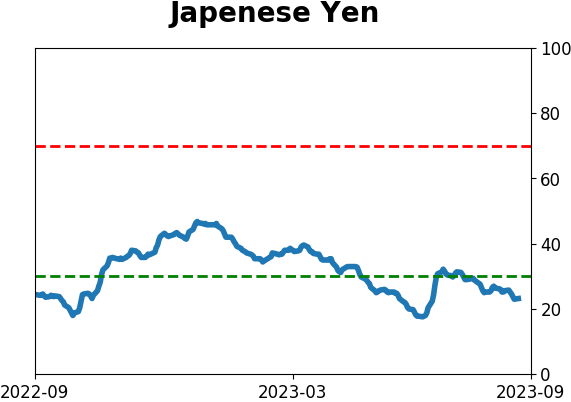
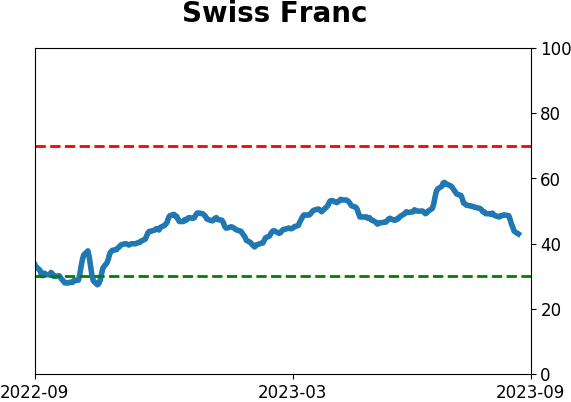
Sentiment Around The World
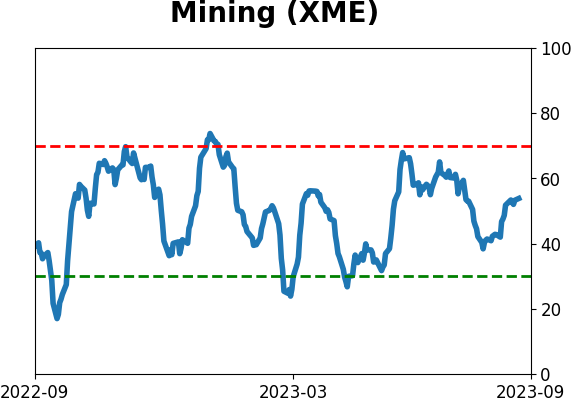
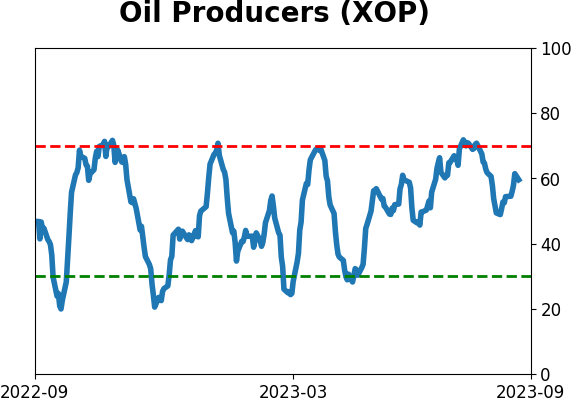
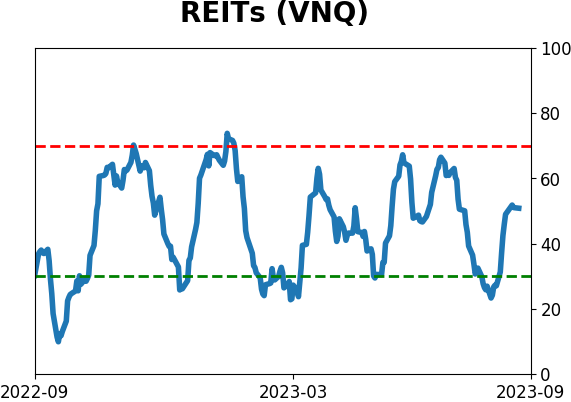
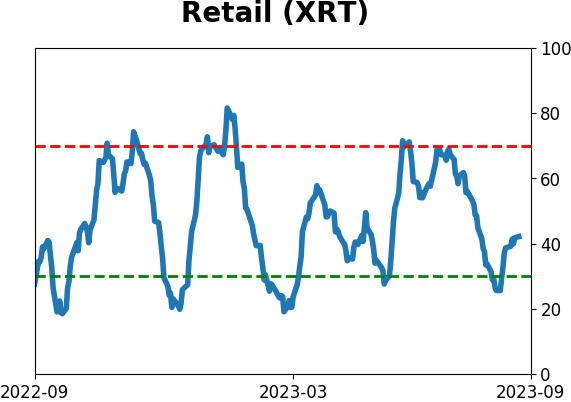
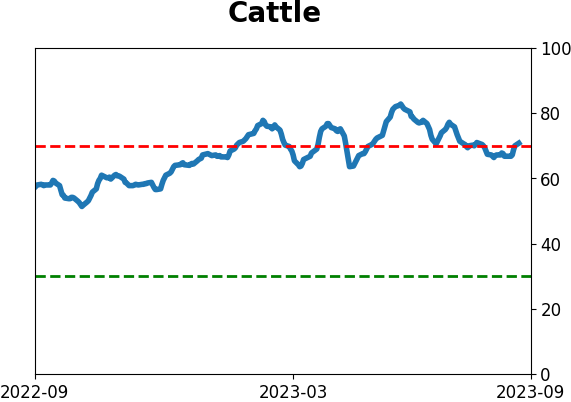
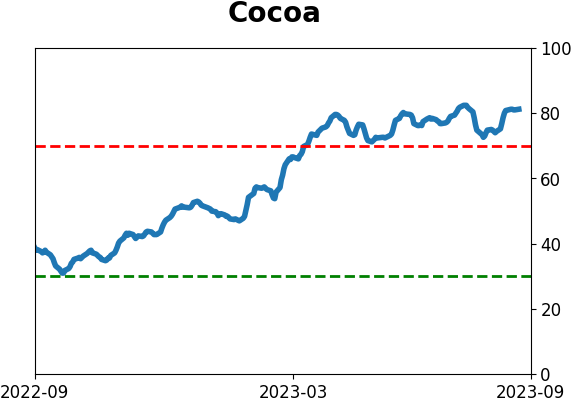
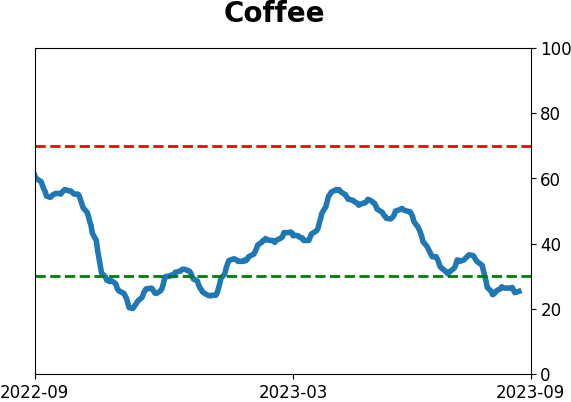
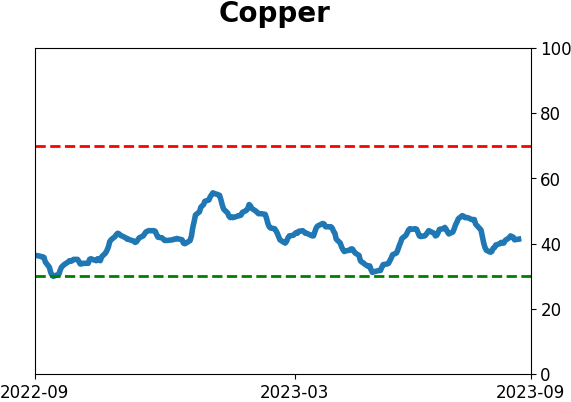
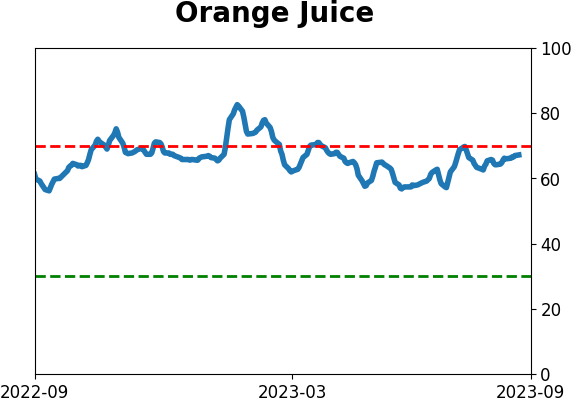
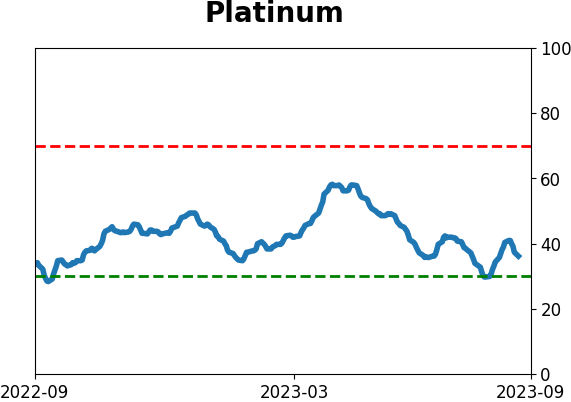
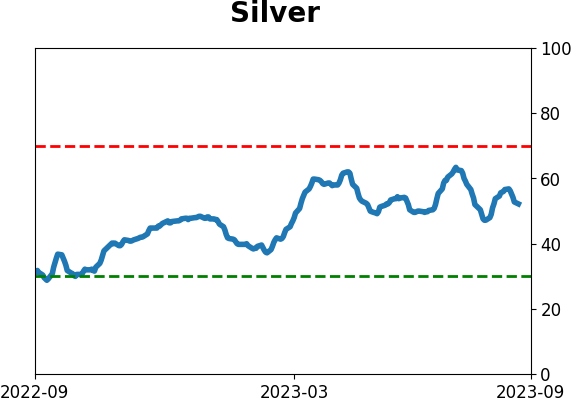
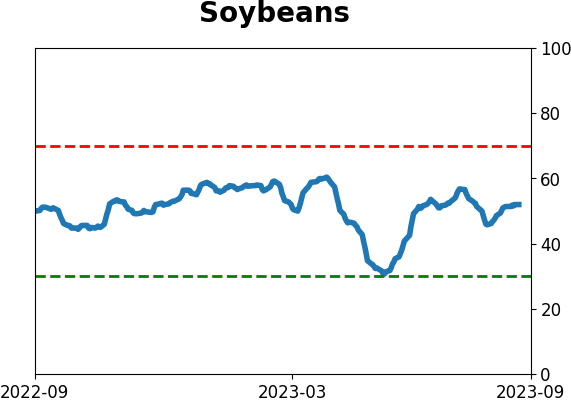
Optimism Index Thumbnails
|
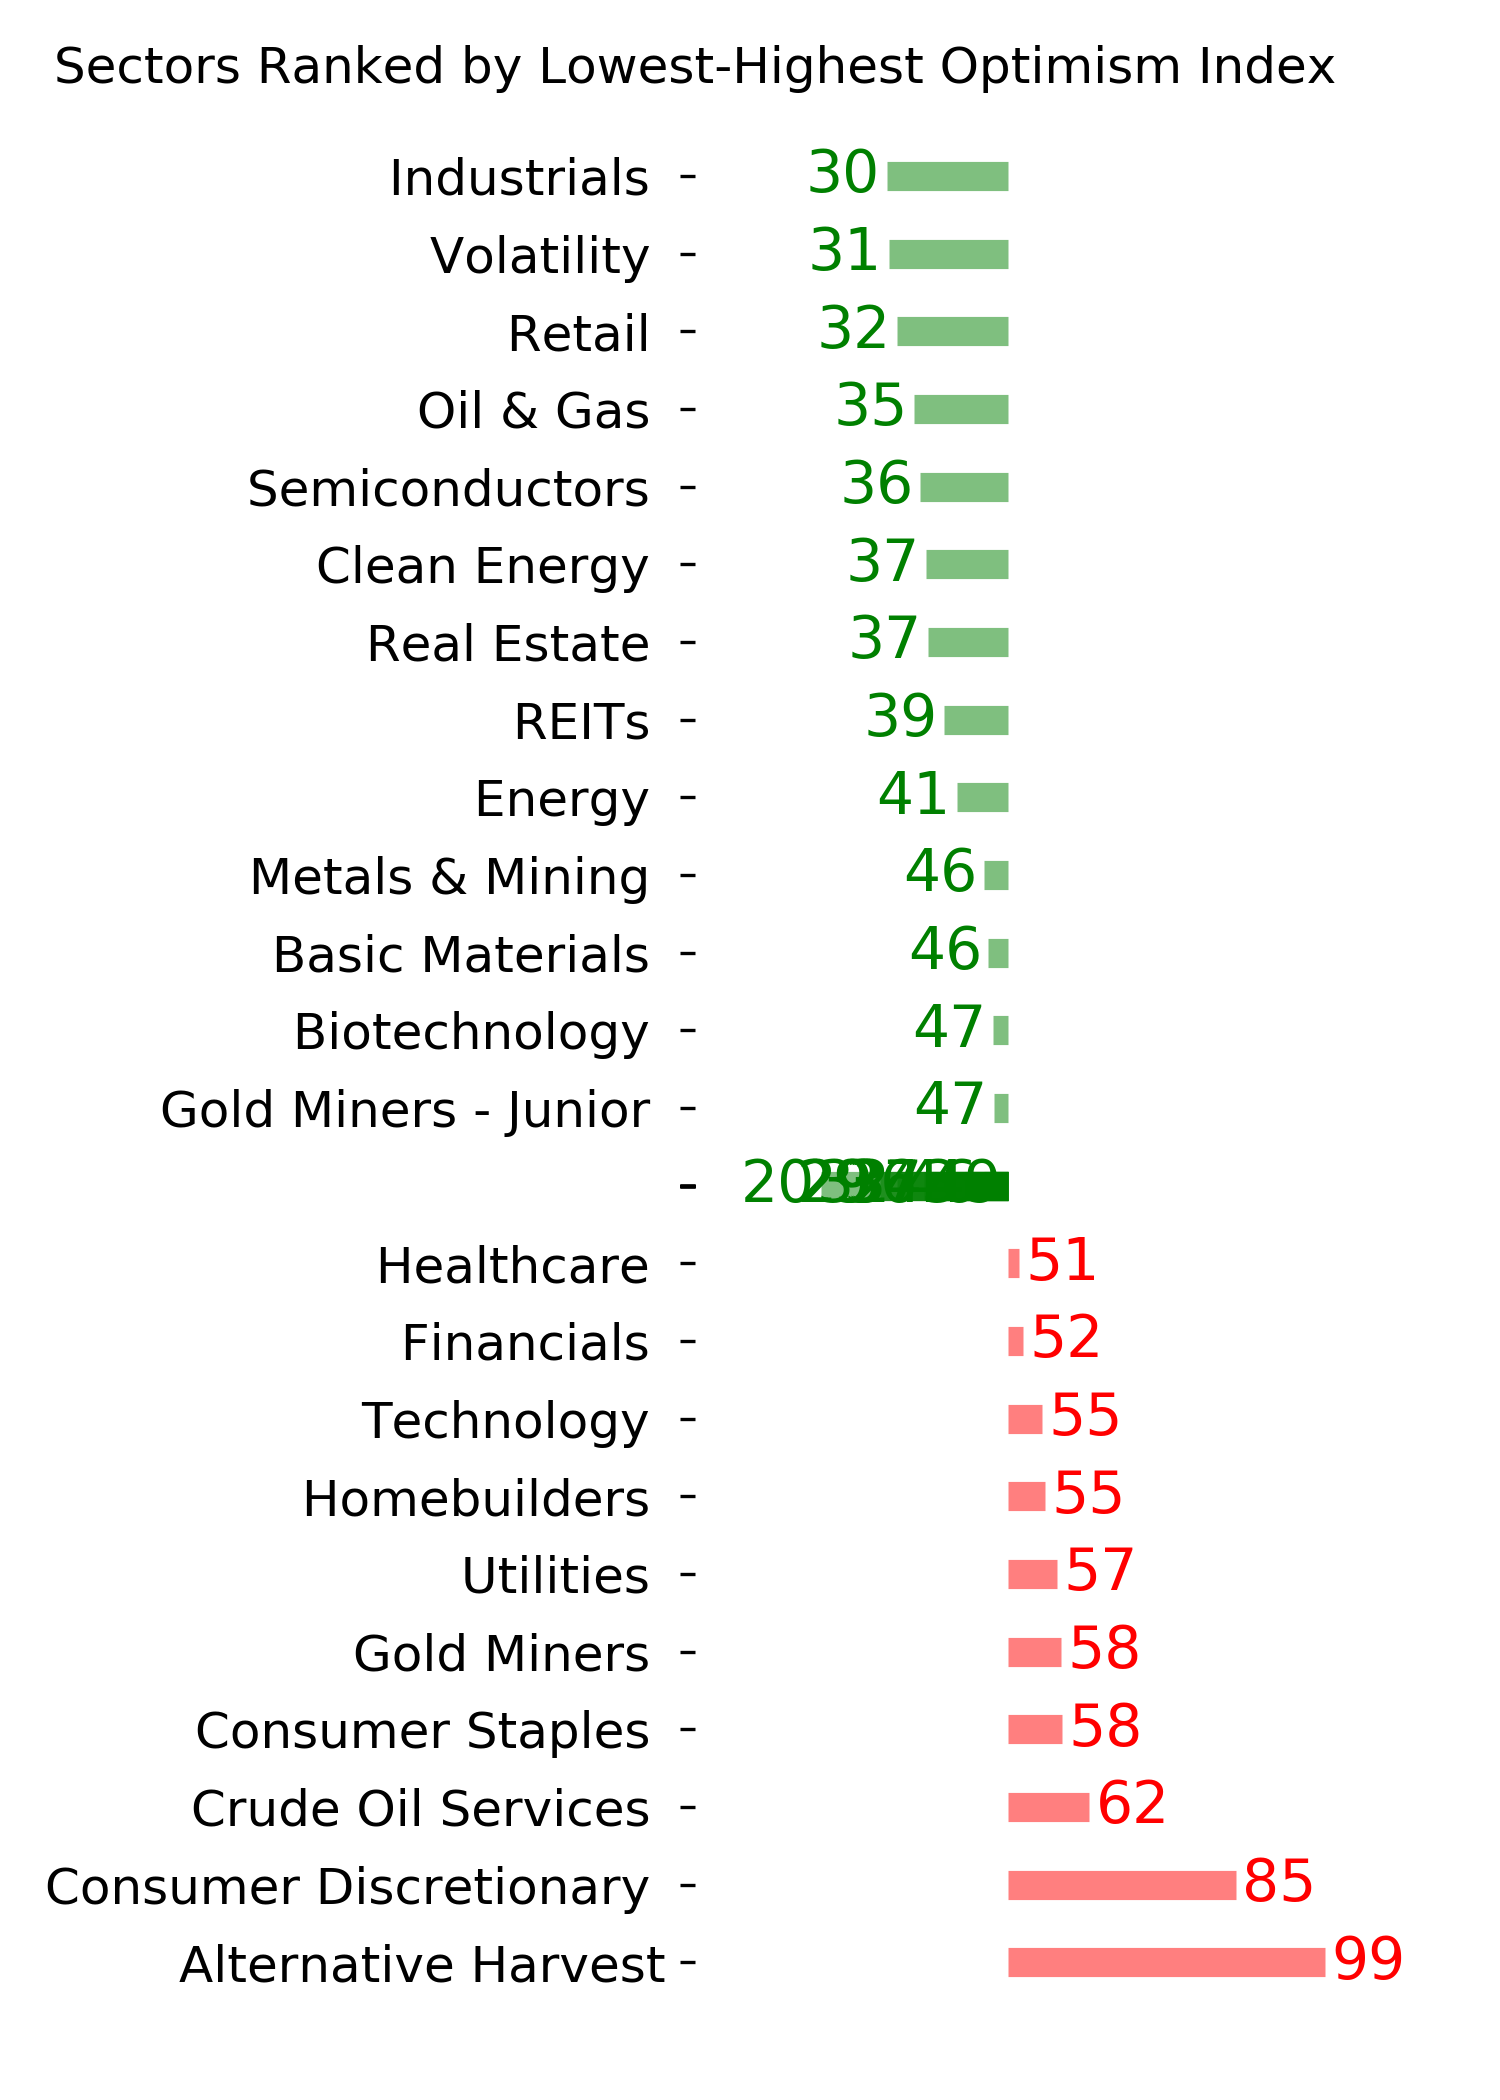
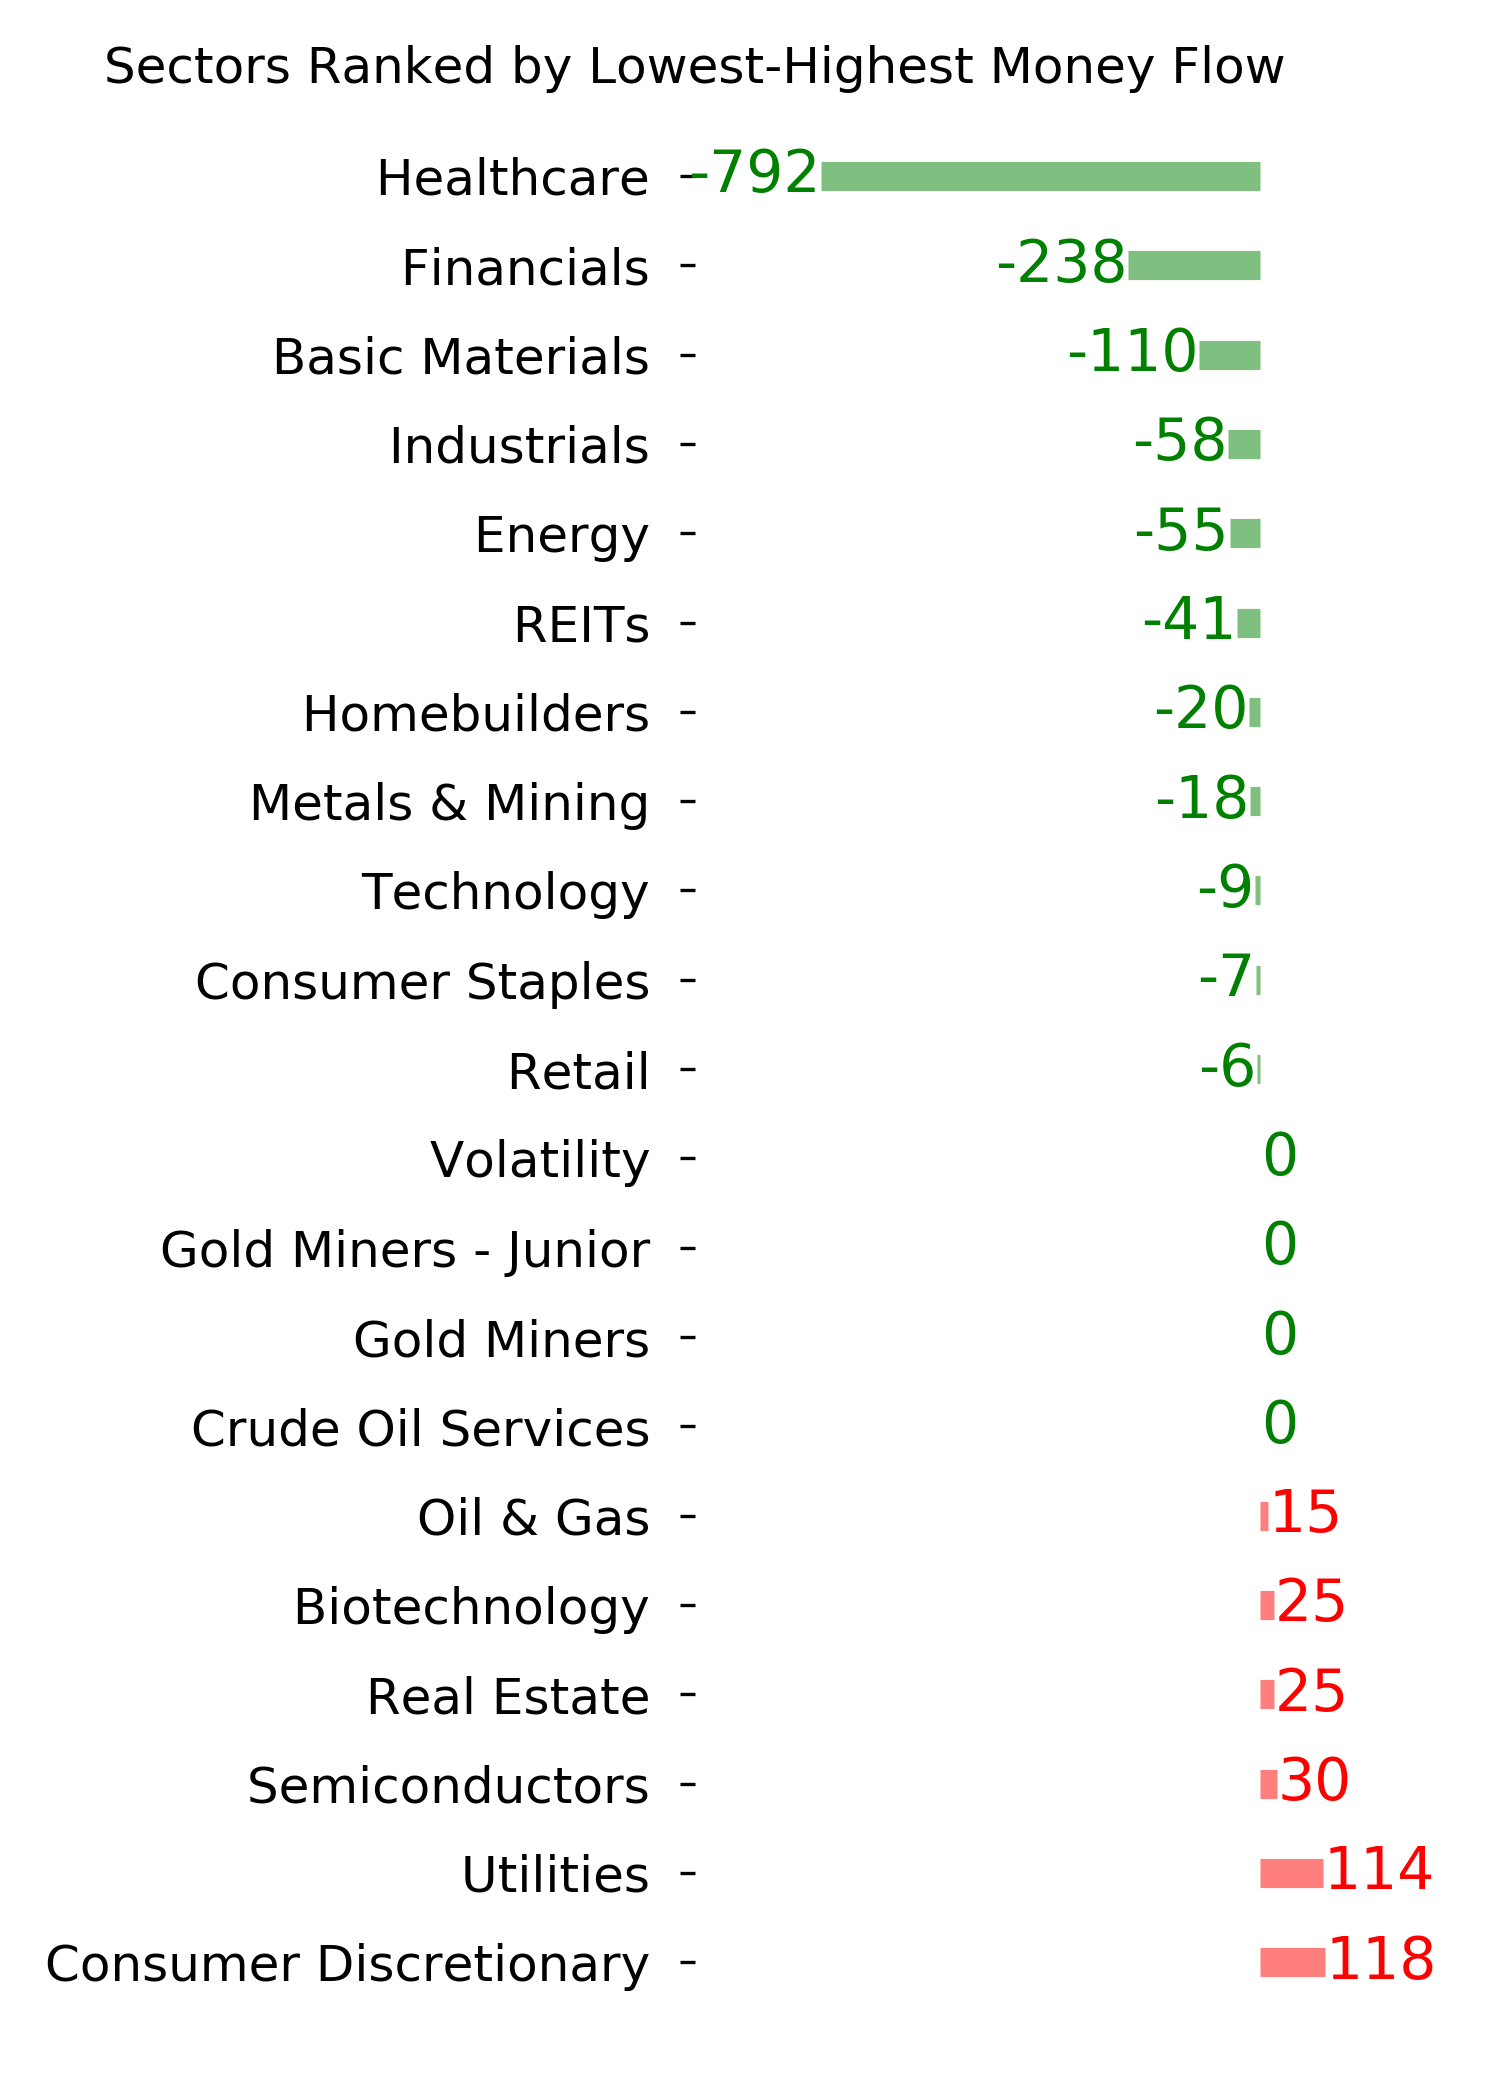
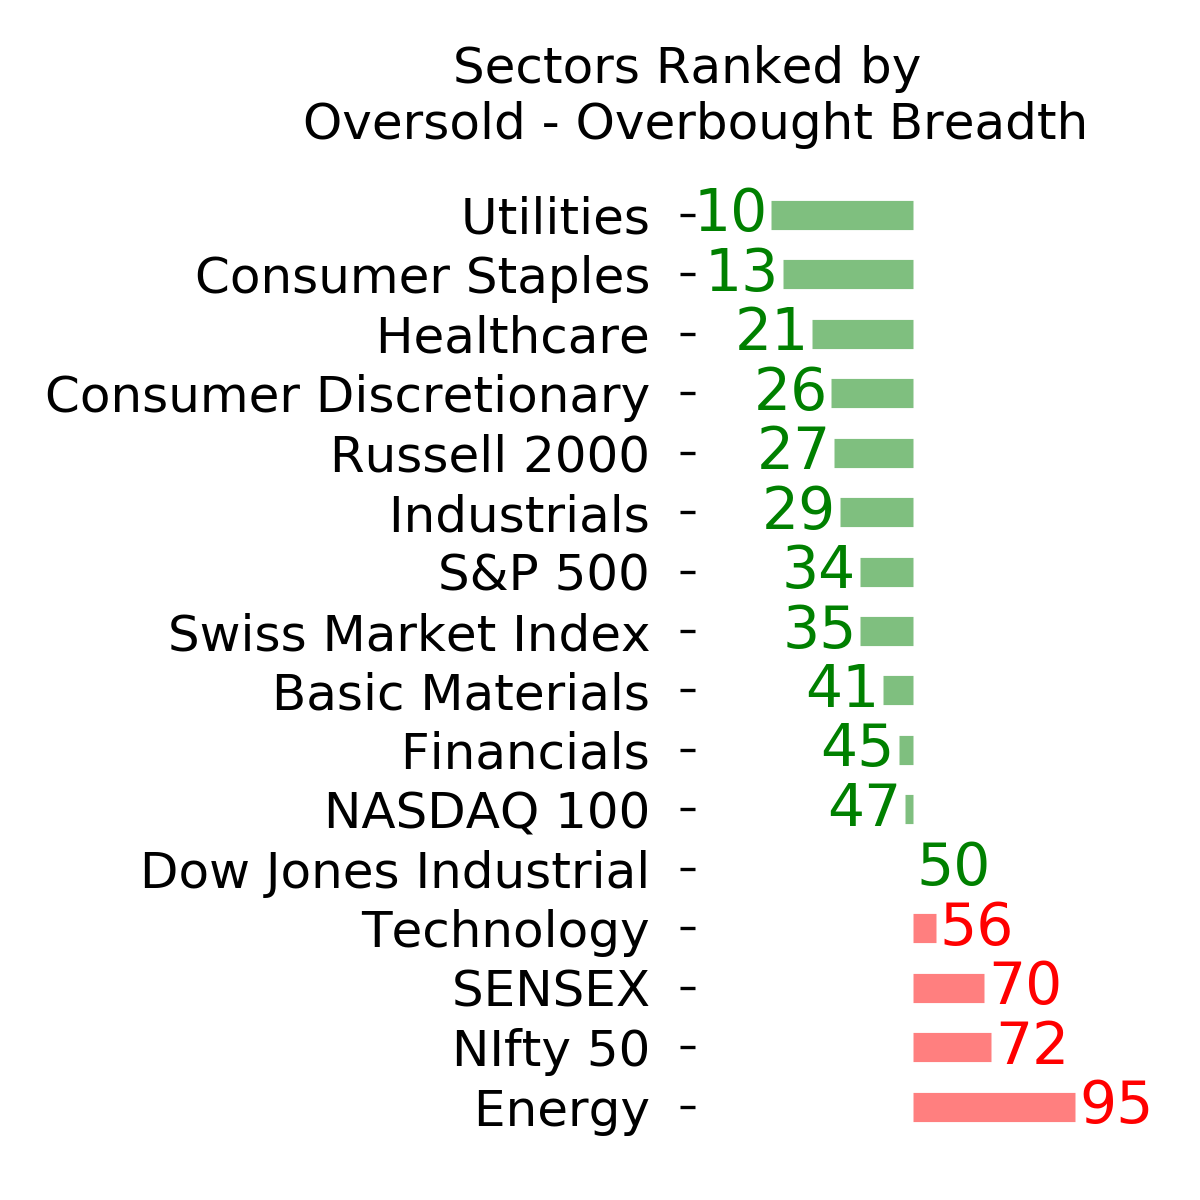
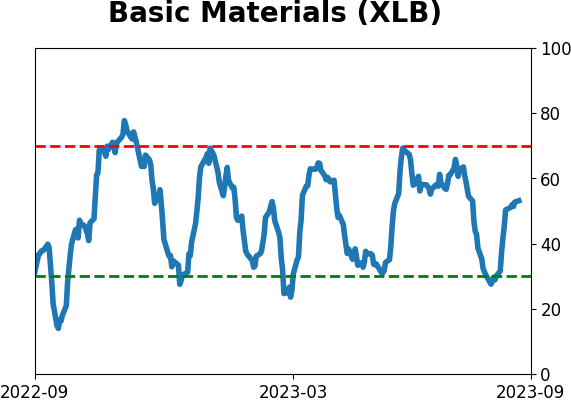
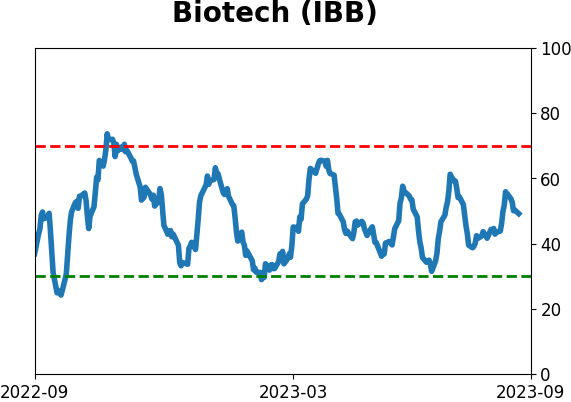
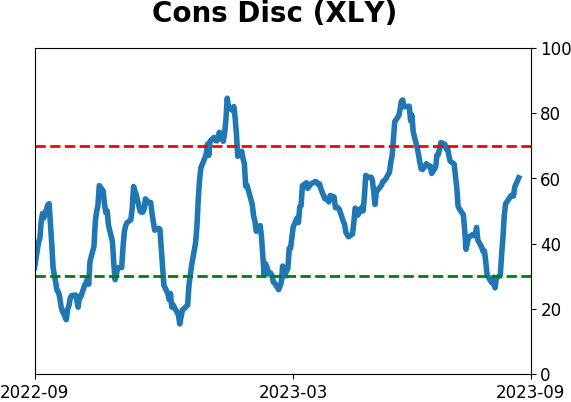
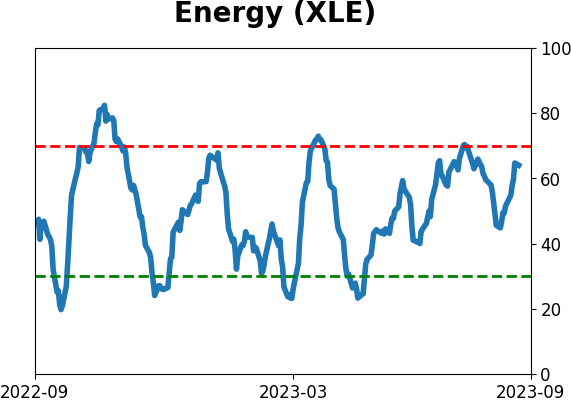
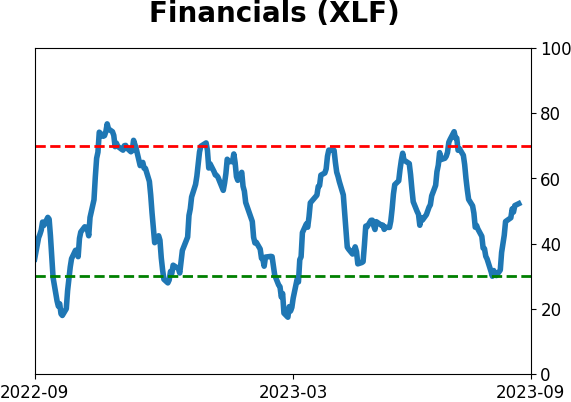
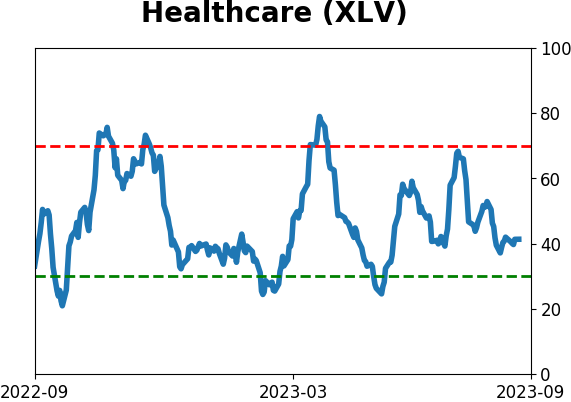
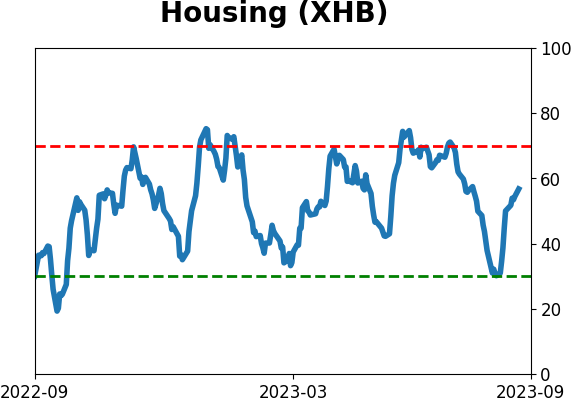
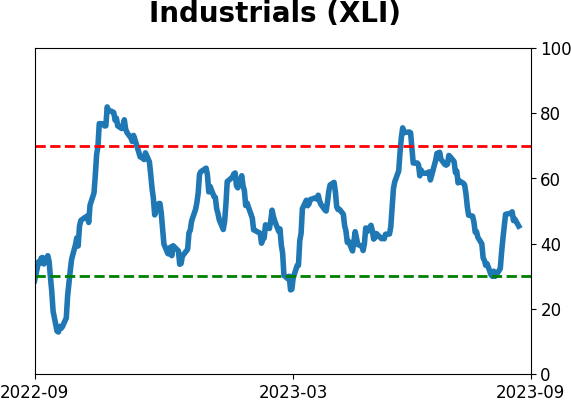
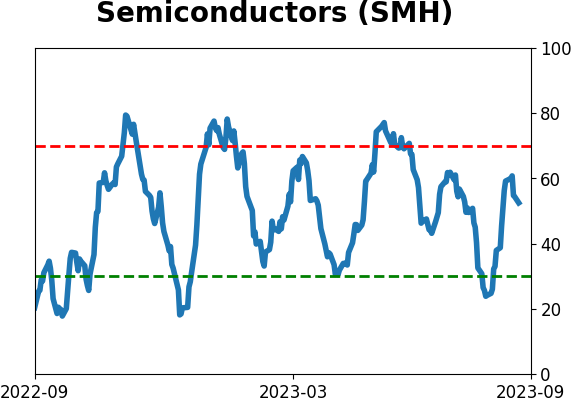
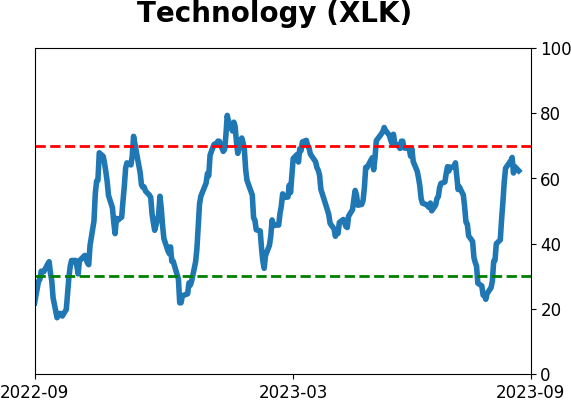
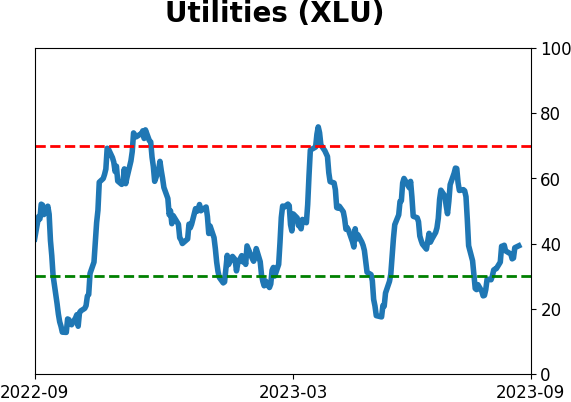
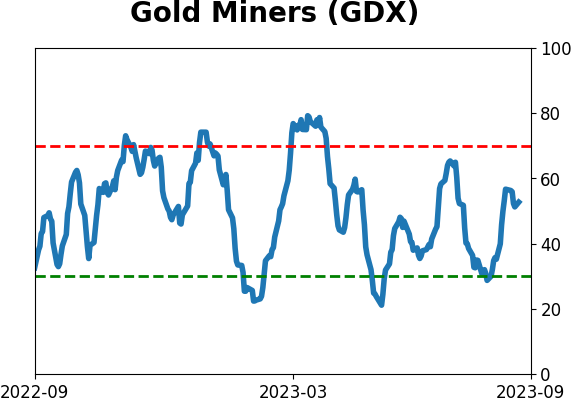
Sector ETF's - 10-Day Moving Average
|
|
|
Country ETF's - 10-Day Moving Average
|
|
|
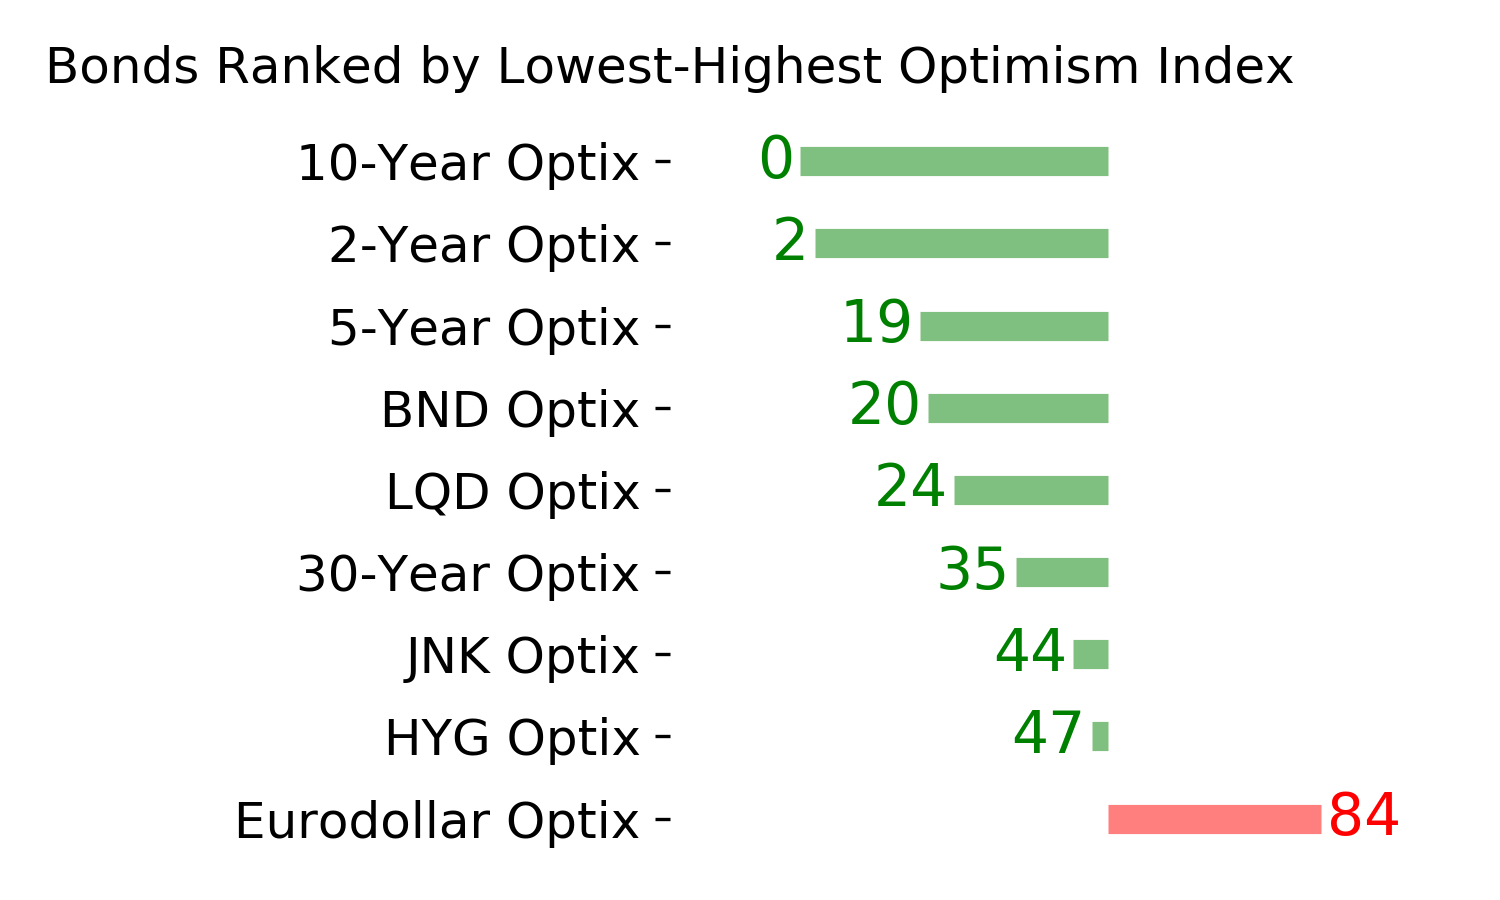
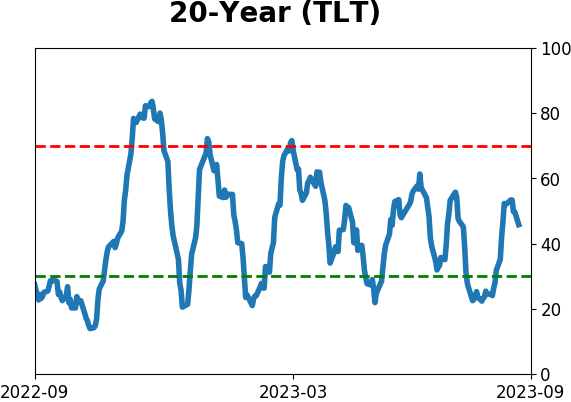
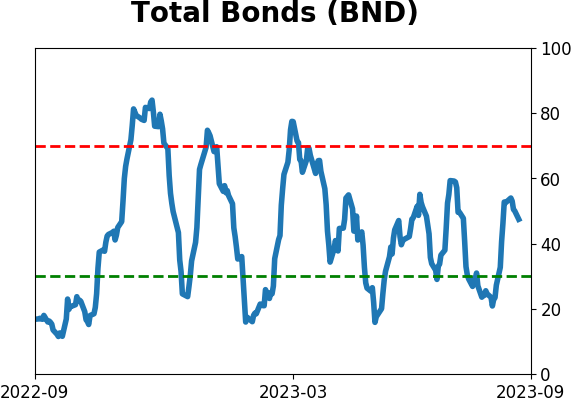
Bond ETF's - 10-Day Moving Average
|
|
|
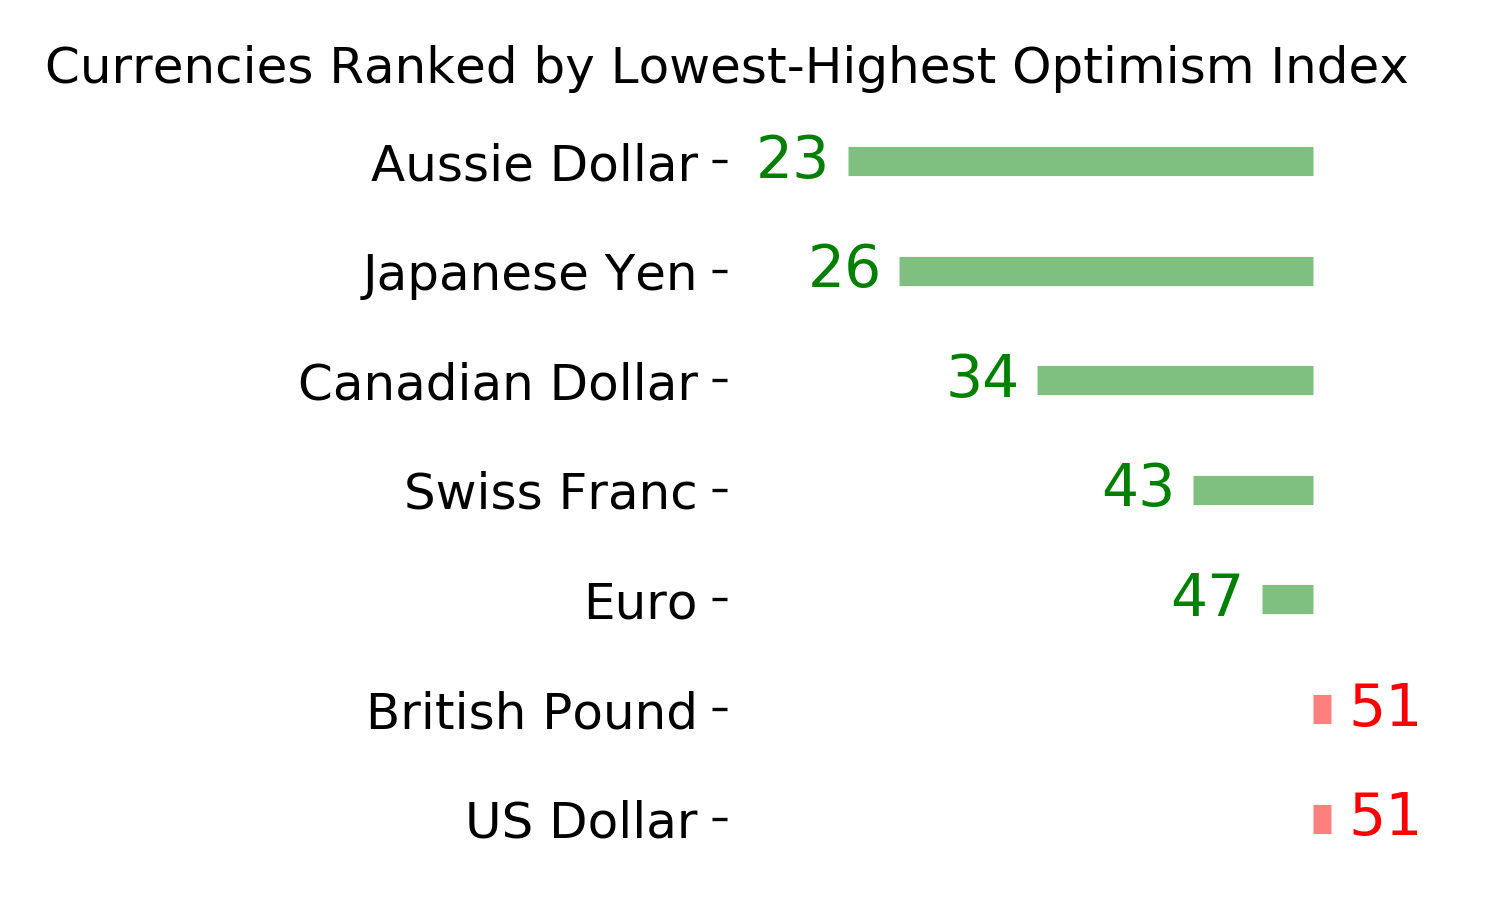
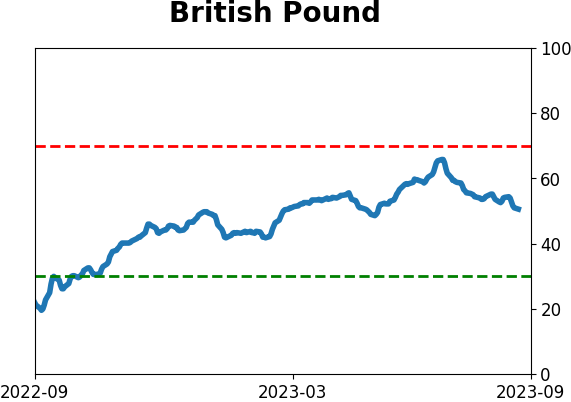
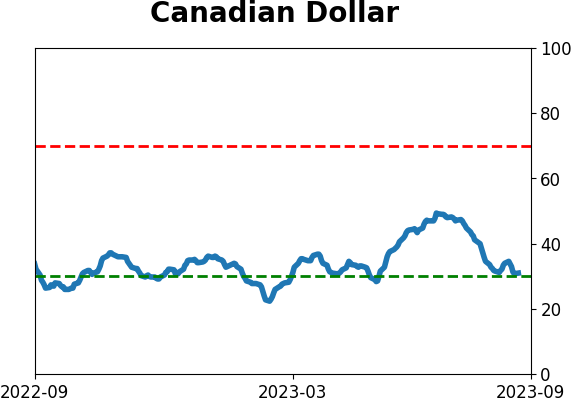
Currency ETF's - 5-Day Moving Average
|
|
|
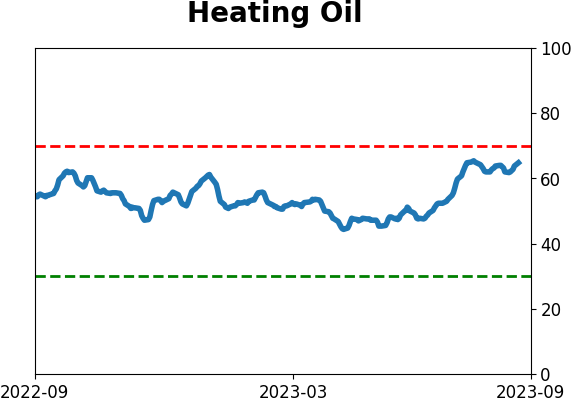
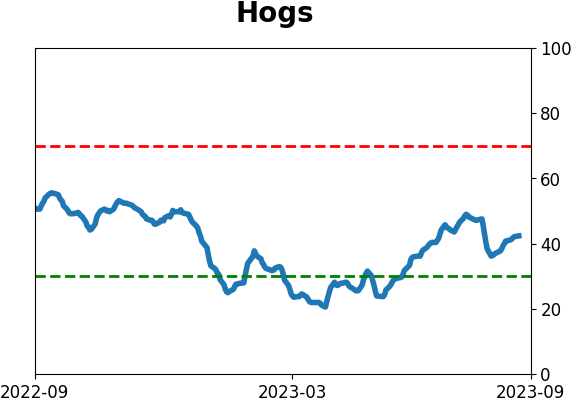
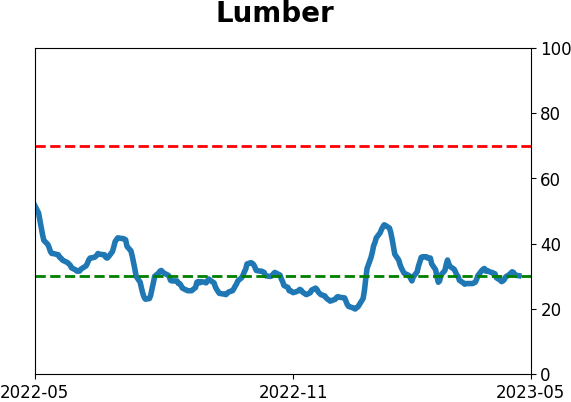
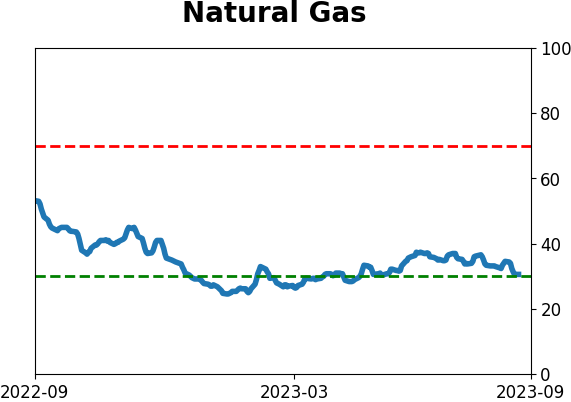
Commodity ETF's - 5-Day Moving Average
|
|