Daily Report : TradingEdge Weekly for Sep 8 - Less pessimistic consumers, surging energy, flailing utilities, renewed commodities

| View/Print a PDF version of this Report |
Headlines
|
TradingEdge Weekly for Sep 8 - Less pessimistic consumers, surging energy, flailing utilities, renewed commodities: This week, we saw that consumers in the U.S. are feeling less pessimistic about the stock market, and that's a good thing. Tech and Energy stocks have enjoyed impressive breadth surges, while European country ETFs are all struggling against the S&P 500 and utility stocks are oversold. Commodities are in a new uptrend but have tough seasonality to deal with. |
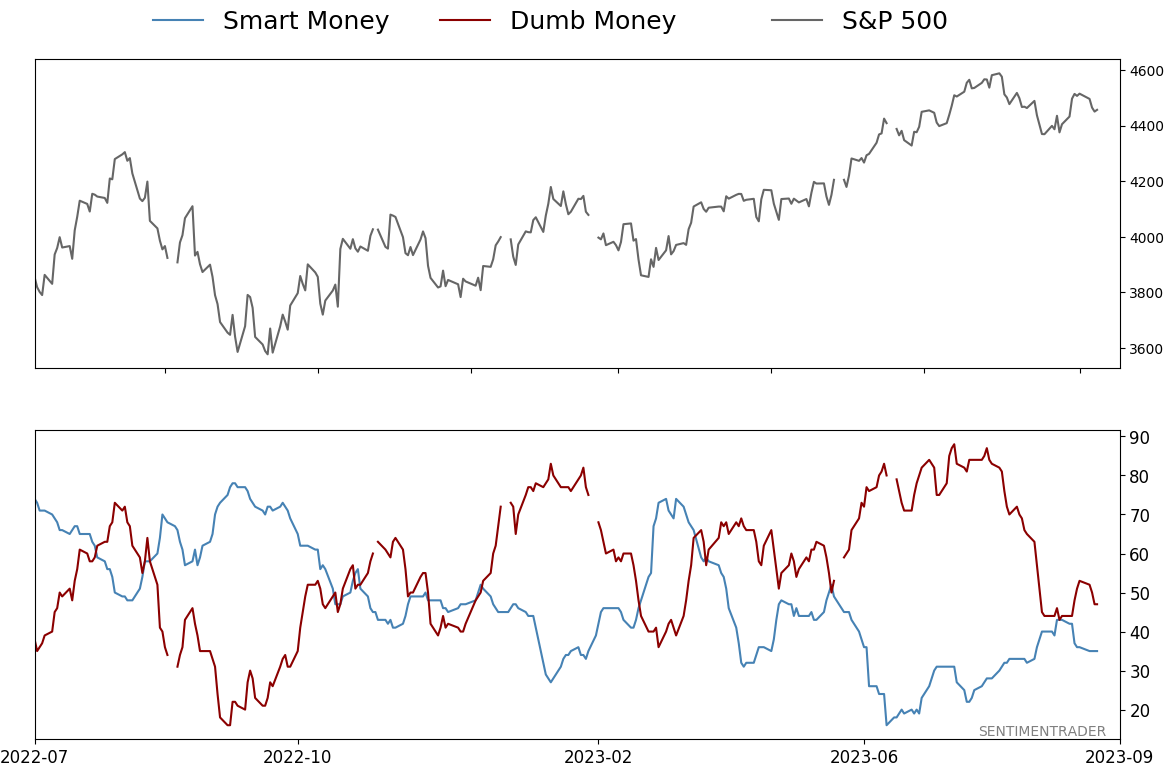
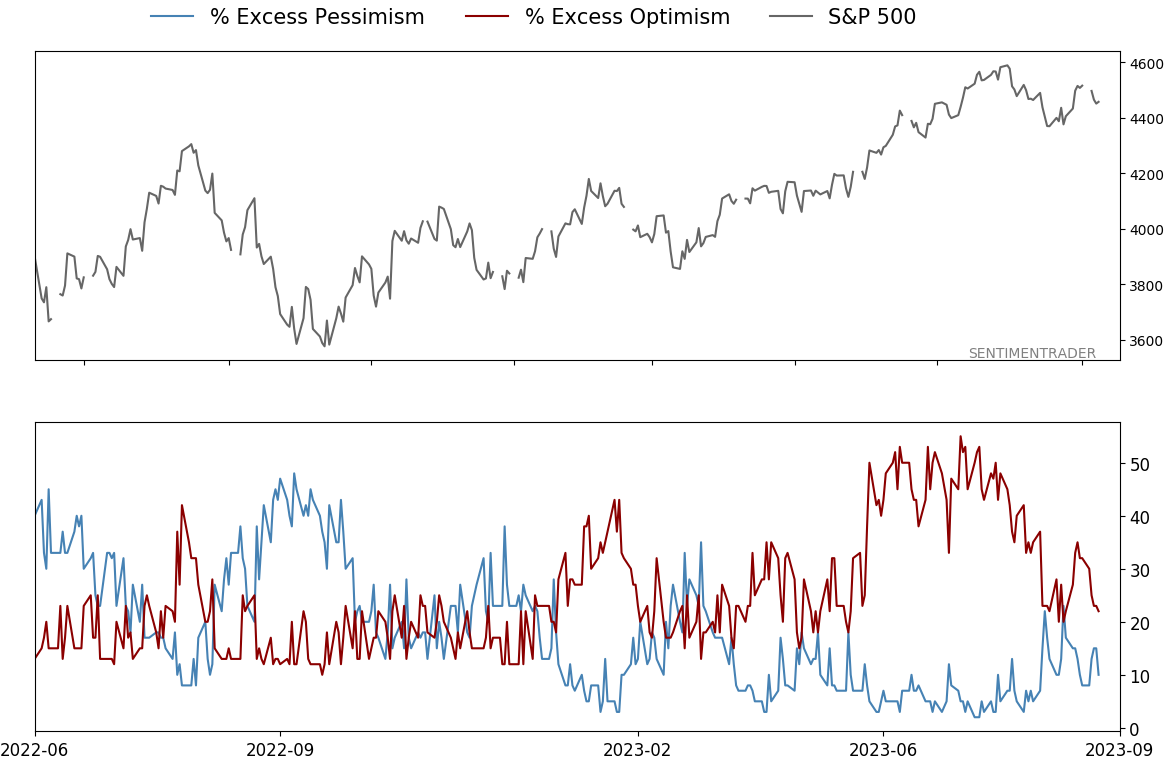
Smart / Dumb Money Confidence
|
|
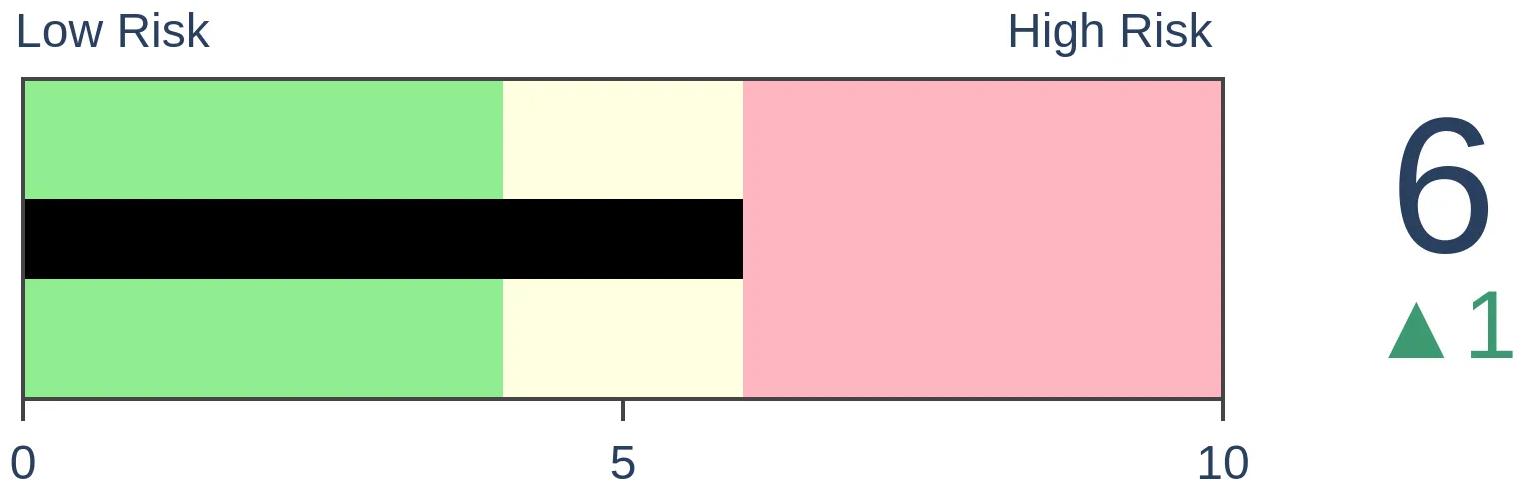
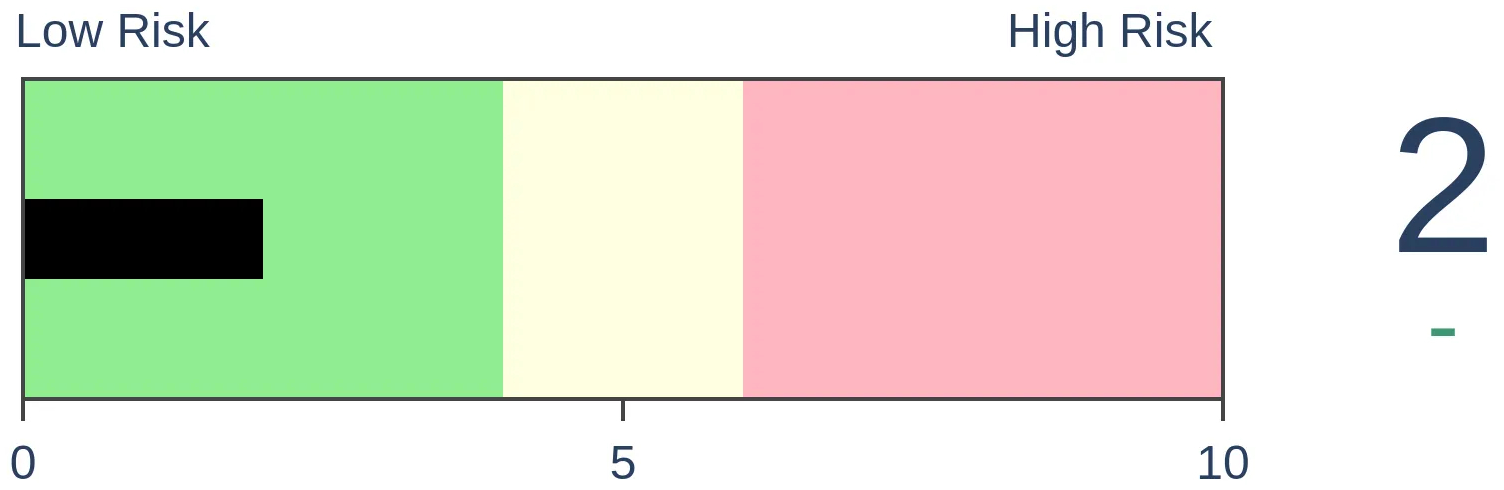
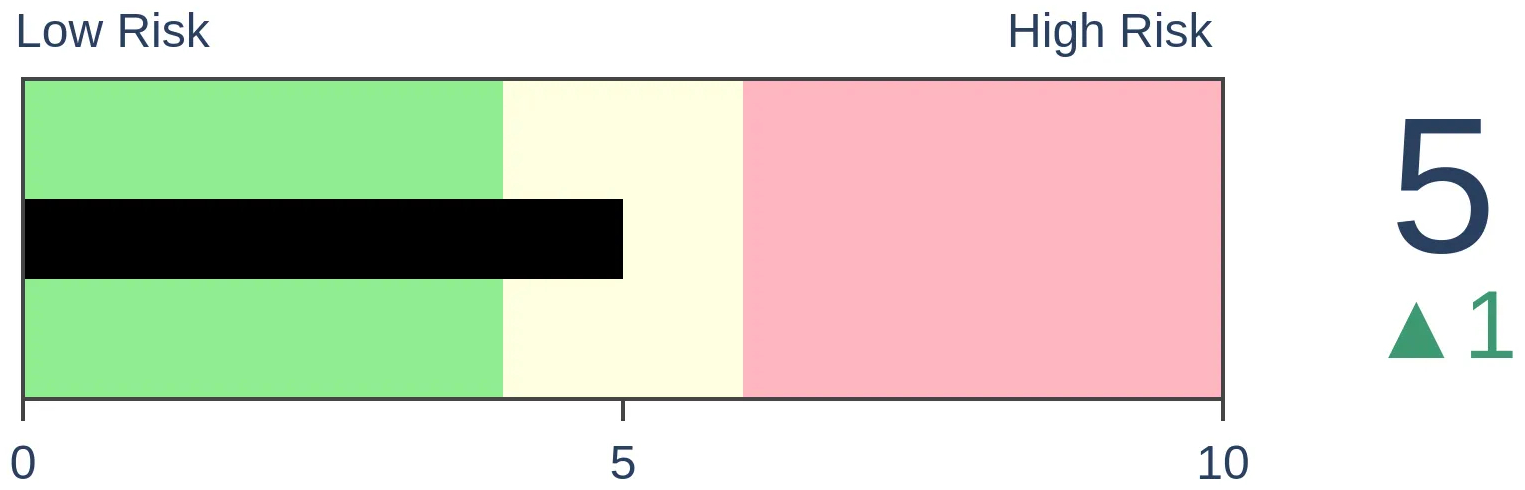
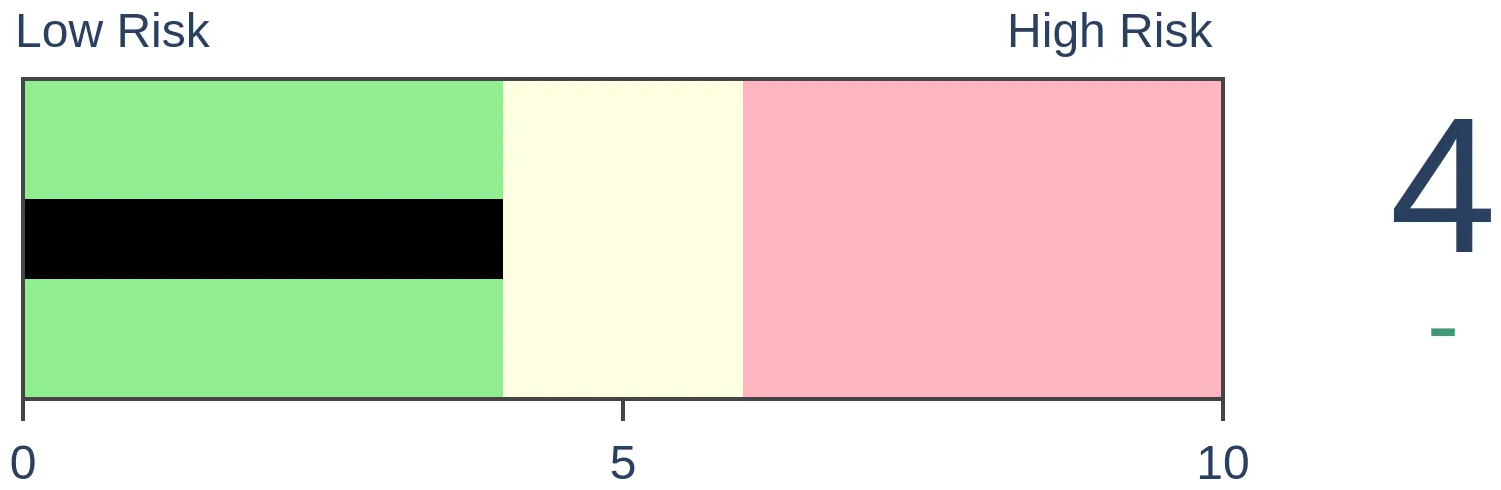
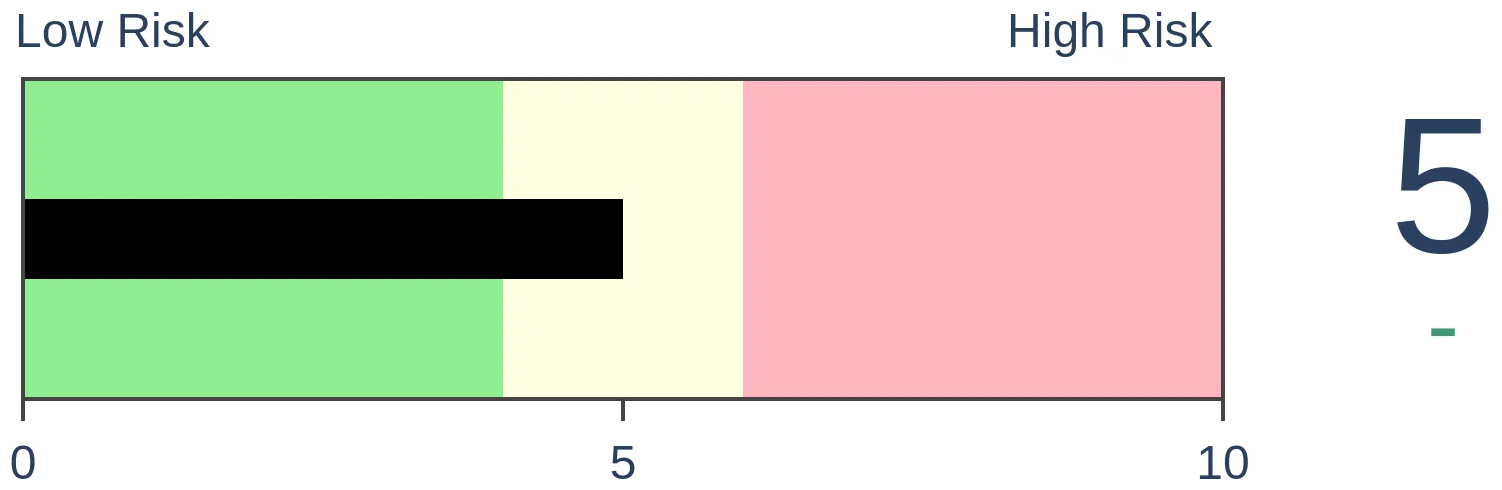
Risk Levels
|

|
|
Research
TradingEdge Weekly for Sep 8 - Less pessimistic consumers, surging energy, flailing utilities, renewed commoditiesBy Jason GoepfertBOTTOM LINEThis week, we saw that consumers in the U.S. are feeling less pessimistic about the stock market, and that's a good thing. Tech and Energy stocks have enjoyed impressive breadth surges, while European country ETFs are all struggling against the S&P 500 and utility stocks are oversold. Commodities are in a new uptrend but have tough seasonality to deal with. FORECAST / TIMEFRAME |
Key points:
- U.S. consumers are getting less pessimistic on the stock market
- Technology stocks enjoying a multi-week breadth thrust
- Not everything is working...optimism on Apple suffered a historic 2-day drop
- Energy stocks have been surging, too, witnessing "reverse panic"
- Signs of extremes in the Utility sector
- European country ETFs all have a negative trend relative to the S&P 500
- Commodities are in an uptrend for the first time in a year
- One challenge is seasonality, with commodities entering a rocky time of year
Fewer consumers are pessimistic about the stock market
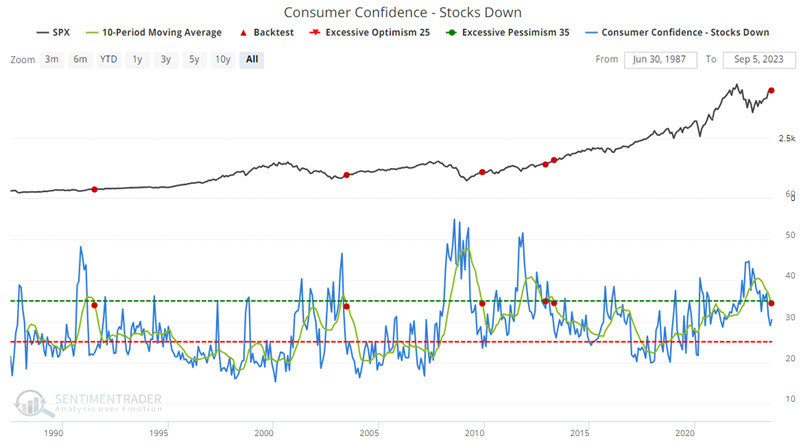
Consumer Confidence regarding investor expectations for stocks in the year ahead just crossed a significant threshold. Jay showed that this signal - though infrequent - has tended to portend a favorable stock market (but not bond market).
The Consumer Confidence Stocks - Down indicator is a monthly indicator that shows the percentage of consumers expecting stocks to decrease, according to a monthly survey from the Conference Board. Like many sentiment indicators, it is ostensibly a contrarian indicator. High readings as the masses become overly bearish - and reversals from high readings - tend to be bullish for stocks.
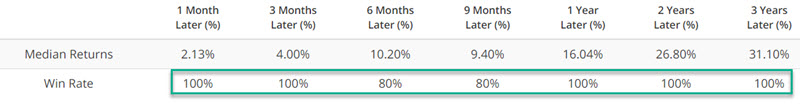
The chart below displays those times when the 10-month moving average of this indicator (the green line in the chart below) crossed below 35%. The most recent signal occurred at the end of August. No investor should look at the results above and assume it is smooth sailing for the next three years. Nevertheless, the recent signal does fall on the favorable side of the weight of the evidence ledger.
This may not be a direct result of cause and effect, but it is worth noting that Treasury bond performance has been notably unfavorable following the signal for stocks shown above. The table below shows returns in 30-year Treasury bond futures after these same signals. They were notably weak up to a year later.
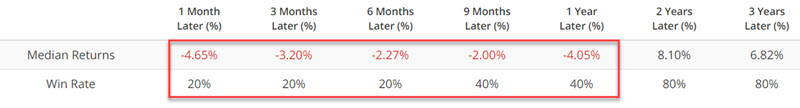
Once again, we are discussing a tiny sample size for an indicator based on an entirely different market. When combined with the fact that T-bonds have already endured a 3+ year bear market - and are now threatening to form a double bottom if recent lows can hold - it is perfectly acceptable for an individual to reject that the results above are meaningful for T-bonds in the here and now.
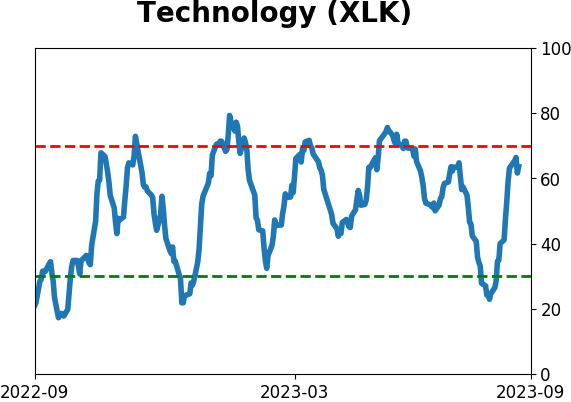
Tech stocks see a breadth thrust
The Technology sector has enjoyed a quick rebound from a scare during August. It wasn't just a few of the big names that get all the attention driving the rally, either. The advance/decline line for the sector showed broad and impressive gains.
Using a 10-day exponential moving average of the Up Issues Ratio for the sector, we can see that it has cycled from an extremely oversold reading (below 35%) to an extremely overbought one (above 65%) in quick succession. The stocks managed similarly impressive feats only twice before in the past five years, both preceding sustained gains.
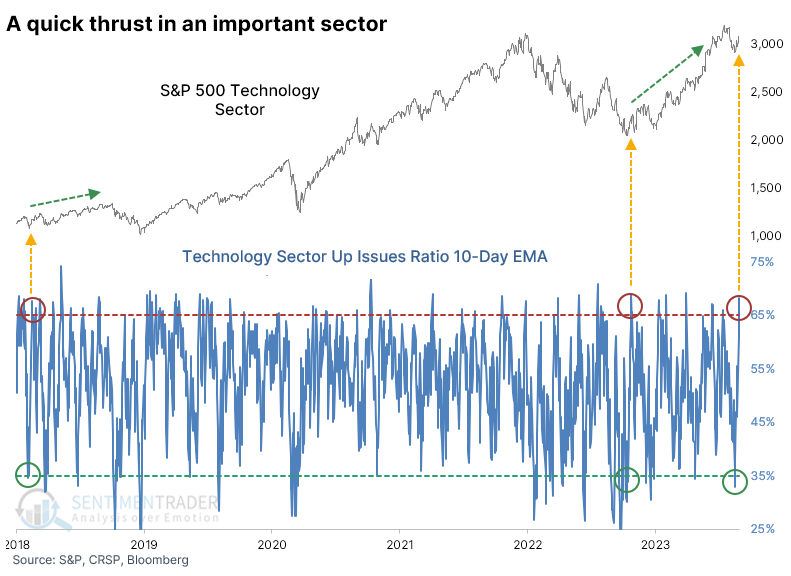
It had been more than six months since the sector witnessed a similar thrust, which is a relatively long time. When Technology stocks witnessed similar behavior over the past 70 years, the sector's returns going forward were pretty good across time frames. It was particularly good over the next six months, with an 82% win rate and a +14.3% median return, well above a random return.
With the sector in an established long-term uptrend and not far from a multi-year high, maybe there is a risk that this kind of move is a blow-off. It's unlike some of the other thrusts that were coming after a prolonged and severe decline. To look for similar instances, the table below filters the signals to only include those that triggered when the S&P 500 Information Technology sector was above its 200-day moving average and was within 5% of its previous three-year high.
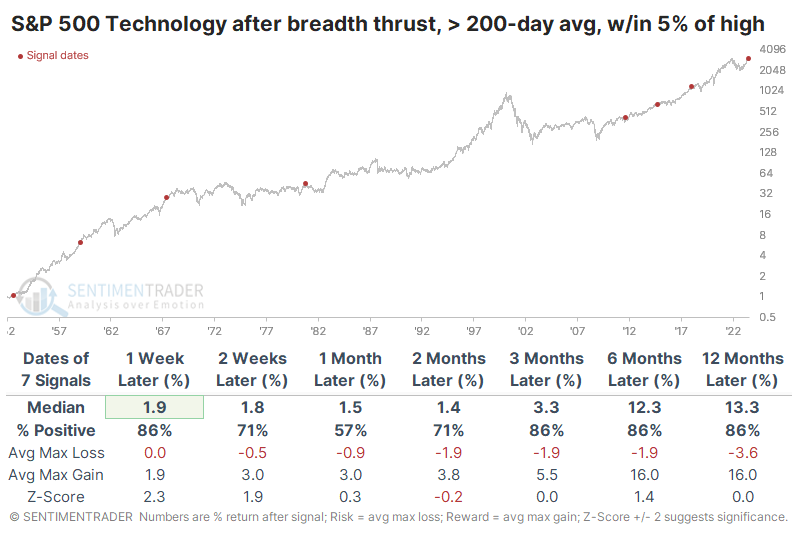
One of them in 1980 did, indeed, mark a blow-off move, and the sector suffered a double-digit loss over the next 3-12 months before embarking on one of the great bull runs of all time. But none of the other signals did, and Tech stocks rose over the medium- to long-term each time.
Not everything in Tech is working
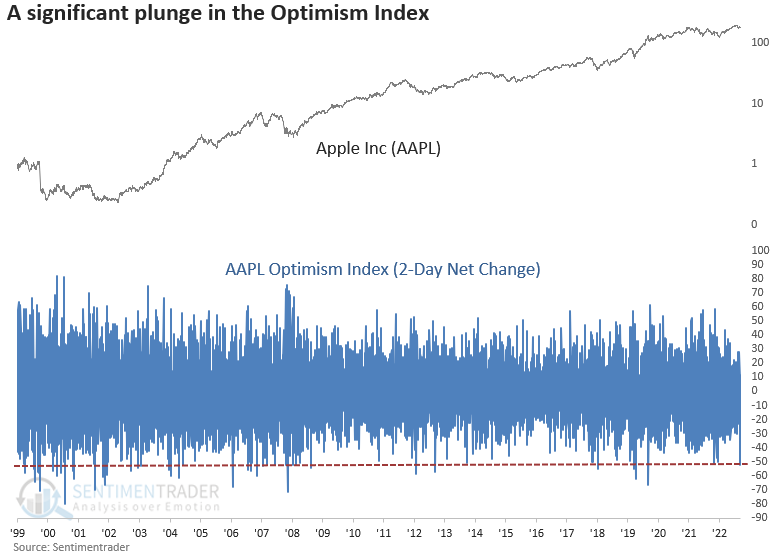
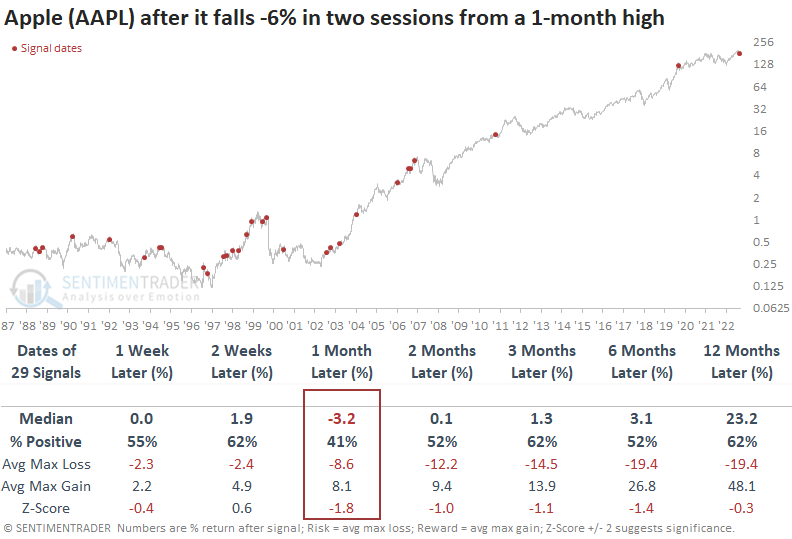
The Optimism Index for Apple saw a dramatic decline, with a drop of more than 50 points in two sessions. Dean showed that similar plunges in sentiment during an uptrend led to negative returns over the following month. A two-session decline of over -6% from a 1-month high also suggests near-term caution.
News-related price plunges like this one are difficult to assess as a certain amount of judgment is required. This one is even more difficult because it involves a foreign government.
When the Optimism Index for Apple takes a nosedive while the stock is trading above its 200-day moving average, the negative momentum tends to persist throughout the following month, resulting in a median return of -3.6% and a win rate of 42%.
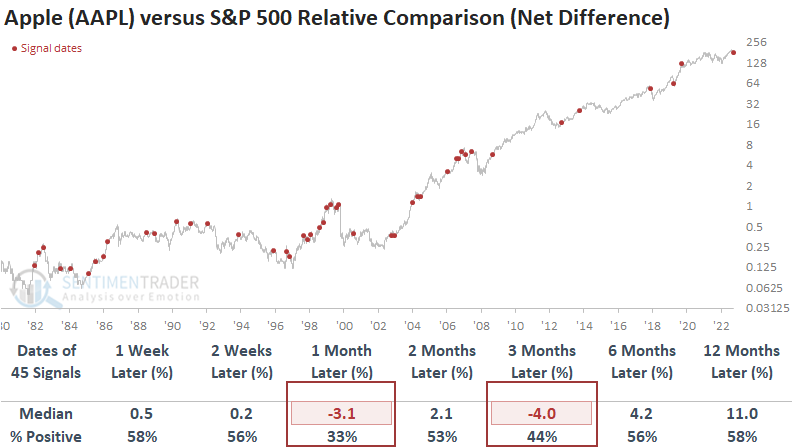
From a relative comparison perspective, the plunge in the Optimism Index suggests Apple could underperform the broad market on a medium-term basis as it outperformed the S&P 500 over the next month only 33% of the time.
In cases where Apple registers a decline exceeding -6% in two sessions from a one-month high while still maintaining a position above its 200-day average, history suggests a tendency for the stock to decline over the following month.
Energy stocks are surging, too
Energy stocks have been on a tear the last couple of weeks and briefly enjoyed a push to new highs on Tuesday before an afternoon reversal. Still, breadth within the sector has been excellent.
Multiple times over the years, we've looked at a Panic Breadth composite that looks at selling pressure within sectors or indexes. It combines a handful of measures that look at the breadth of devastation among individual stocks. We can do the same calculation and just reverse the implication for a sector that's been doing well. This "reverse panic breadth" composite has been hanging at a very low level for energy stocks for weeks. The 30-day average of this measure has dropped below 5.75%, in the bottom 5% of readings over the past 30 years.
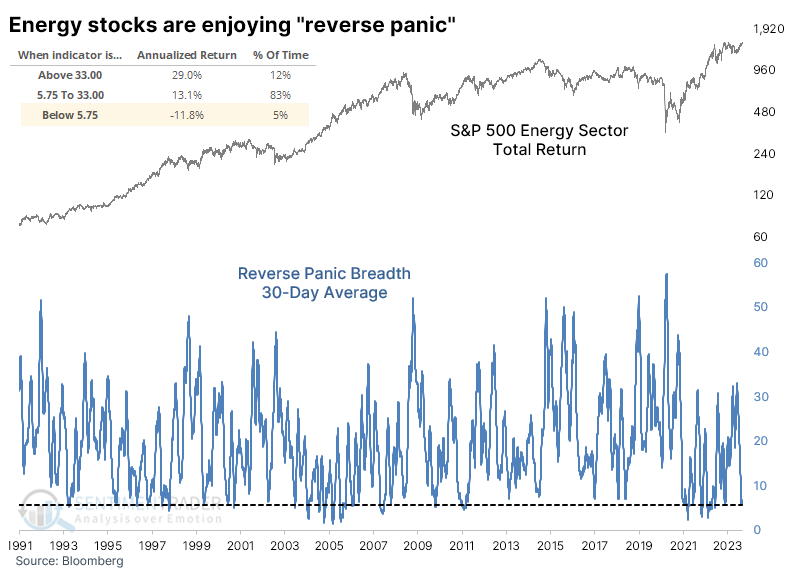
A total return version of a stock or index includes dividends in the calculation, so it tends to show consistently positive returns across most time frames. Even so, when the reverse panic breadth calculation was this low for Energy stocks, the S&P 500 Energy Total Return index showed an annualized return of -11.8%.
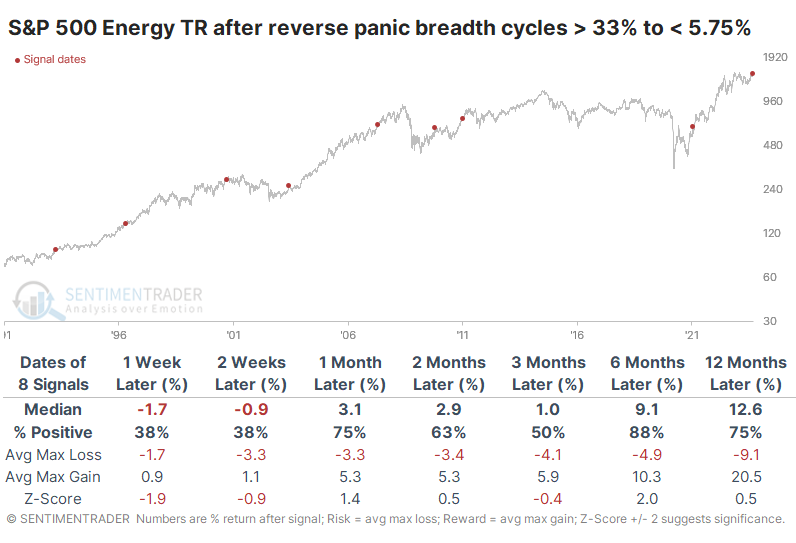
The table below takes a signal-based approach, looking at other times when the reverse panic breadth cycled from above 33% to below 5.75%. Even though this is a total return index, short-term returns were poor over the next one to two weeks. There was really only one signal, at the end of 2010, when it took off and just kept climbing for months. Even with some short-term weakness, the index still showed a gain every time but once over the next six months, and the sole loss was small.
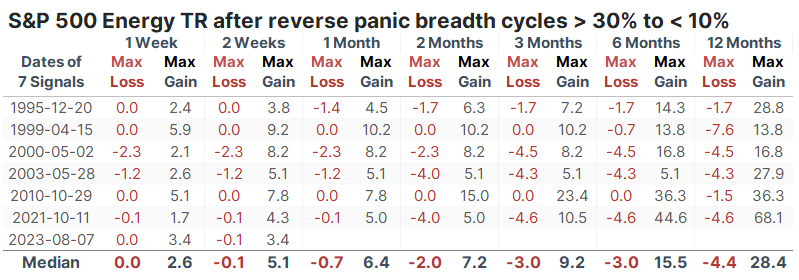
We can generate a larger sample size if we relax the parameters slightly. We add 11 signals if we reduce the upper extreme to 30% and the lower to 10%. The current signal was first triggered on August 7. Since then, the Energy Total Return index rallied more than 3% within the first two weeks, one of the best initial reactions to these signals since 1990.
The table below filters the signals to only show those that had the best reactions; the sector had to rally at least 3% at some point within the first two weeks. It made a difference in the long-term returns and risk versus reward.
The table of maximum gains and losses for these signals shows very little of the latter up to six months later. None showed a loss of more than -5%, while all showed a gain of more than +5% at some point. Granted, they all had a head start due to the first couple of weeks, but it's instructive to see that none of them suffered immediate, large, and/or sustained declines for months afterward.
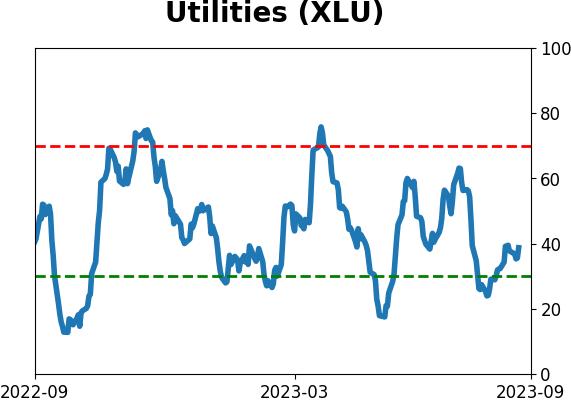
More extremes among Utilities
Utilities have been a dog so far in 2023. Jay noted that a bevy of potential positive signs in mid-June was followed by more weakness but there are more signs that the outlook may finally be improving for utilities.
In June, Jay highlighted a variety of indicators that were flashing potentially favorable signals for the utility sector. They turned out to be a dud. So, should investors throw in the towel? Another round of indicators suggests the answer is "No," and the signals highlighted in June remain bullish into June 2024.
As the name implies, the XLU 12-Week Low % indicator shows the percentage of stocks in that exchange-traded fund currently trading at a 12-week low. The chart below displays all the days when this indicator stood above 90%.
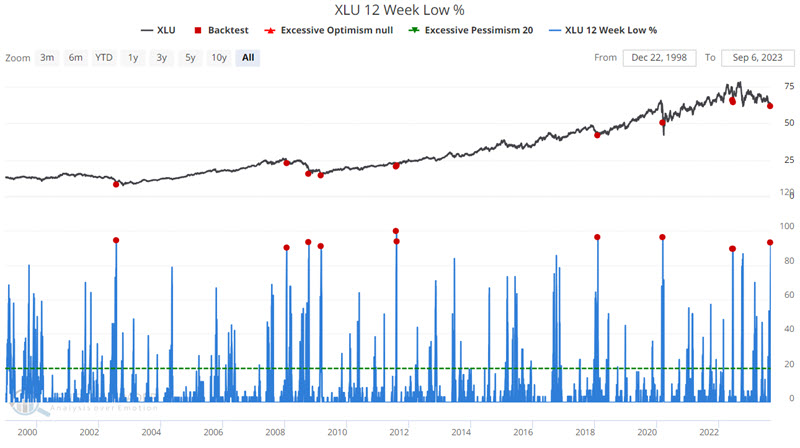
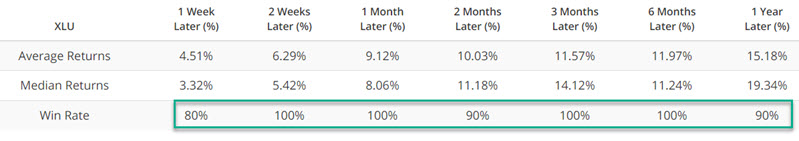
The latest favorable signal occurred on 2023-09-05. The good news is that historical results have been highly favorable. The bad news is that historical results do not guarantee that this latest signal will follow suit. Nevertheless, it certainly falls on the favorable side of the ledger.
Our XLU Aggregated Put/Call Ratio indicator recently spiked above 3.0, an infrequent occurrence. The chart below displays all the days when this indicator was above 3.0.
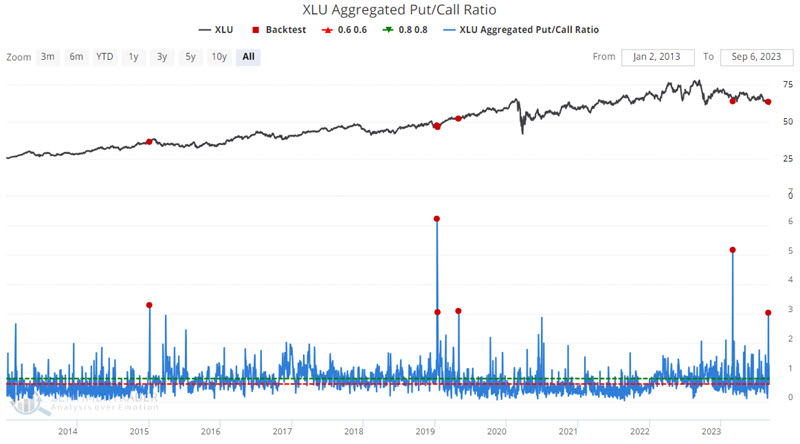
The most recent signal occurred on 2023-08-30. The bad news is the minuscule sample size and the so-so results for six and twelve months. The good news is the high Win Rates and robust median returns for two weeks to 2 months.
Jay also showed that our calculation of correlation among companies in the sector is reversing lower from an extremely high level. After similar behavior, the sector showed exceptional 12-month returns.
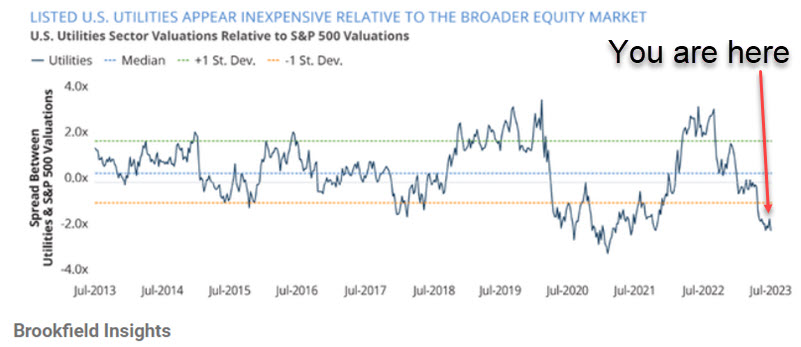
Utility stocks appear to be undervalued relative to the overall market. The chart below (Courtesy of Austin Rogers and Brookfield Insight) displays the spread between utility sector valuations and that of the S&P 500 Index. The utility sector is presently in deeply undervalued territory.
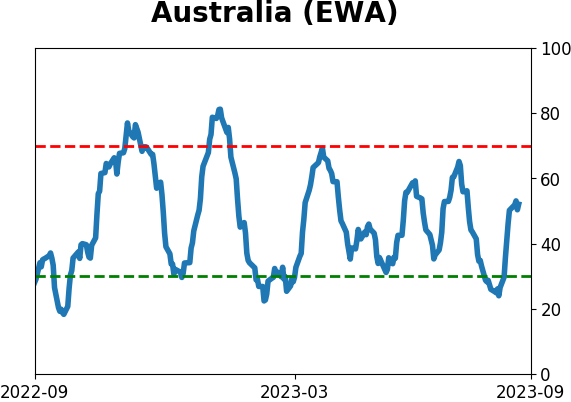
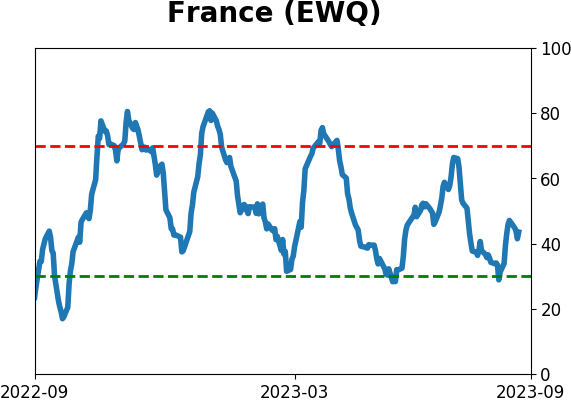
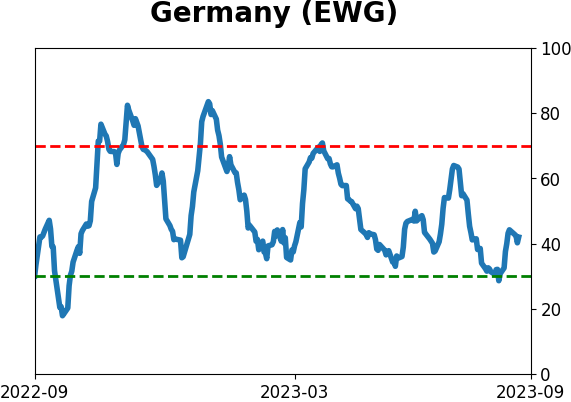
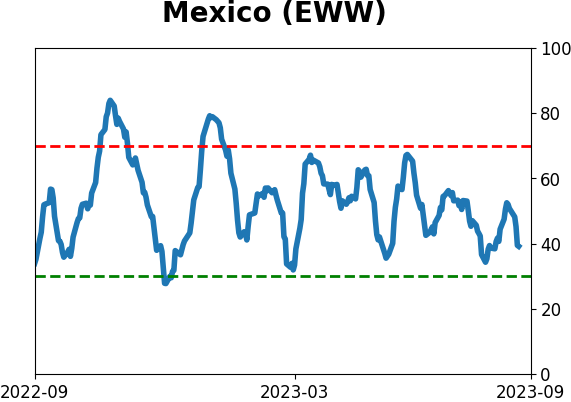
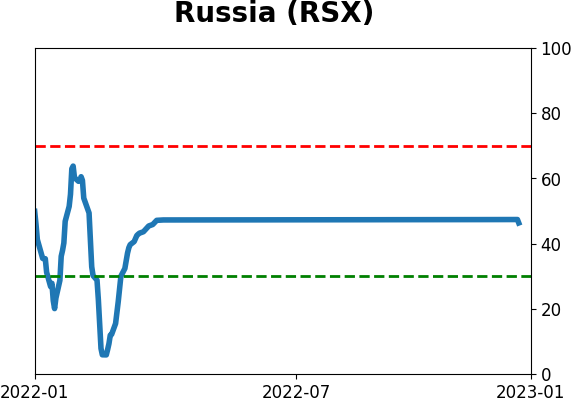
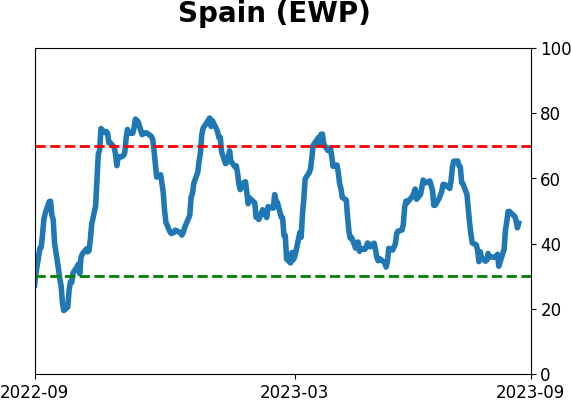
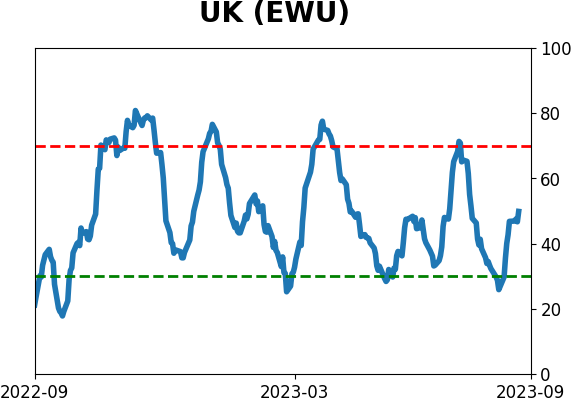
European stocks are struggling
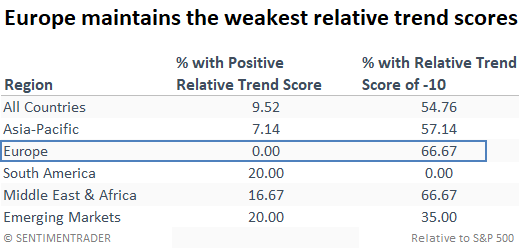
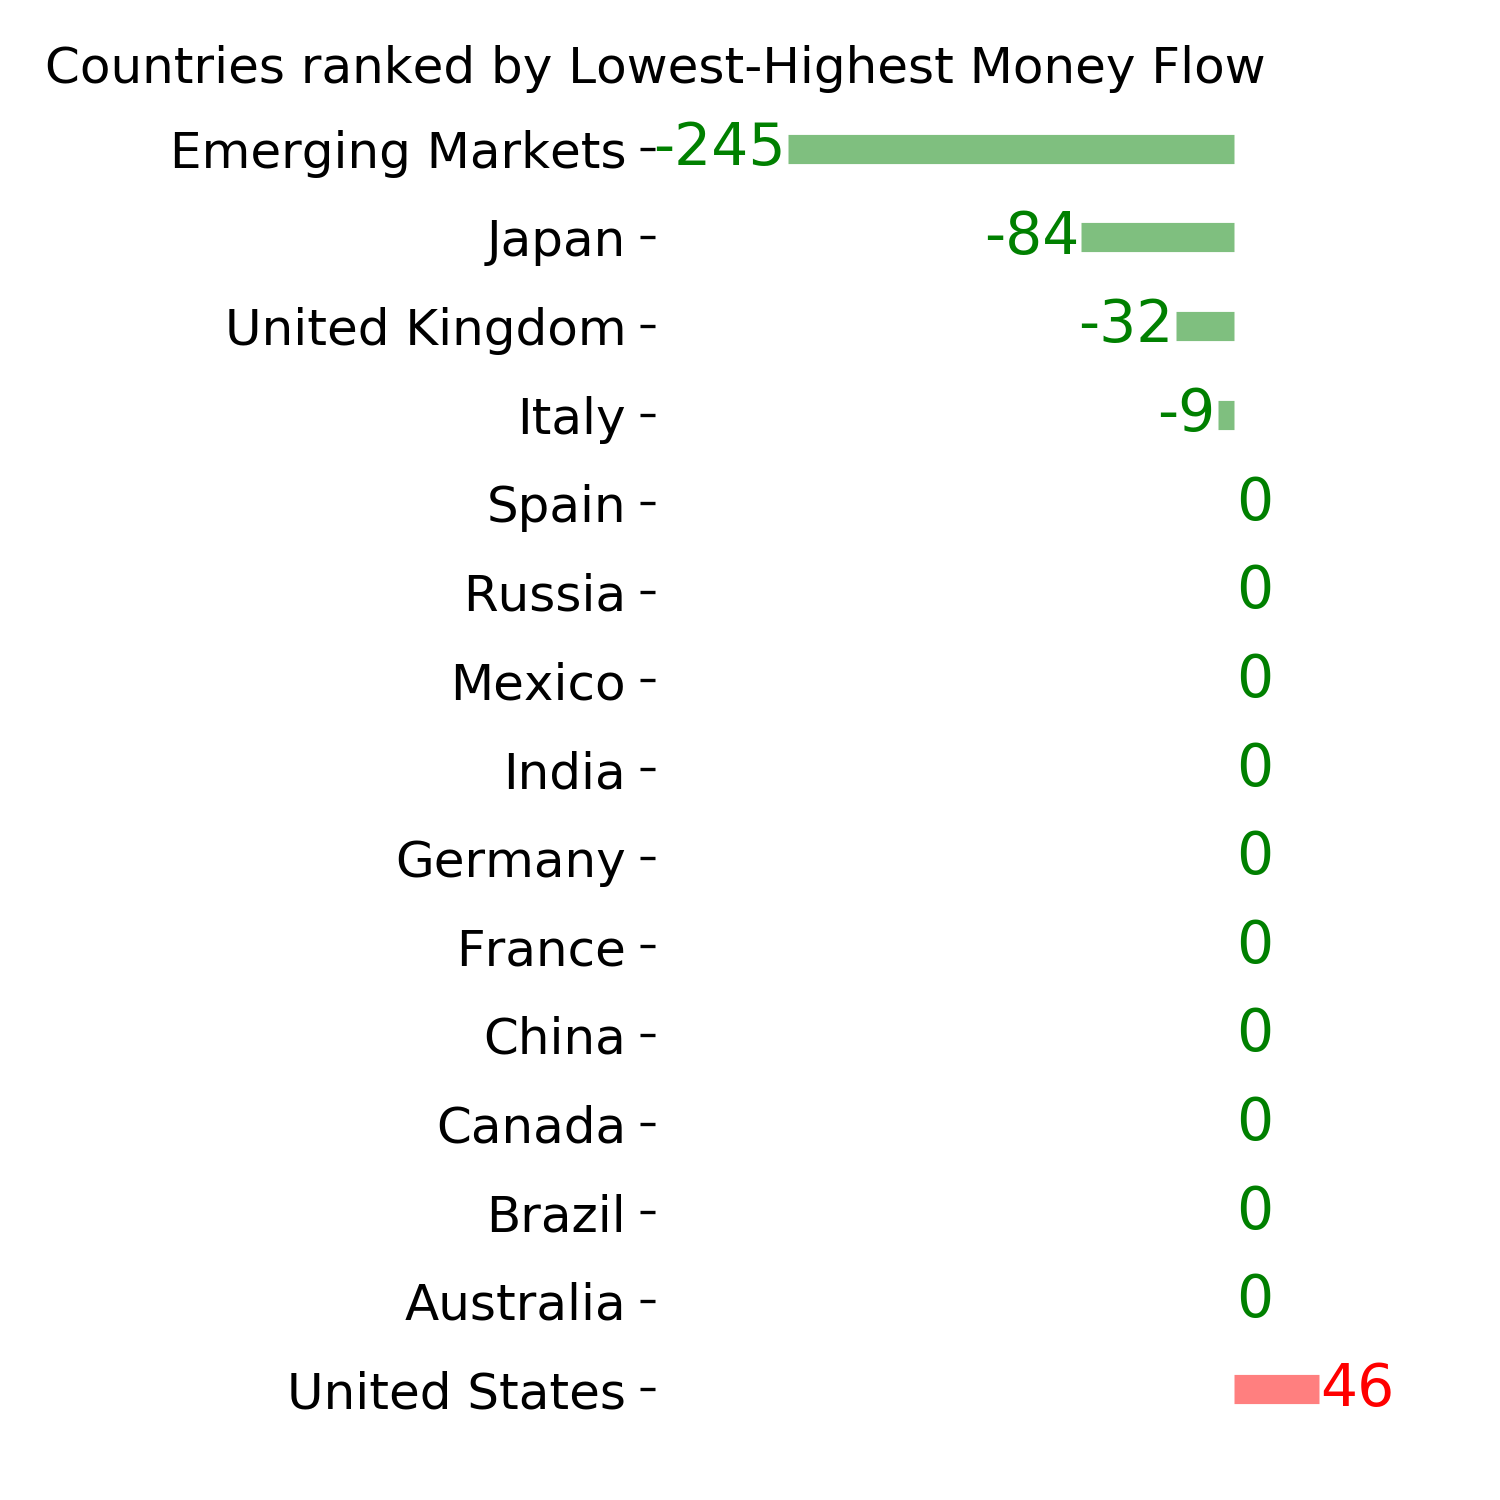
The percentage of European country ETFs with the worst possible relative trend score surged higher. Dean noted that similar trend score conditions led to unfavorable returns for the MSCI Europe Index over the next few months.
Regarding regions around the globe, Europe is a glaring weak spot. Astonishingly, no European country maintains a positive relative trend score versus the S&P 500. Even more concerning is the recent surge in countries achieving the lowest possible score, with a whopping two-thirds of European nations now residing at a dismal -10.
When aggregating the relative trend scores for regions globally, it's notable that no European country maintains a positive score compared to the S&P 500, and the percentage with the worst possible score, -10, has now increased to 66%.
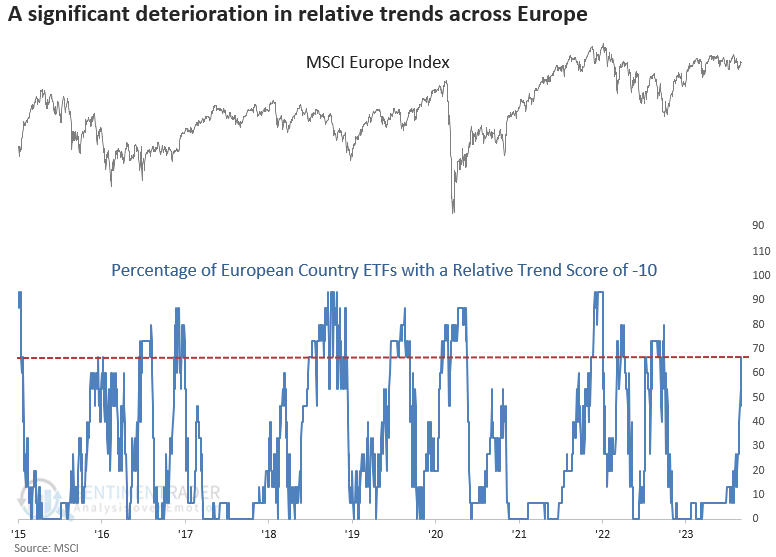
The percentage of European country ETFs with a relative trend score of -10 increased to the highest level since September 2022.
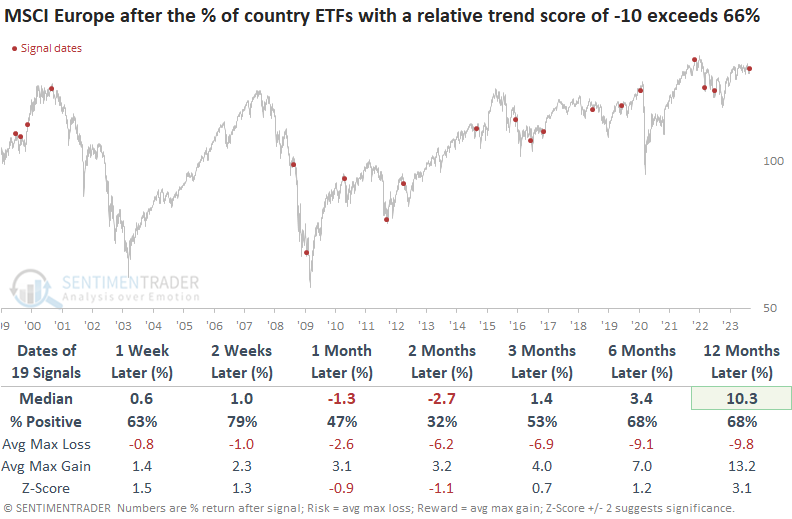
When the percentage of European country ETFs with a relative trend score of -10 cycles from less than 25% to greater than 66%, the MSCI Europe Index tends to bounce in the near term. However, after the relief rally, the index showed negative returns over the subsequent one and two-month periods. The median max loss exceeded the max gain from two to six months later.
A new uptrend for commodities
Dean showed that the Bloomberg Spot Commodity Index closed above its 200-day average for the first time in a year. Similar trend change signals led to higher commodity prices over the next six and twelve months every time.
After 251 consecutive trading days below its 200-day moving average, the 8th longest streak in 90 years, the Bloomberg Spot Commodity Index has finally closed above its long-term price trend indicator.
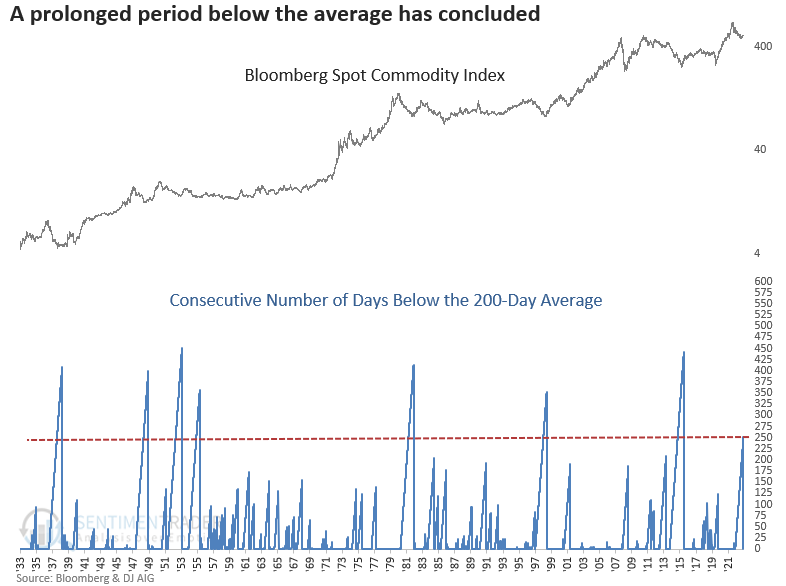
After similar moves back above average, a diverse basket of commodities exhibited lackluster returns in the ensuing months. Nevertheless, this initial lull eventually paved the way for a sustained uptrend, with the index registering a gain 100% of the time over the next six and twelve months.
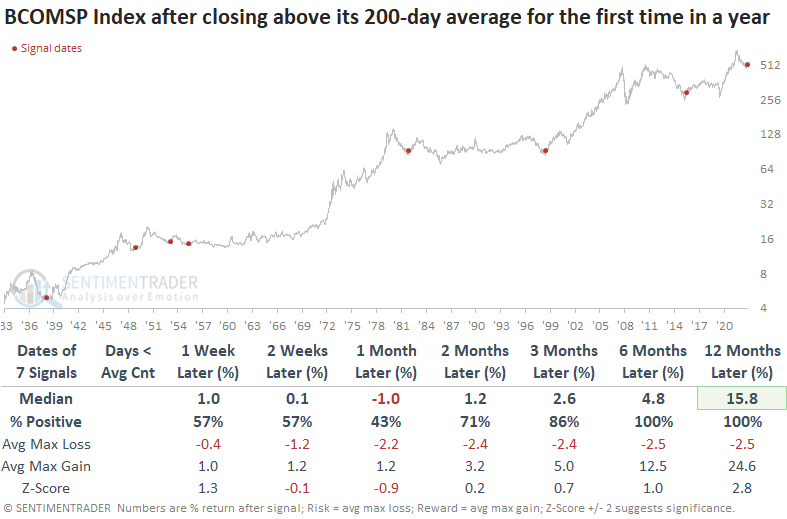
By reducing the threshold to 175 trading days below the 200-day average, we can generate six additional precedents. A year later, the Bloomberg Spot Commodity Index was higher 85% of the time, with a median gain of 14.7%.
Energy, a sector showing renewed strength after consolidating for the last year, is the clear-cut winner after the Bloomberg Spot Commodity Index shifts to a new uptrend, as it showed - by far - the highest average returns across sectors and factors.
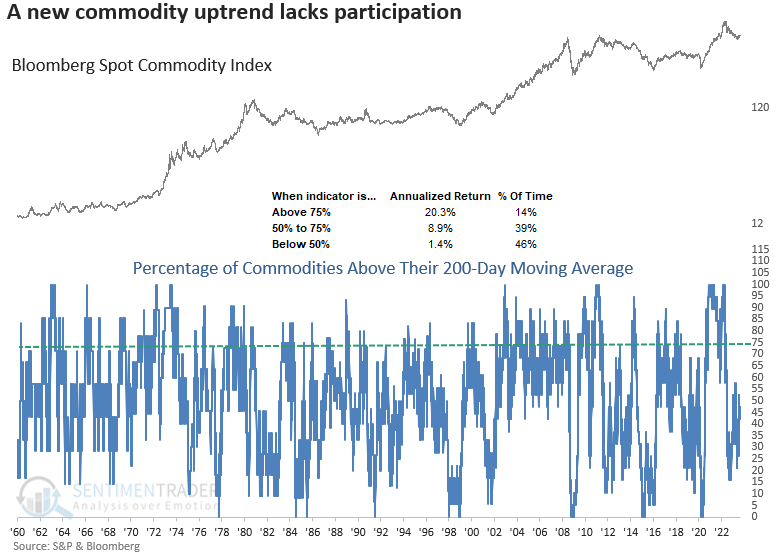
While there has been a trend change at the index level, it's important to note that broad participation is uninspiring, with fewer than 50% of commodities above their respective 200-day averages. Historically, the Bloomberg Spot Commodity Index delivers robust returns when over 75% of commodities are trading above their long-term averages.
But there is seasonality to deal with
Even though price action is showing some positive signs, Jay noted that unleaded gas and the CRB Index are entering their weakest seasonal periods of the year.
The beginning or end of any typically favorable or unfavorable seasonal period should NOT be considered an automatic buy or sell signal. The beginning of a favorable seasonal period tells us to look for a buying opportunity, and the start of an unfavorable seasonal period simply tells us to look for an opportunity to sell (or sell short).
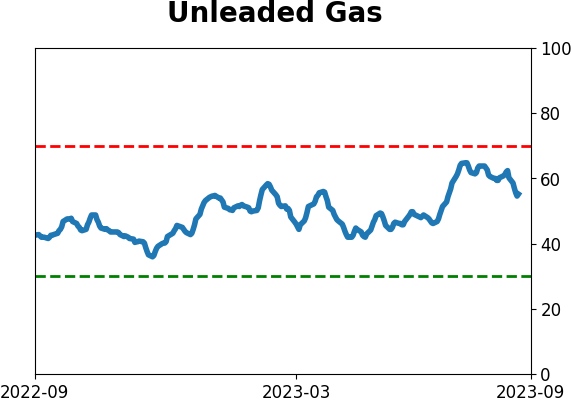
For unleaded gas, it has a historically weak period that extends from the close on Trading Day of Year #167 through TDY #236. For 2023, this period extends through the close on 2023-11-30. The chart below displays the hypothetical cumulative $ +(-) from holding a long position in unleaded gas futures only during this unfavorable period every year since 2006.
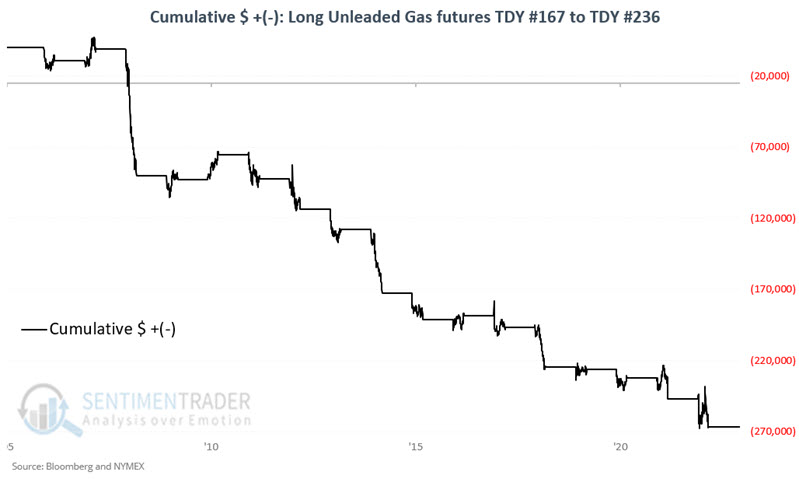
Only 18% of years managed to gain during these seasonal windows, and the average loss was about double the average gain. The contract gained more than +$10,000 only once while losing more than -$10,000 nine times.
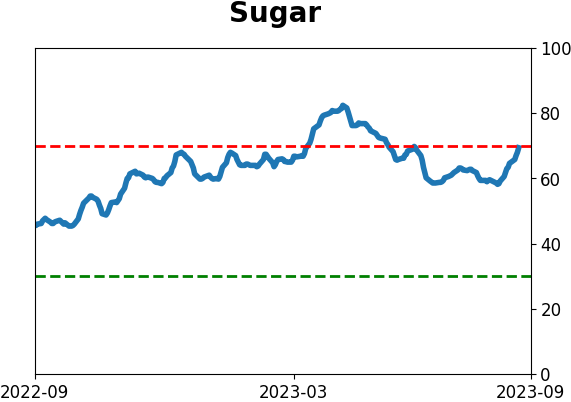
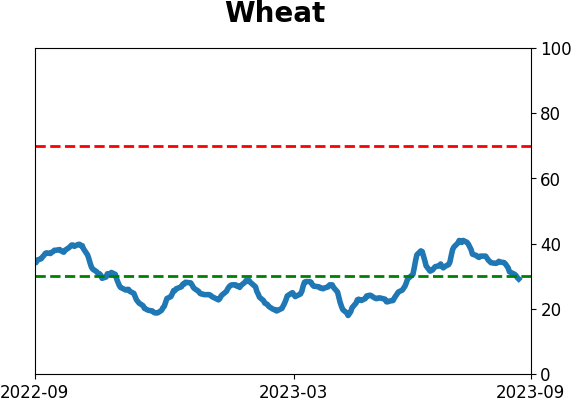
The CRB Index is an index based on price changes for a basket of commodities. We've published multiple pieces of research suggesting higher prices for various commodities lately, though commodities as an asset class have shown a historical tendency to experience weakness during the period directly ahead. The chart below displays the annual seasonal trend for the CRB Index
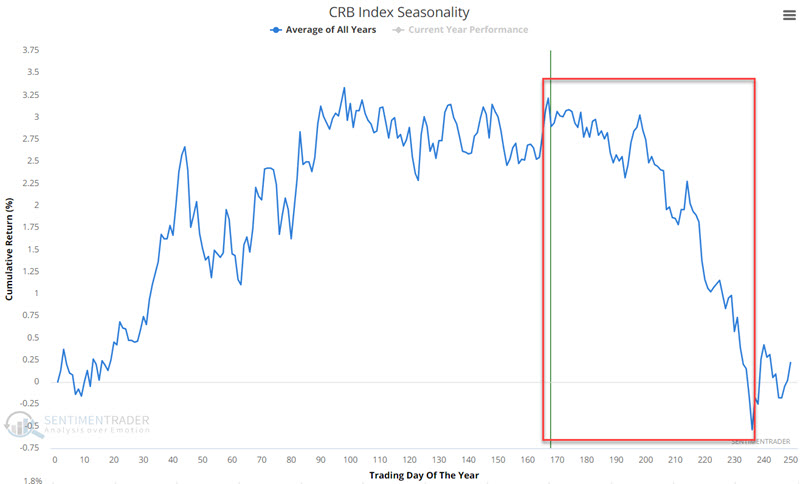
While the overall trend is clearly lower, the edge wasn't huge. The CRB Index showed a gain during 15 years and a loss during 14 years. The average gain was modestly smaller than the average loss, though it gained more than +9% only twice while suffering a loss larger than -9% four times.
About TradingEdge Weekly...
The goal of TradingEdge Weekly is to summarize some of the research published to SentimenTrader over the past week. Sometimes there is a lot to digest, and this summary highlights the highest conviction or most compelling ideas we discussed. This is NOT the published research; rather, it pulls out some of the most relevant parts. It includes links to the published research for convenience, and if you don't subscribe to those products, it will present the options for access.
Indicators at Extremes
|
|
|
|
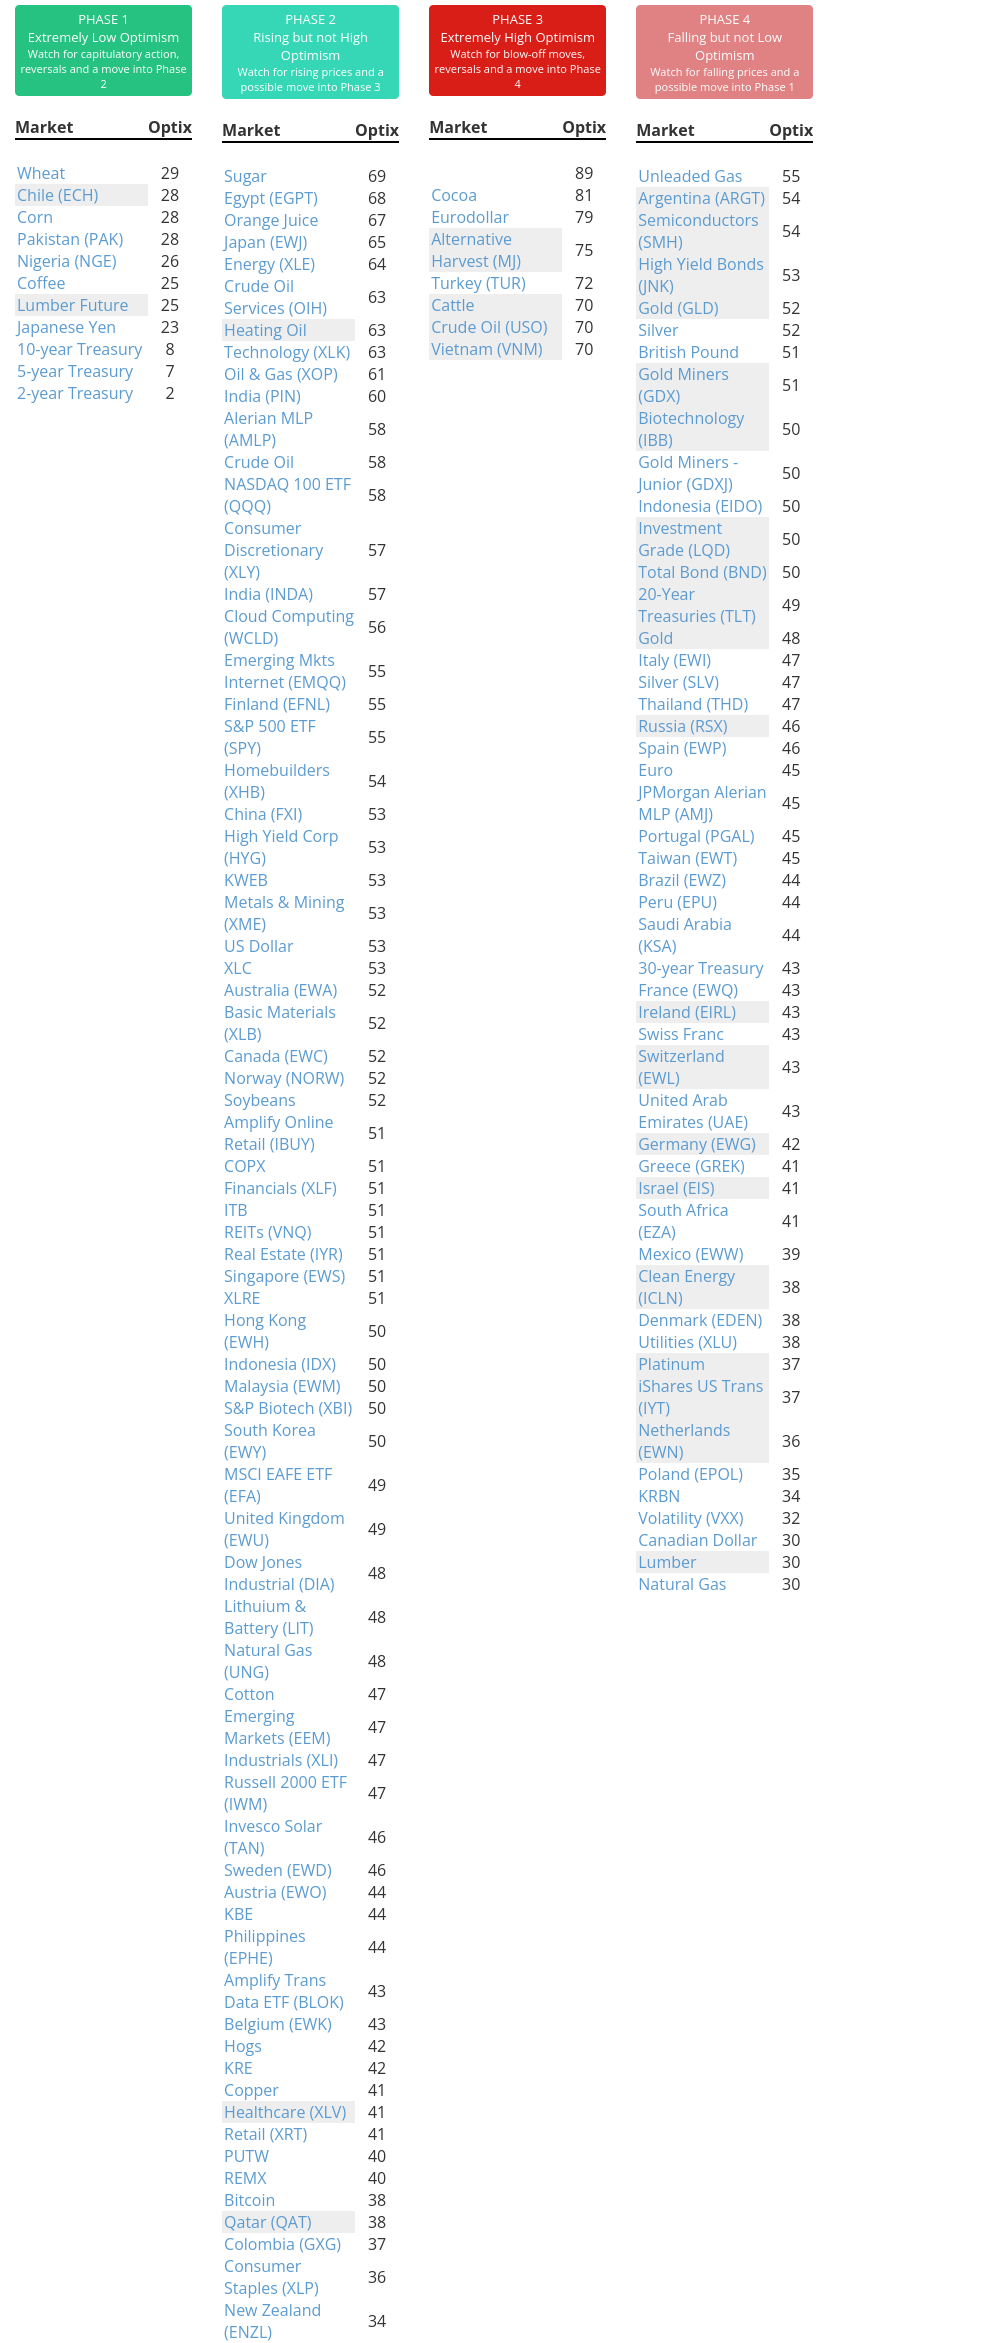
Phase Table
|
|
|
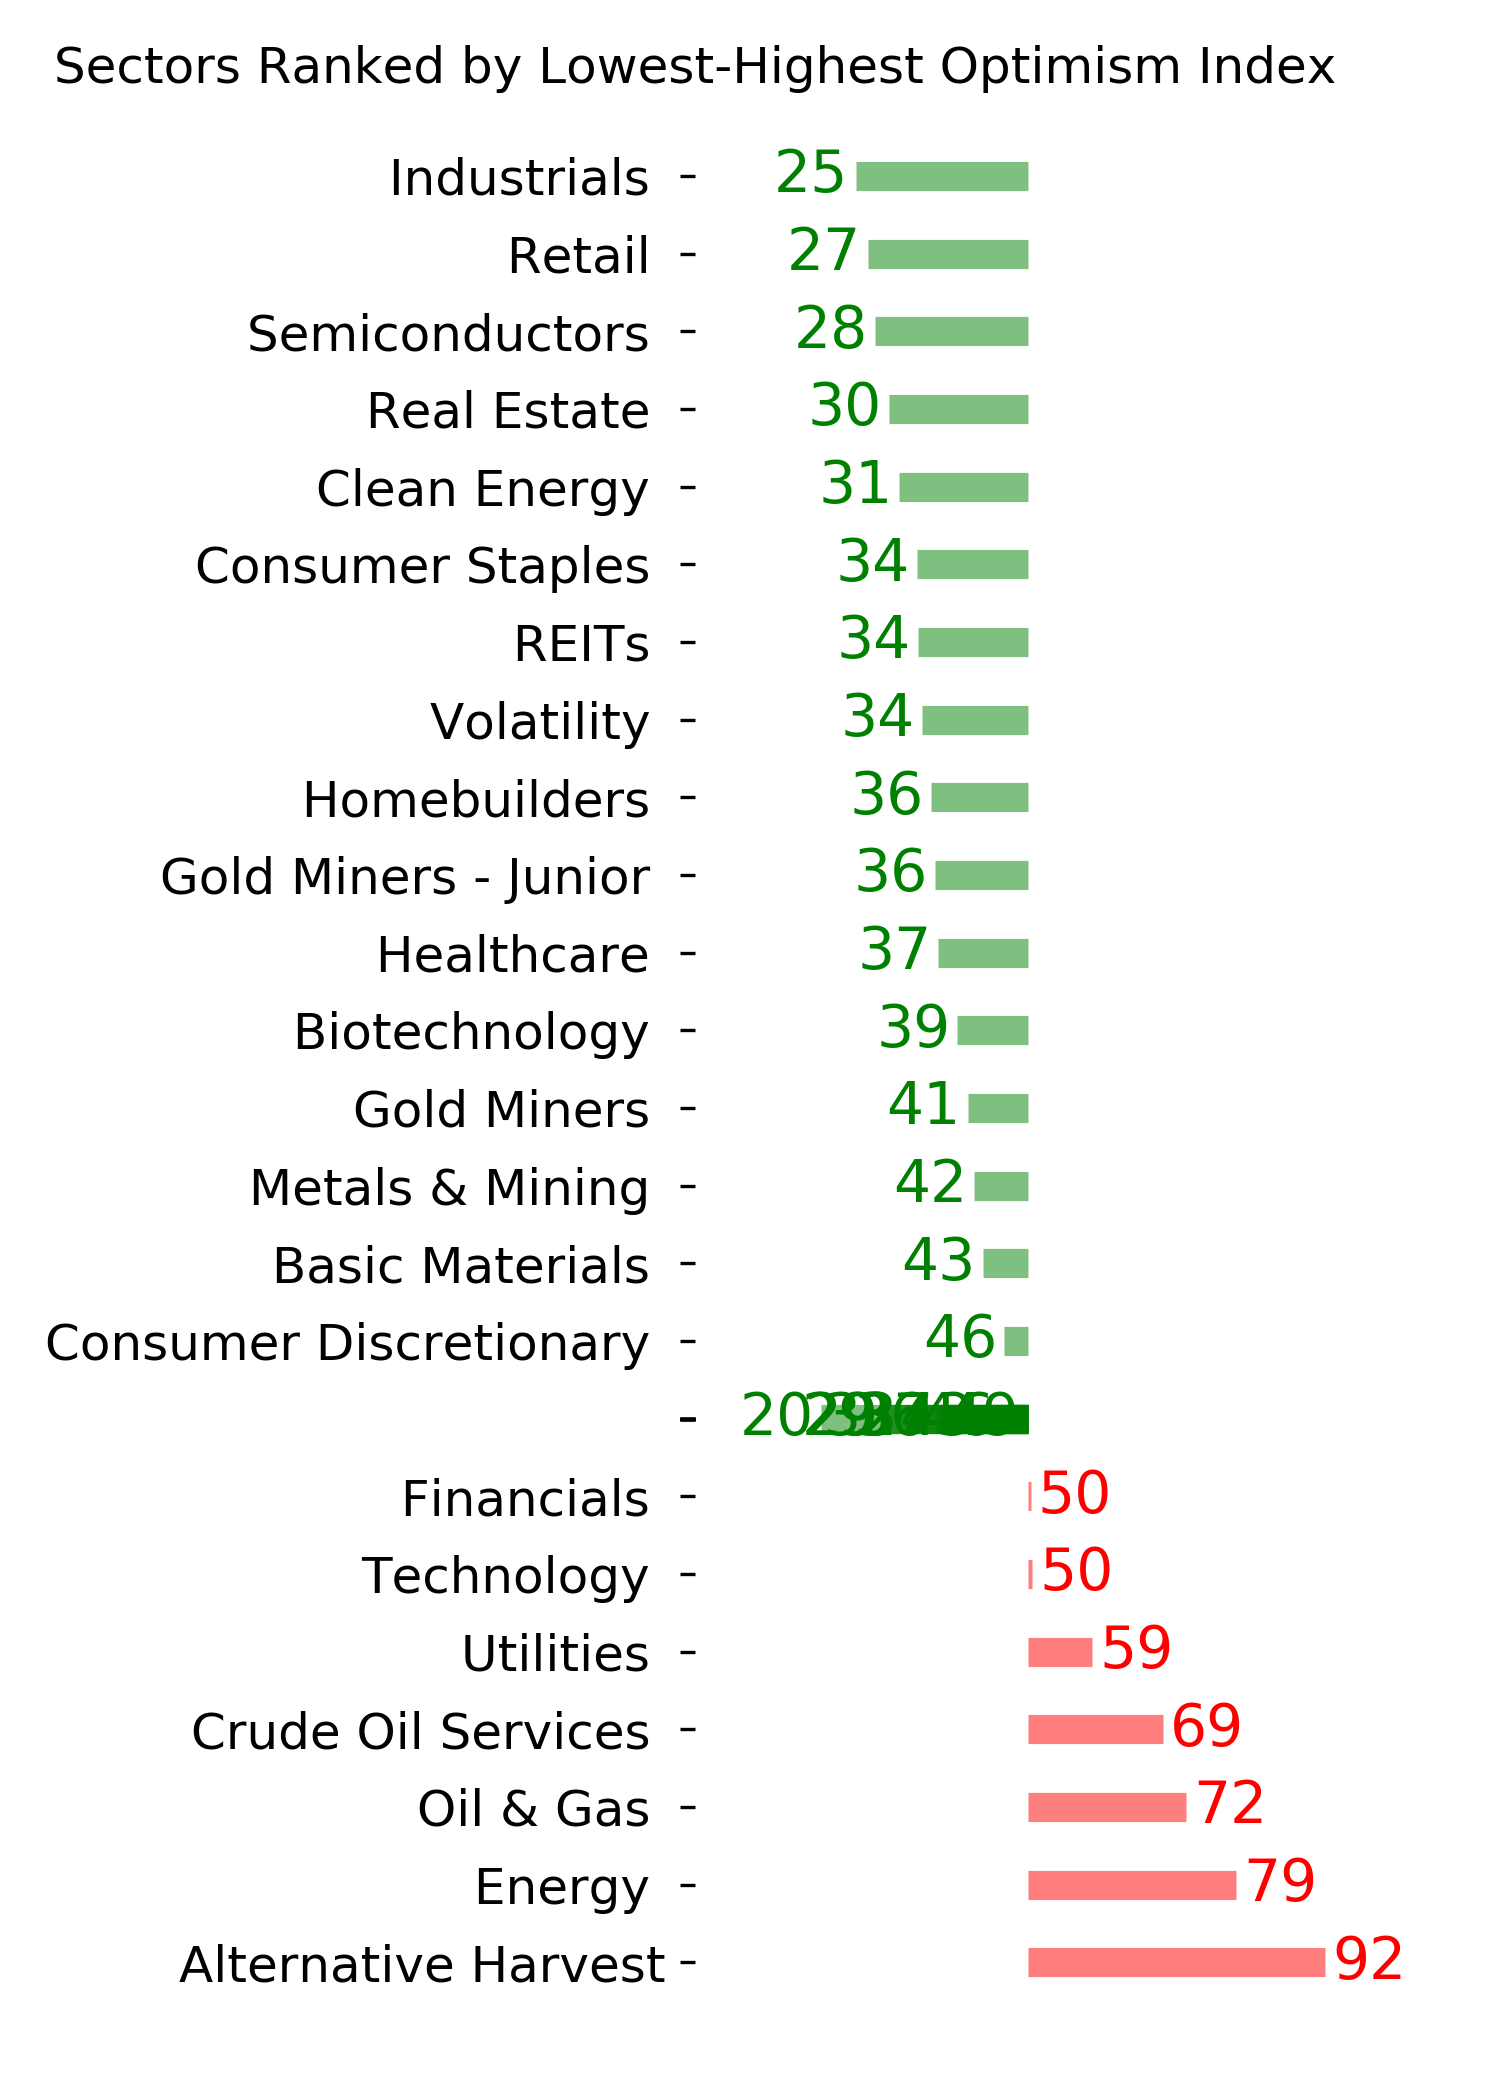
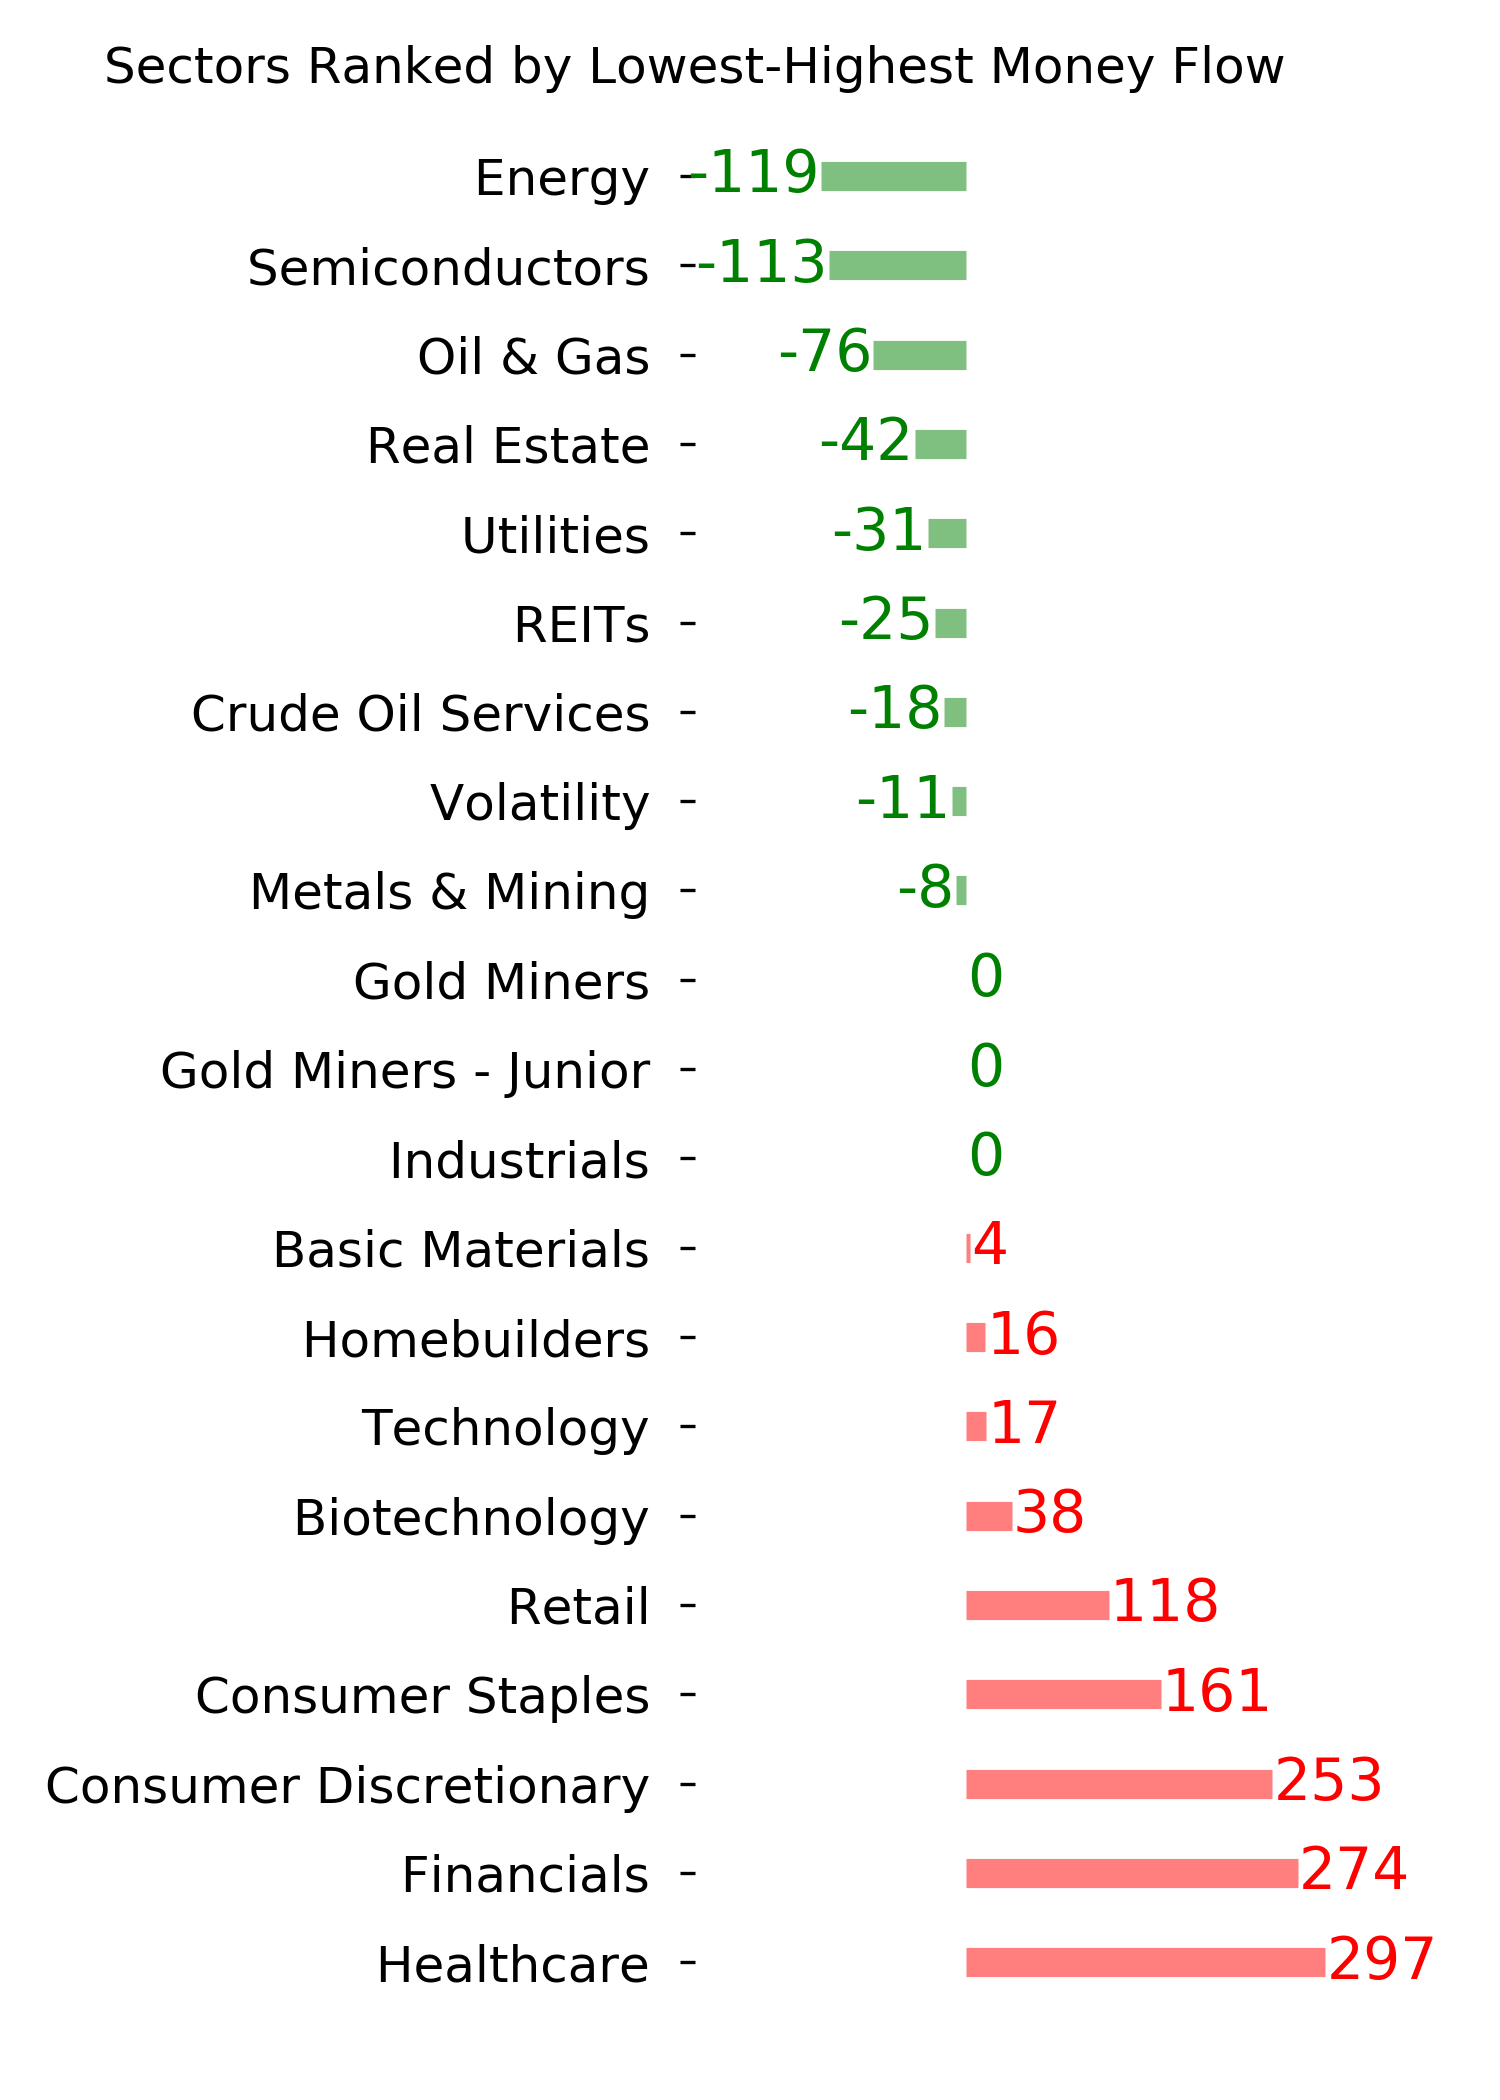
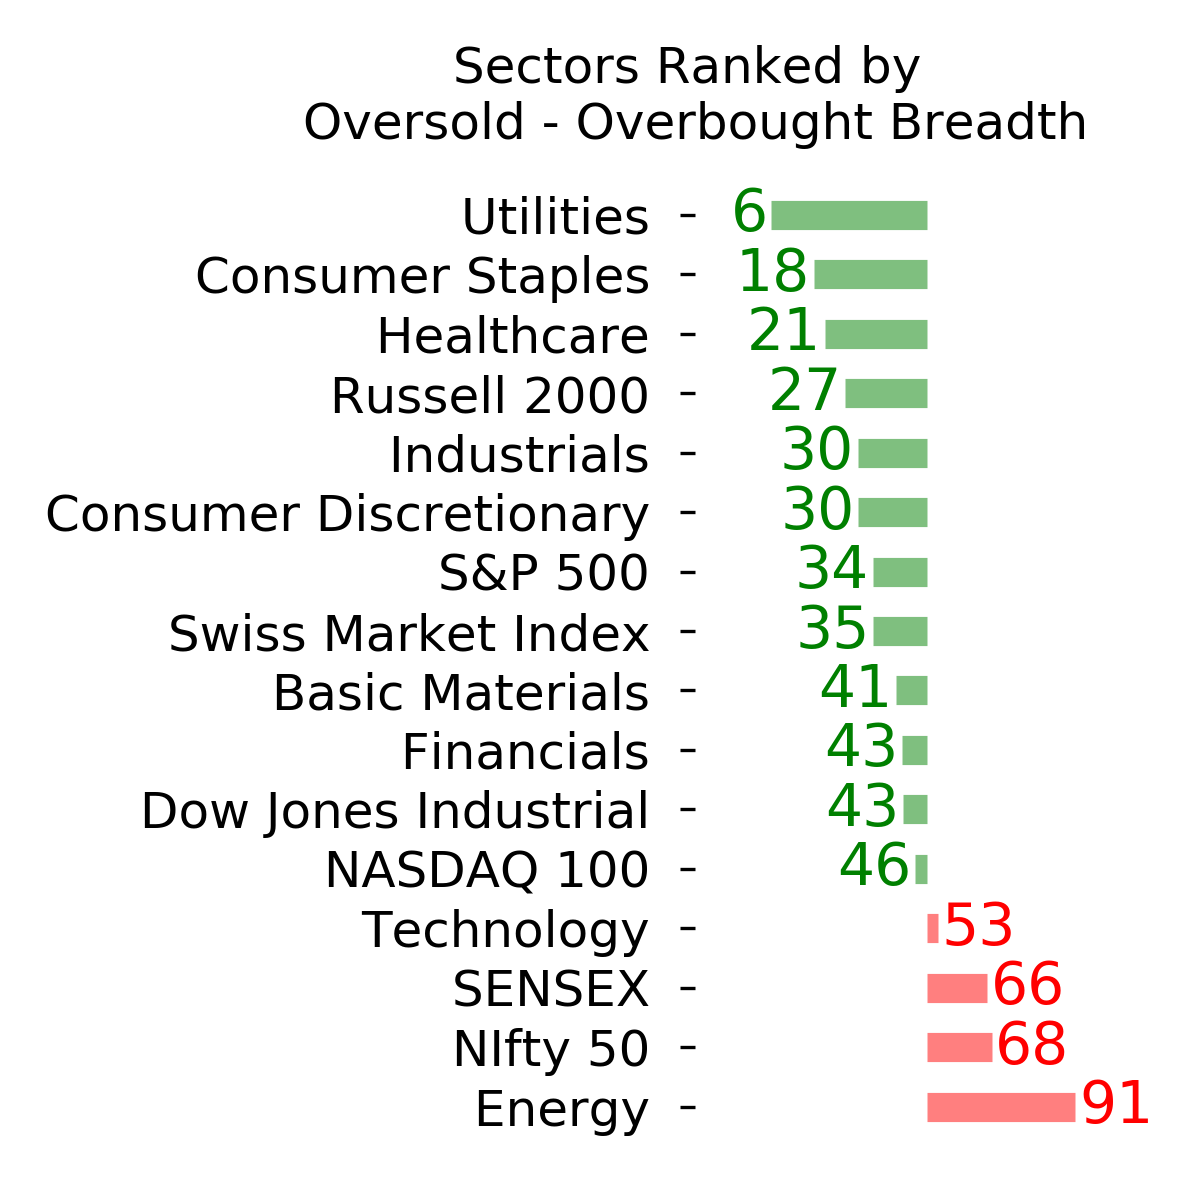
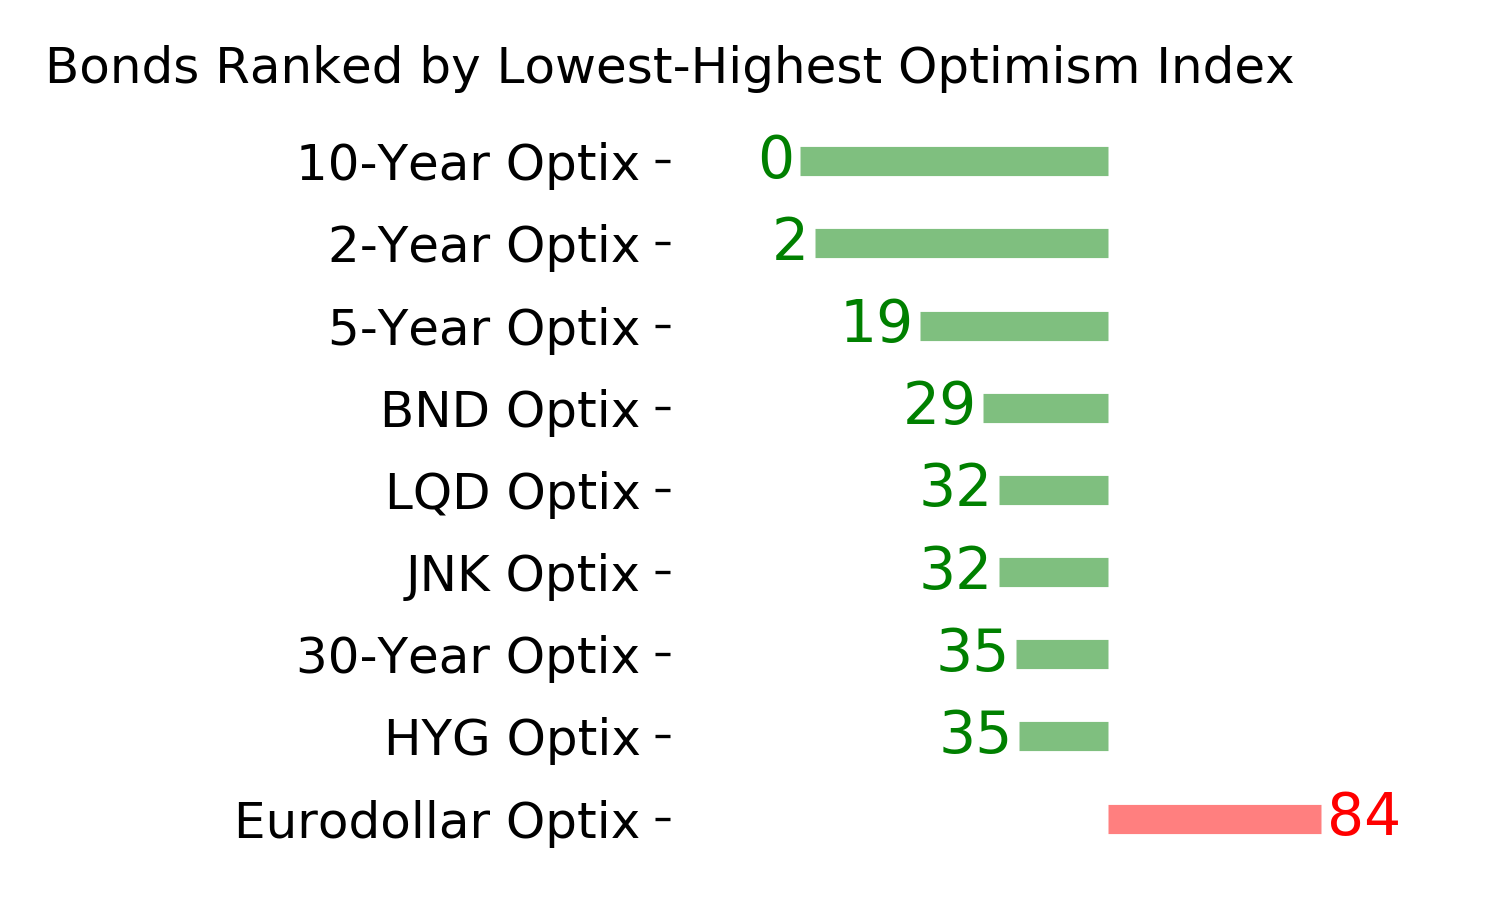
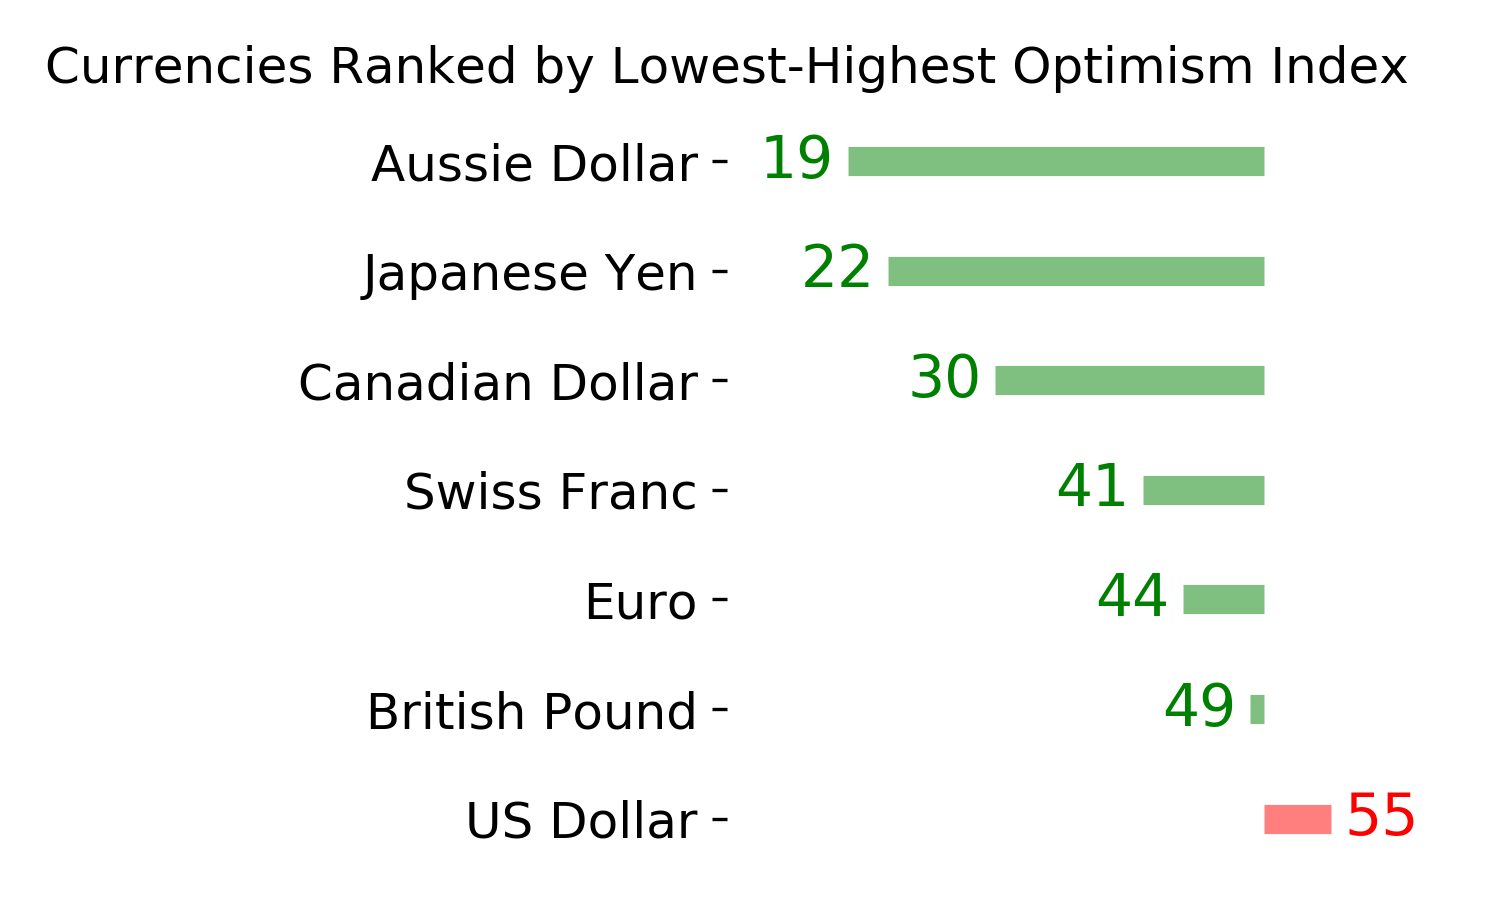
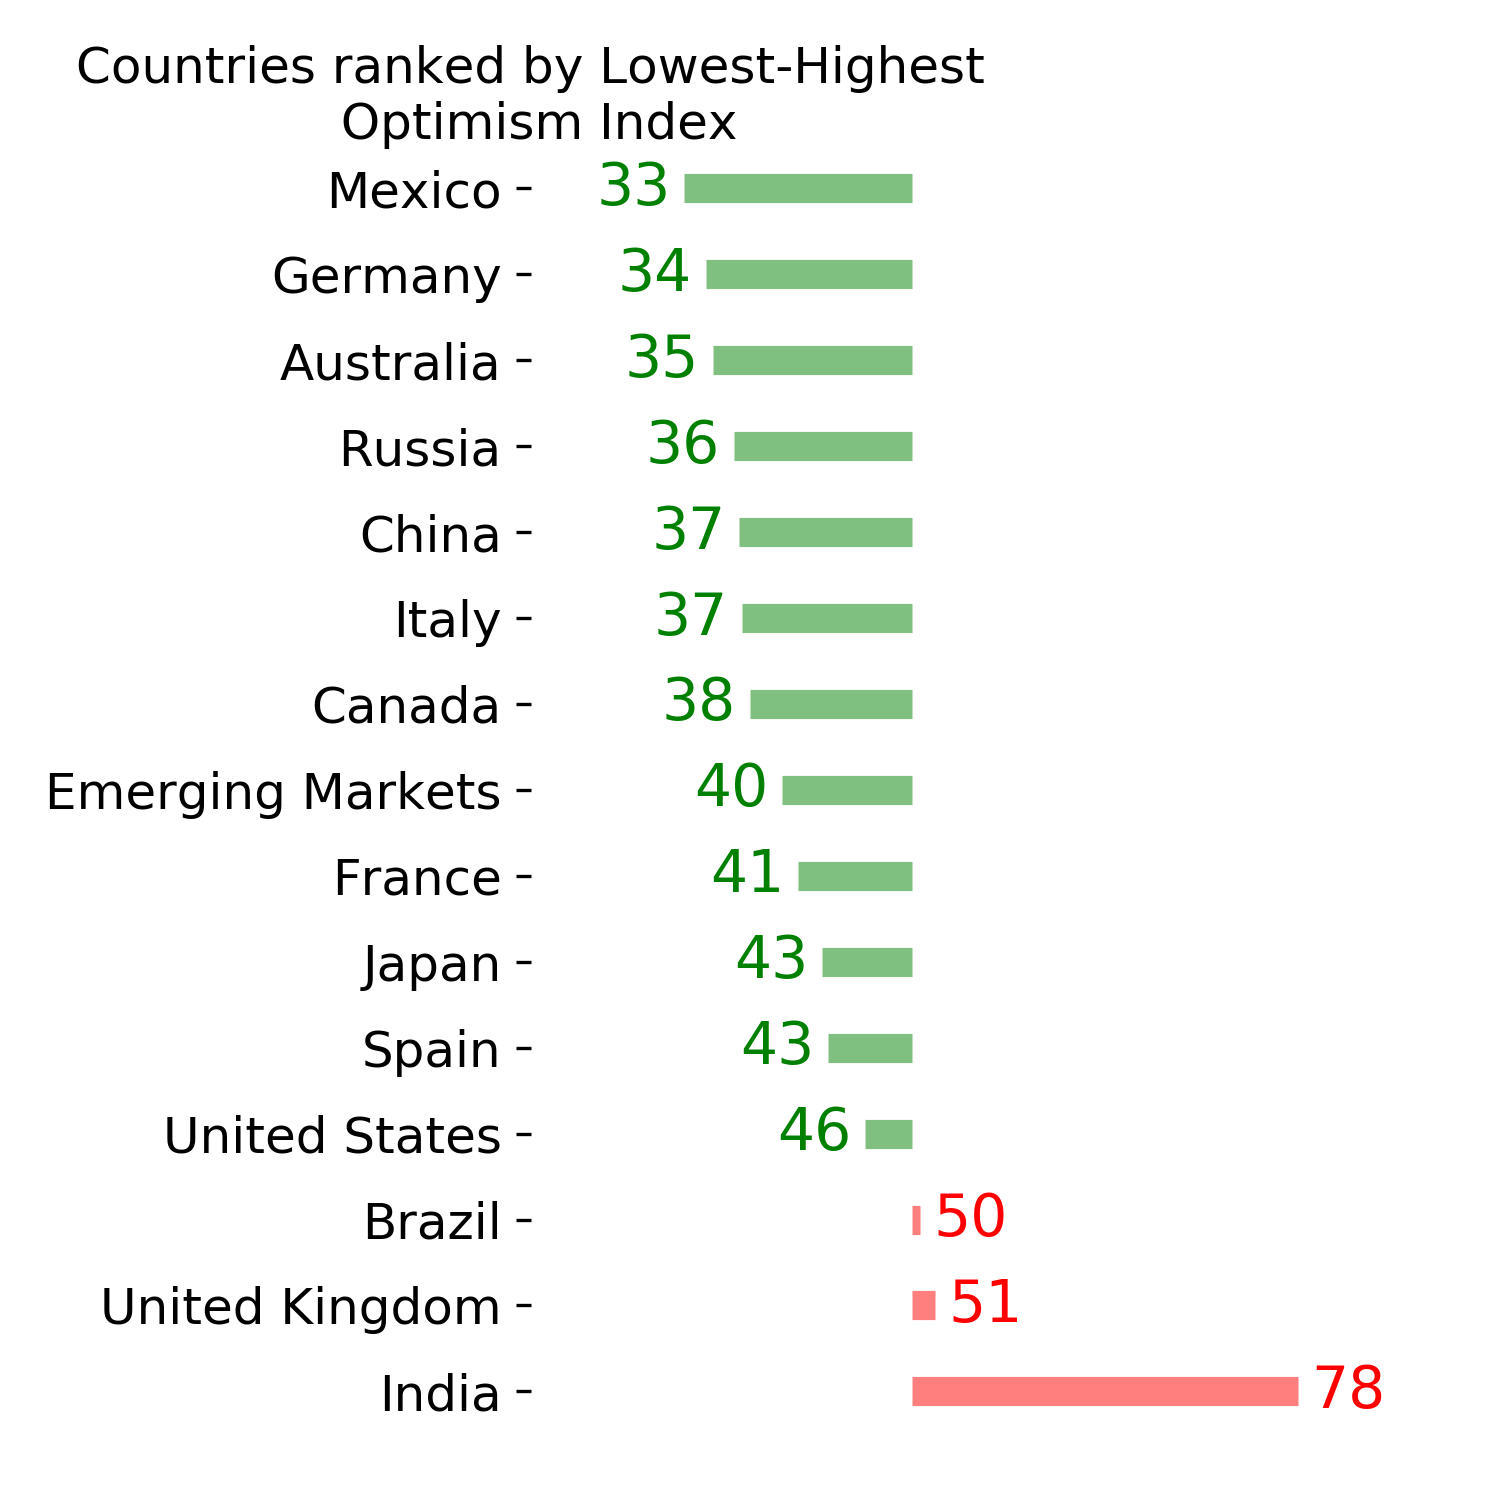
Ranks
|
|
|
|
|
|
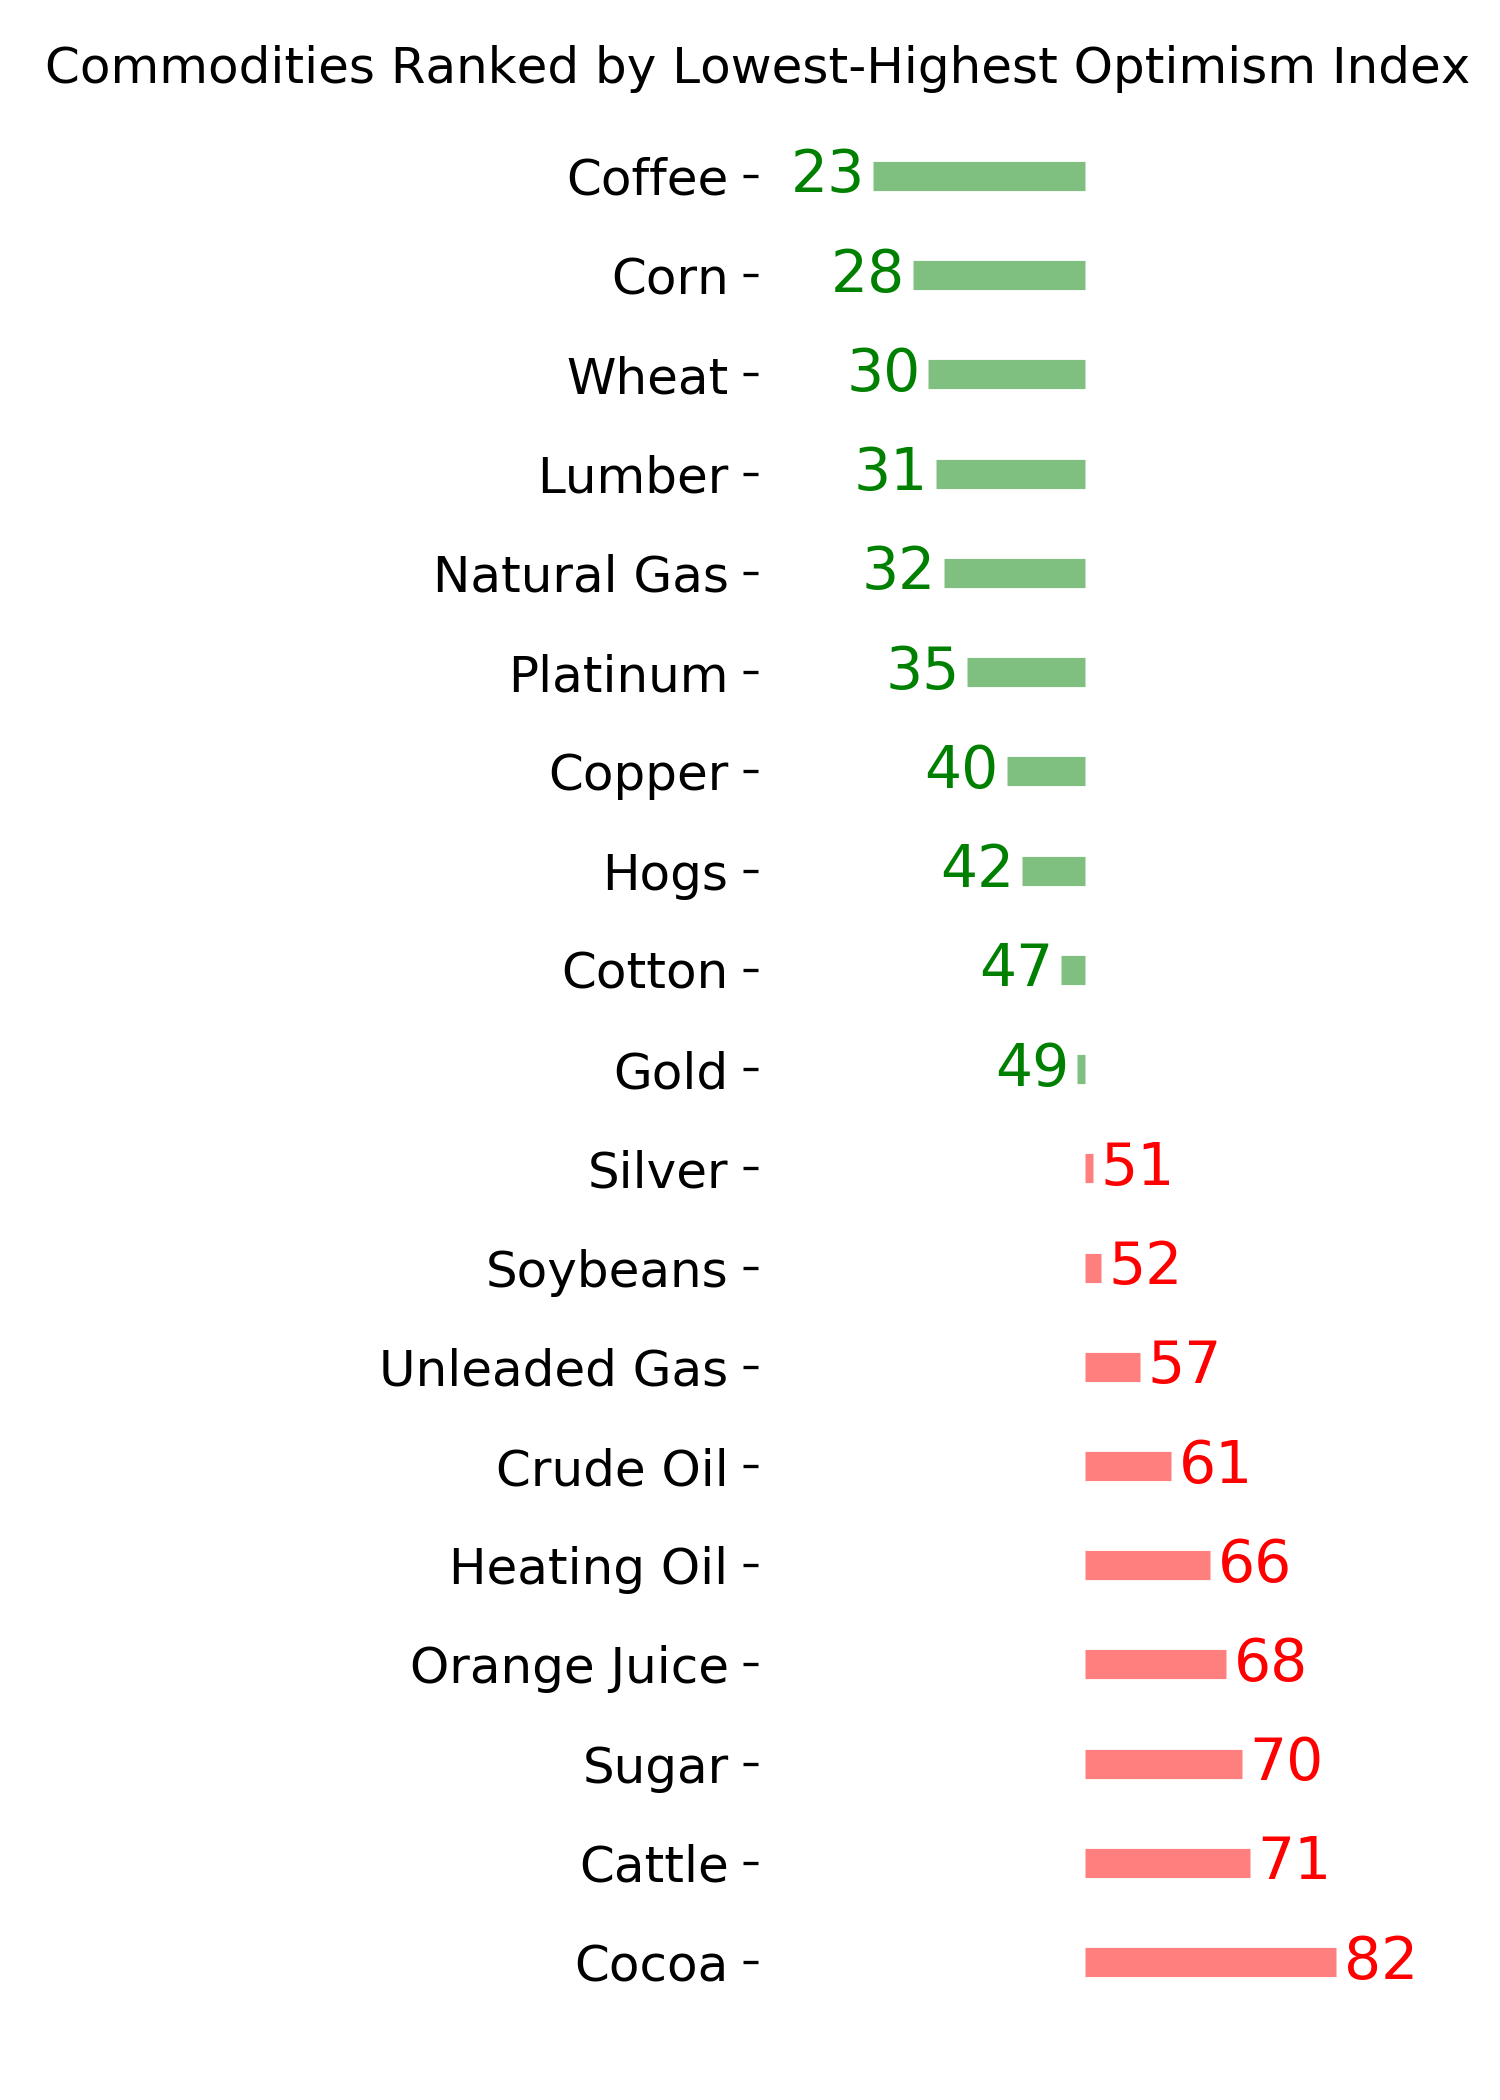
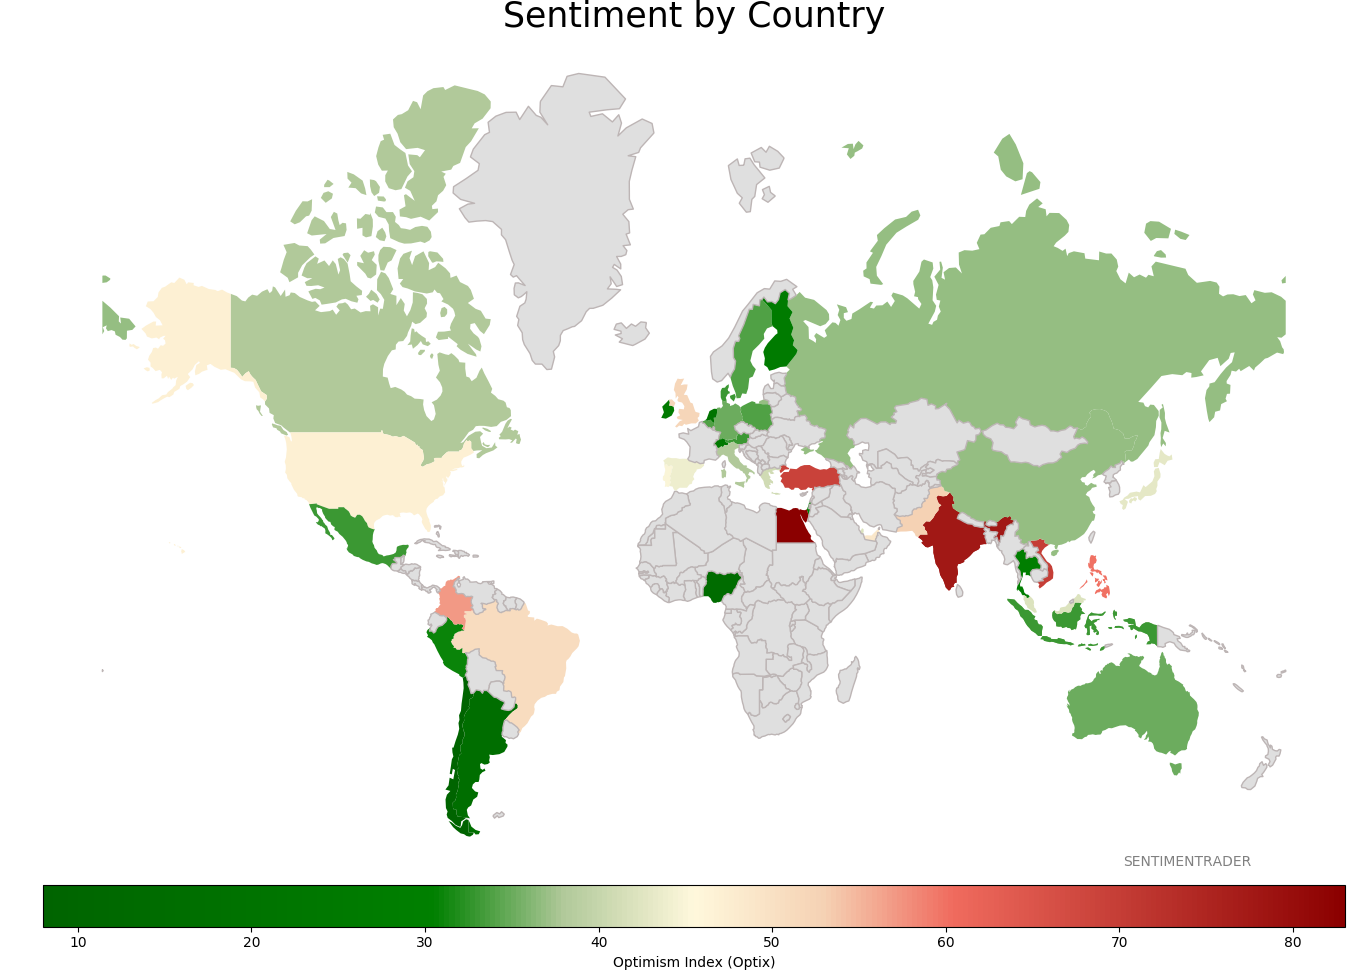
Sentiment Around The World
|
|
|
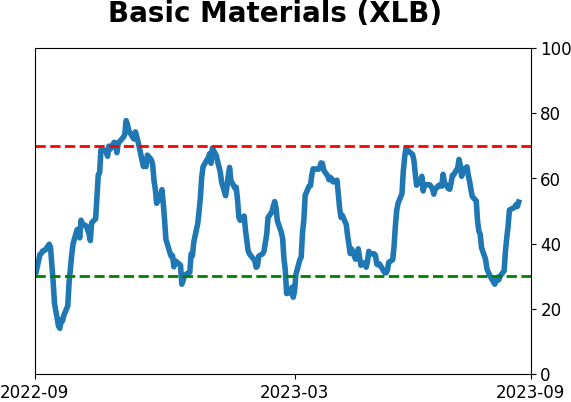
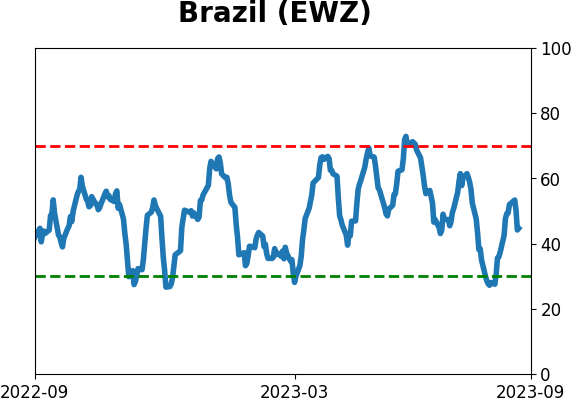
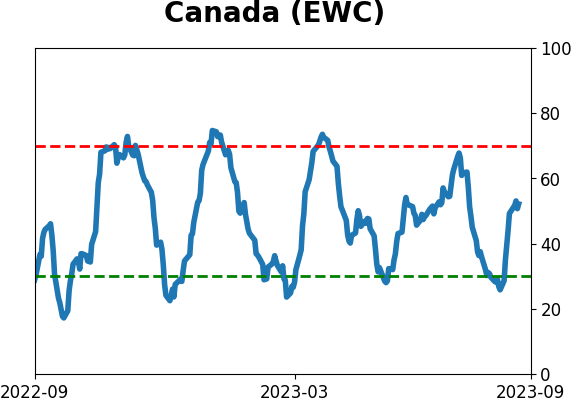
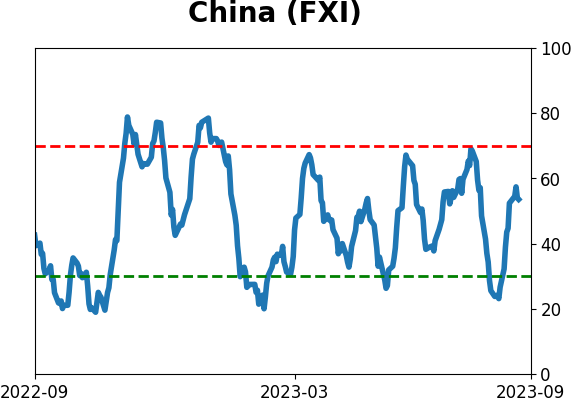
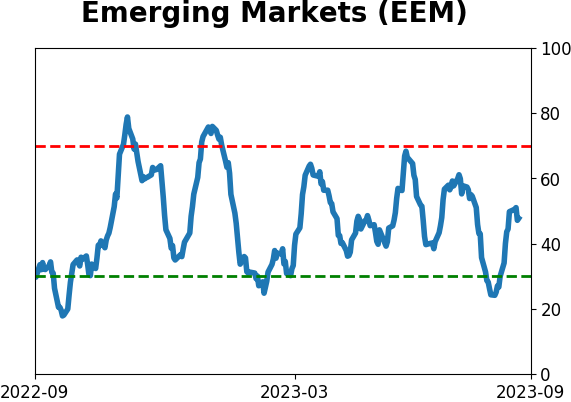
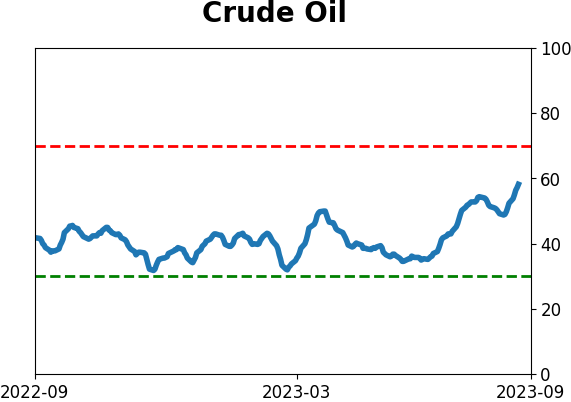
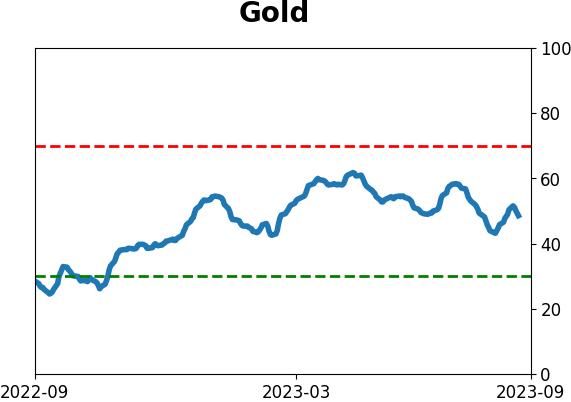
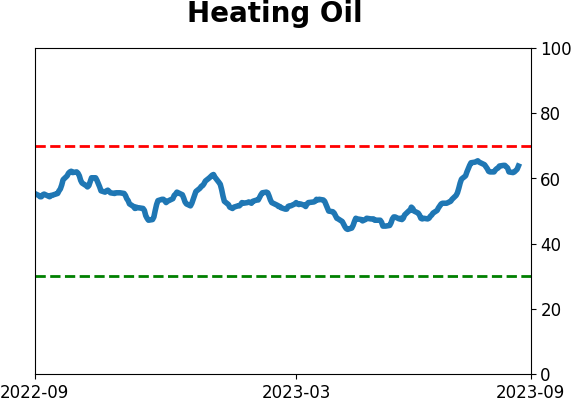
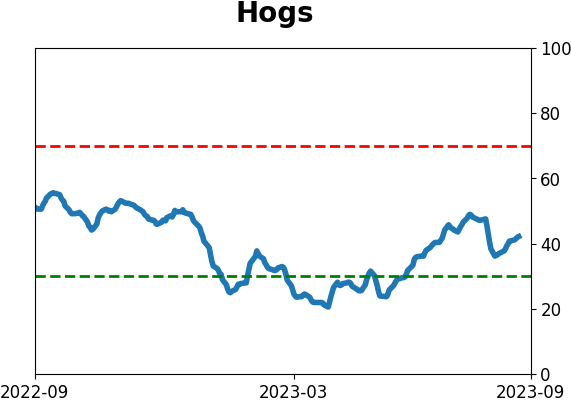
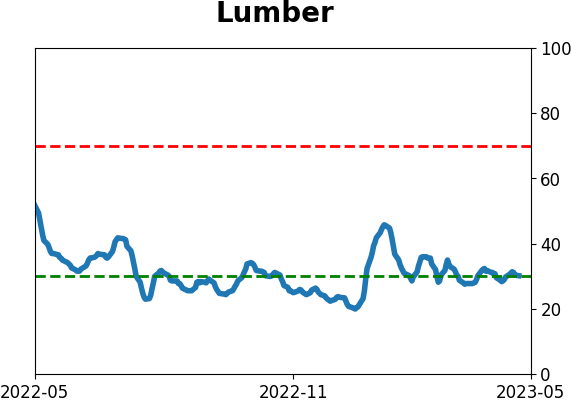
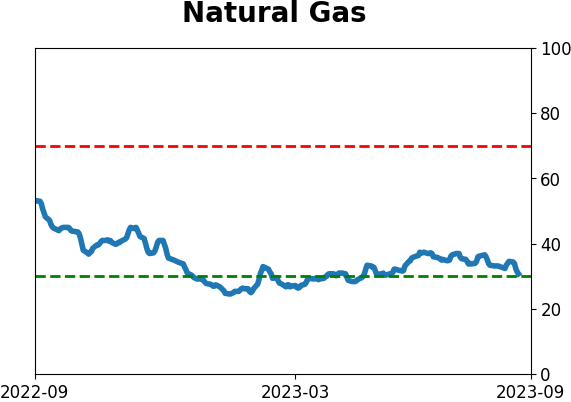
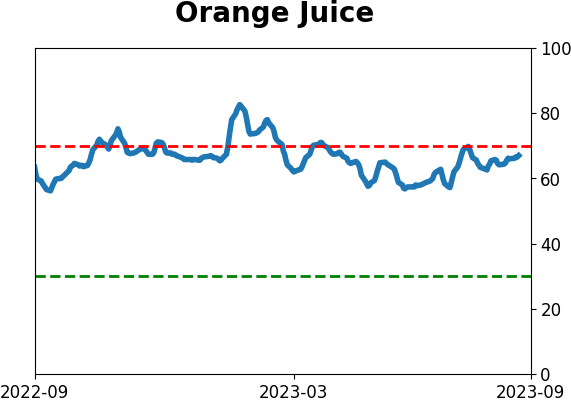
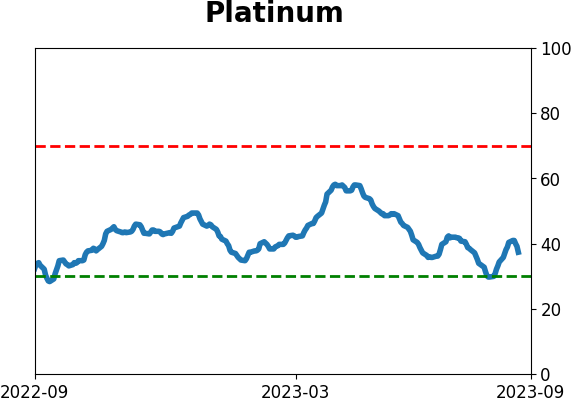
Optimism Index Thumbnails
|
|
|
|
|
|
|
|
|

|
|
|
|
|
|
|
|
|
|
|
|