Headlines
|
|
Once more to the utilities well:
Utilities have been a dismal performer in 2023. Trying to pick a bottom is an exercise fraught with peril. That said, a sizeable contingent of indicators suggests that investors and traders keep their eyes (and minds) open to the possibility of significantly better days ahead.
|
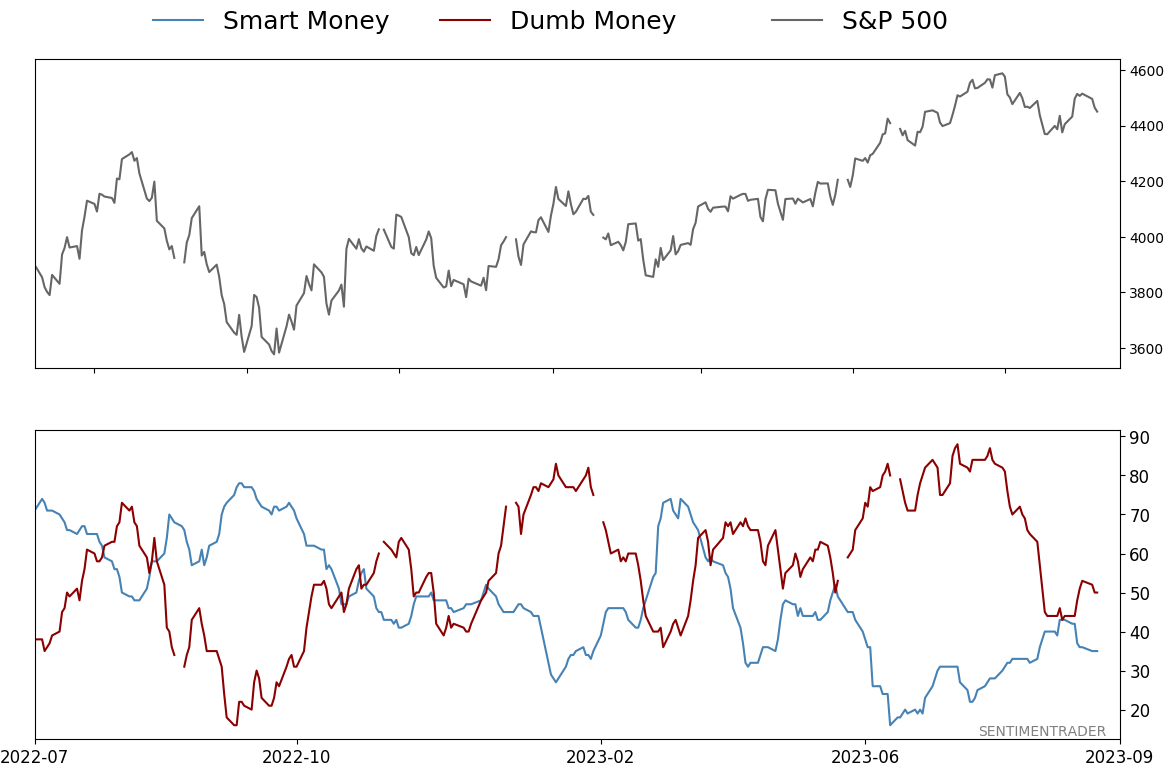
Smart / Dumb Money Confidence
|
Smart Money Confidence: 35%
Dumb Money Confidence: 50%
|
|
Risk Levels
Stocks Short-Term
|
Stocks Medium-Term
|
|
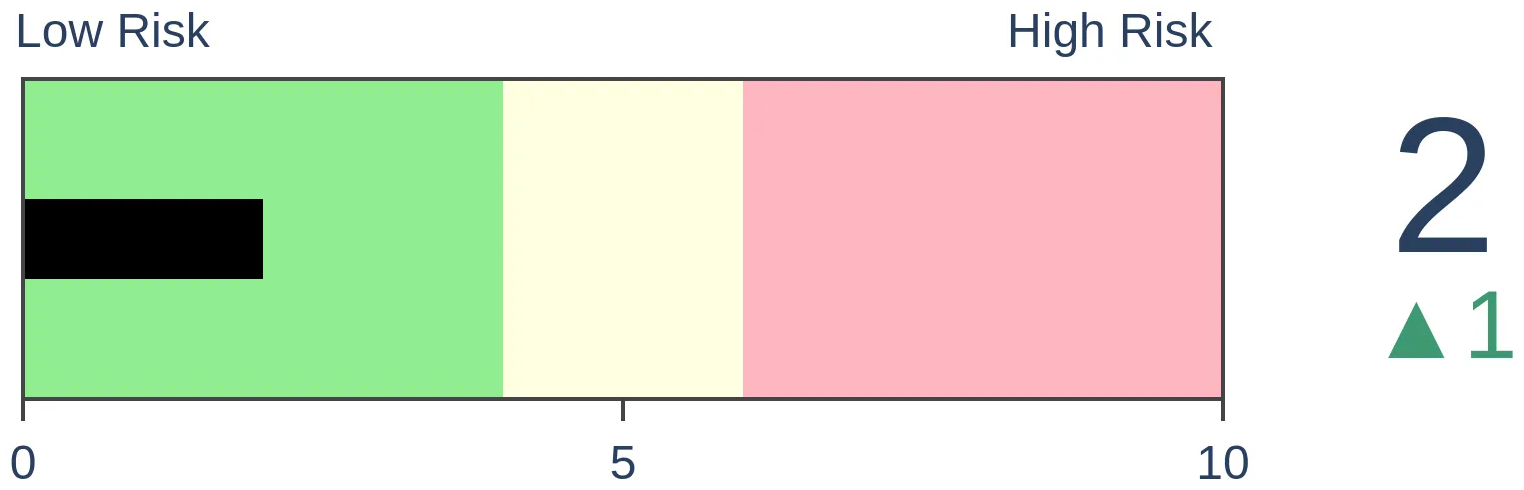
Bonds
|
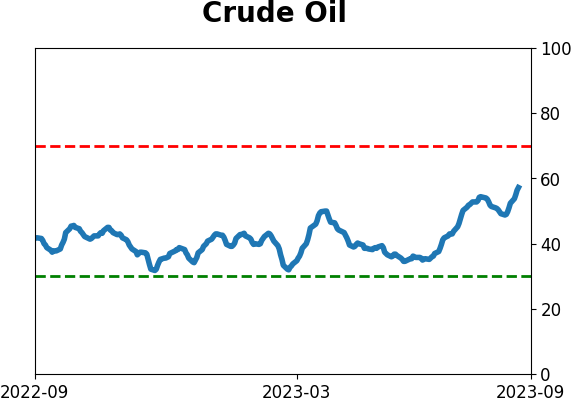
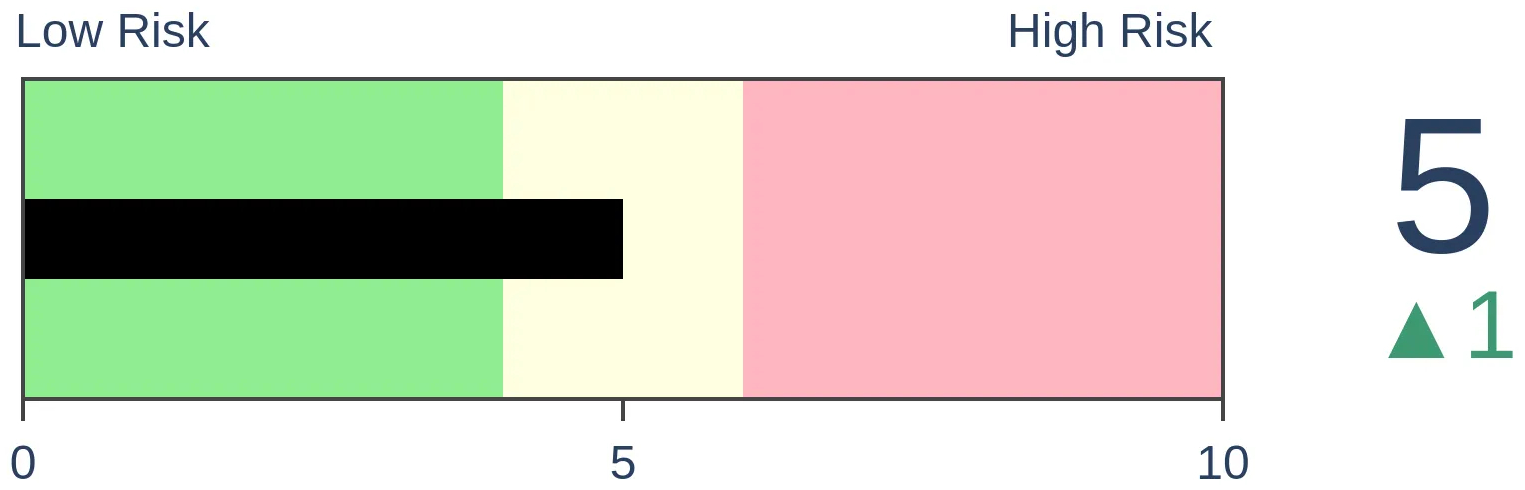
Crude Oil
|
|
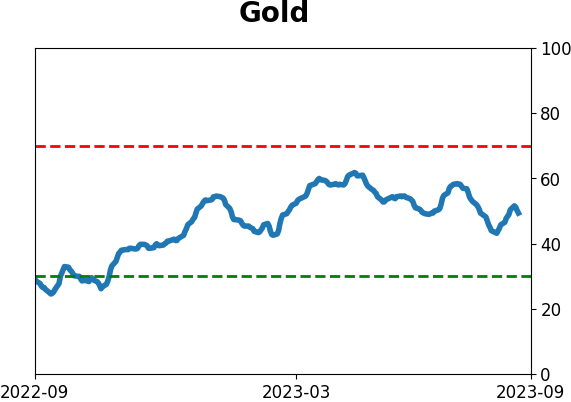
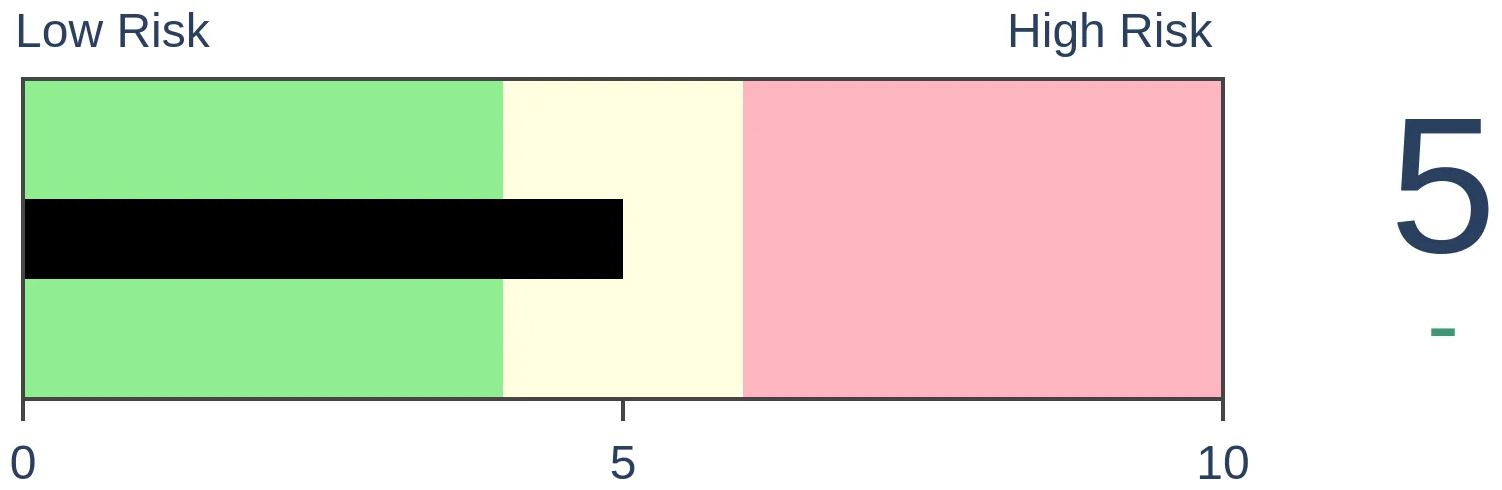
Gold

|
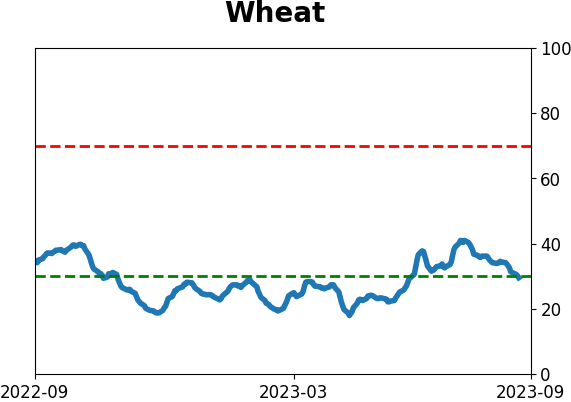
Agriculture

|
|
Research
By Jay Kaeppel
BOTTOM LINE
Utilities have been a dismal performer in 2023. Trying to pick a bottom is an exercise fraught with peril. That said, a sizeable contingent of indicators suggests that investors and traders keep their eyes (and minds) open to the possibility of significantly better days ahead.
FORECAST / TIMEFRAME
None
|
Key points
- Utilities have been a dog so far in 2023
- A bevy of potential positive signs in mid-June was followed by more weakness
- Could the outlook finally be improving for utilities?
Utilities have been a significant laggard in 2023
In this article dated 2023-06-12, I highlighted a variety of indicators that were flashing potentially favorable signals for the utility sector. They turned out to be a dud. Since that piece was published, the Utilities Select Sector SPDR Fund (ticker XLU) has declined another -6.7%, while the S&P 500 has gained +2.9%.
So, should utility investors throw in the towel? Another round of indicators suggests the answer is "No" (There he goes again). In addition, the signals highlighted in the article linked above (tests can be run here, here, and here) remain bullish into June 2024.
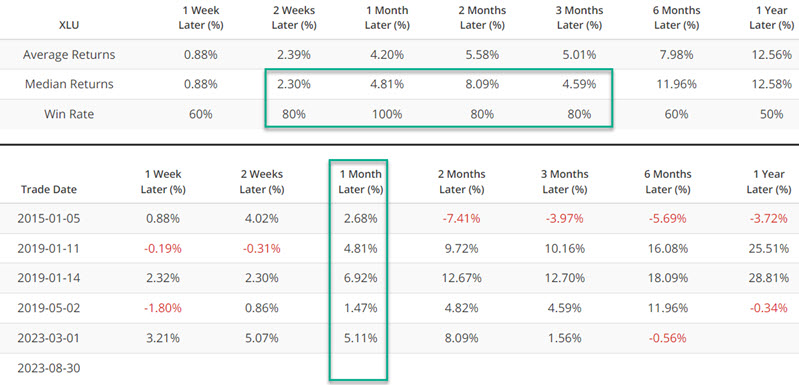
XLU 12-Week Low % spikes to a significant level
As the name implies, the XLU 12-Week Low % indicator shows the percentage of stocks in that exchange-traded fund currently trading at a 12-week low.
The chart below displays all the days when this indicator stood above 90%.
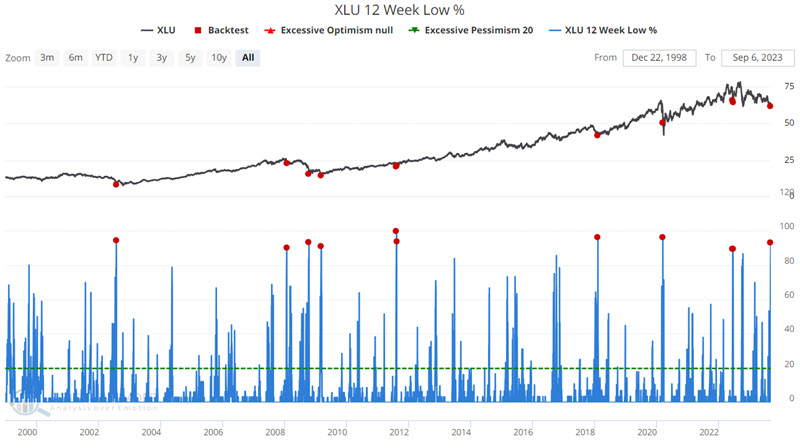
The tables below summarize XLU's performance following these days.
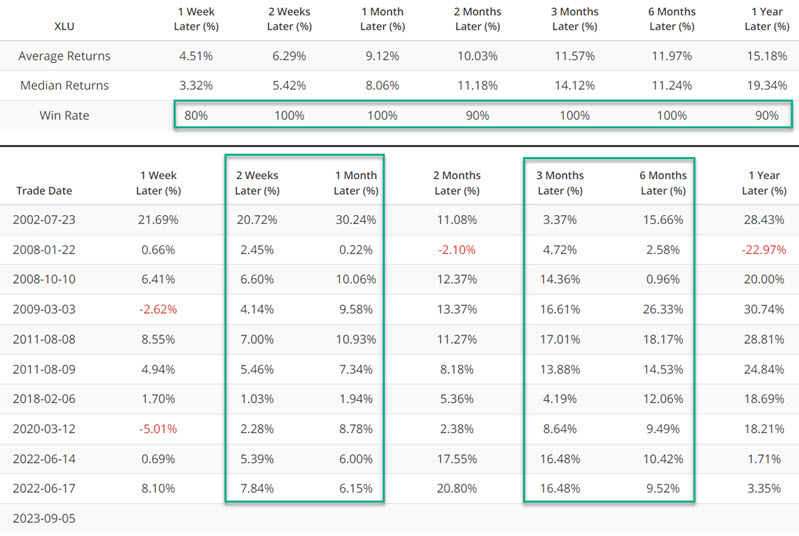
The latest favorable signal occurred on 2023-09-05. The good news is that historical results have been highly favorable. The bad news is that historical results do not guarantee that this latest signal will follow suit. Nevertheless, it certainly falls on the favorable side of the ledger.
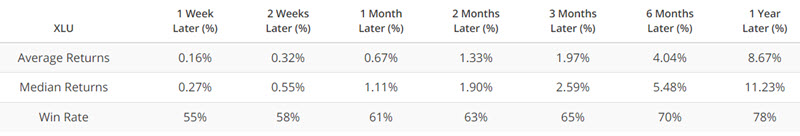
XLU put/call ratio spike argues for a near-term bounce
Our XLU Aggregated Put/Call Ratio indicator recently spiked above 3.0, an infrequent occurrence. The chart below displays all the days when this indicator was above 3.0.
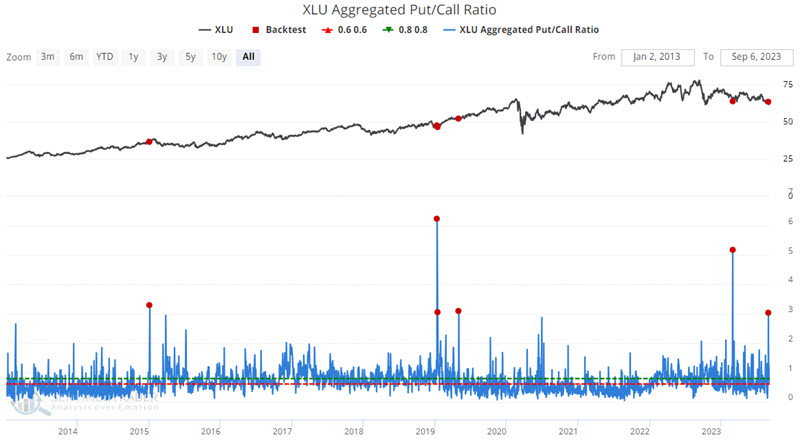
The tables below summarize XLU's performance following these days.
The most recent signal occurred on 2023-08-30. The bad news is the minuscule sample size and the so-so results for six and twelve months. The good news is the high Win Rates and robust median returns for two weeks to 2 months.
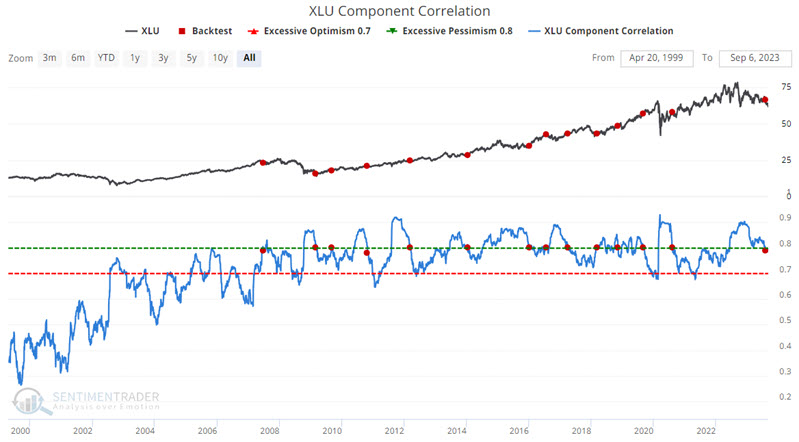
XLU Component Correlation flashes a hidden signal
This indicator shows the correlation among member stocks in the index. Typically, higher numbers occur during a sell-off, when investors indiscriminately dump stocks within a given sector. So, in theory, the higher the reading, the more favorable the implication. However, another interesting application involves waiting for the XLU Component Correlation indicator to decline from a high level.
For reference, the Average and Median Returns and Win Rates for ALL days since XLU started trading appear in the table below.
The chart below displays those times when the XLU Component Correlation indicator crossed below 0.80 for the first time in six months.
The table below displays XLU performance following the signals shown in the chart above.
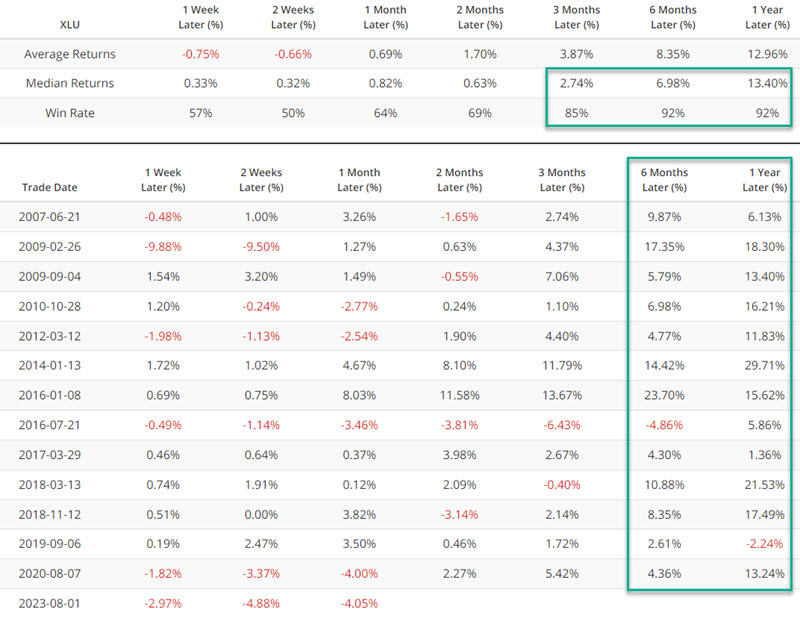
The key things to note are the high Win Rates for 3 to 12 months and the exceptional 12-month returns. The most recent signal occurred on 2023-08-01 and was followed by a brutal month, with XLU down over -4%. However, 1-week to 2-month returns have historically been pretty mixed anyway. The bulk of historical returns have occurred after the 2-month mark.
One more factor to consider: Valuation
Utility stocks appear to be undervalued relative to the overall market. The chart below (Courtesy of Austin Rogers and Brookfield Insight) displays the spread between utility sector valuations and that of the S&P 500 Index. The utility sector is presently in "deeply undervalued" territory.
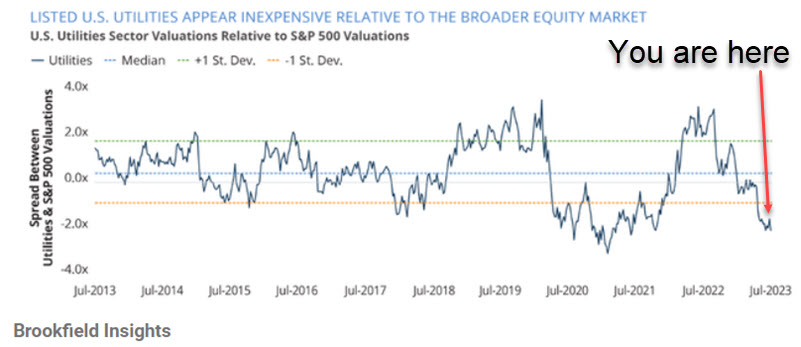
Valuation is best used as a "perspective" tool, not a market timing tool. So, the fact that utilities are relatively cheap does not guarantee an imminent rally. However, it suggests the potential for outperformance in the year ahead.
What the research tells us…
So, will the utility sector finally show some signs of life? They have been in a freefall of late, and buying the weakest sector is generally an exercise fraught with peril. Likewise, the combination of signals highlighted in June produced nothing, and seasonality is unfavorable for the utility sector into mid-October. So perhaps there is no hurry to climb aboard. That said, the indicator signals highlighted above and in the earlier article suggest the potential for a meaningful rebound. Dividend and defensive investors should watch the utility sector closely for new opportunities.
Indicators at Extremes
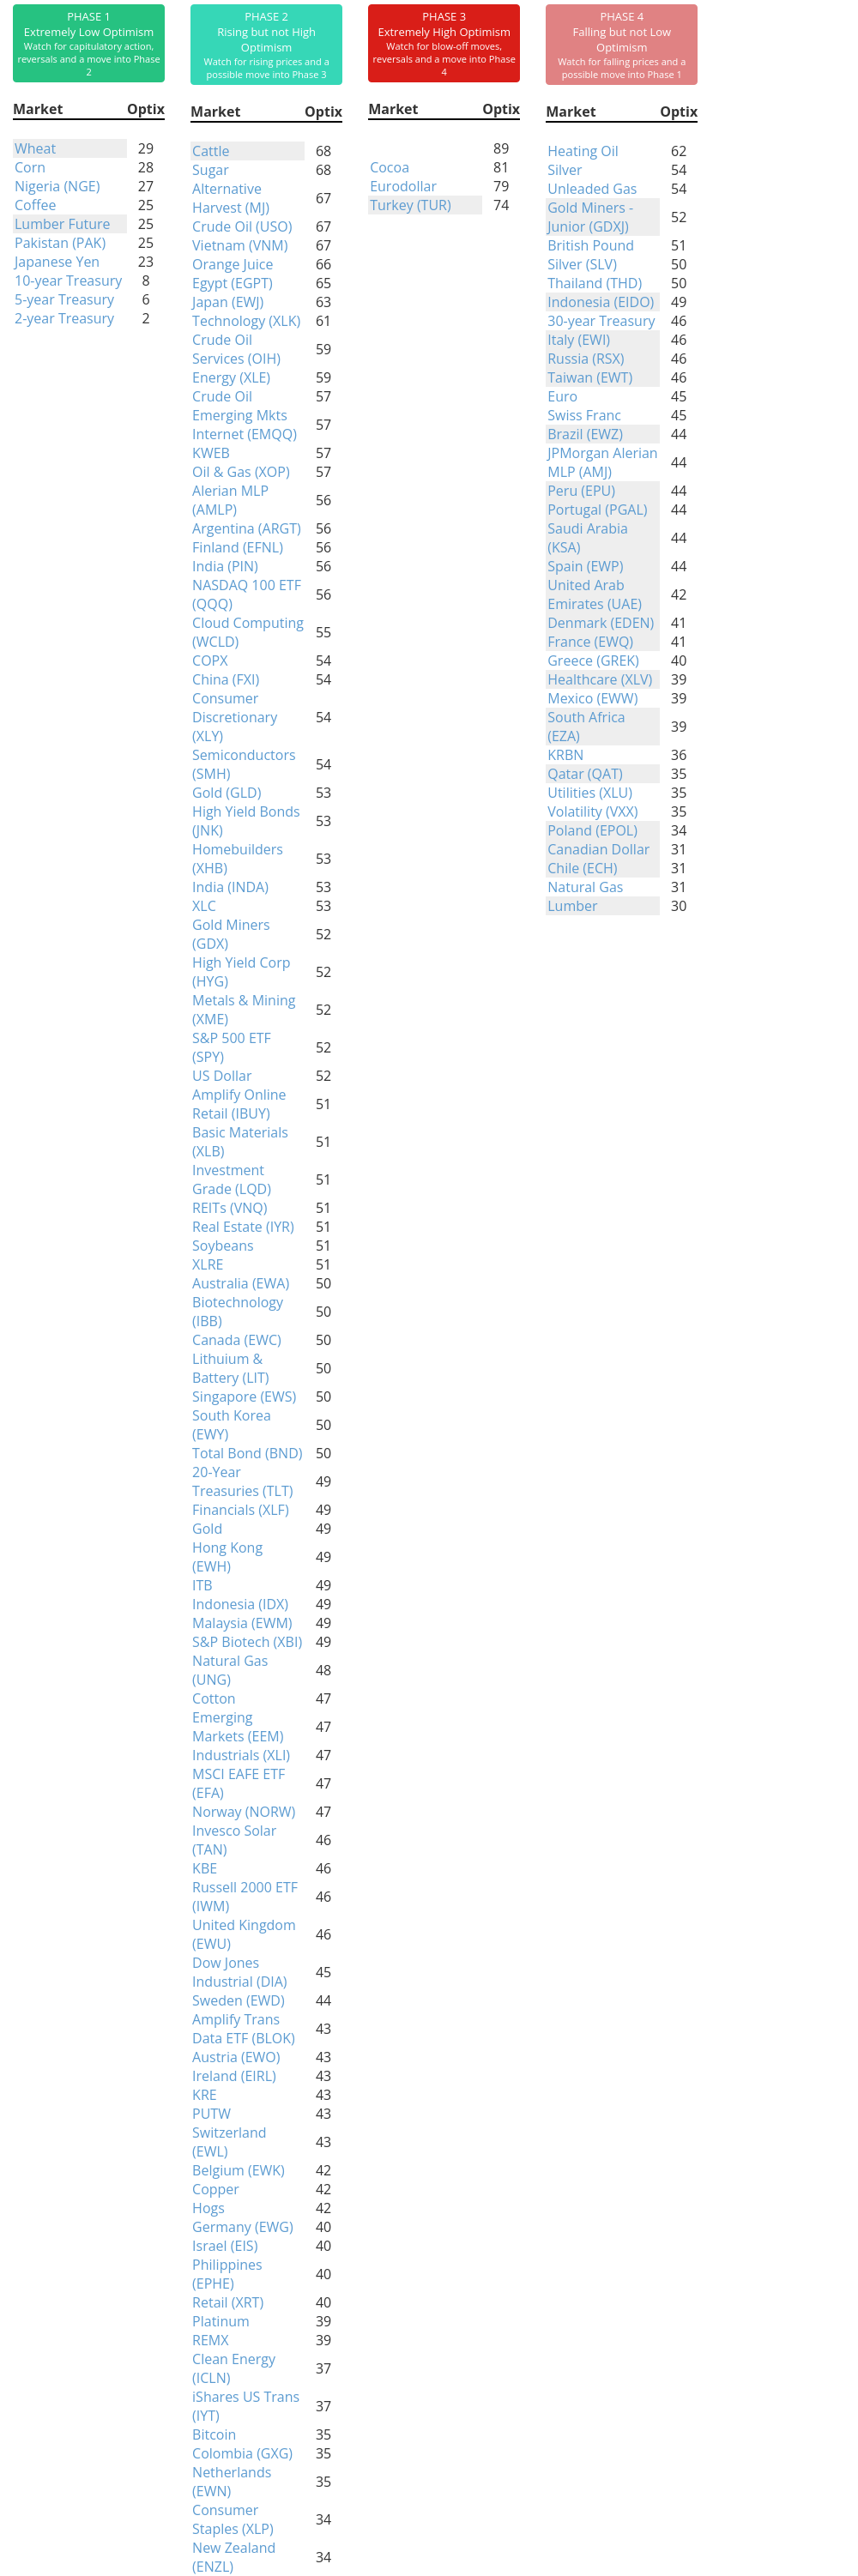
Phase Table
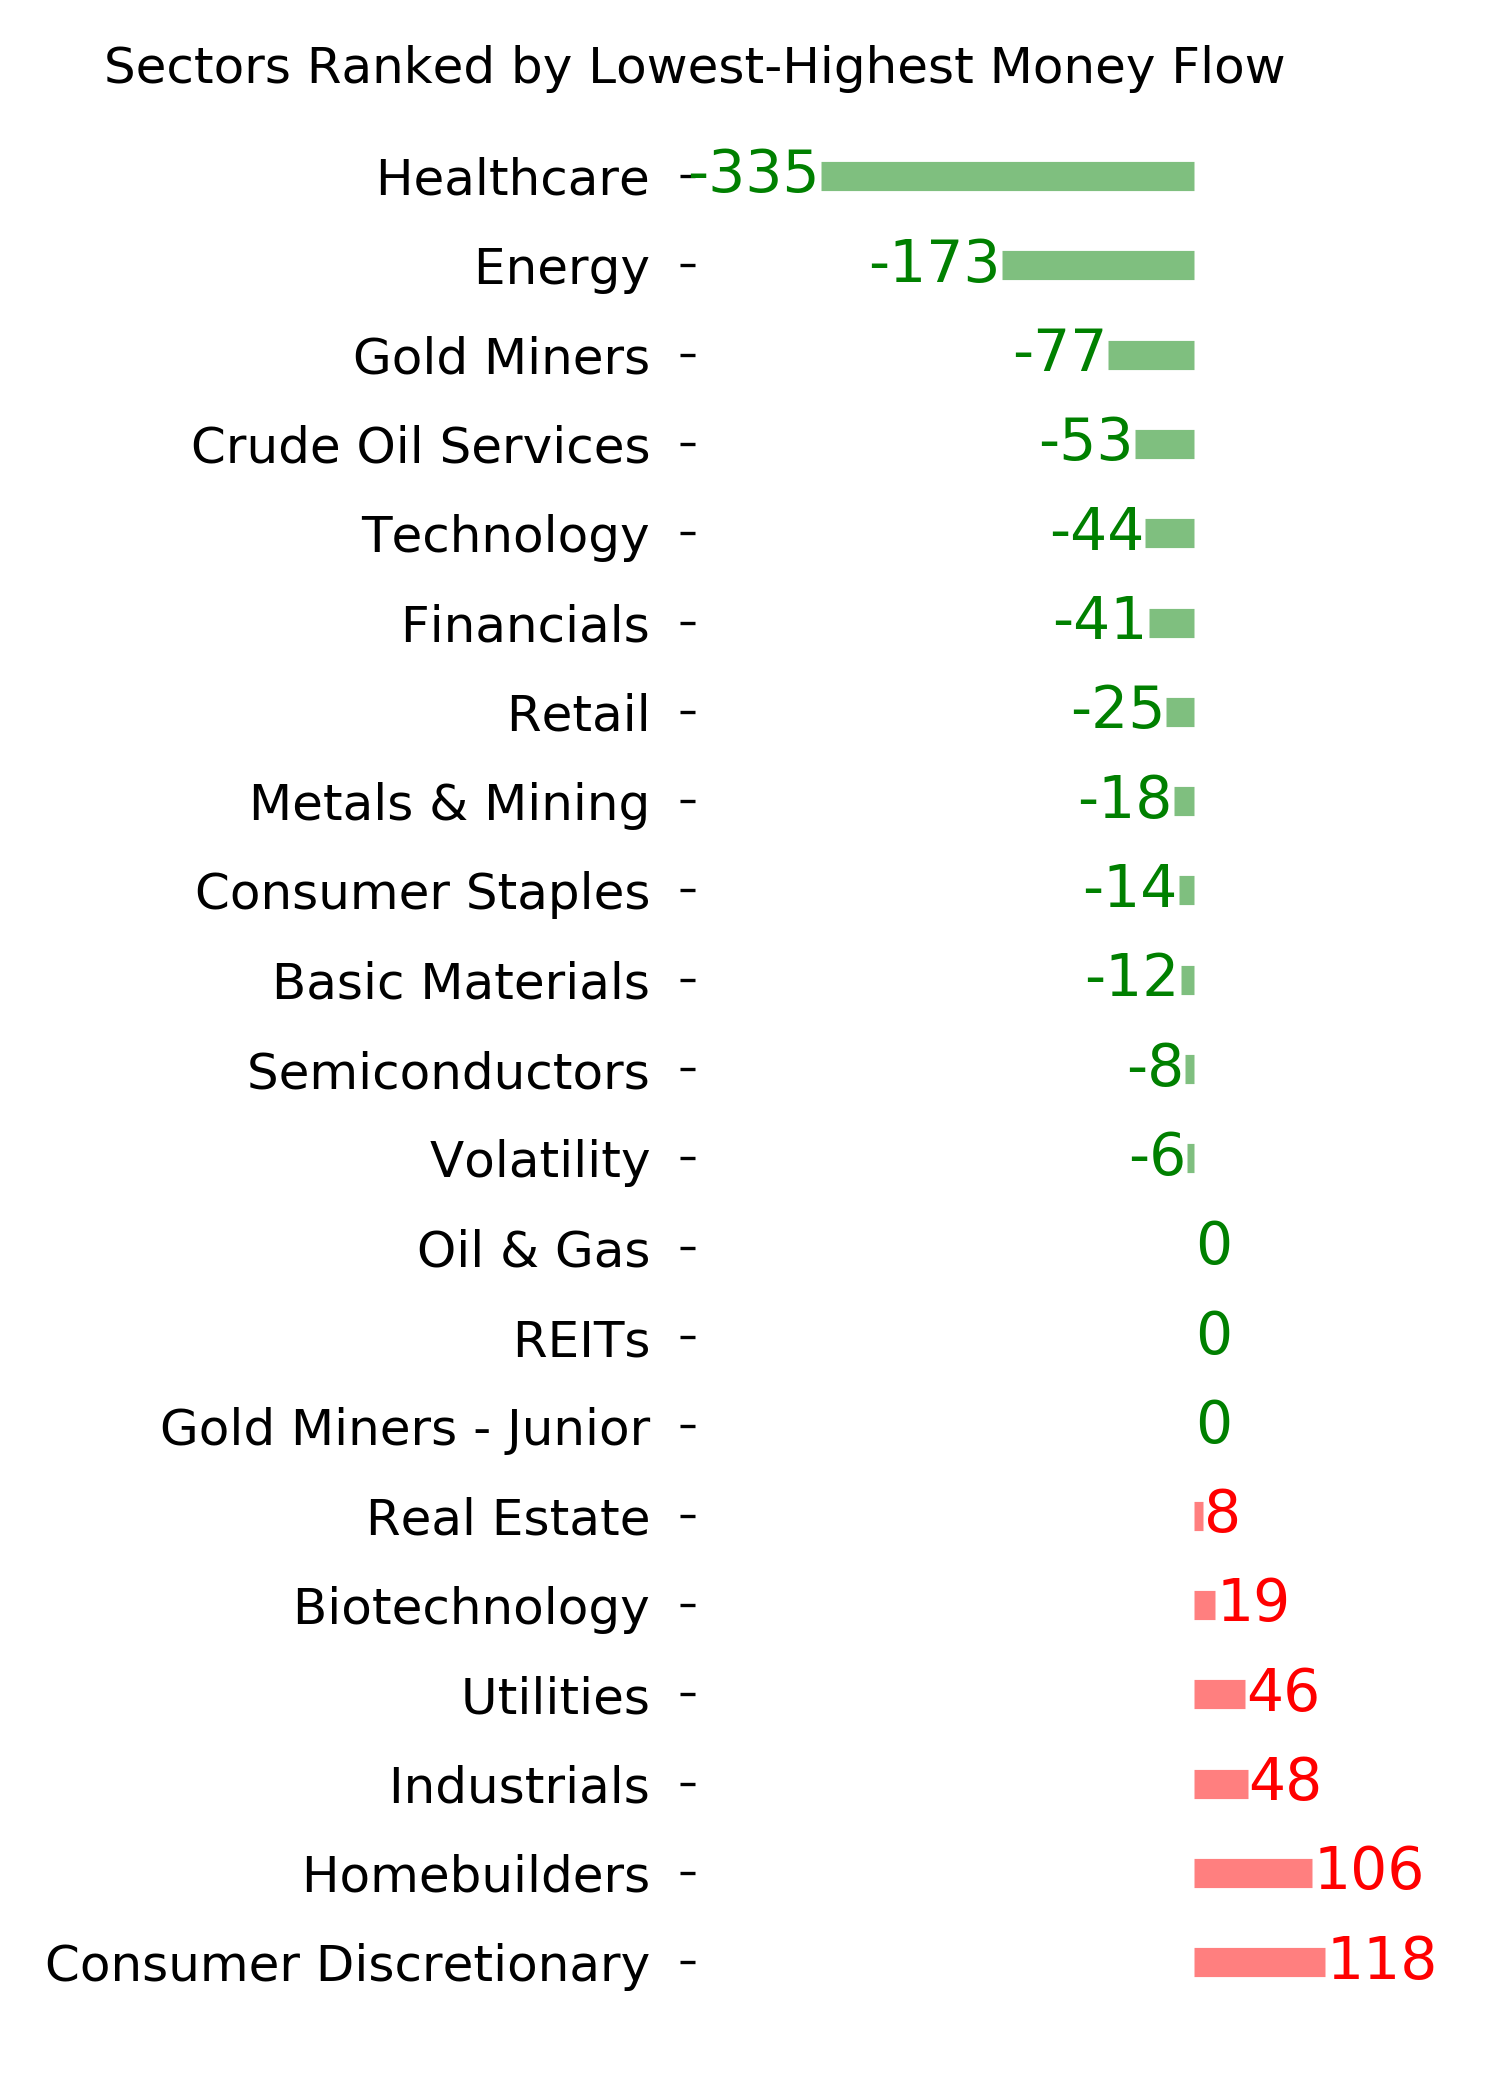
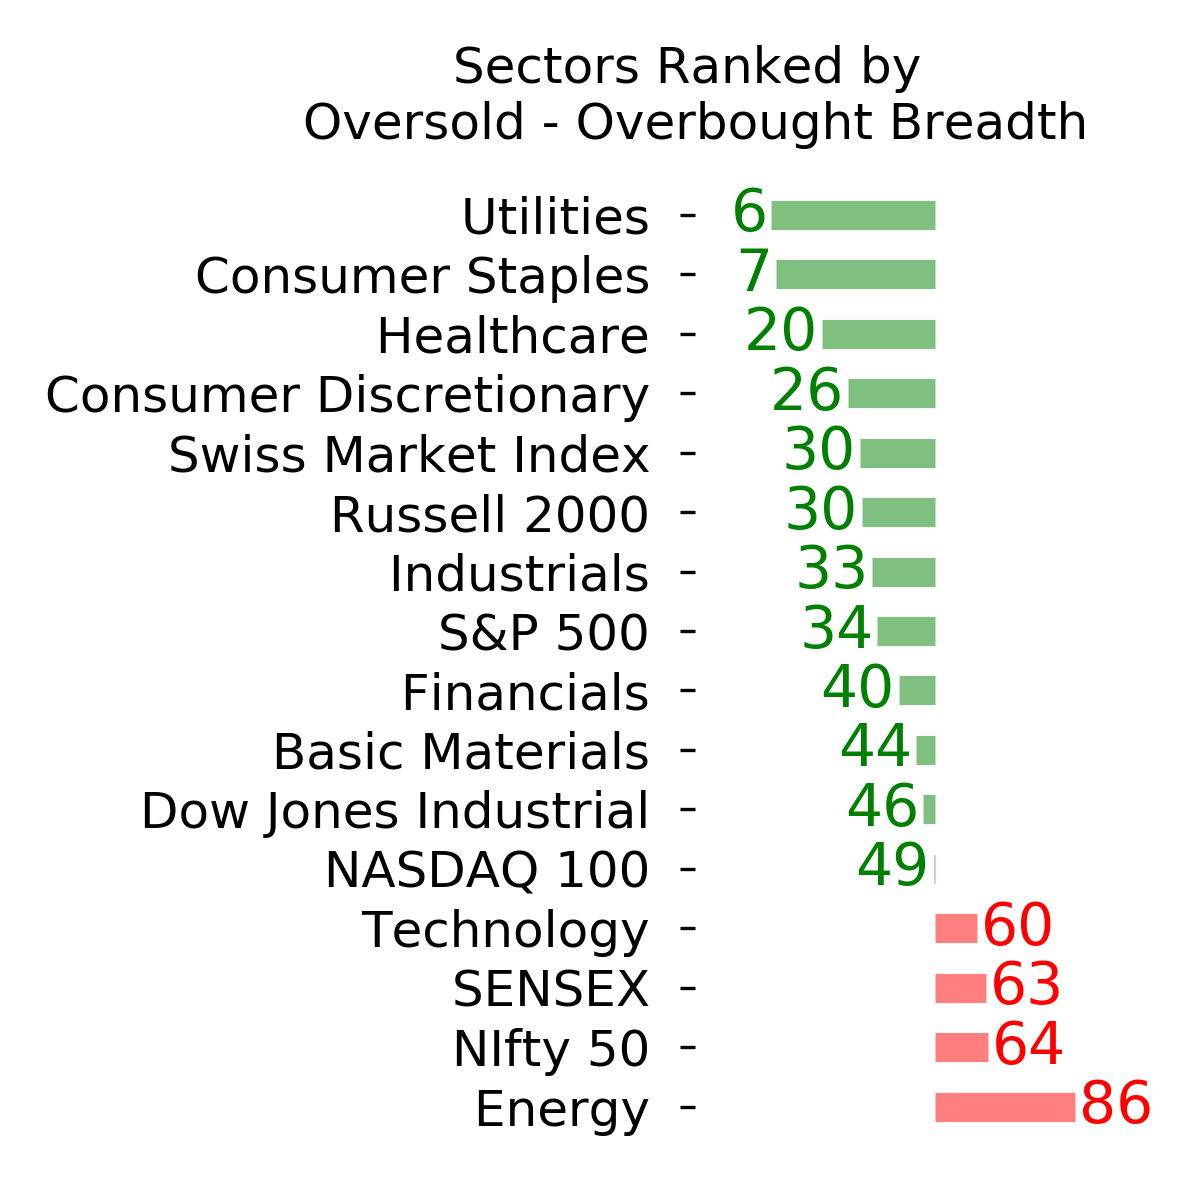
Ranks
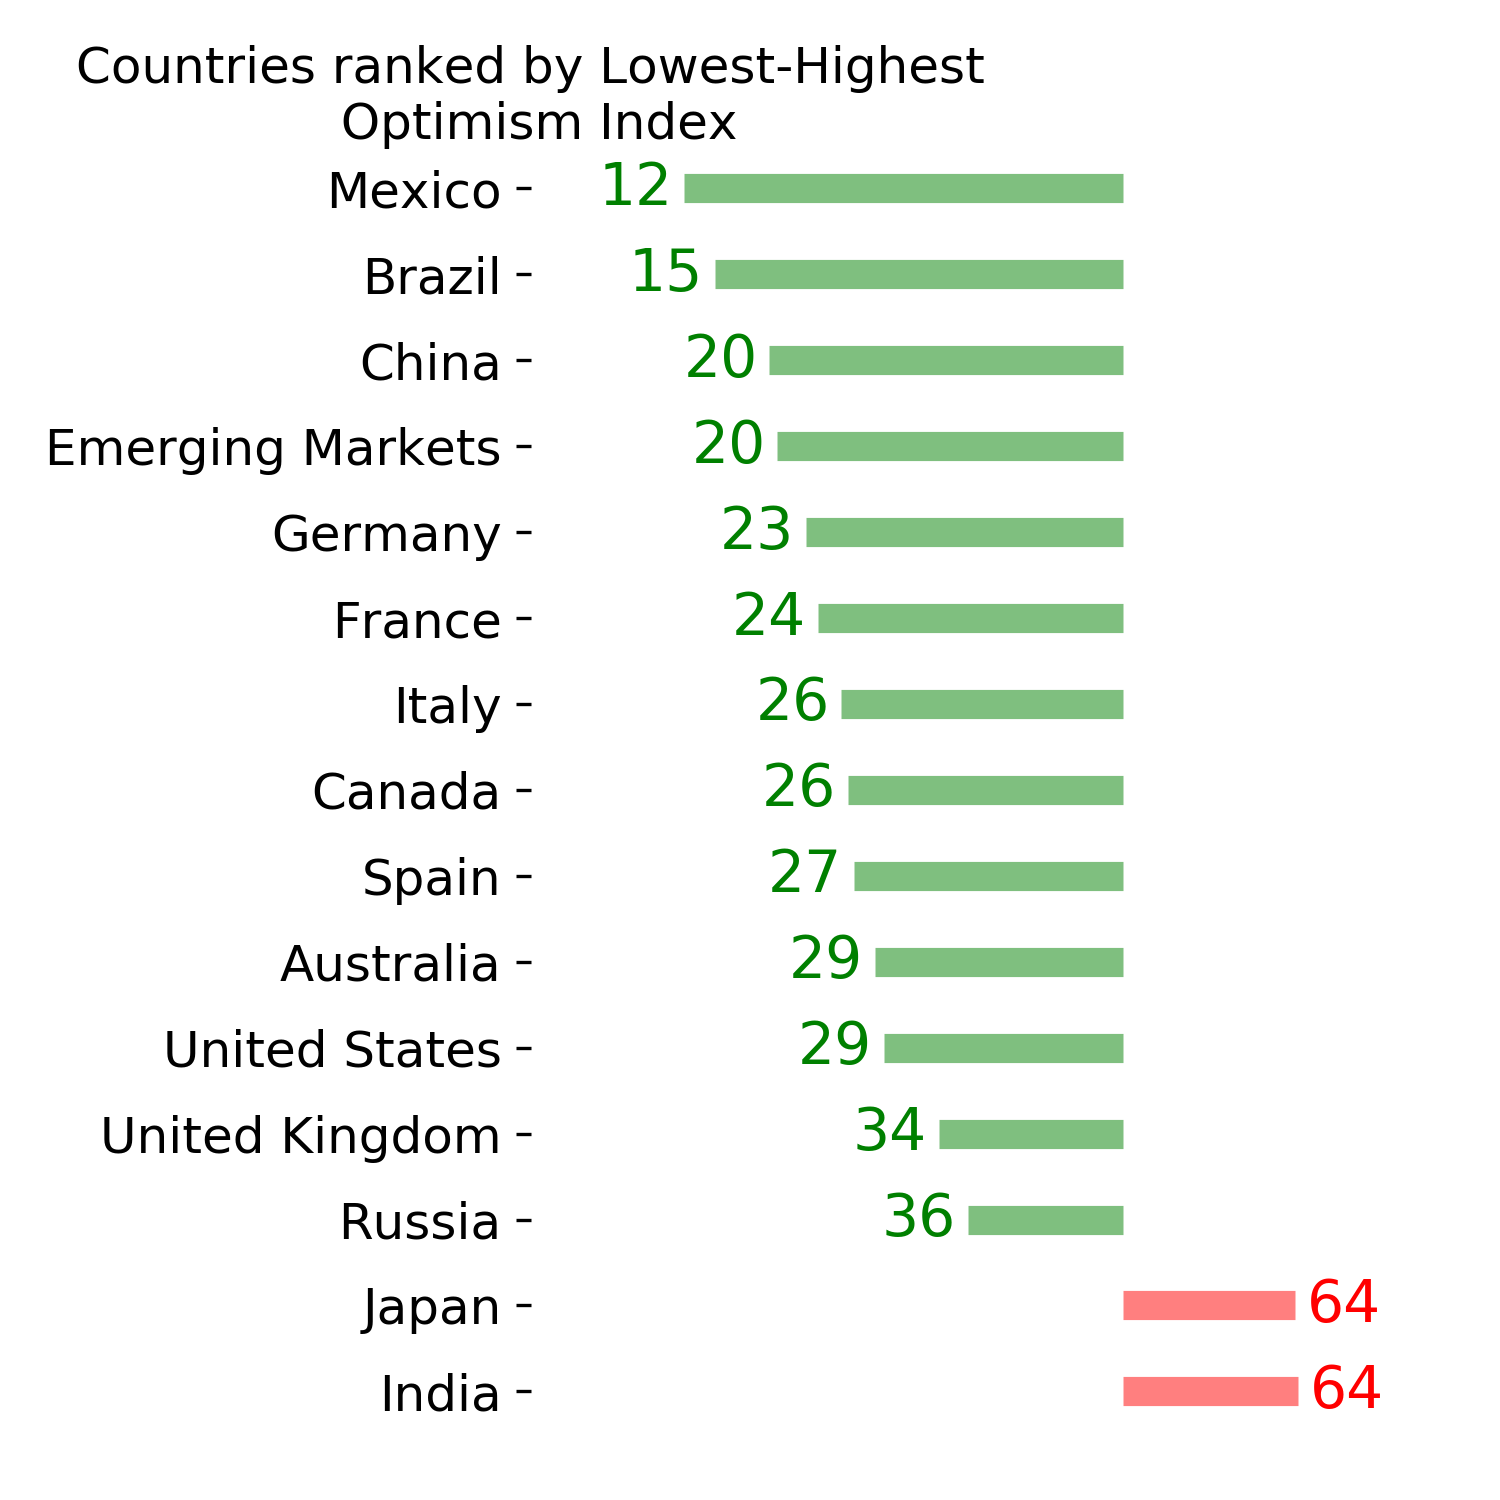
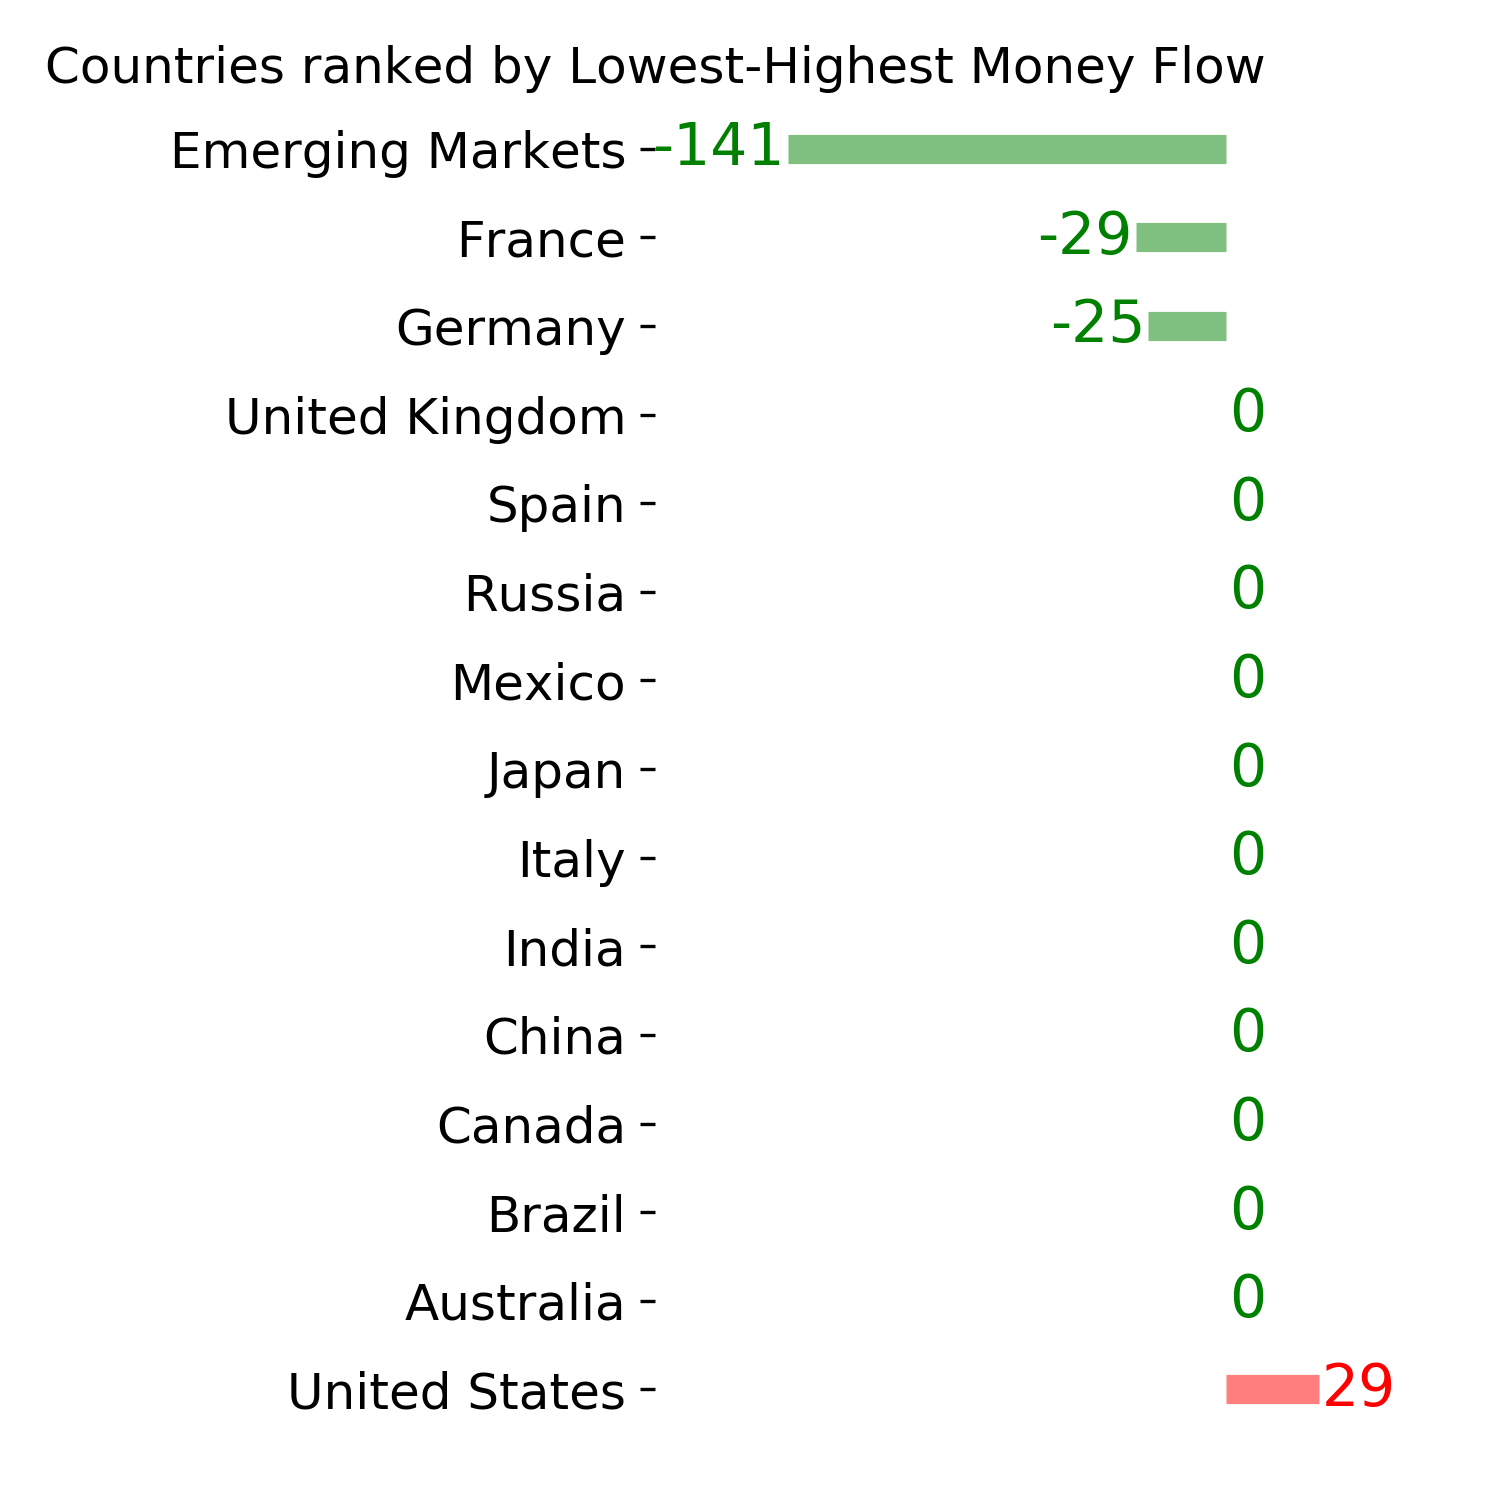
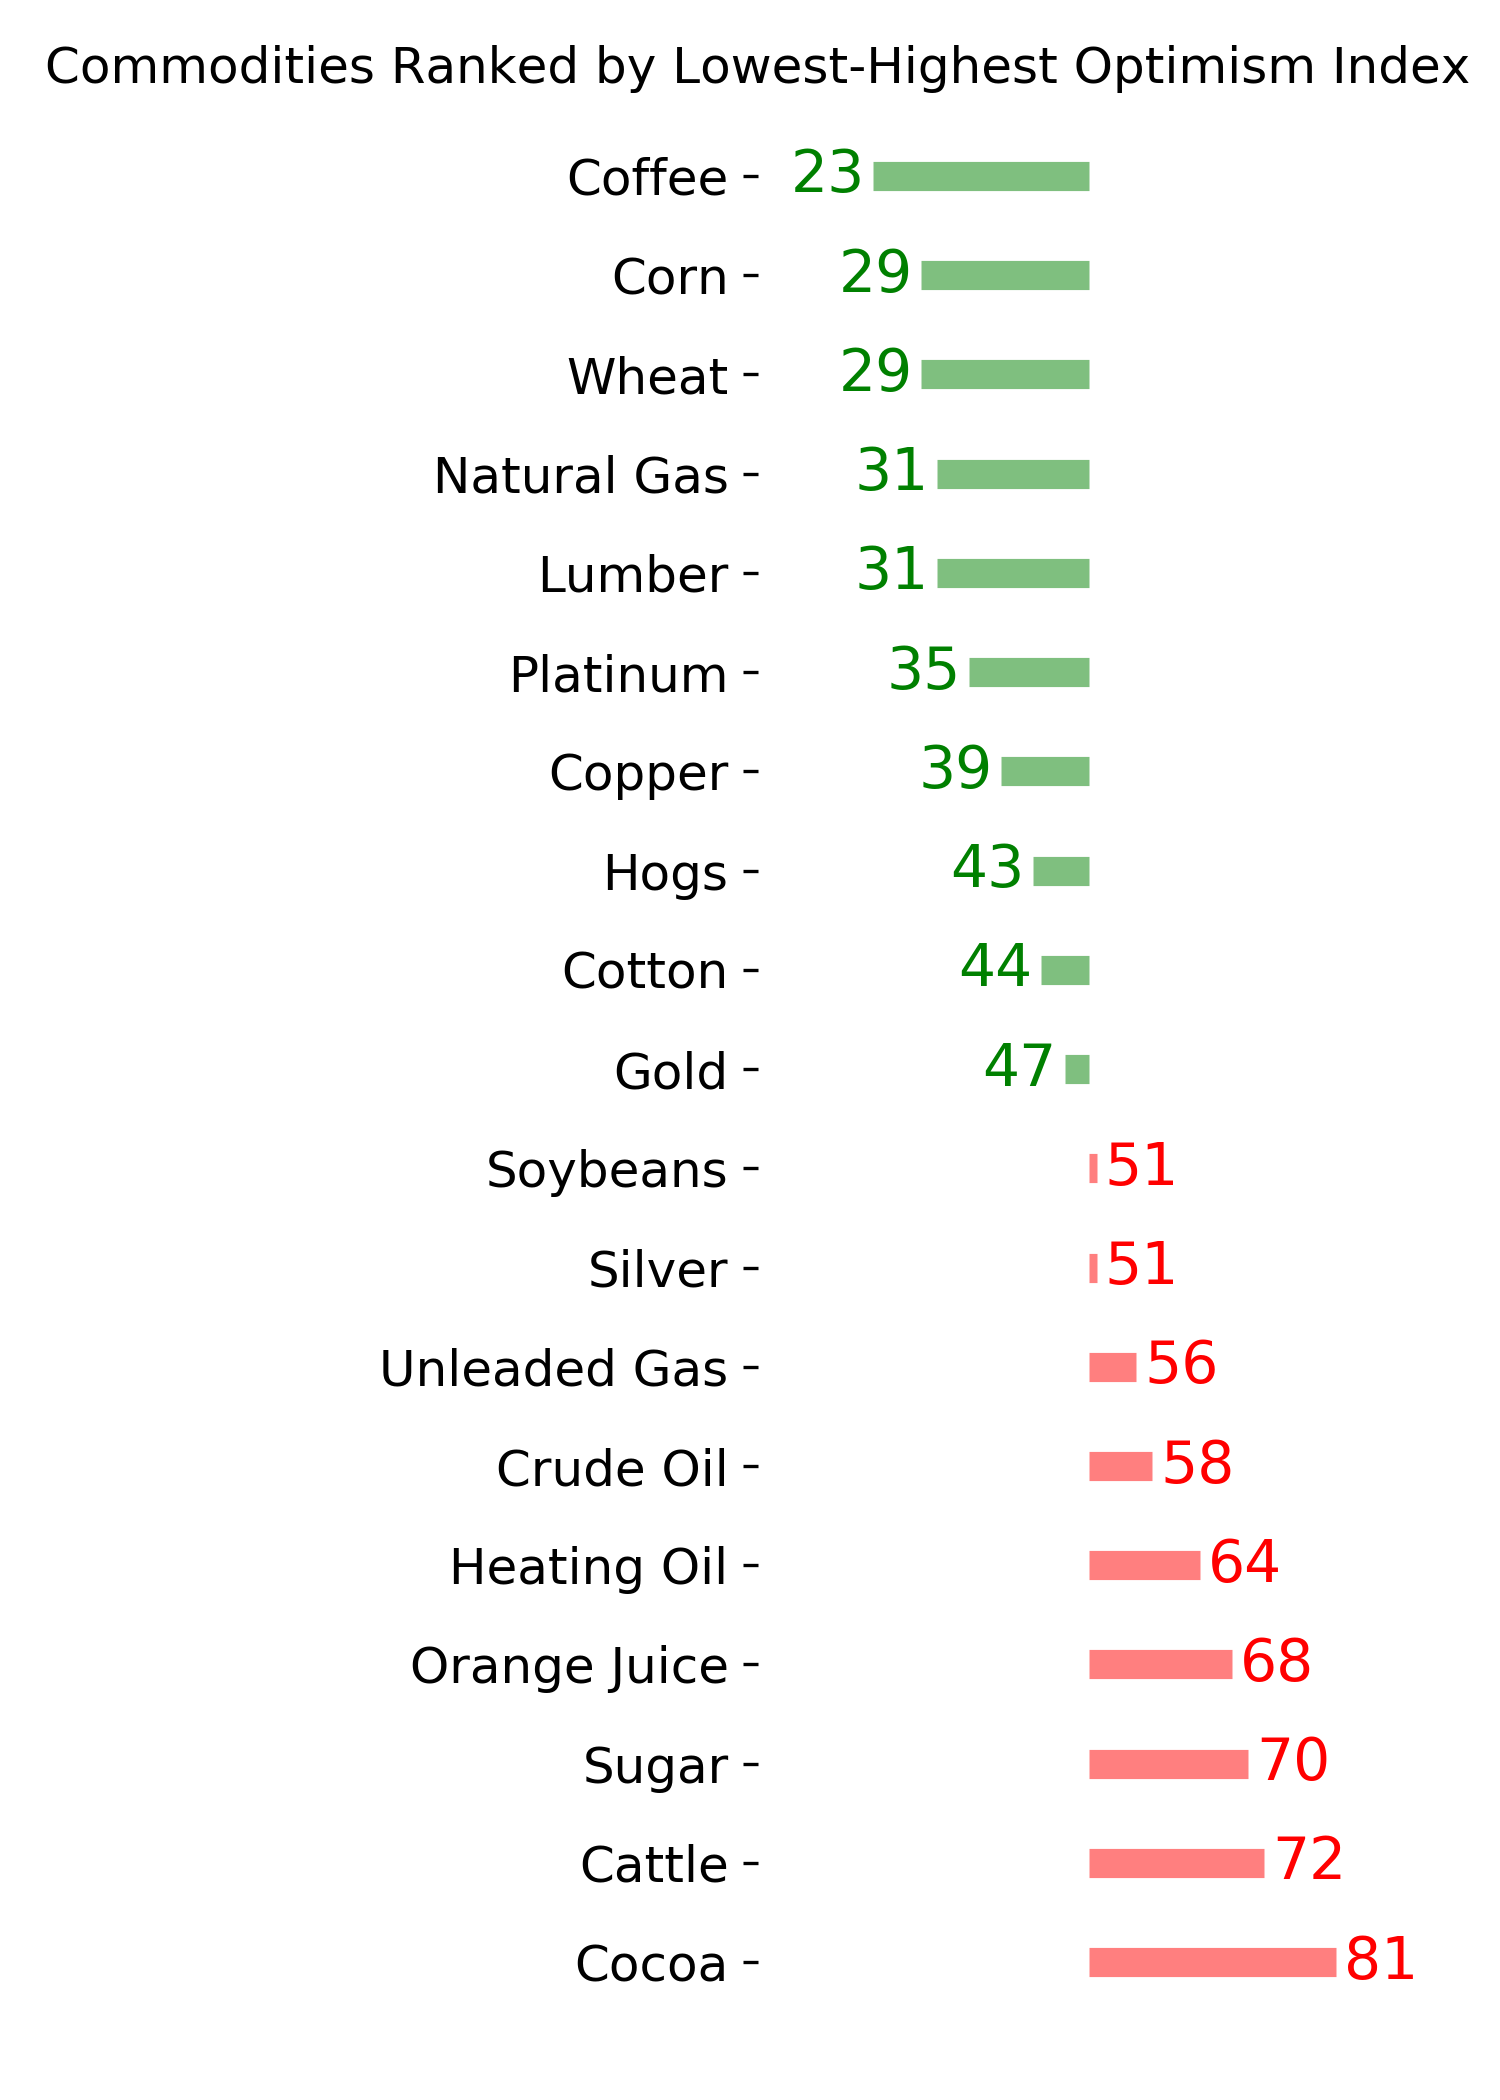
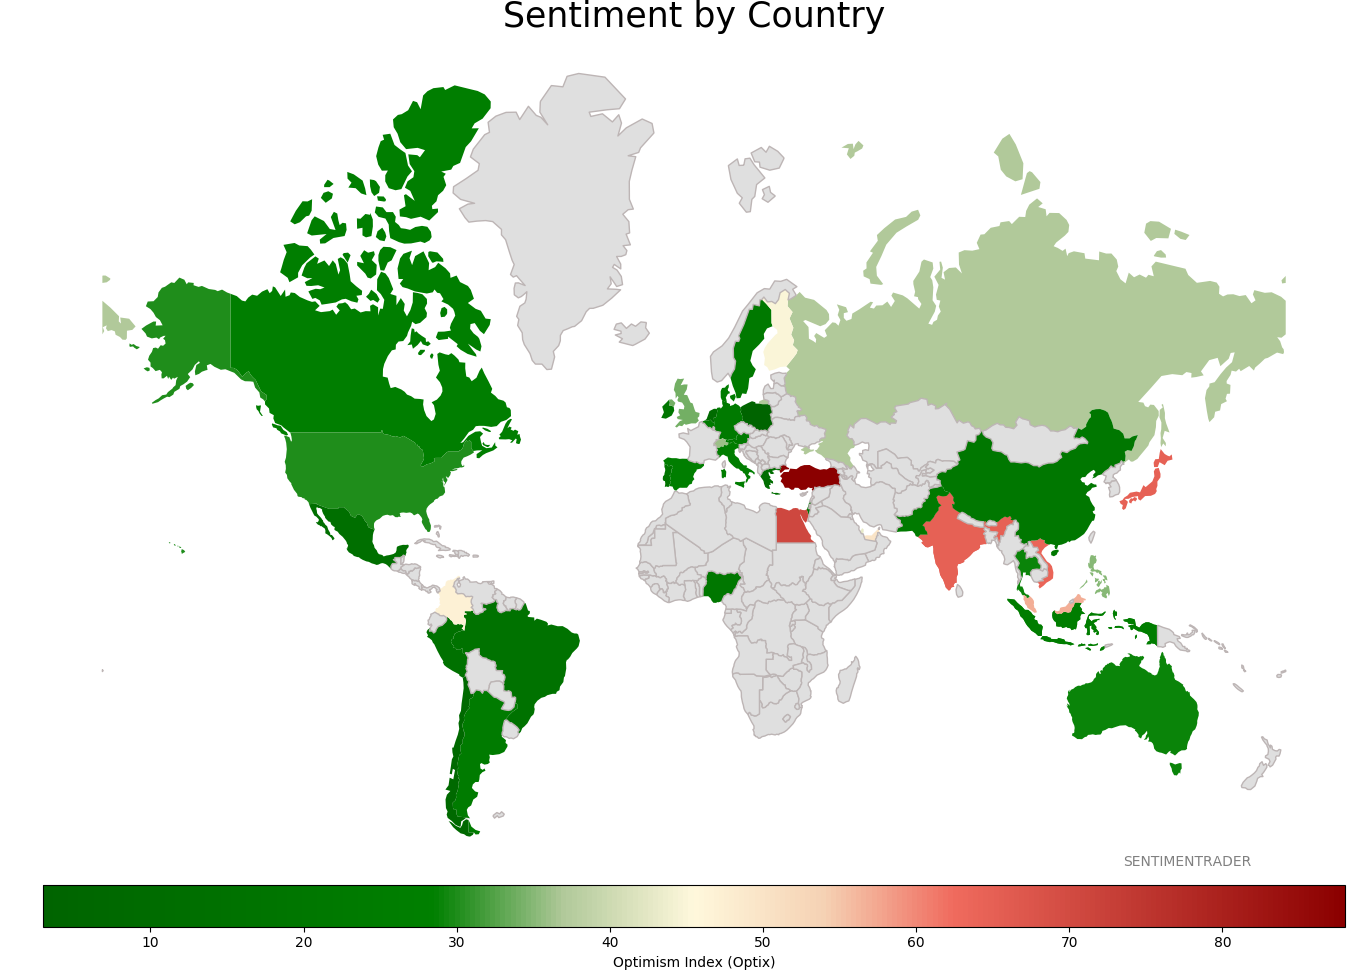
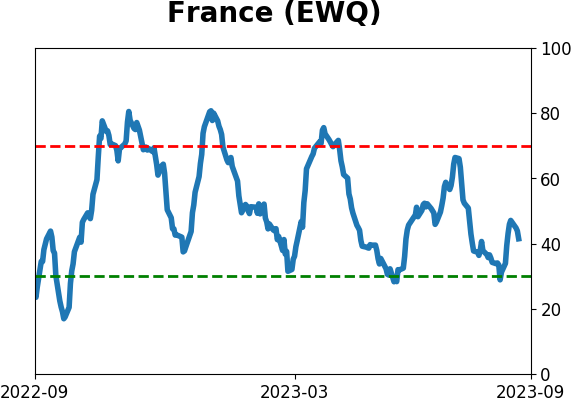
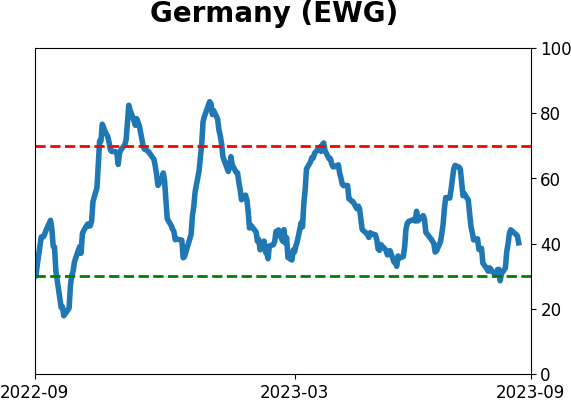
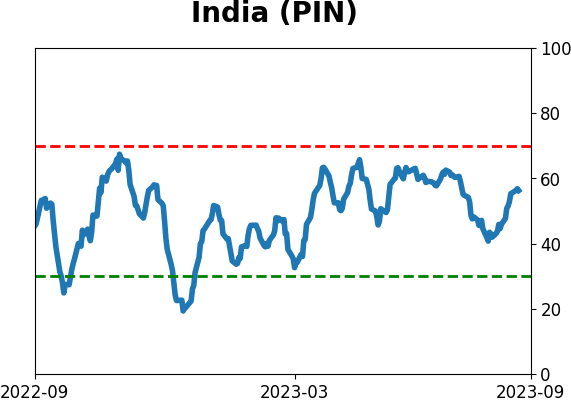
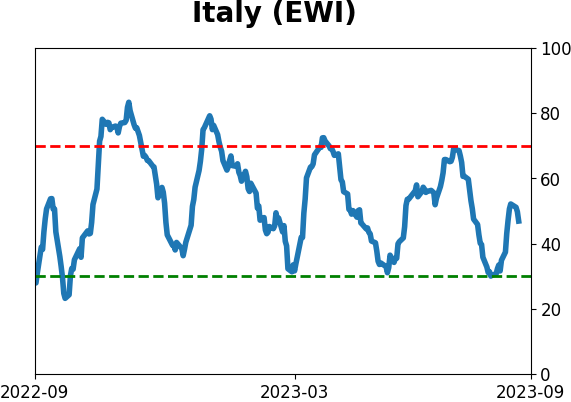
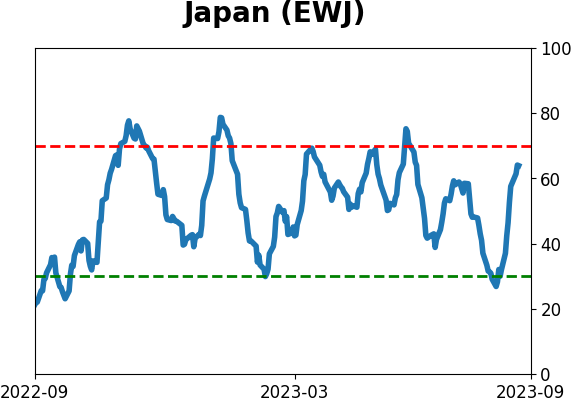
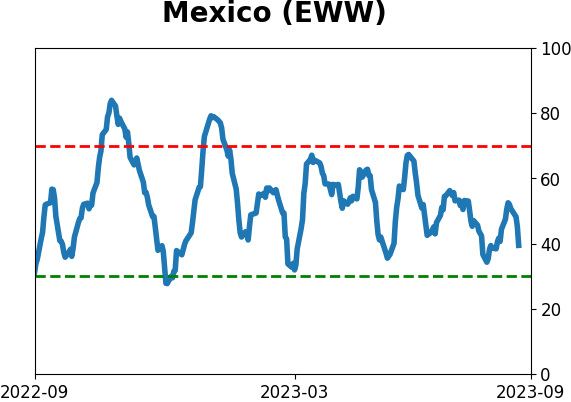
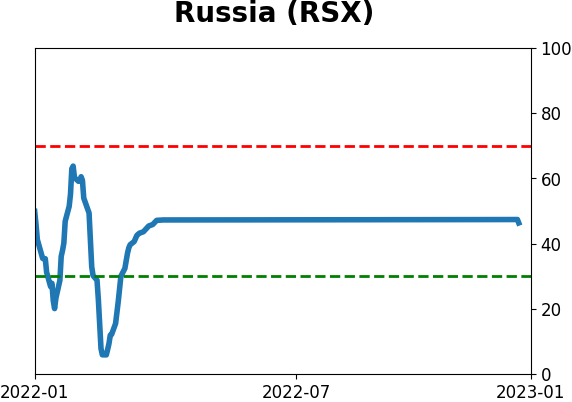
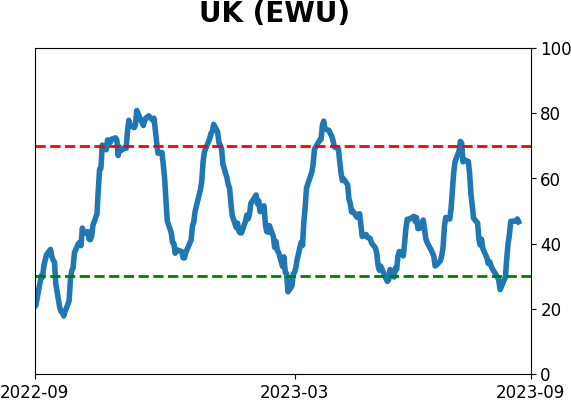
Sentiment Around The World
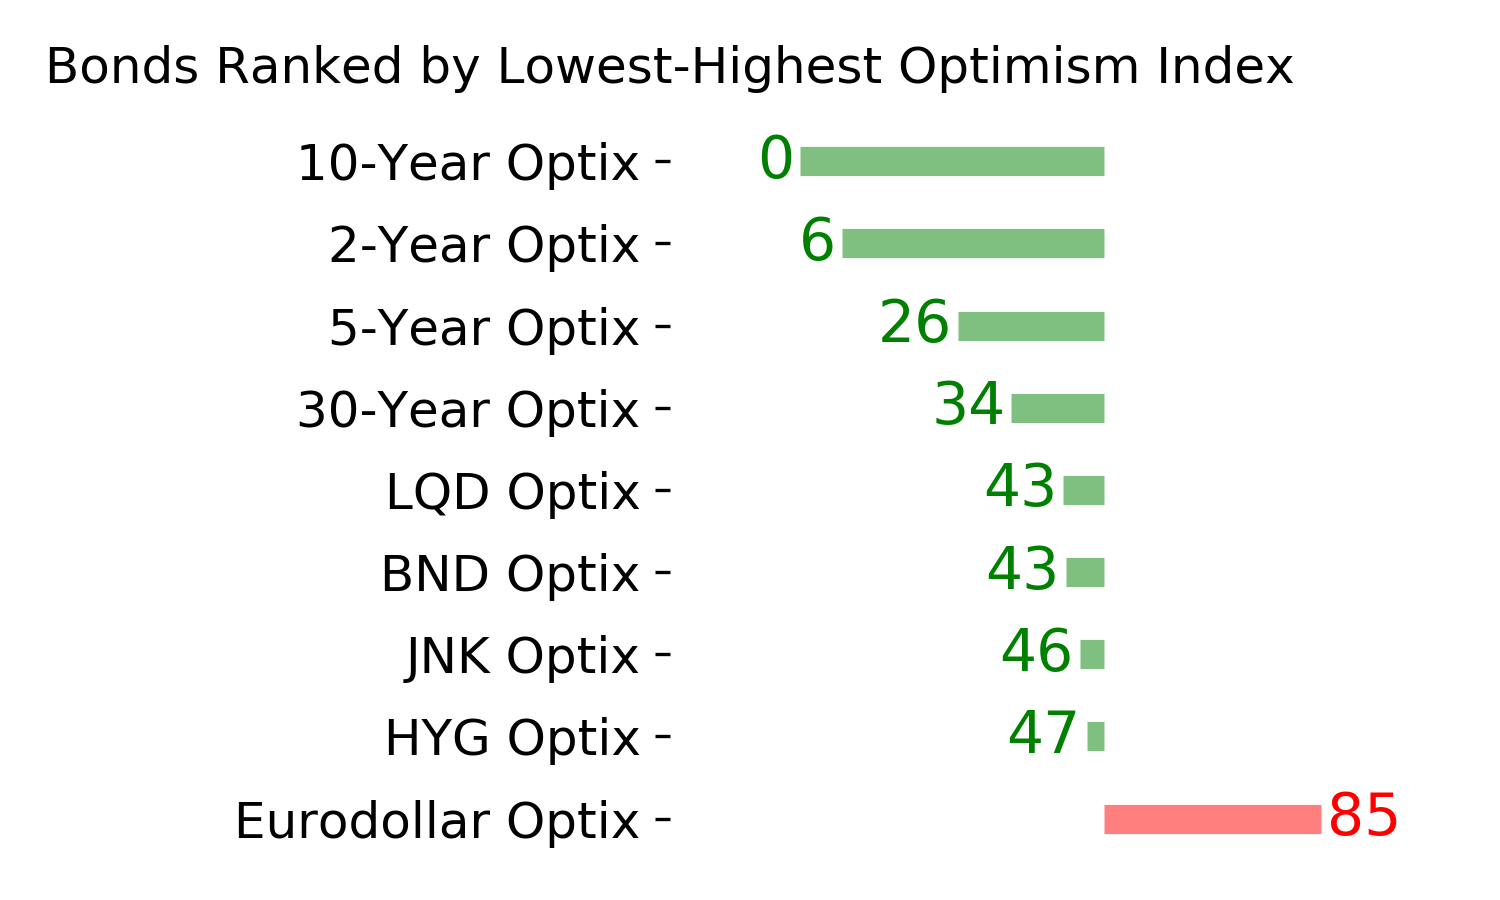
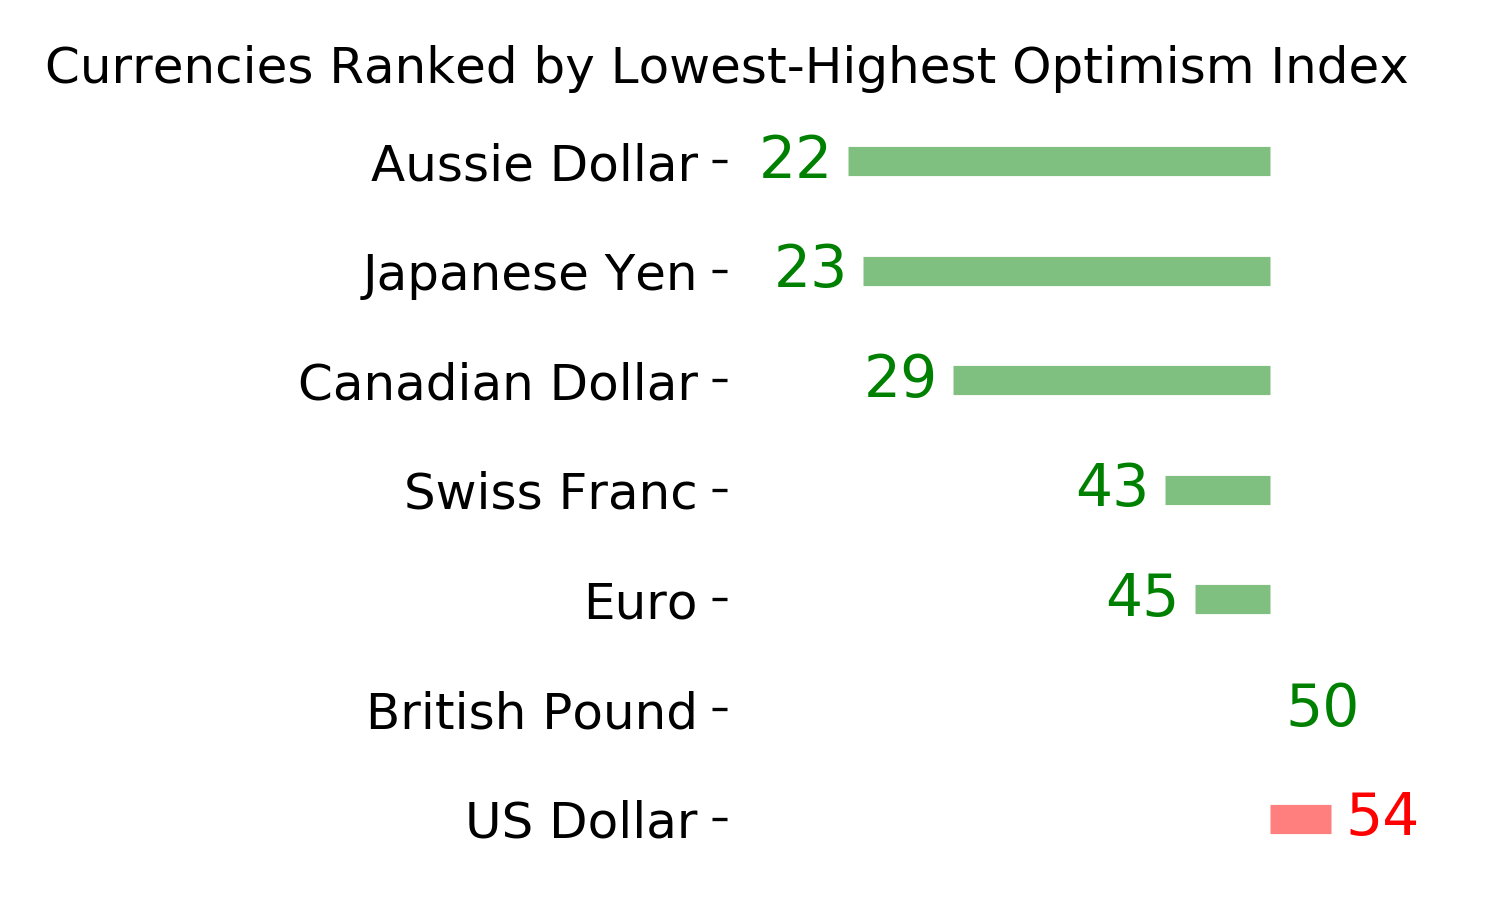
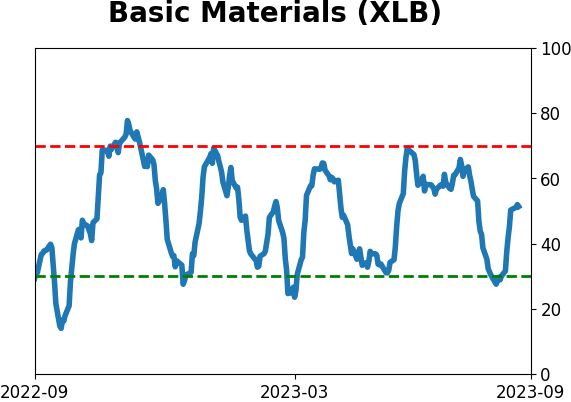
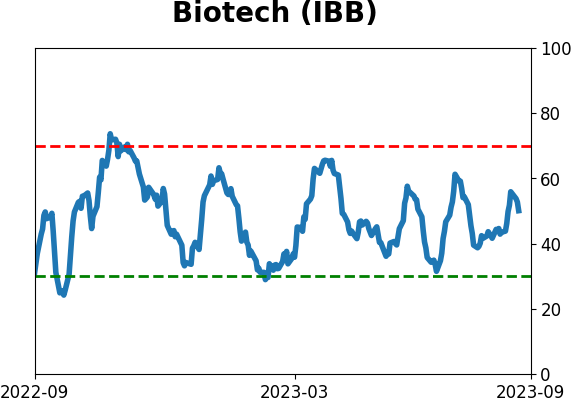
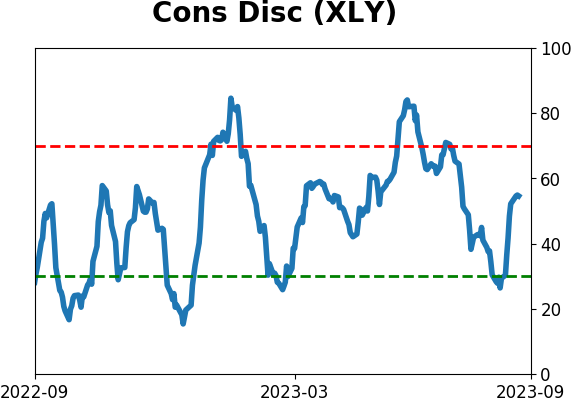
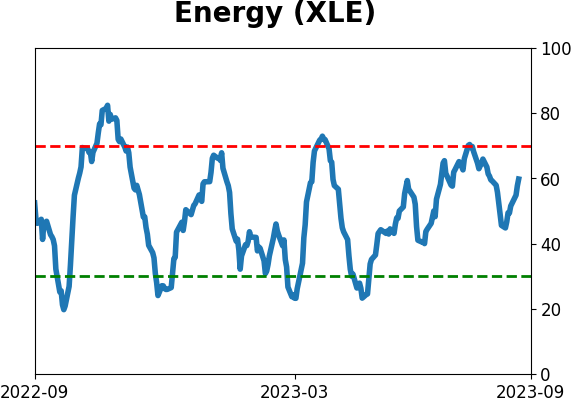
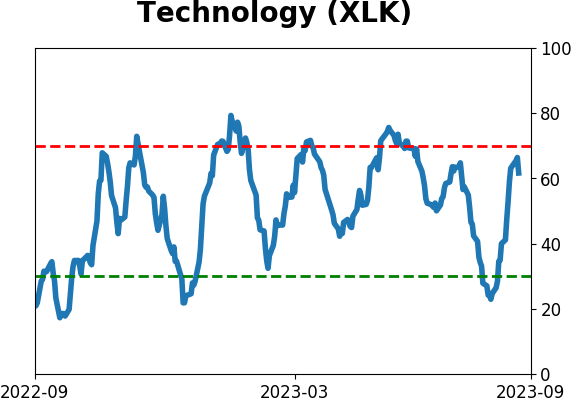
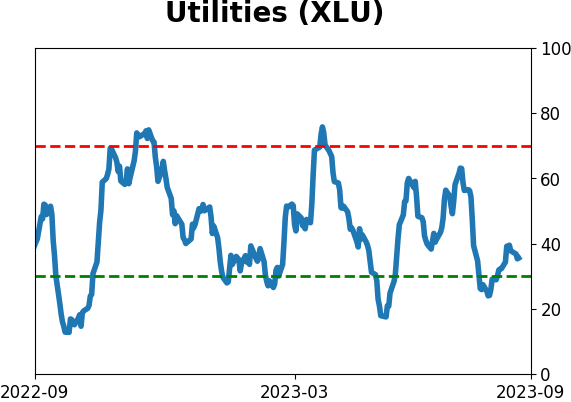
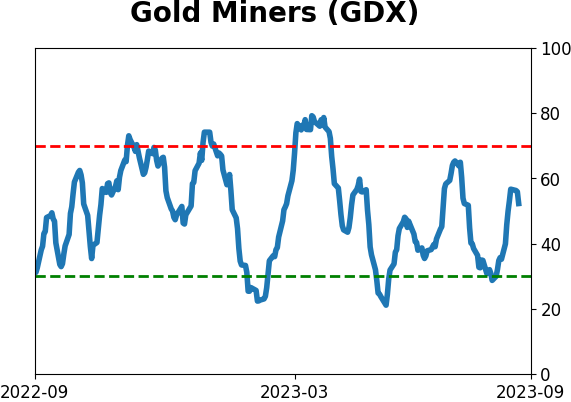
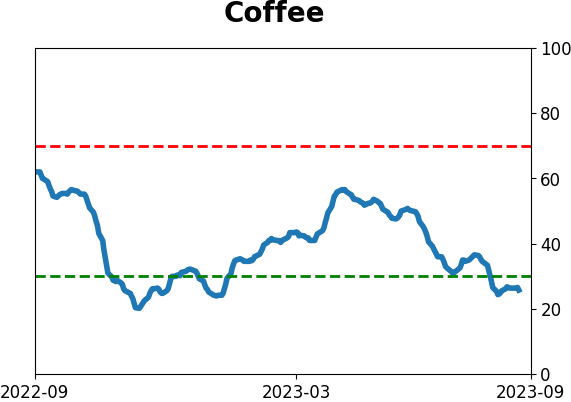
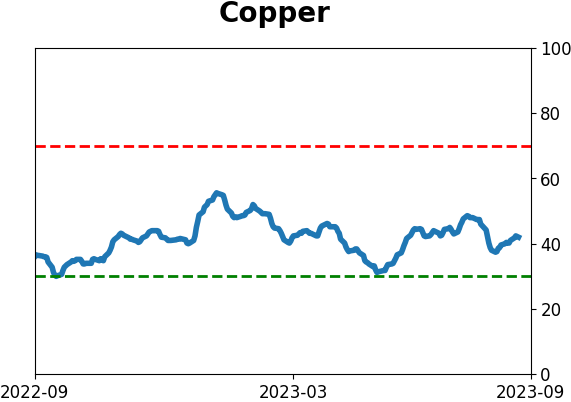
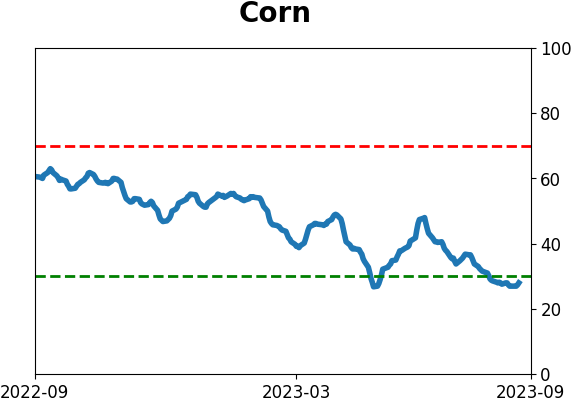
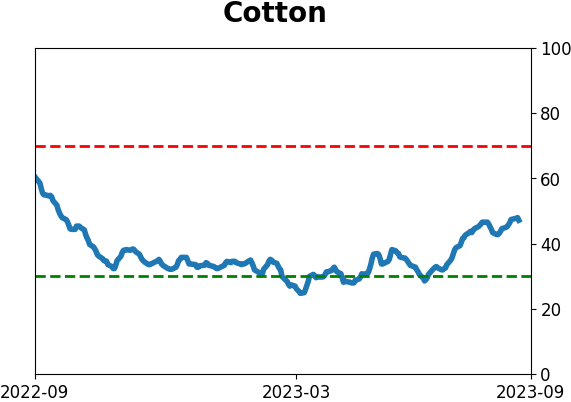
Optimism Index Thumbnails
|
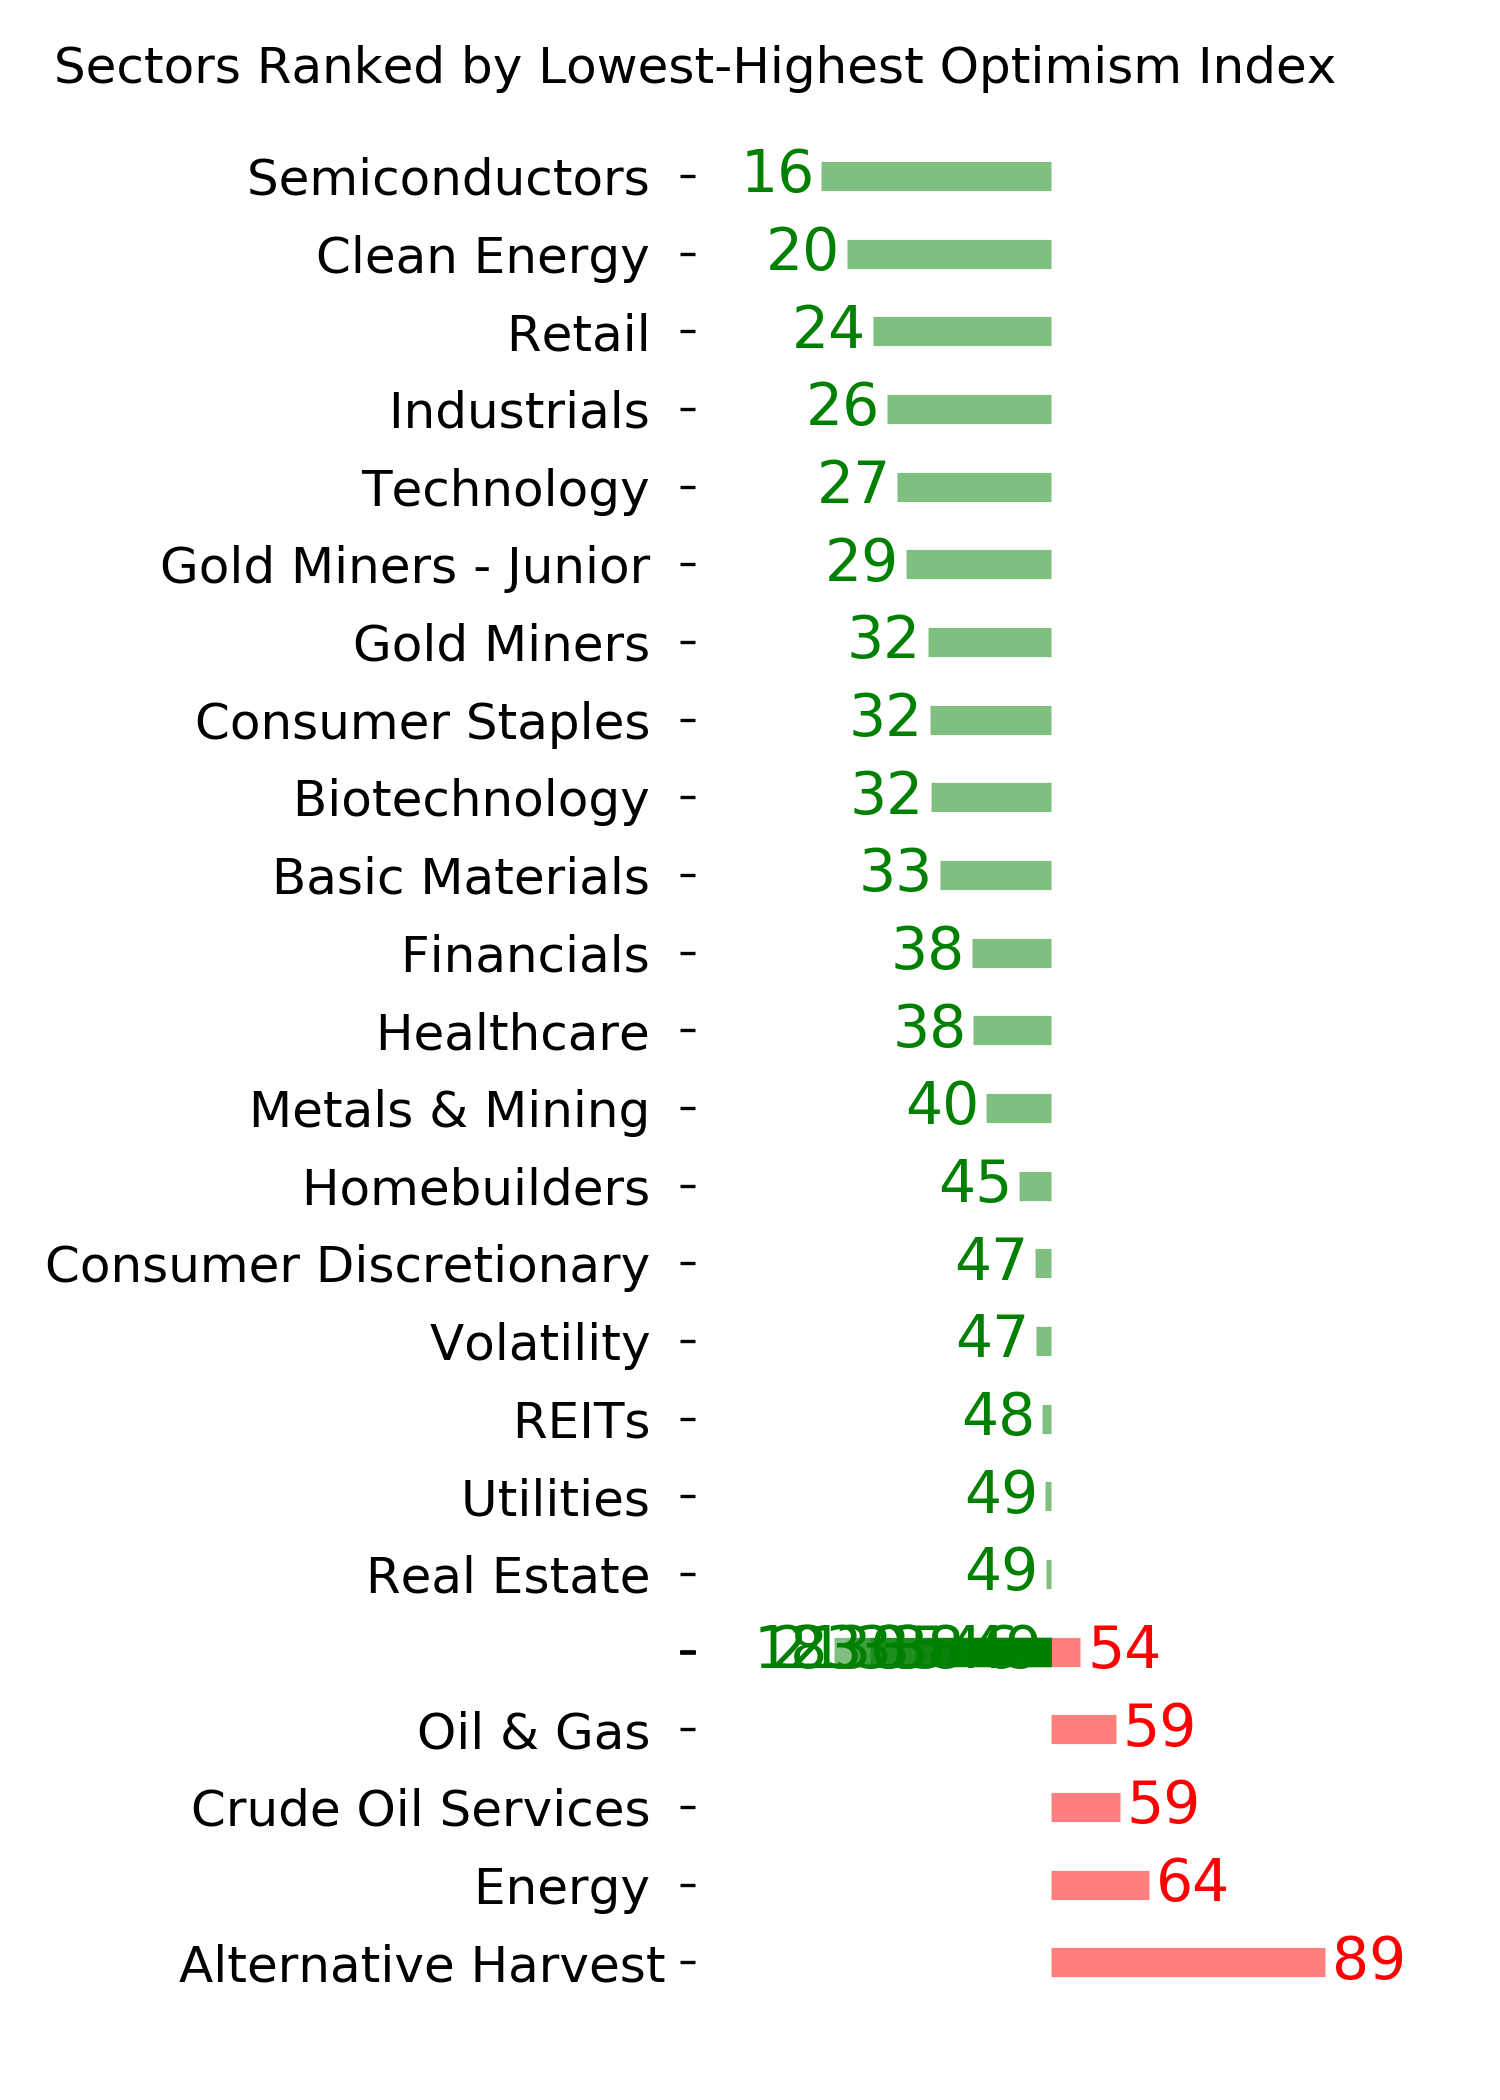
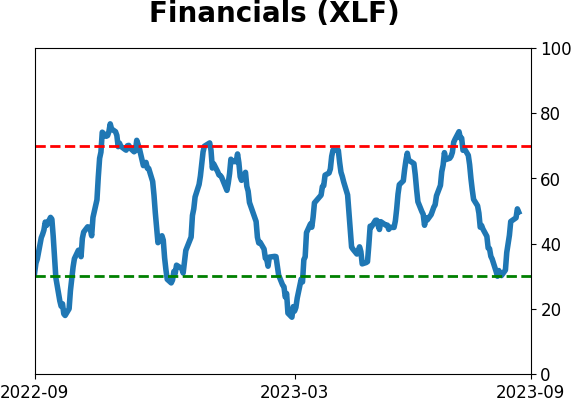
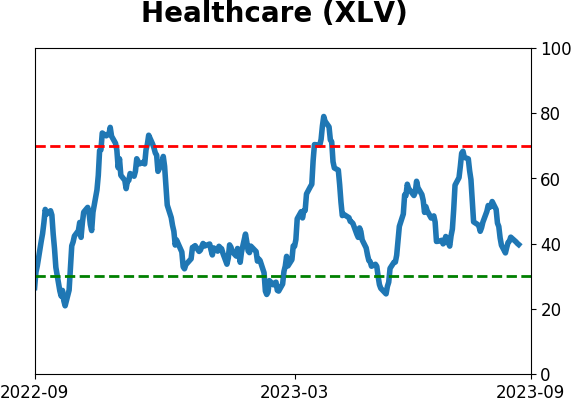
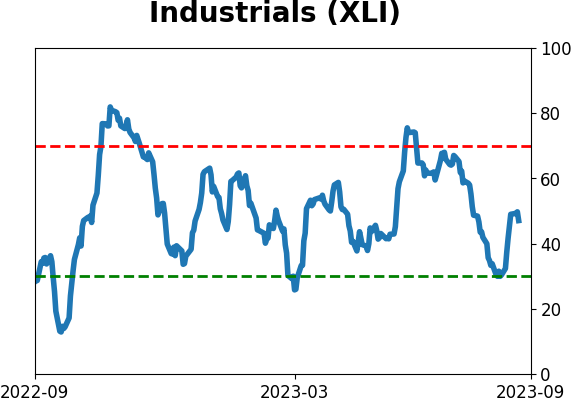
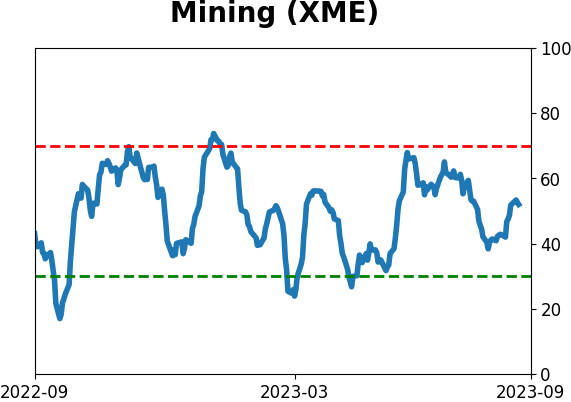
Sector ETF's - 10-Day Moving Average
|
|
|
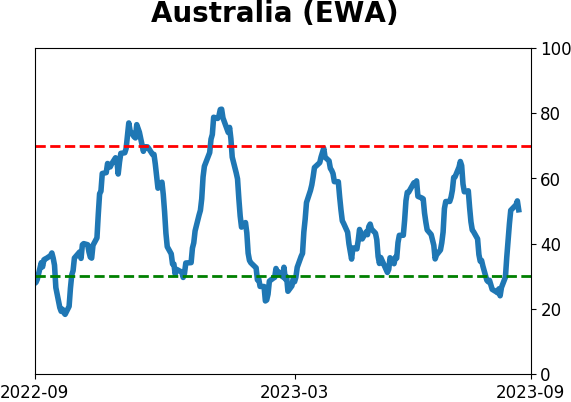
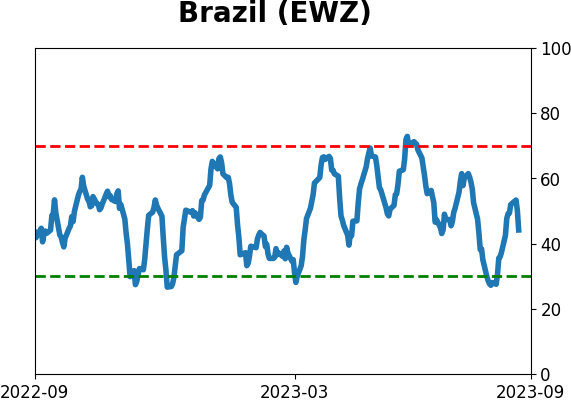
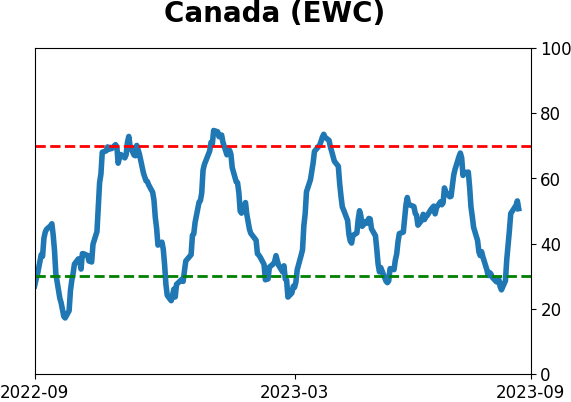
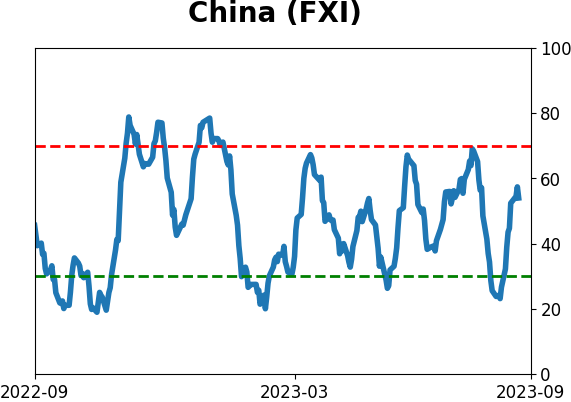
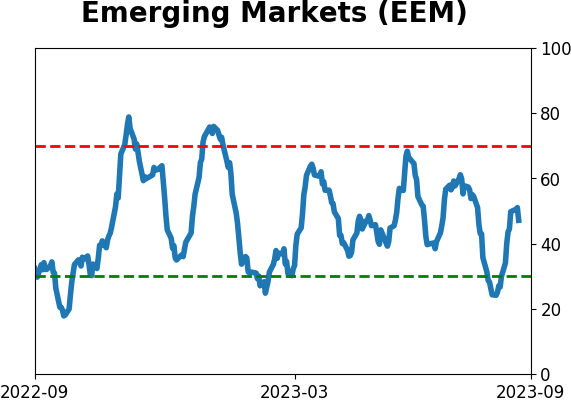
Country ETF's - 10-Day Moving Average
|
|
|
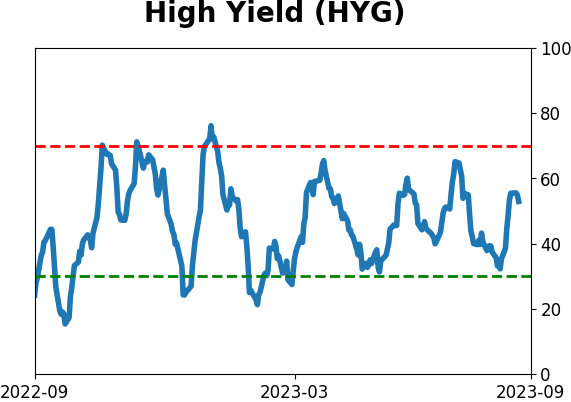
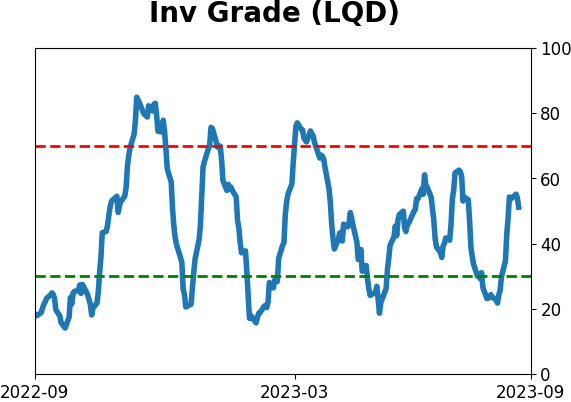
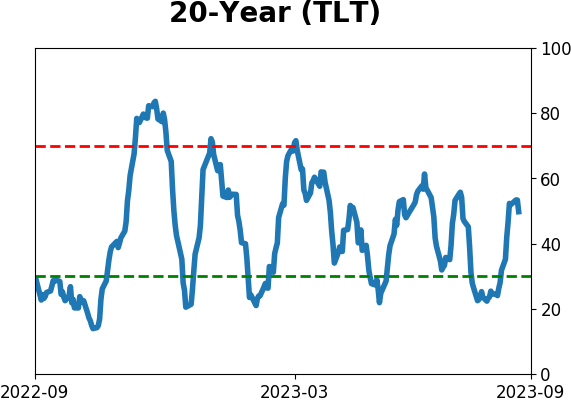
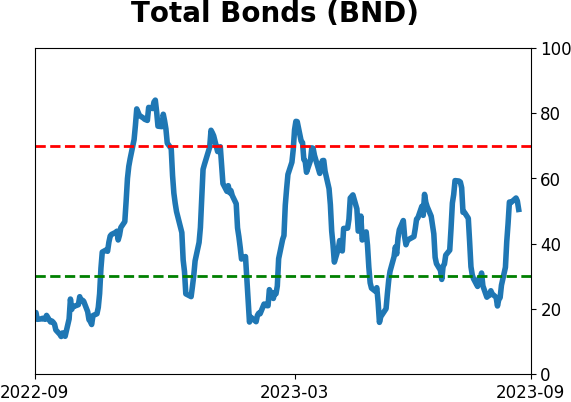
Bond ETF's - 10-Day Moving Average
|
|
|
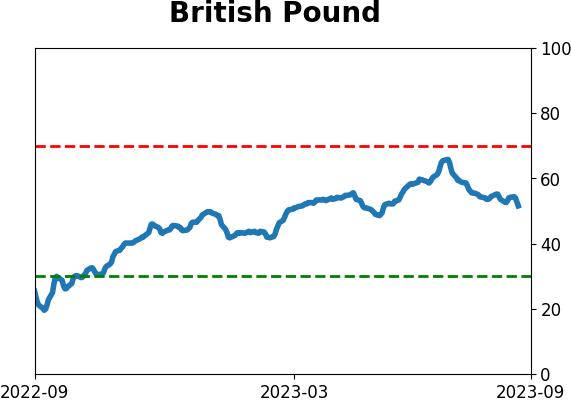
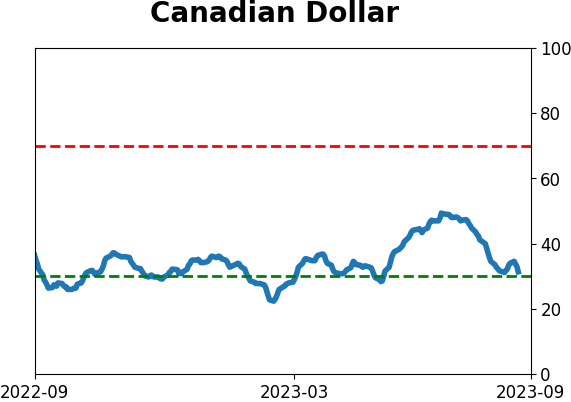
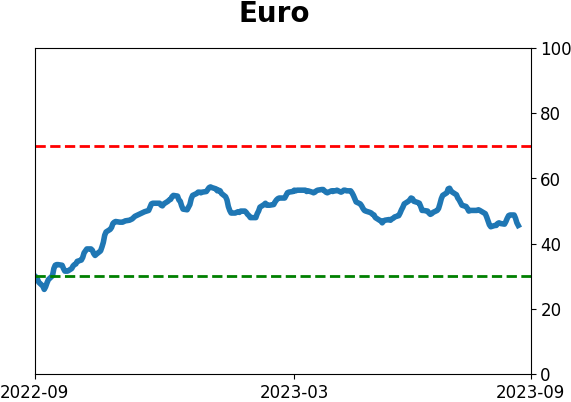
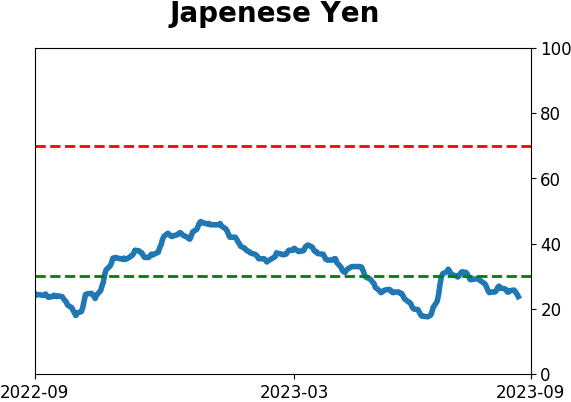
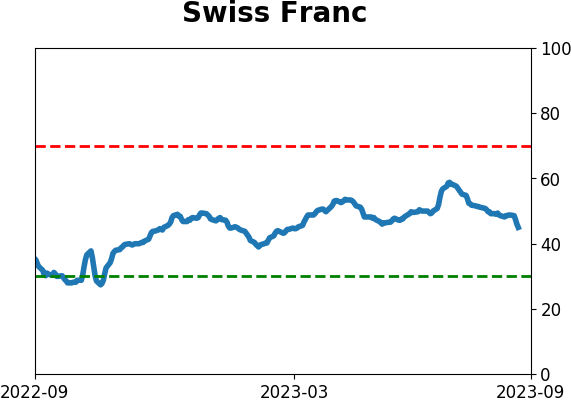
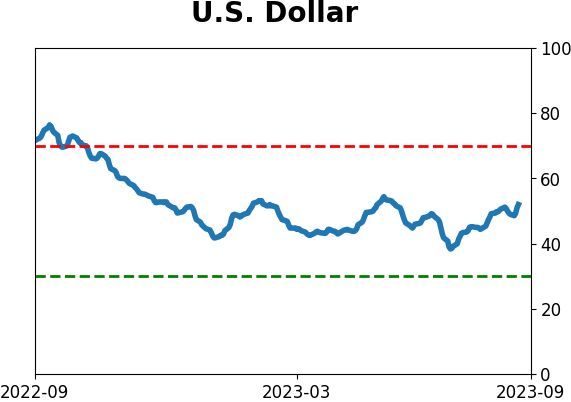
Currency ETF's - 5-Day Moving Average
|
|
|
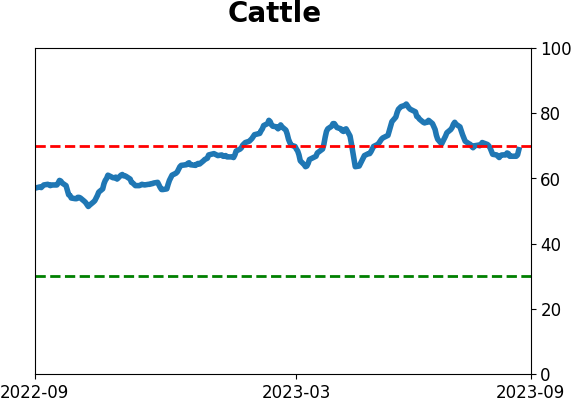
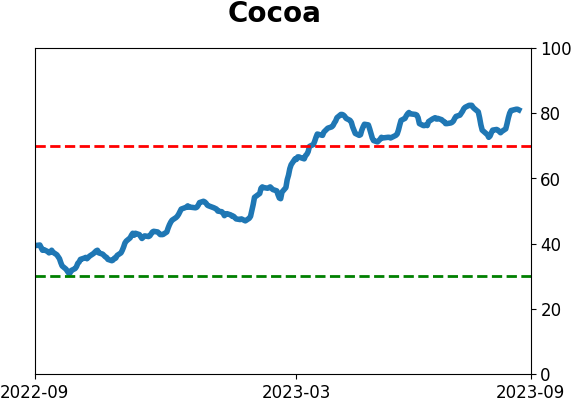
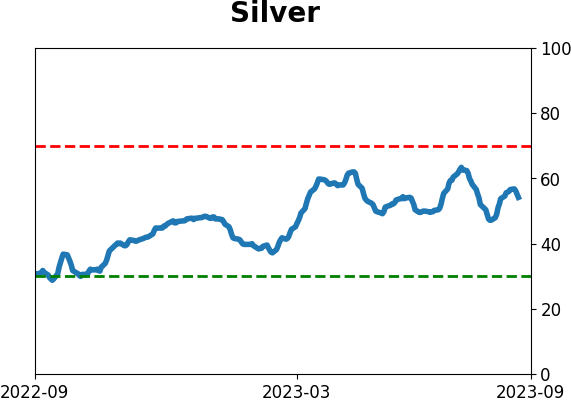
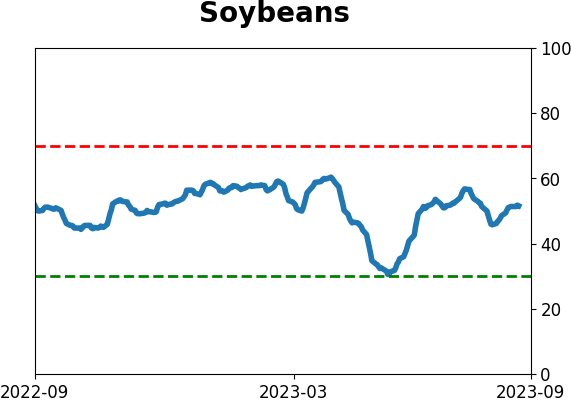
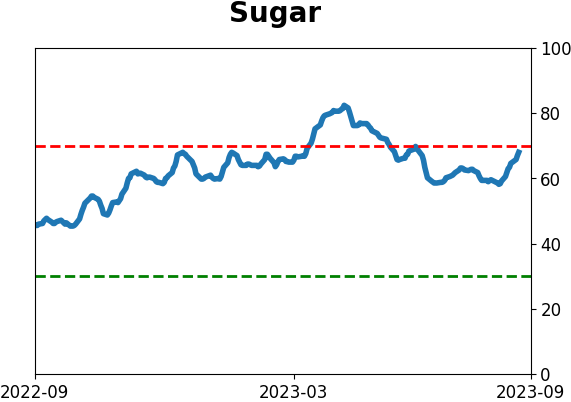
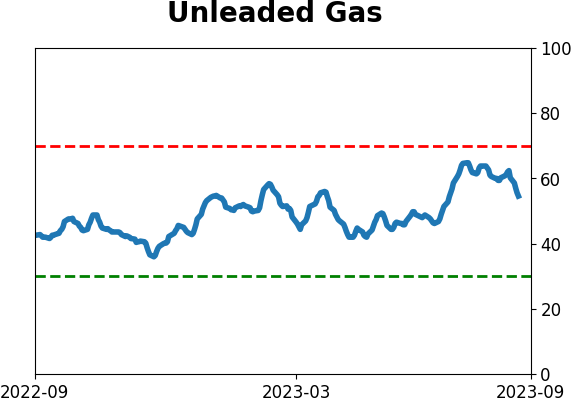
Commodity ETF's - 5-Day Moving Average
|
|