Headlines
|
|
A Technology rally broader than it gets credit for:
When the Technology sector rallies, detractors typically point out that it's "only a few big stocks." That hasn't been the case this time, as the Up Issues Ratio for the sector has cycled from a deep oversold to a deep overbought reading. That has tended to precede more gains, even during a long-term uptrend.
|
Smart / Dumb Money Confidence
|
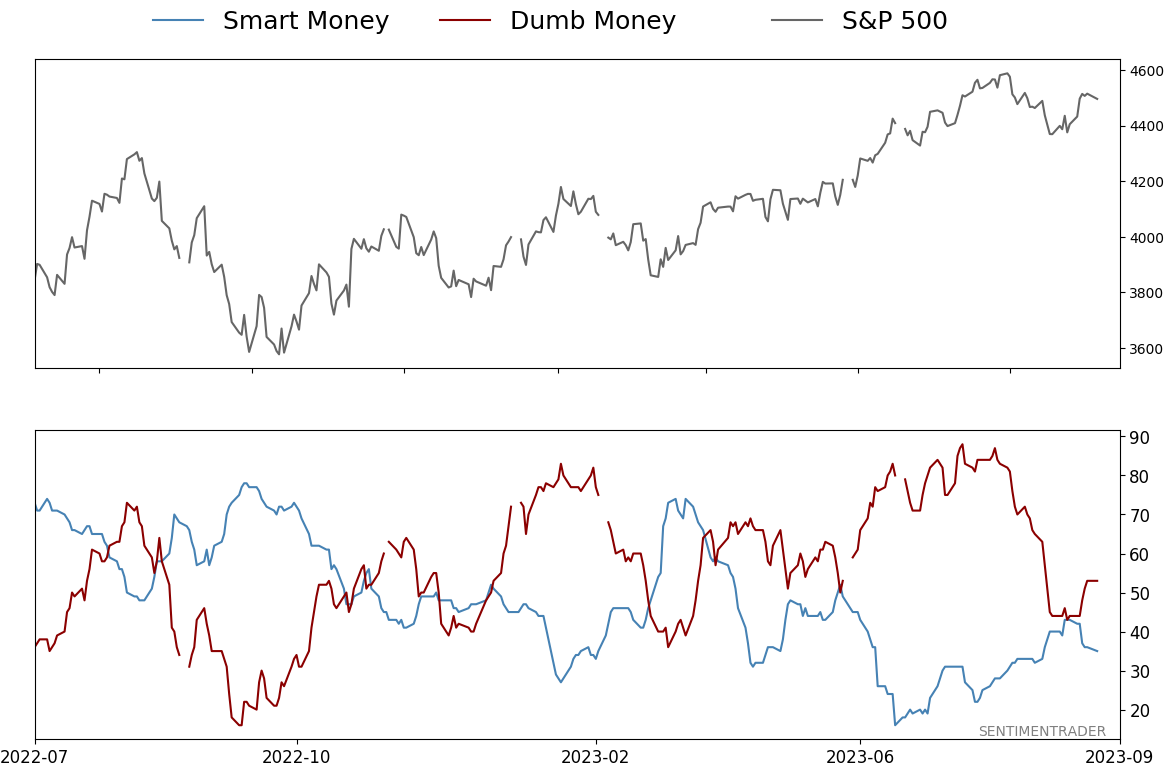
Smart Money Confidence: 35%
Dumb Money Confidence: 53%
|
|
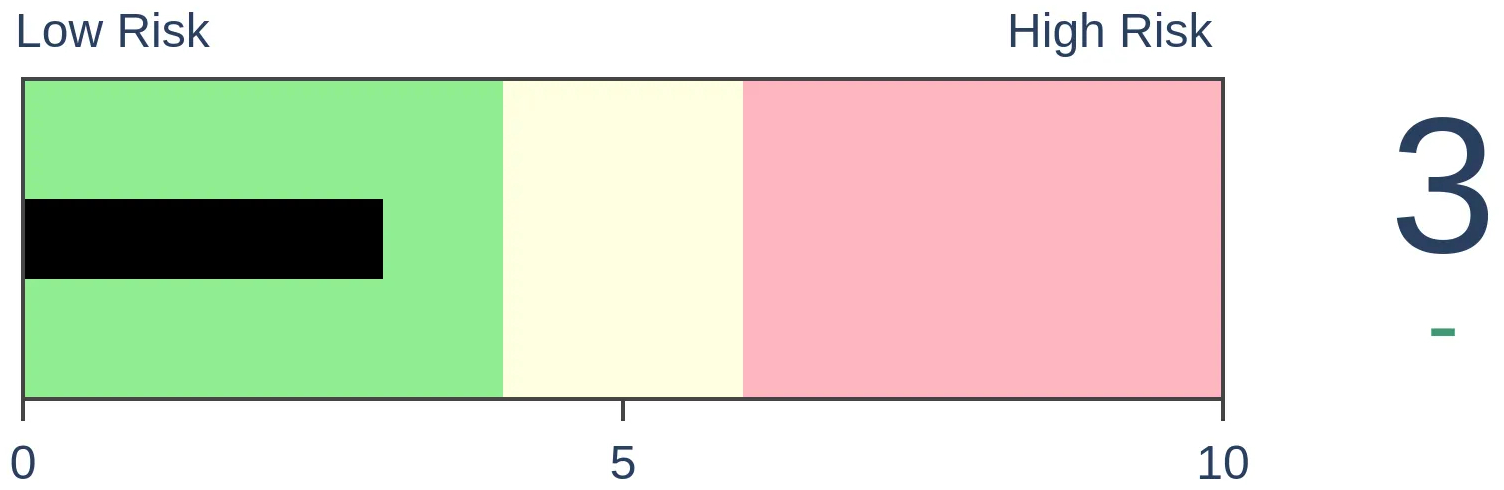
Risk Levels
Stocks Short-Term

|
Stocks Medium-Term

|
|
Bonds
|
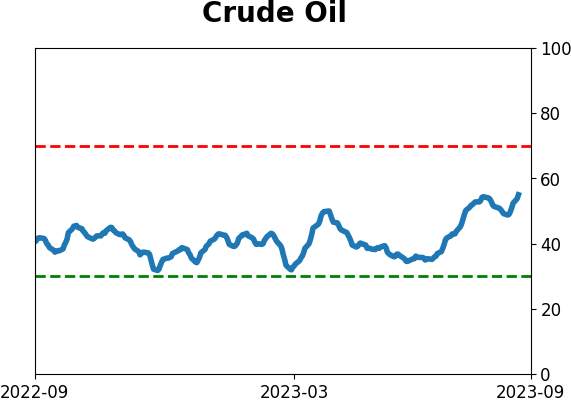
Crude Oil
|
|
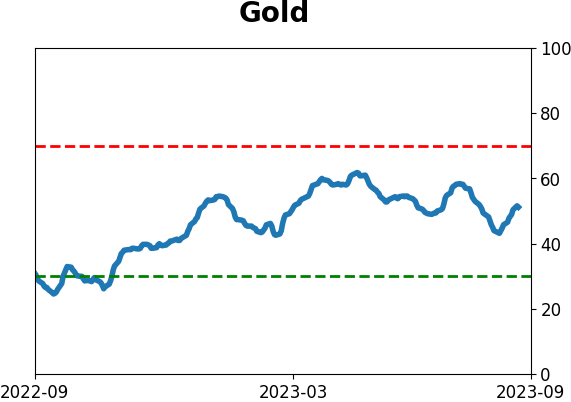
Gold
|
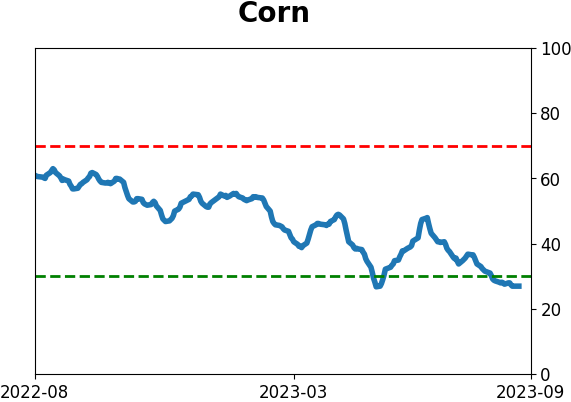
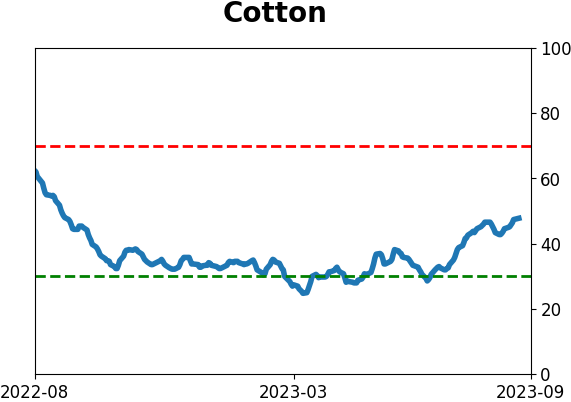
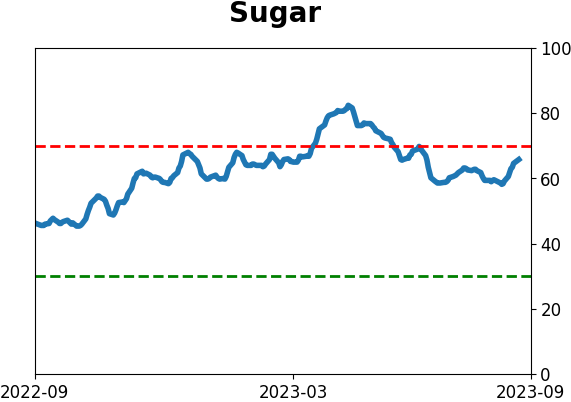
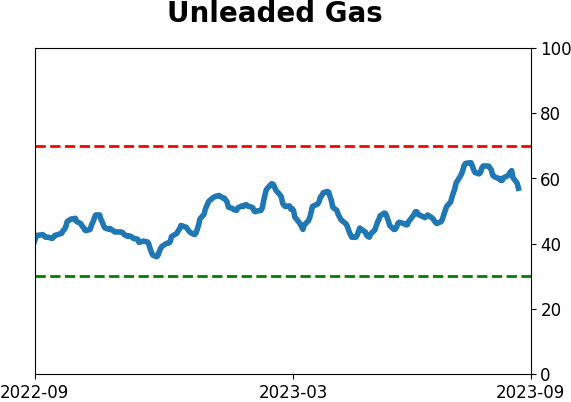
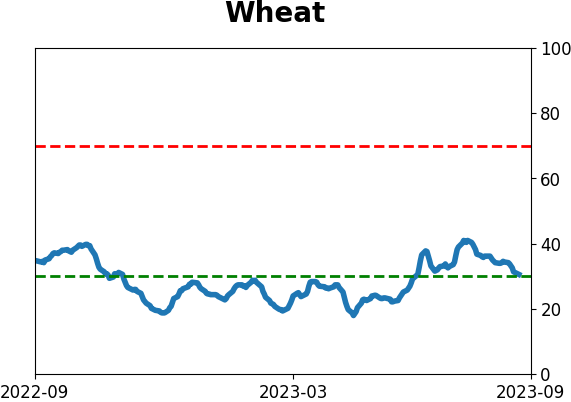
Agriculture

|
|
Research
By Jason Goepfert
BOTTOM LINE
When the Technology sector rallies, detractors typically point out that it's "only a few big stocks." That hasn't been the case this time, as the Up Issues Ratio for the sector has cycled from a deep oversold to a deep overbought reading. That has tended to precede more gains, even during a long-term uptrend.
FORECAST / TIMEFRAME
None
|
Key points:
- The Technology sector has quickly cycled from a deep pullback to a rally
- More than two-thirds of stocks in the sector advanced
- Similarly quick and broad cycles preceded further gains even when the sector was near a previous high
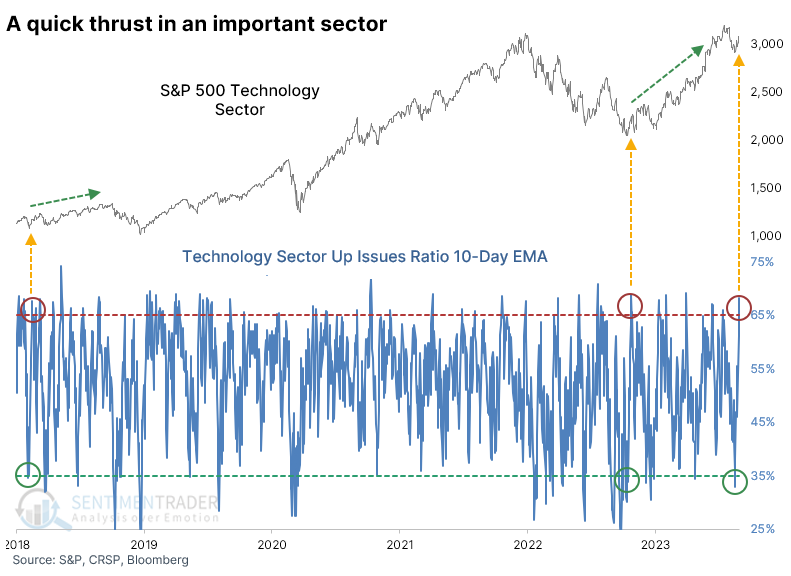
The Tech sector has enjoyed a quick - and broad - advance
The Technology sector has enjoyed a quick rebound from a scare during August. It wasn't just a few of the big names that get all the attention driving the rally, either. The advance/decline line for the sector showed broad and impressive gains.
Using a 10-day exponential moving average of the Up Issues Ratio for the sector, we can see that it has cycled from an extremely oversold reading (below 35%) to an extremely overbought one (above 65%) in quick succession. The stocks managed similarly impressive feats only twice before in the past five years, both preceding sustained gains.
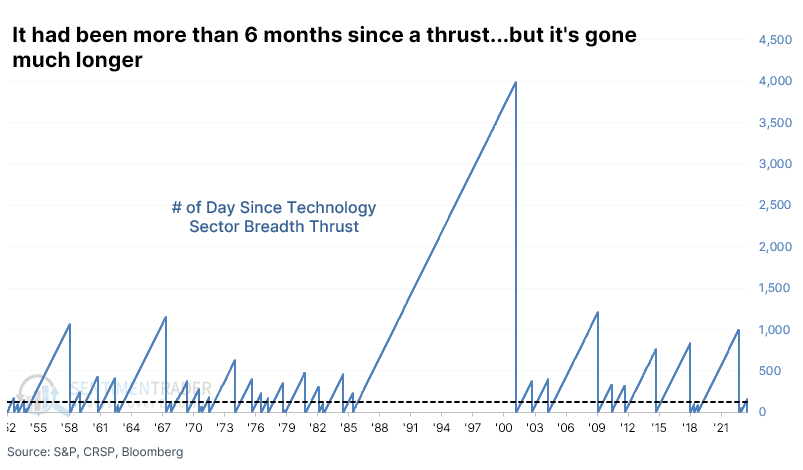
It had been more than six months since the sector witnessed a similar thrust, which is a relatively long time. It's still far from the longest streak, which went over a decade, as hard as that is to believe. It has gone longer than a year multiple times.
Thrusts typically preceded higher prices, and only rarely a blow-off
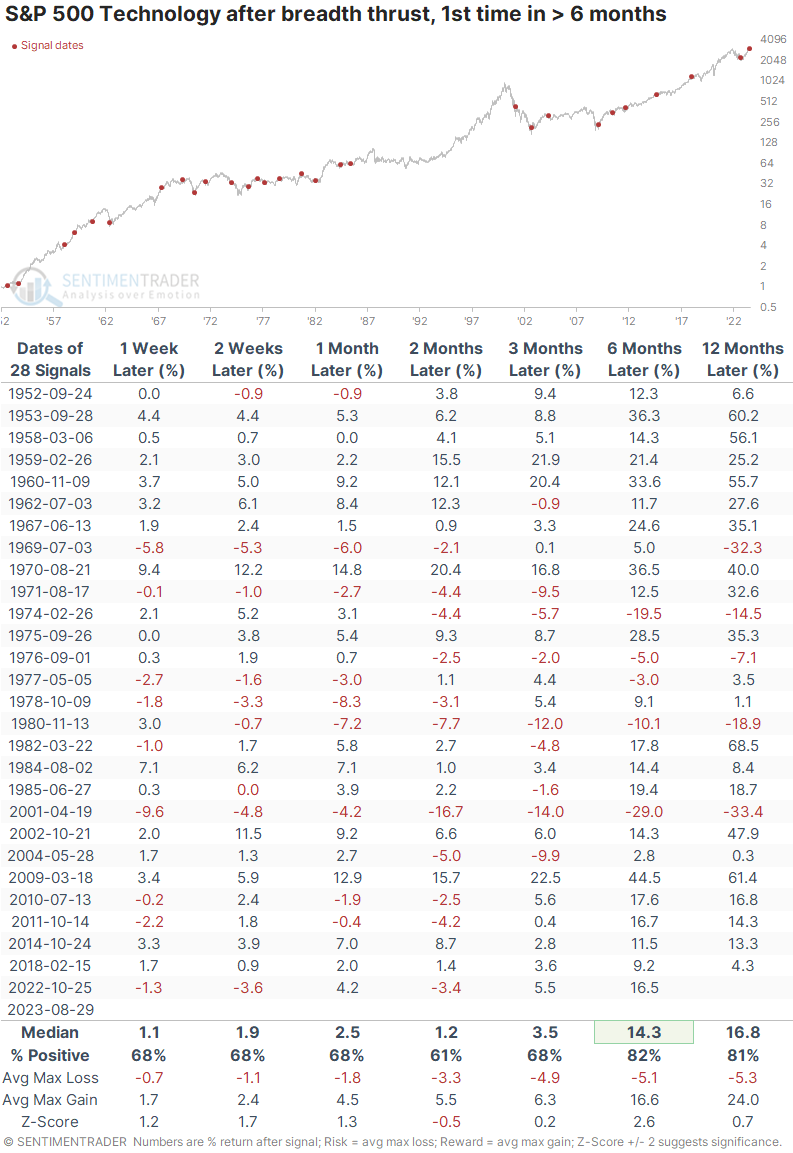
The table below shows every time over the past 70 years when Technology stocks witnessed similar behavior. These are times when the 10-day EMA of the Up Issues Ratio for the sector cycled from below 35% to above 65% within ten trading days, and it had to be the first instance in at least six months.
The sector's returns going forward were pretty good across time frames. It was particularly good over the next six months, with an 82% win rate and a +14.3% median return, well above a random return. The ratio of maximum gains to maximum losses was impressive over the next six to twelve months.
With the sector in an established long-term uptrend and not far from a multi-year high, maybe there is a risk that this kind of move is a blow-off. It's unlike some of the other thrusts that were coming after a prolonged and severe decline.
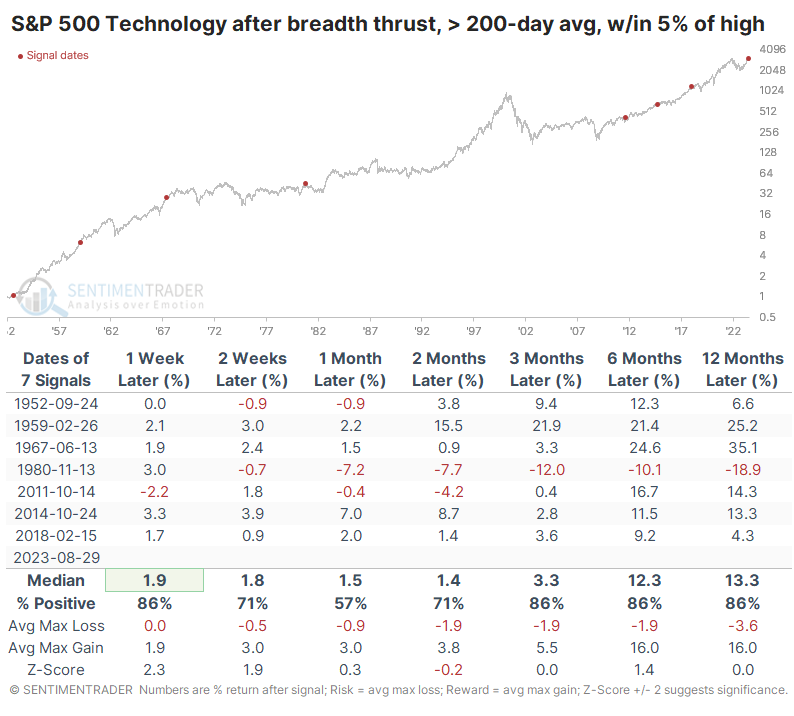
To look for similar instances, the table below filters the signals to only include those that triggered when the S&P 500 Information Technology sector was above its 200-day moving average and was within 5% of its previous three-year high.
One of them in 1980 did, indeed, mark a blow-off move, and the sector suffered a double-digit loss over the next 3-12 months before embarking on one of the great bull runs of all time. But none of the other signals did, and Tech stocks rose over the medium- to long-term each time.
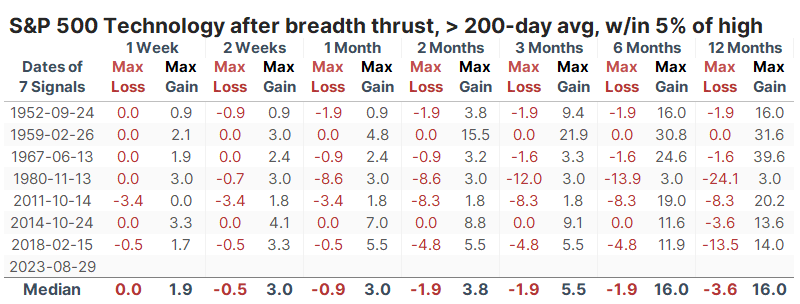
The table of maximum gains and losses across each time frame shows that losses tended to be muted up to six months later. Two of the seven signals witnessed losses at some point of more than -5%, while all but one showed gains of more than +5%.
What the research tells us...
A handful of stocks generate most of the investor interest and media attention, but the rally over the past week+ has been broader than many seem to give it credit for. Within the Technology sector specifically, the advance was fairly broad, with an average of more than two-thirds of the stocks rising. When that happens after a steep selloff in the shares, the sector tends to keep rising. Even when it occurs near a previous high, it has only rarely indicated a blow-off move before a sustained decline. Much more often, it indicated a kick-off to even higher prices.
Indicators at Extremes
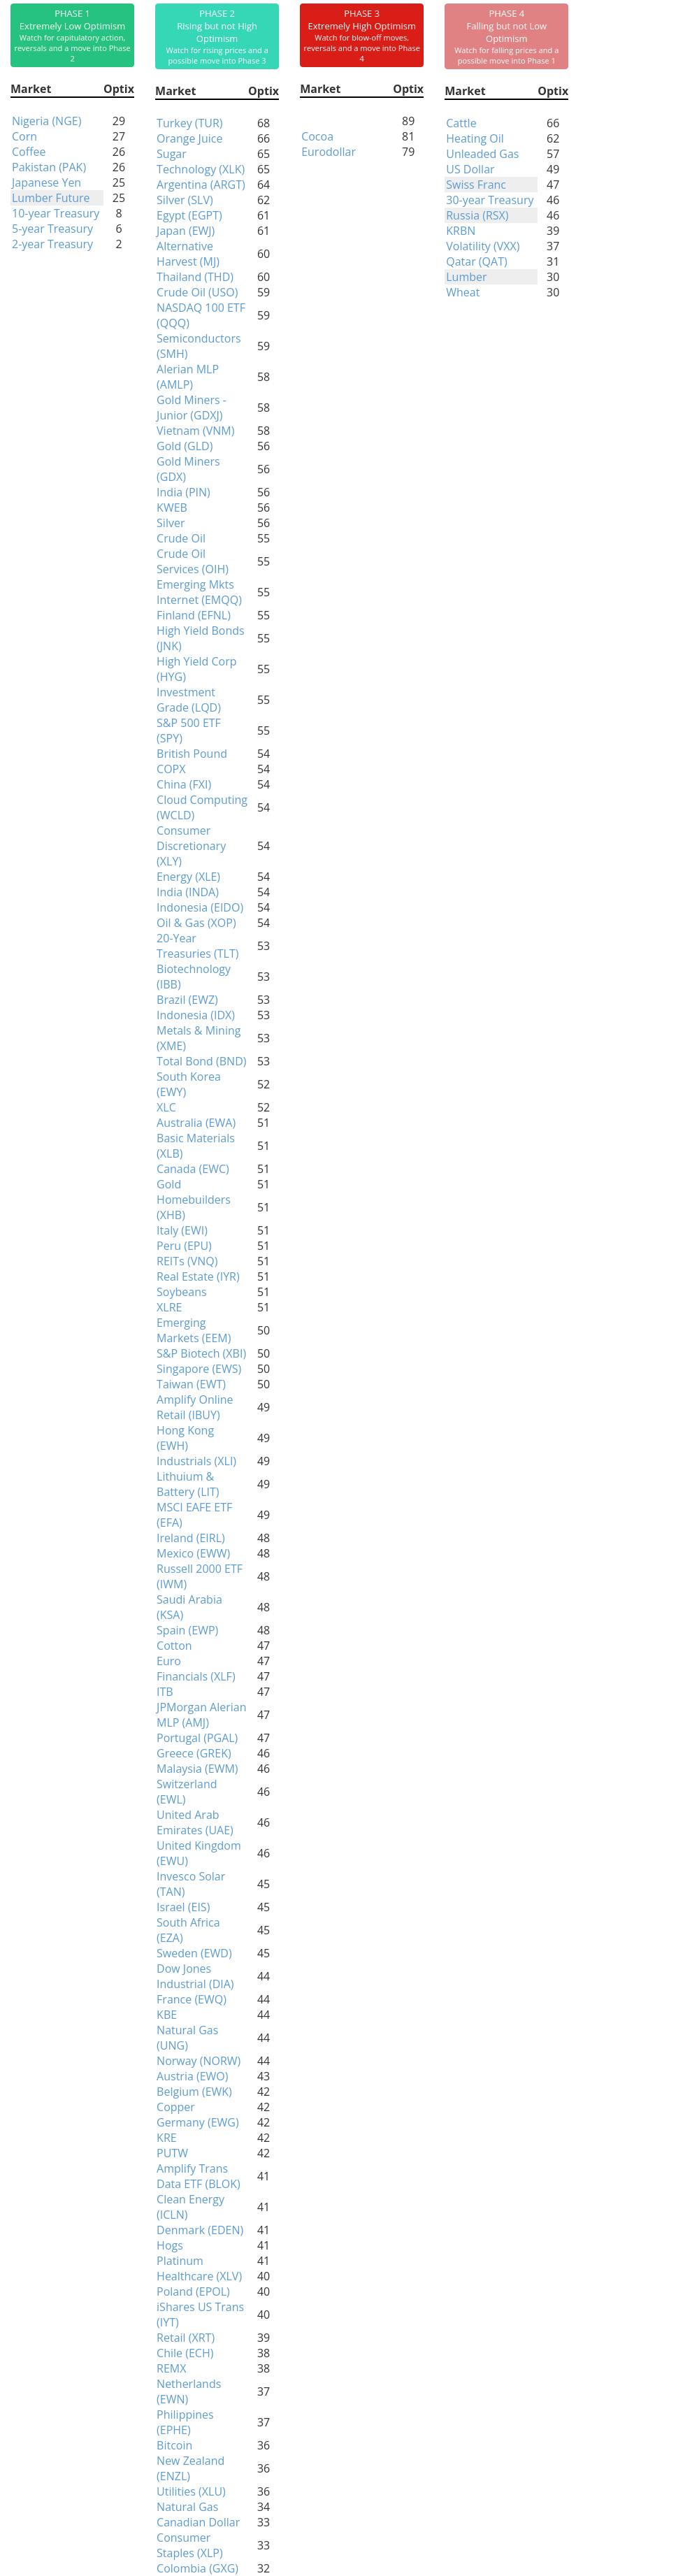
Phase Table
Ranks
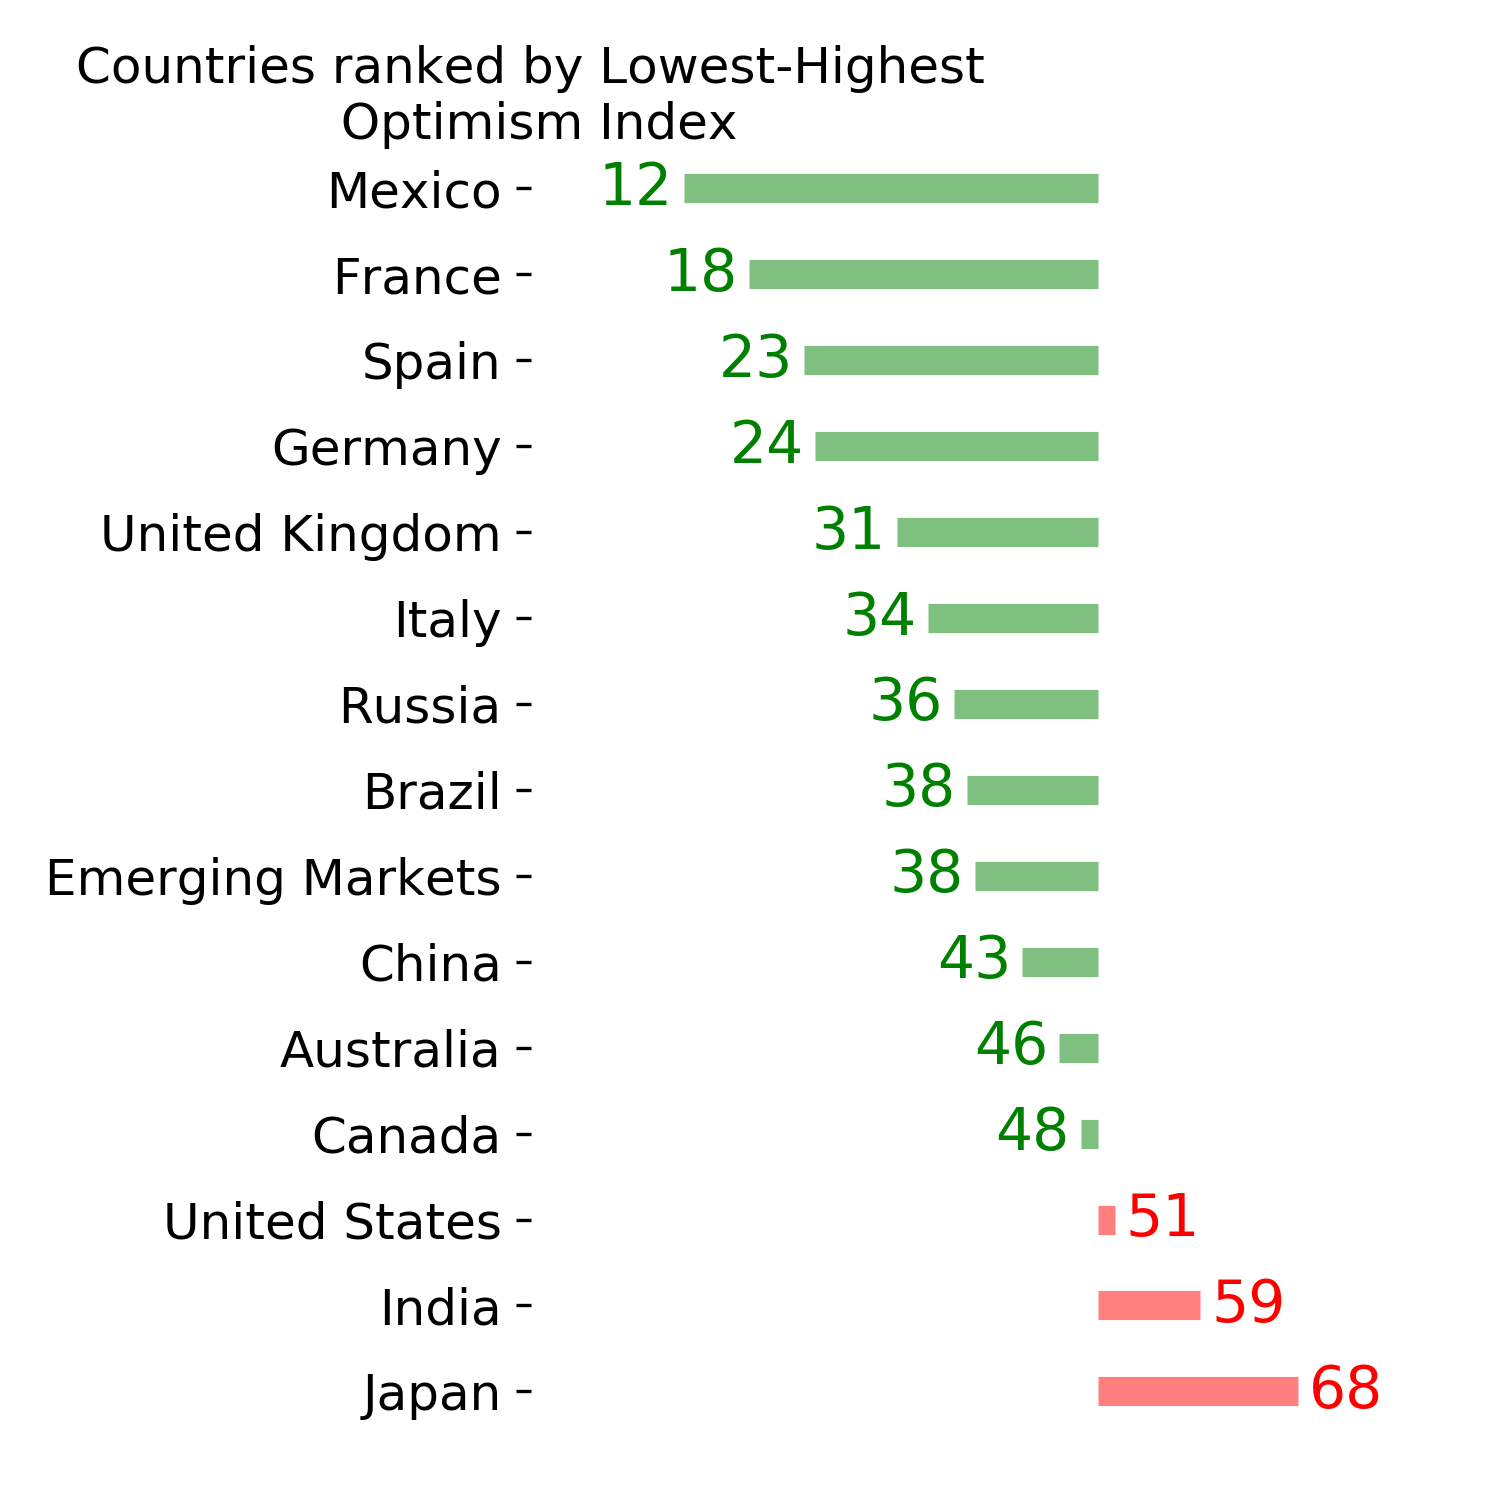
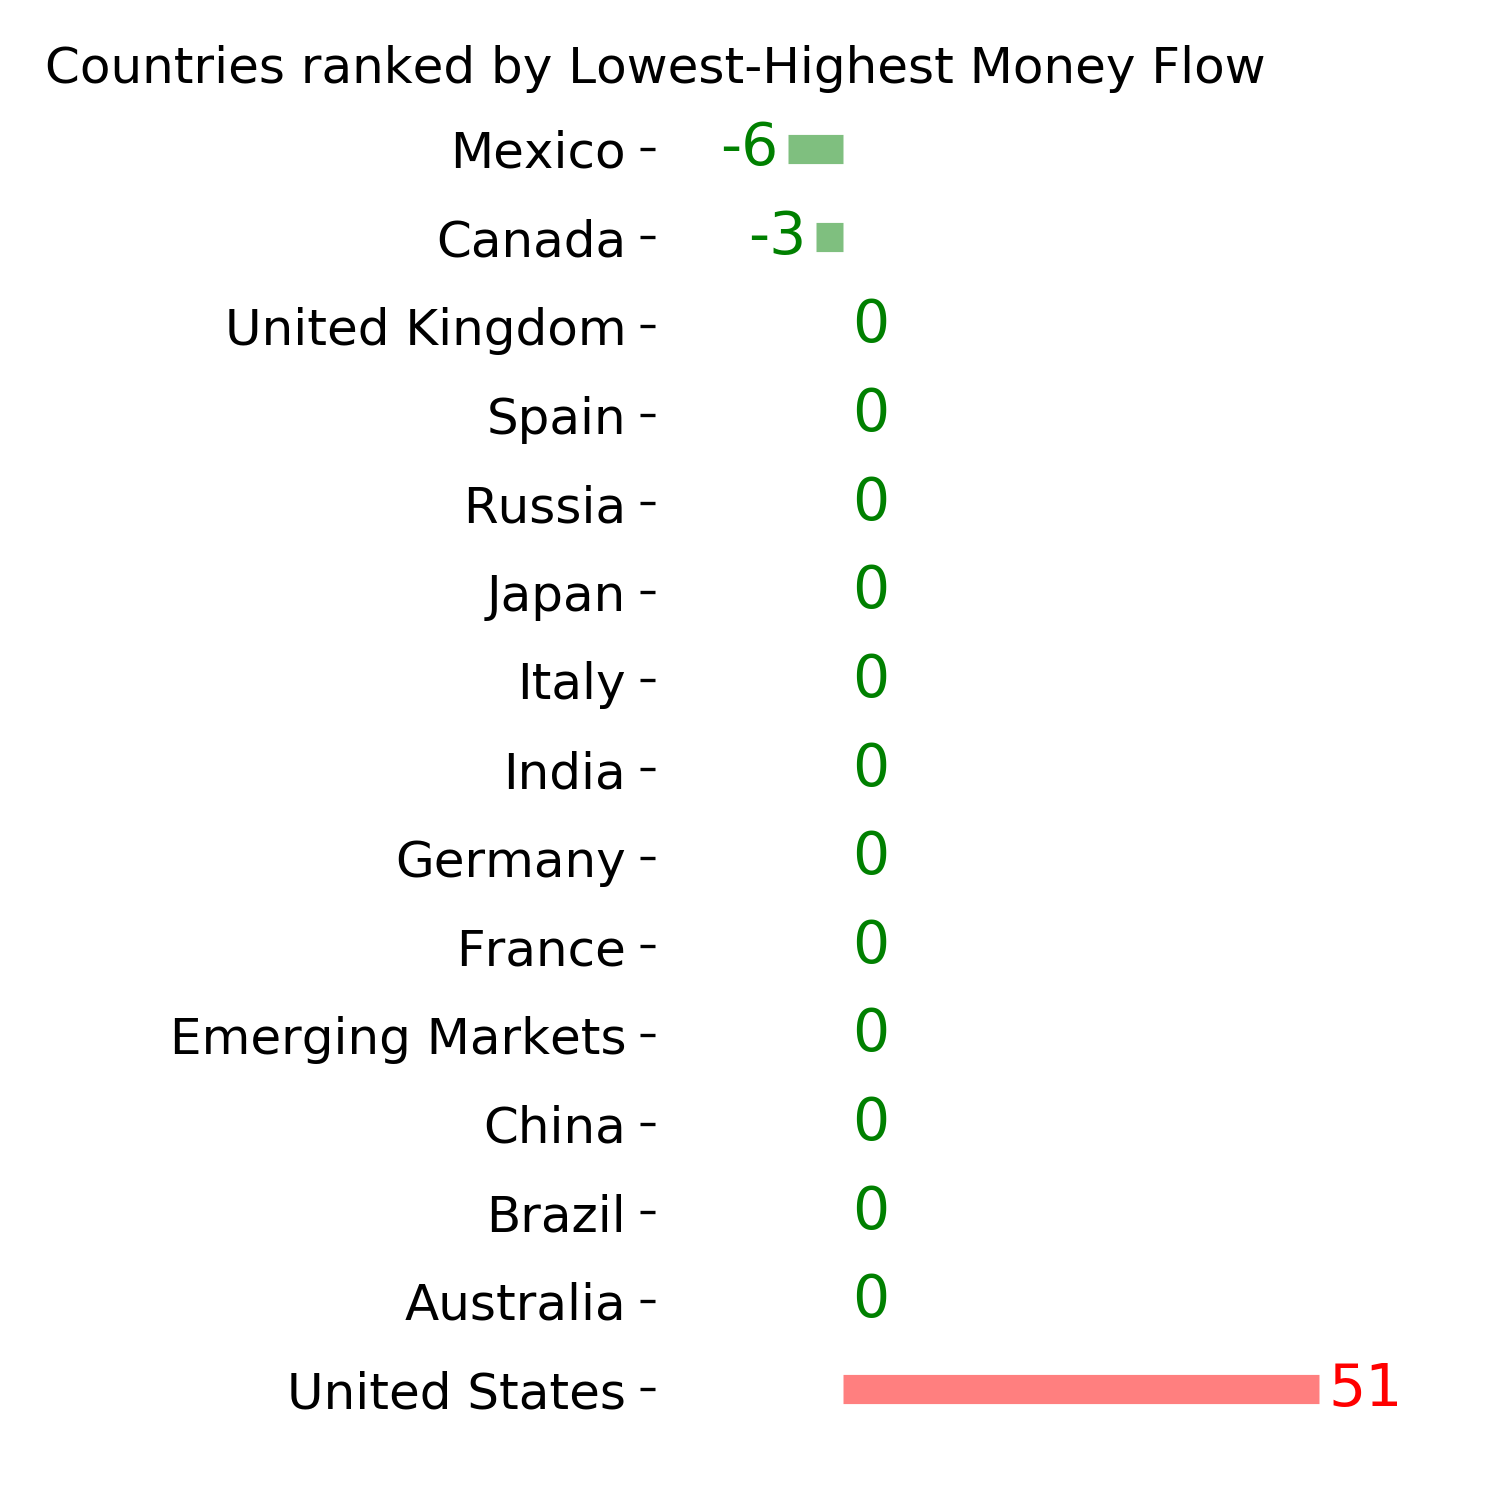
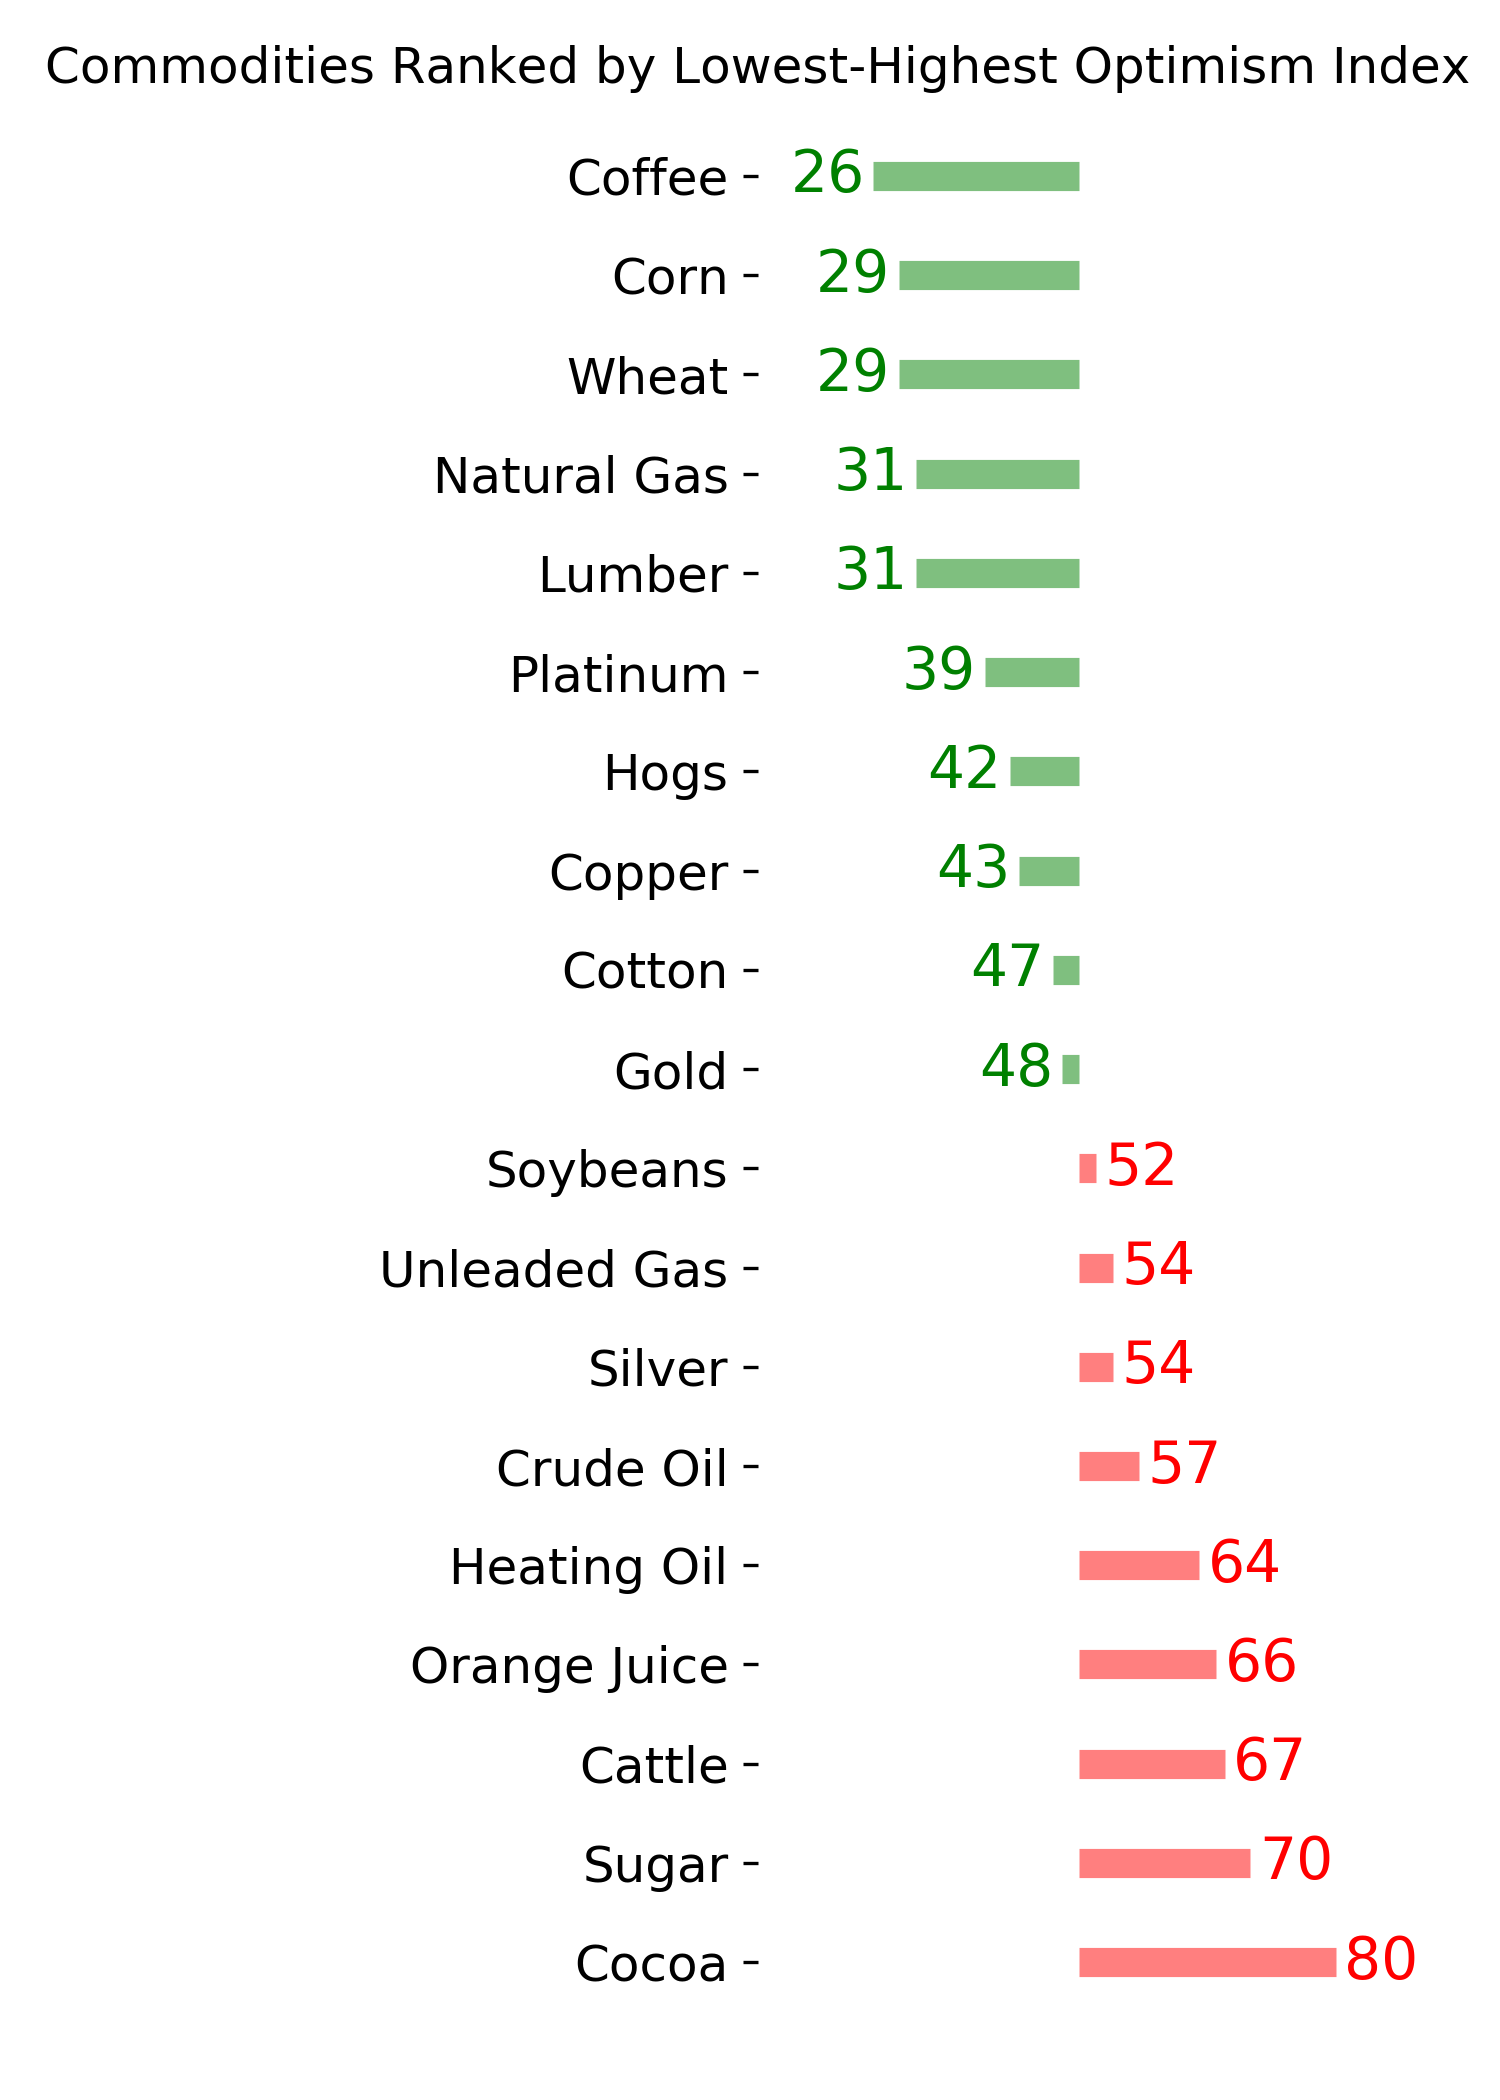
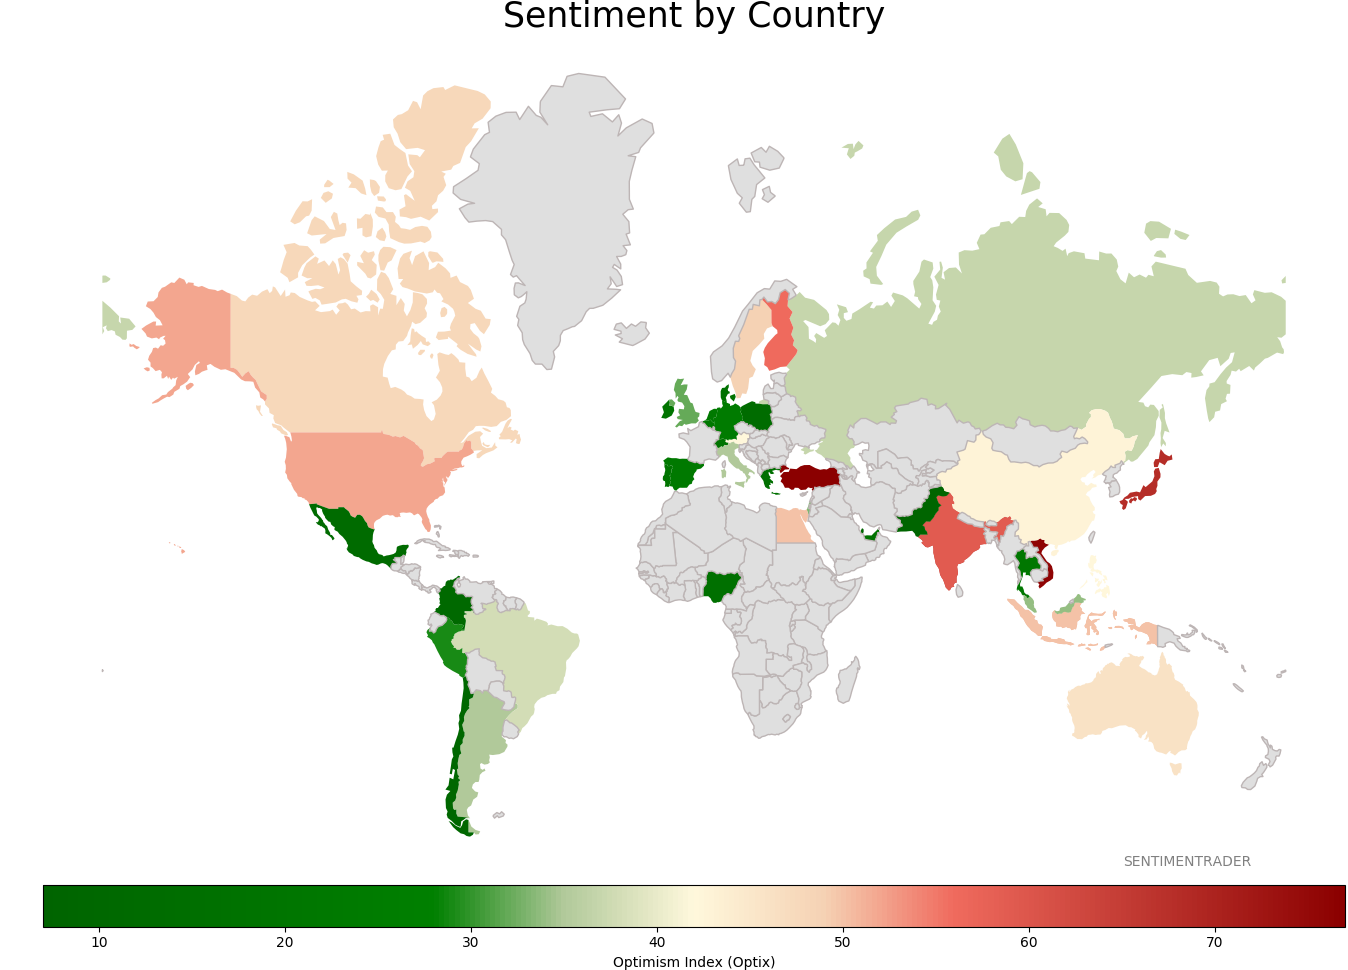
Sentiment Around The World
Optimism Index Thumbnails
|
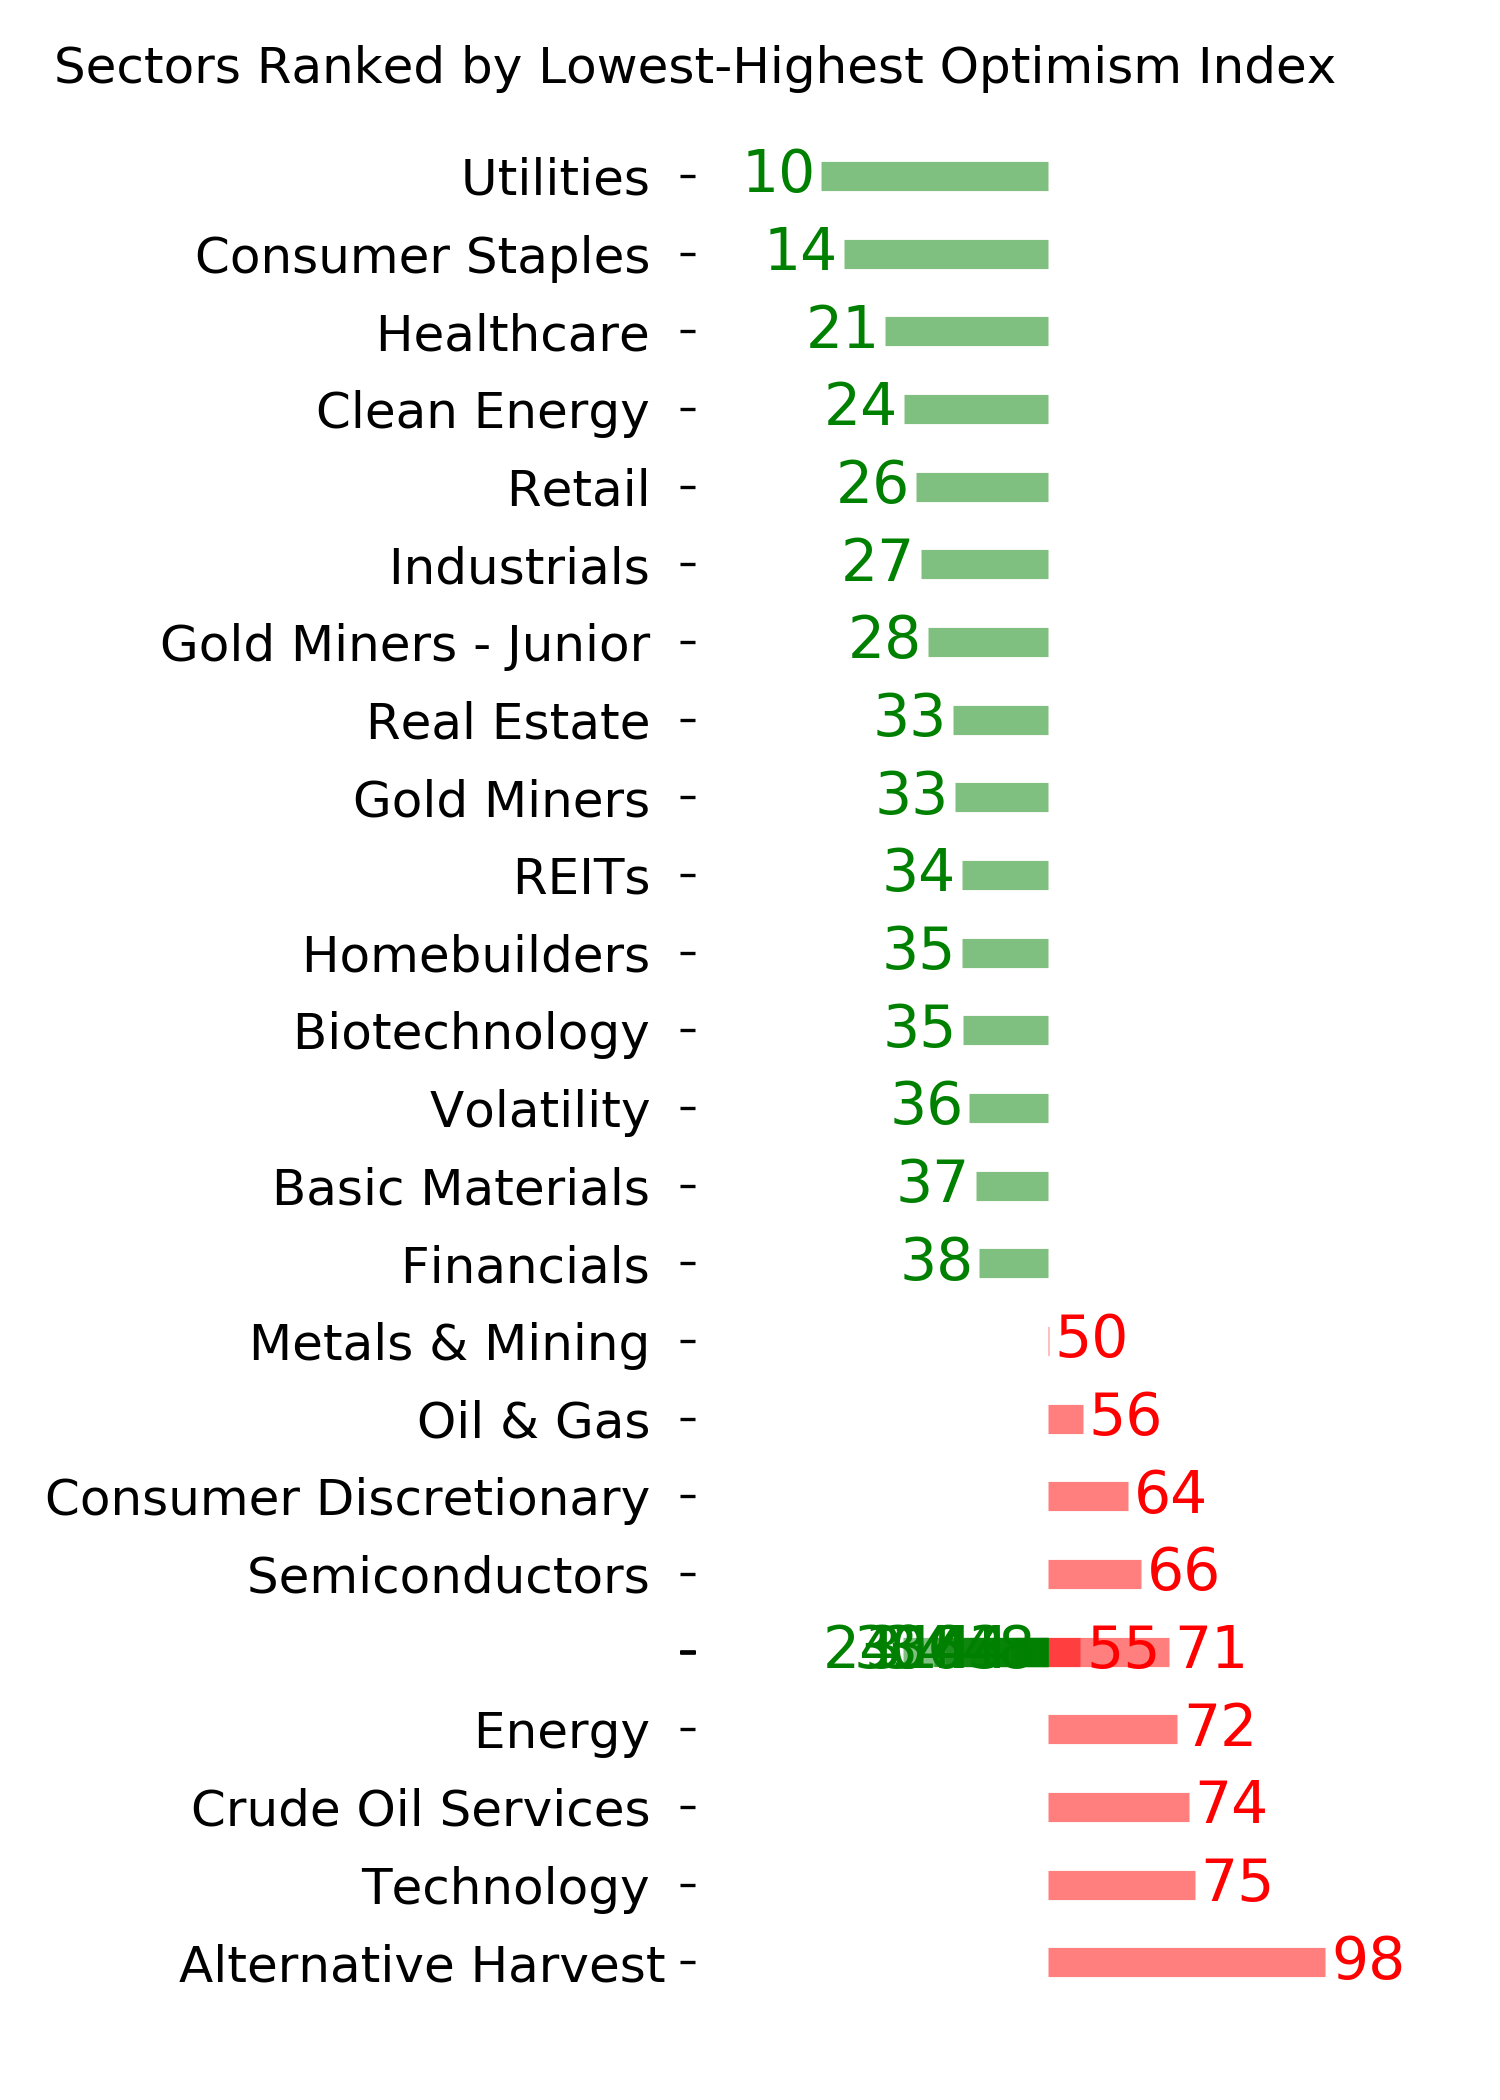
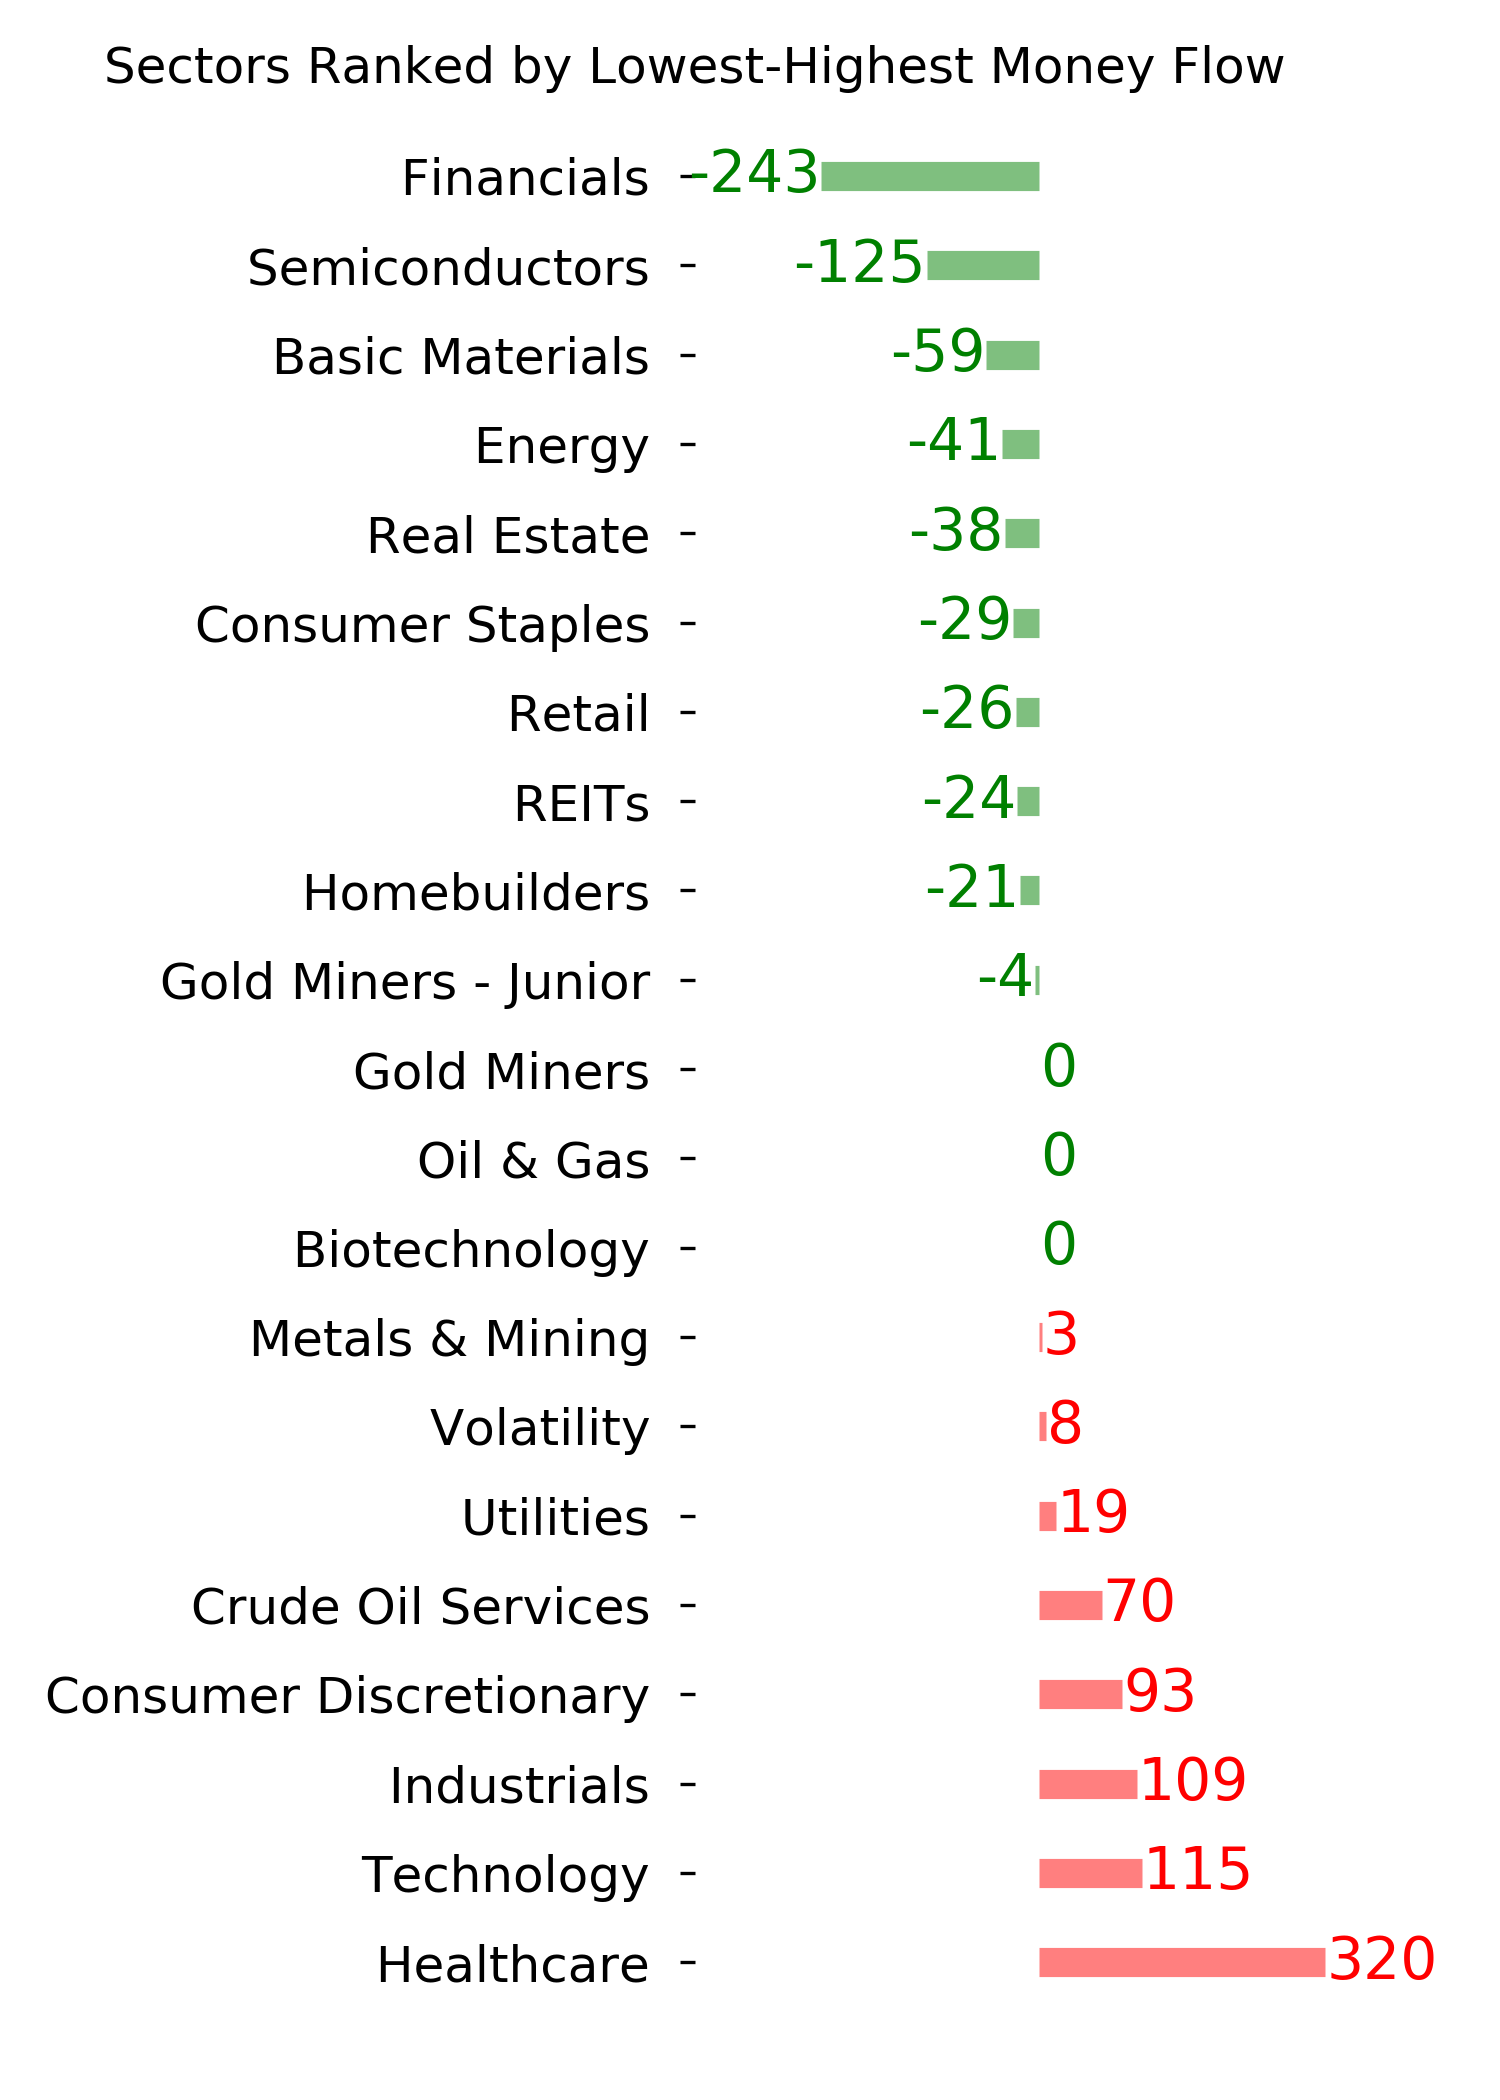
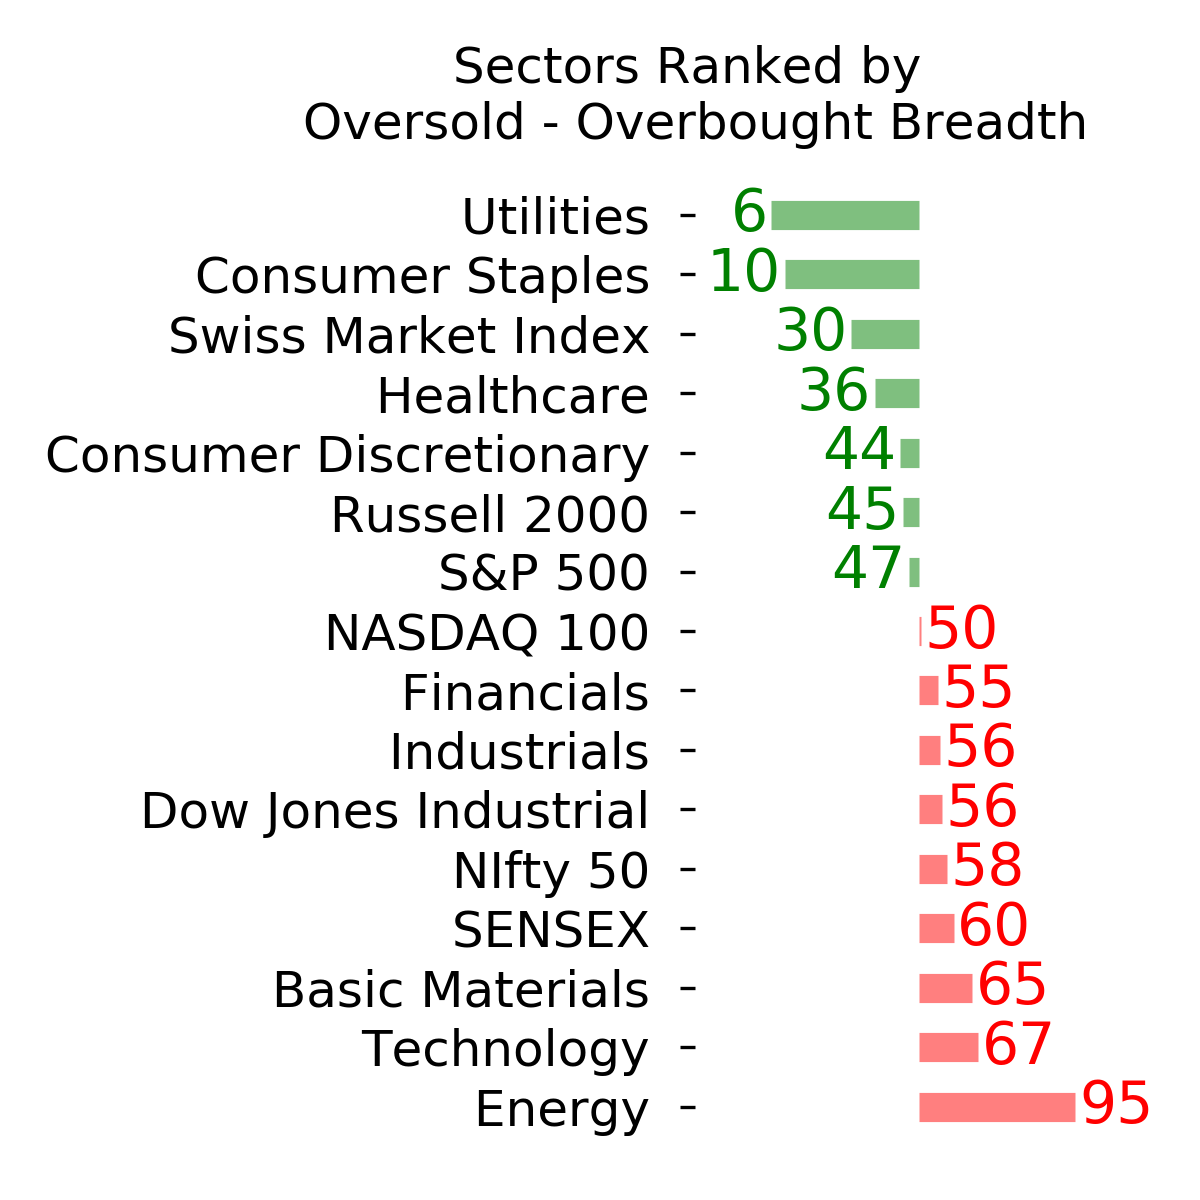
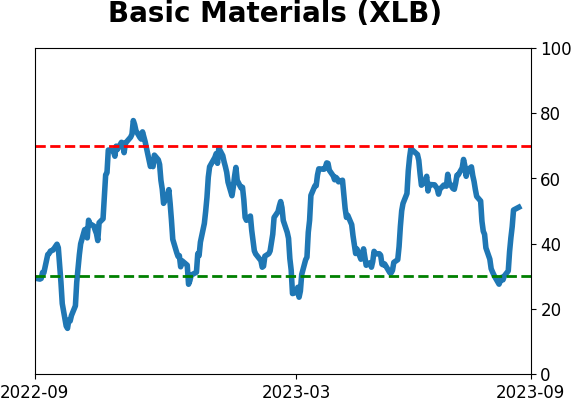
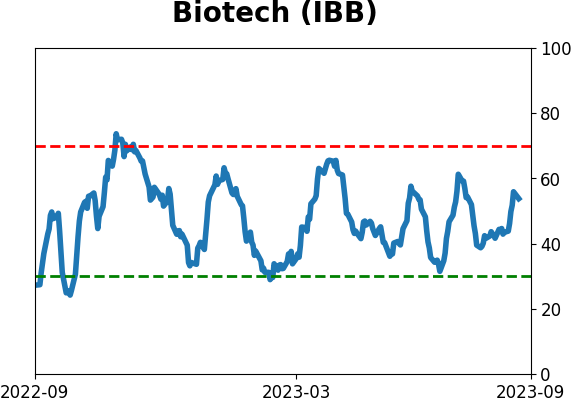
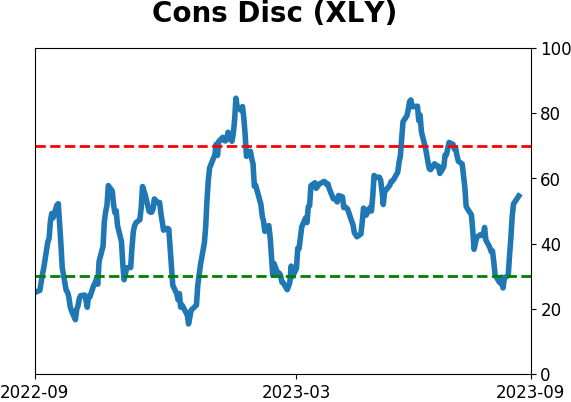
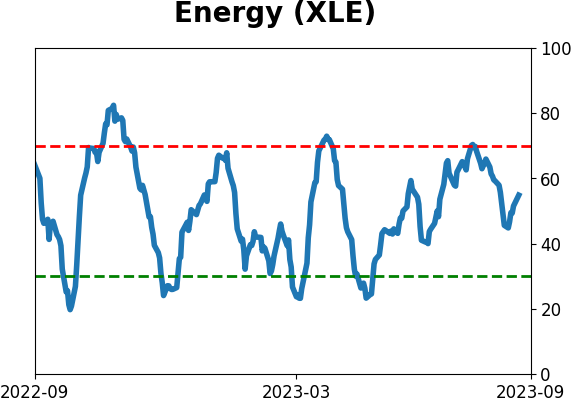
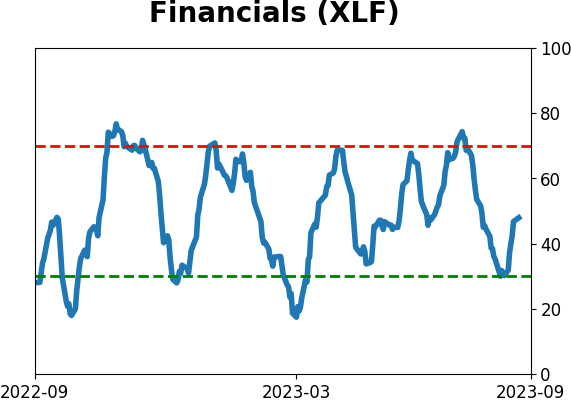
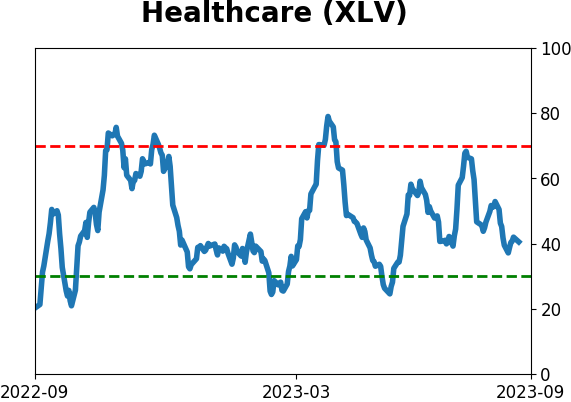
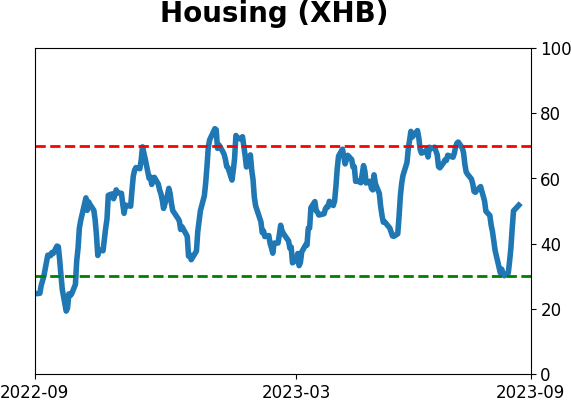
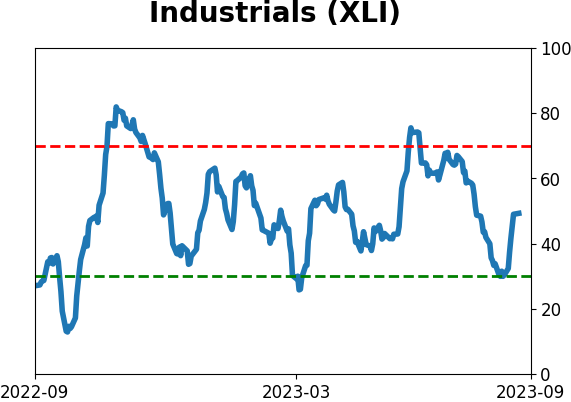
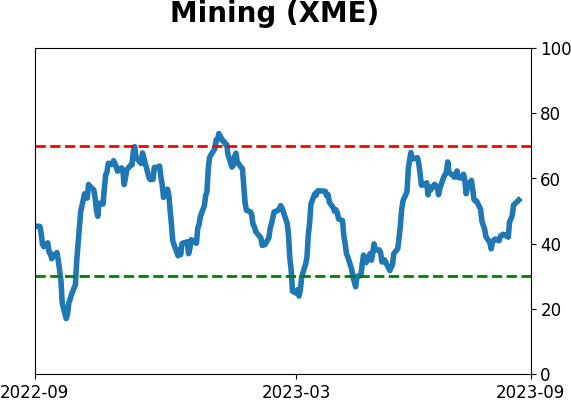
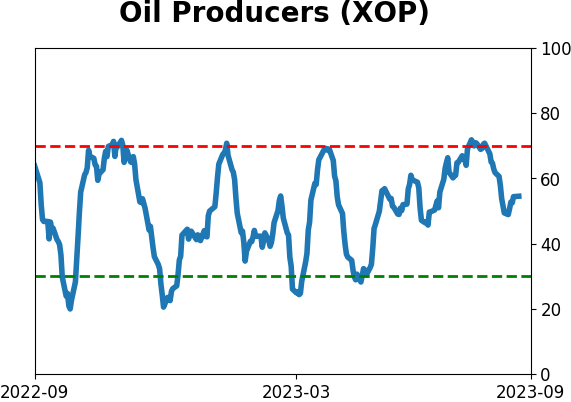
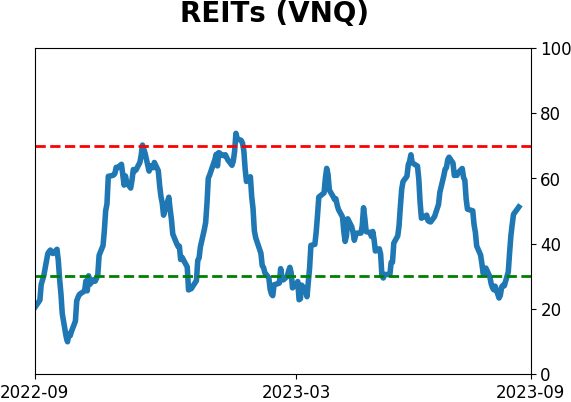
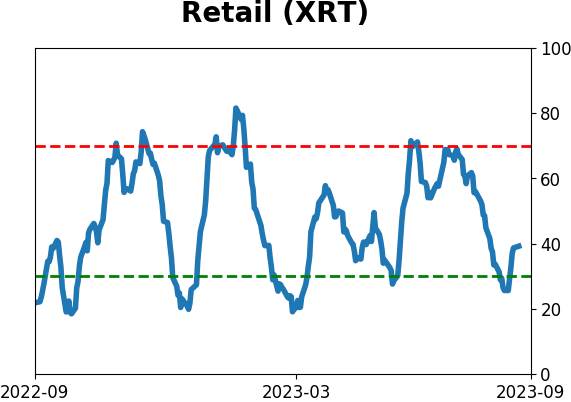
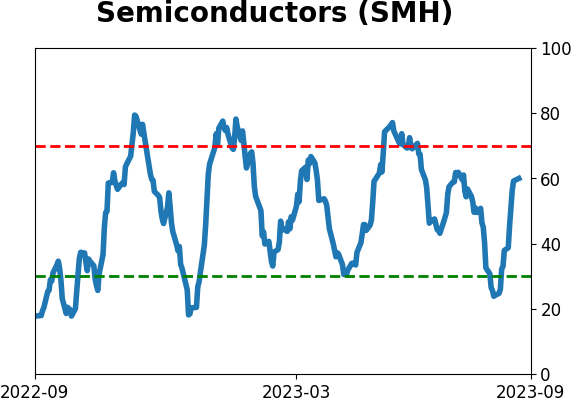
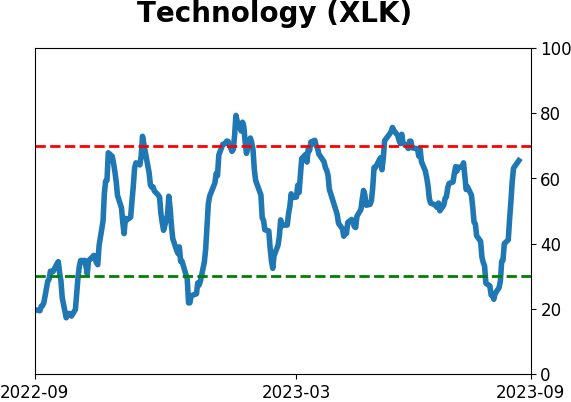
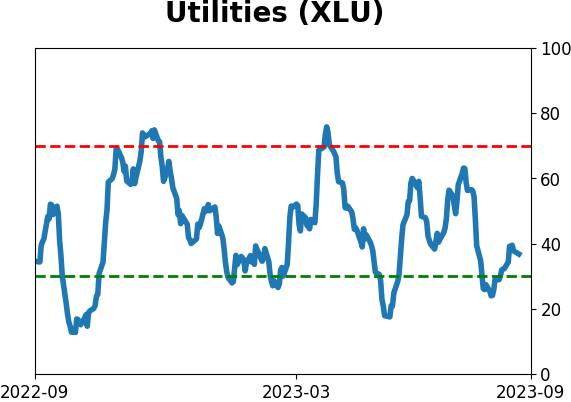
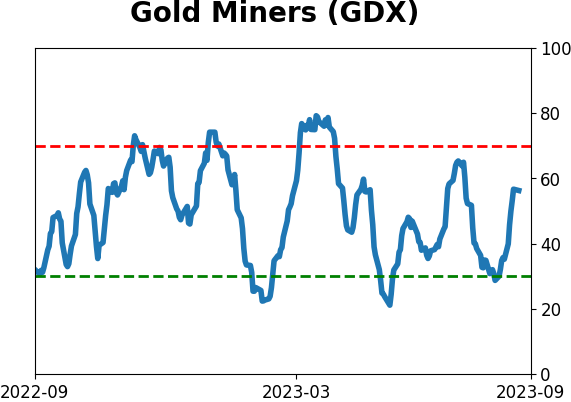
Sector ETF's - 10-Day Moving Average
|
|
|
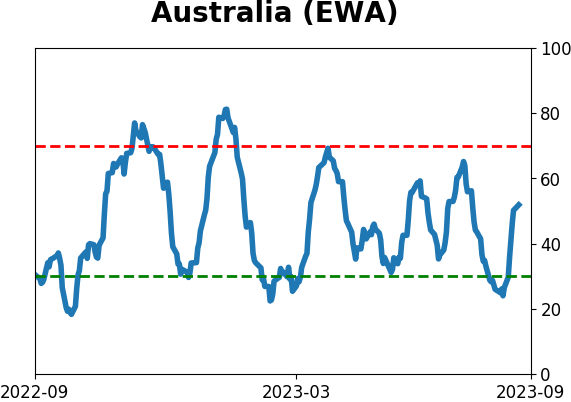
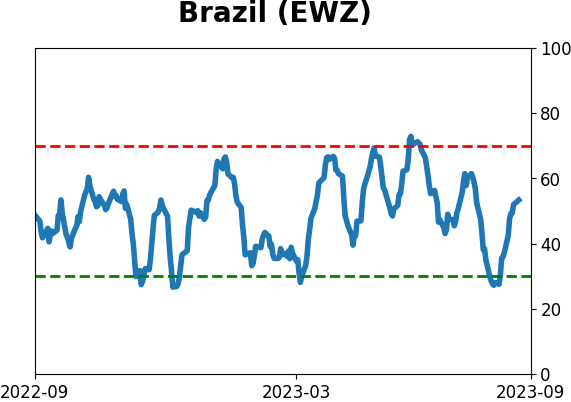
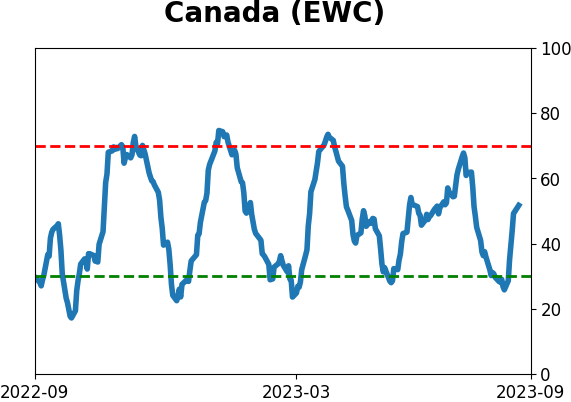
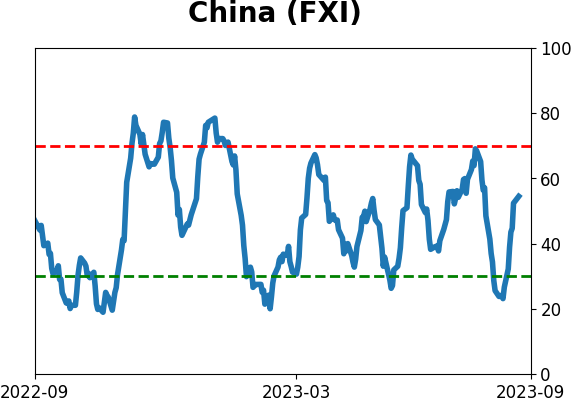
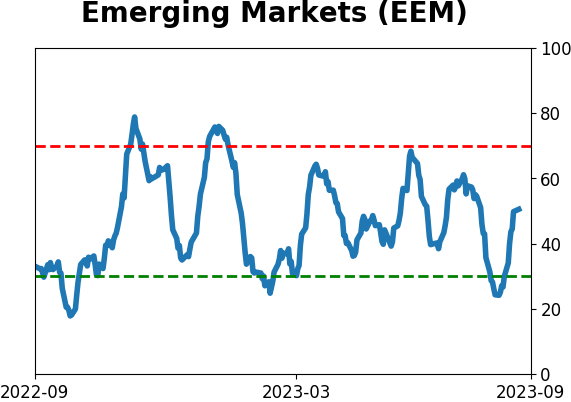
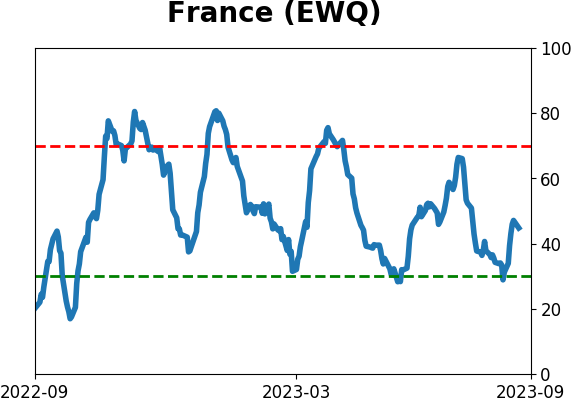
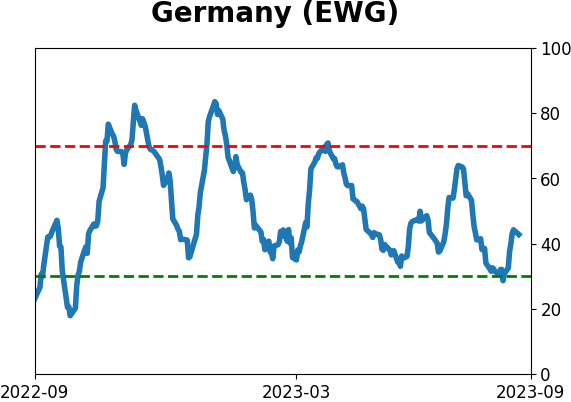
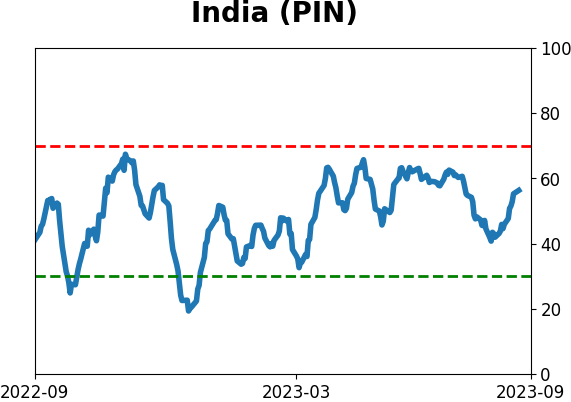
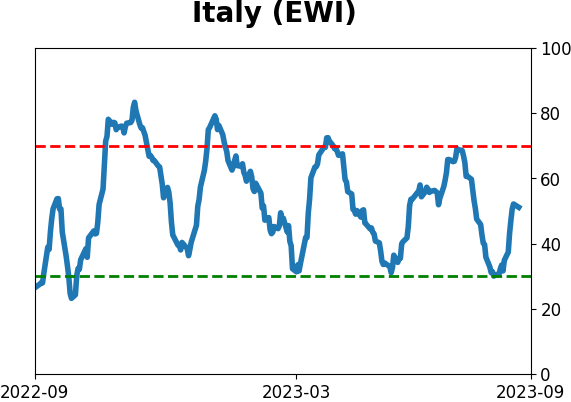
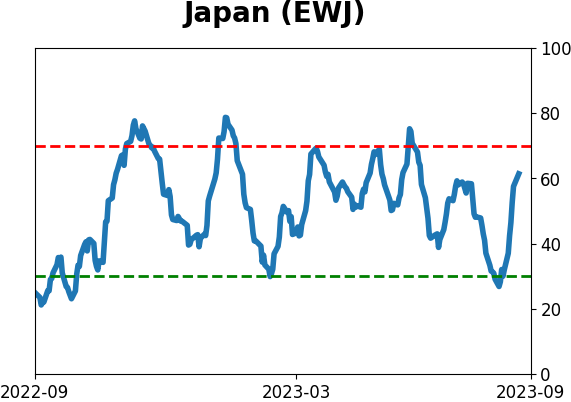
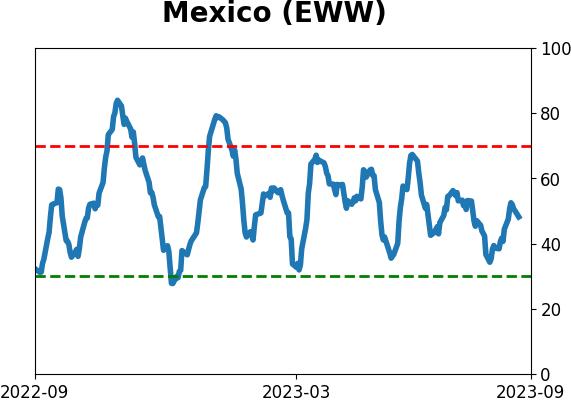
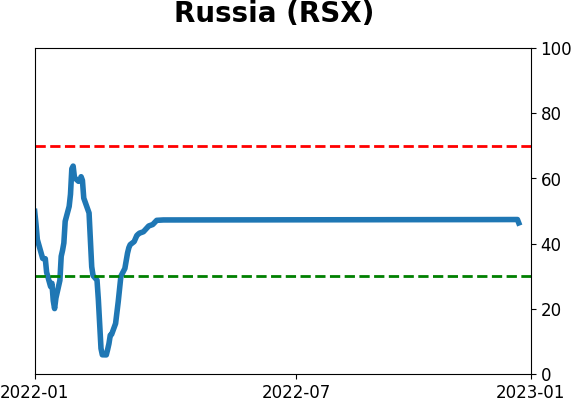
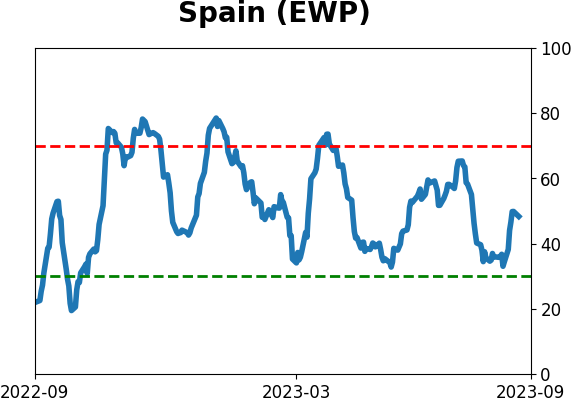
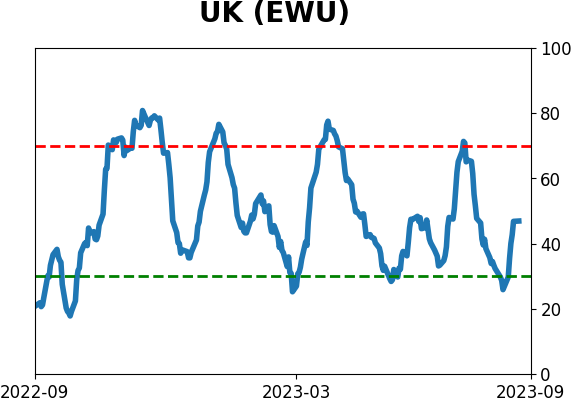
Country ETF's - 10-Day Moving Average
|
|
|
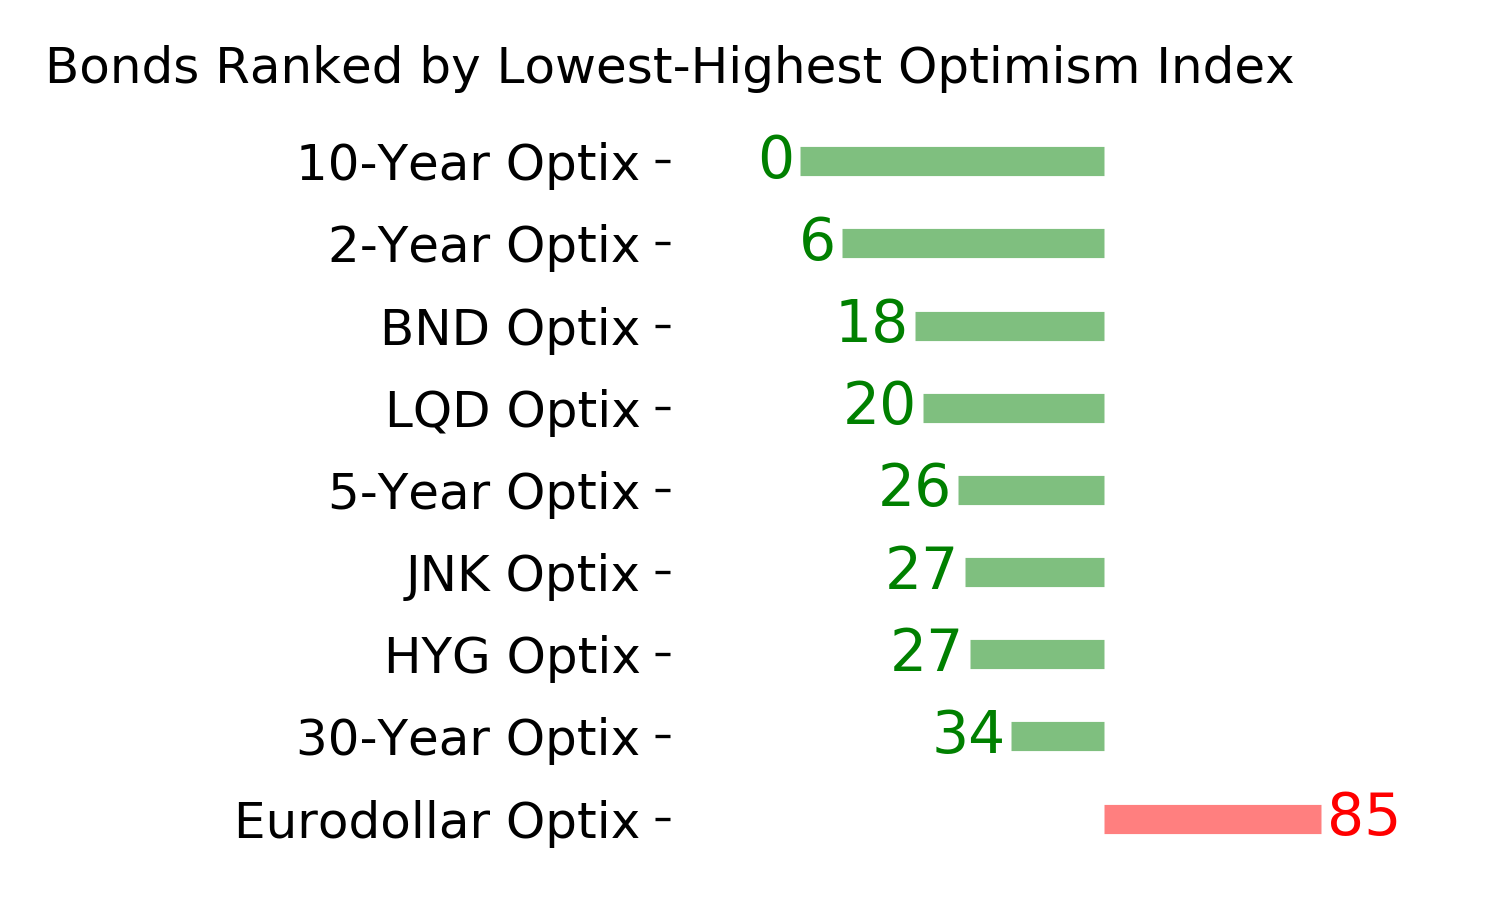
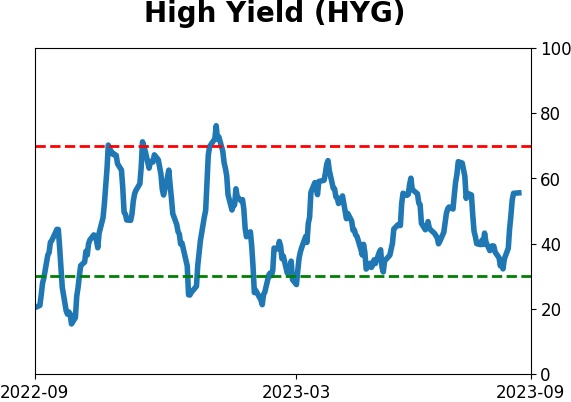
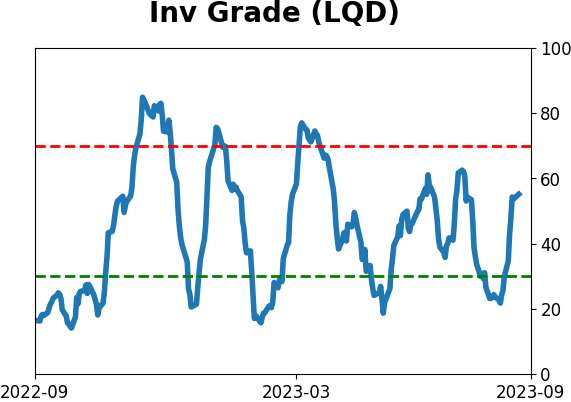
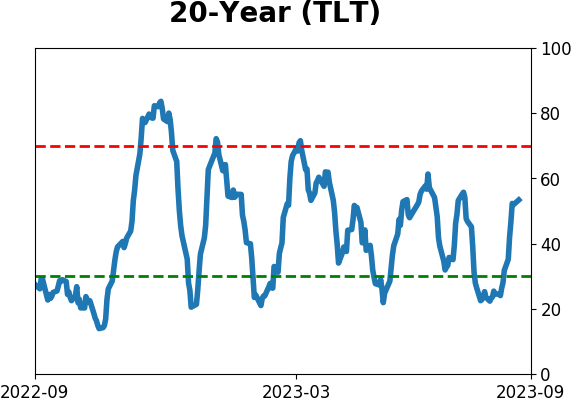
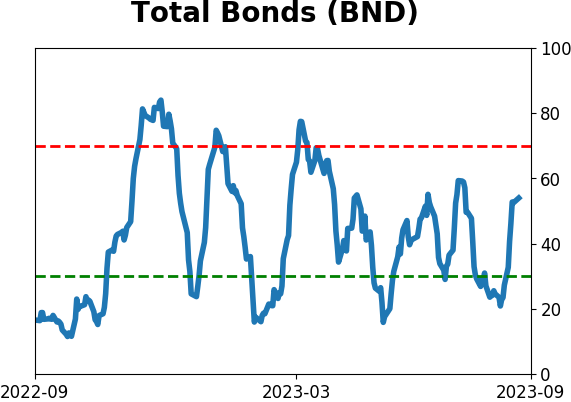
Bond ETF's - 10-Day Moving Average
|
|
|
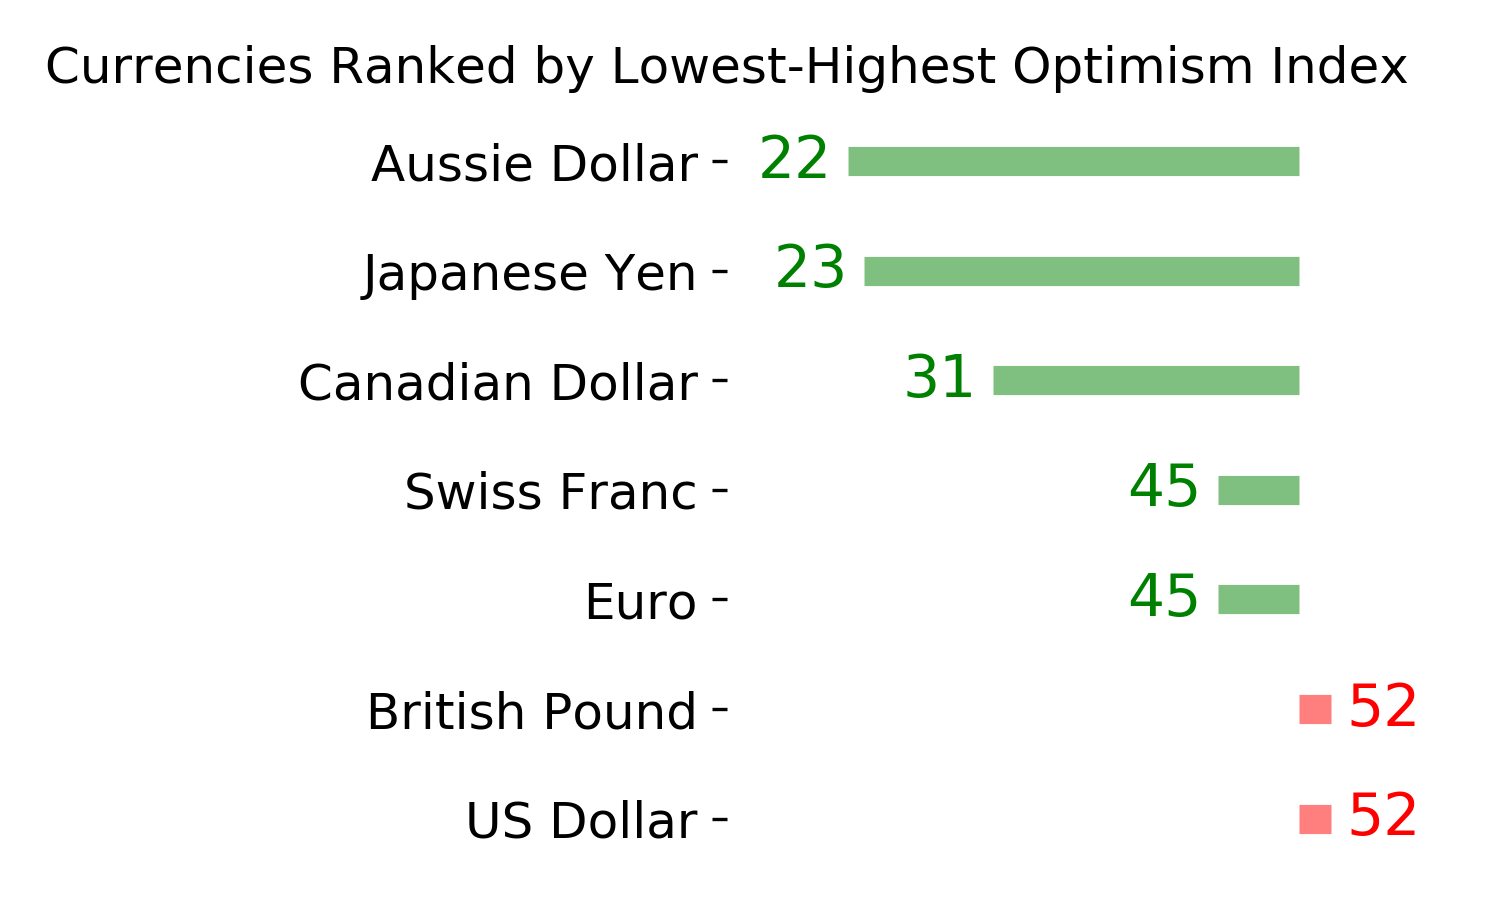
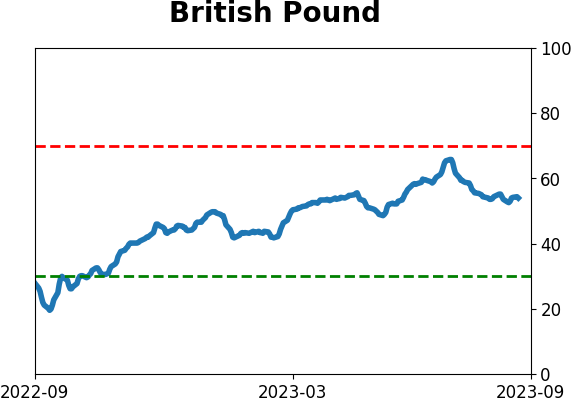
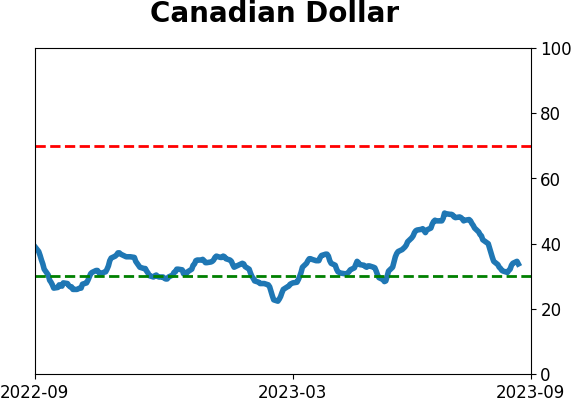
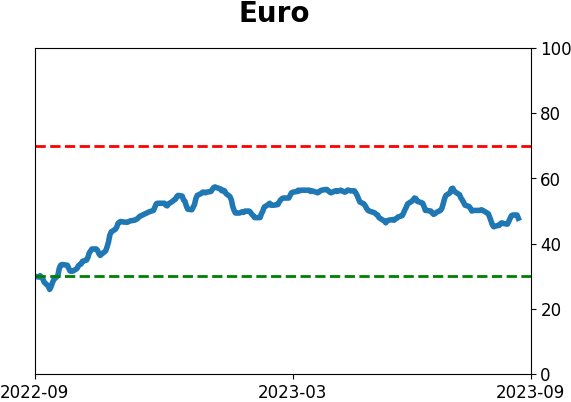
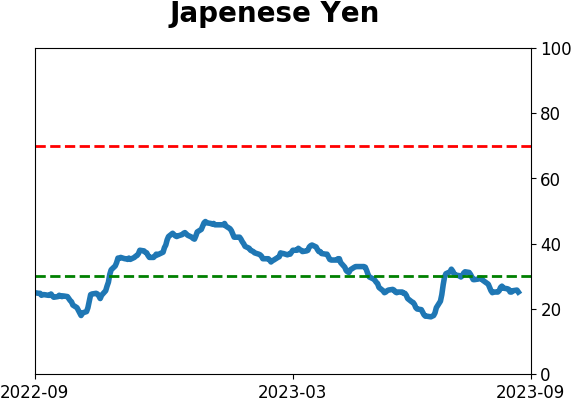
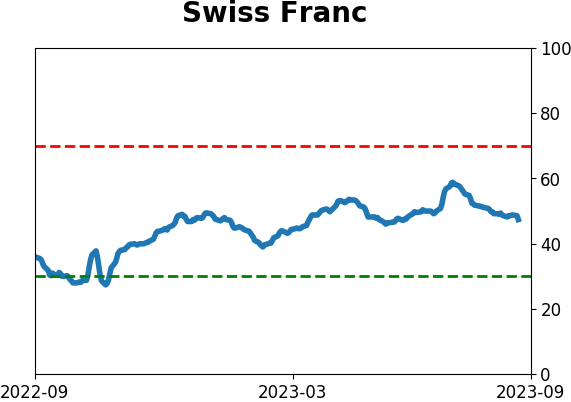
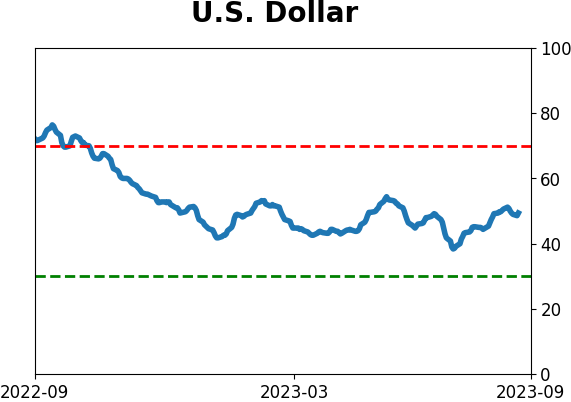
Currency ETF's - 5-Day Moving Average
|
|
|
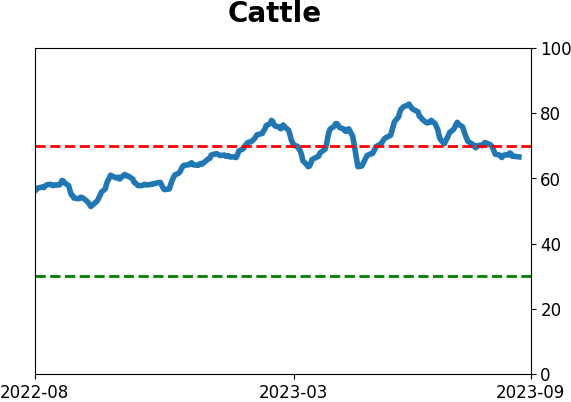
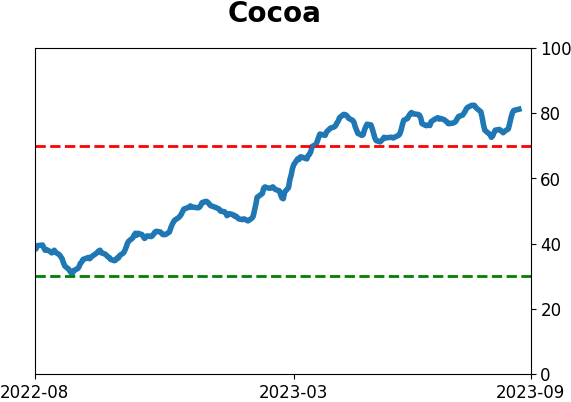
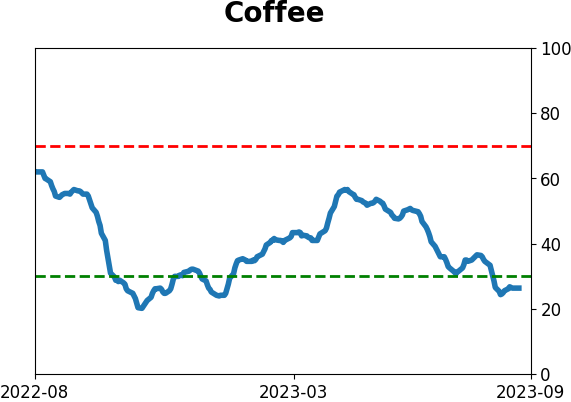
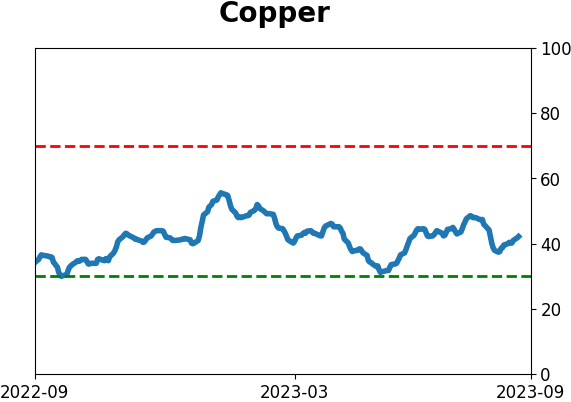
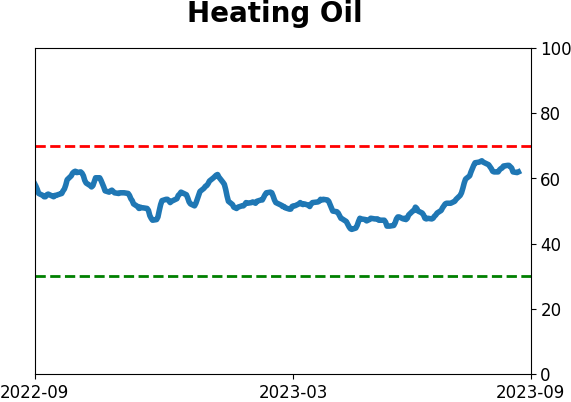
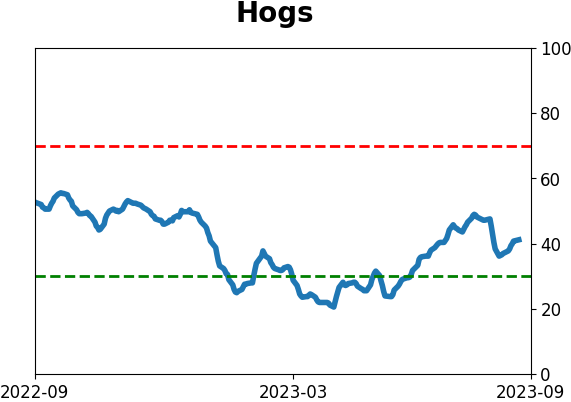
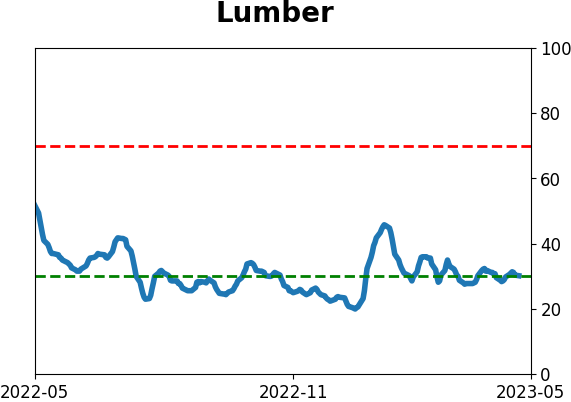
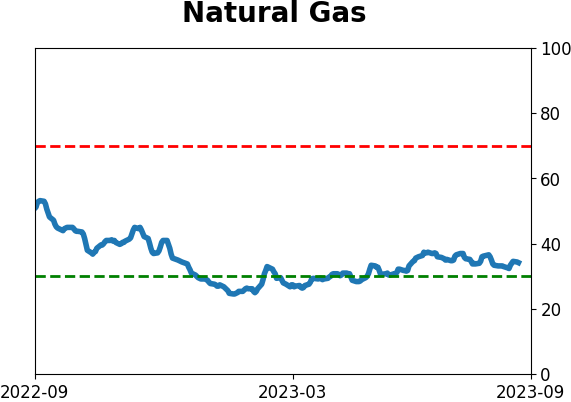
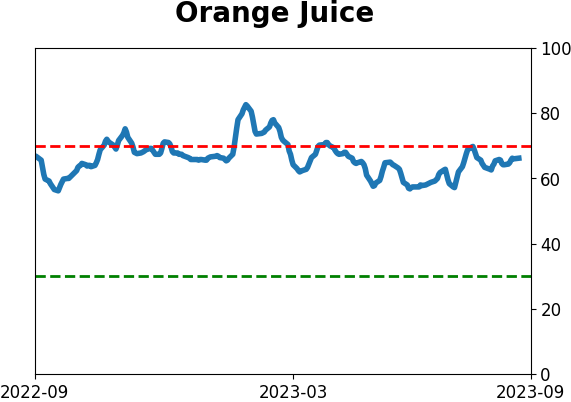
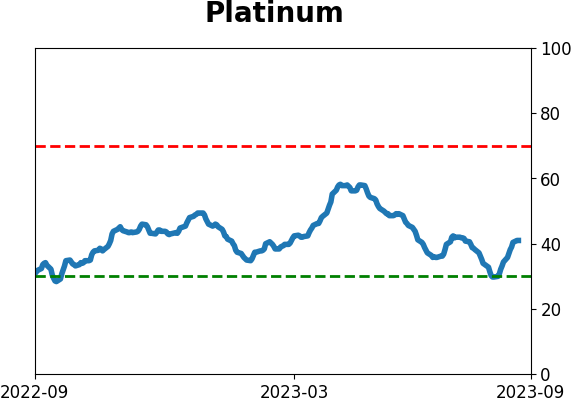
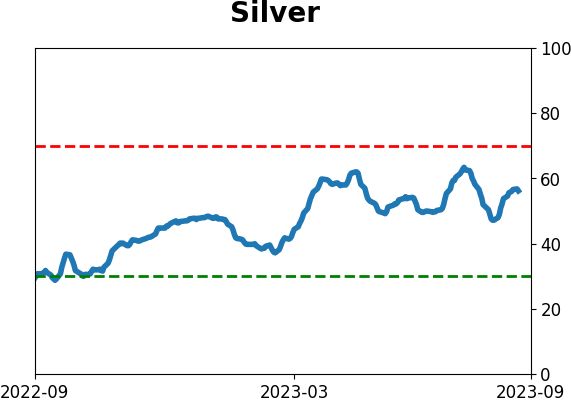
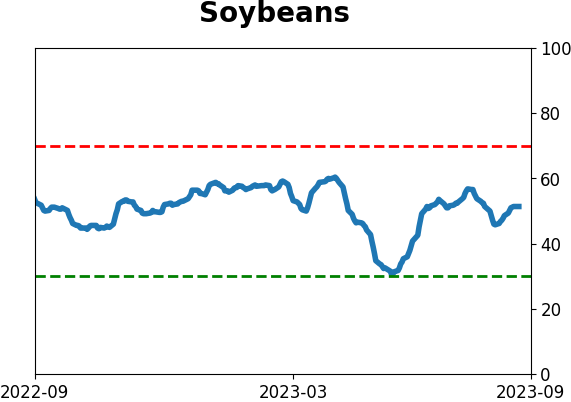
Commodity ETF's - 5-Day Moving Average
|
|