Headlines
|
|
TradingEdge Weekly for Sep 2 - Overwhelming selling, negative reversals, bad seasonality:
This week, we saw more overwhelmingly negative breadth as investors sold a wide array of stocks. That triggered a quick reversal in the S&P 500, which has tended to lead to more weakness. That would be typical following similar 50-day rallies off one-year lows. The IPO market has dried up. Some metals are now facing seasonal headwinds.
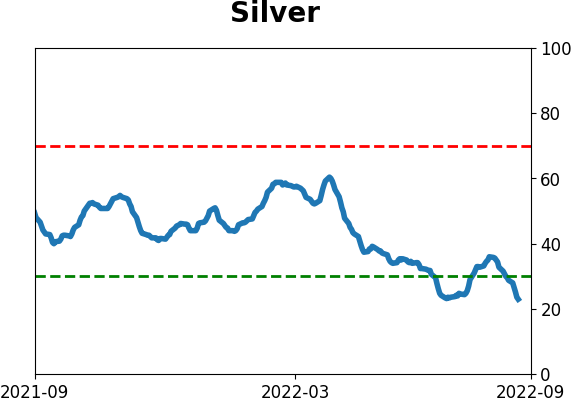
The latest Commitments of Traders report was released, covering positions through Tuesday: The 3-Year Min/Max Screen shows that "smart money" commercial hedgers established one new extreme this week, and it's notable. For only the 3rd time in history, hedgers moved to a net long position in silver futures. Because these traders use the futures market to hedge their underlying business risk, it's unusual to see them take an outright net long position in almost any contract. When they do, there is a long track record of that commodity rising in price over the next 6-12 months. The Backtest Engine shows that after the other two instances in August 2018 and May 2019, silver rose about 20% over the next year. They're also long platinum, which was a bad guide in 2001, but otherwise had a good track record of preceding gains in that metal in the months ahead. Hedgers are quickly building up a long position in 10-year Treasury futures again, a decent but no means perfect sign for bond bulls. They pulled back a bit in their record long position in S&P 500 e-mini contracts. This is typically a positive sign for stocks and has been nearly perfect since the 2008 financial crisis.
|
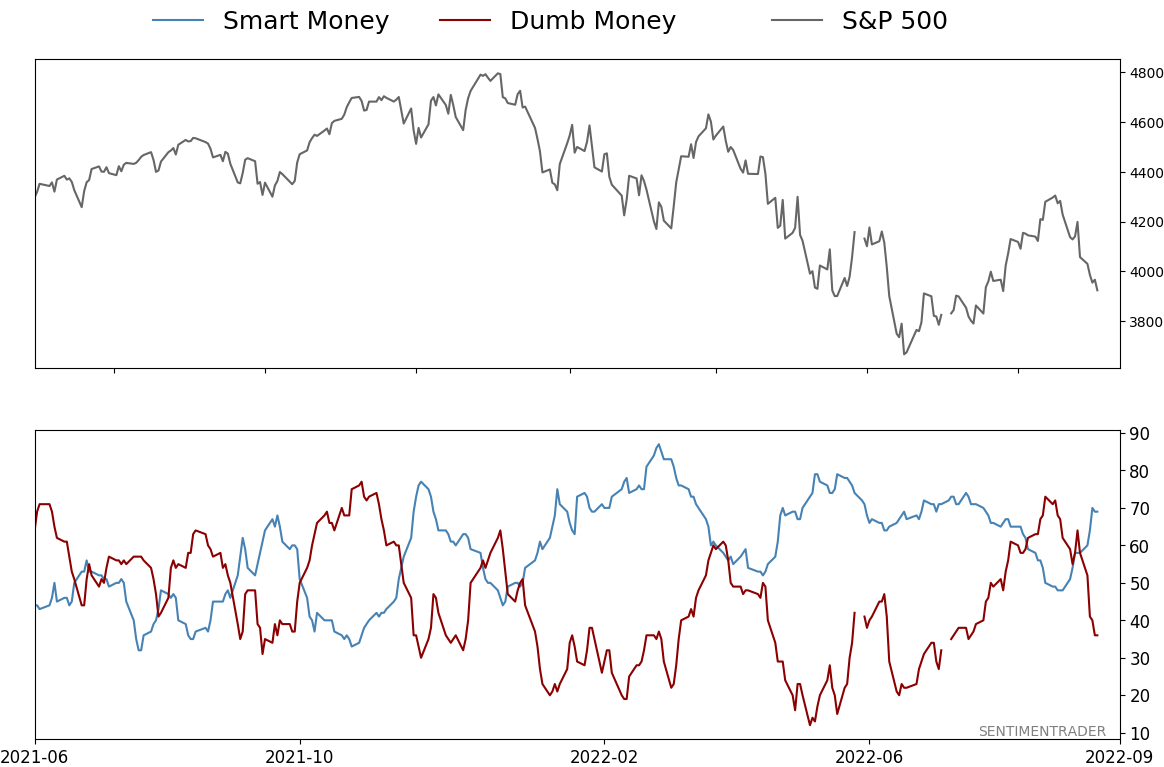
Smart / Dumb Money Confidence
|
Smart Money Confidence: 69%
Dumb Money Confidence: 36%
|
|
Risk Levels
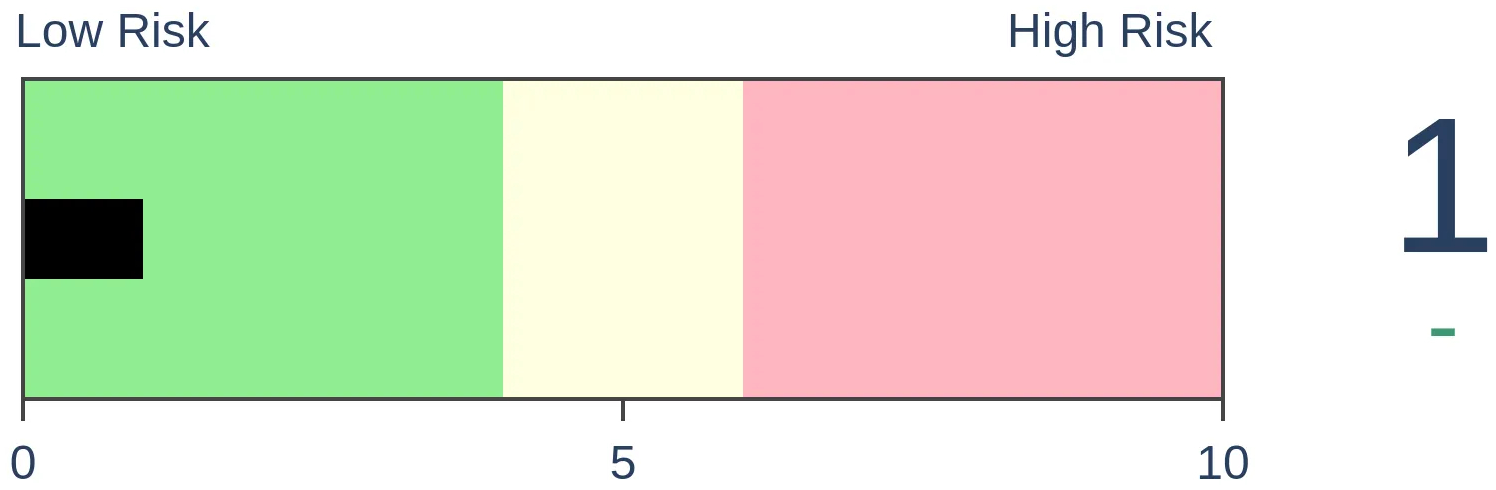
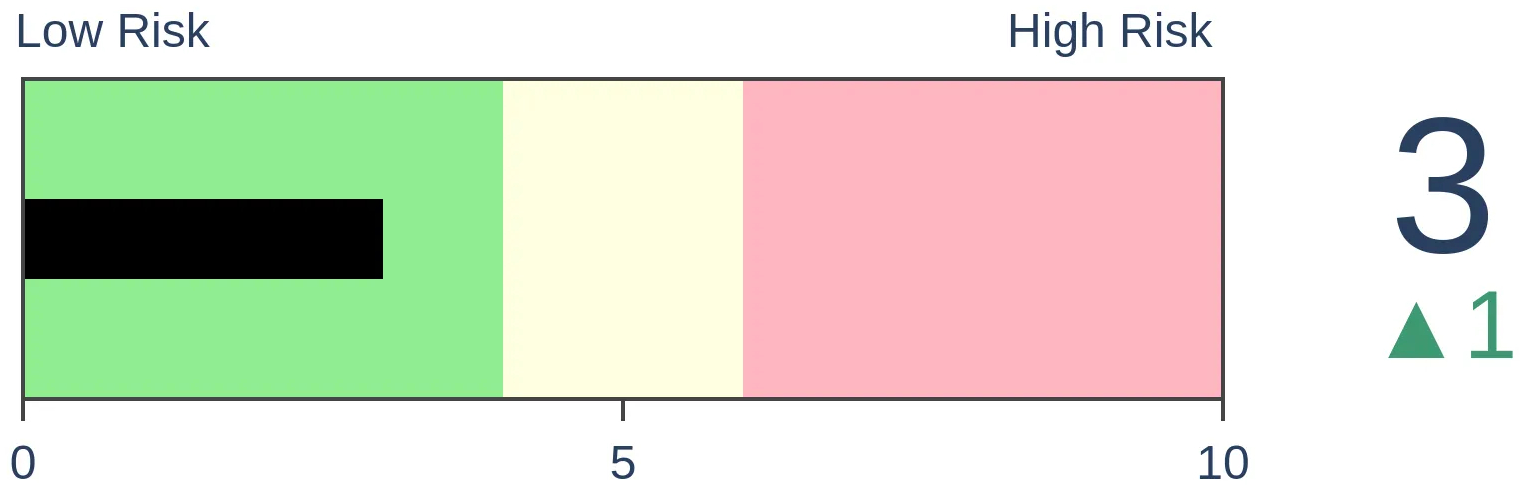
Stocks Short-Term
|
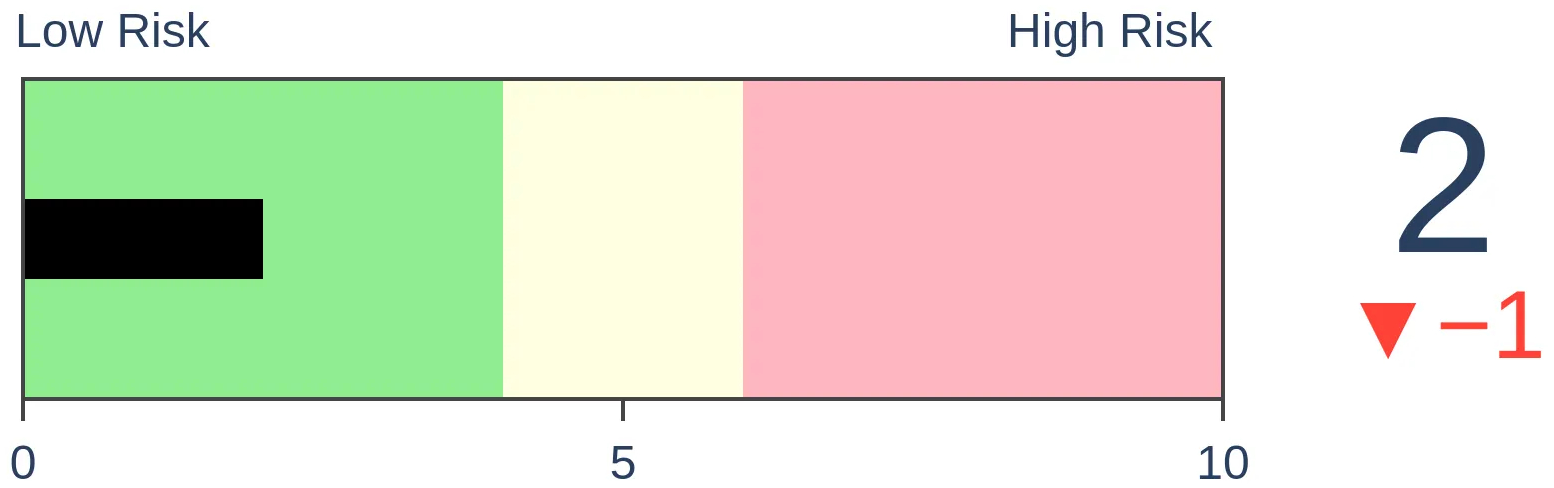
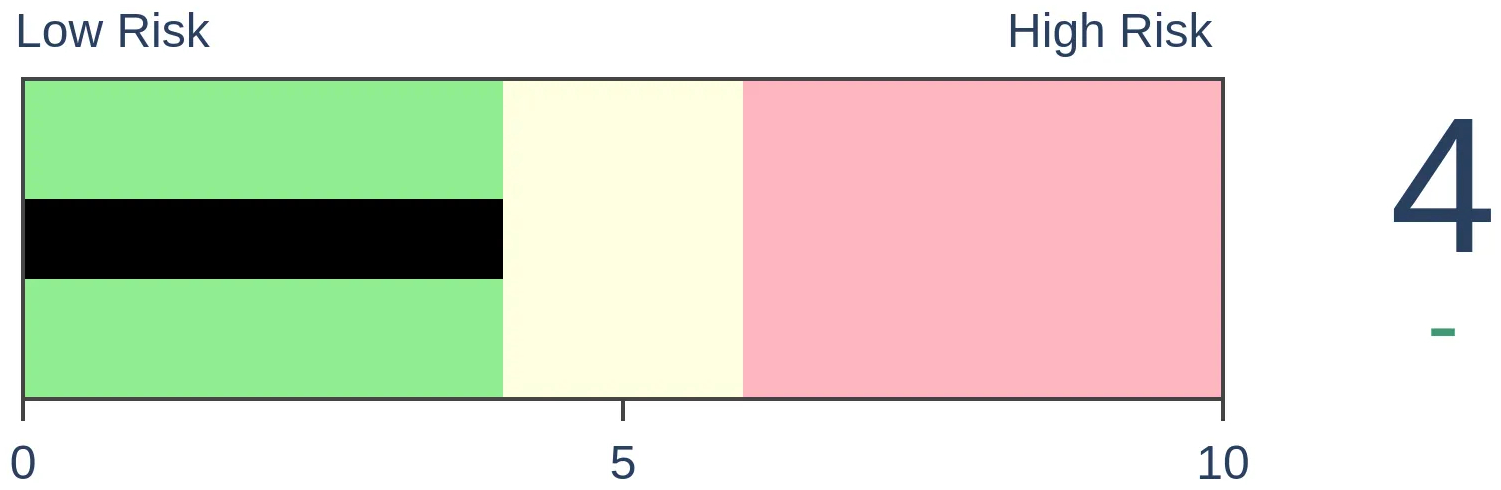
Stocks Medium-Term
|
|
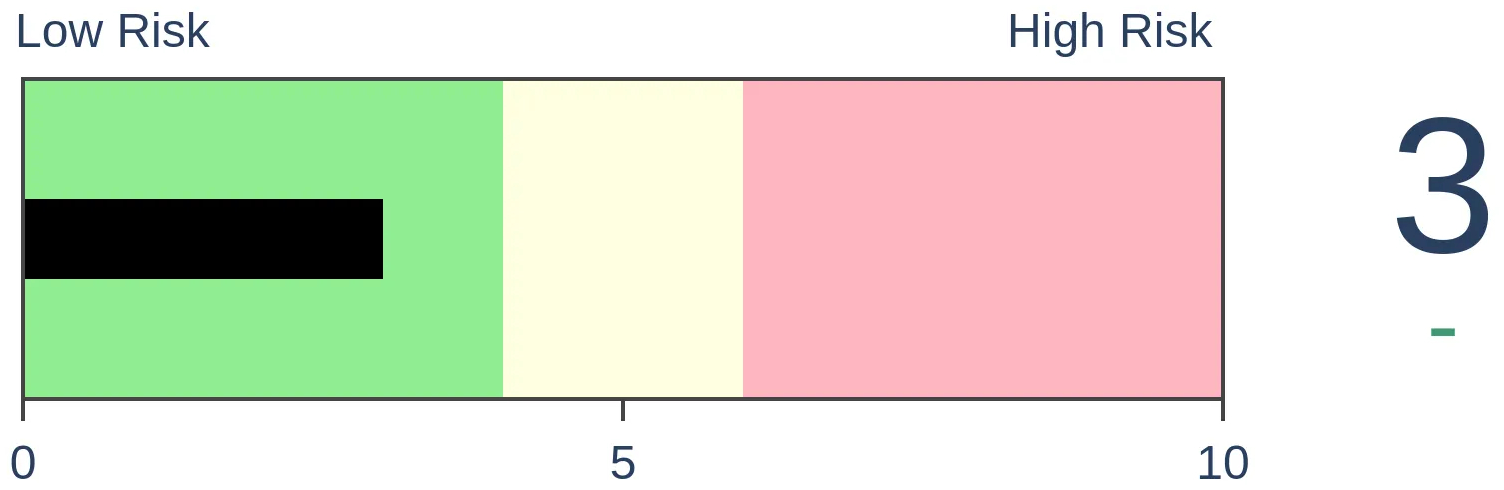
Bonds
|
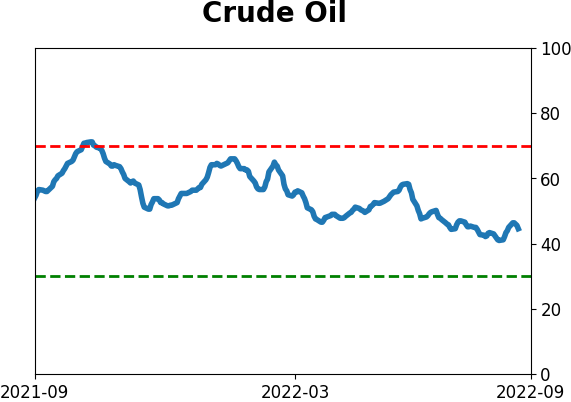
Crude Oil

|
|
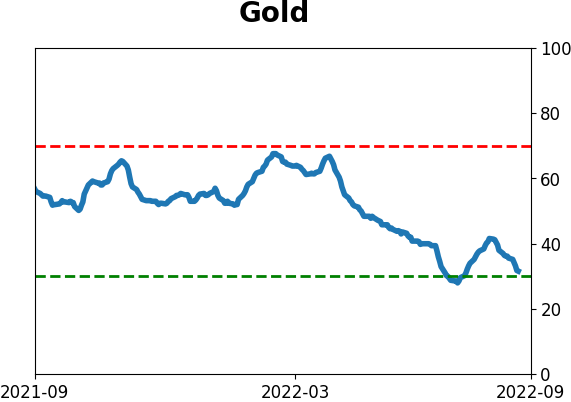
Gold
|
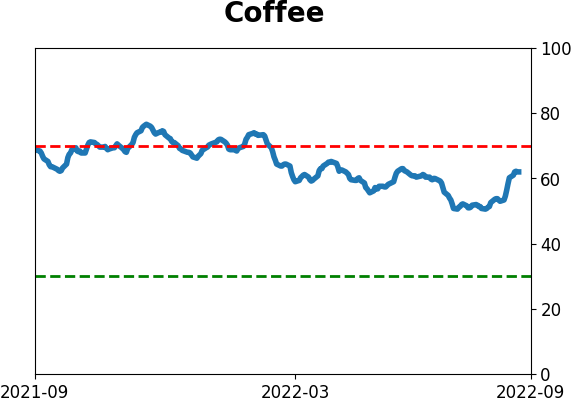
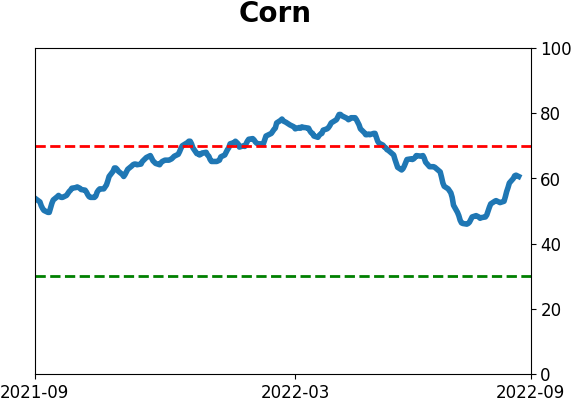
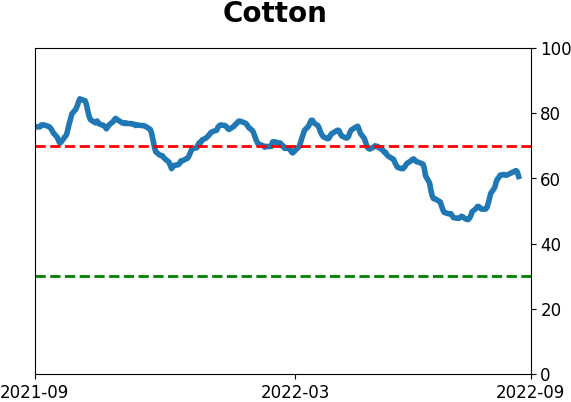
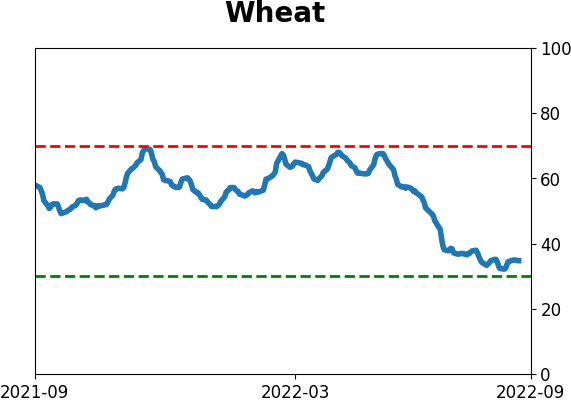
Agriculture
|
|
Research
By Jason Goepfert
BOTTOM LINE
This week, we saw more overwhelmingly negative breadth as investors sold a wide array of stocks. That triggered a quick reversal in the S&P 500, which has tended to lead to more weakness. That would be typical following similar 50-day rallies off one-year lows. The IPO market has dried up. Some metals are now facing seasonal headwinds.
FORECAST / TIMEFRAME
None
|
Key points:
- The recent stretch has been tough for bulls, with overwhelmingly negative breadth
- The S&P 500 itself has quickly reversed from a 2-month high to a 1-month low
- Such persistent weakness has caused its 200-day moving average to decline for 90 straight days
- This is typical behavior following similar 50-day stretches of individual stock participation off a low
- It's also typical following the most similar 50-day periods of price action off one-year lows
- The IPO market has completely dried up
- Copper and platinum (and soybeans) are entering a tough seasonal stretch
A tough haul for bulls
Bulls have not had an easy time of it lately.
Dean showed that within six sessions, NYSE market breadth turned considerably unfavorable, with three sessions showing an advance-decline ratio of -5/1. This comes amid a protracted decline, with the 200-day moving average for the S&P 500 falling for more than 80 sessions.
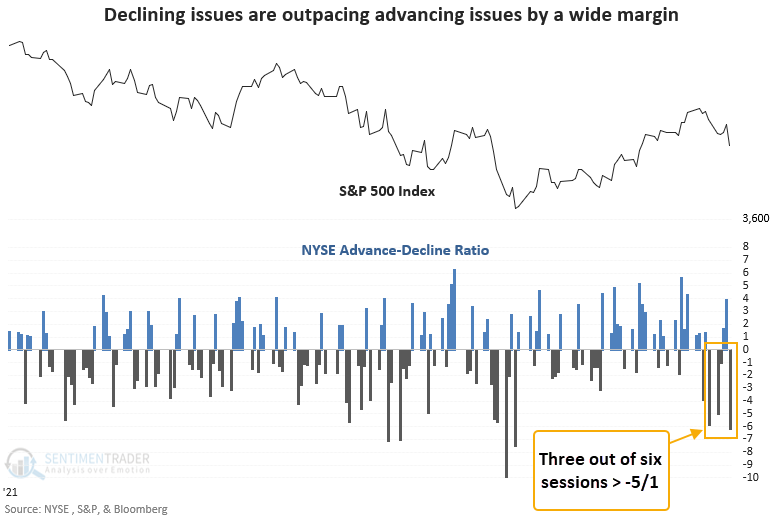
The lopsided breadth ratio in a downtrend is rare, especially since 1942. Our study identified 15 other instances in the last 93 years.
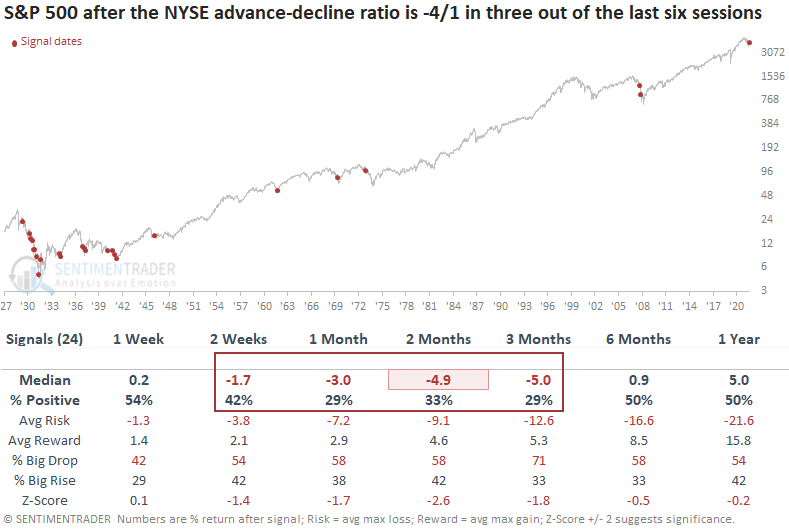
When he lowered the threshold for the ratio to -4/1, the study identifies an additional eight signals. Returns, win rates, and z-scores look considerably worse. As with the -5/1 signals, the 1929-42 period contains most of the instances.
Heavy selling has triggered a quick reversal
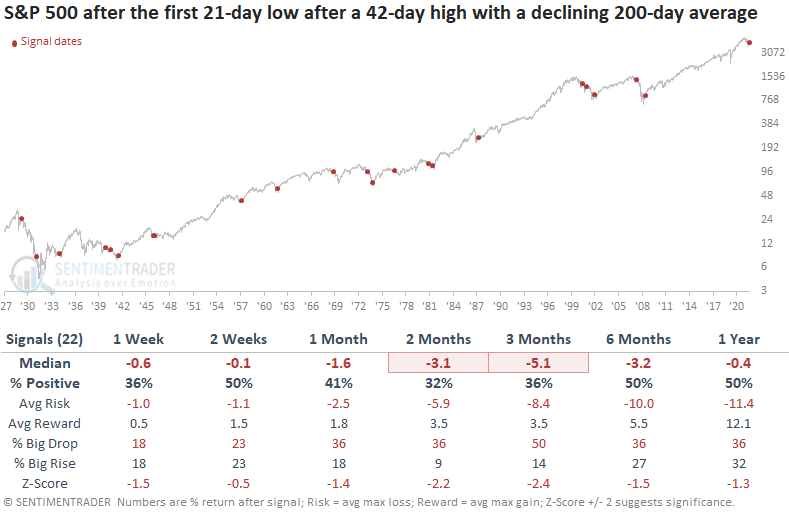
The S&P 500 and other indexes continue to retrace the multi-month surge from the June low. Dean noted that the world's most watched benchmark reversed from a 42-day high (close) to a 21-day low (close) in only eight sessions.
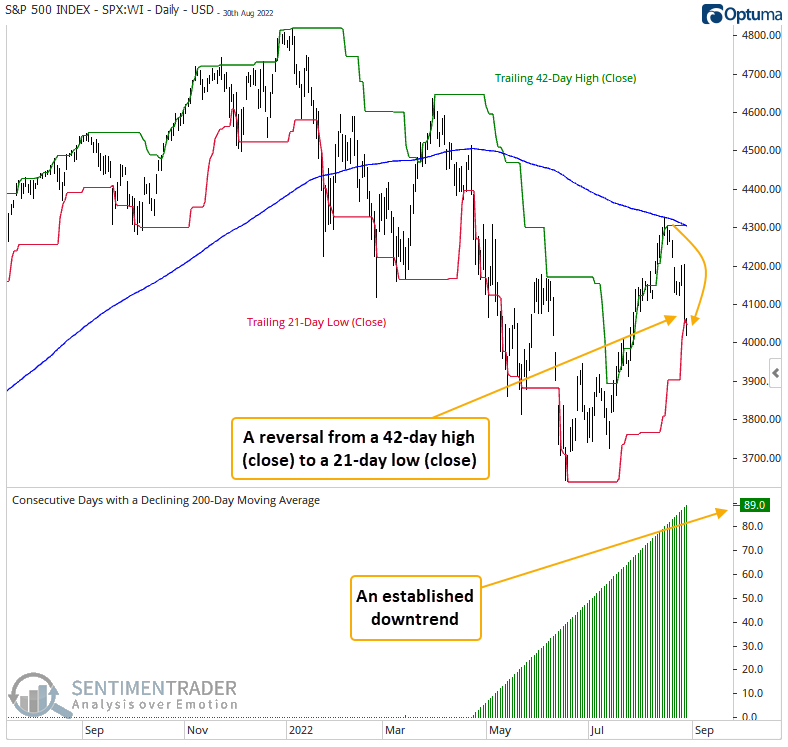
A swift reversal from a 42-day high (close) to a 21-day low (close) within an established downtrend typically occurs in significant bear markets. In most cases, the S&P 500 closed at a lower low. Signals in 1958, November 1974, and 1988 are instances when the index failed to take out the previous low.
The study shows seven additional signals if we increase the reversal count from 15 to 25 sessions. Returns, win rates, and z-scores continue to look unfavorable. The relaxed condition parameter picked up a signal in 1962, which happens to be another example of a significant retracement, but not an undercut of the low.
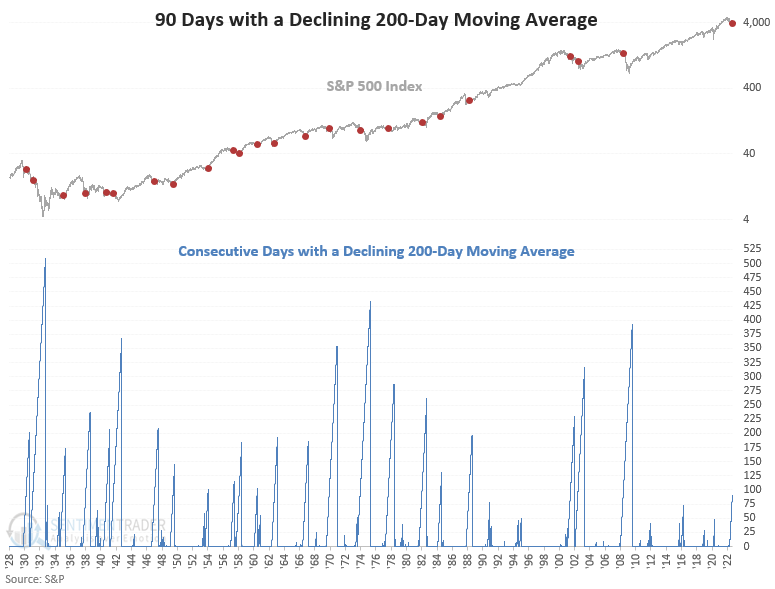
The 200-day average has been dropping for 90 straight days
With the 200-day moving average for the S&P 500 declining for 90 consecutive days this week, Dean assessed the outlook for the index after other persistent declines in one of the most widely followed price trend indicators.
While most short- to medium-term time frames suggest somewhat flat returns, the six-month window looks troubling, especially the win rate and z-score. Signals since 1969 show a consistent pattern of negative returns across all time frames, with the 2-week window showing a loss in all nine instances.
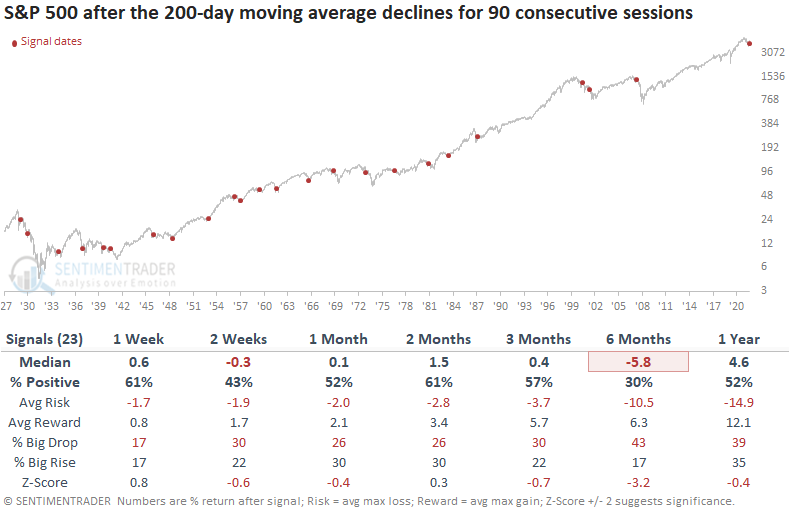
It's not unprecedented to see a 200-day average signal coincide with a tightening cycle from the FOMC. However, most of the time, we see a neutral or easy Fed. While the previous instances occurred during multi-year bear markets, the drawdown difference between the two is notable.
Further weakness is typical, even for the most similar thrusts
Since late June, we've spent a lot of time discussing the return of eager buyers into stocks and high-yield bonds. During bear markets, we rarely see the buying interest evident over the past two months. And it's seldom as broad-based as it has been since June.
The percentage of S&P 500 member stocks trading above their short- and medium-term averages has cycled from extreme to extreme. When cycling so quickly from one to the other, it never failed to lead to a positive return over the next year.
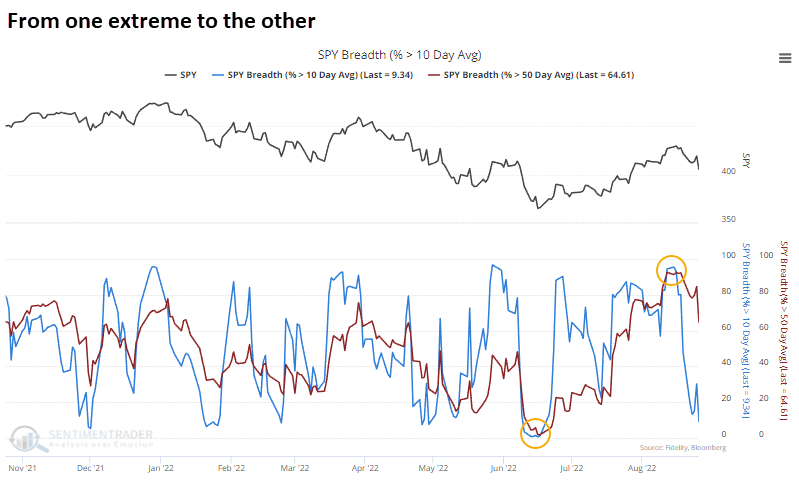
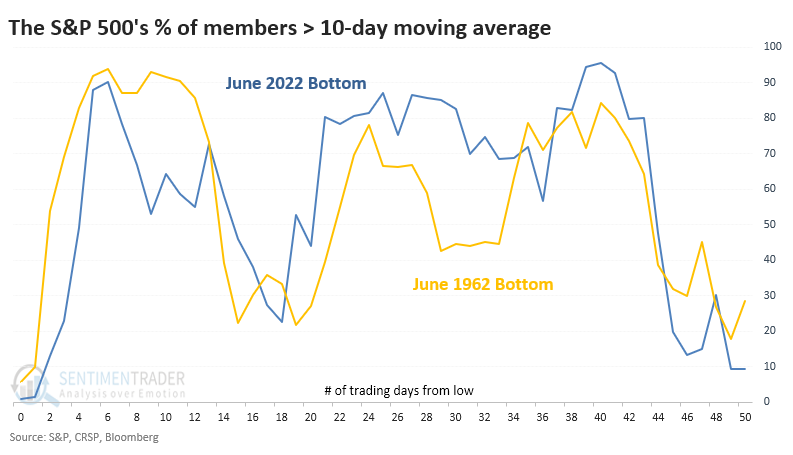
If we look at the percentage of S&P 500 stocks above their 10-, 50-, and 200-day moving averages and compare the last 50 days to every 50-day rally off of a one-year low since 1928, we can get a better sense of whether this is normal or not.
The rally off of the June 1962 bottom showed the most similar behavior to the past 50 days. These two time periods had a 0.83 correlation (from -1.0 to +1.0). That bottom carved out almost an exact replica in the percentage of member stocks above their 10-day moving average.
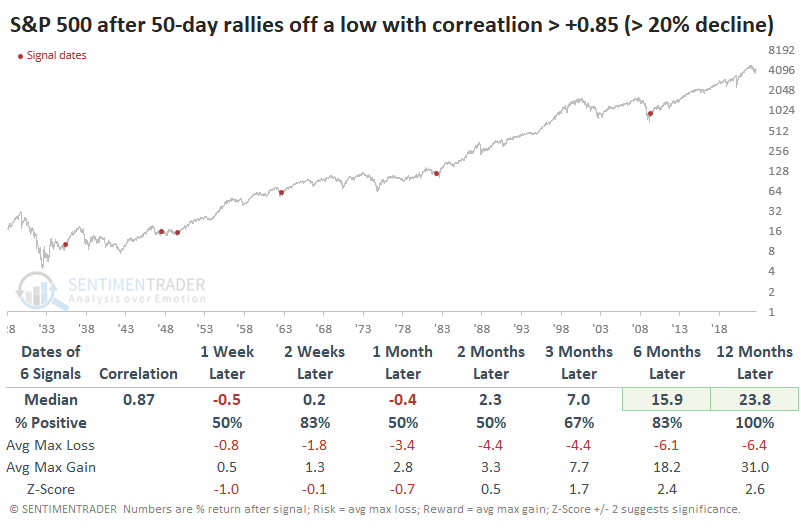
The table below shows the S&P 500's future returns after the 50-day rallies from a one-year low, with the highest correlation in members trading above their three moving averages. The decline to the one-year low had to be at least 20% to qualify.
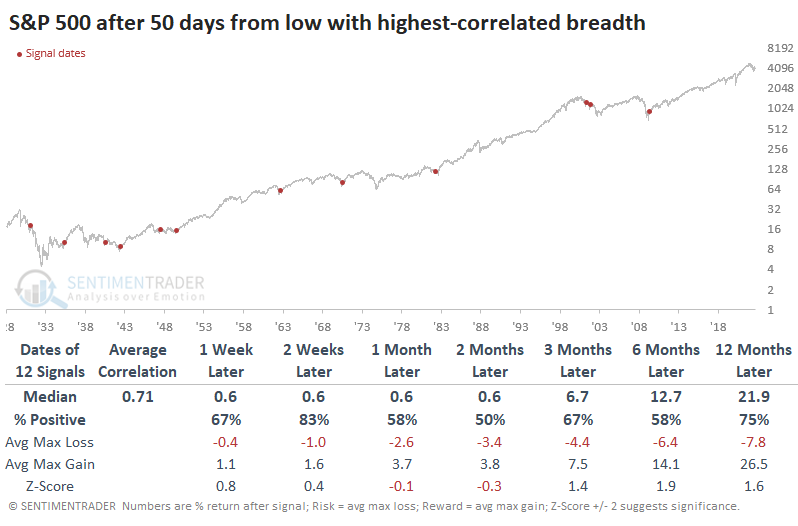
It was not a fail-safe indicator that we're in the clear. Stocks behaved similarly in 2001 (twice) and in 1931, both leading to terrible failures. But the other nine signals preceded gains over the next year, typically by double-digits.
The price action since the low suggests short-term weakness, too
Now, let's look at the price action in the S&P 500 itself, not the performance of its individual stocks. The chart below shows the S&P's price return in the 50 days following the June low, compared to the 15 rebounds from a low that had a correlation of more than +0.55 (out of a scale from -1.00 to +1.00).
The black line, which shows the average of those rebounds, tended to peak a little later than we did this time, and our current pullback is more extensive than average. The initial shot off the low tends to run out of steam around day #50 and last through day #90.
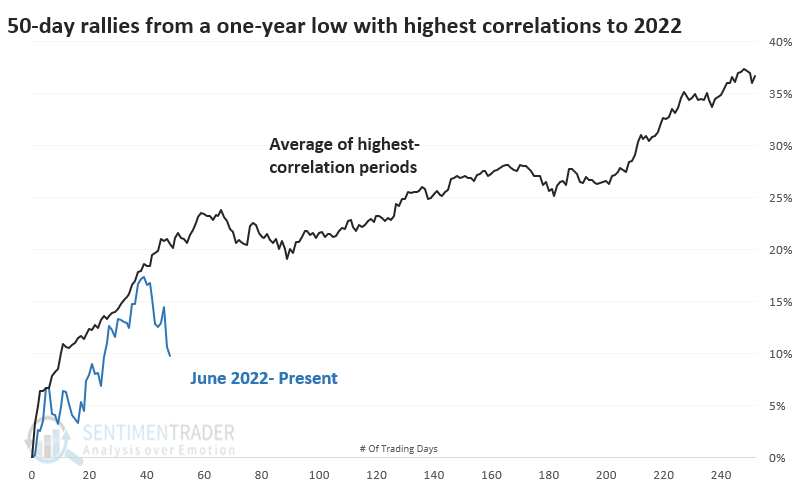
Overall, the S&P tended to do well after similar 50-day rebounds over the long-term. If we filter the table to show only the most similar rallies to the current one, those with a correlation above +0.85, returns over the next year were impressive.
The sample size is even tinier, but those rallies tended to peak right where we did this time. A few pulled back significantly after the initial rally, but all recovered over the longer term.
No appetite for new companies
A little over a year ago, it was the best of times. At least, it was for money-losing operators looking to cash out and the bankers who feed on them. As we saw last June, we were amid a speculative frenzy with only two precedents.
Things have changed, and in a big way. That market has completely dried up. According to Bloomberg data, since May, there has been only one IPO with proceeds greater than $25 million (excluding SPACs).
If we look at the dollar amount raised as a percentage of the market capitalization of all U.S. stocks, the last three months have seen the lowest amount ever, dating to 1985. This even exceeds the last dry spell from October 2008.
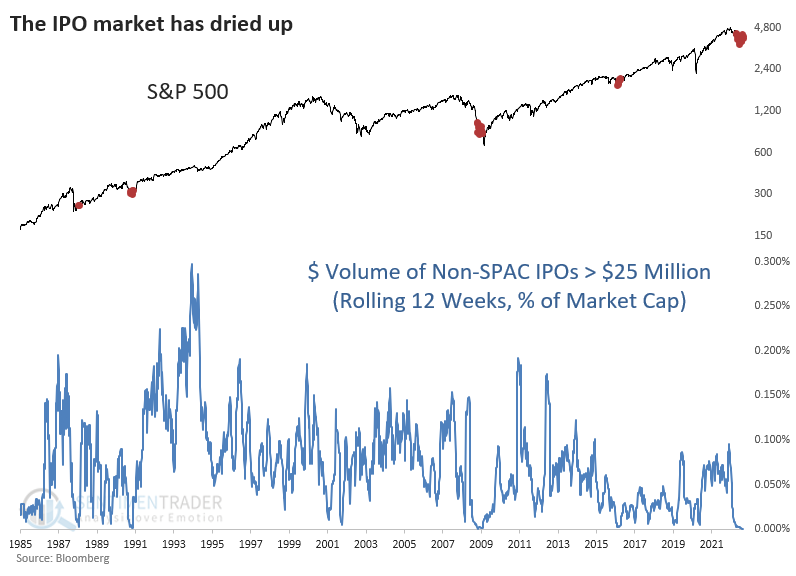
The performance of the IPO market is not a precise timing mechanism by any stretch. As we saw last year, it's more of a broad indicator of the market environment and where we may be in the typical sentiment cycle. The current lack of activity suggests we're in the discouragement phase of the cycle. That can last a while and is often accompanied by wide swings that don't take us much of anywhere.
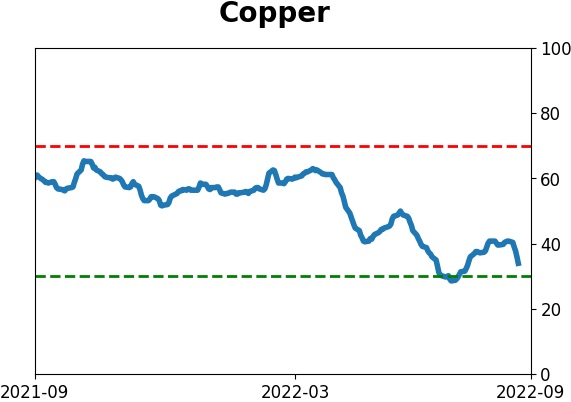
Copper's conflicting signals
Jay noted that copper is flashing contradictory signals. The Copper/Gold Ratio recently triggered a bullish alert, which has preceded long-term gains. But seasonality is entering a period of weakness and price action remains negative.
The annual seasonal chart below reveals that copper is about to enter a period of general price weakness.
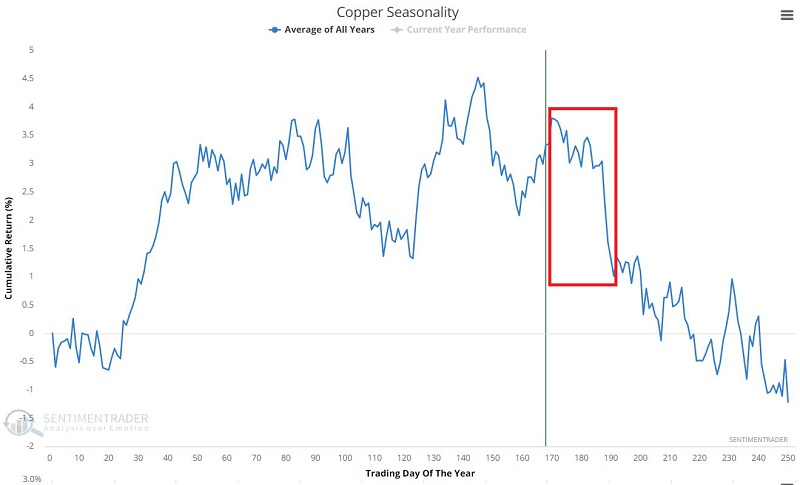
For 2022, this weak period extends from the close on 2022-08-29 through the close on 2022-09-27. Historically, this stretch showed a gain during 11 years but a loss during 22 years.
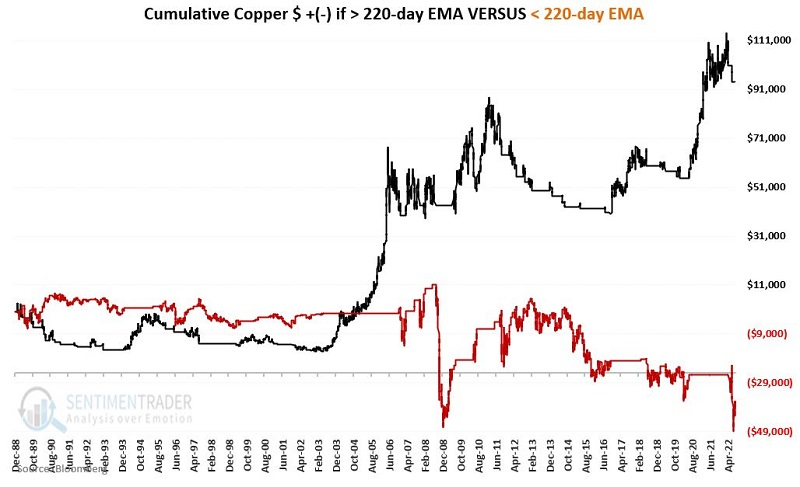
In addition, the price action of the metal has been poor.
The chart below displays equity growth separately when copper is above (black line) or below (red line) its 220-EMA. While properly not worth using as a standalone trading model, the critical thing to note is the subpar results achieved when copper trades below this long-term EMA.
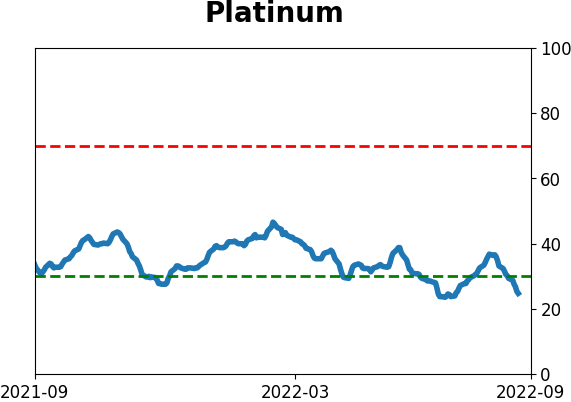
Platinum is facing seasonal headwinds, too
Platinum is about to enter its weakest seasonal period of the year. Jay showed that the period will begin with price already in an established downtrend.
The chart below displays the cumulative dollar return for platinum futures held long only during Trading Day of Year #173 through TDY #198 since 1983. This year, the period extends from the close on August 30 through the close on October 5.
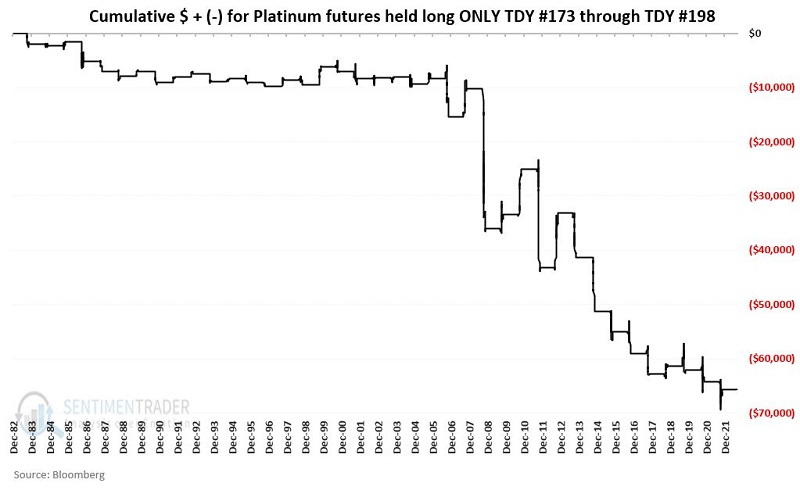
After looking at the chart above, it is somewhat surprising to learn that platinum has declined only 60% of the time (24 out of 40 years) during this period. The critical thing to note, however, is that the average and median decline is almost twice as large as the average and median advance.
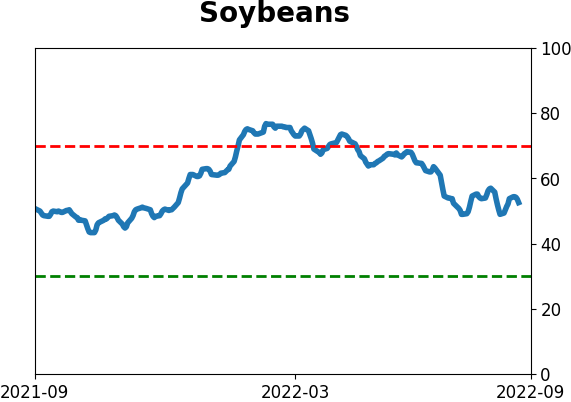
And soybeans
Jay also noted that soybean seasonality is entering a period of historically consistent price weakness.
Each year as soybean harvesting season begins in the U.S. Midwest, there is little doubt left about the state of the crop harvest. It is either good, bad, or somewhere in between - but the critical point is that the state of the crop harvest is a known quantity. As a result, whatever risk premium has been built in typically is shed during this September/early October period.
For 2022, this period extends from the close on September 7 through October 5. The chart below displays the cumulative dollar return for soybean futures held long only during Trading Day of Year #172 through TDY # 191.
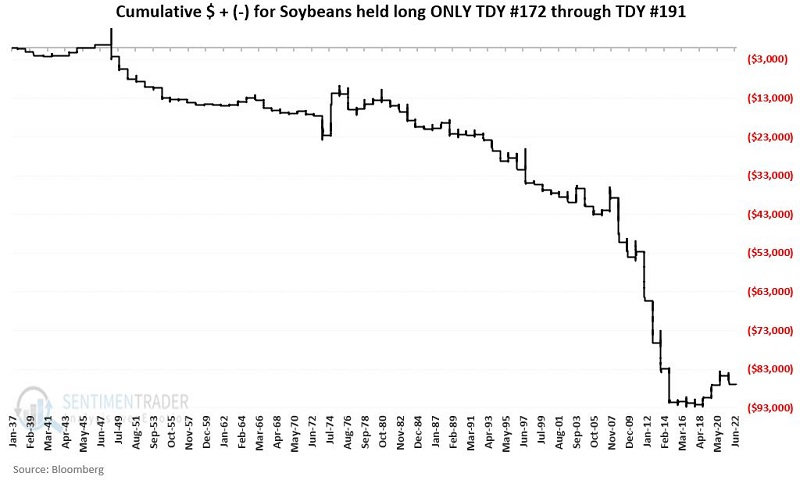
Since 1937, beans have rallied during this time frame 28 times and declined 57 times. Its average decline was nearly three times larger than its average rally.
The standard seasonality caveat applies: In any given year, anything can happen. Still, a trader must have a solid reason to consider holding a long position during this period.
About TradingEdge Weekly...
The goal of TradingEdge Weekly is to summarize the research published to SentimenTrader over the past week. Sometimes there is a lot to digest and this summary is meant to highlight the highest conviction or most compelling ideas we discussed. This is NOT the full research that's published, rather it pulls out some of the most relevant parts. It includes links to the published research for convenience; if you don't subscribe to those products it will present the options for access.
Indicators at Extremes
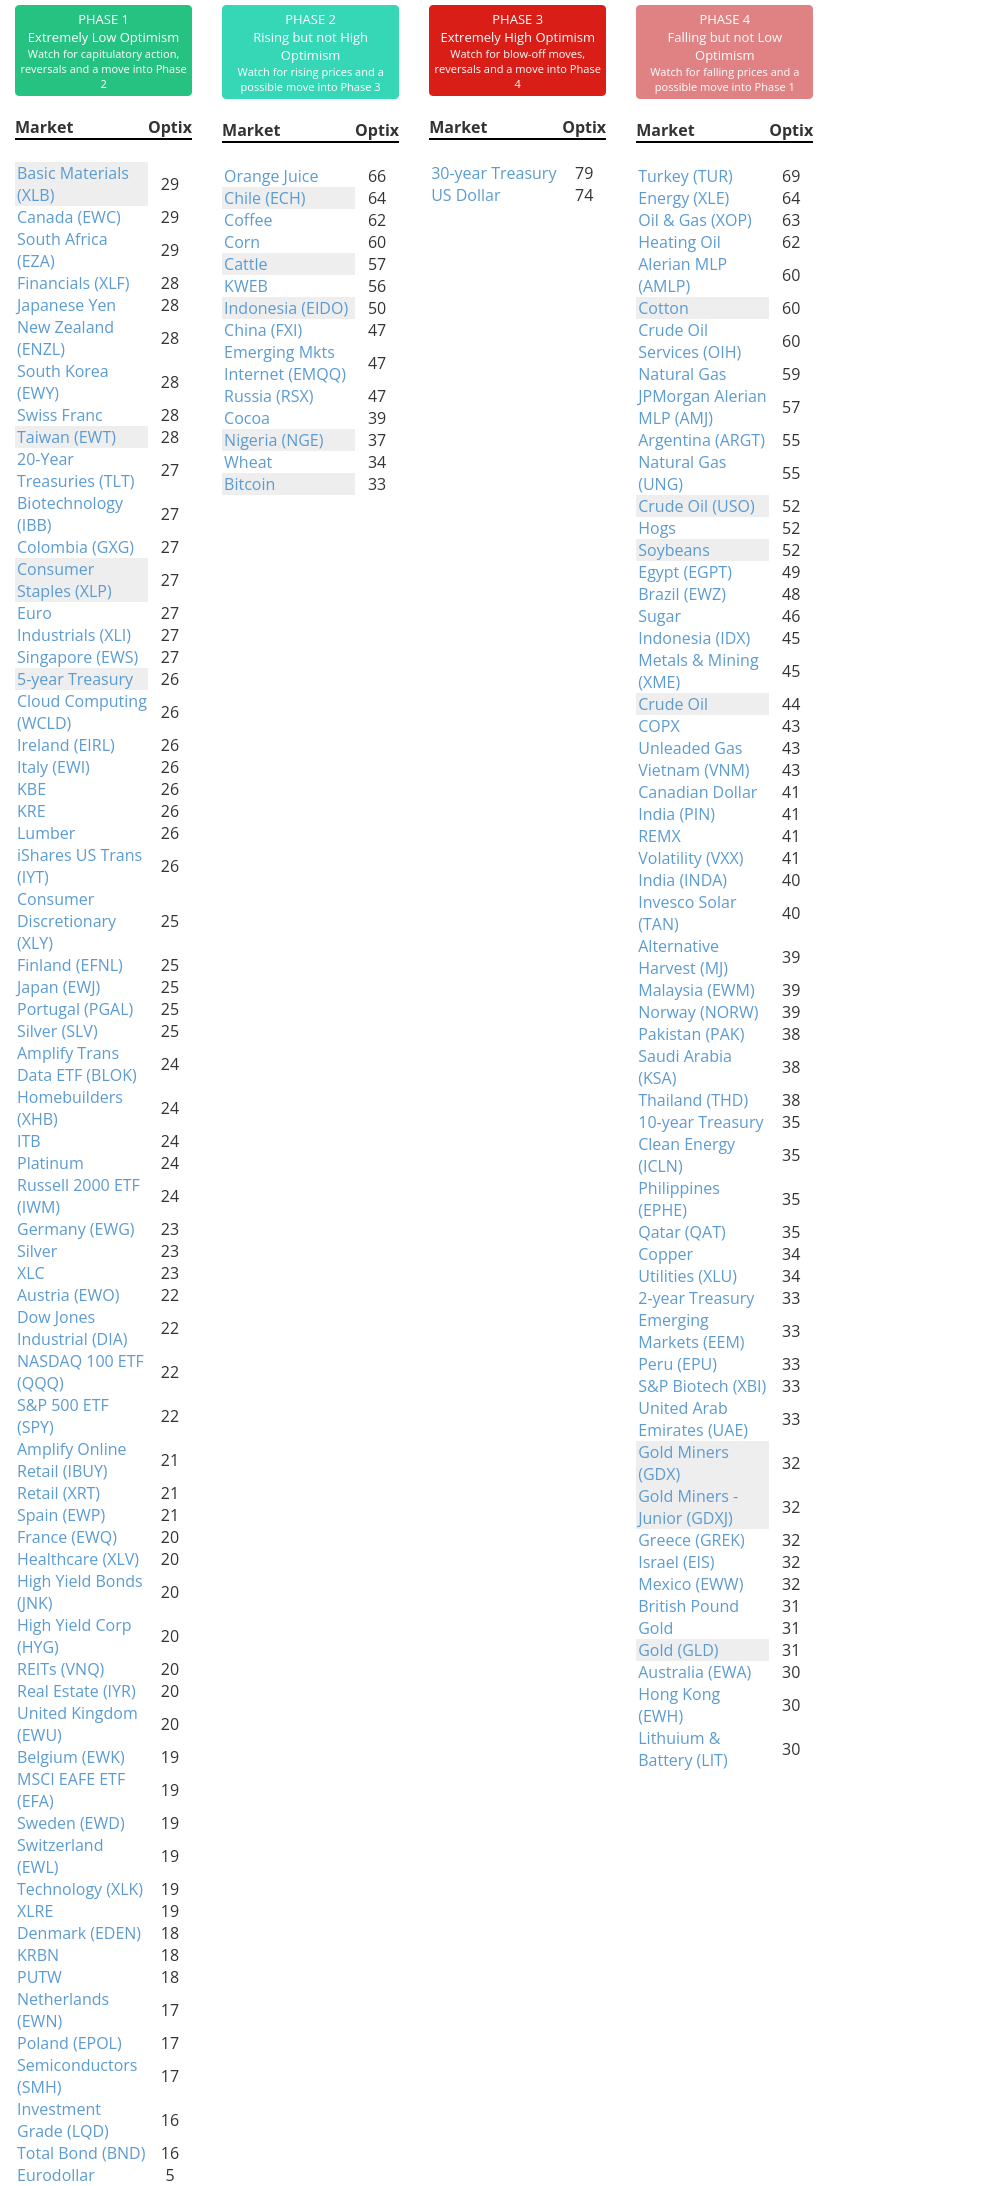
Phase Table
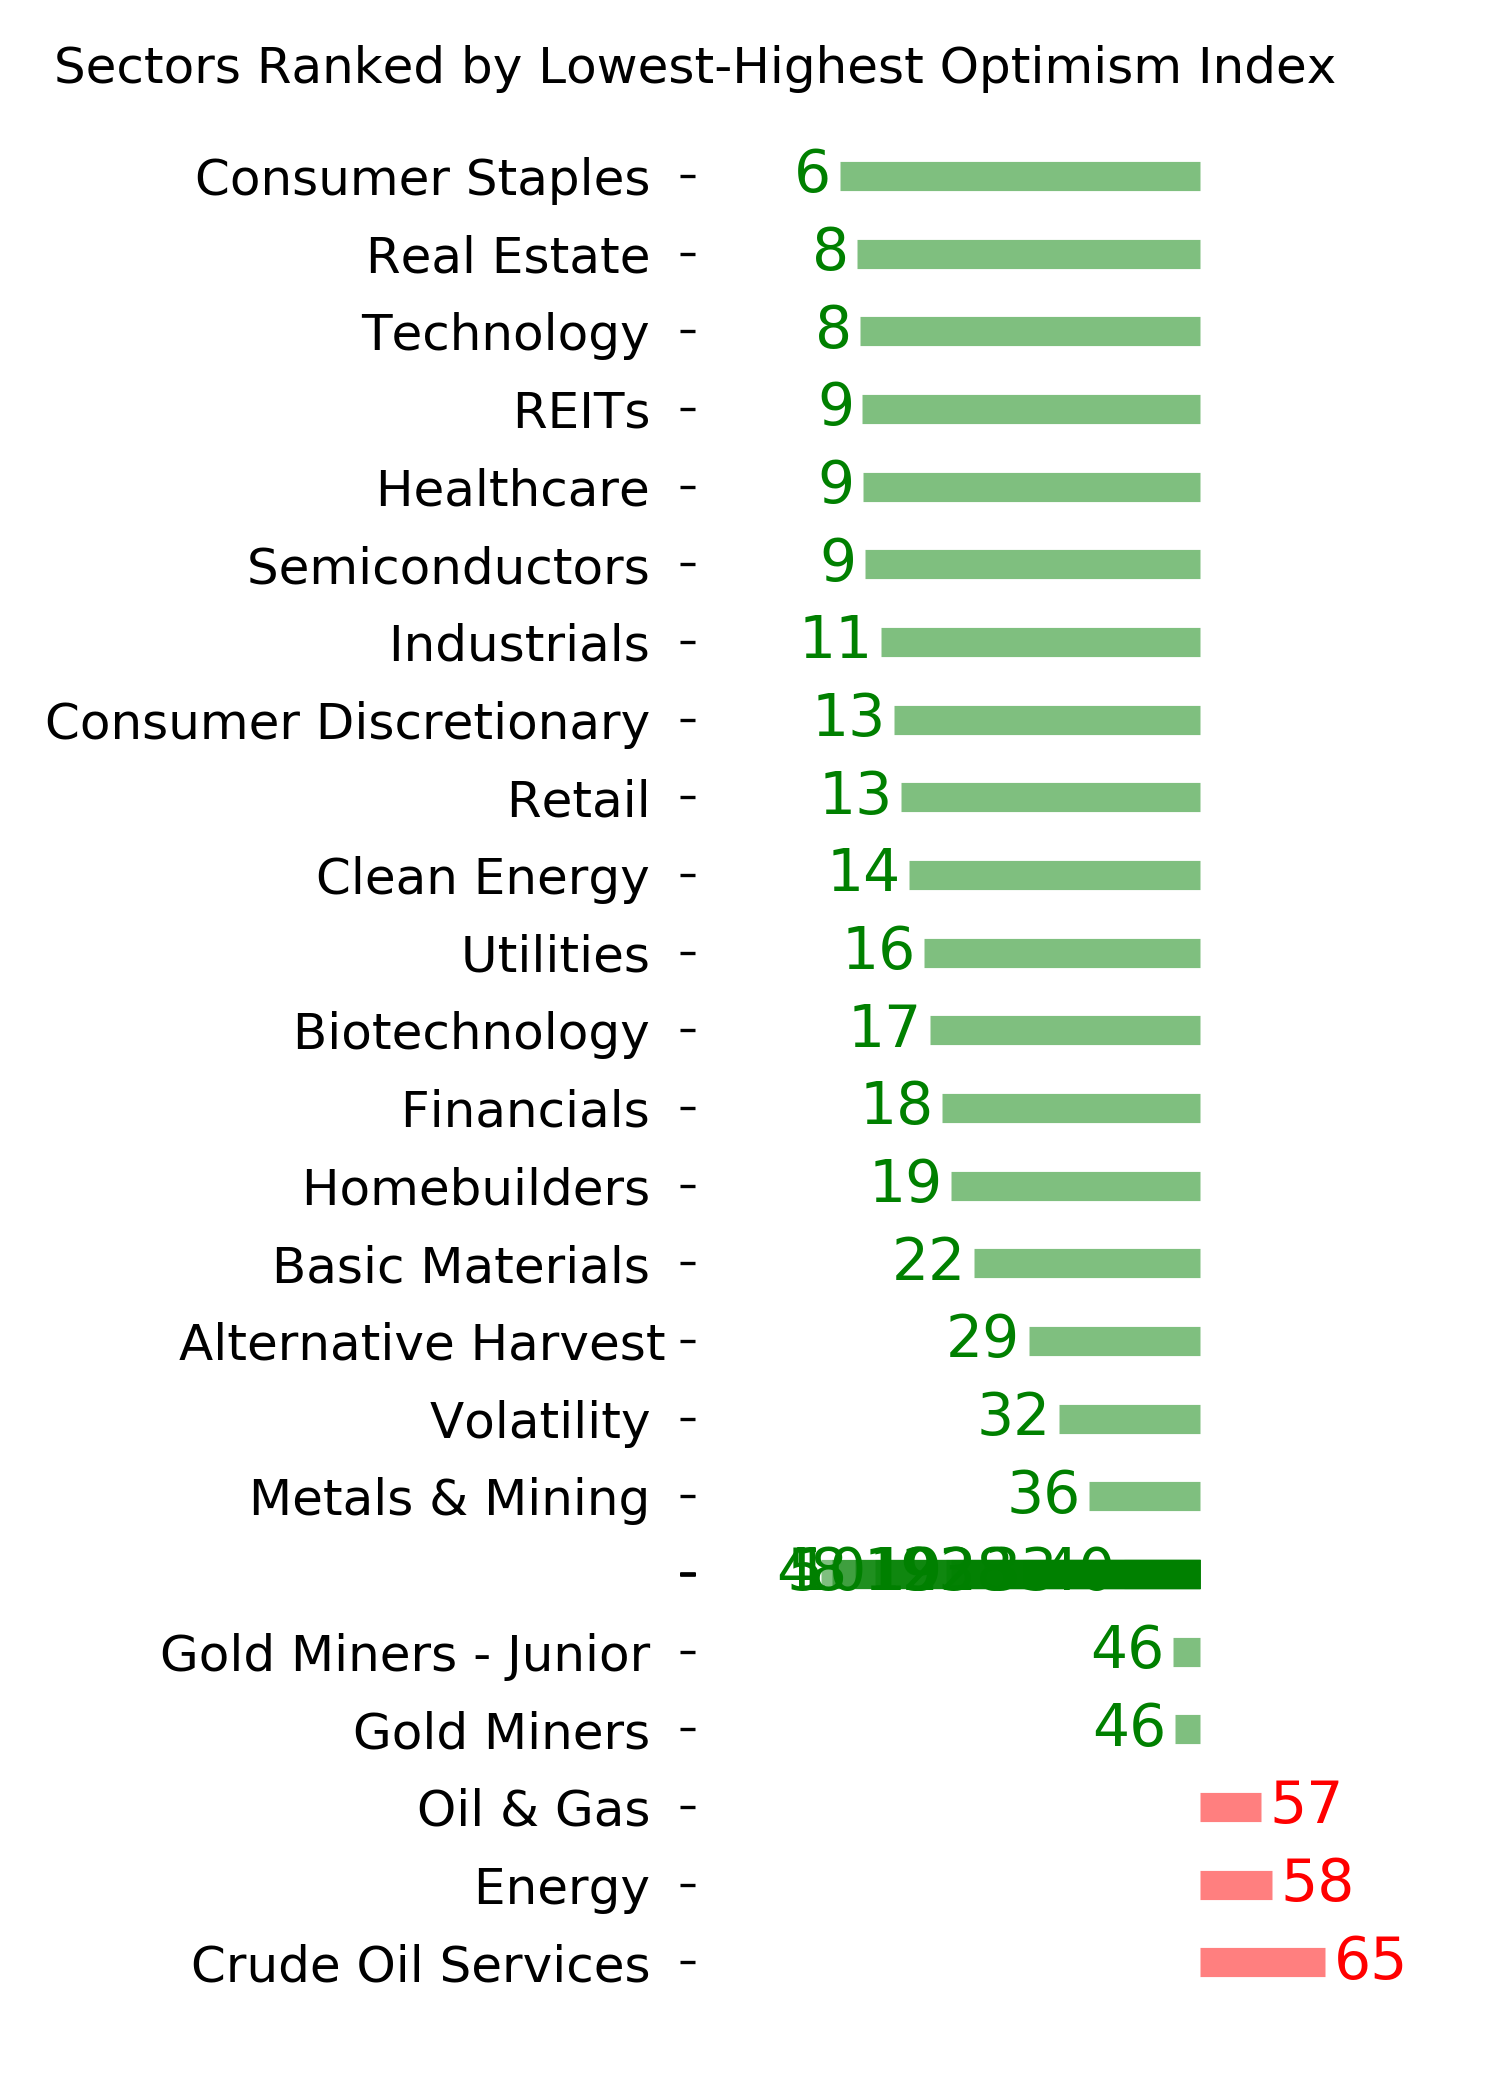
Ranks
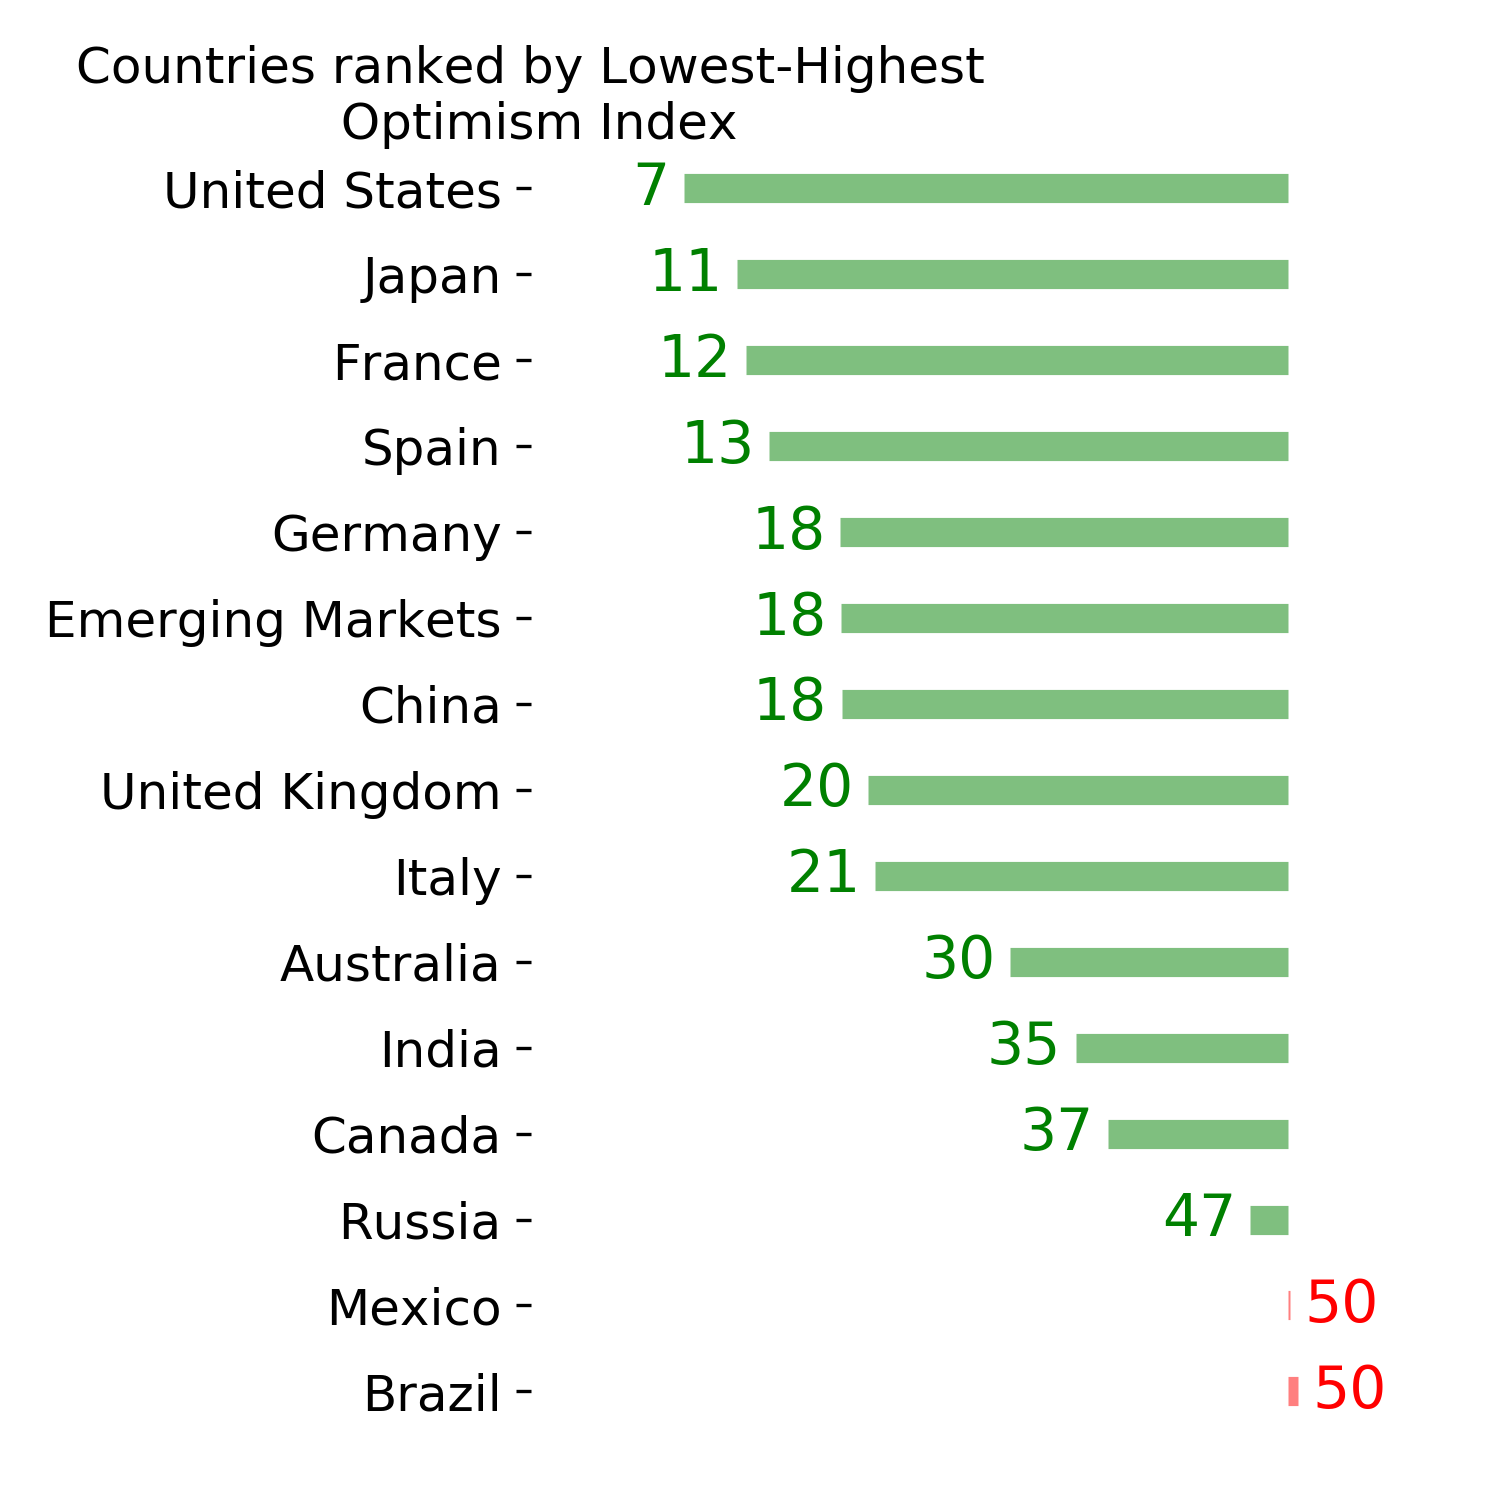
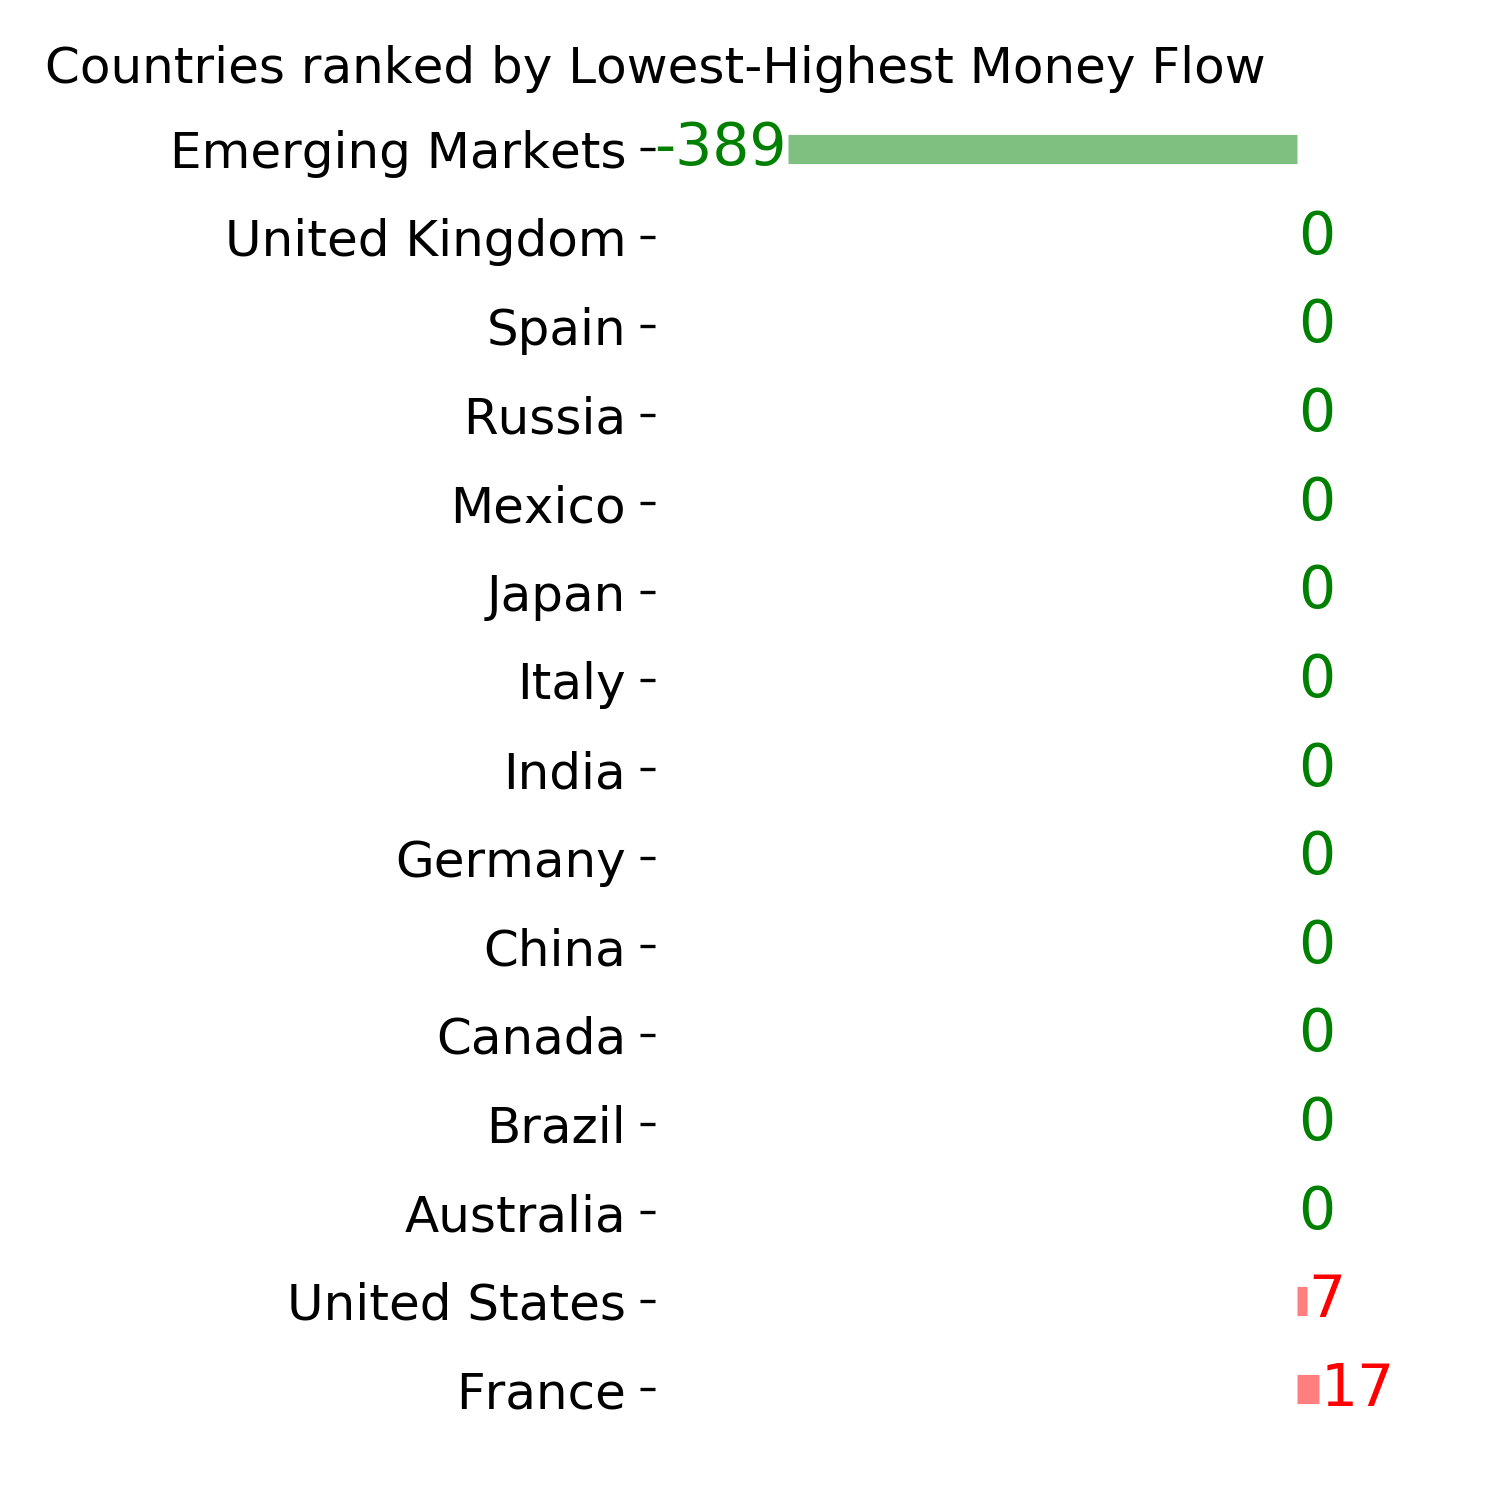
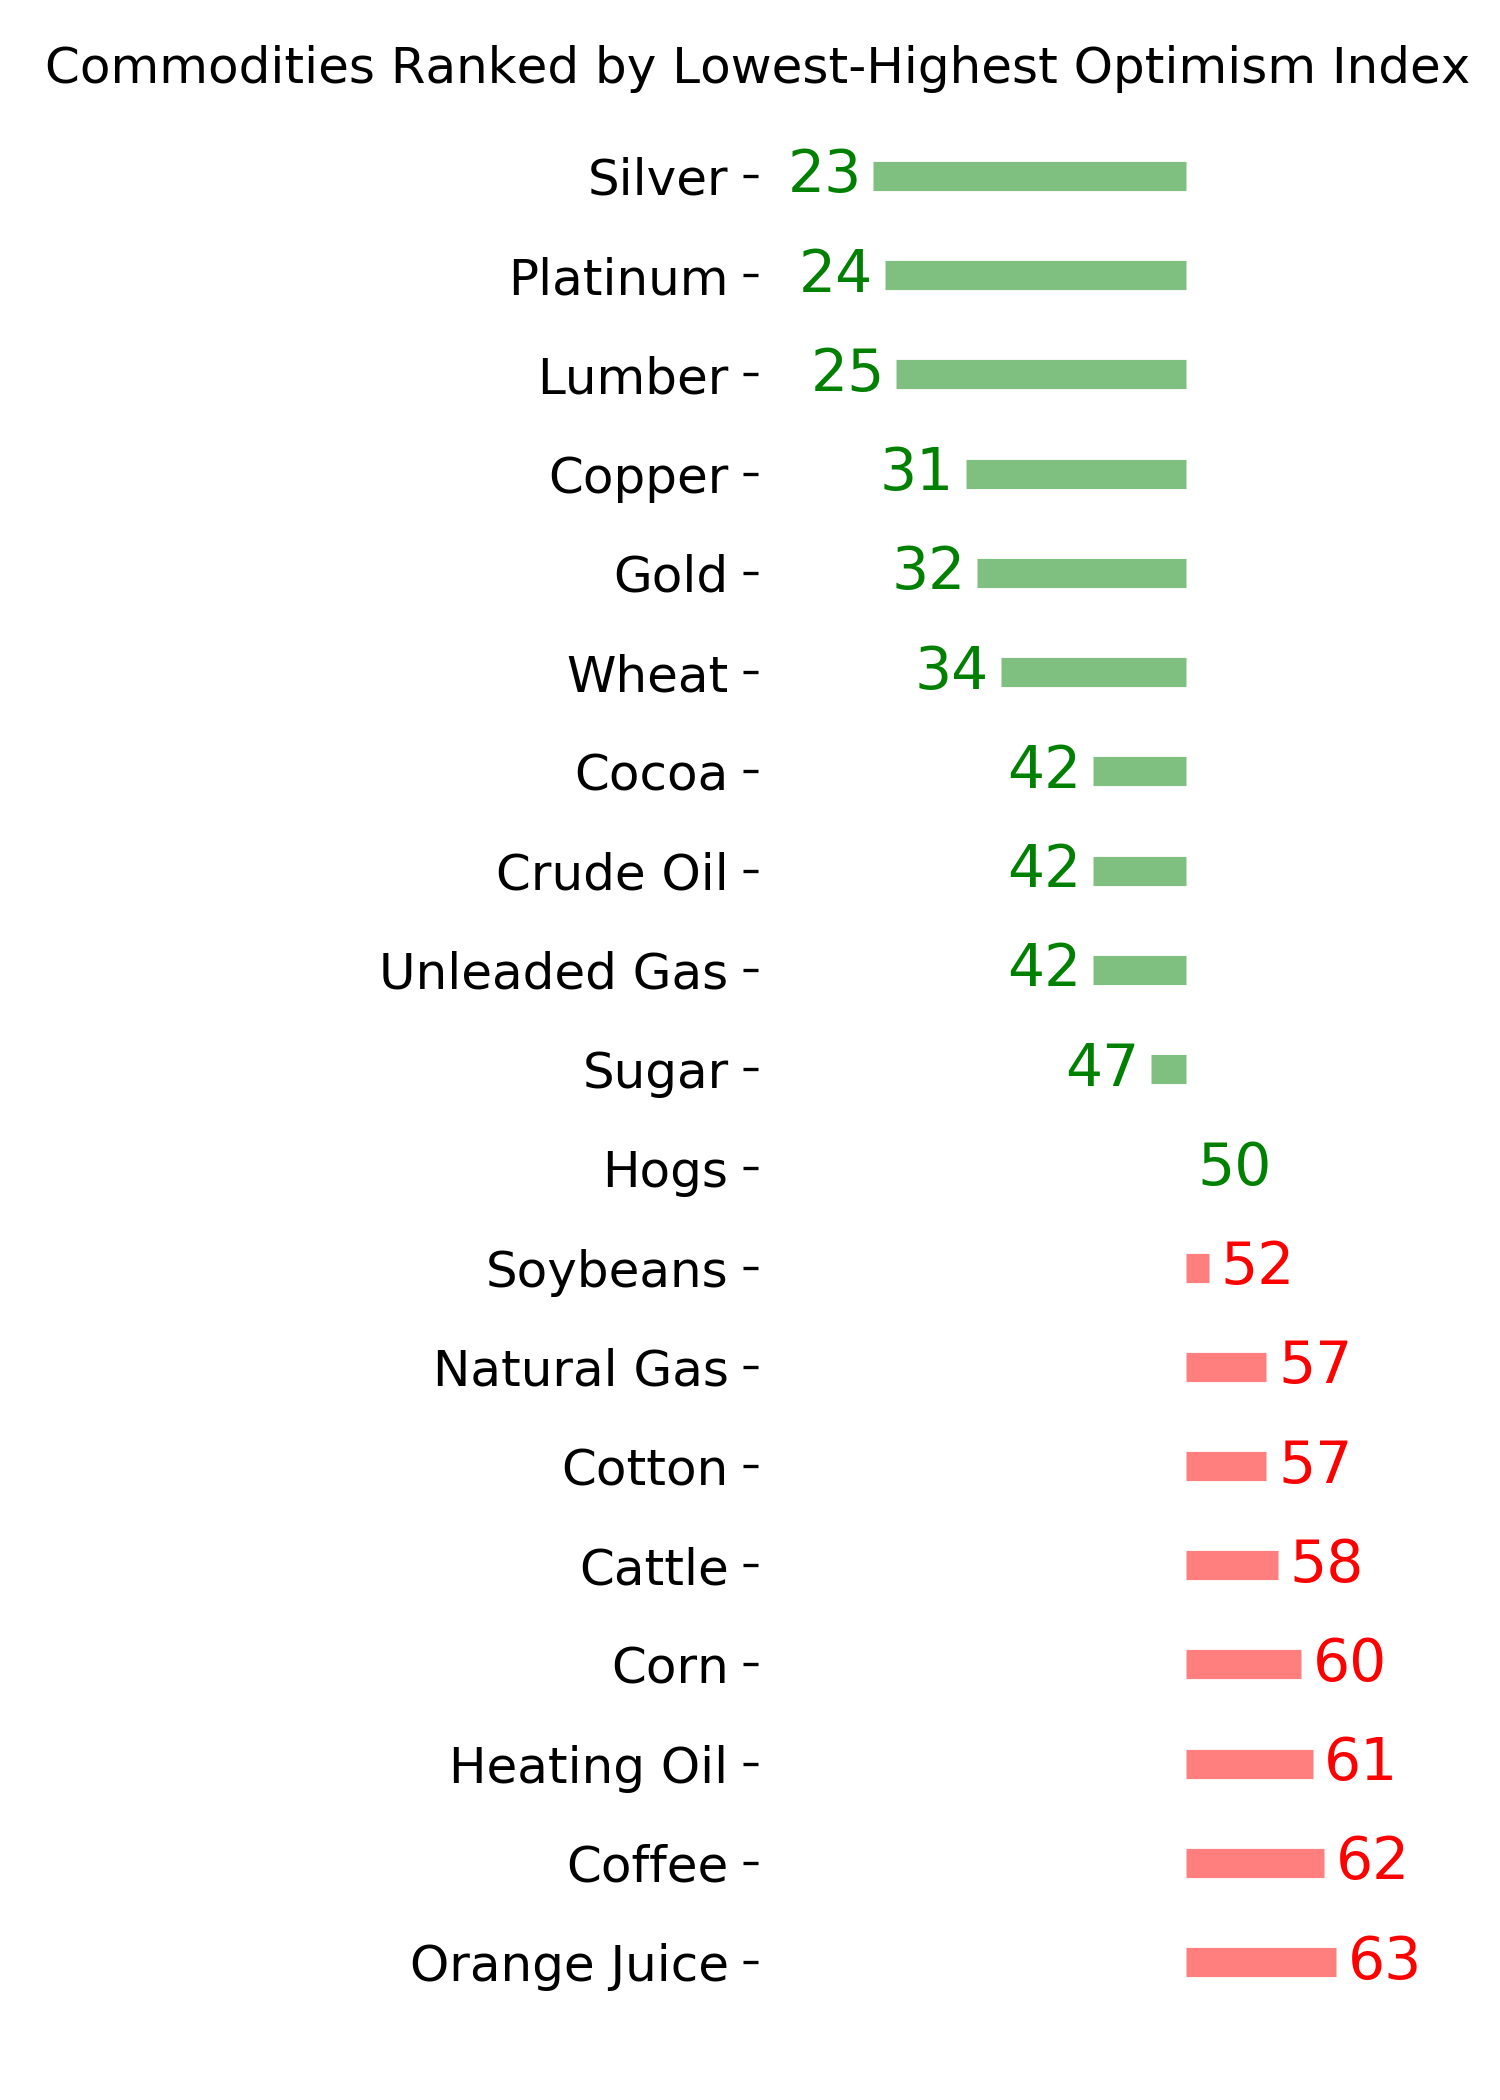
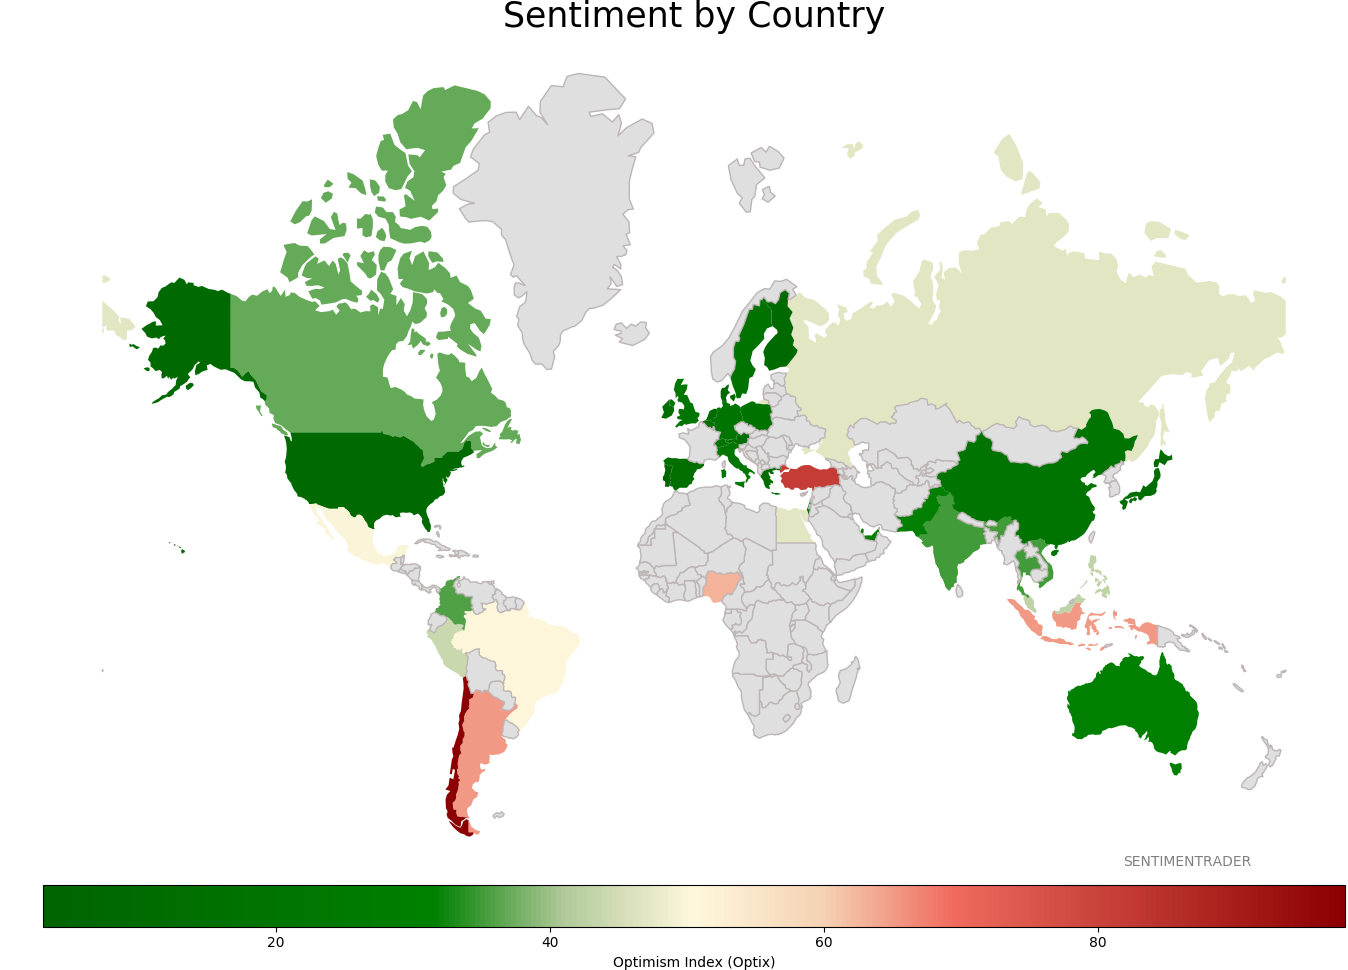
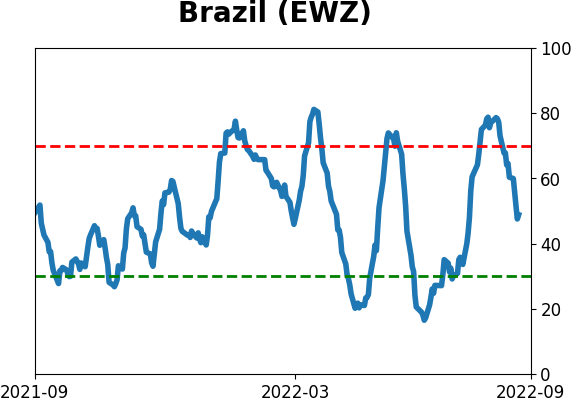
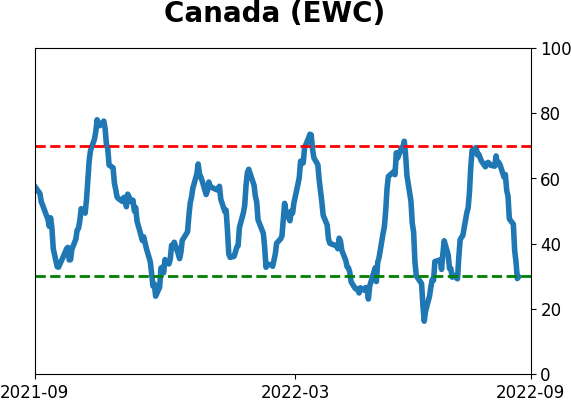
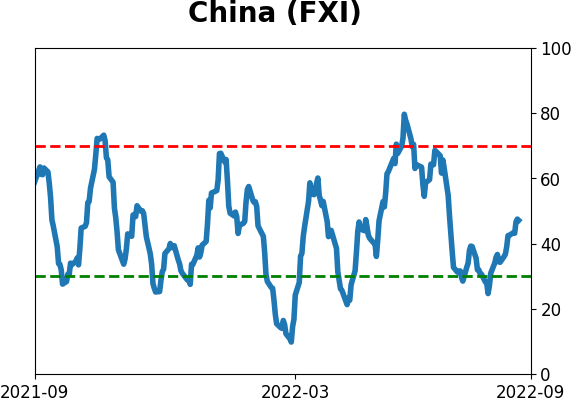
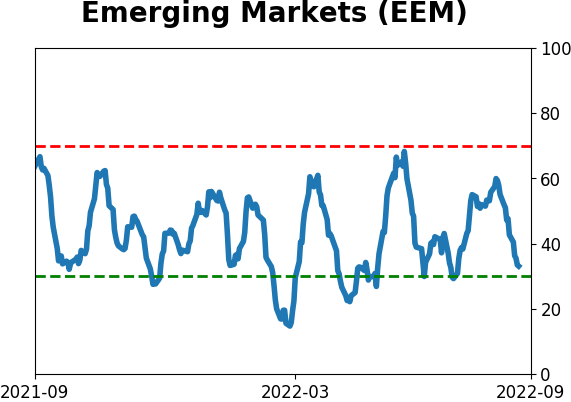
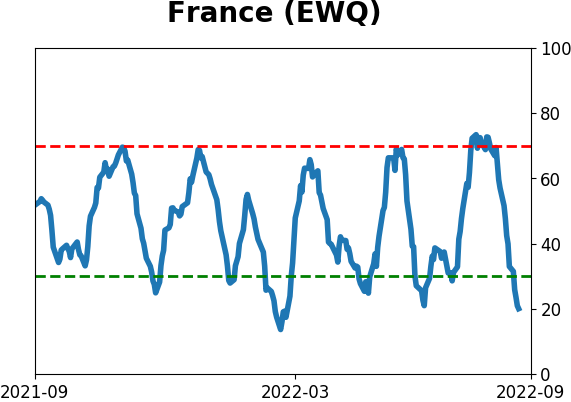
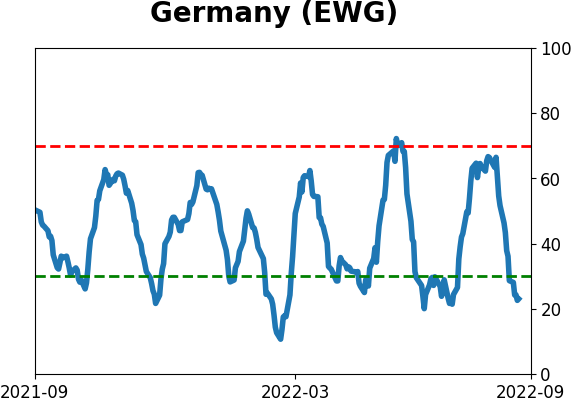
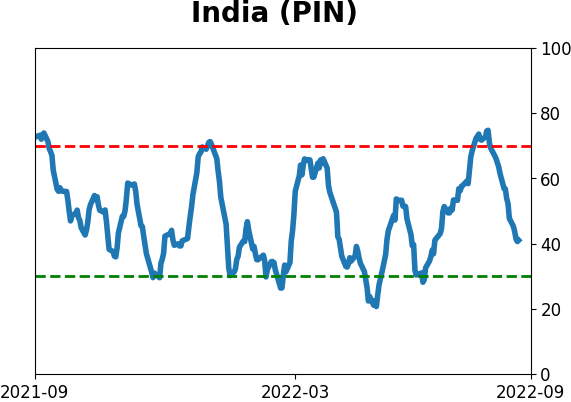
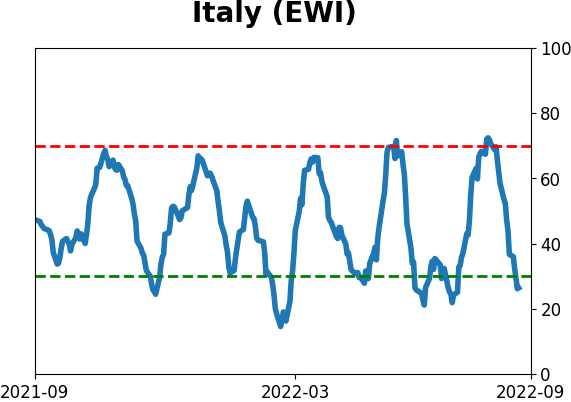
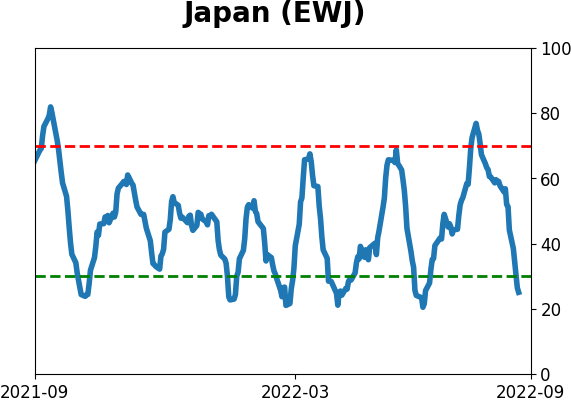
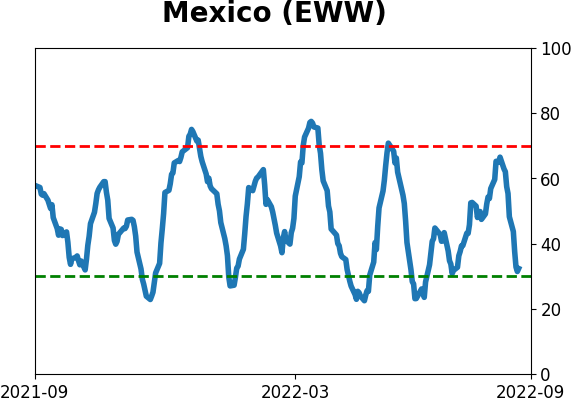
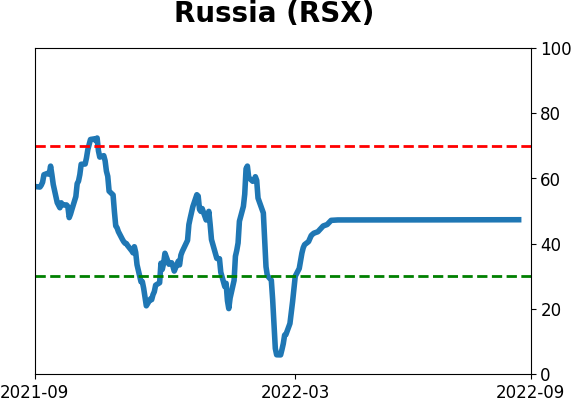
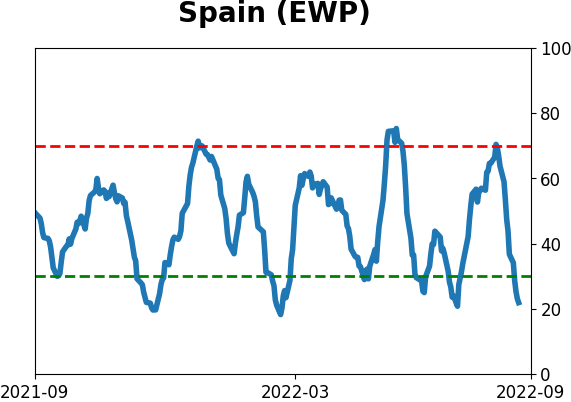
Sentiment Around The World
Optimism Index Thumbnails
|
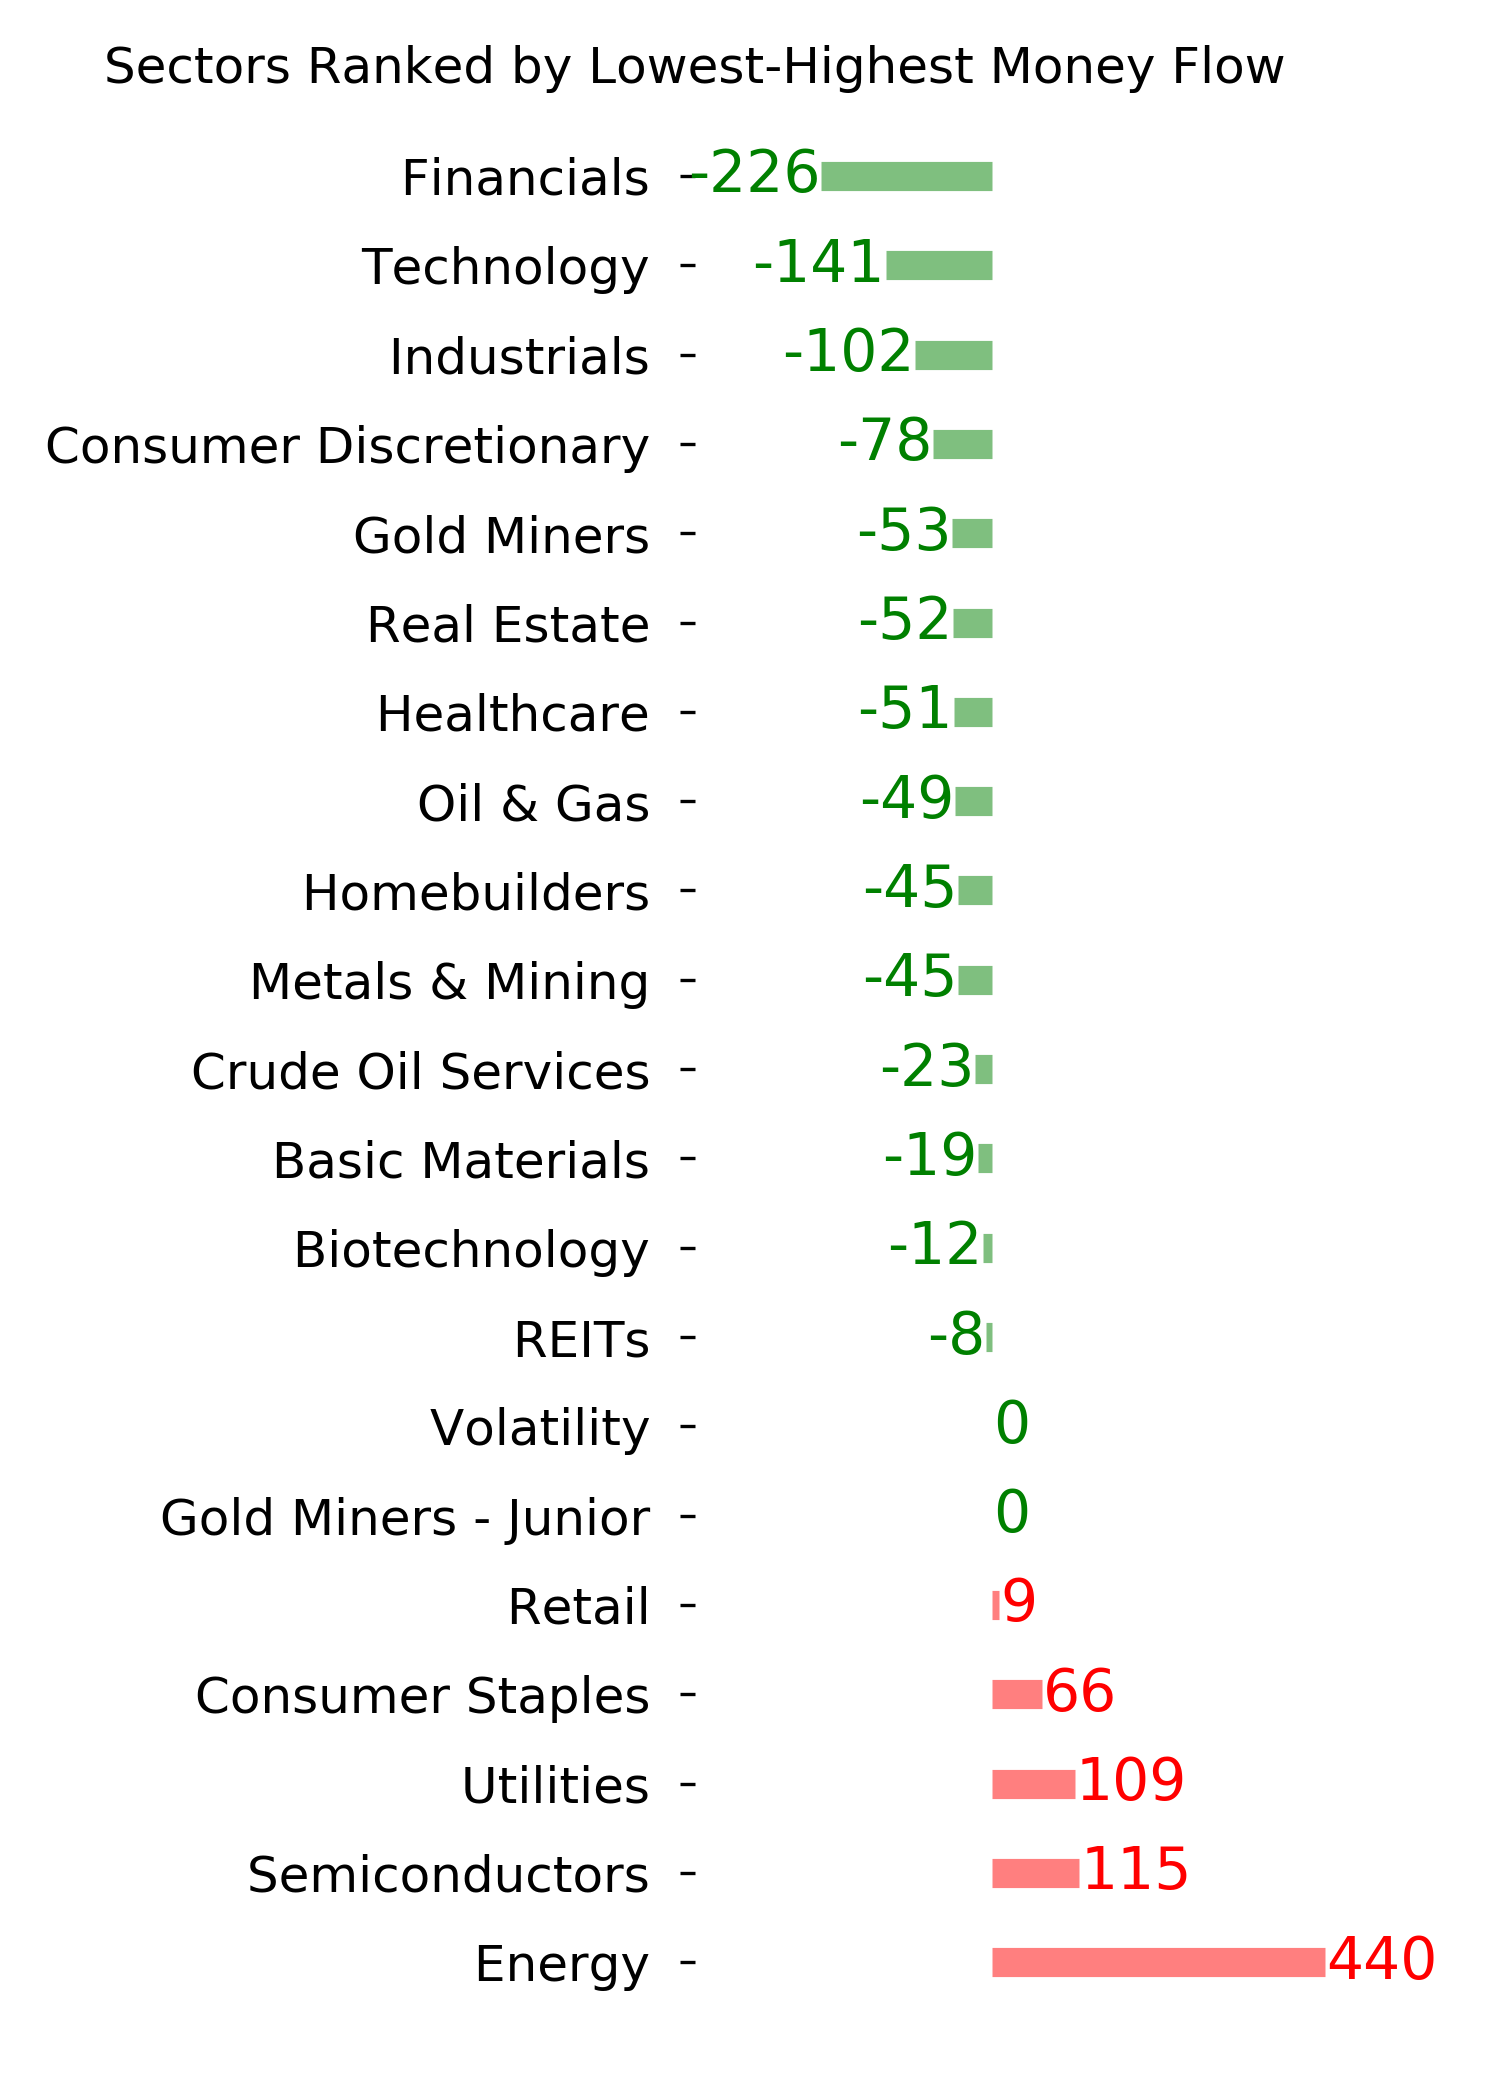
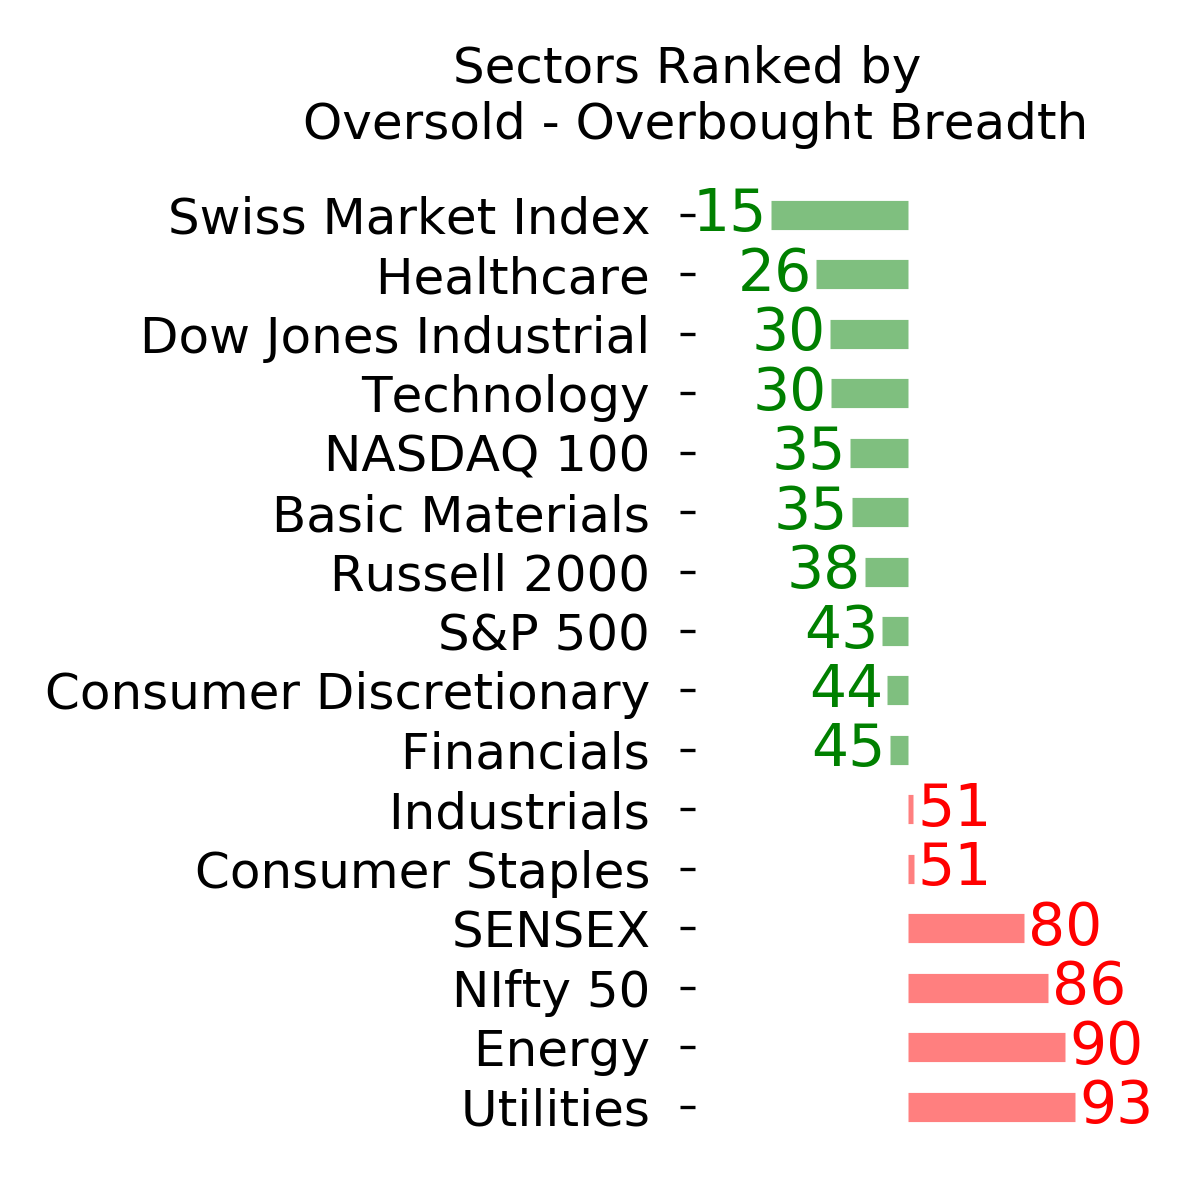
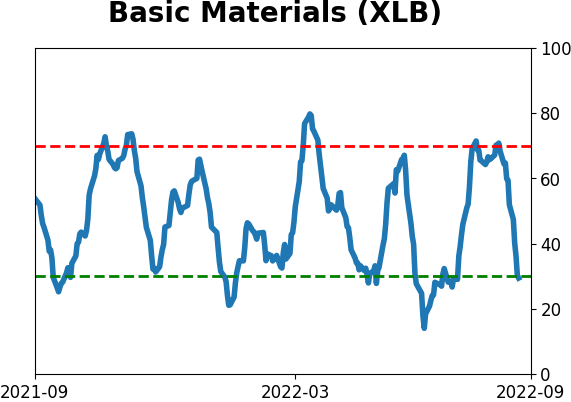
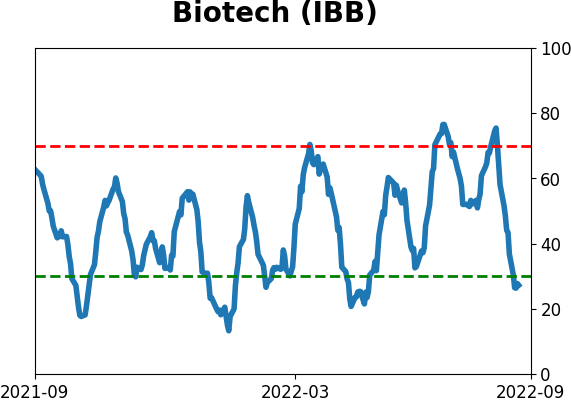
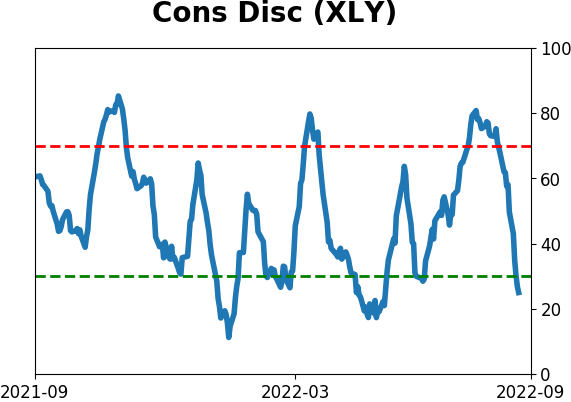
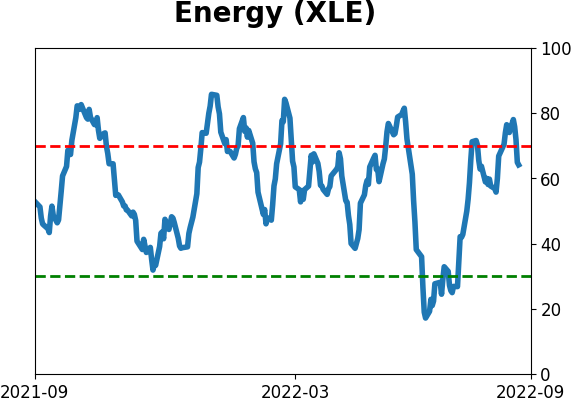
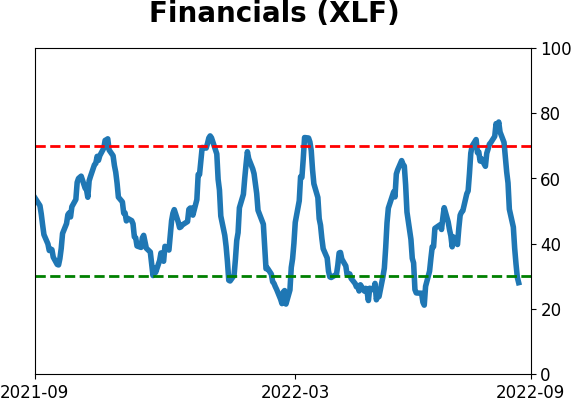
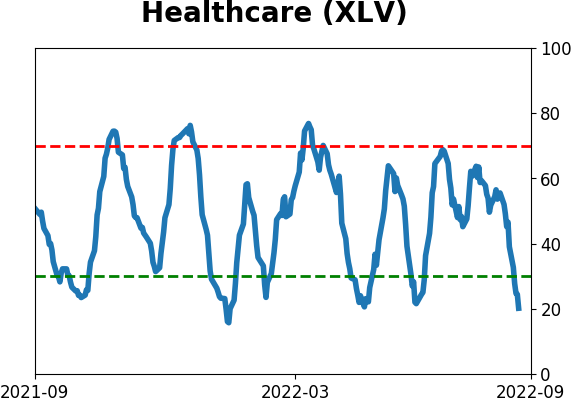
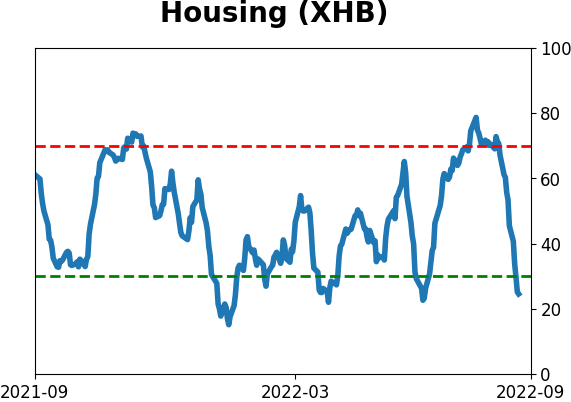
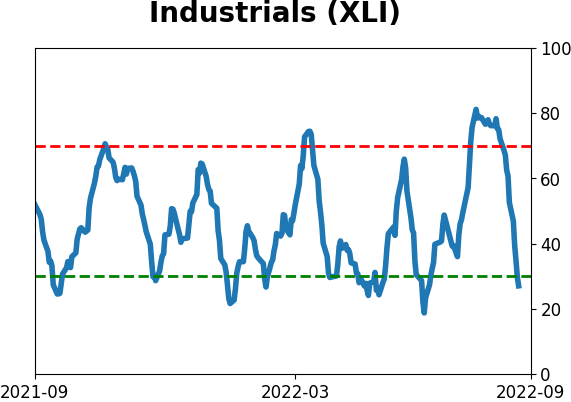
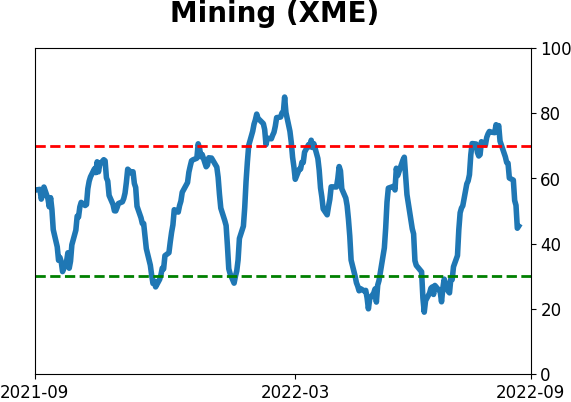
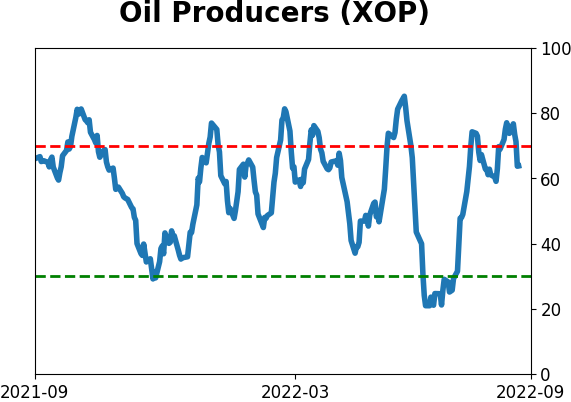
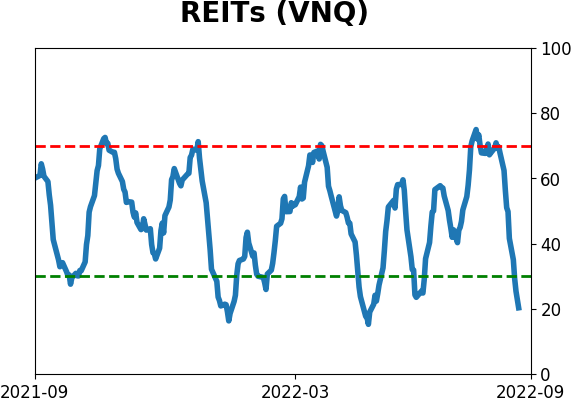
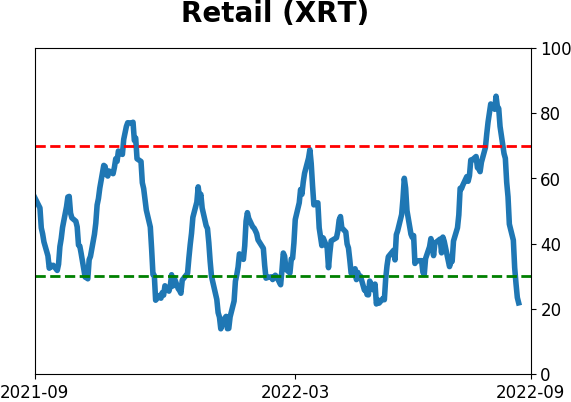
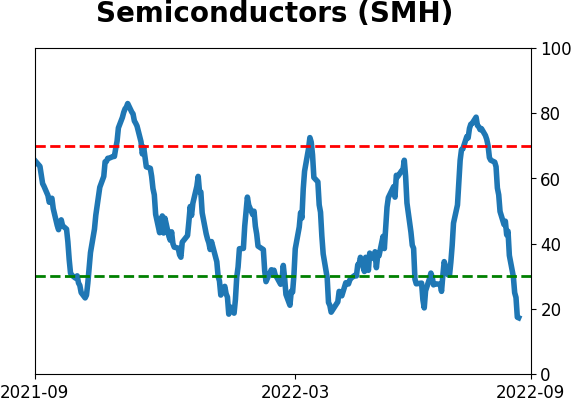
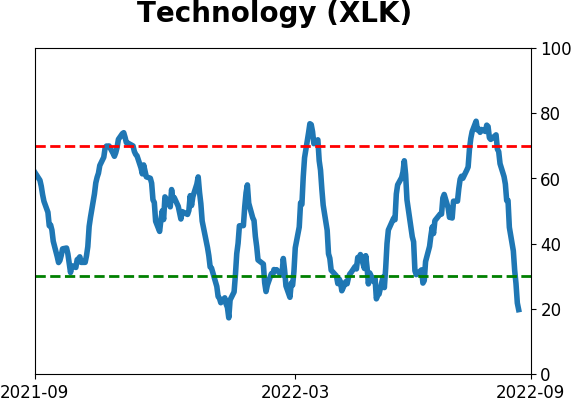
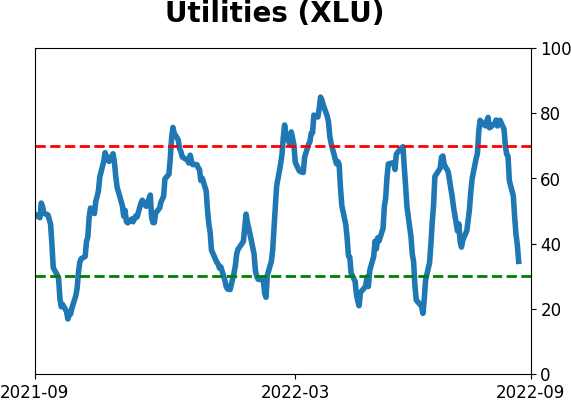
Sector ETF's - 10-Day Moving Average
|
|
|
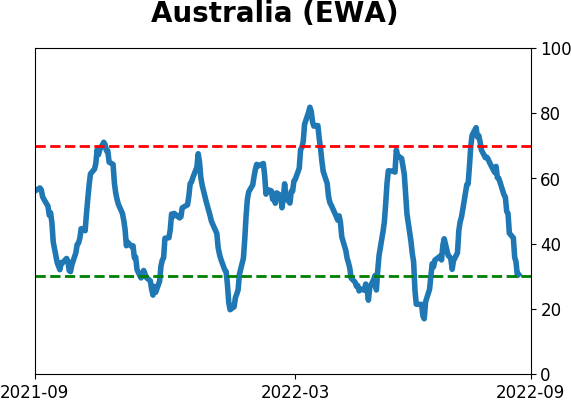
Country ETF's - 10-Day Moving Average
|
|
|
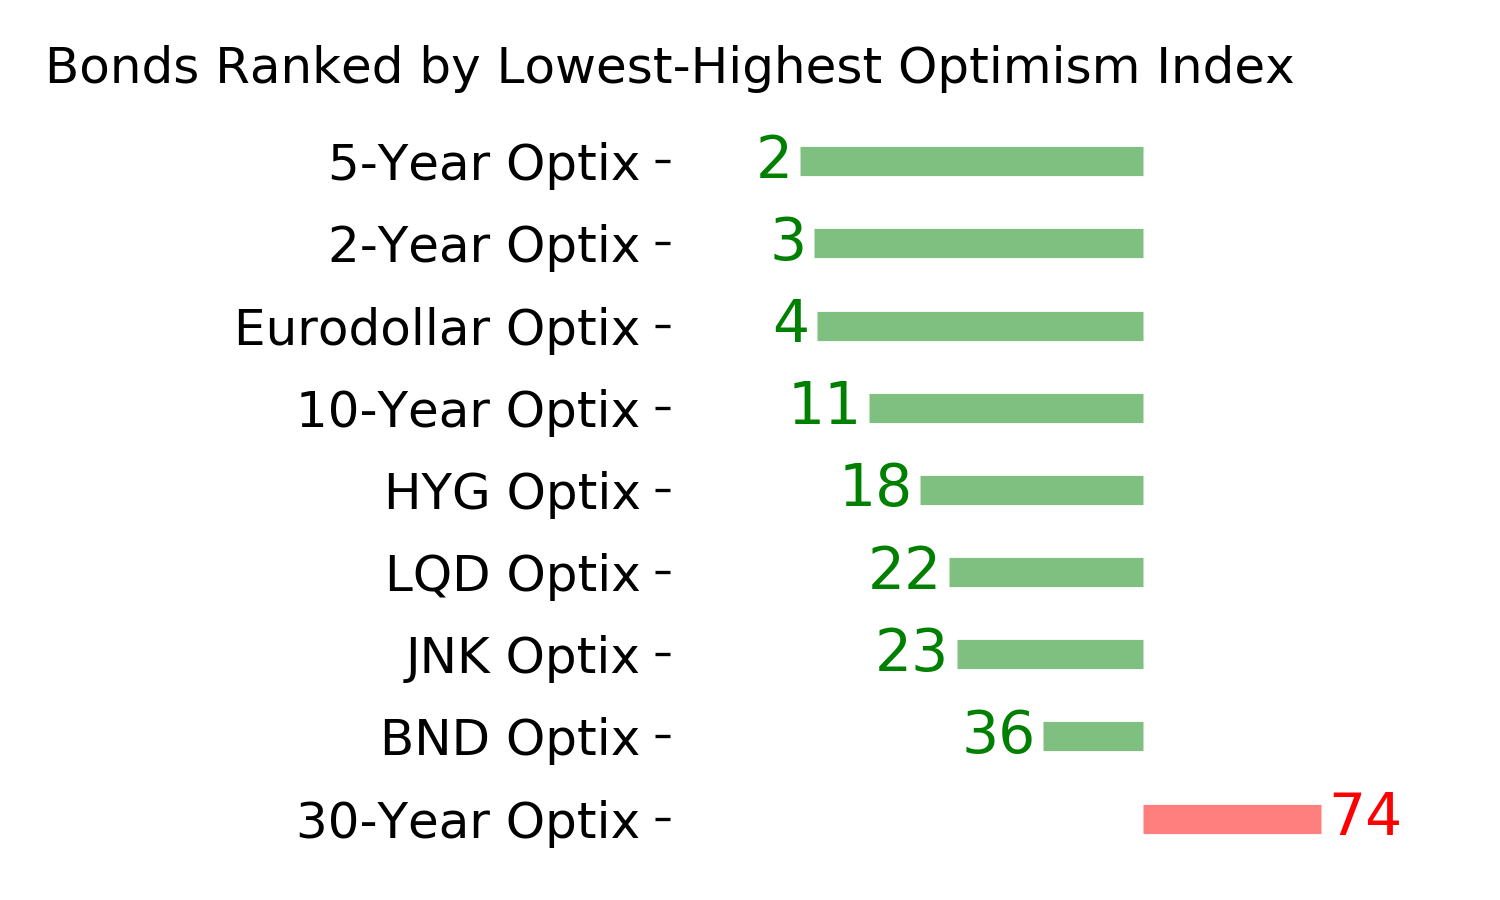
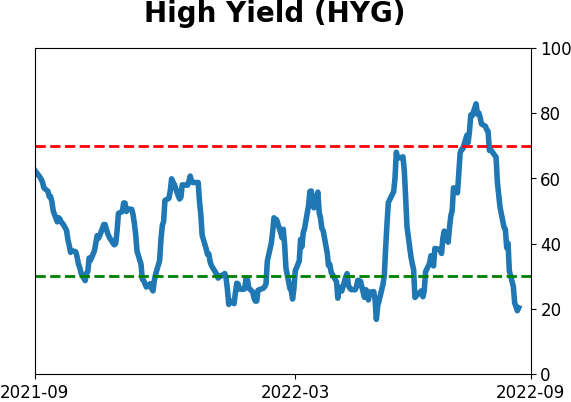
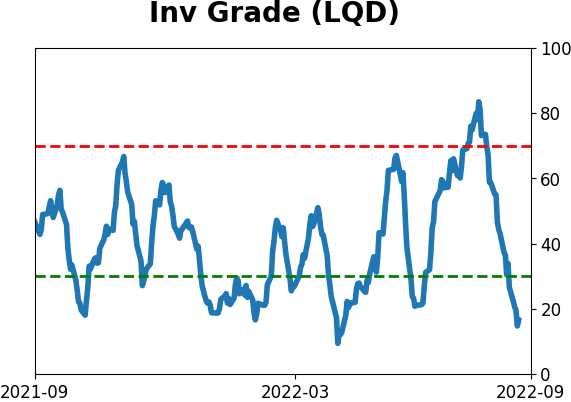
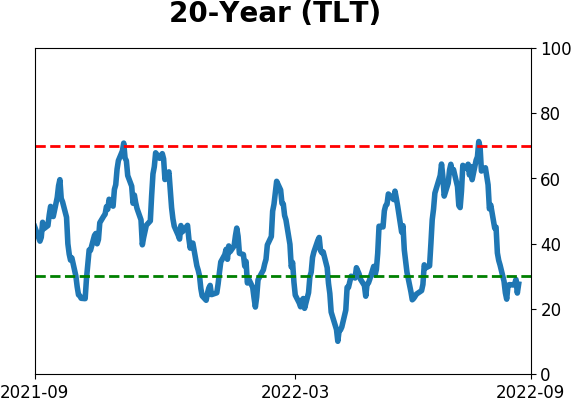
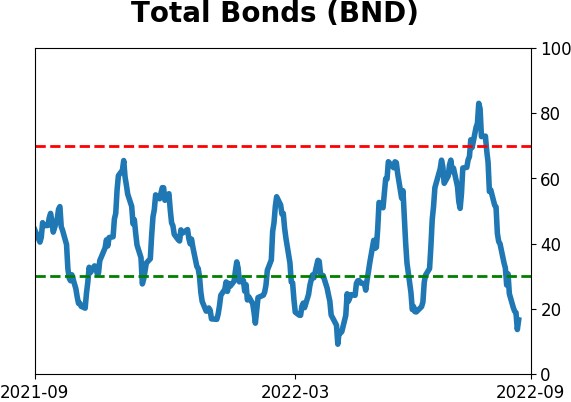
Bond ETF's - 10-Day Moving Average
|
|
|
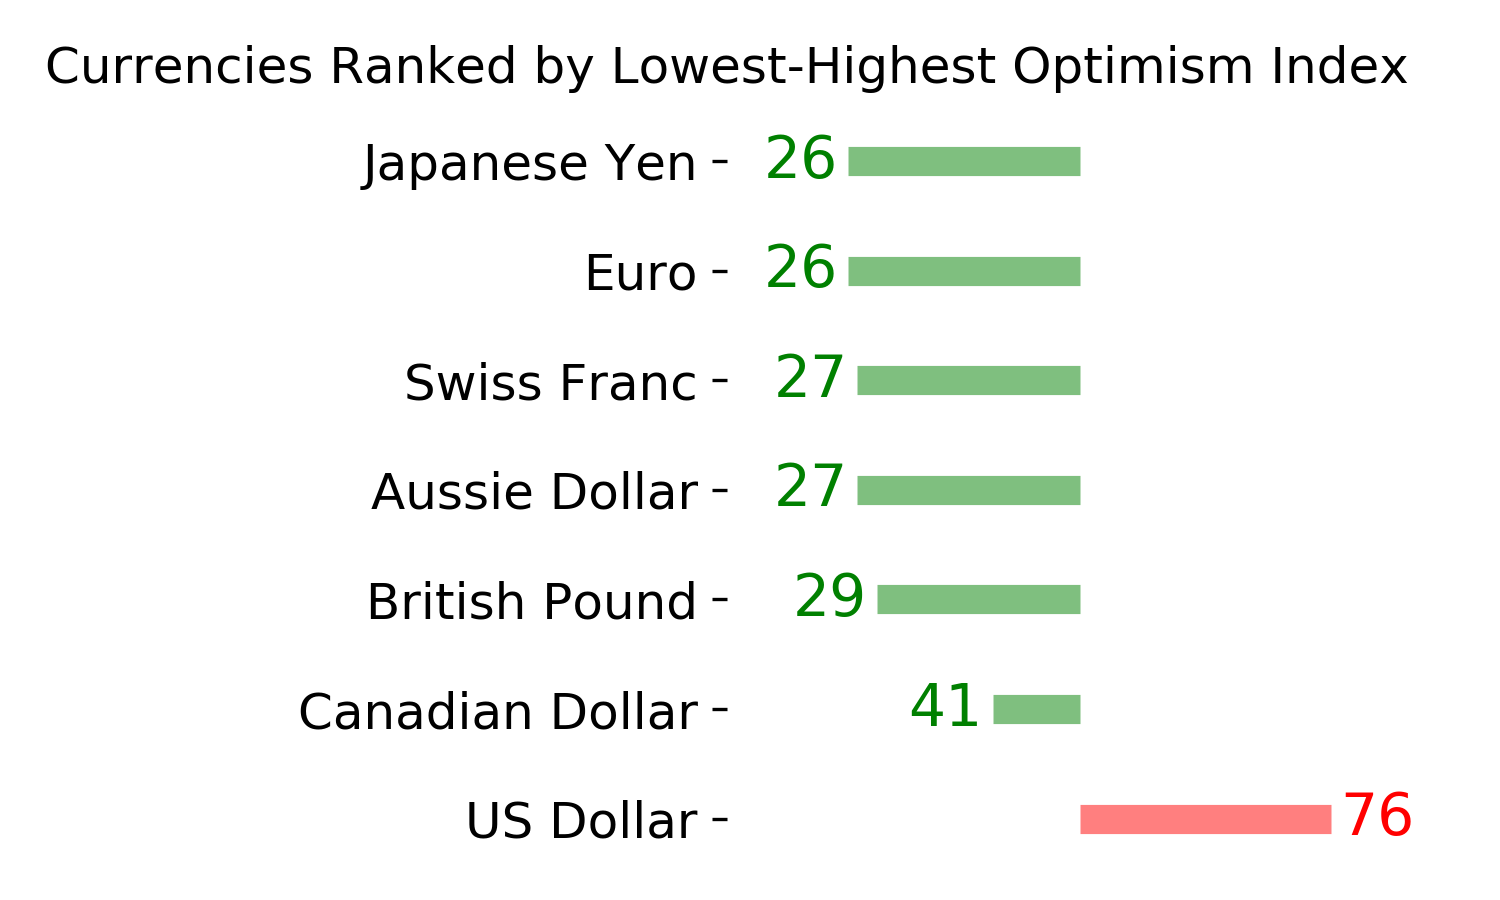
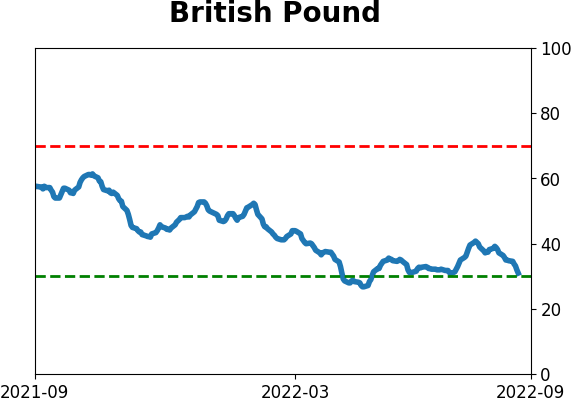
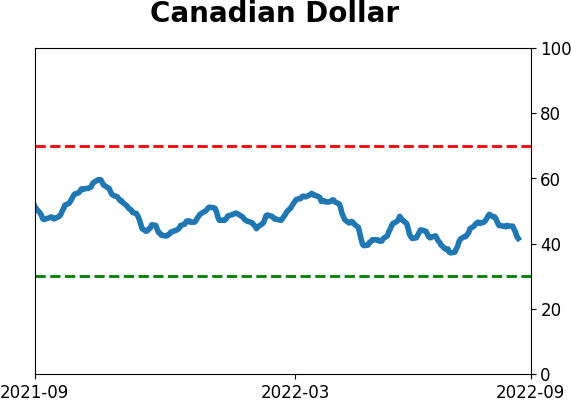
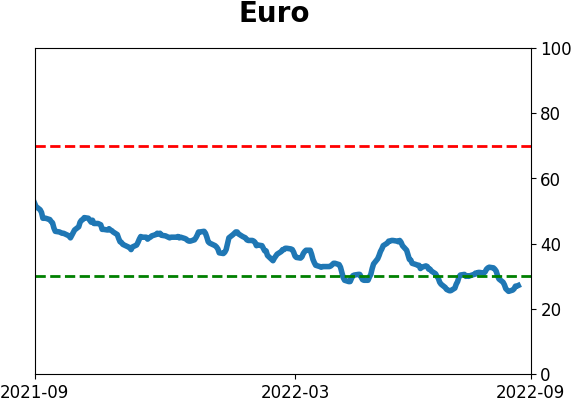
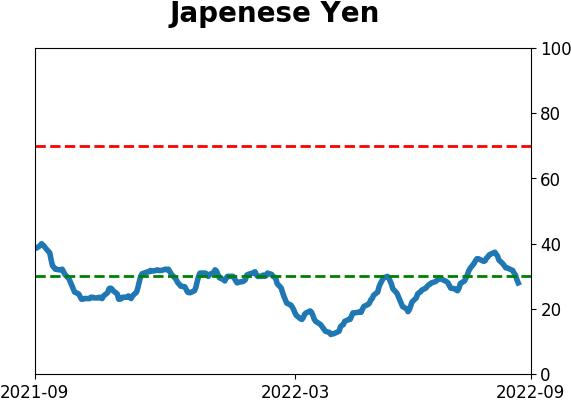
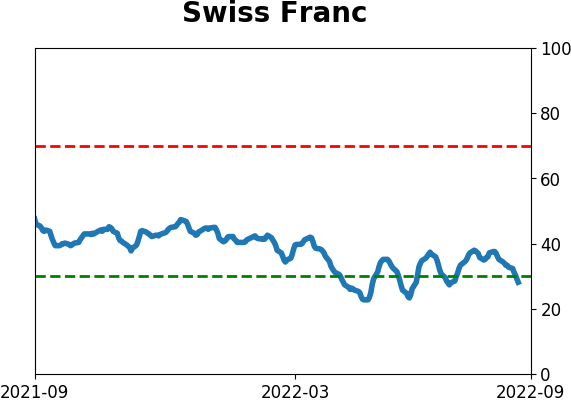
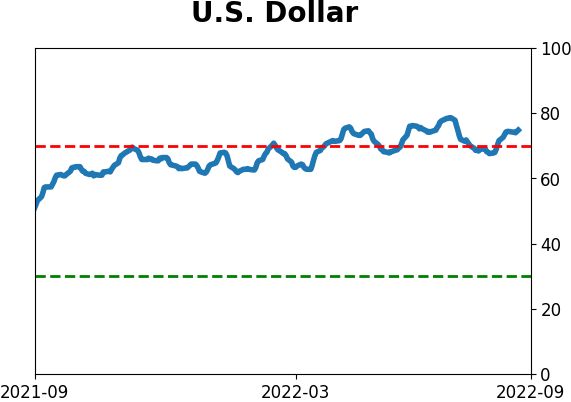
Currency ETF's - 5-Day Moving Average
|
|
|
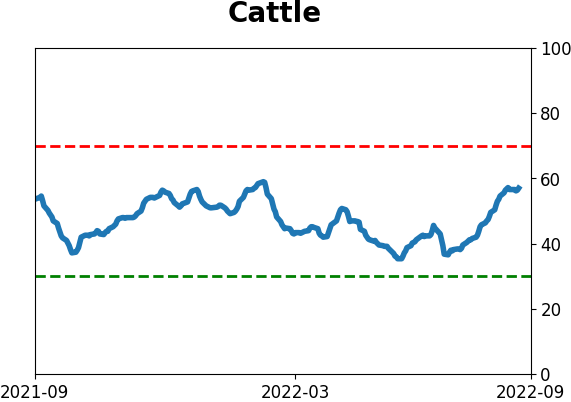
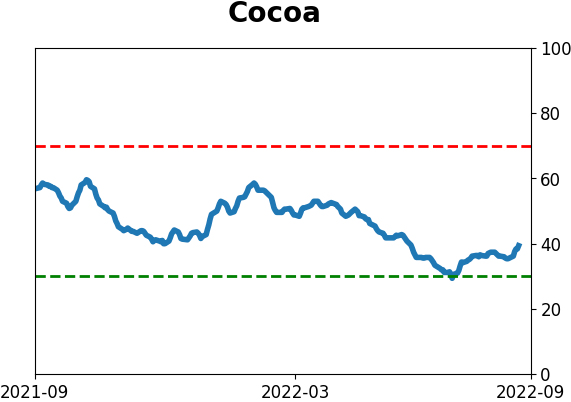
Commodity ETF's - 5-Day Moving Average
|
|