Headlines
|
|
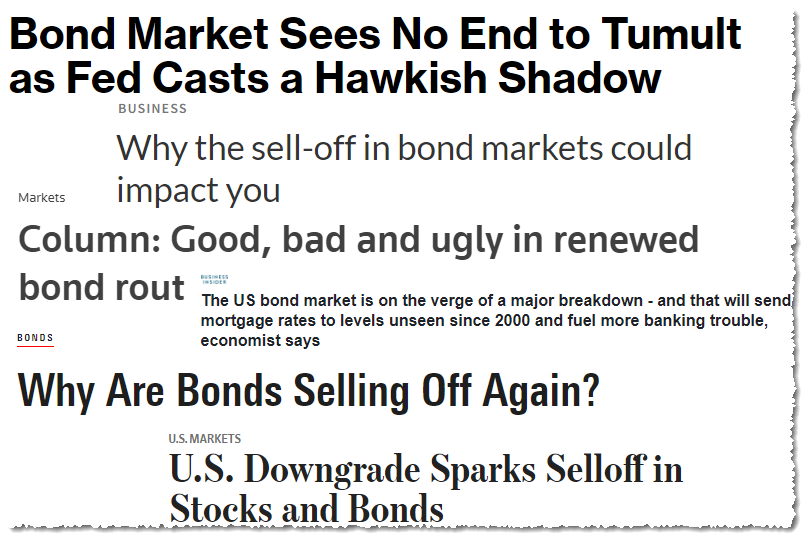
Sentiment on bonds is decidedly ugly:
The bond market suffered one of its worst-ever losses in 2022, and 2023 hasn't been much better. Sentiment is awful, and some indicators are showing historic extremes. Unfortunately for contrarians, indicators aren't as effective as other markets like stocks. Also, seasonality is about to turn decidedly negative.
|
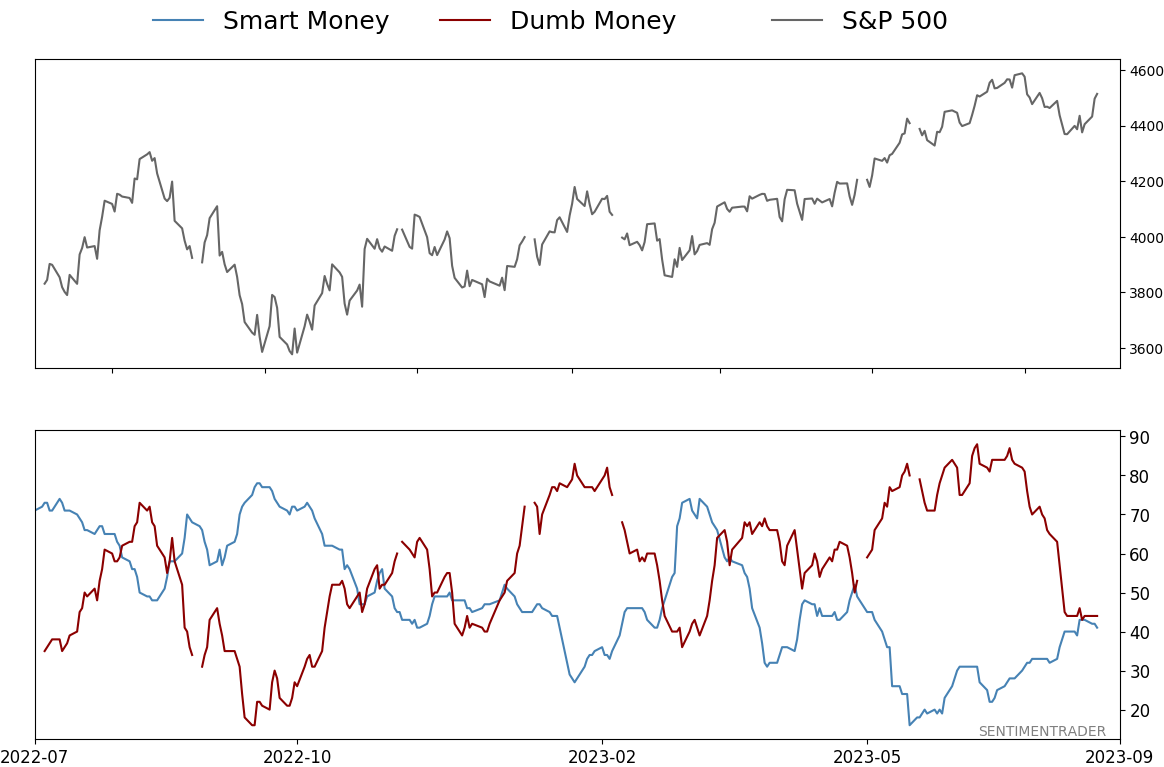
Smart / Dumb Money Confidence
|
Smart Money Confidence: 41%
Dumb Money Confidence: 44%
|
|
Risk Levels
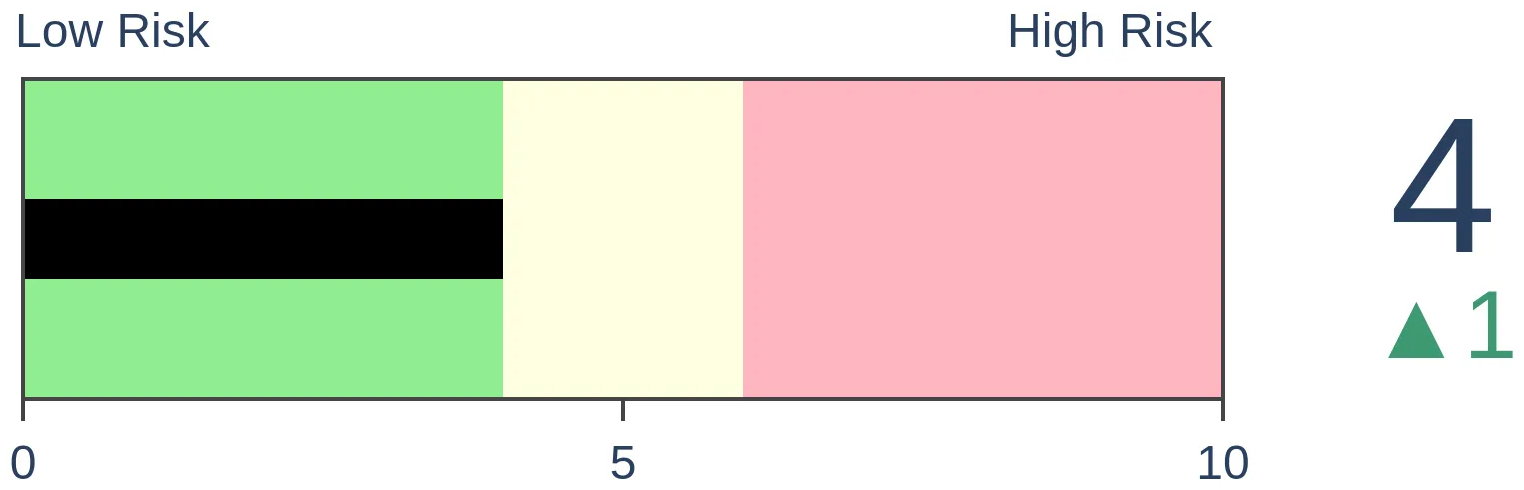
Stocks Short-Term
|
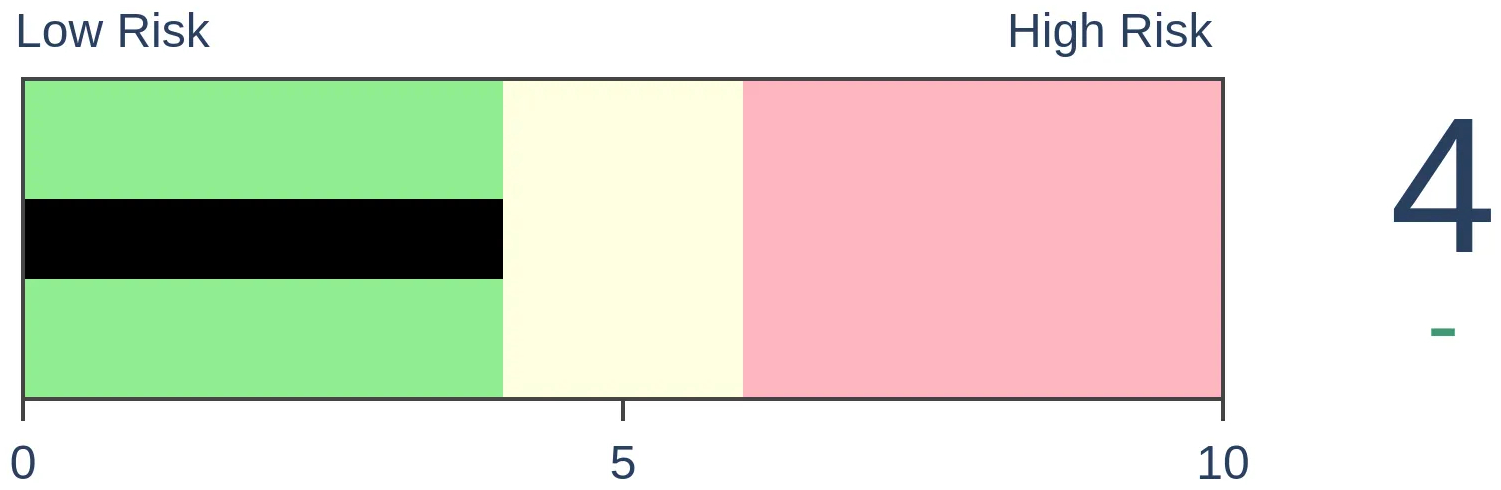
Stocks Medium-Term

|
|
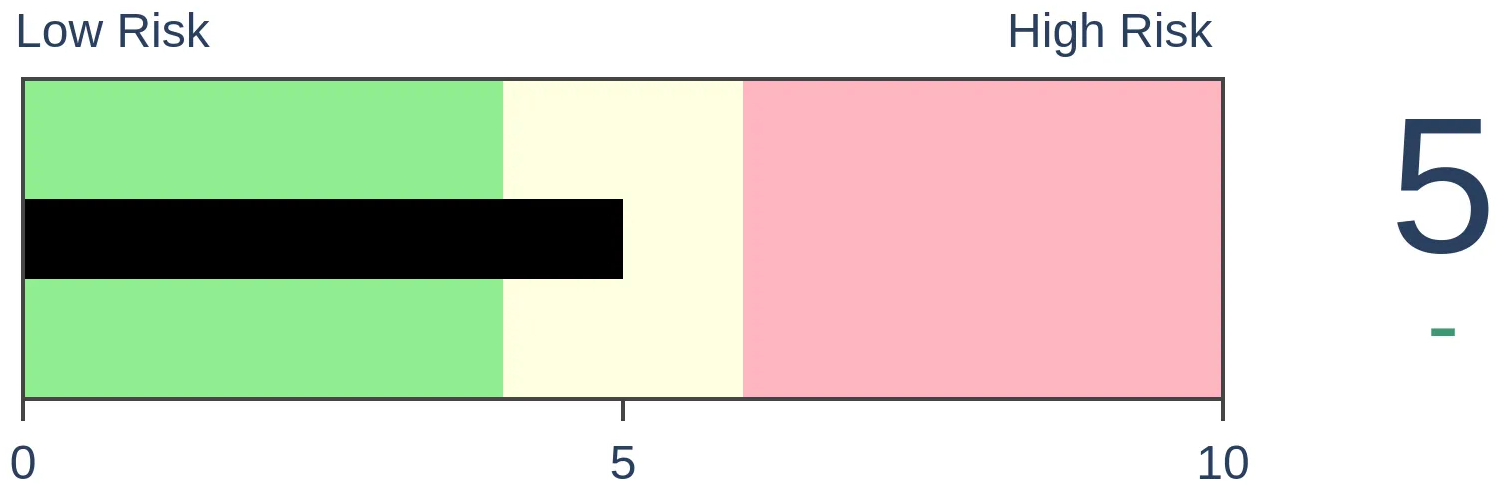
Bonds
|
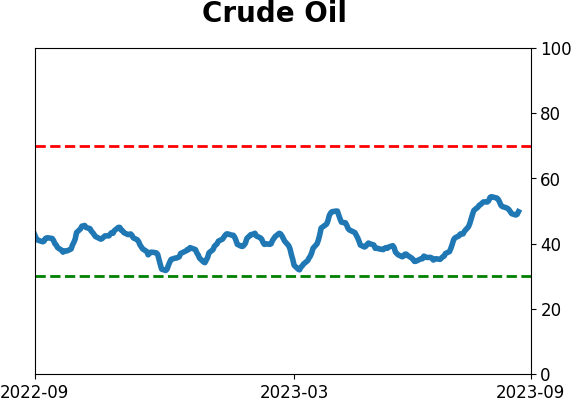
Crude Oil

|
|
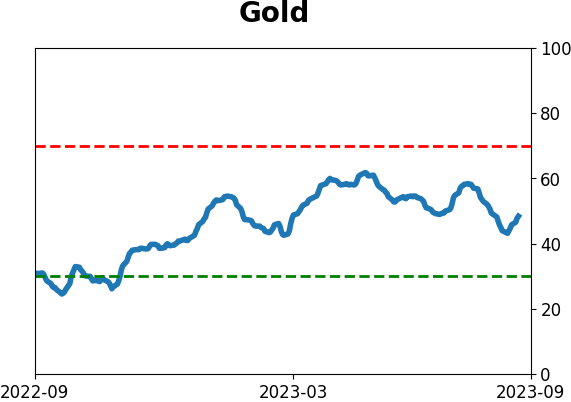
Gold
|
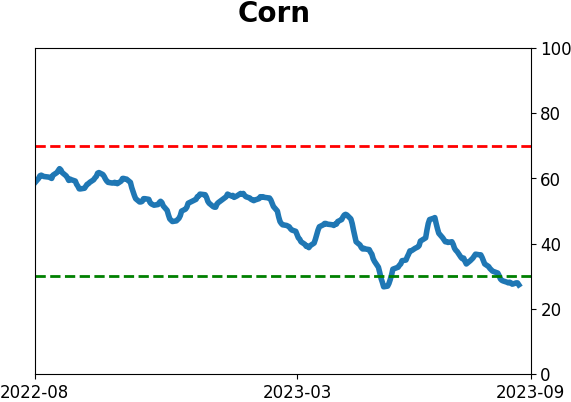
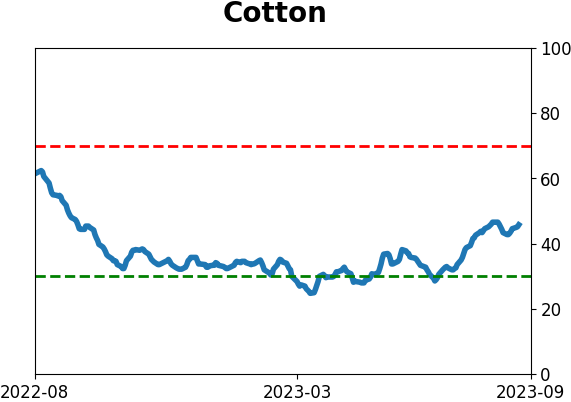
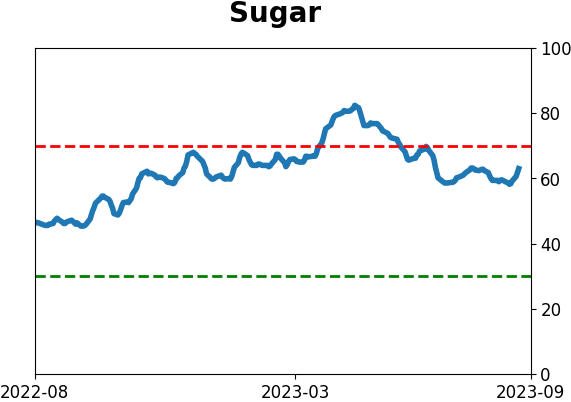
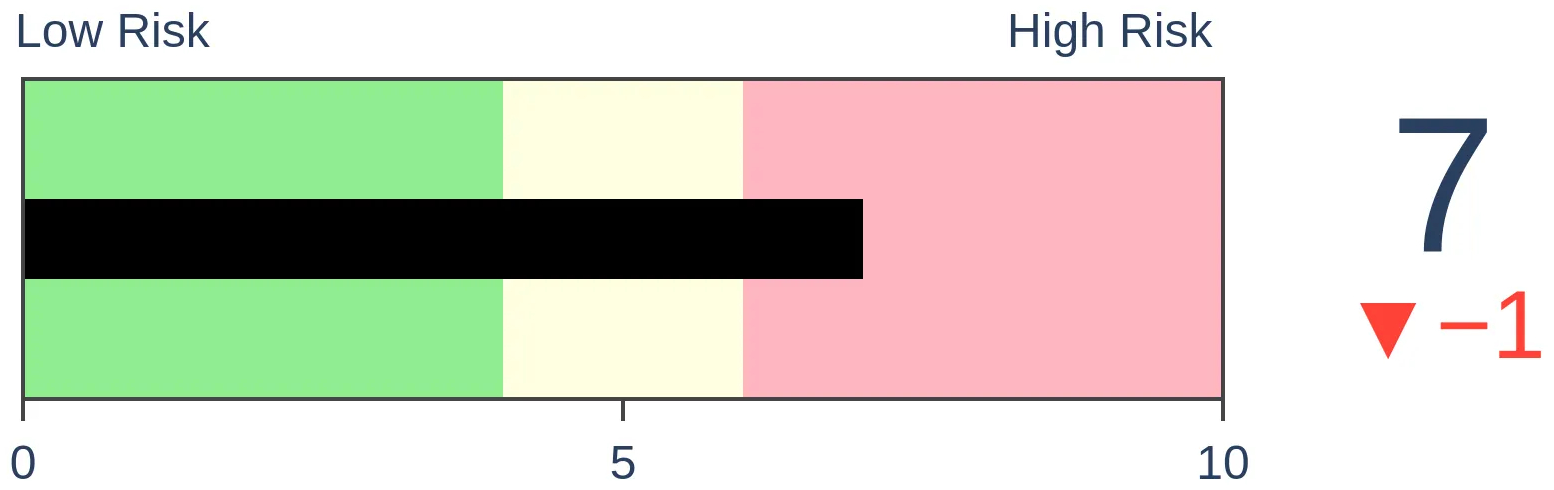
Agriculture
|
|
Research
By Jason Goepfert
BOTTOM LINE
The bond market suffered one of its worst-ever losses in 2022, and 2023 hasn't been much better. Sentiment is awful, and some indicators are showing historic extremes. Unfortunately for contrarians, indicators aren't as effective as other markets like stocks. Also, seasonality is about to turn decidedly negative.
FORECAST / TIMEFRAME
None
|
Key points:
- Sentiment on bonds is about as low as it has been at any point in 20 years
- Contrary indicators aren't as effective in the bond market vs. stocks, but lately, it has been a decent guide
- One stumbling block is seasonality, which is about to turn decidedly negative for fixed income
Funds are exiting bonds, and retail has made a quick U-turn
The sell-off in fixed income markets has gone from a niche concern to a popular mainstream financial media topic to everyday news headlines. It usually takes quite a while, and severe declines, to reach the point where it's at with recent headlines.
Professional investors have taken note of the headlines and believe they're not a contrary indicator this time.
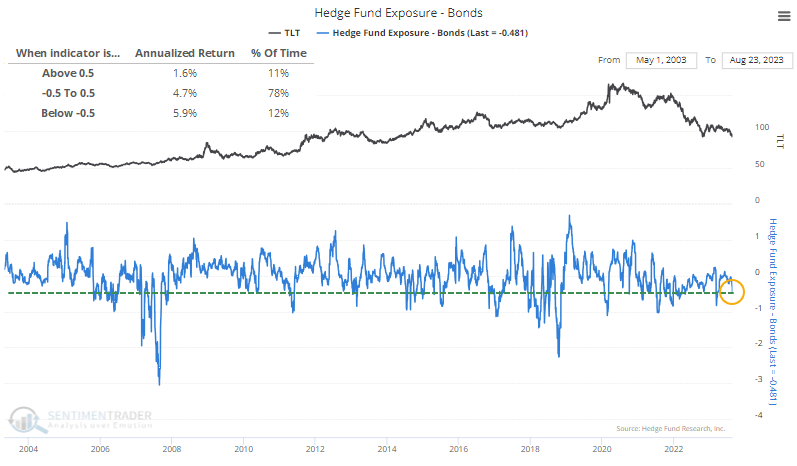
Hedge funds are quickly scaling back their exposure to bonds, now getting close to -50% exposure, which has preceded above-average annualized returns in TLT. Exposure has certainly gotten much more extreme, and those extremes have been effective contrary signals. It has been enough to precede above-average annualized returns even at current low exposure levels.
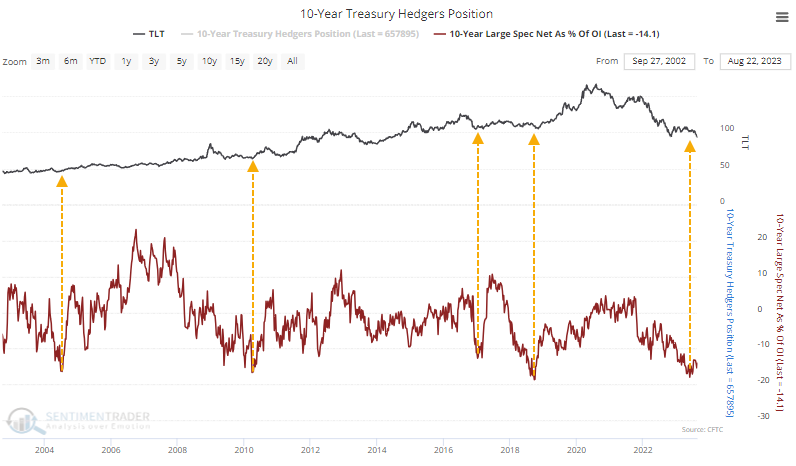
The cut in exposure among trend-following hedge funds coincides with drastic short positions against 10-year Treasury futures. Speculators hold about 14% of open interest in the contracts net short, which has occurred near troughs in TLT.
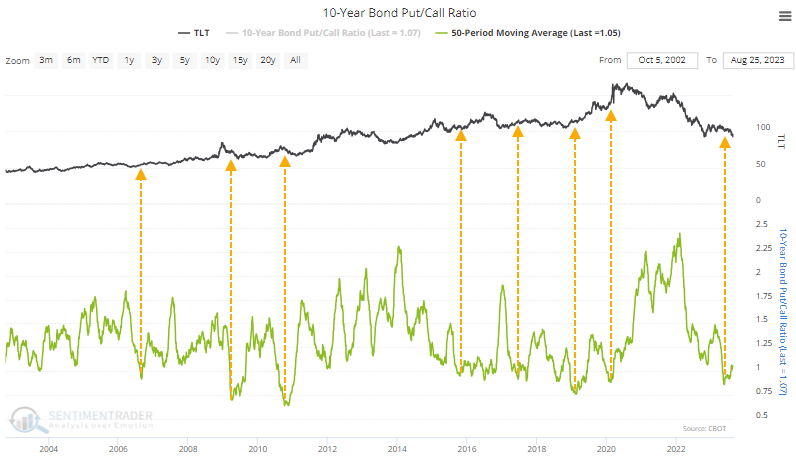
In the other primary market for leveraged and expiring exposure, options traders have not bought many puts. The 50-day average put/call ratio in 10-year notes is rising from one of its lowest levels ever. However, the options market in bonds differs from stocks - it is not a good contrary indicator.
High readings (heavy put activity relative to calls) are a reliable bottom signal in stocks, but not for bonds, and vice-versa. The arrows on the chart show other times the 50-day average p/c ratio troughed at a very low level, and it mostly preceded rebounds in TLT.
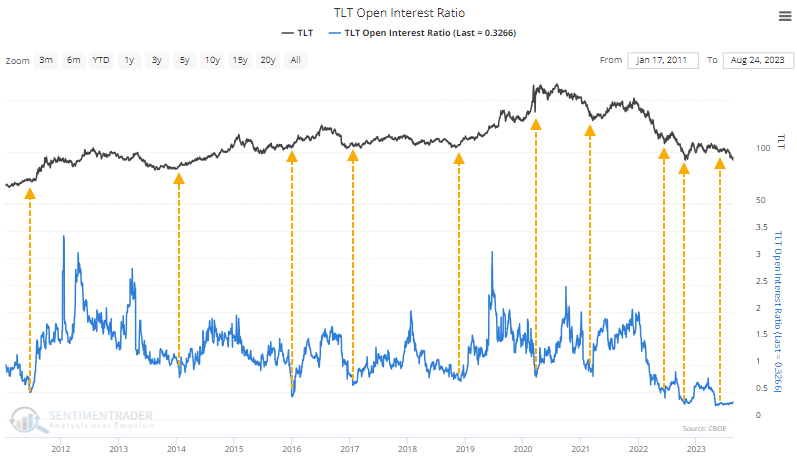
Switching to TLT itself, the Open Interest Put/Call Ratio is similarly low, showing a historically low level of open interest in put contracts relative to call contracts. While contrarians want to consider this a sign of optimism, it has been misguided. Most bottoms in TLT occurred when the open interest ratio was very low.
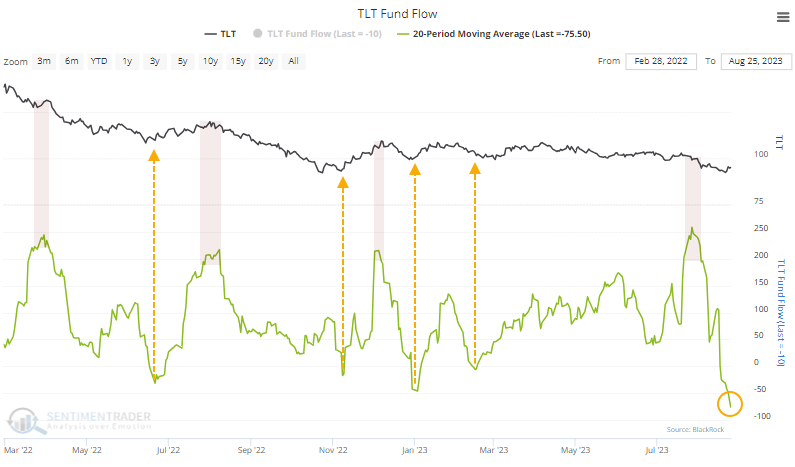
After a brief bout of apparent optimism, traders have been leaving the ETF in droves lately. The 20-day average fund flow exceeded a $250 million per day inflow in late July but has since reversed course and is now an average outflow of more than $75 million per day. Fund flows don't have the best track record, but since the bear market began in earnest, outflows in TLT tended to precede relief bounces.
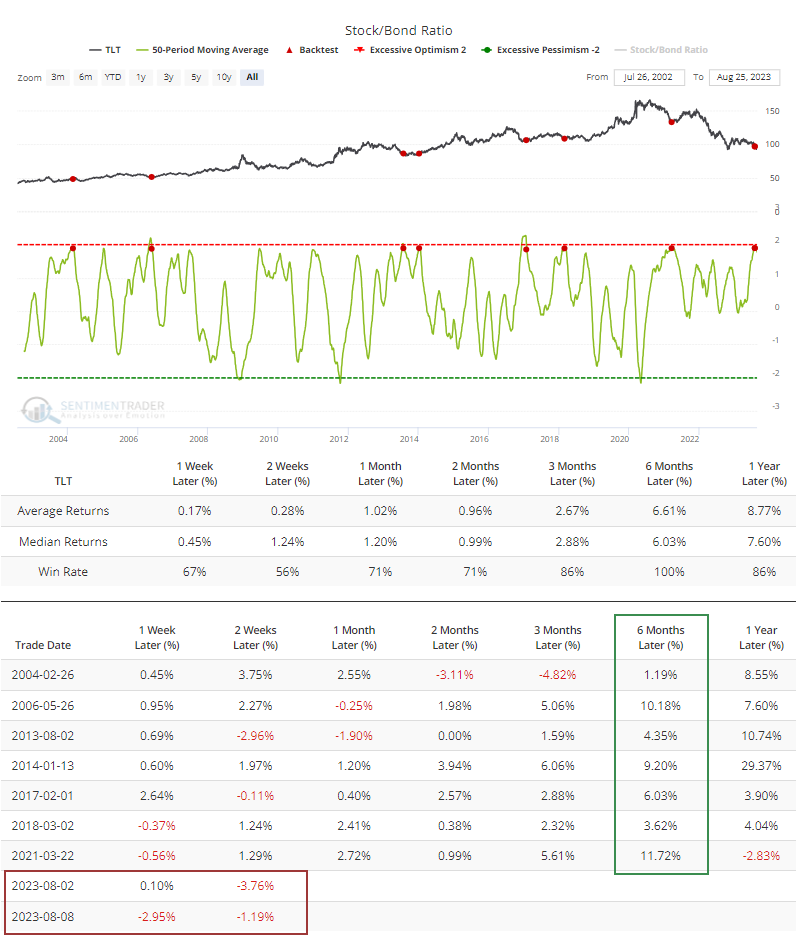
Because stocks had been doing well until recent weeks, and bonds have not, the Stock/Bond Ratio was stuck at a very high level and has just started to reverse.
The Backtest Engine shows that when the 50-day average of the ratio began to curl lower after a very high reading, it preceded six-month gains for TLT each time. It is concerning that the latest signals also show among the worst initial returns, suggesting we may not be able to put as much weight on this as prior signals.
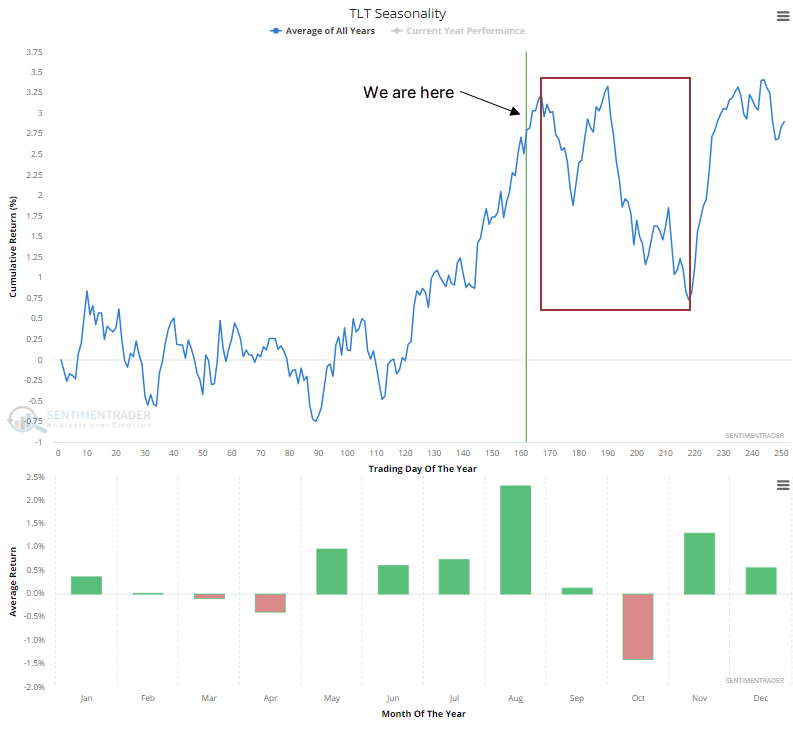
Seasonality is another worry, which is about to turn decidedly negative for TLT. Bond futures contracts and other fixed-income ETFs show mostly the same pattern, with a traditional rough stretch during September/October.
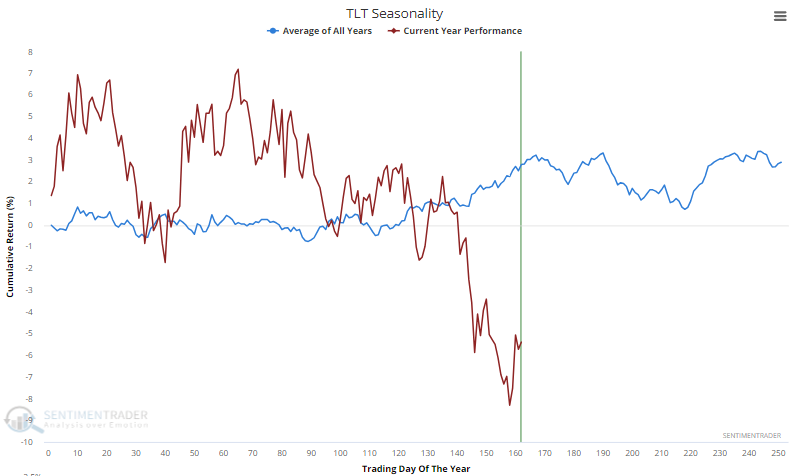
Maybe as a consolation, 2023 hasn't exactly abided by the annual pattern, with steep losses during what had been its most consistently positive time of year.
What the research tells us...
The stock market tends to respond the most consistently to extremes in sentiment, perhaps because non-institutional interests most influence it. That doesn't mean sentiment doesn't matter in other markets, only that it is a less reliable input. That's the case for the bond market, though it is probably the next-best market next to stocks when sentiment reaches an extreme.
There is little doubt that pessimism in bonds of all stripes is extreme. Among the problems, though, is that it may not be enough to turn the market. There are initial signs that extremes haven't been working that well anyway, and the market tends to suffer a rough stretch into October. Within such an established downtrend, we'd prefer to see more compelling extremes across more indicators, preferably with seasonality as a headwind (after October) instead of a headwind.
Indicators at Extremes
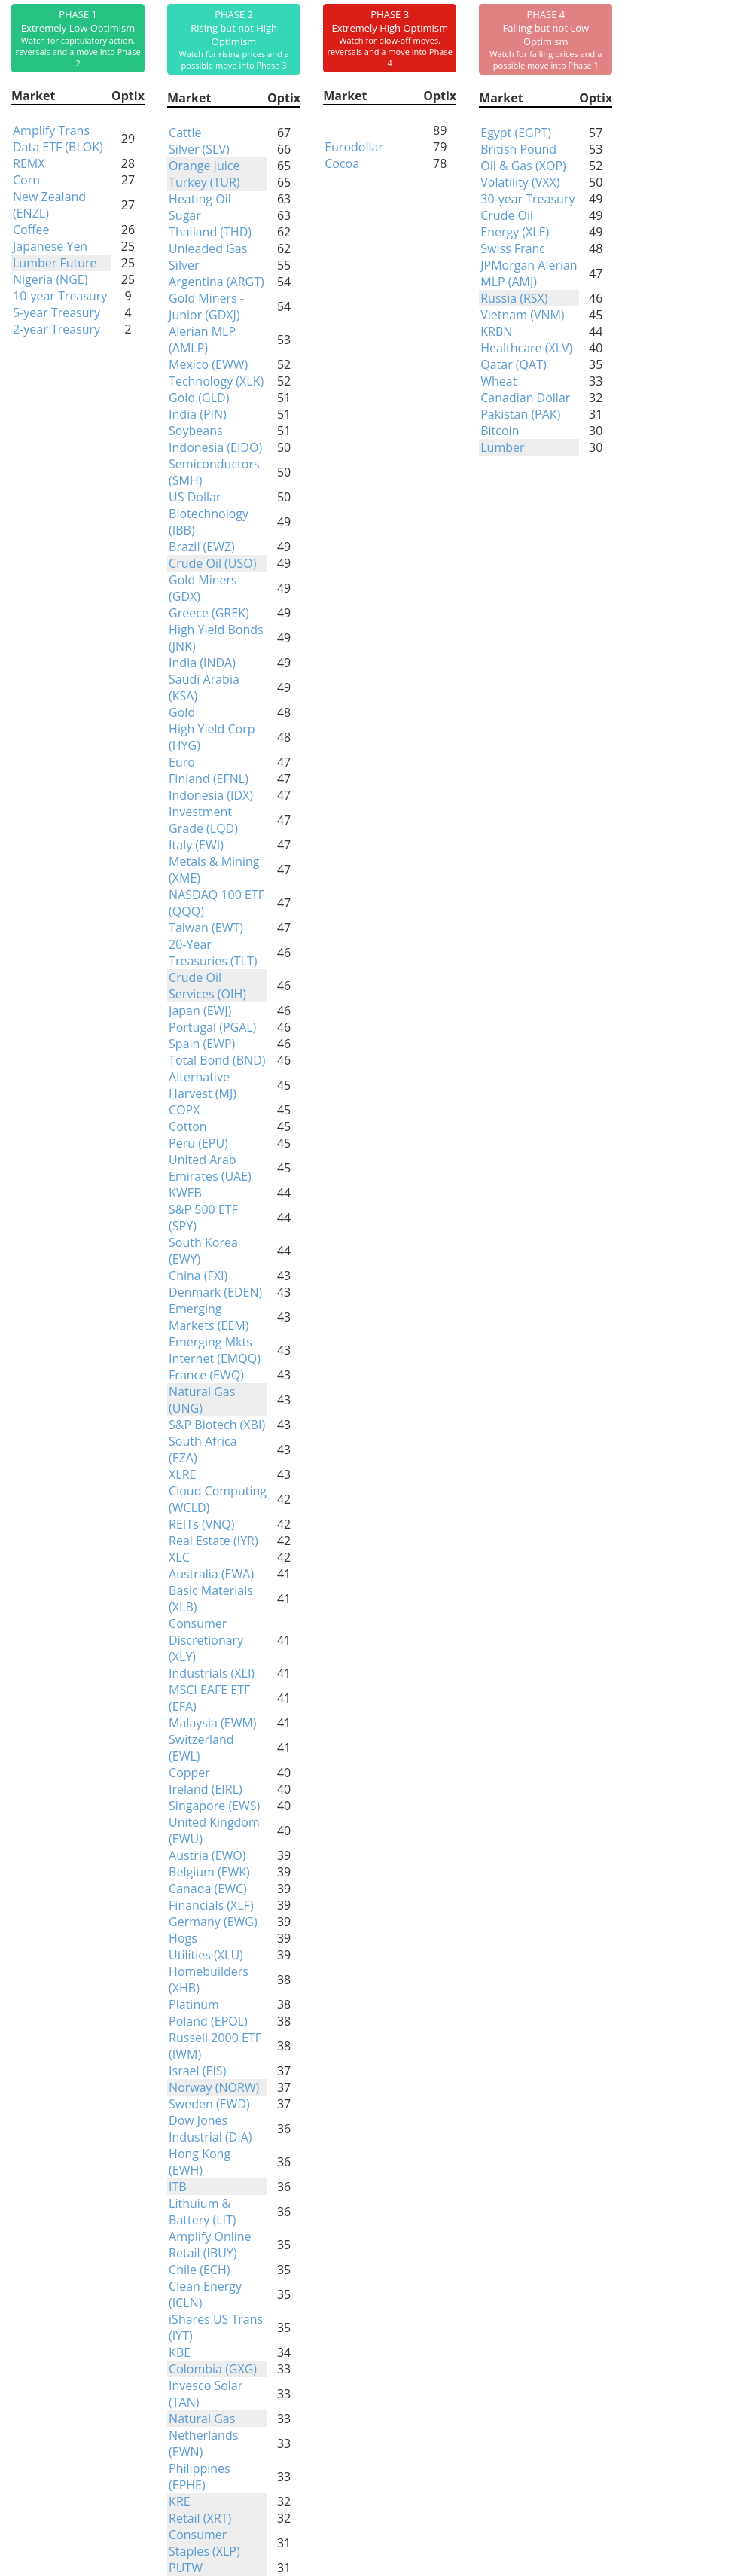
Phase Table
Ranks
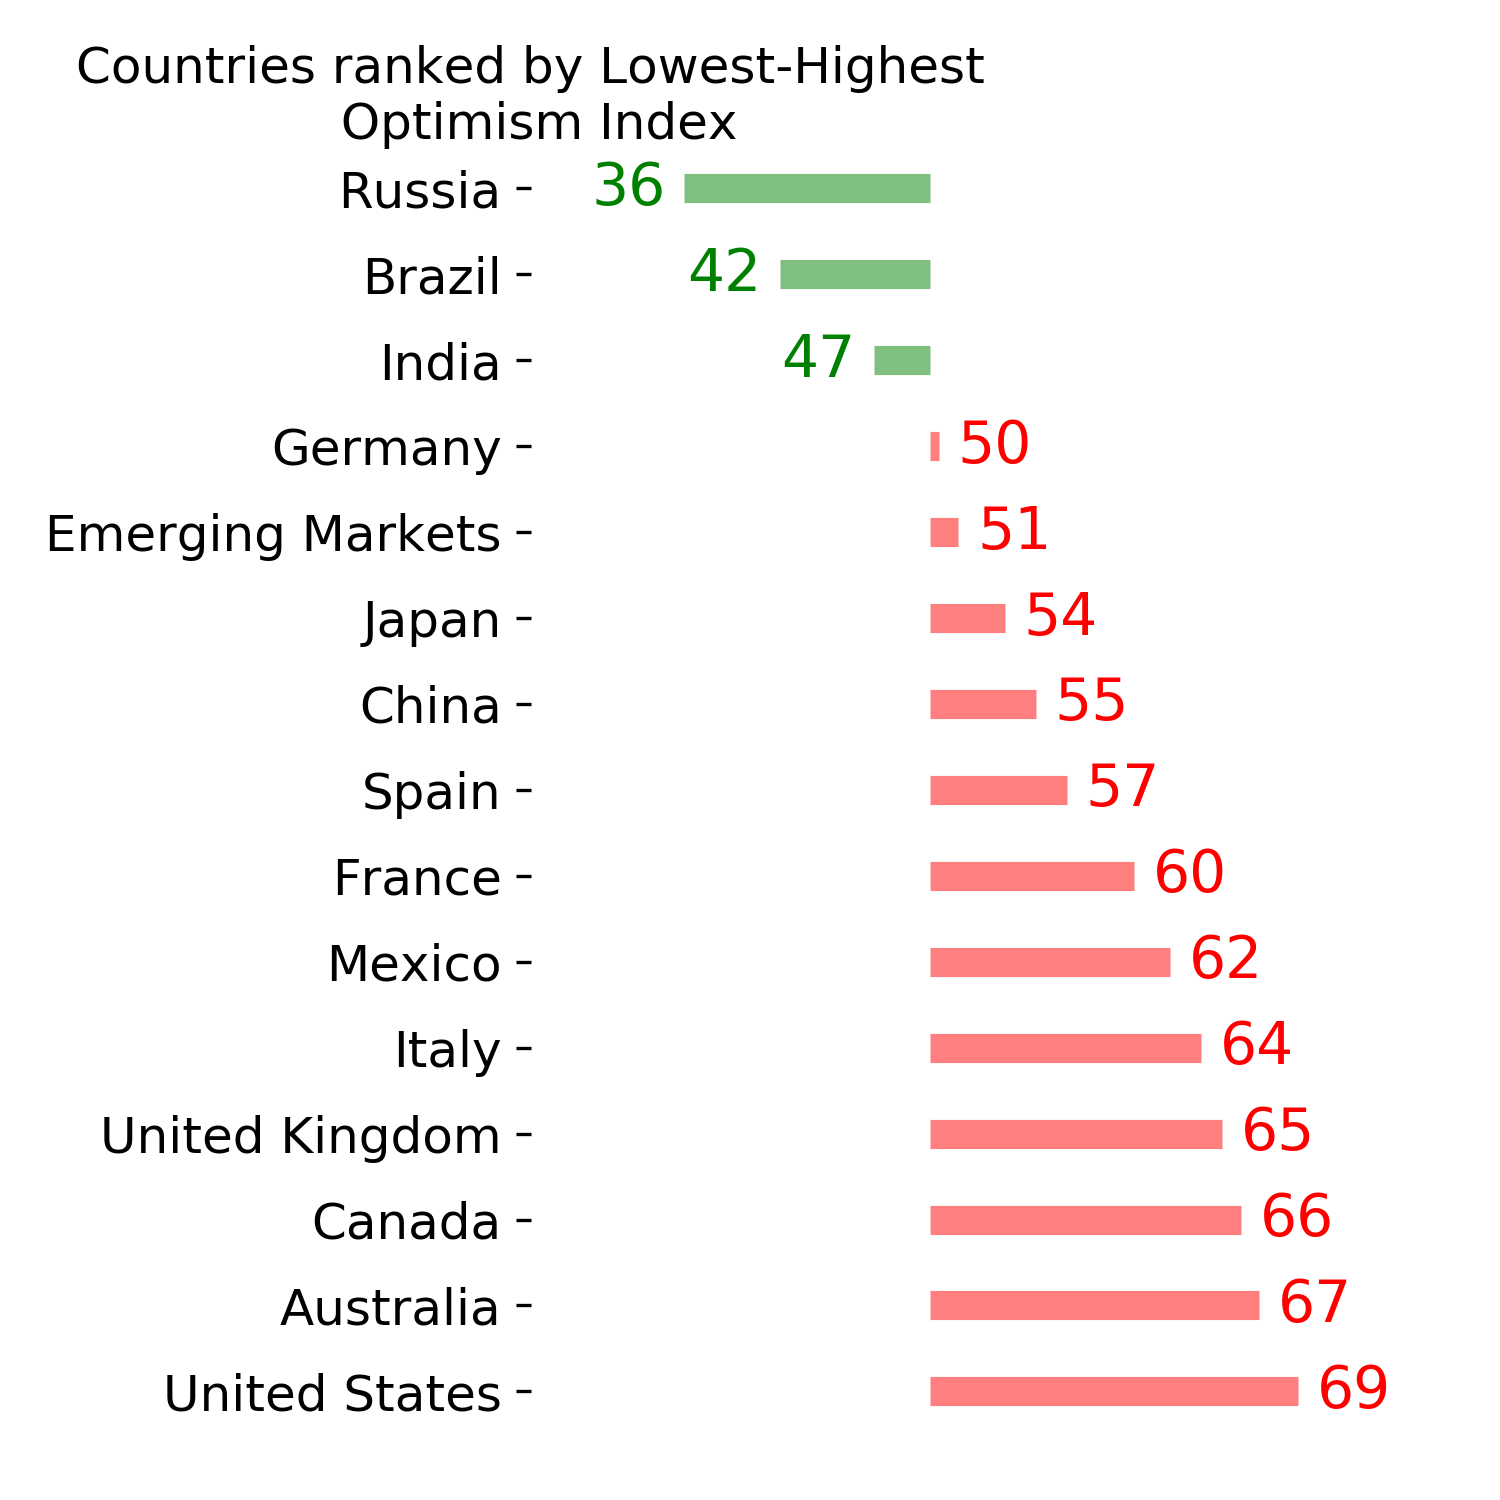
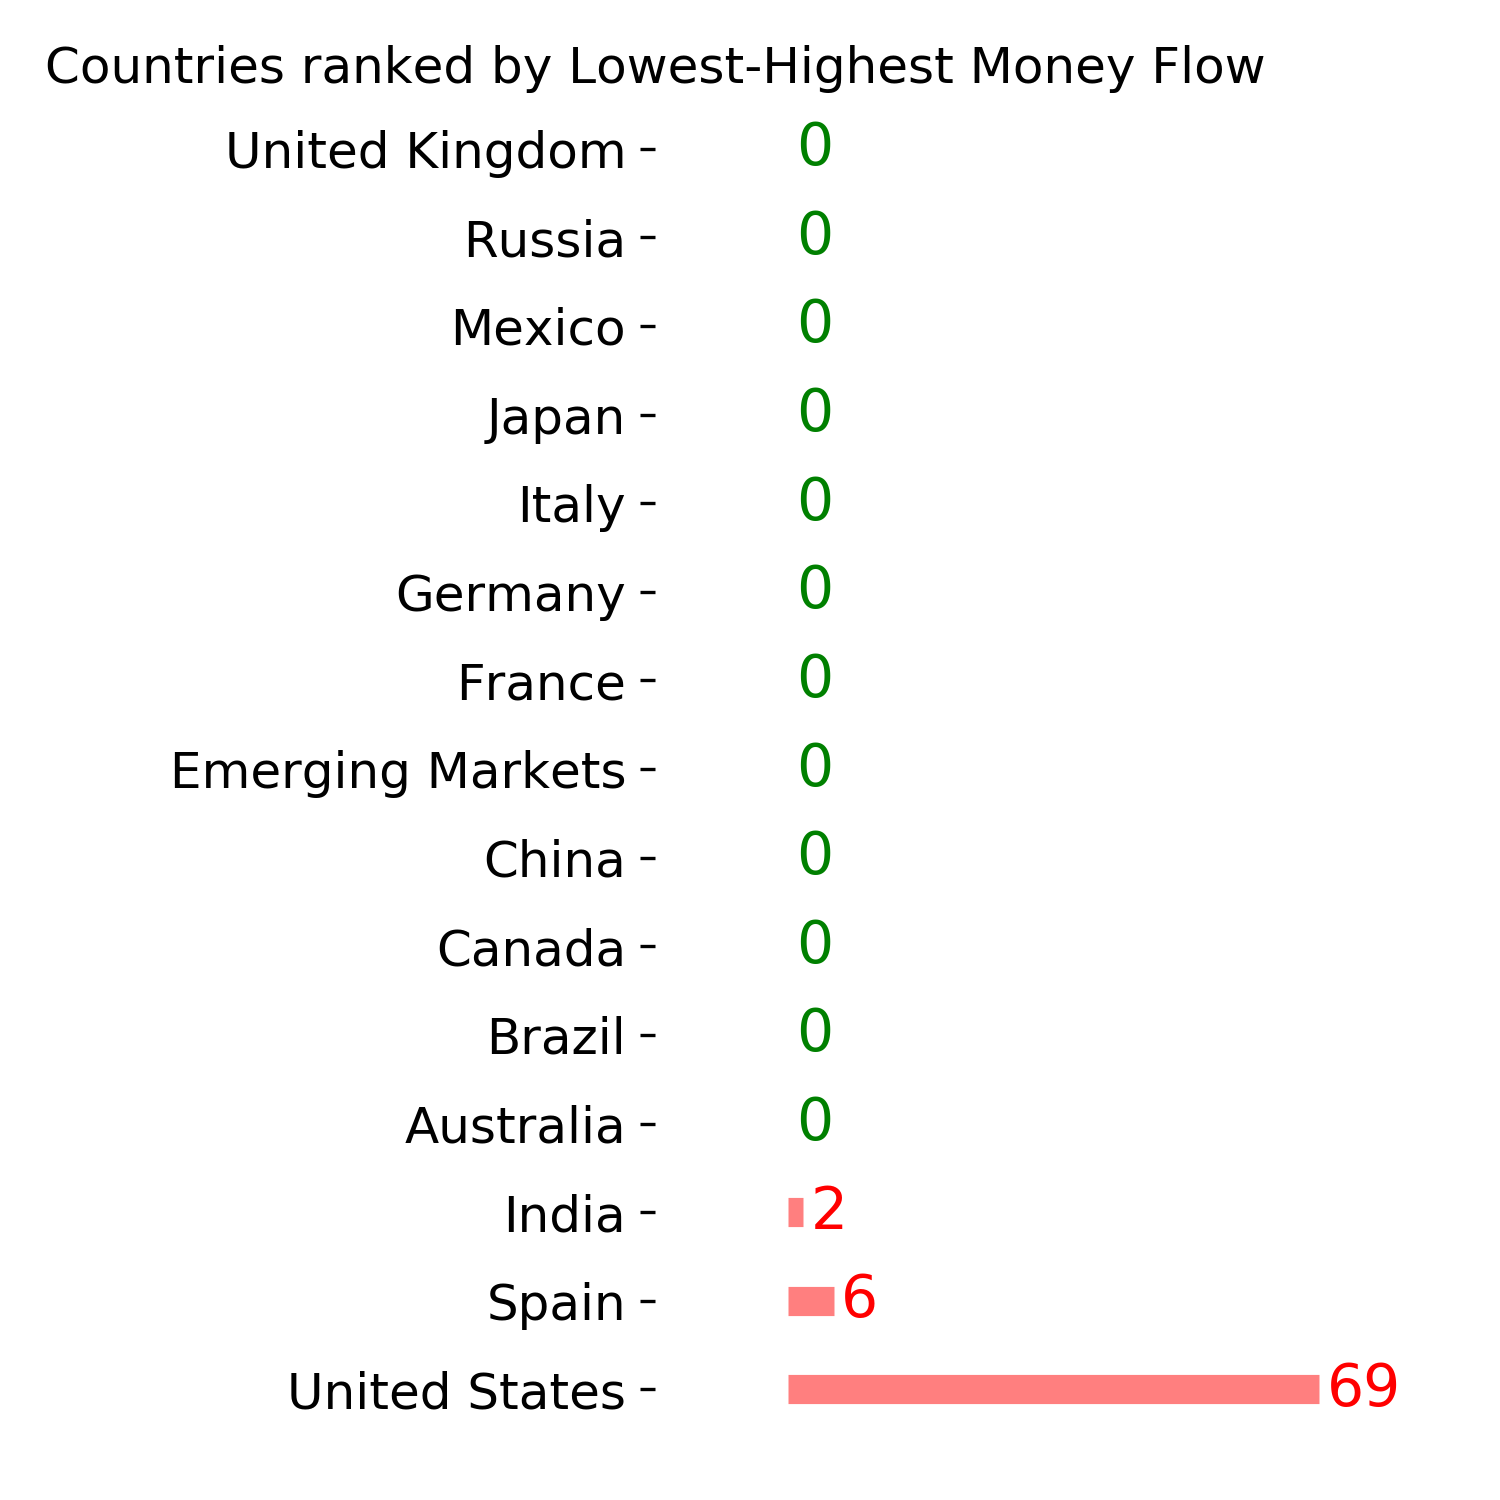
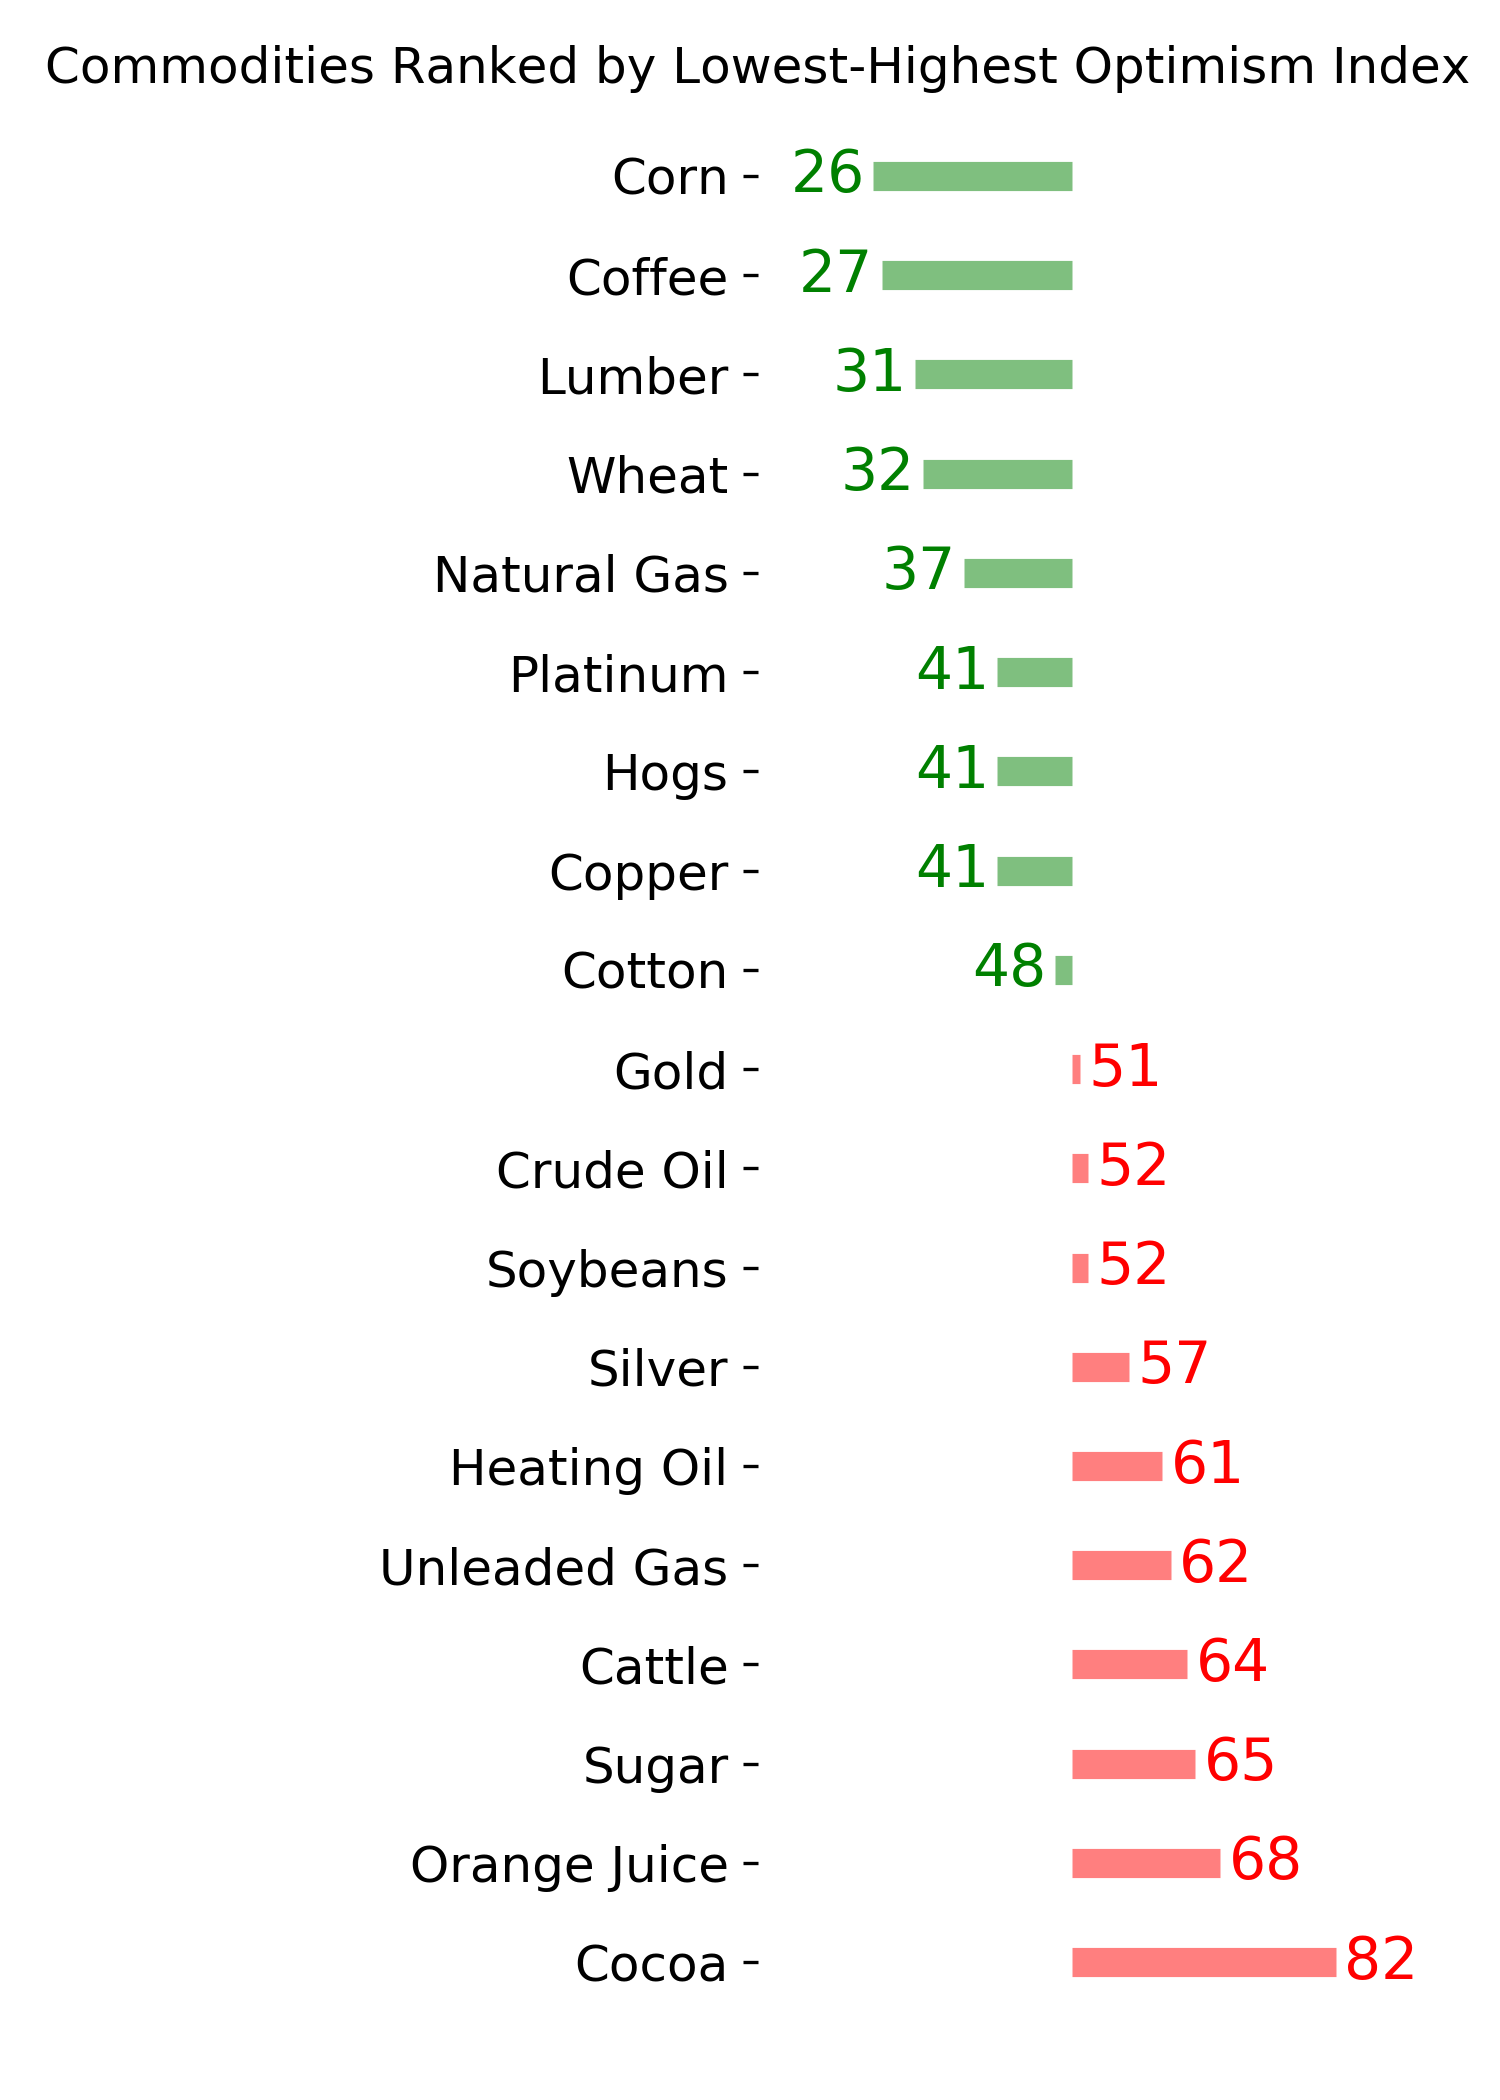
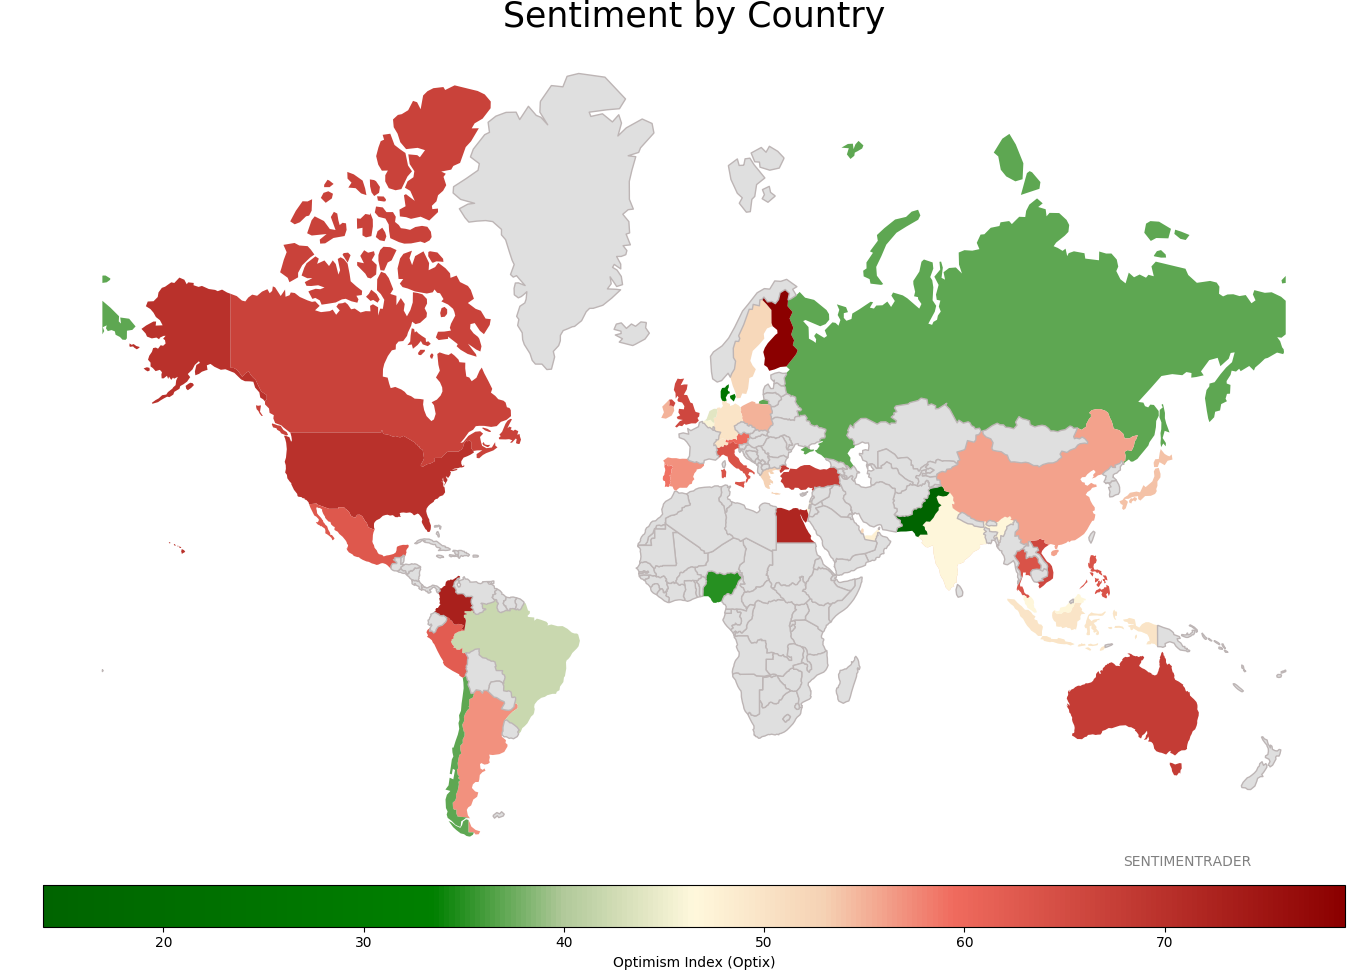
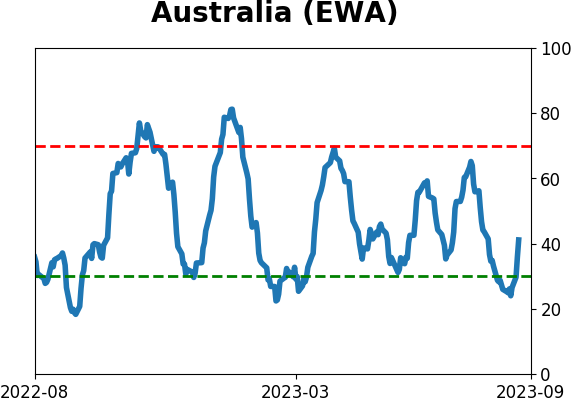
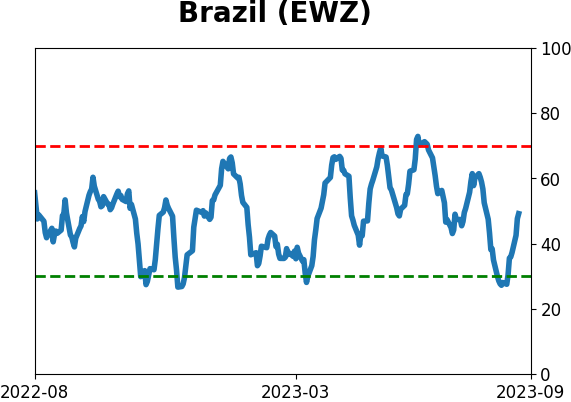
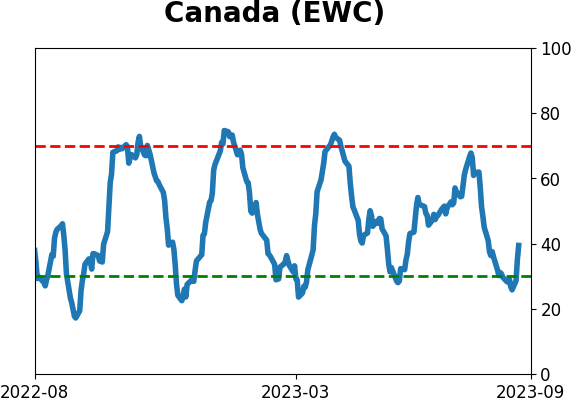
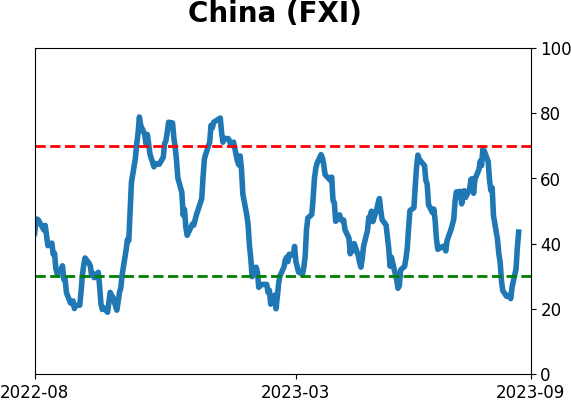
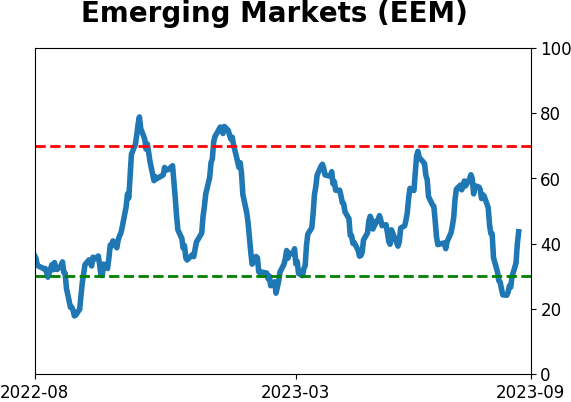
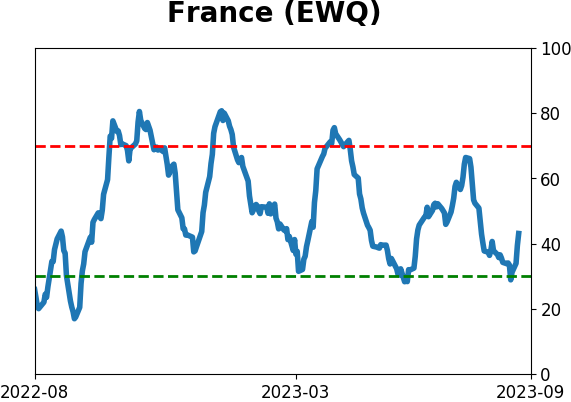
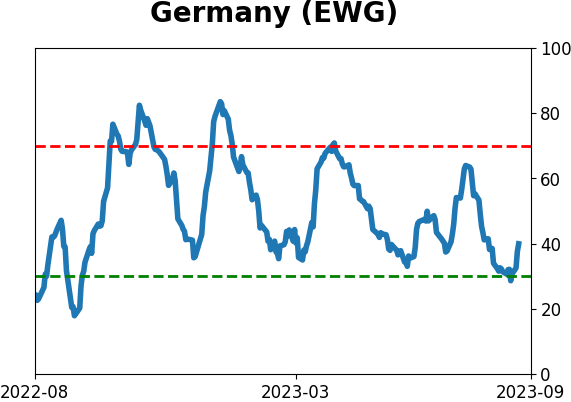
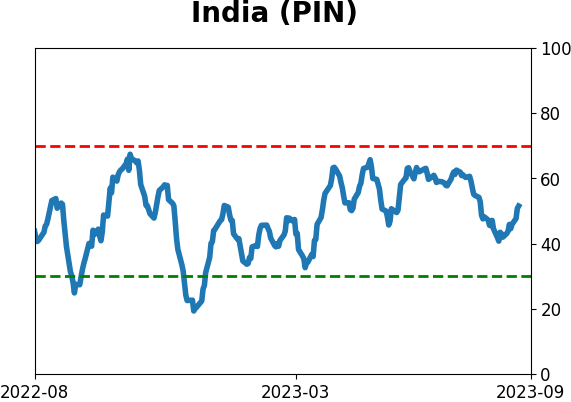
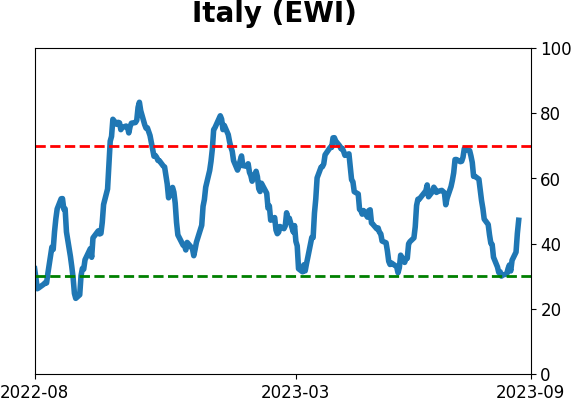
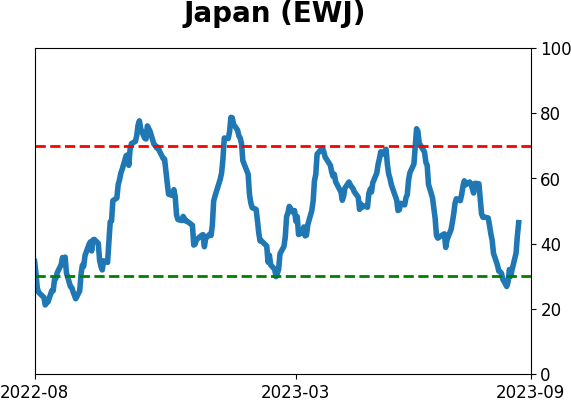
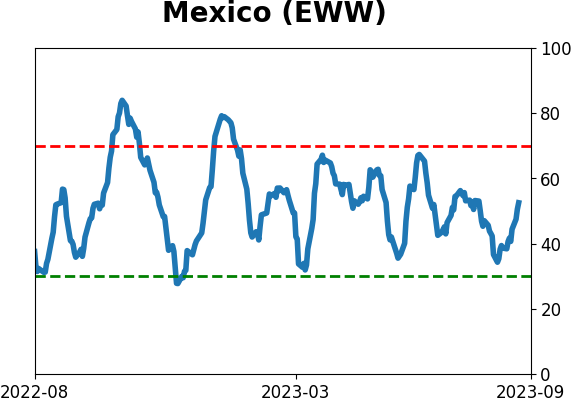
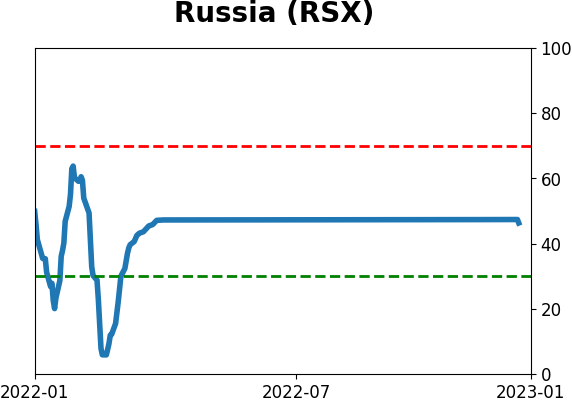
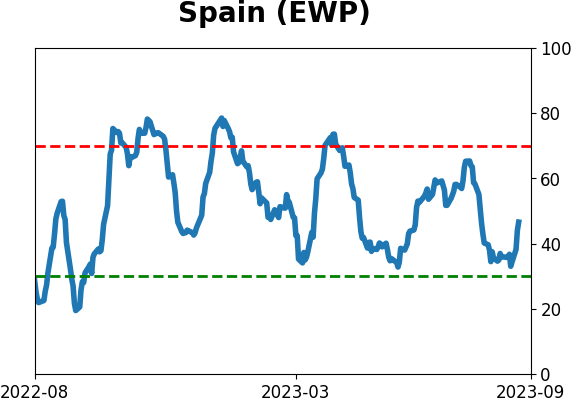
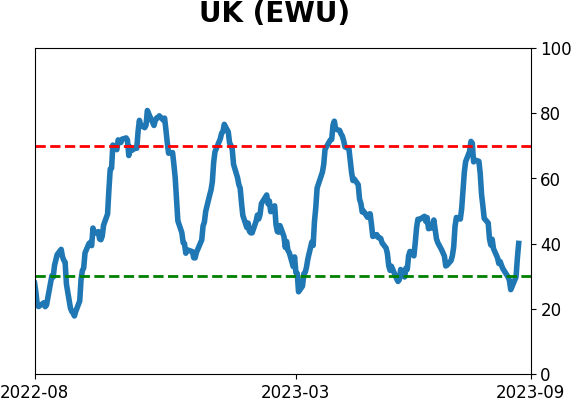
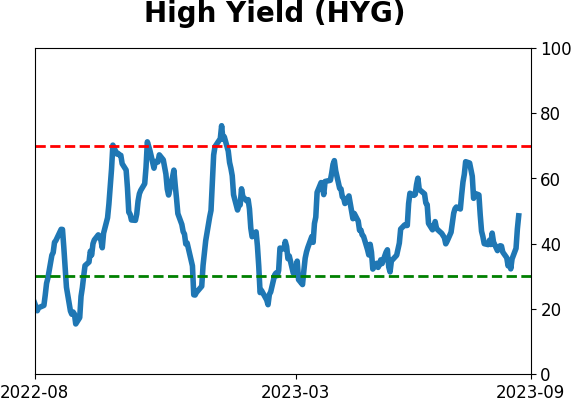
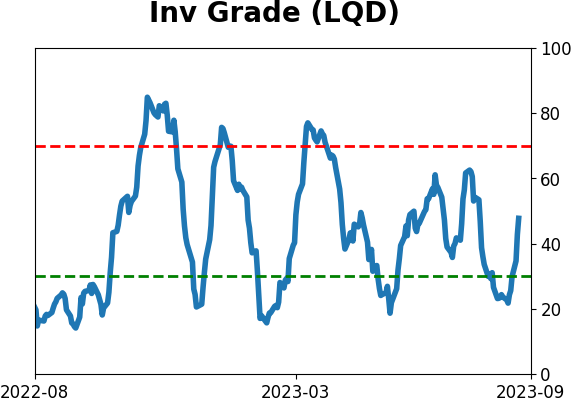
Sentiment Around The World
Optimism Index Thumbnails
|
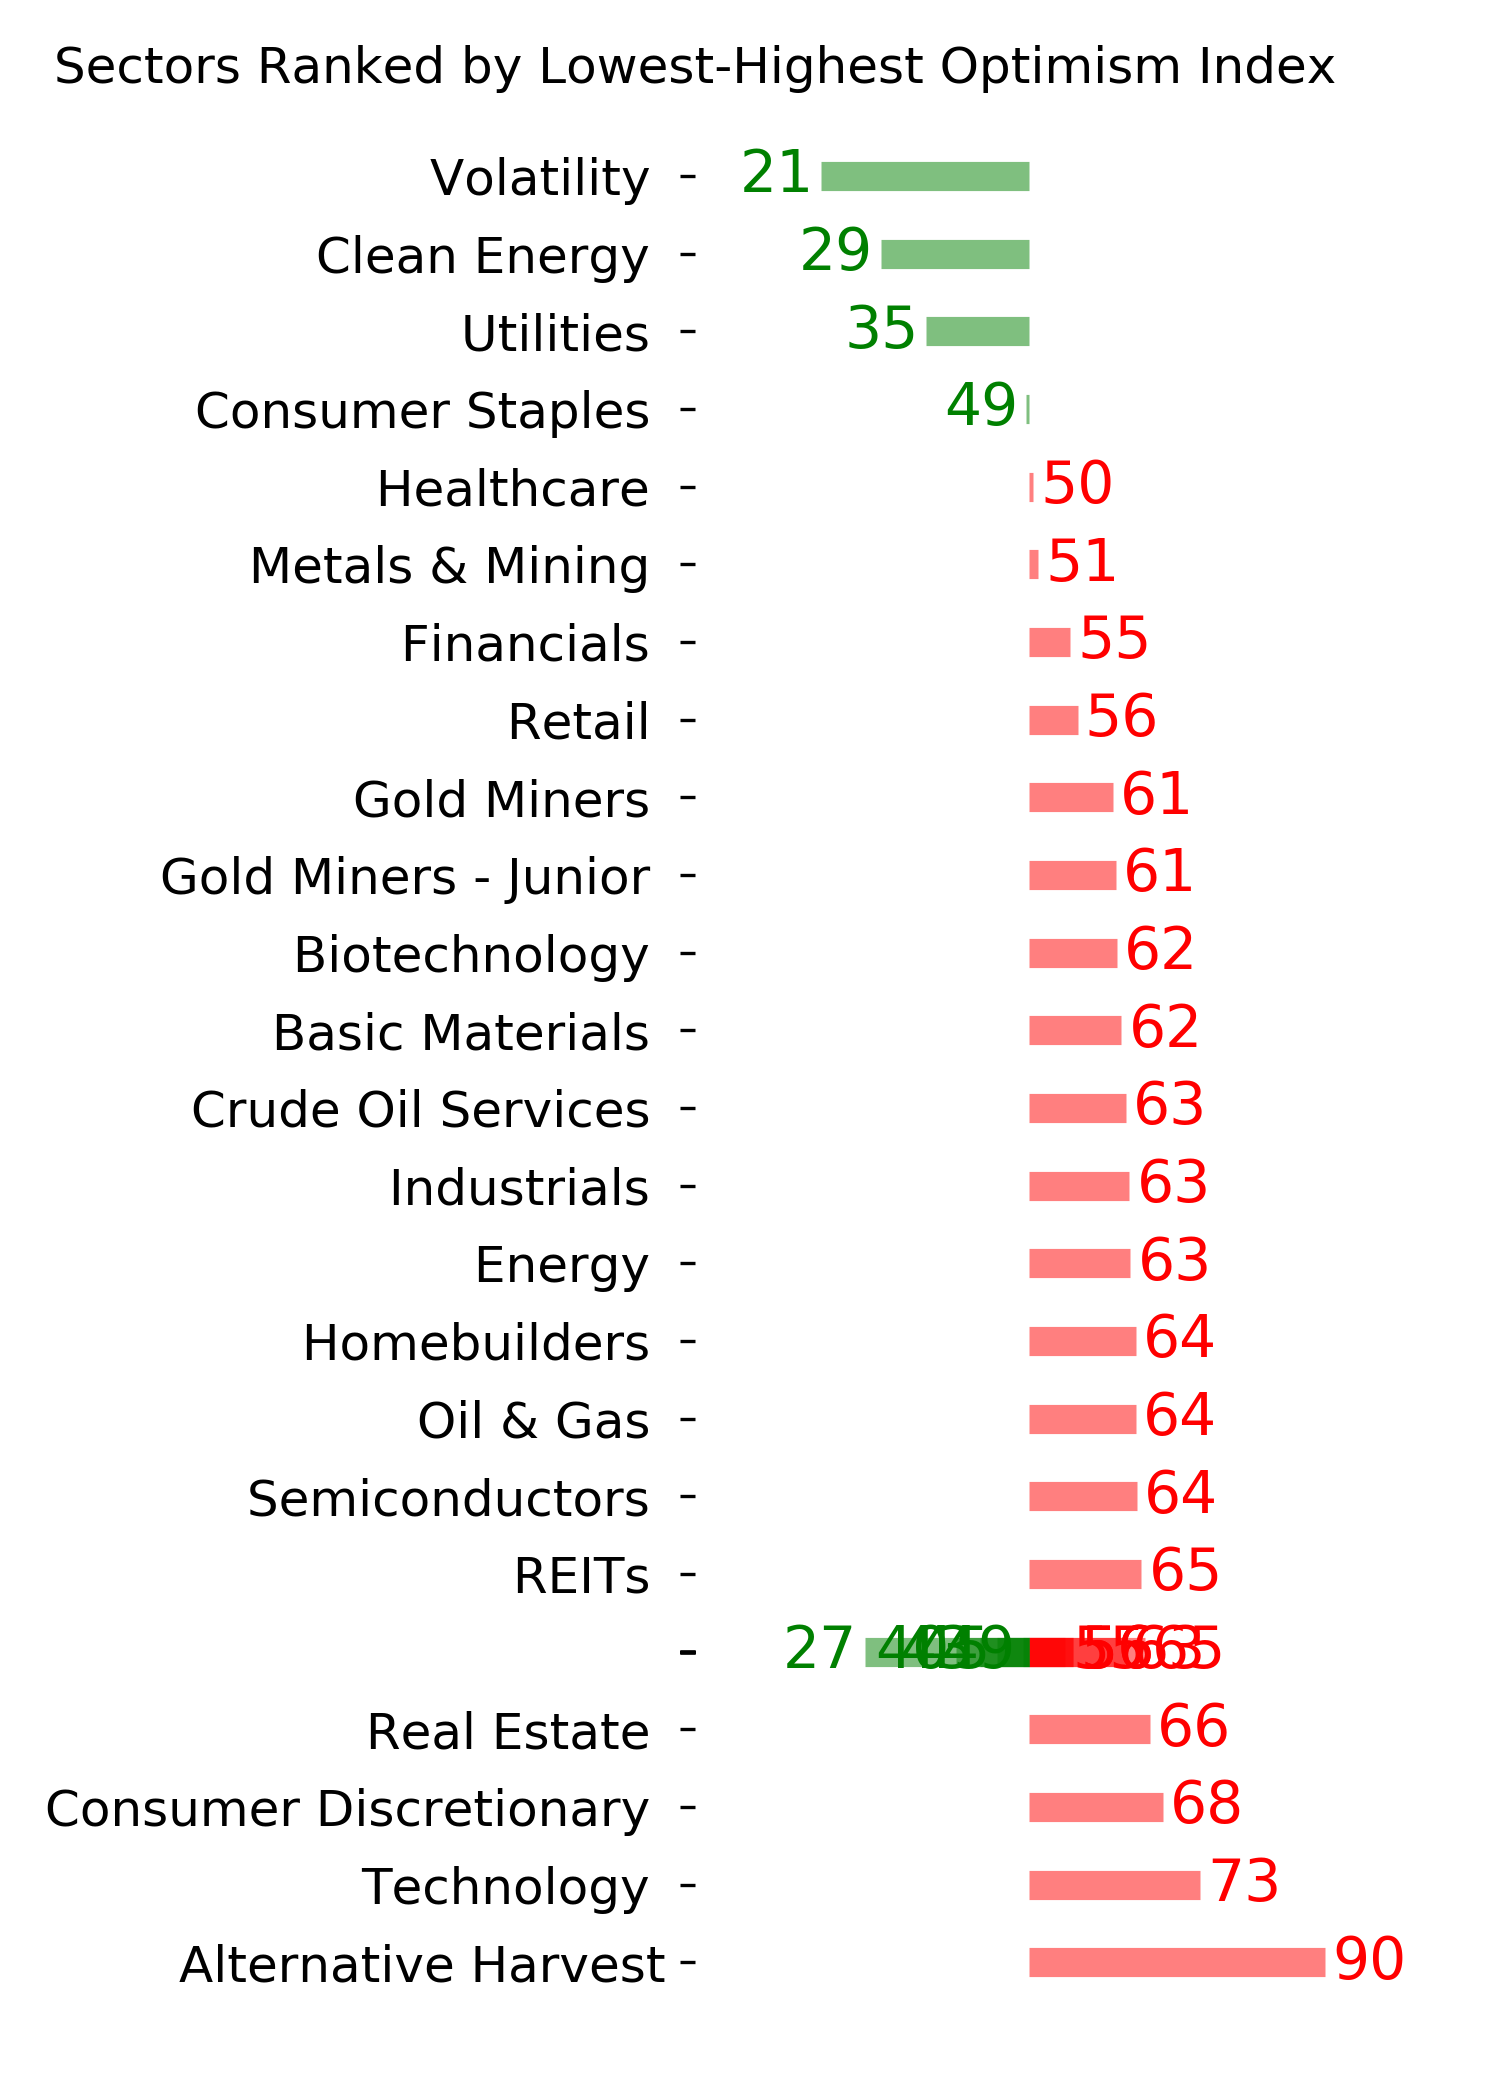
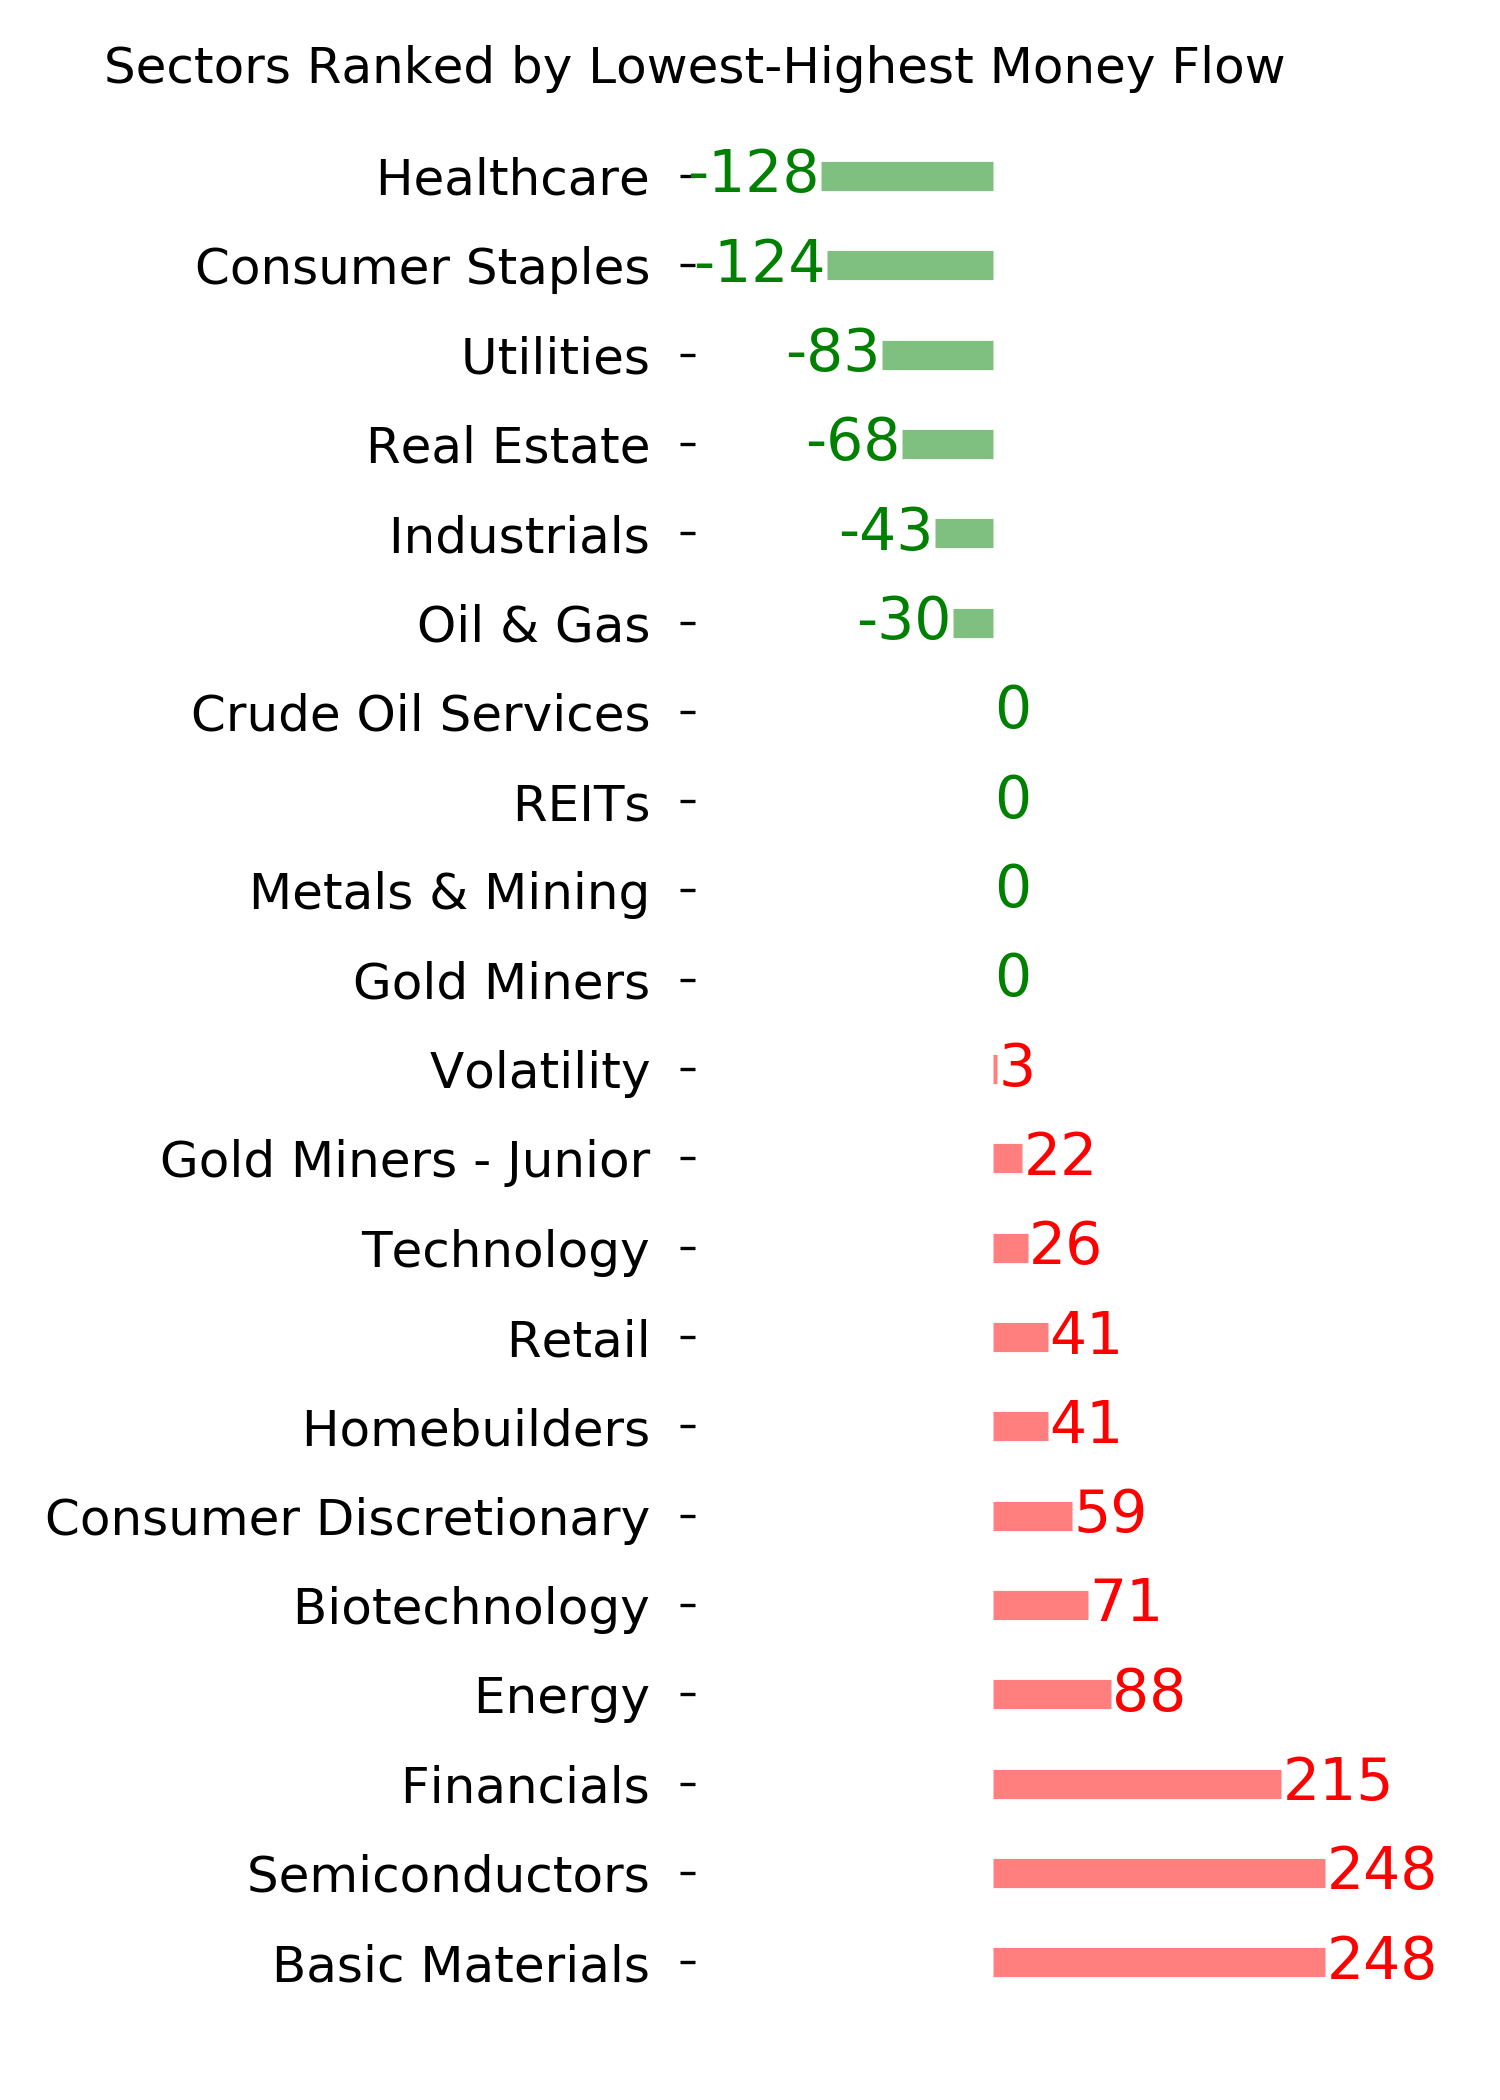
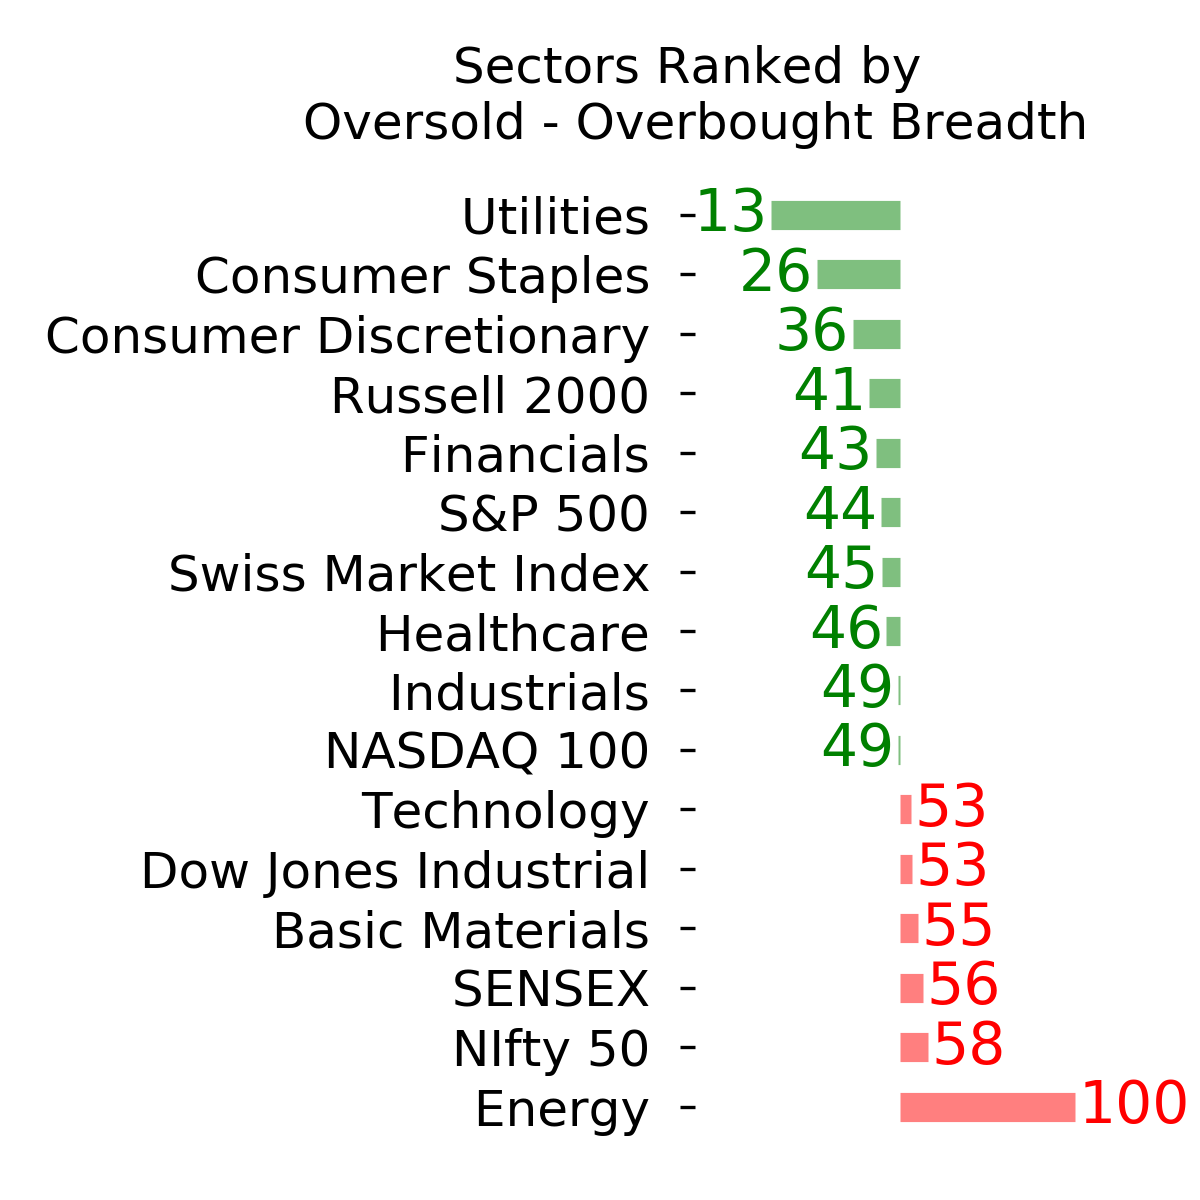
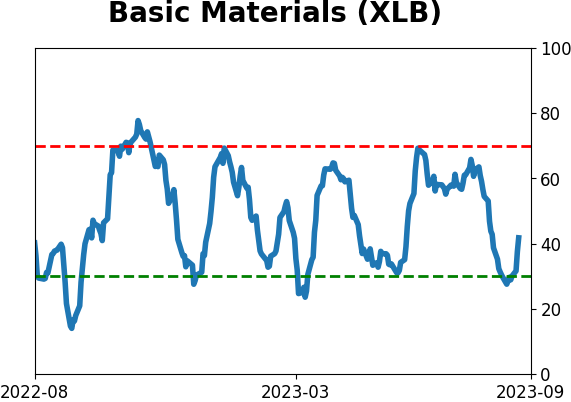
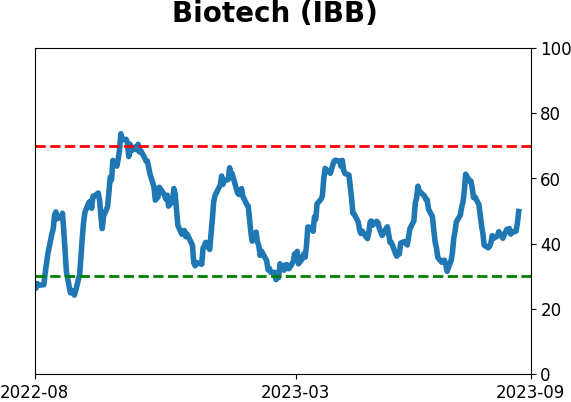
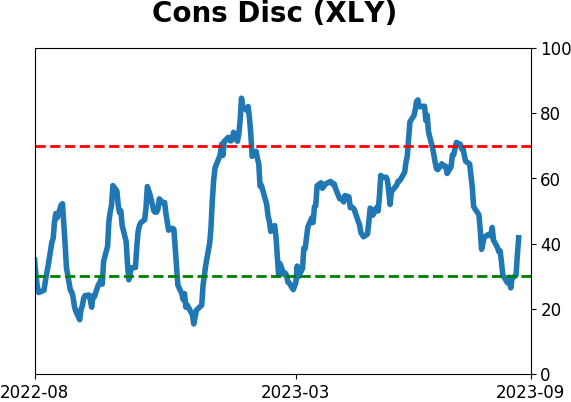
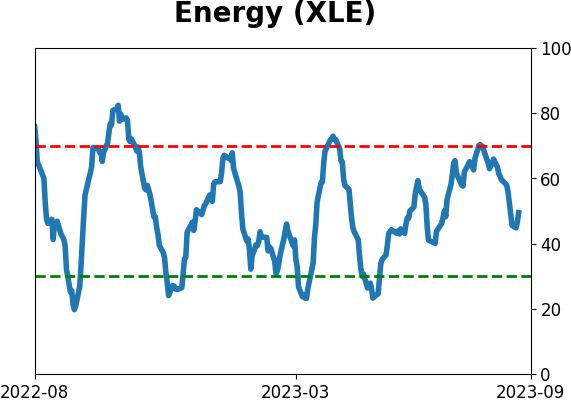
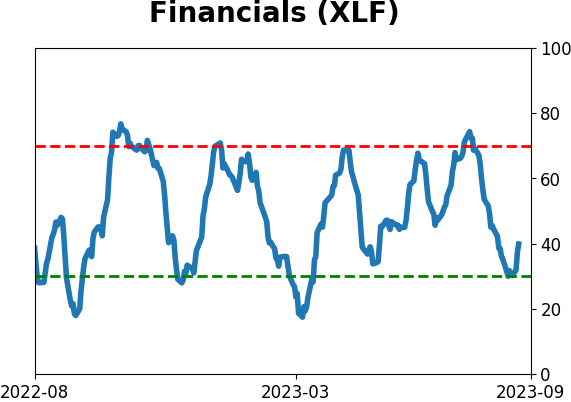
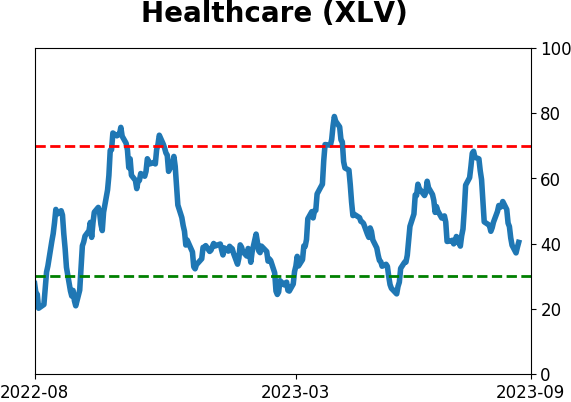
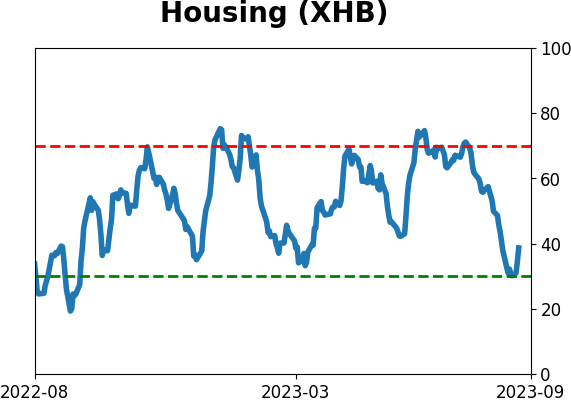
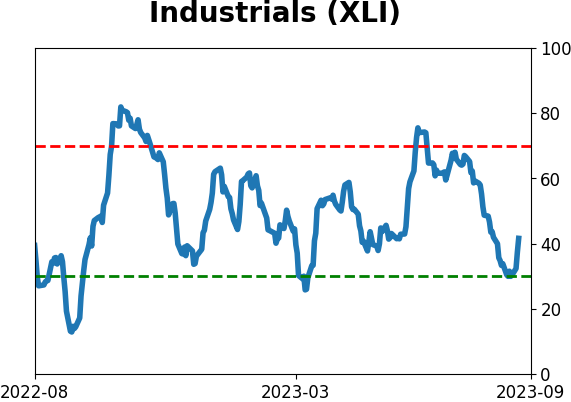
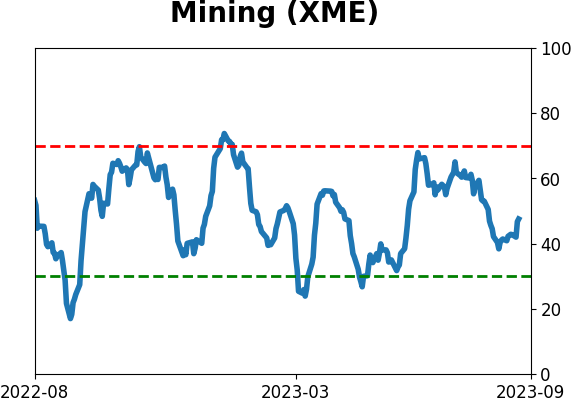
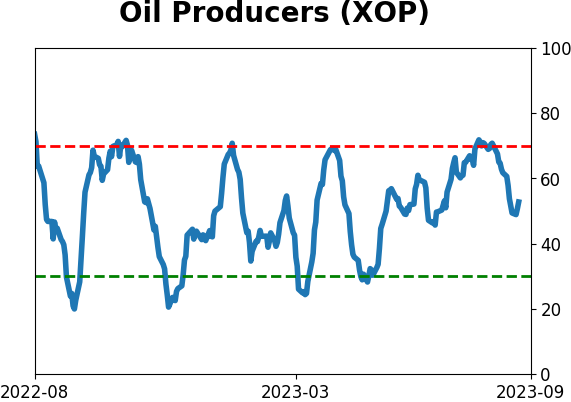
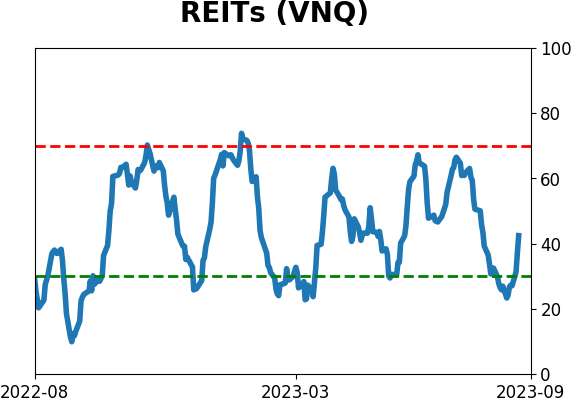
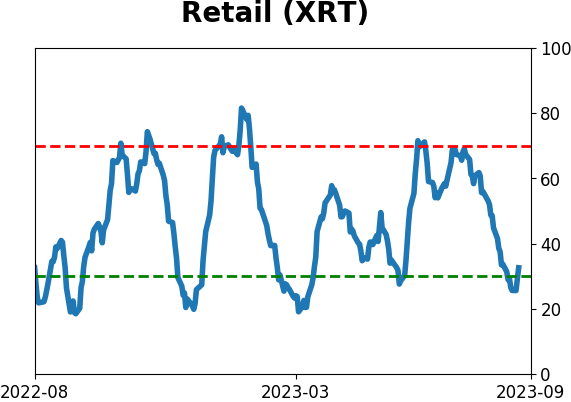
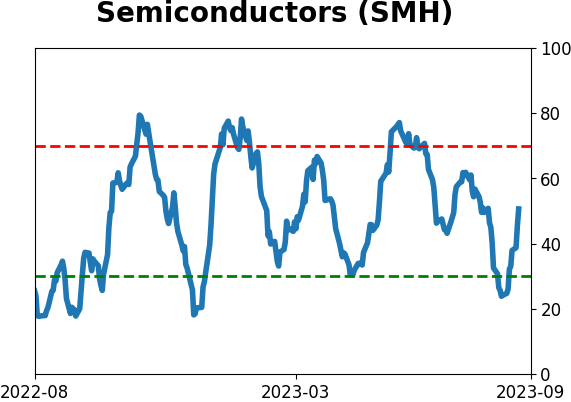
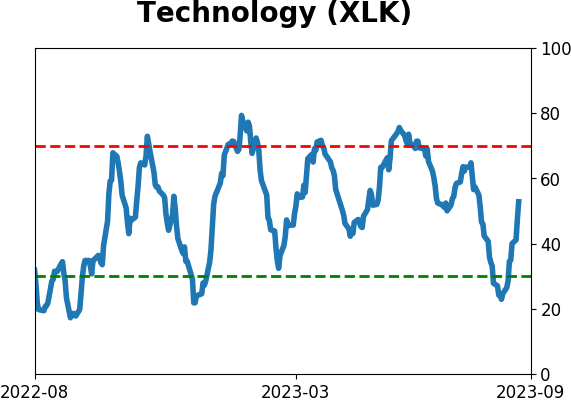
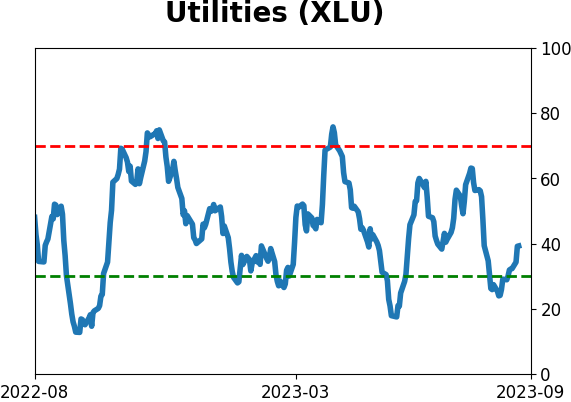
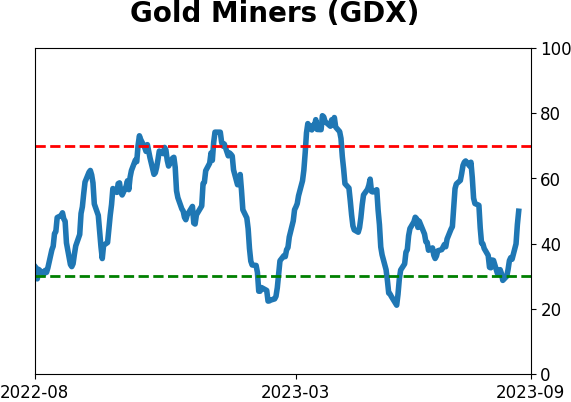
Sector ETF's - 10-Day Moving Average
|
|
|
Country ETF's - 10-Day Moving Average
|
|
|
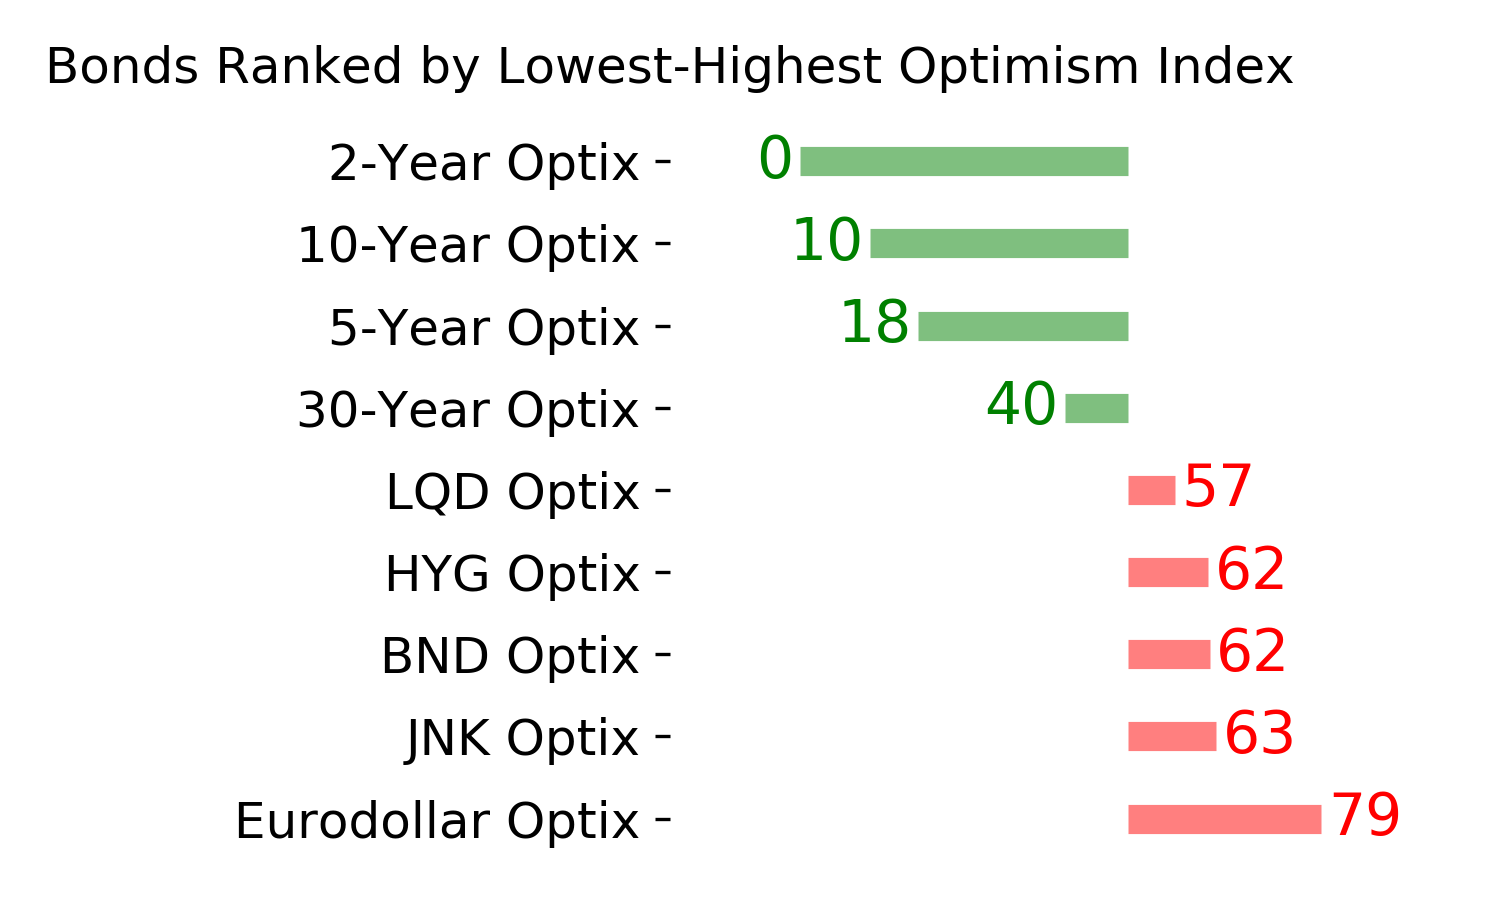
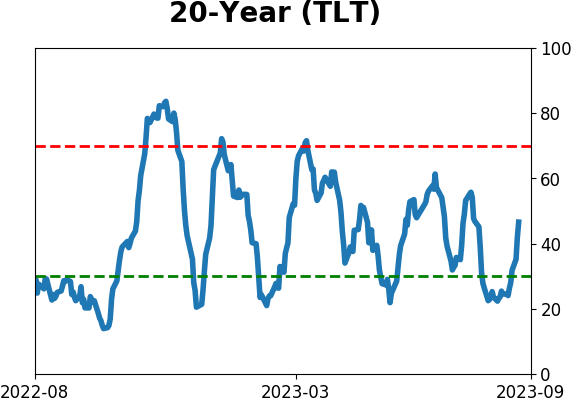
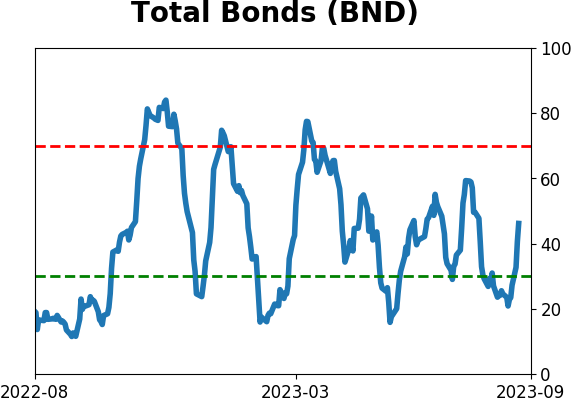
Bond ETF's - 10-Day Moving Average
|
|
|
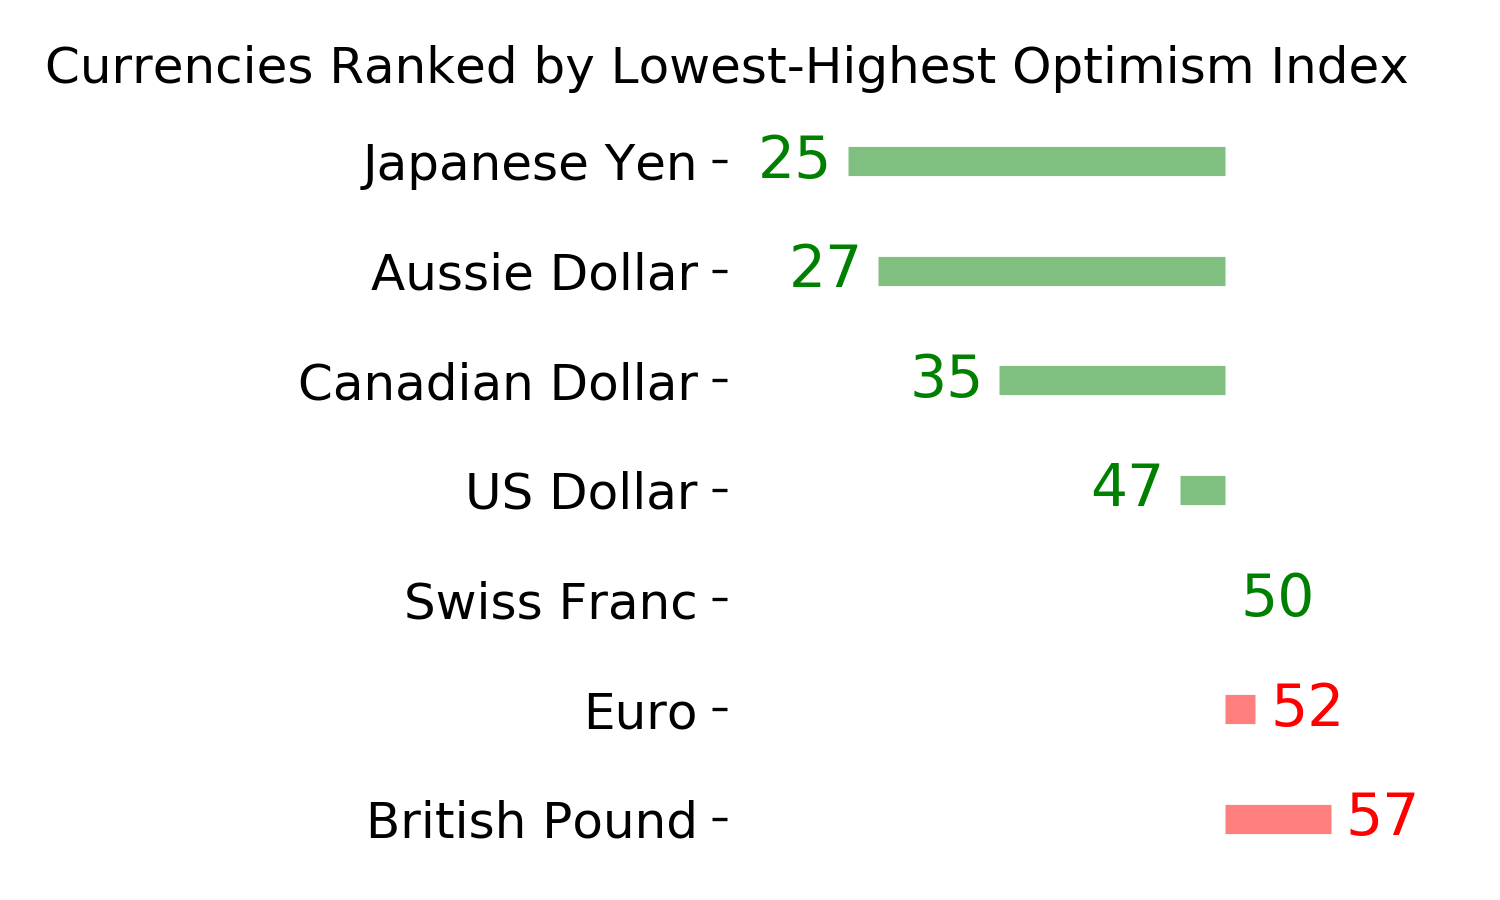
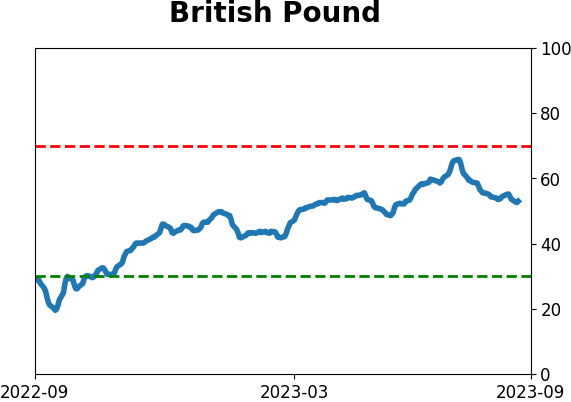
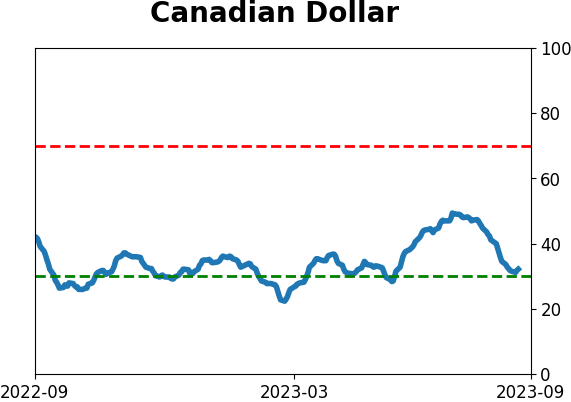
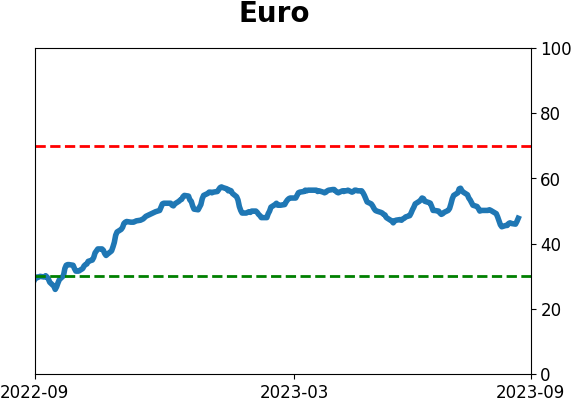
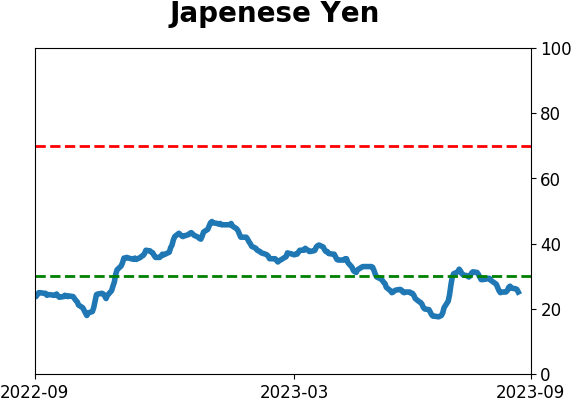
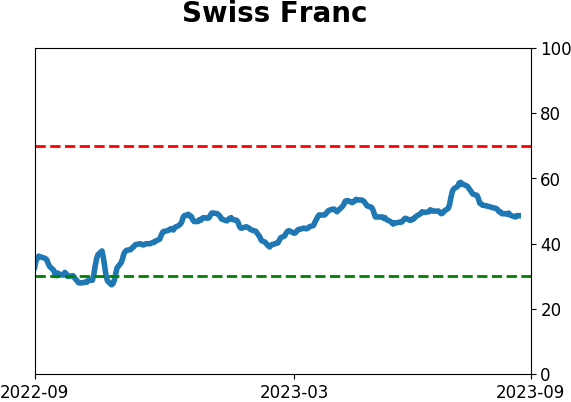
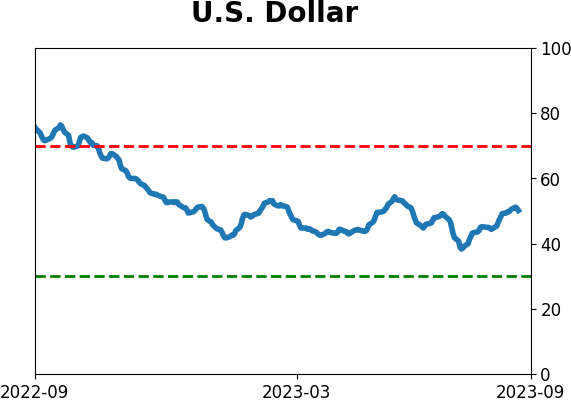
Currency ETF's - 5-Day Moving Average
|
|
|
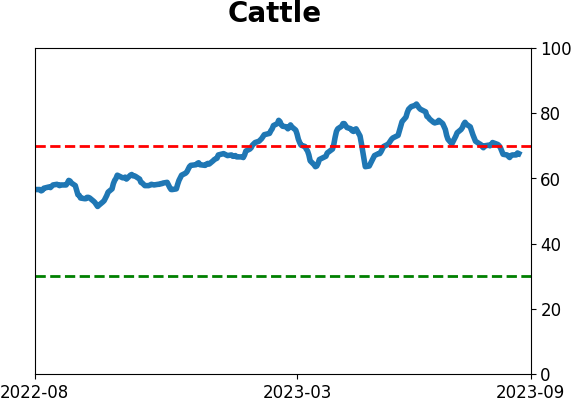
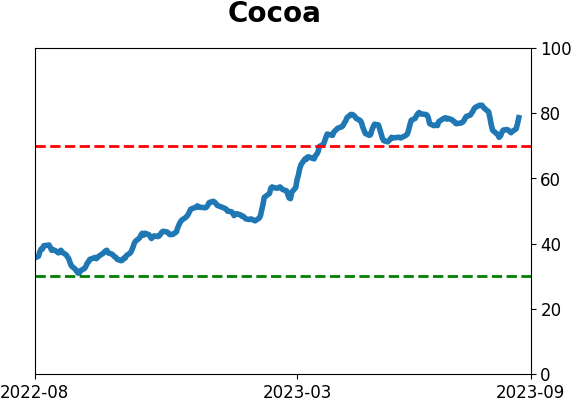
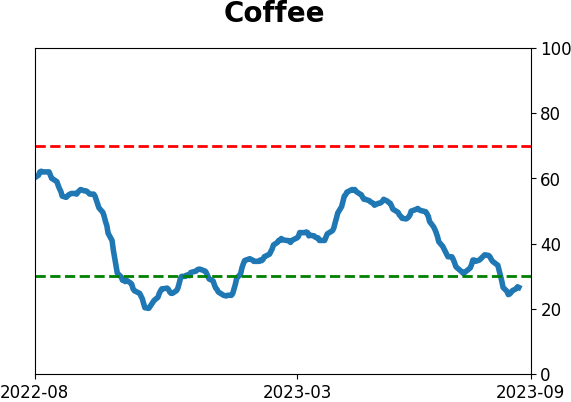
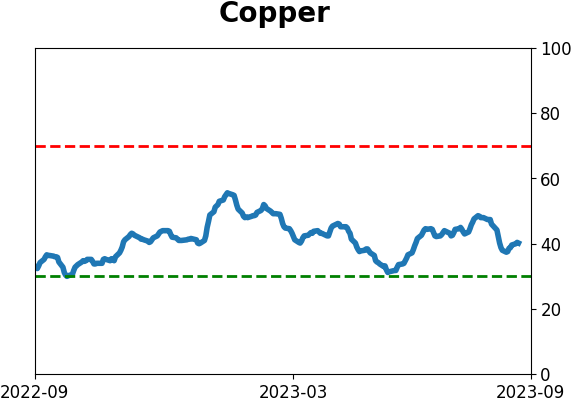
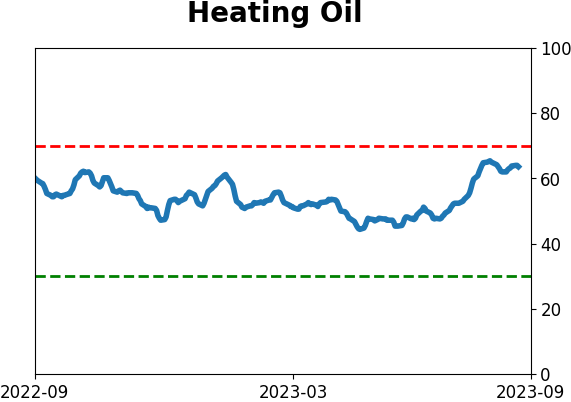
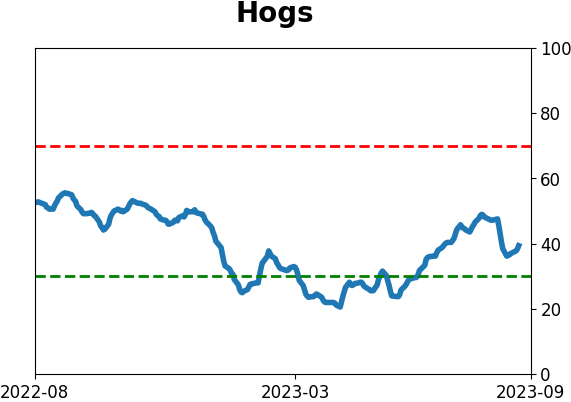
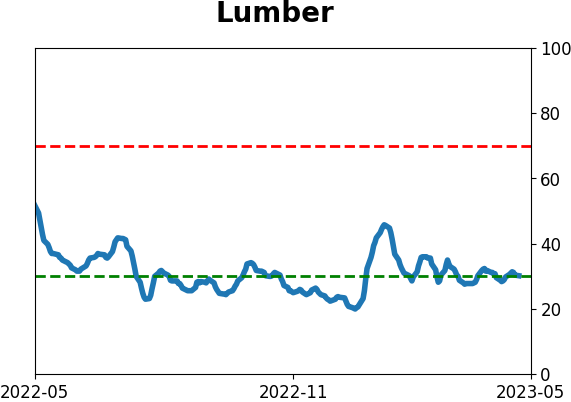
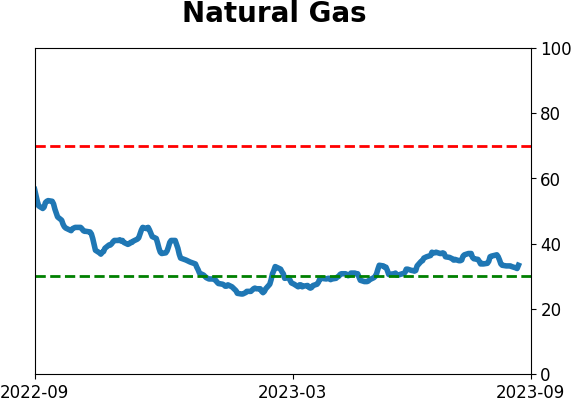
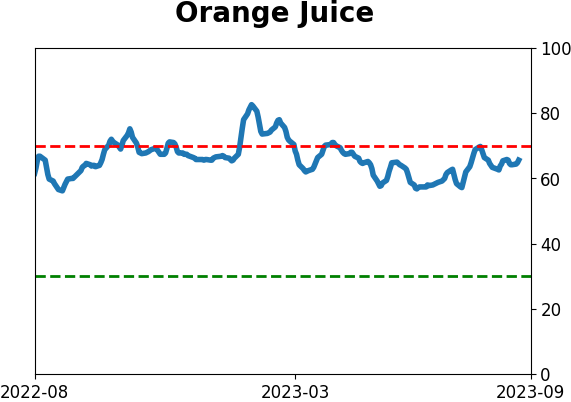
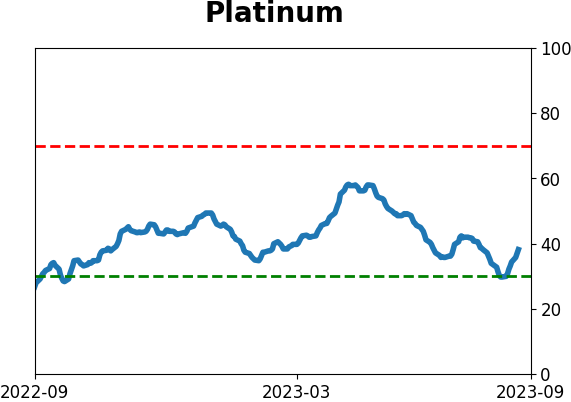
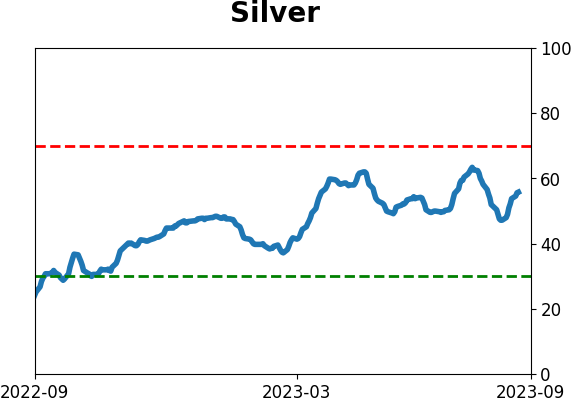
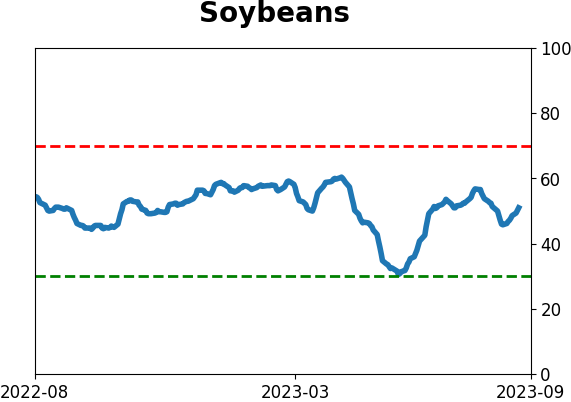
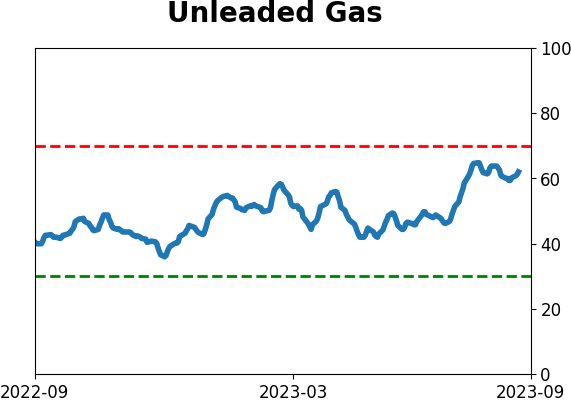
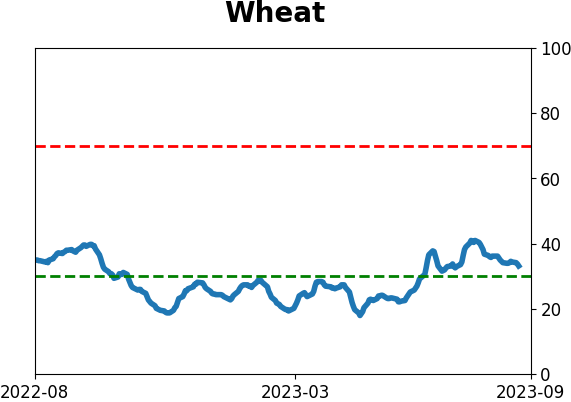
Commodity ETF's - 5-Day Moving Average
|
|