Headlines
|
|
Economic Surprises Turn Negative, Globally:
For the first time in over a year, global economic surprises have turned negative. That has preceded a headwind for stocks, especially in the U.S. when those surprises were lagging the world.
Bottom Line:
STOCKS: Hold
Sentiment continues to decline from the speculative February peak. With deteriorating breadth, this raises the risk of poor short- to medium-term returns until optimism and better breadth returns. See the Outlook & Allocations page for more. BONDS: Hold
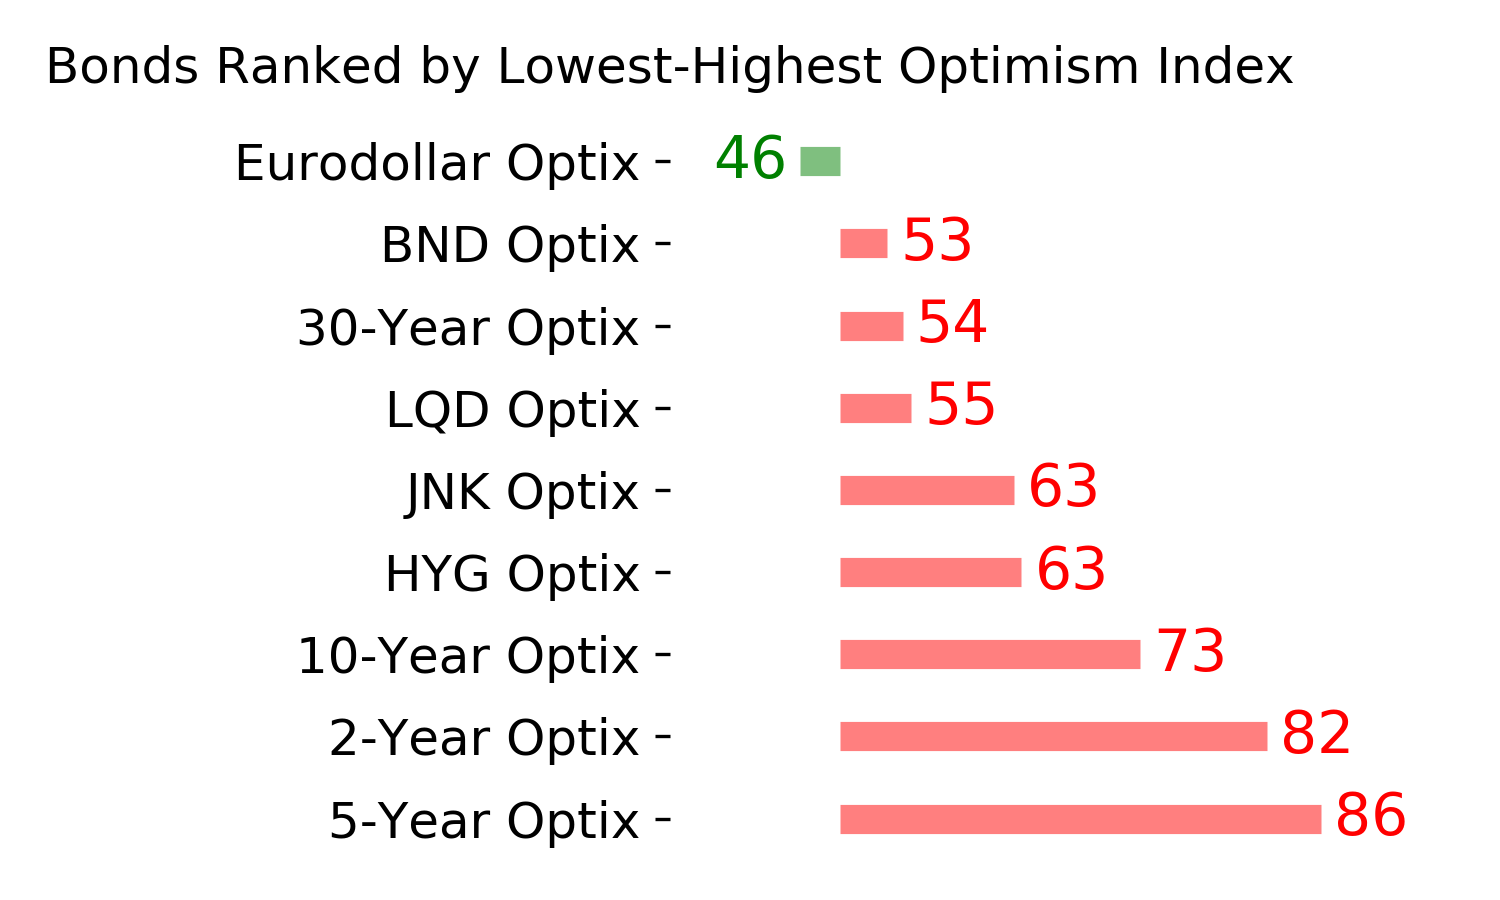
Various parts of the market got hit in March, with the lowest Bond Optimism Index we usually see during healthy environments. Bond prices have modest recovered and there is no edge among the data we follow. GOLD: Hold
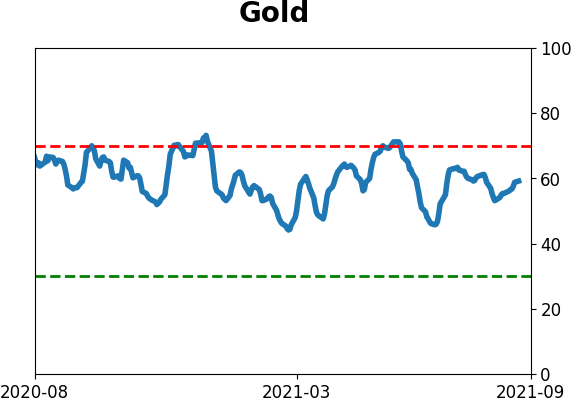
Gold and miners were rejected after trying to recover above their 200-day averages in May. Lately, some medium-term (not long-term) oversold extremes in breadth measures among miners have triggered.
|
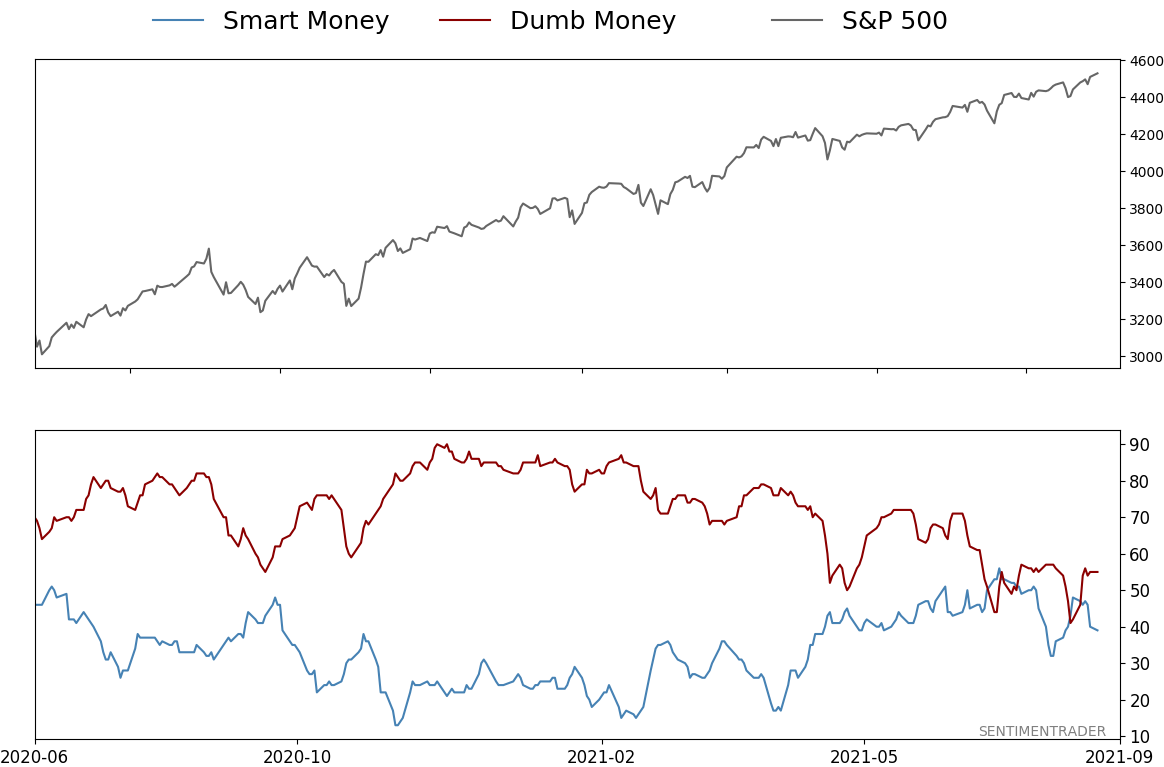
Smart / Dumb Money Confidence
|
Smart Money Confidence: 39%
Dumb Money Confidence: 55%
|
|
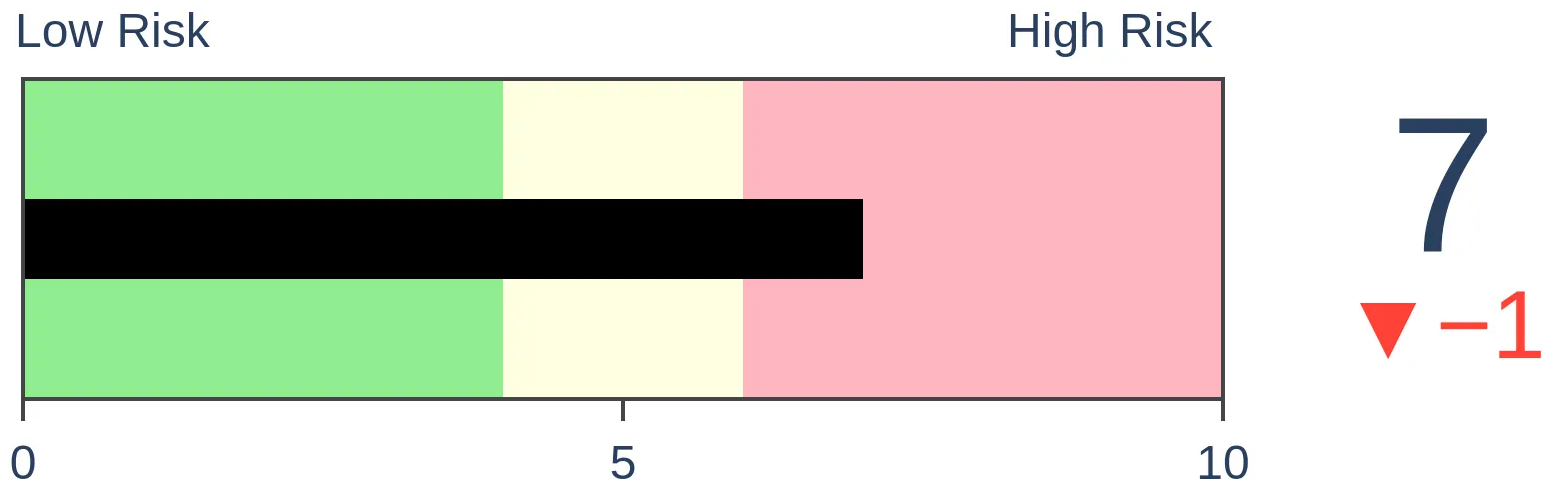
Risk Levels
Stocks Short-Term
|
Stocks Medium-Term
|
|
Bonds

|
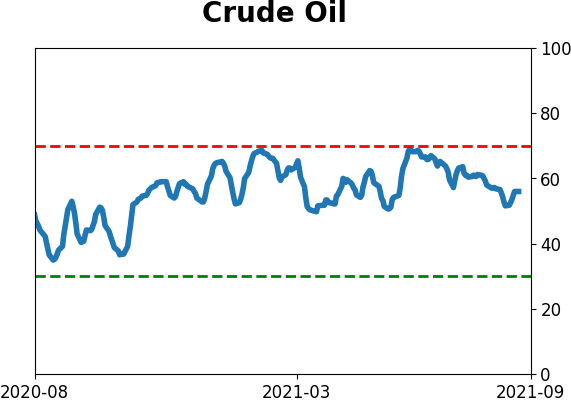
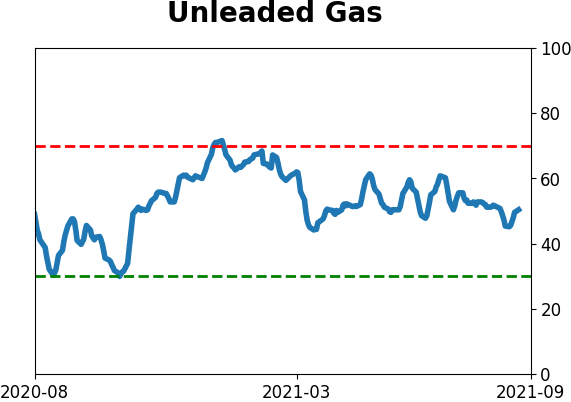
Crude Oil

|
|
Gold
|
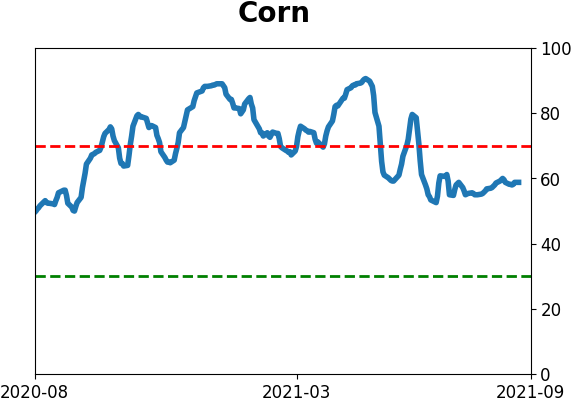
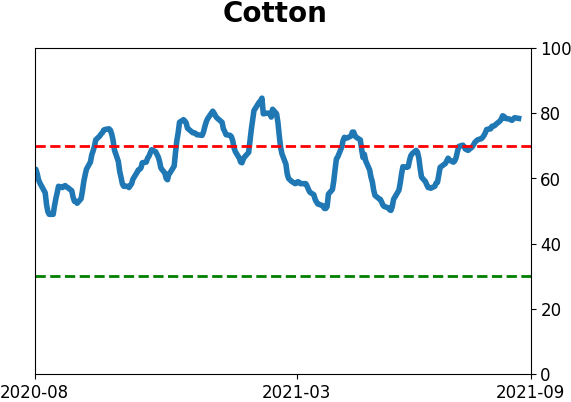
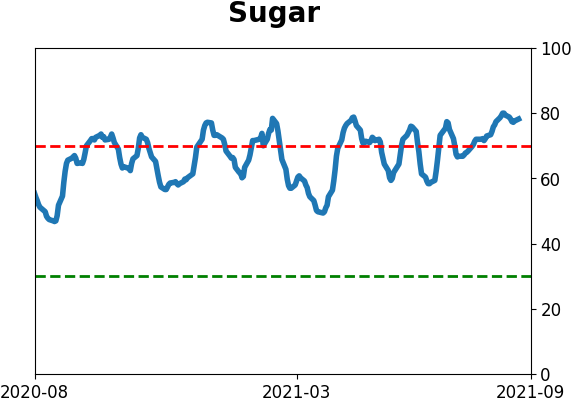
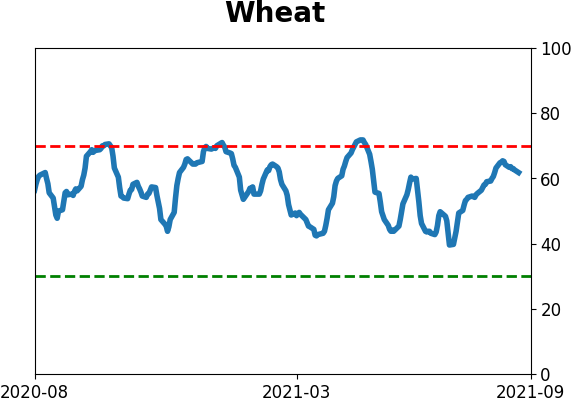
Agriculture
|
|
Research
By Jason Goepfert
BOTTOM LINE
For the first time in over a year, global economic surprises have turned negative. That has preceded a headwind for stocks, especially in the U.S. when those surprises were lagging the world.
FORECAST / TIMEFRAME
None
|
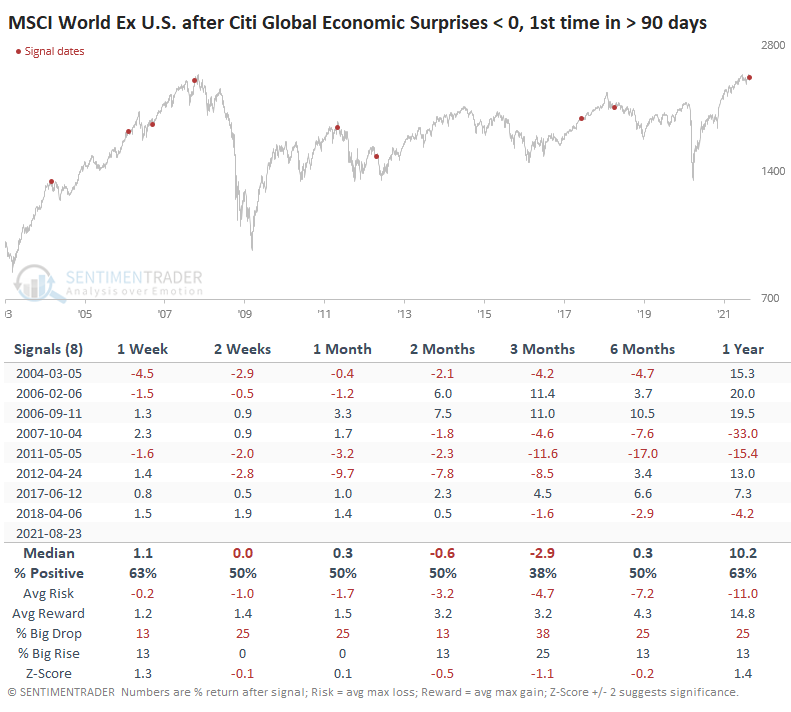
In May, economic surprises in the U.S. turned negative for the first time in almost a year. They rebounded briefly, then surprises turned even more negative as economists didn't lower their forecasts enough.
Worldwide, however, economic reports had still been coming in better than economists' forecasts...until last week. For the first time in over a year, Citi's Global Economic Surprise Index turned negative.
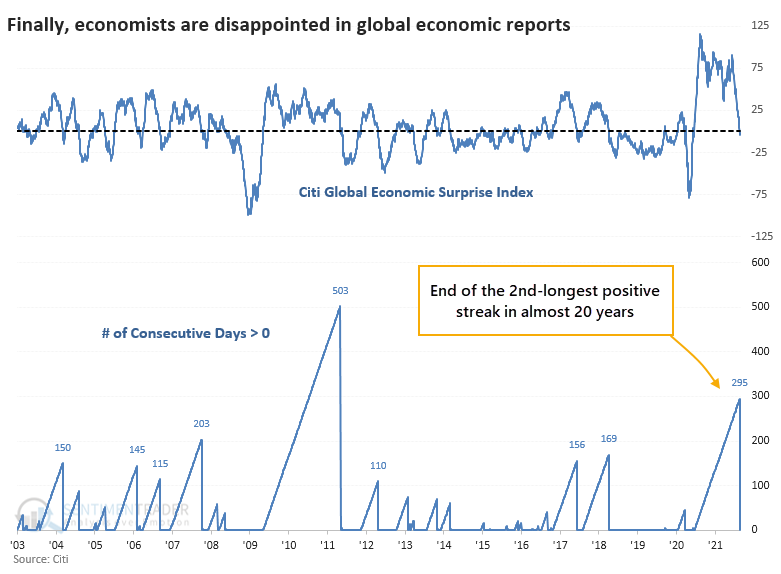
Last week's reading ended the 2nd-longest streak in positive territory in nearly 20 years. The only streak that exceeded the current one, or even came close, was the one following the recovery from the Great Financial Crisis.
'MEH' FOR MARKETS
The economy does not equal the market, especially when we're dealing with stocks. But for the MSCI World Index (excluding the U.S.), forward returns were poor after the ends of positive economic surprises, especially over the next 3 months.
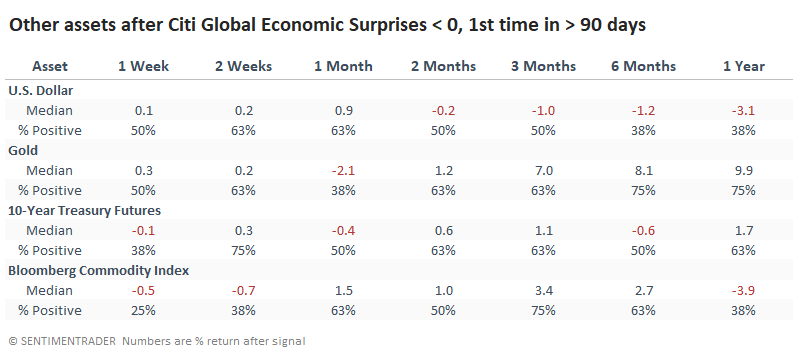
Among other assets, there wasn't a very consistent message. The U.S. dollar did okay shorter-term, then showed losses in the months ahead. Gold and commodities were essentially the opposite, but it wasn't perfect. Treasuries meandered above and below the zero line.
THE U.S. IS LAGGING THE WORLD
Even though the Citi Global Economic Surprise Index just turned negative, the one focused on the U.S. is nearly -50. If we filter the table above to only include those signals when U.S. surprises were lagging the world, then the ratio of the Russell 3000 to the MSCI World Index tended to see losses.
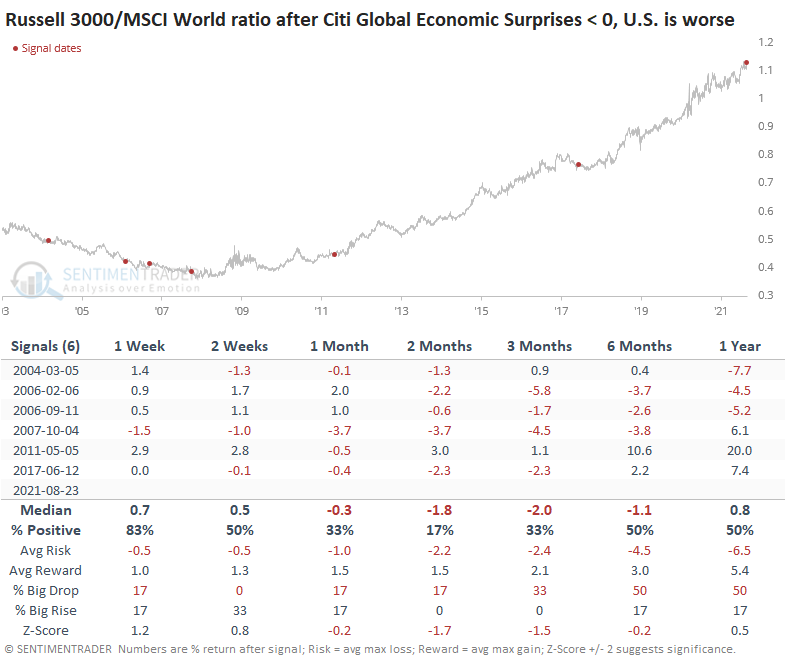
The ratio between the two indexes, the U.S. versus the world, showed a negative bias at some point between 1-2 months later every time. Granted, there isn't much history, so the sample size is tiny.
For those allocating across geographies, Dean has repeatedly pointed out how almost everything has fallen behind the U.S., especially the Asia Pacific region. And when so many of those markets are falling behind, they have a strong tendency to continue to. The broader MSCI World Index is lagging U.S. stocks, too, but the recent bout of disappointing economic reports shouldn't be a reason to expect that to continue, given that they've been even worse here in the States.
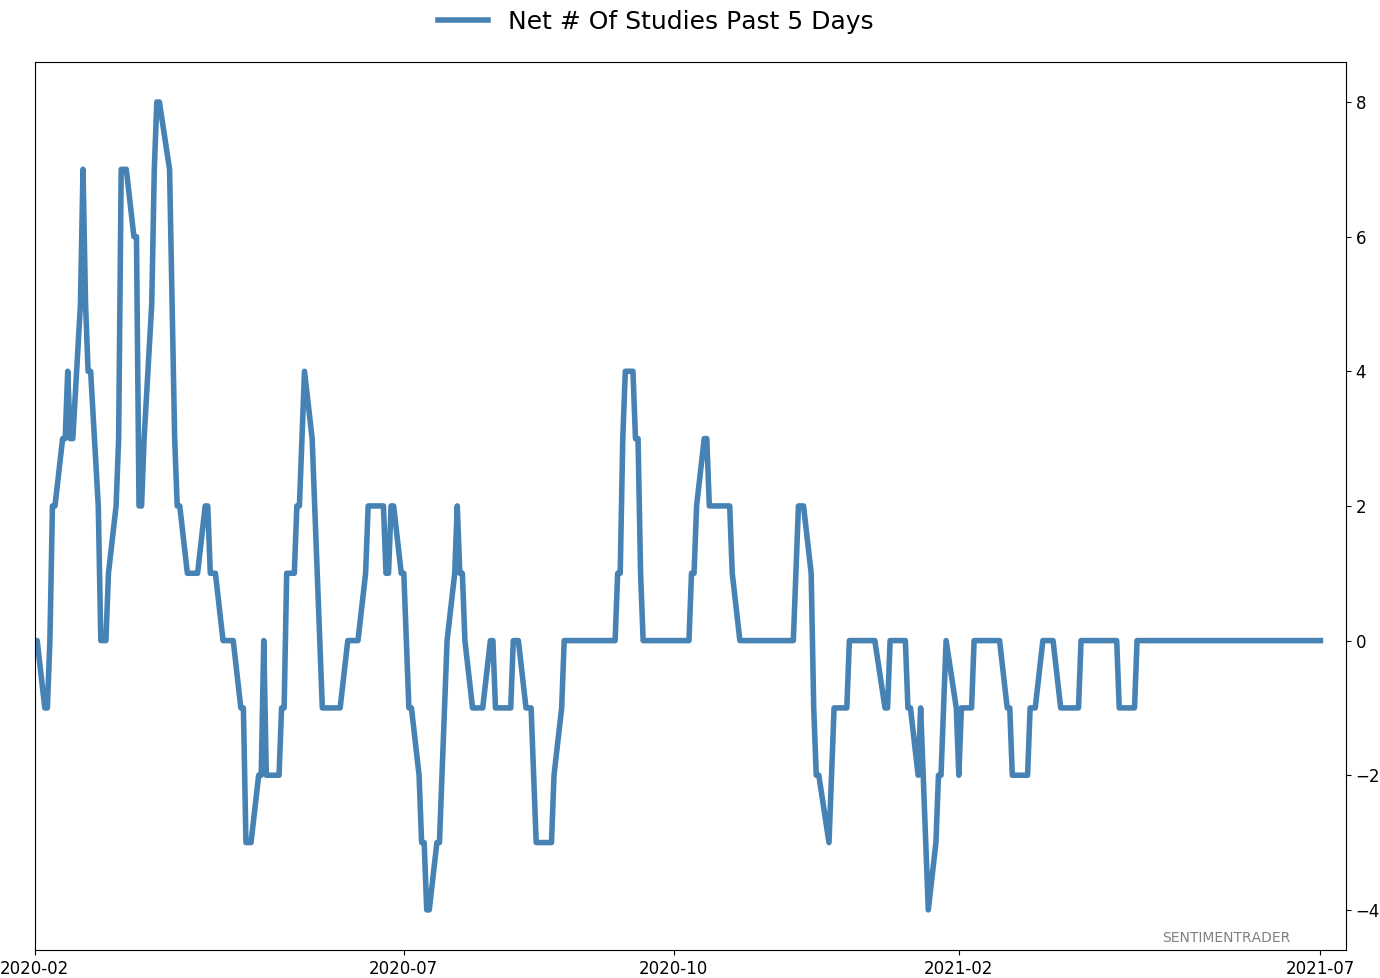
Active Studies
| Time Frame | Bullish | Bearish | | Short-Term | 0 | 5 | | Medium-Term | 4 | 3 | | Long-Term | 11 | 5 |
|
Indicators at Extremes
Portfolio
| Position | Description | Weight % | Added / Reduced | Date | | Stocks | RSP | 4.1 | Added 4.1% | 2021-05-19 | | Bonds | 23.9% BND, 6.9% SCHP | 30.7 | Reduced 7.1% | 2021-05-19 | | Commodities | GCC | 2.6 | Reduced 2.1%
| 2020-09-04 | | Precious Metals | GDX | 5.6 | Reduced 4.2% | 2021-05-19 | | Special Situations | 4.3% XLE, 2.2% PSCE | 7.6 | Reduced 5.6% | 2021-04-22 | | Cash | | 49.4 | | |
|
Updates (Changes made today are underlined)
Much of our momentum and trend work has remained positive for several months, with some scattered exceptions. Almost all sentiment-related work has shown a poor risk/reward ratio for stocks, especially as speculation drove to record highs in exuberance in February. Much of that has worn off, and most of our models are back toward neutral levels. There isn't much to be excited about here. The same goes for bonds and even gold. Gold has been performing well lately and is back above long-term trend lines. The issue is that it has a poor record of holding onto gains when attempting a long-term trend change like this, so we'll take a wait-and-see approach. RETURN YTD: 8.9% 2020: 8.1%, 2019: 12.6%, 2018: 0.6%, 2017: 3.8%, 2016: 17.1%, 2015: 9.2%, 2014: 14.5%, 2013: 2.2%, 2012: 10.8%, 2011: 16.5%, 2010: 15.3%, 2009: 23.9%, 2008: 16.2%, 2007: 7.8%
|
|
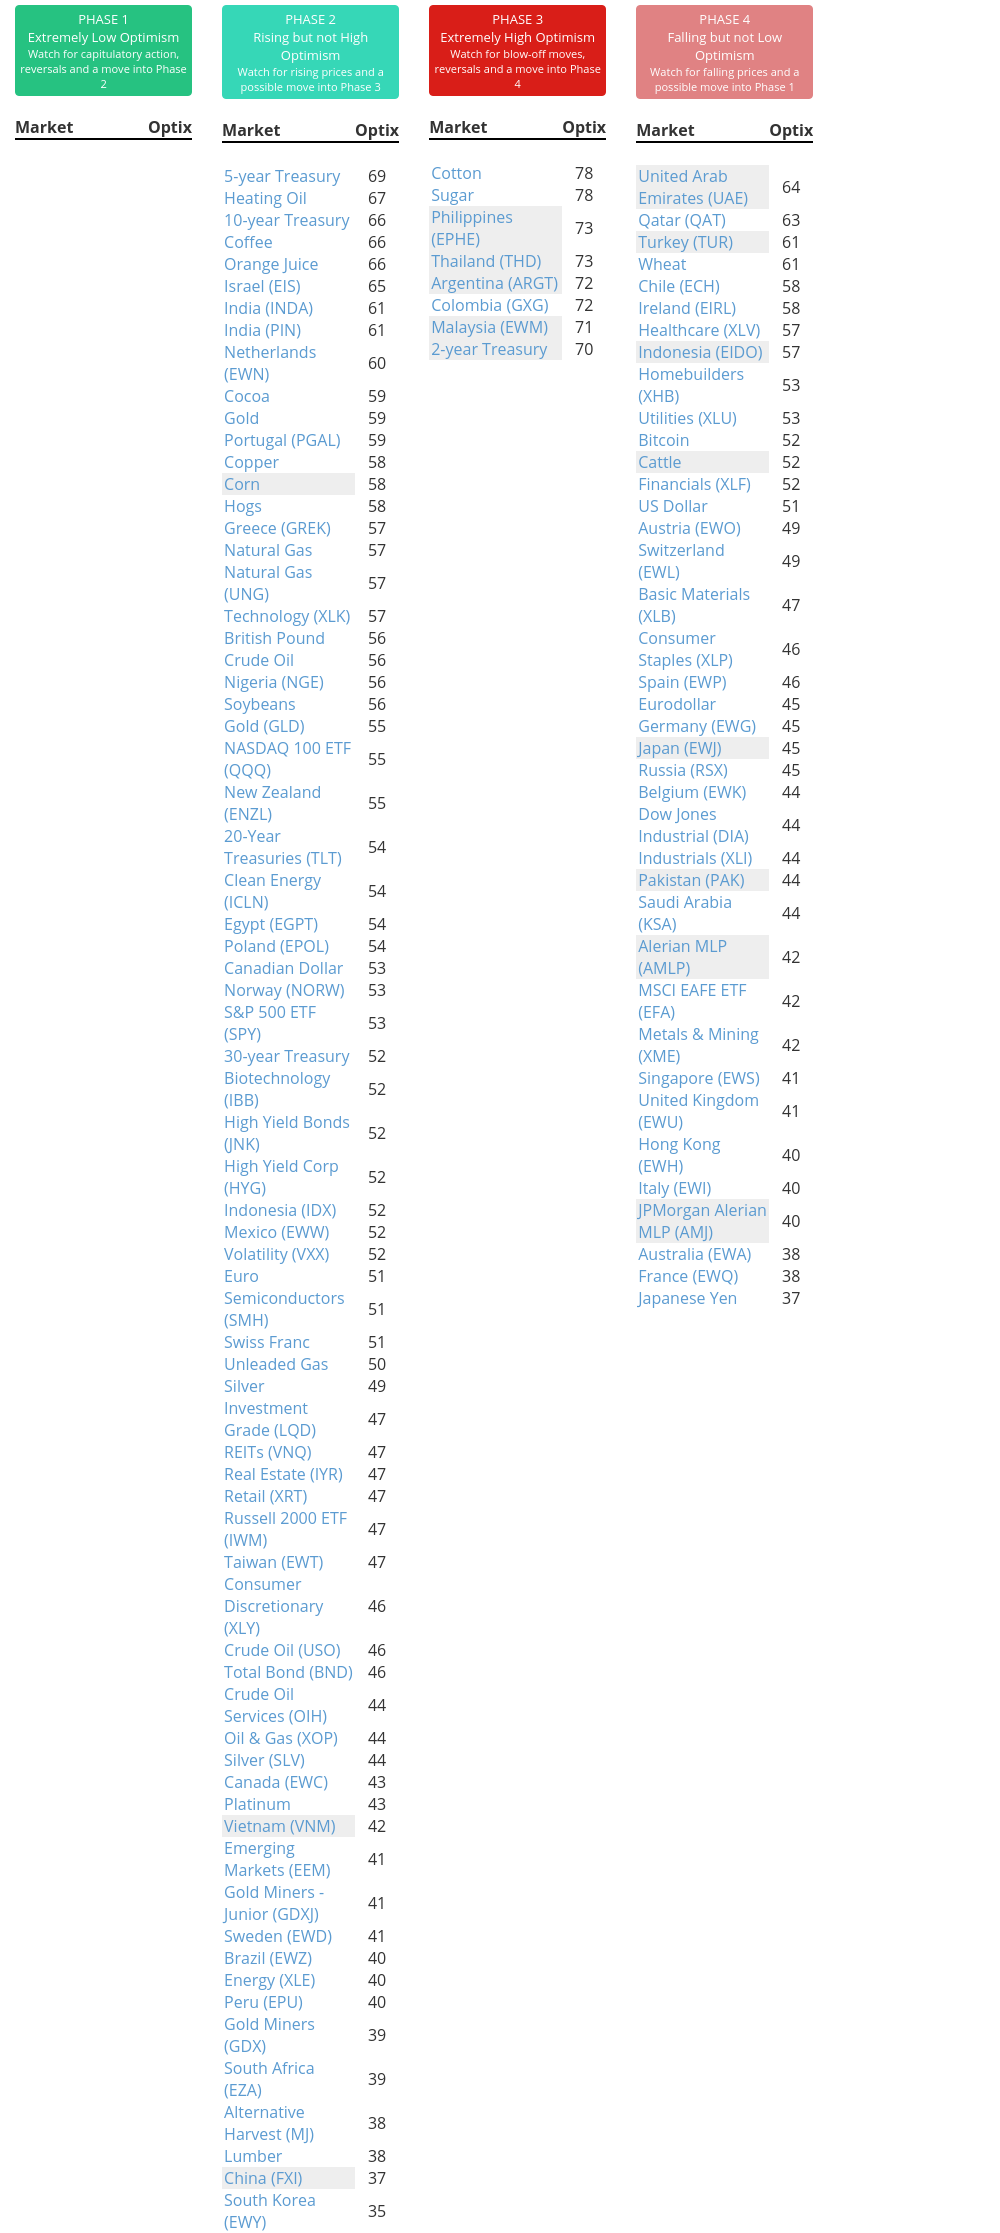
Phase Table
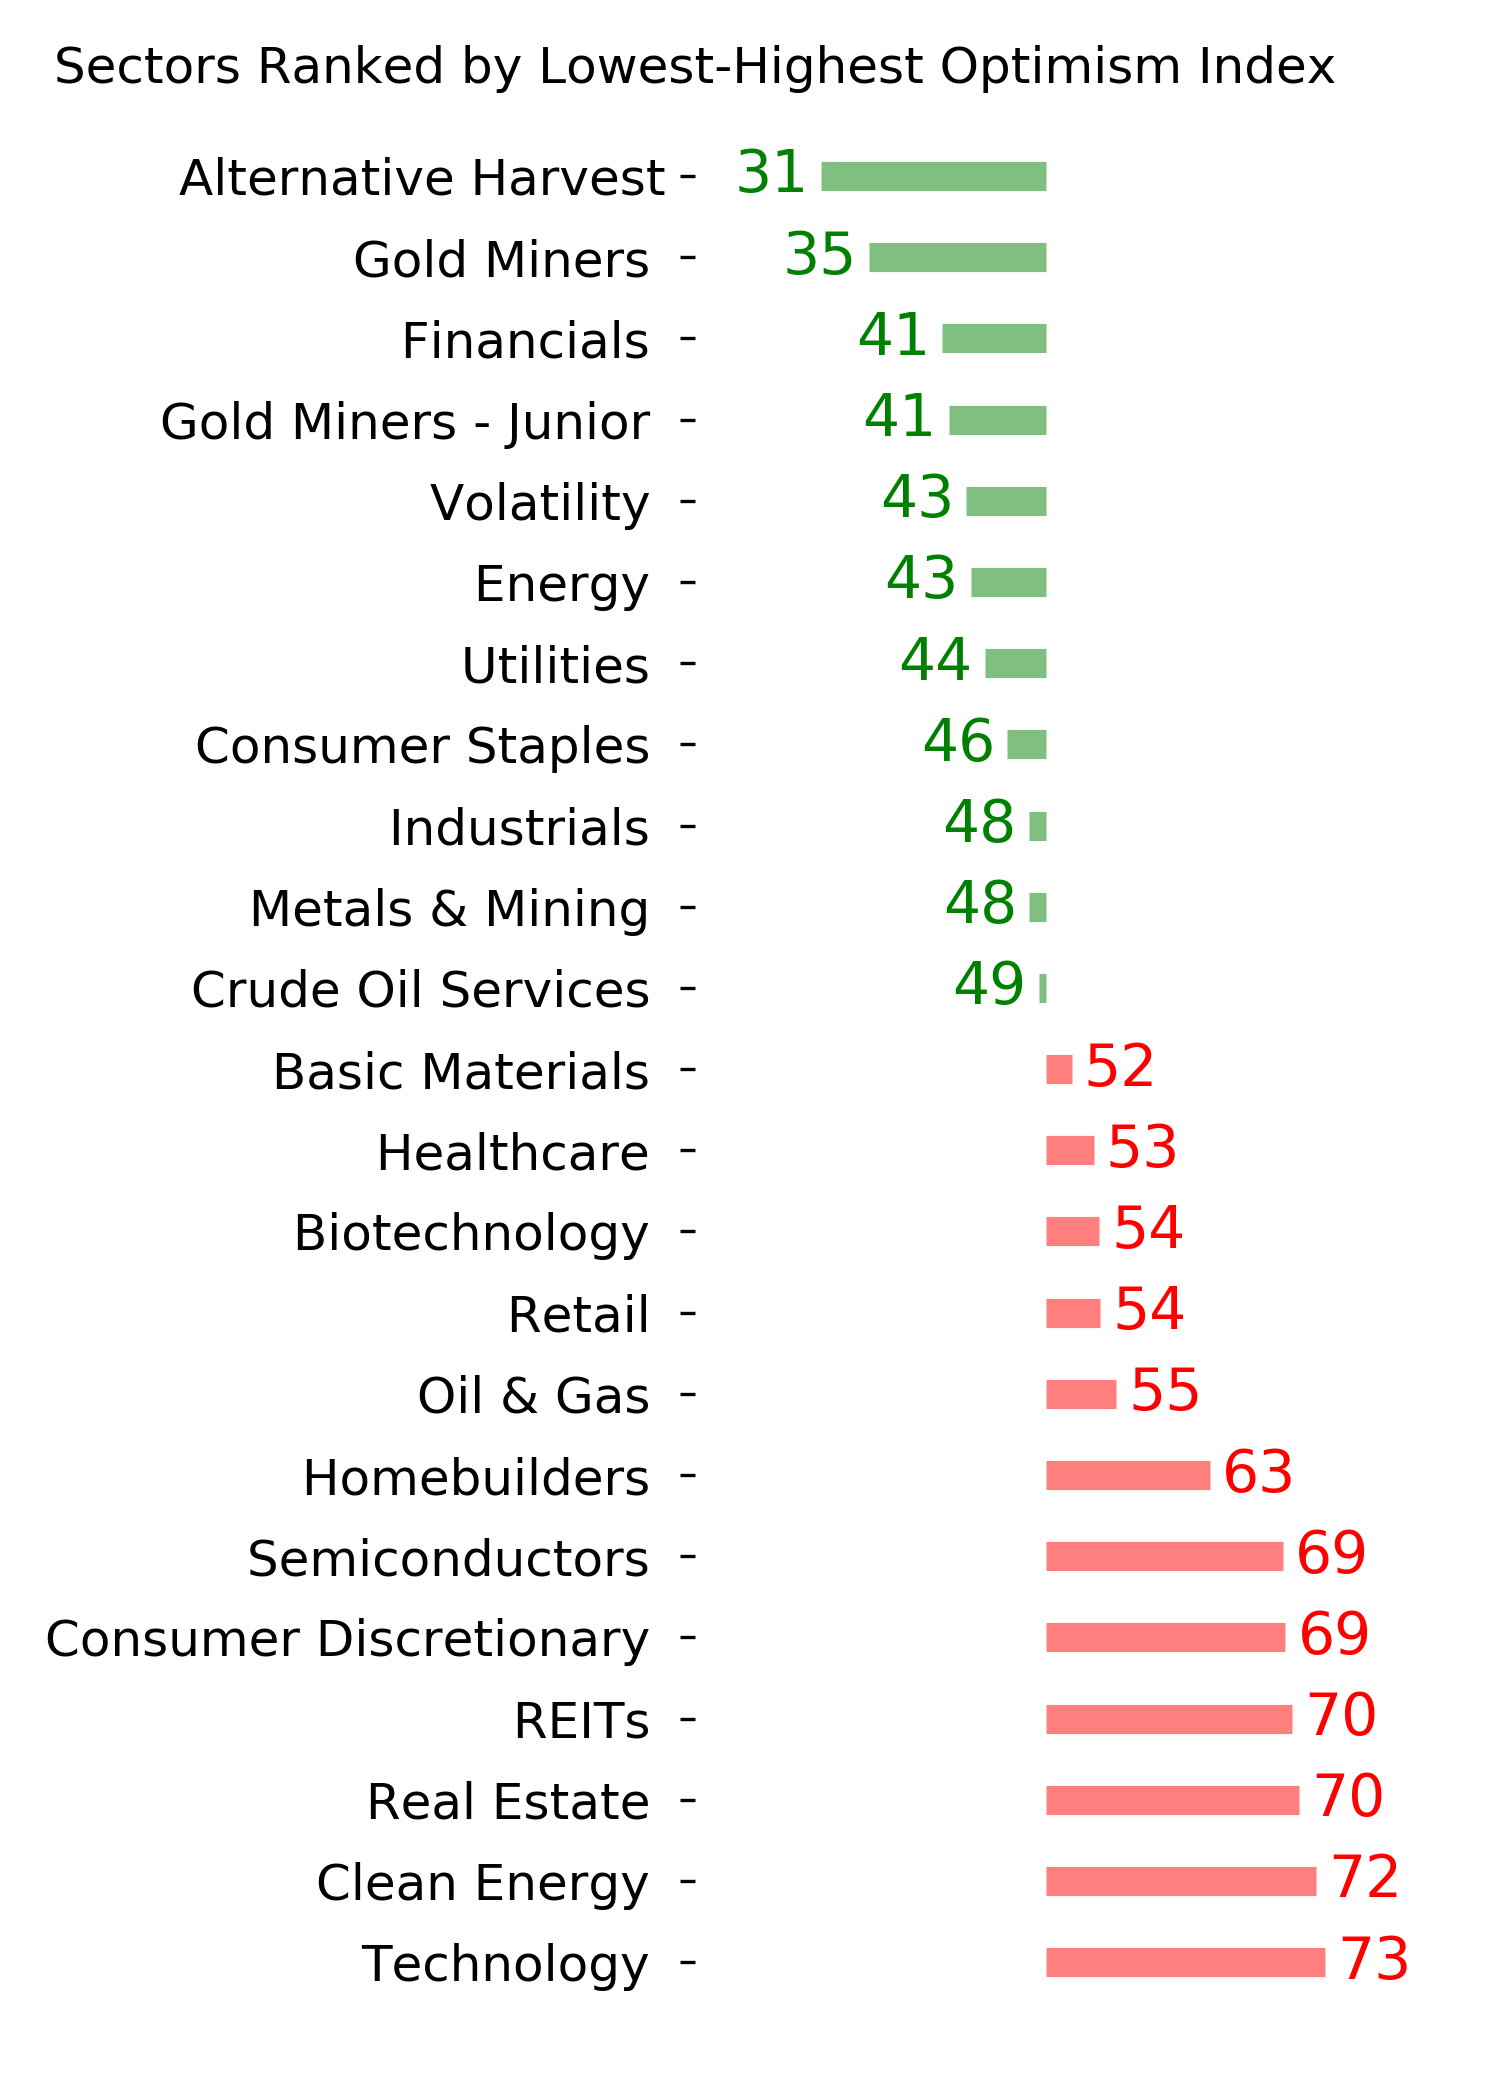
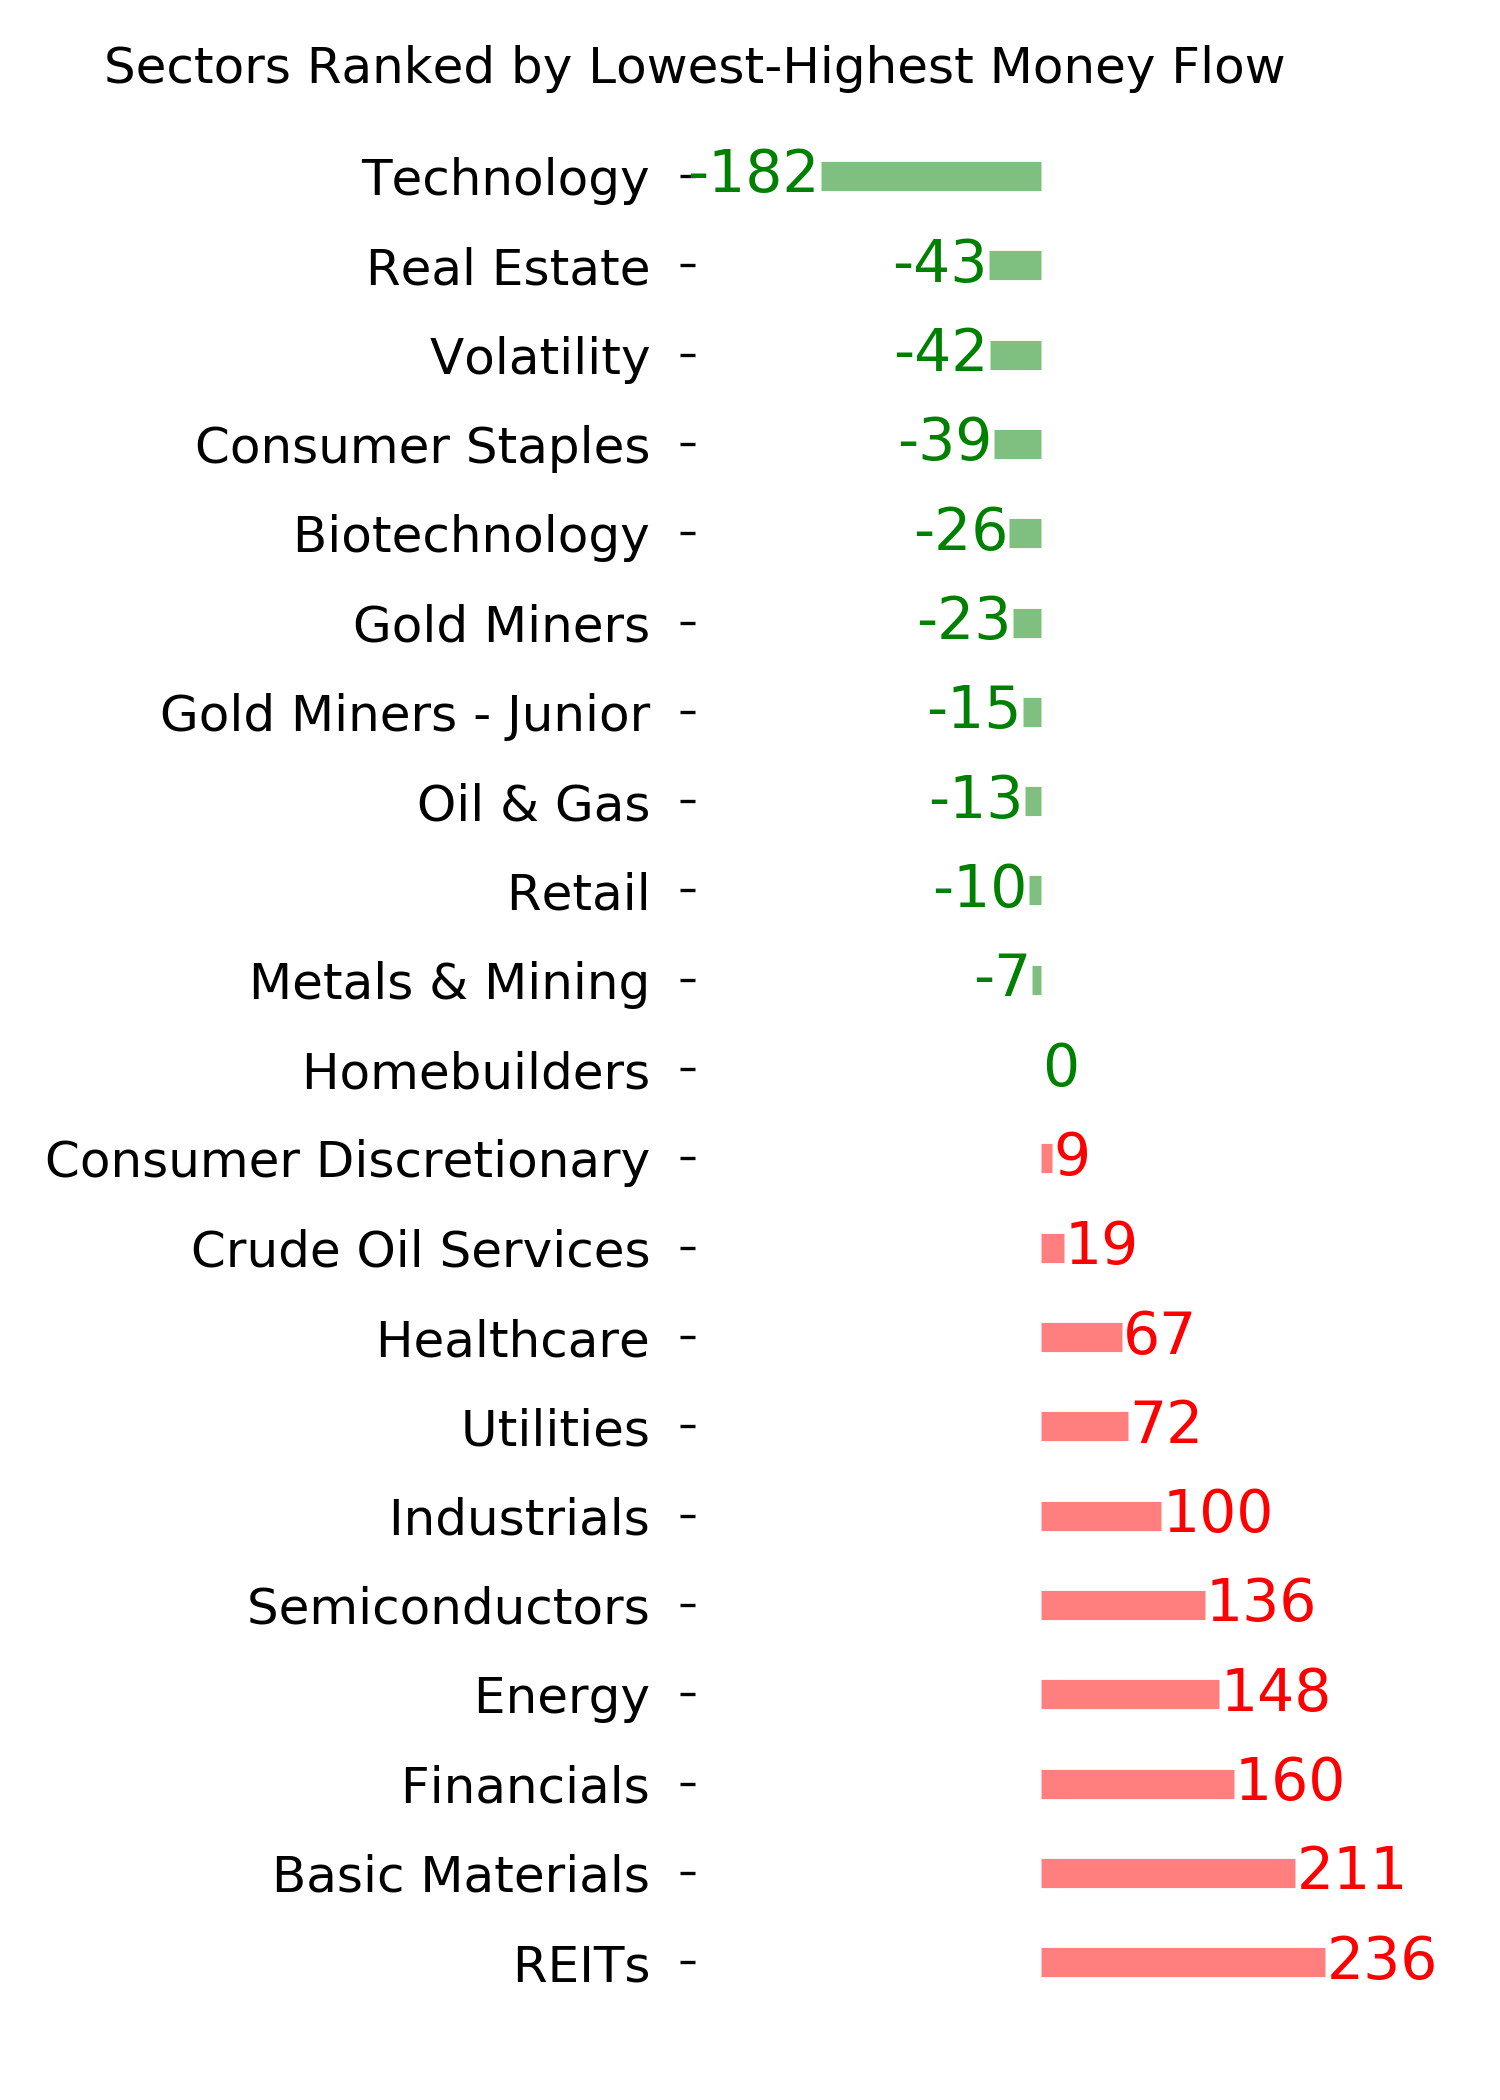
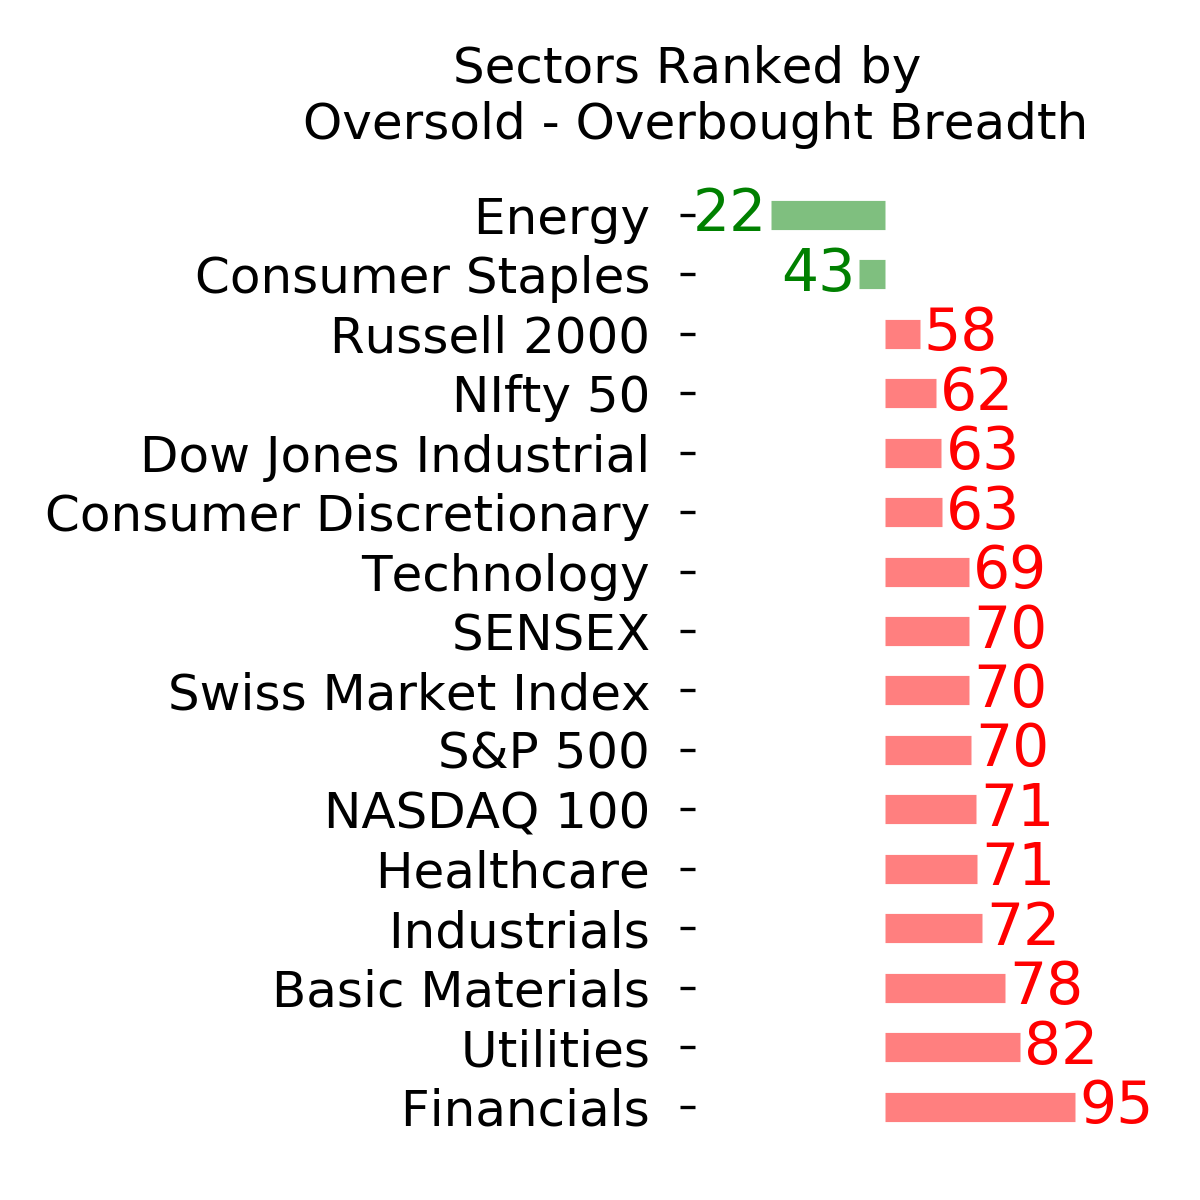
Ranks
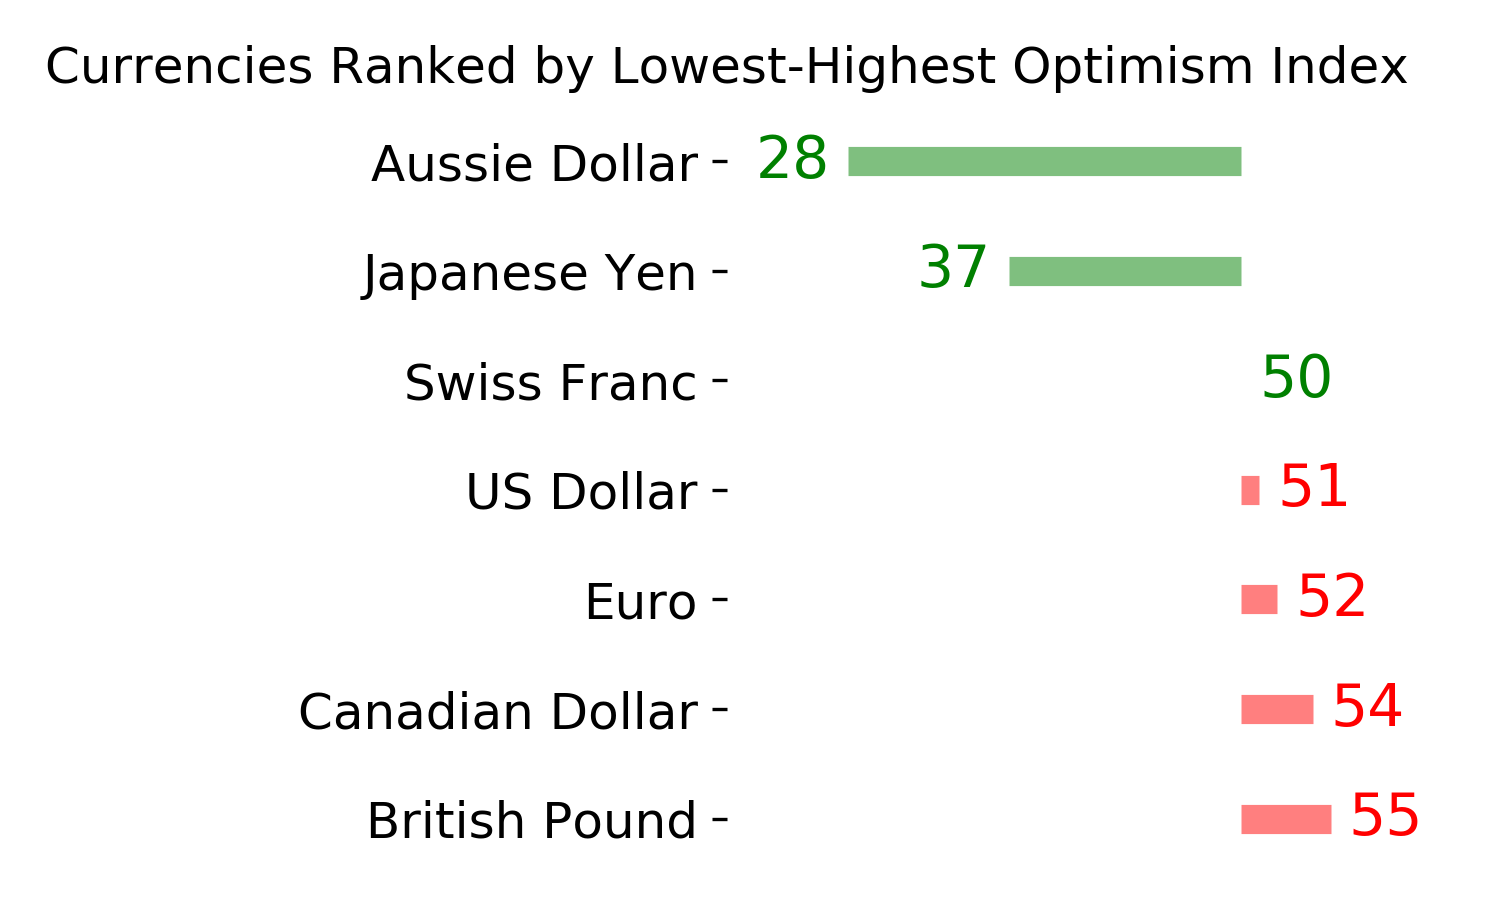
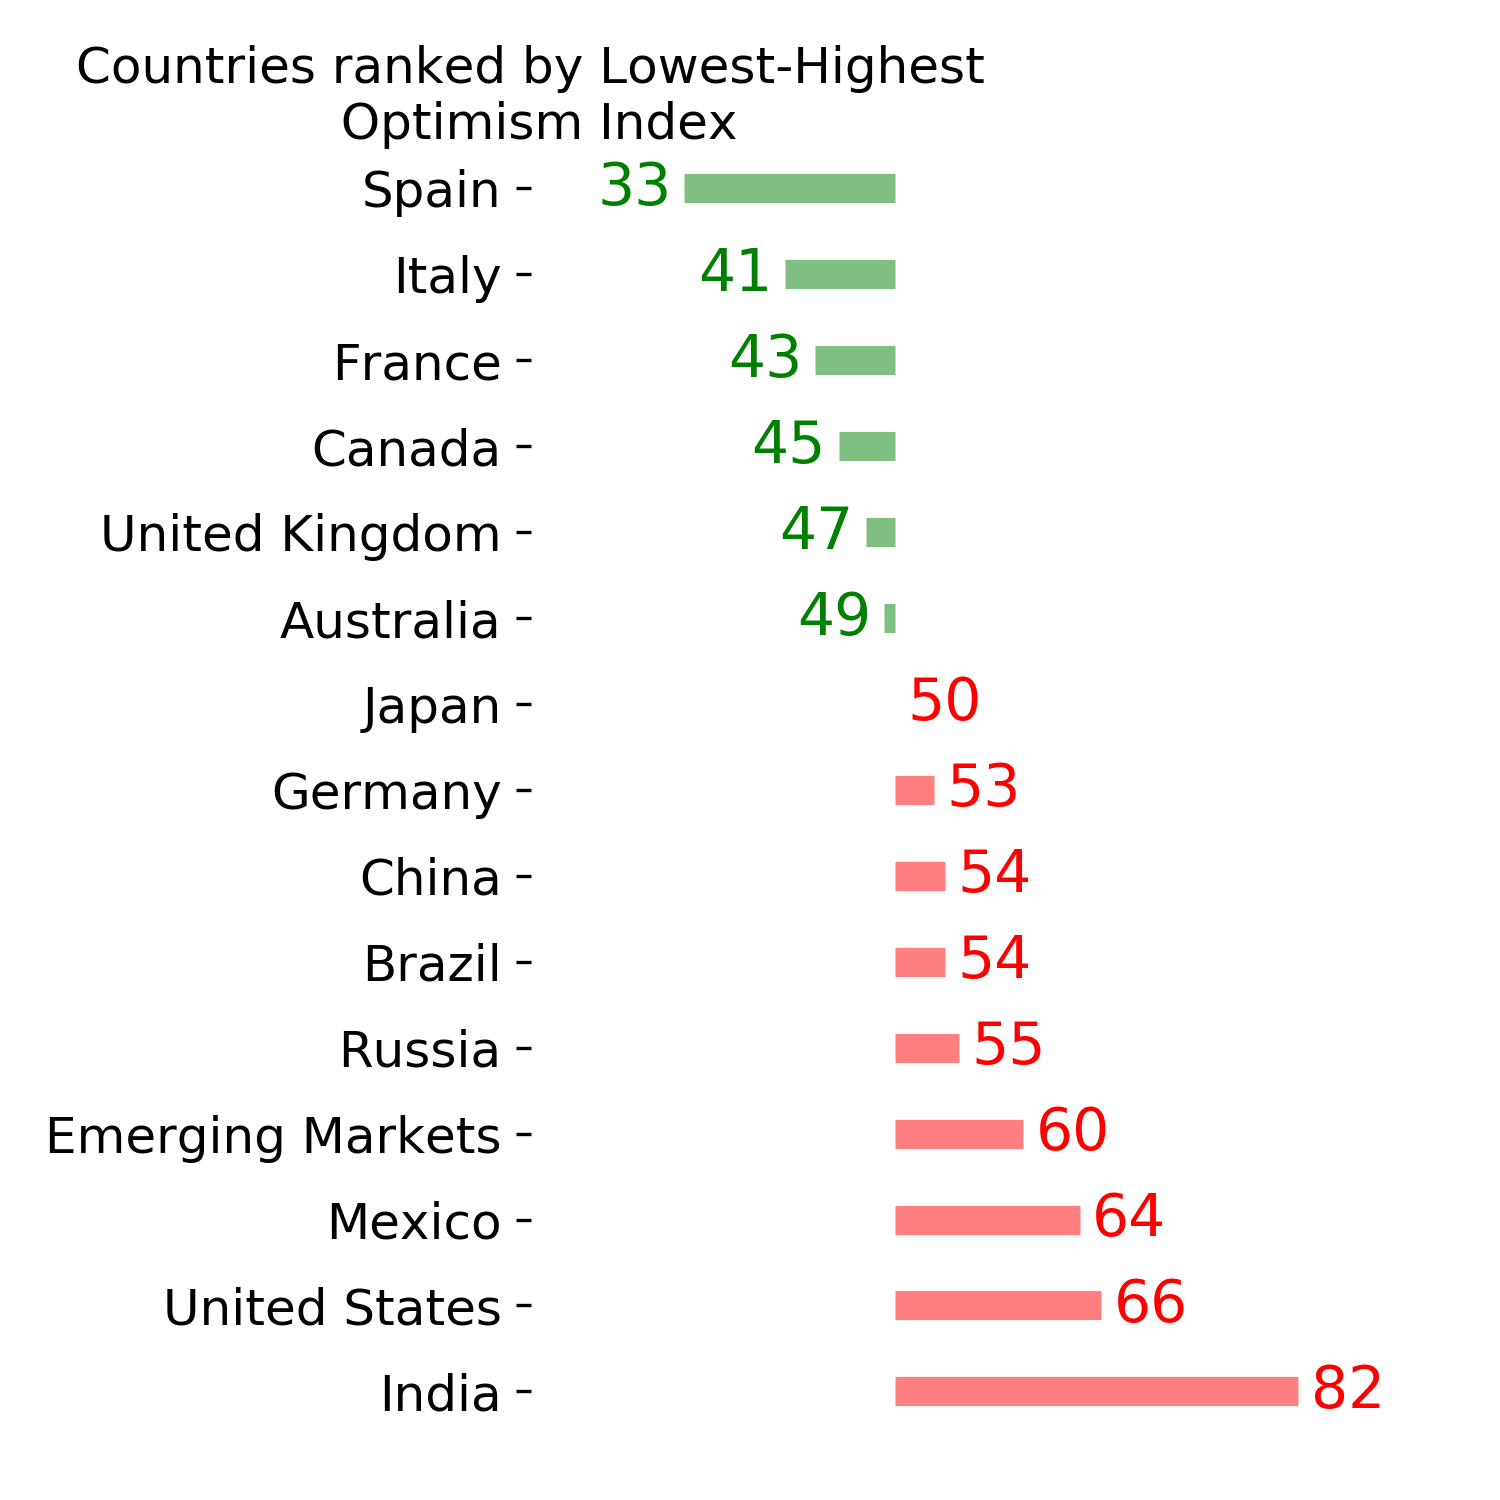
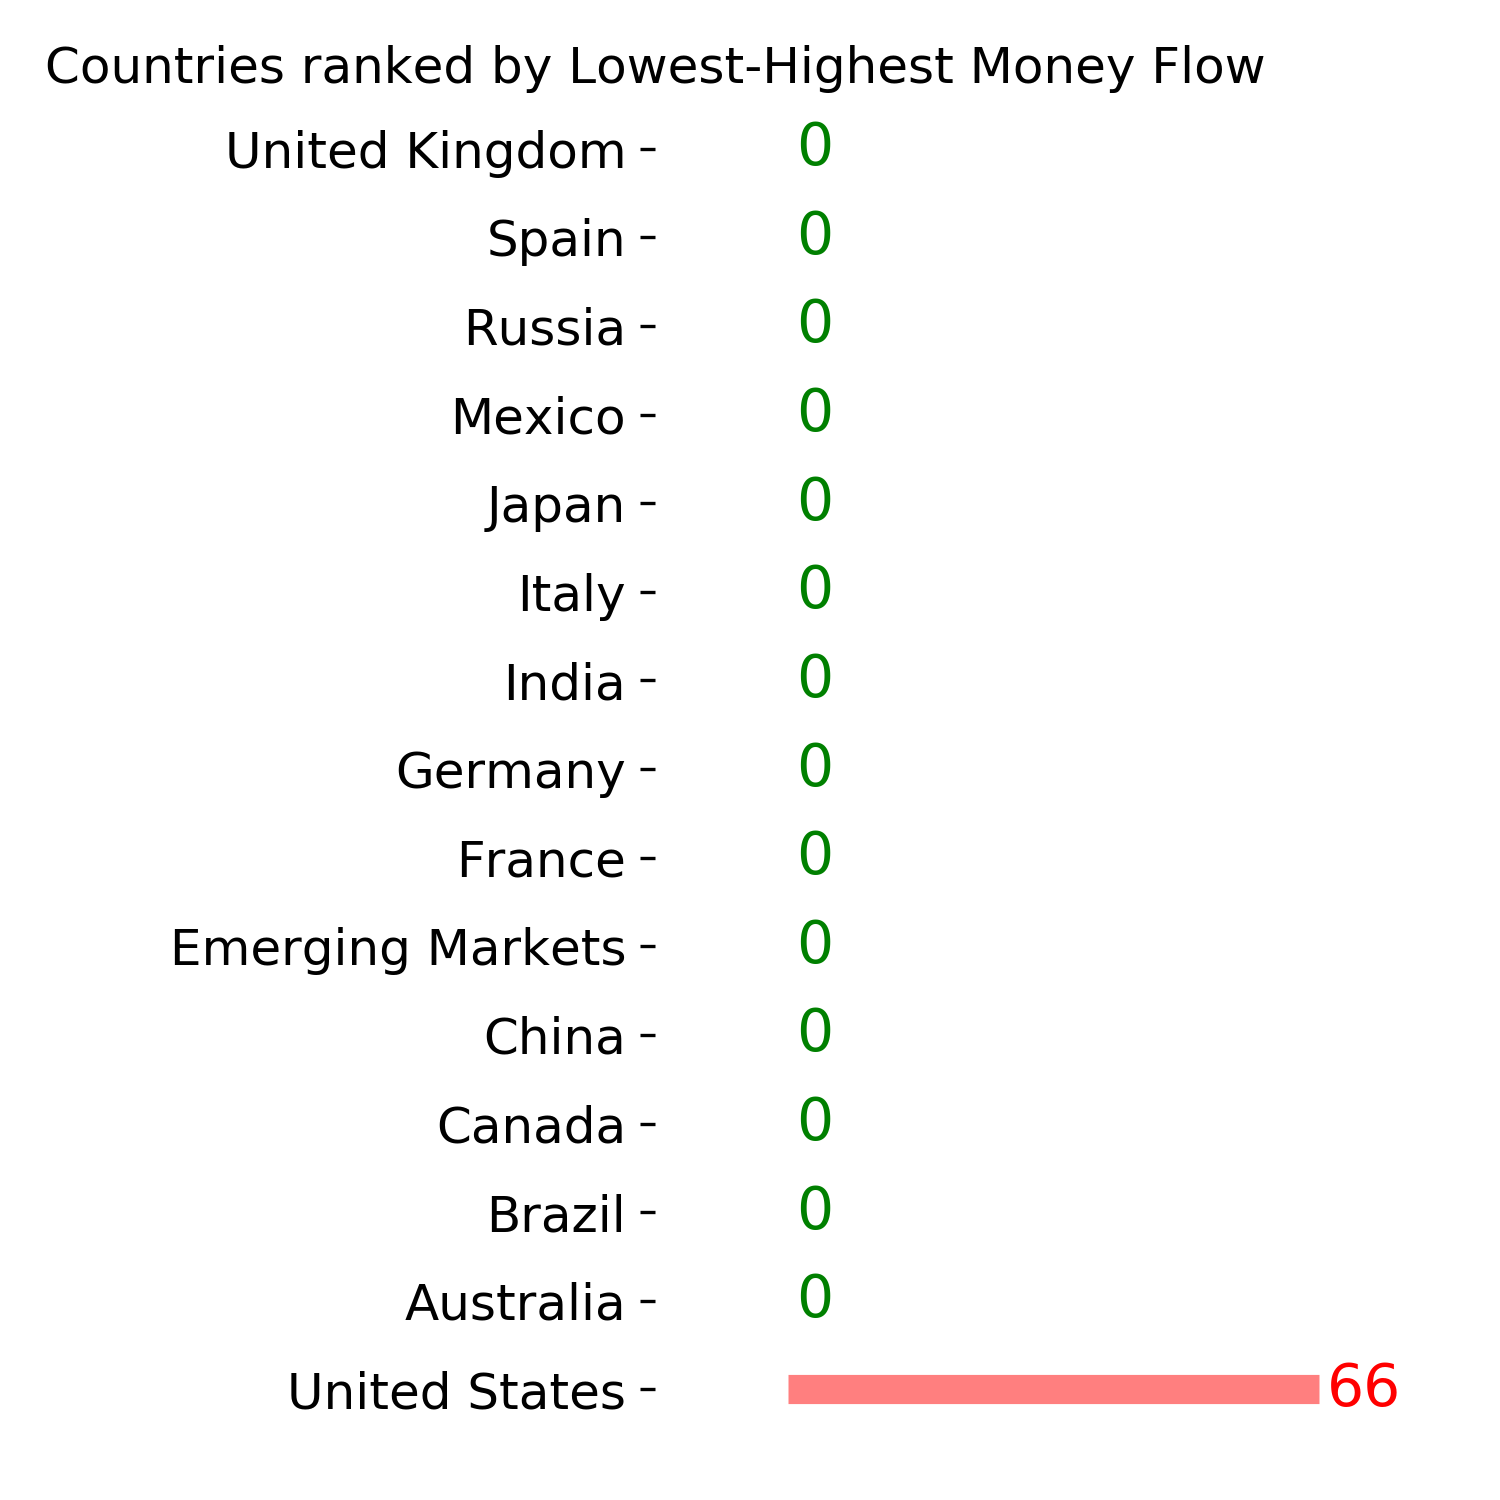
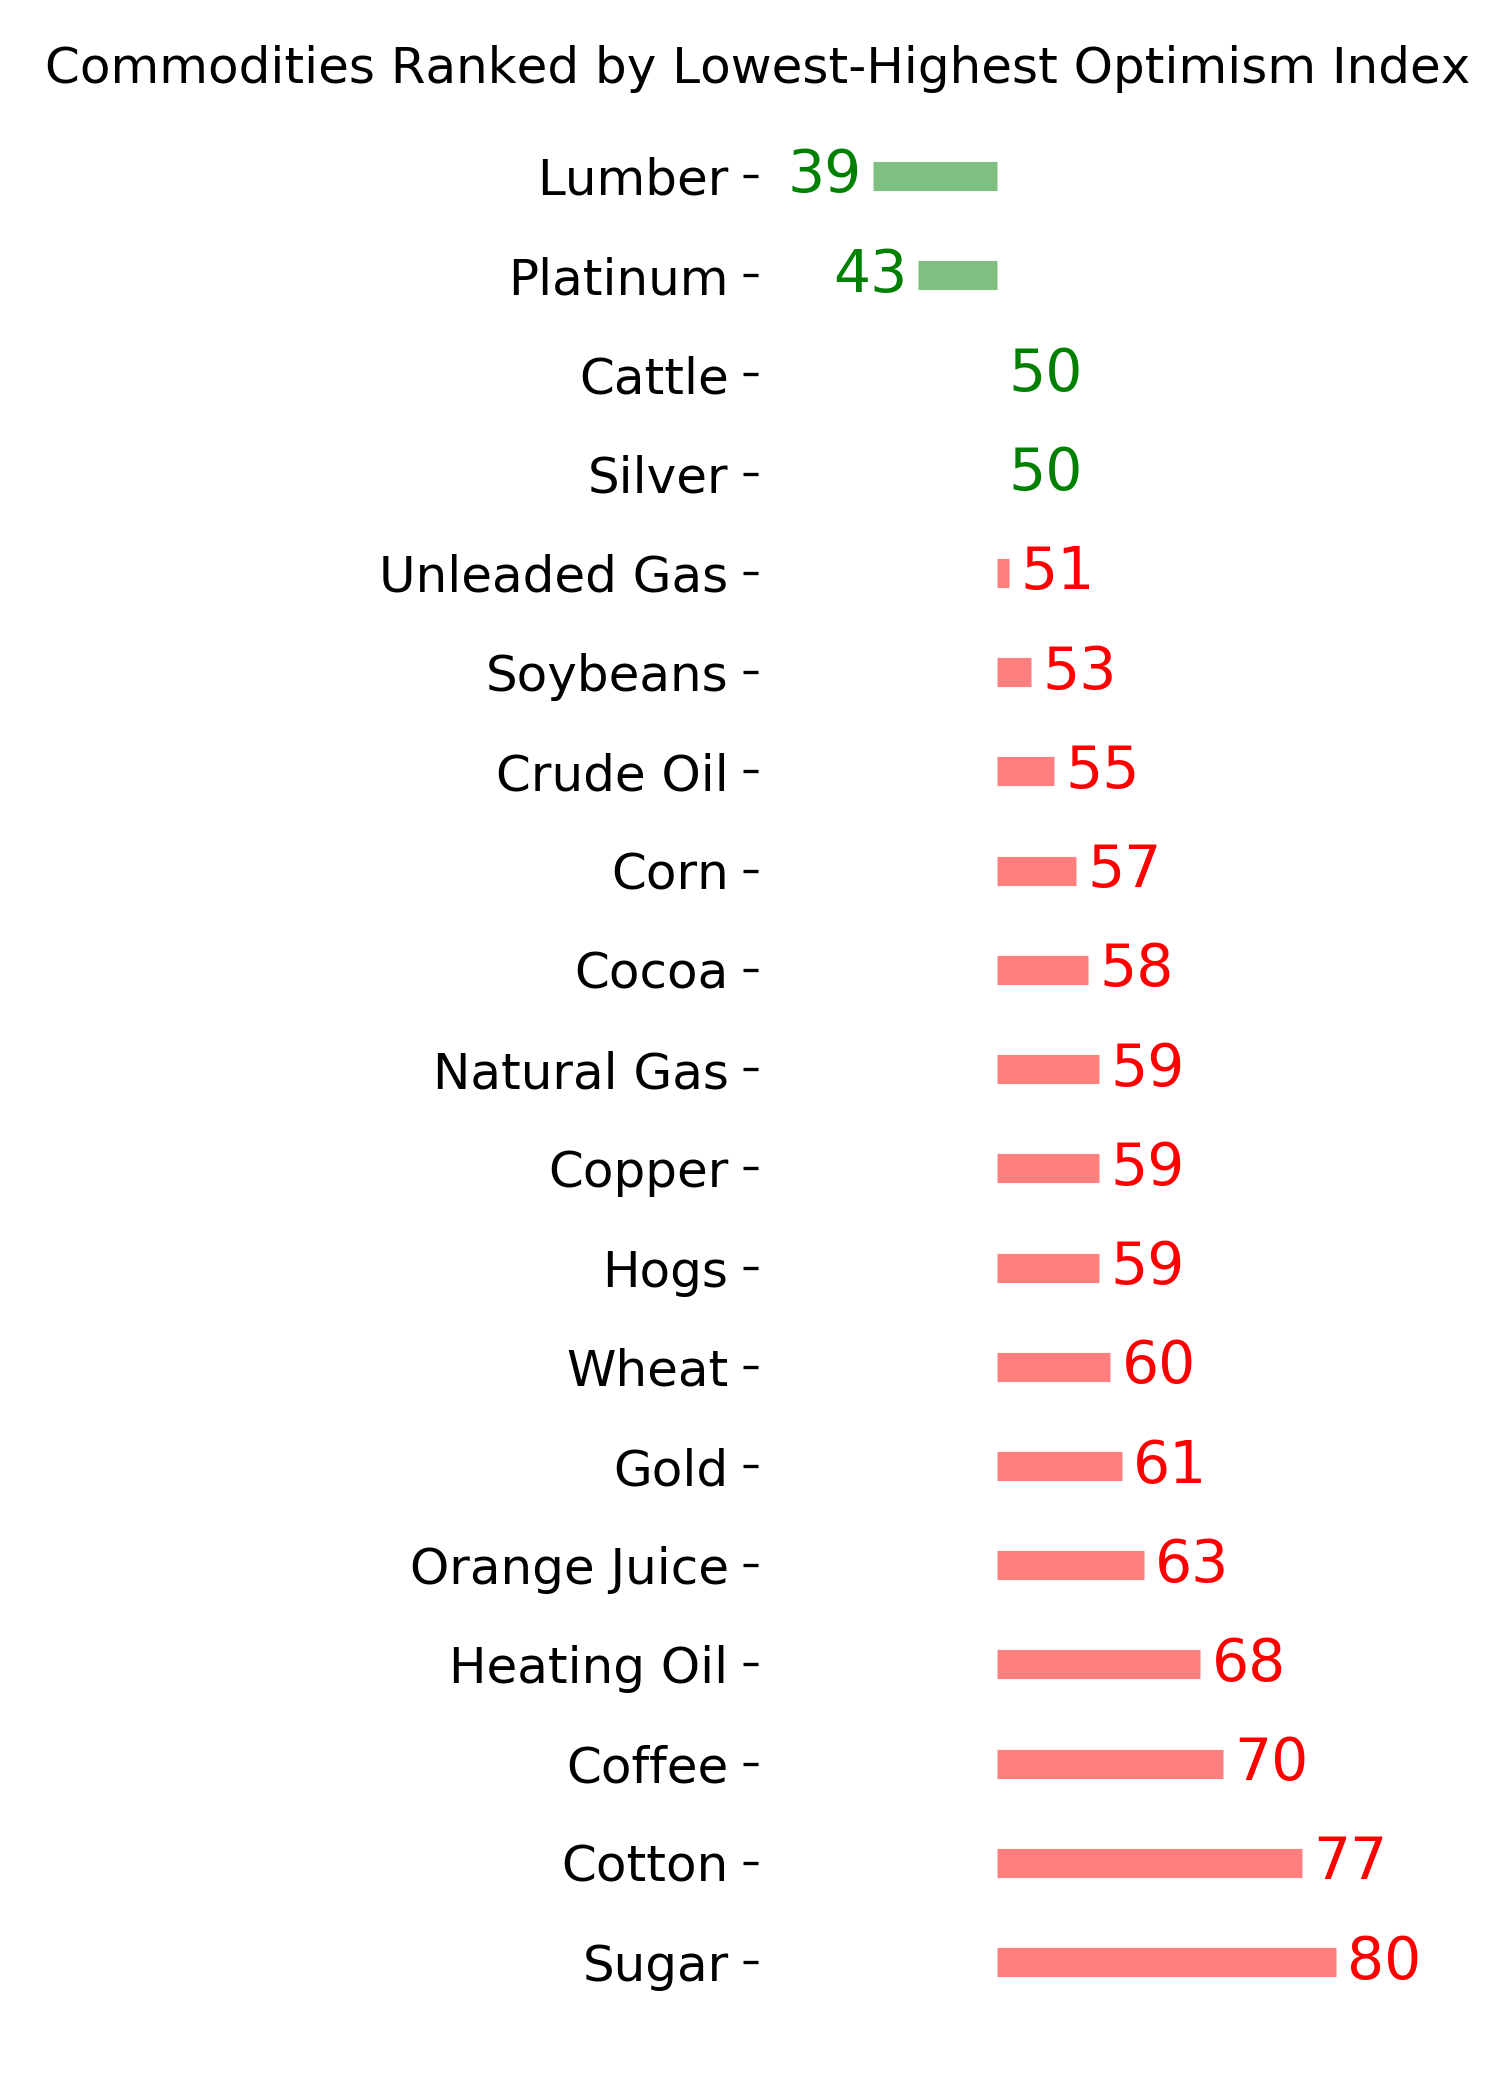
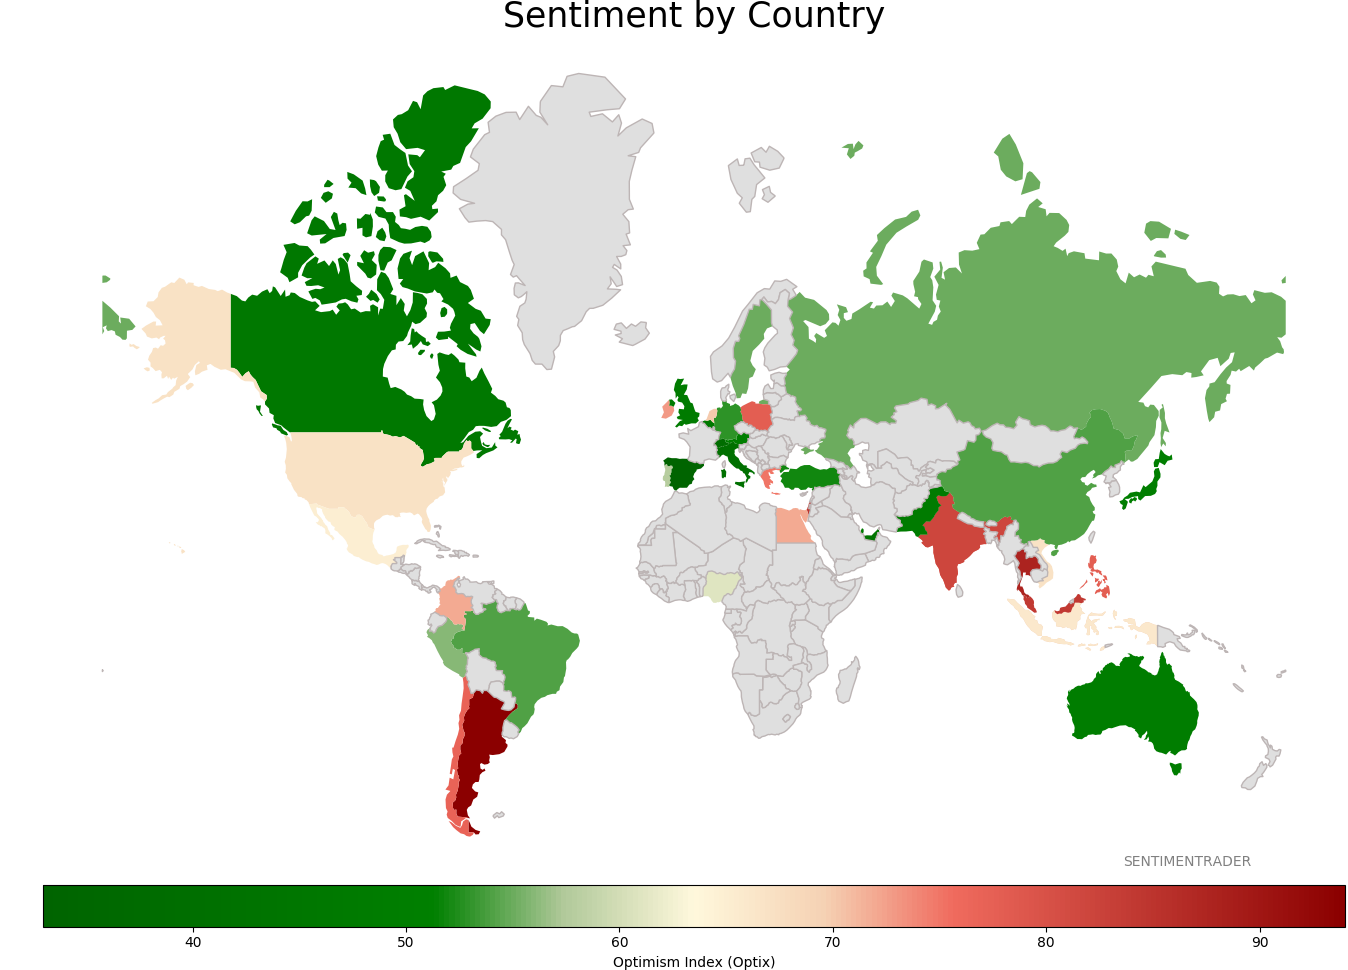
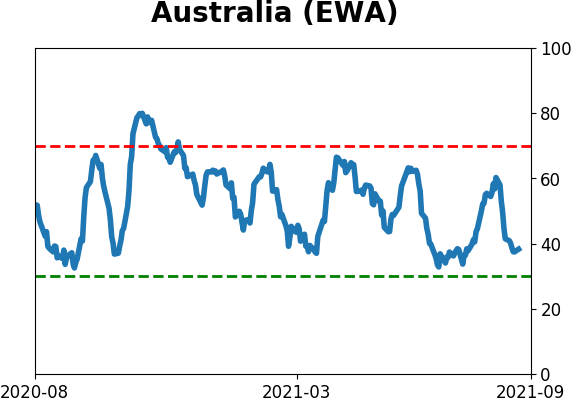
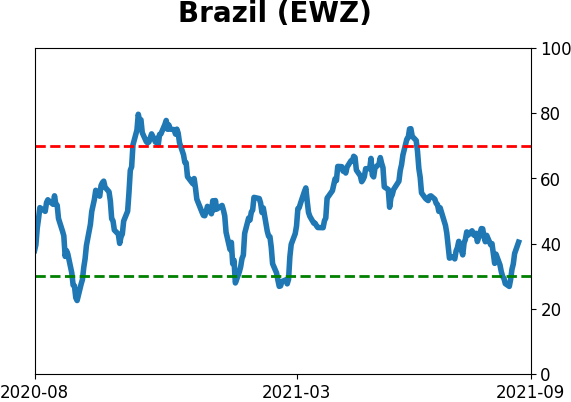
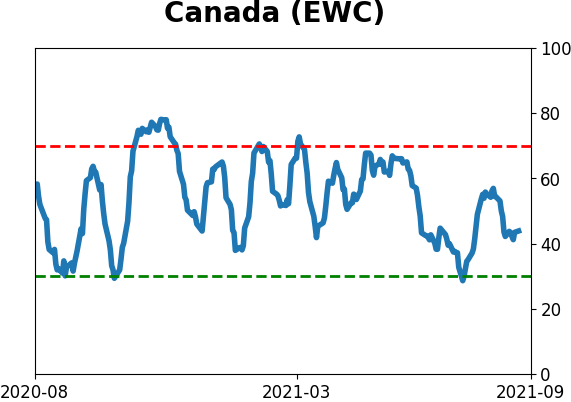
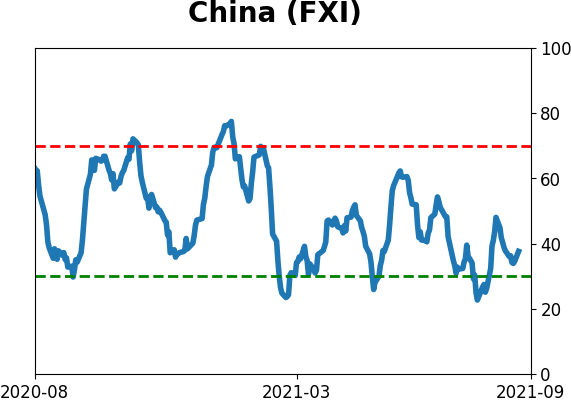
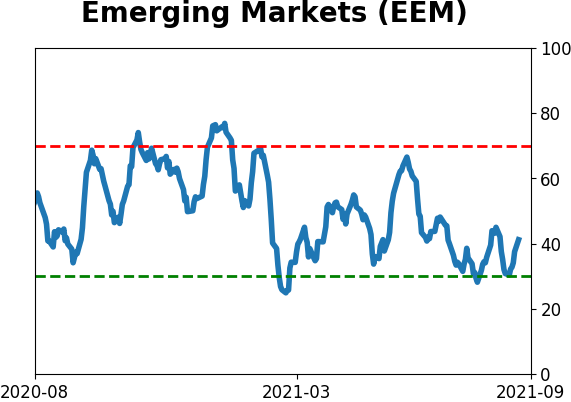
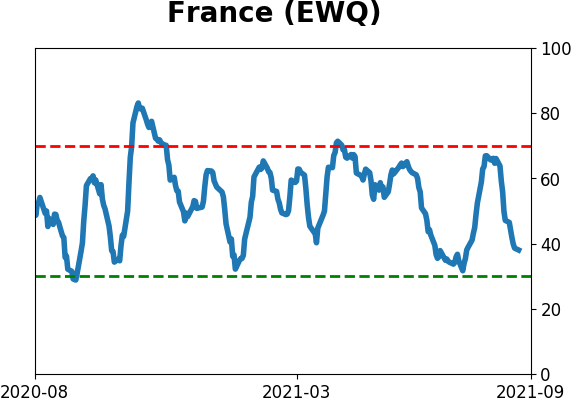
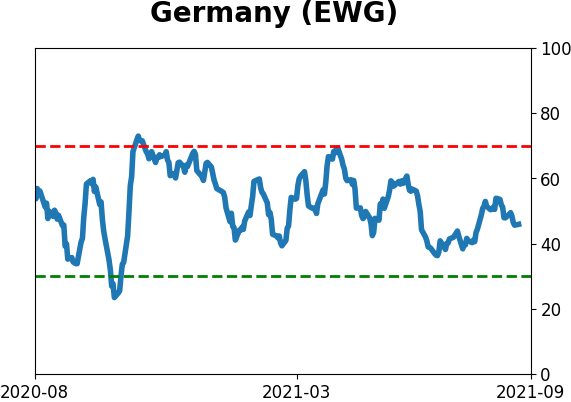
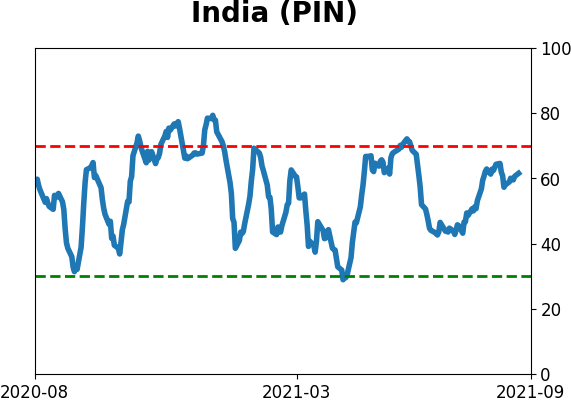
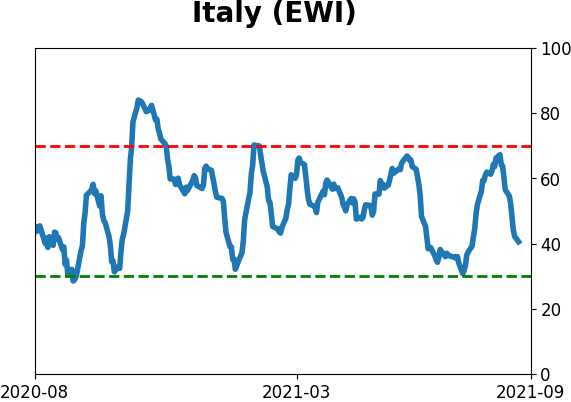
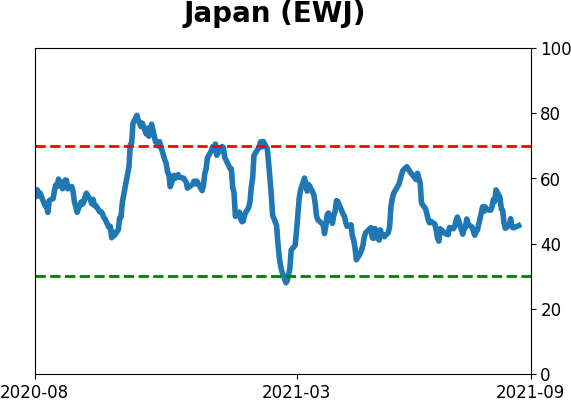
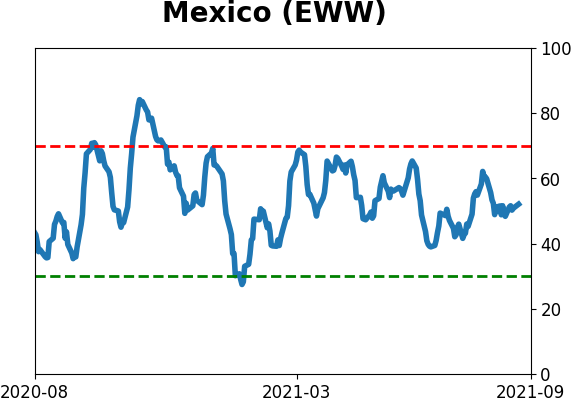
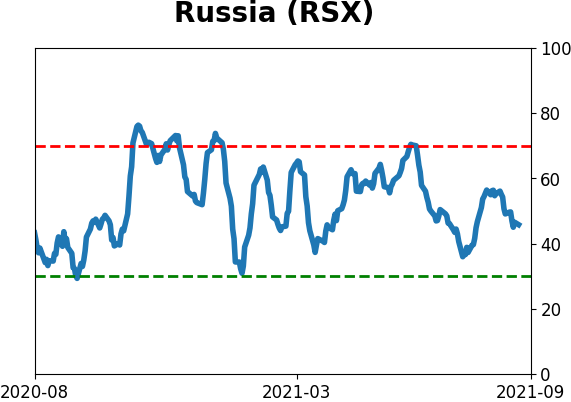
Sentiment Around The World
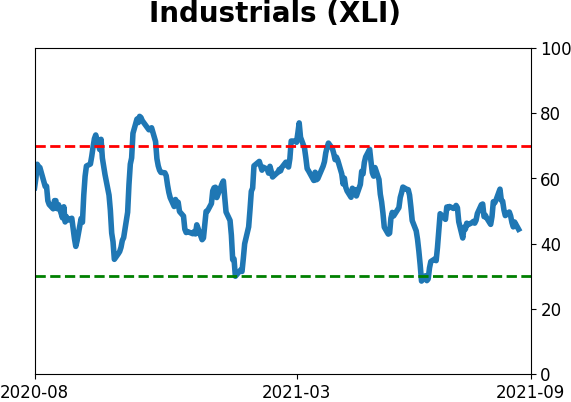
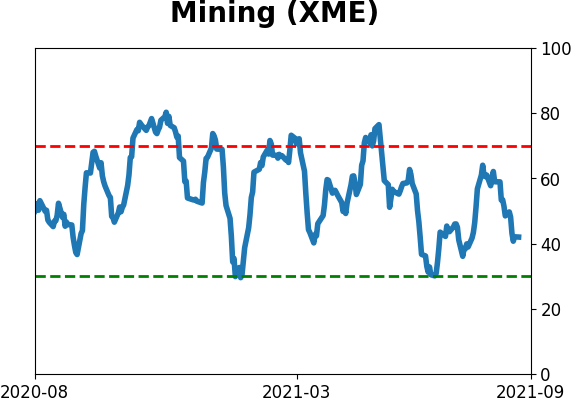
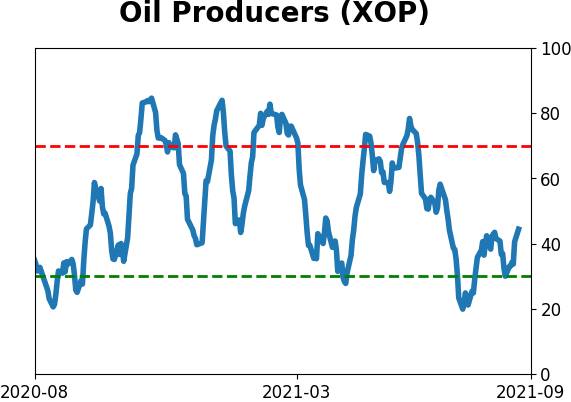
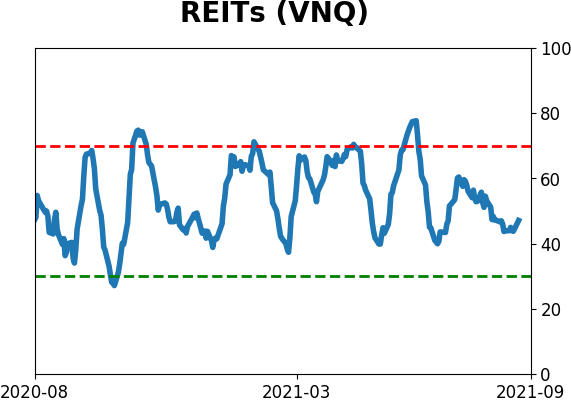
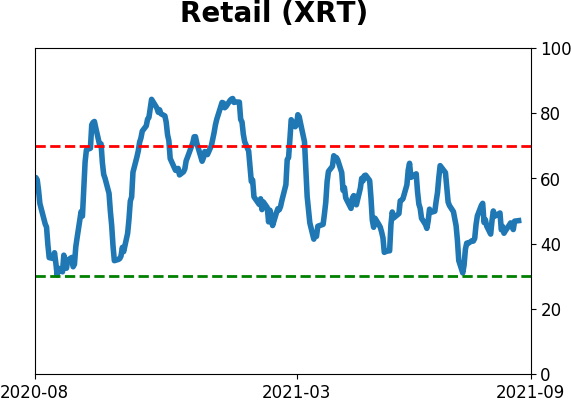
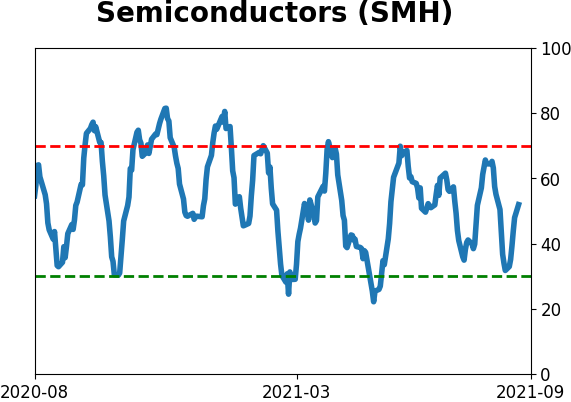
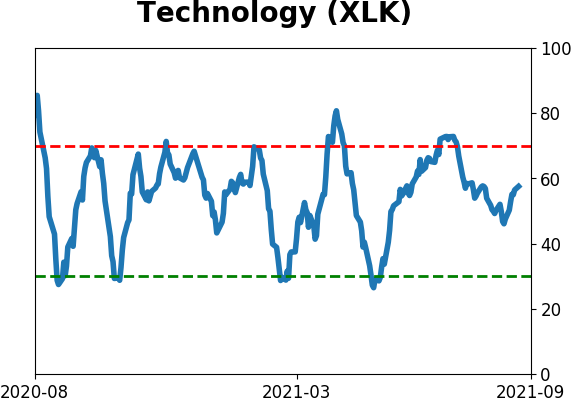
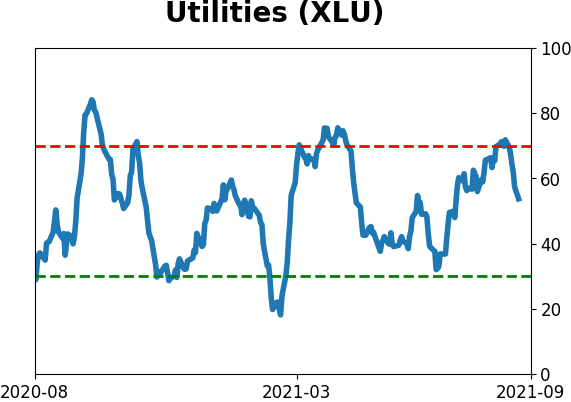
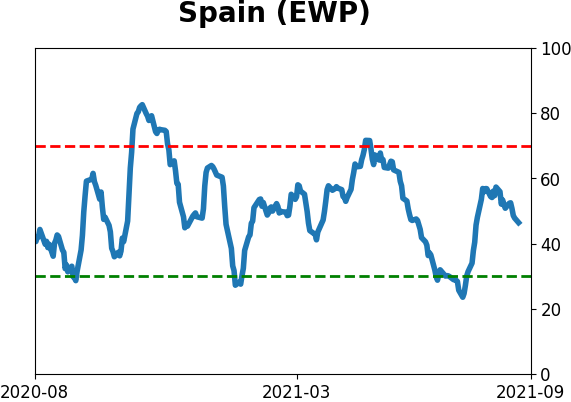
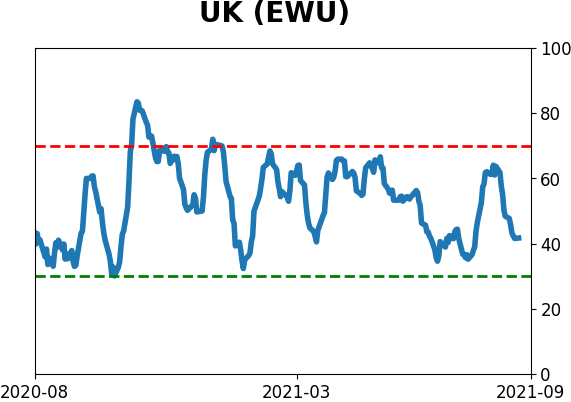
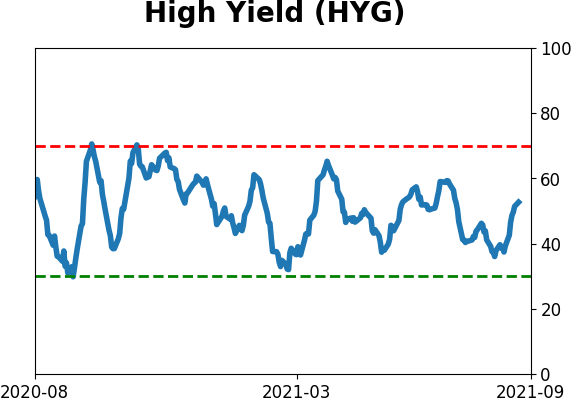
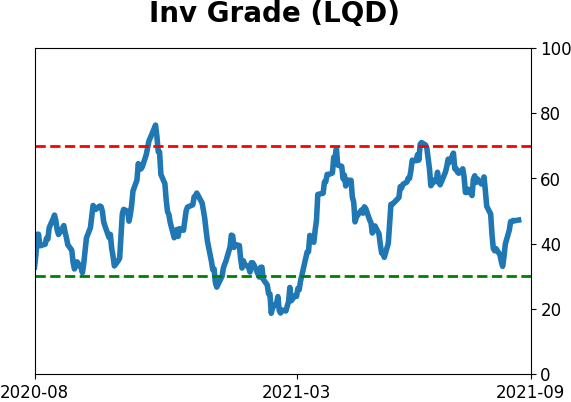
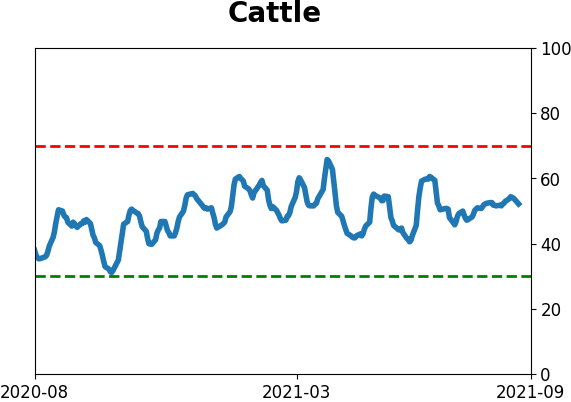
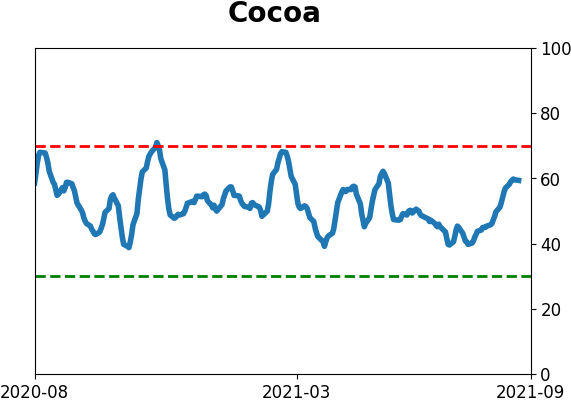
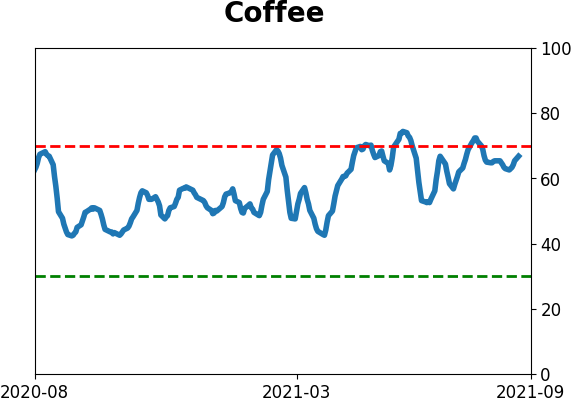
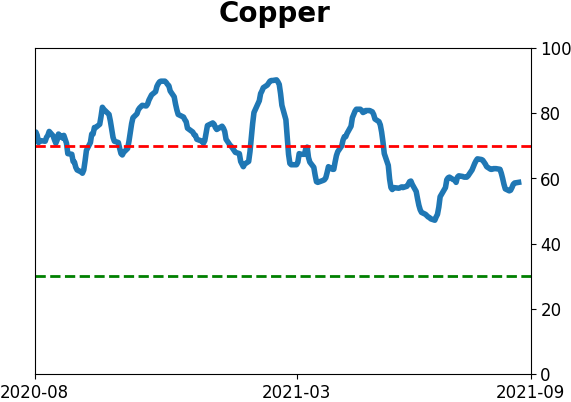
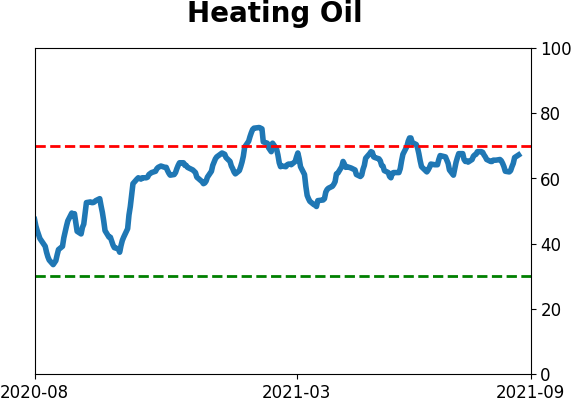
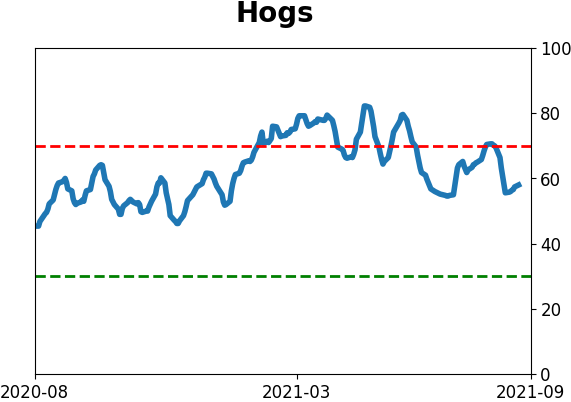
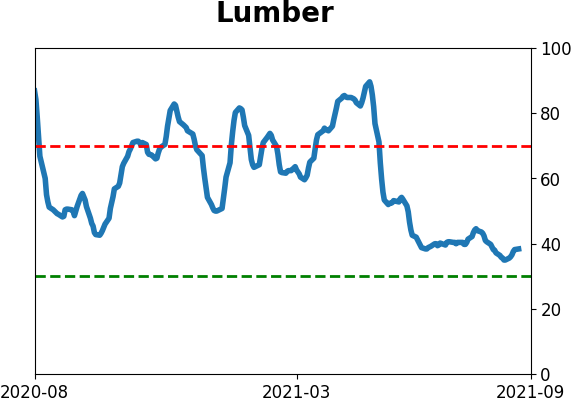
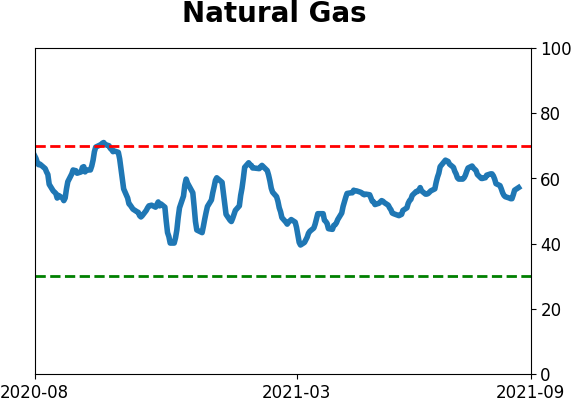
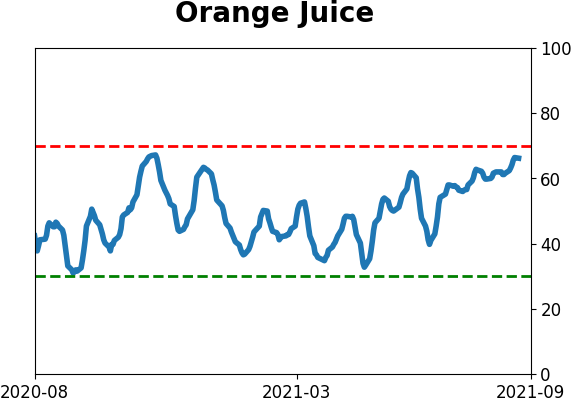
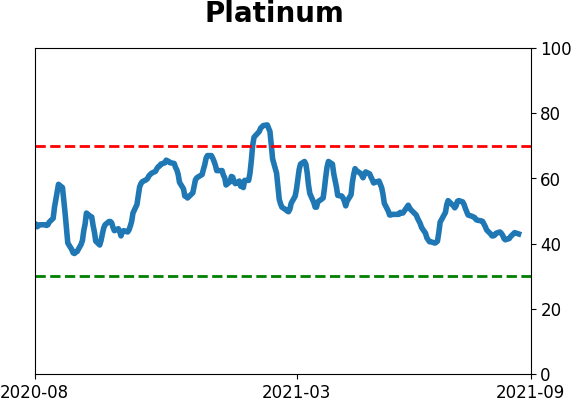
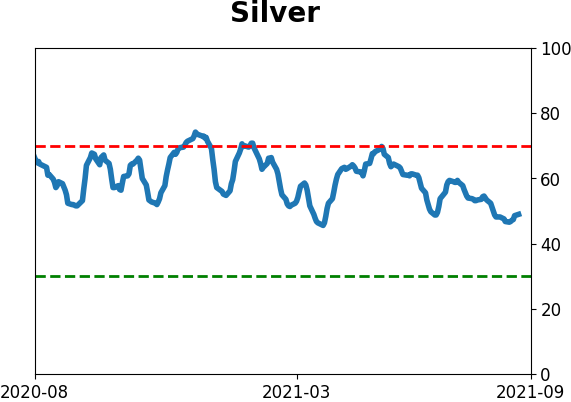
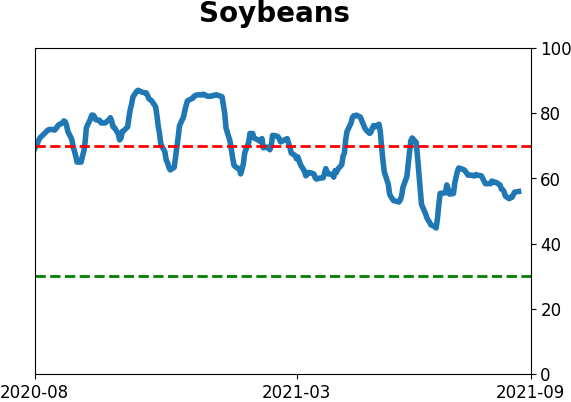
Optimism Index Thumbnails
|
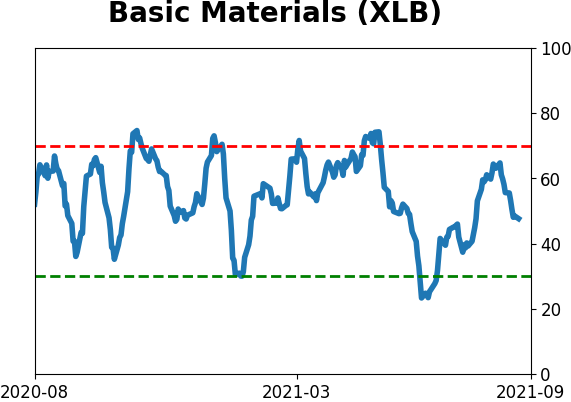
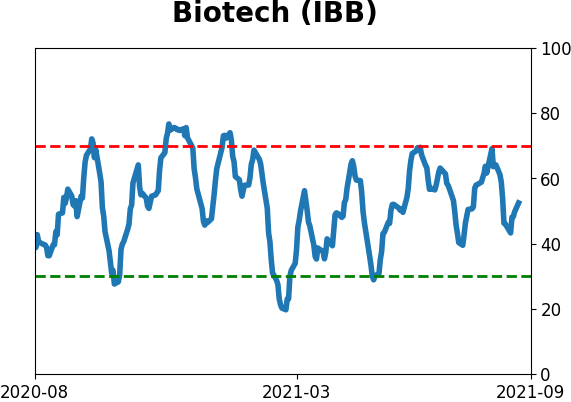
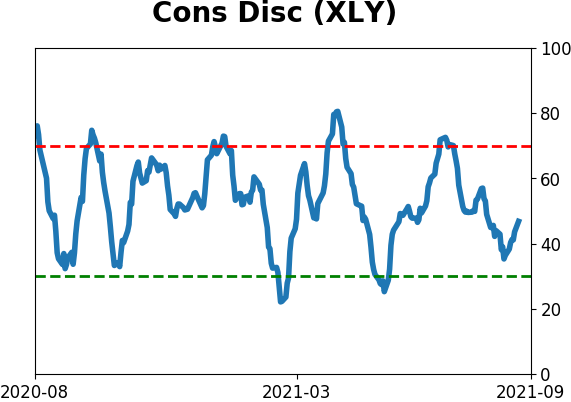
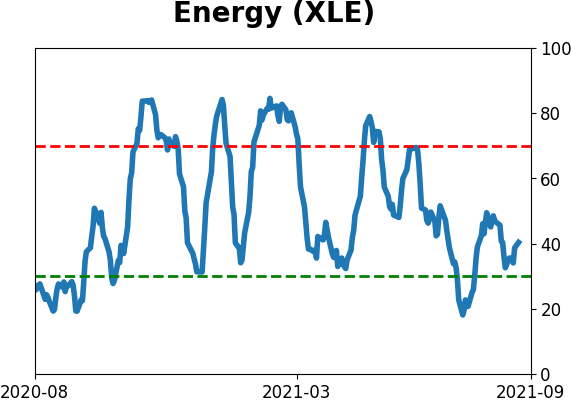
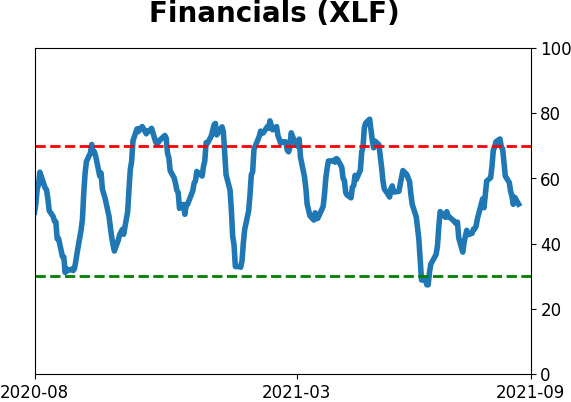
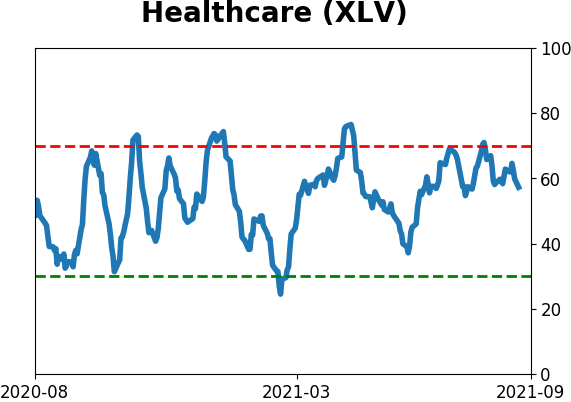
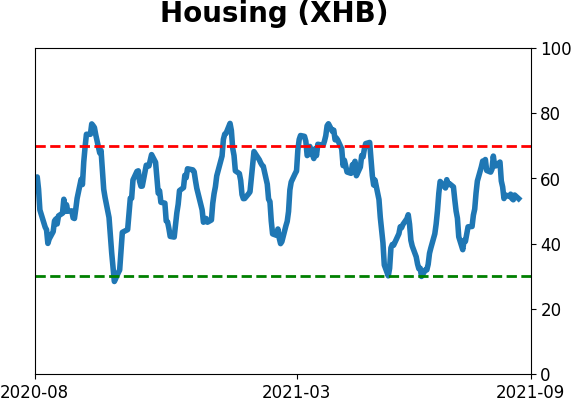
Sector ETF's - 10-Day Moving Average
|
|
|
Country ETF's - 10-Day Moving Average
|
|
|
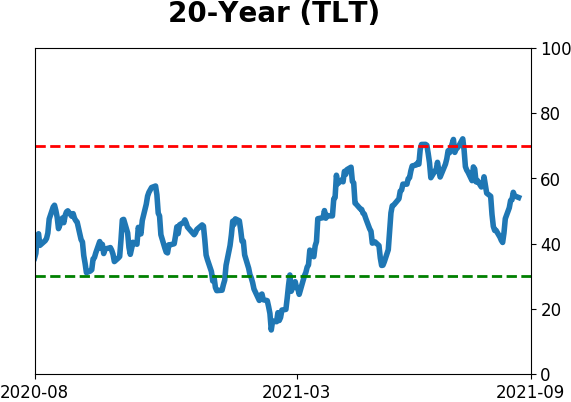
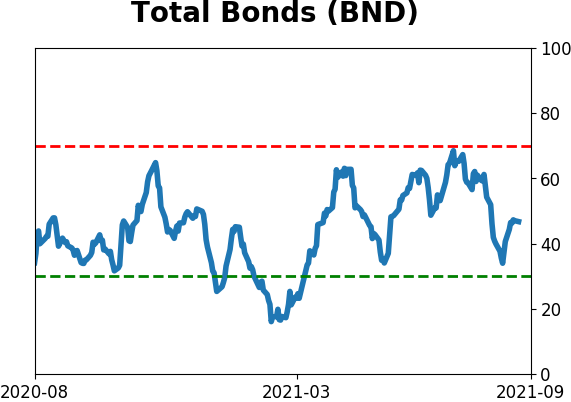
Bond ETF's - 10-Day Moving Average
|
|
|
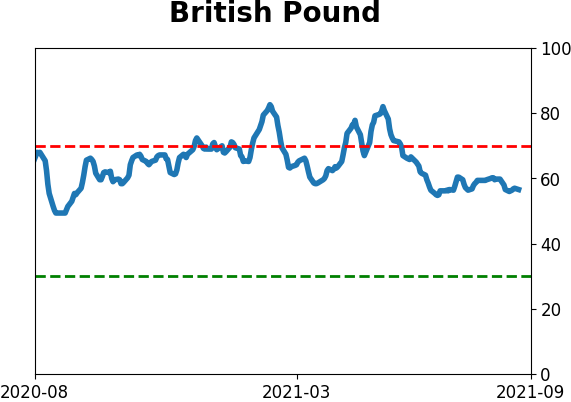
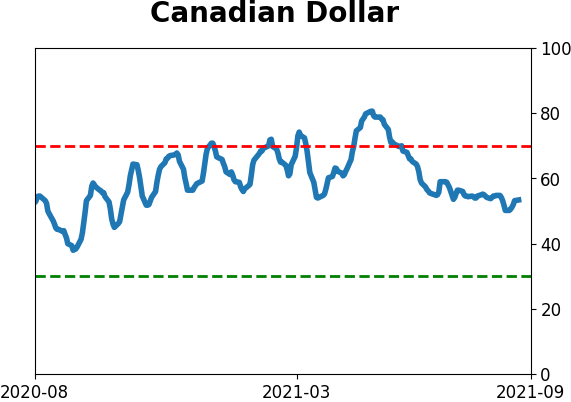
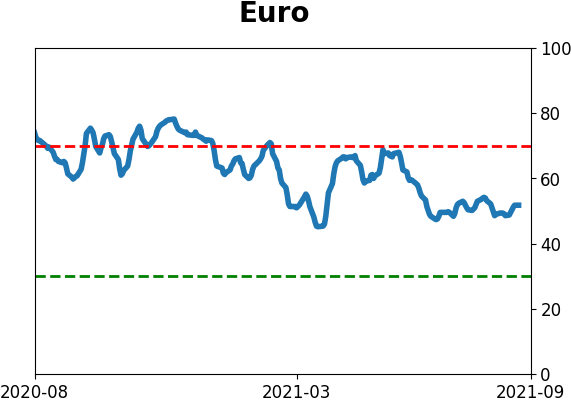
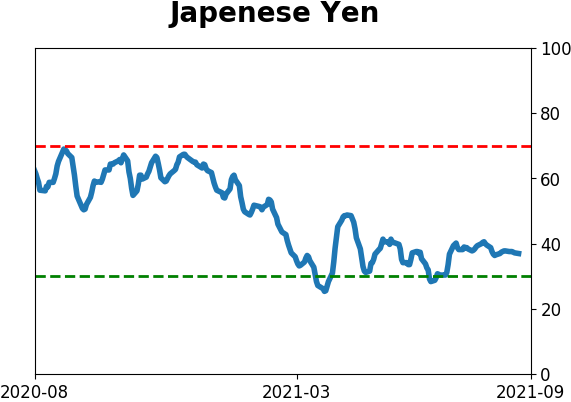
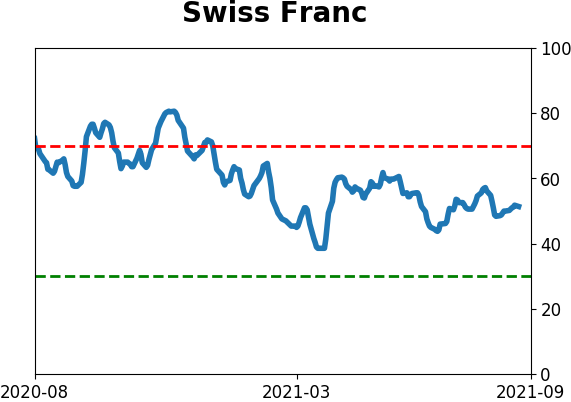
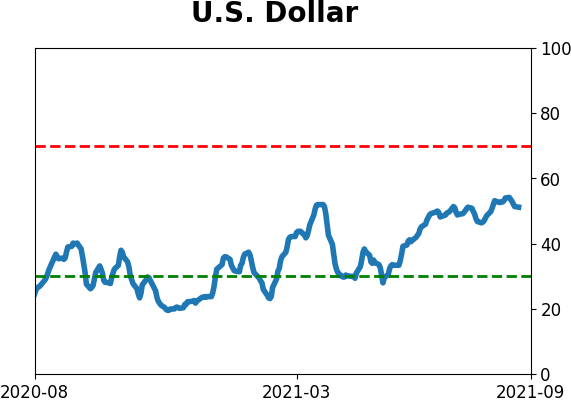
Currency ETF's - 5-Day Moving Average
|
|
|
Commodity ETF's - 5-Day Moving Average
|
|