Headlines
|
|
The recent price pattern in the S&P 500 suggests the uptrend is sustainable:
The Correlation Pattern Match tool now includes a trend filter. A CPM study found 85 other S&P 500 periods that mirrored the last 18 sessions, with the index above its 200-day average. Similar price patterns produced favorable returns and consistency for the world's most benchmarked index, suggesting the uptrend persists.
|
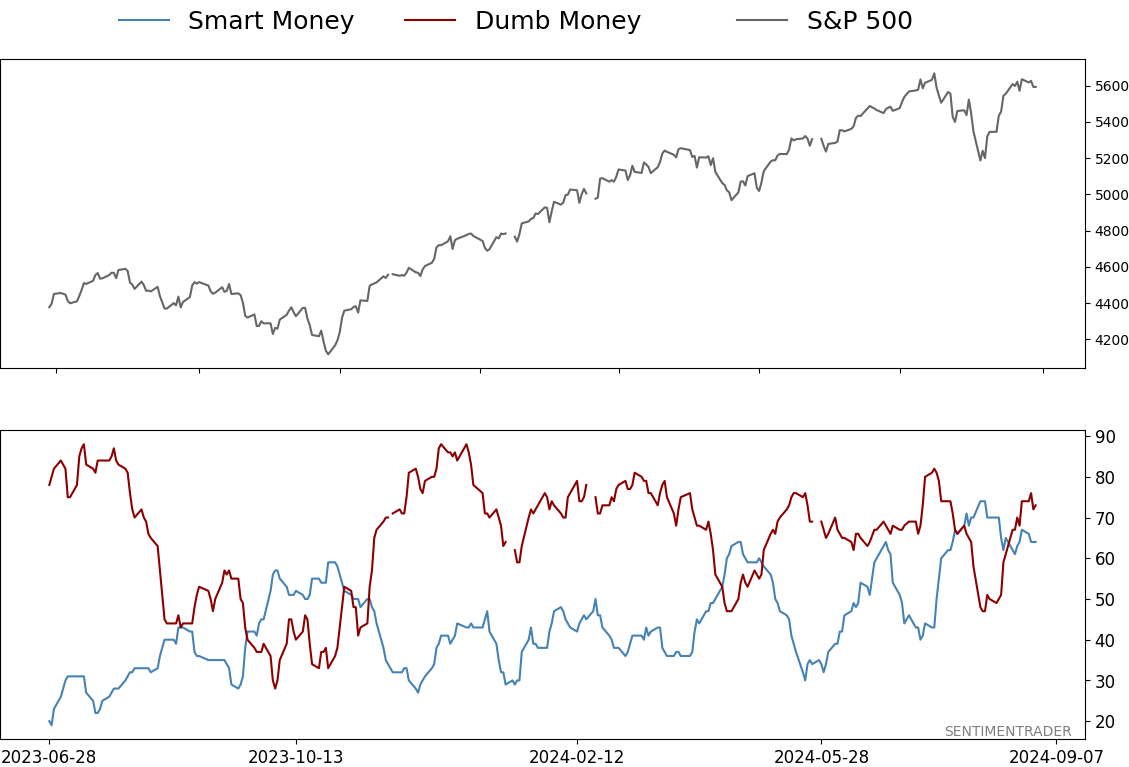
Smart / Dumb Money Confidence
|
Smart Money Confidence: 64%
Dumb Money Confidence: 73%
|
|
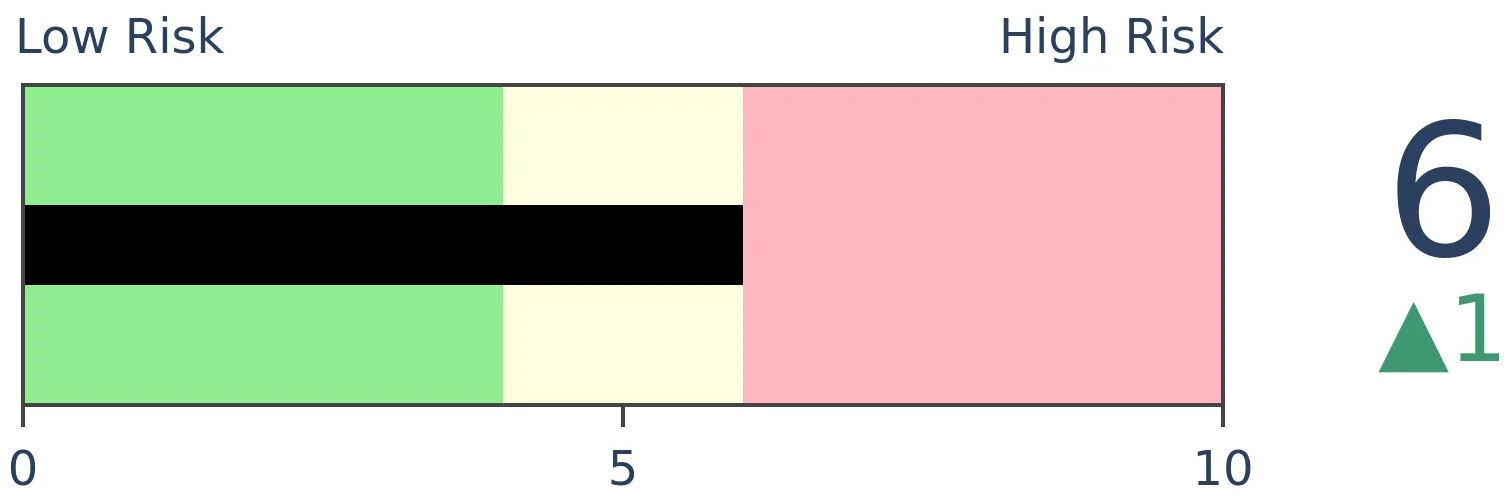
Risk Levels
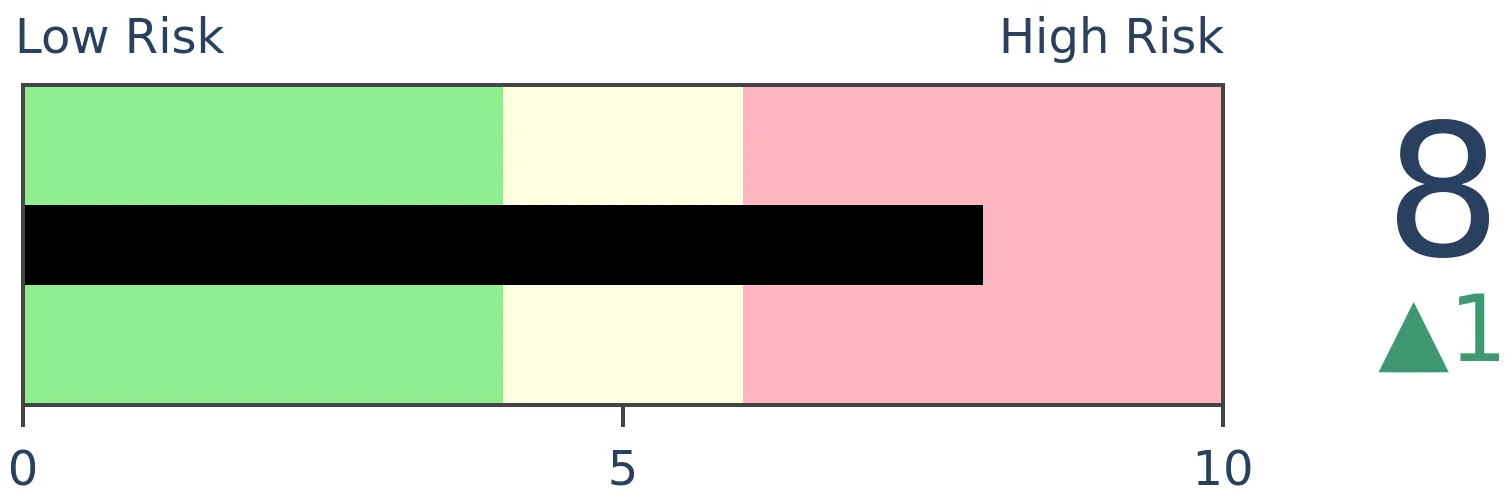
Stocks Short-Term
|
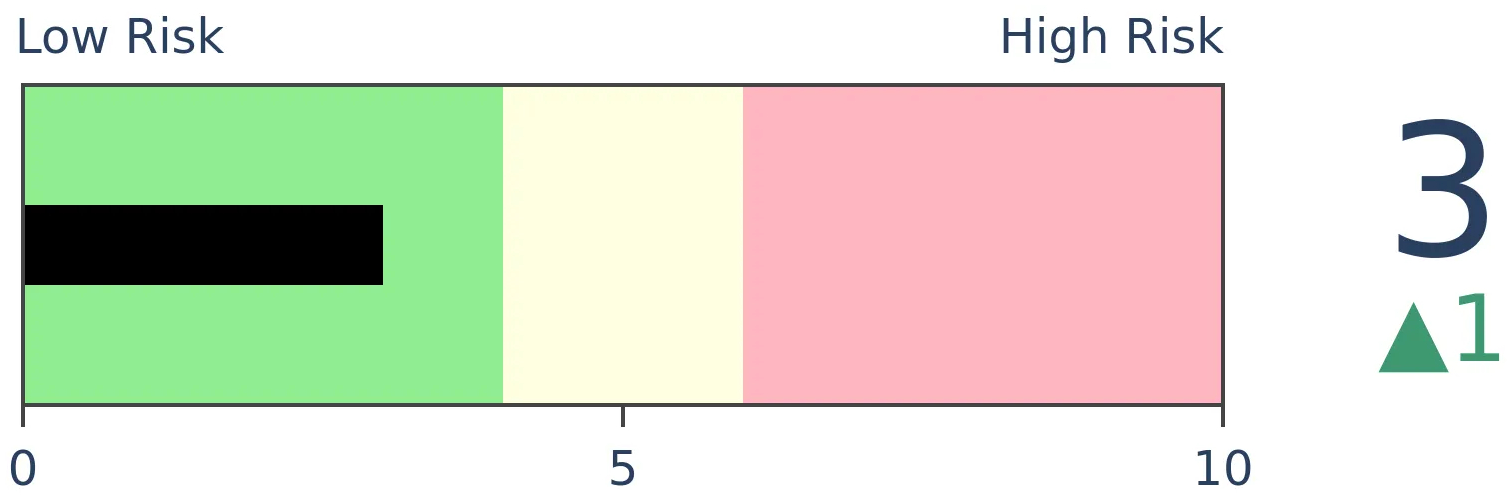
Stocks Medium-Term
|
|
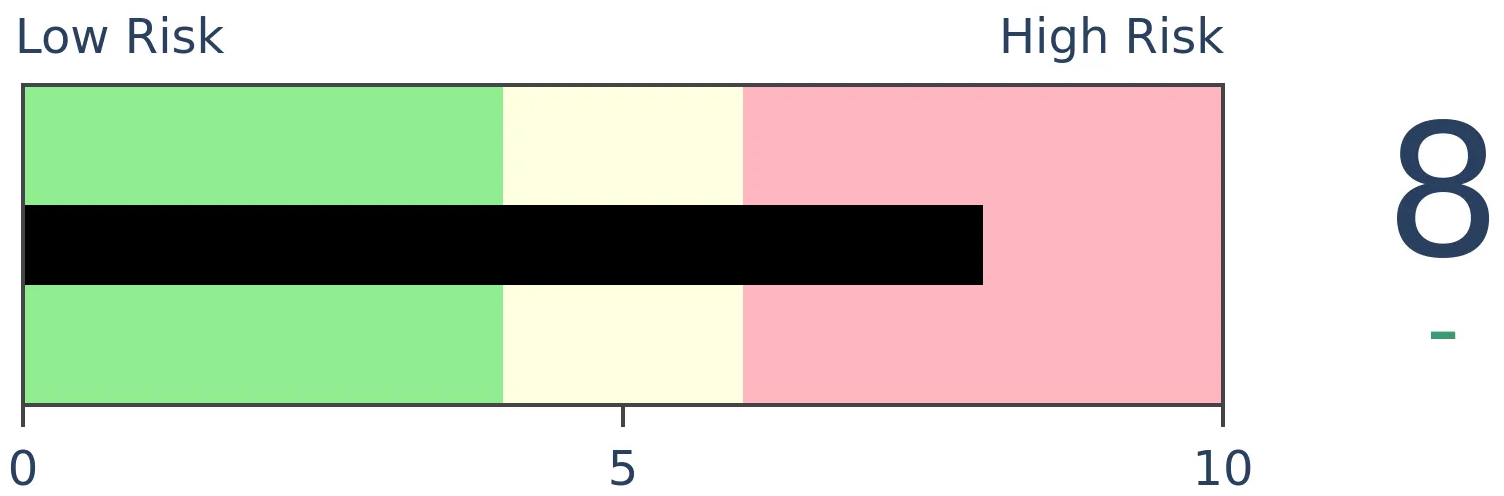
Bonds
|
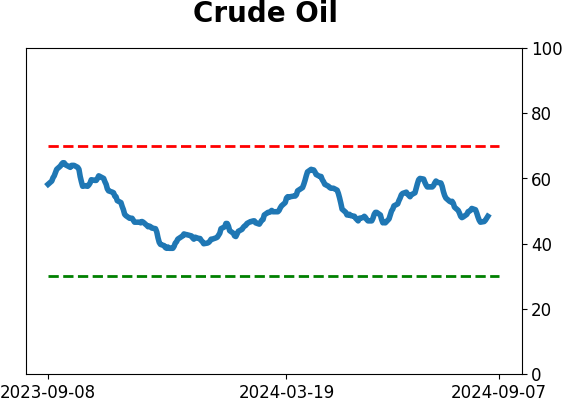
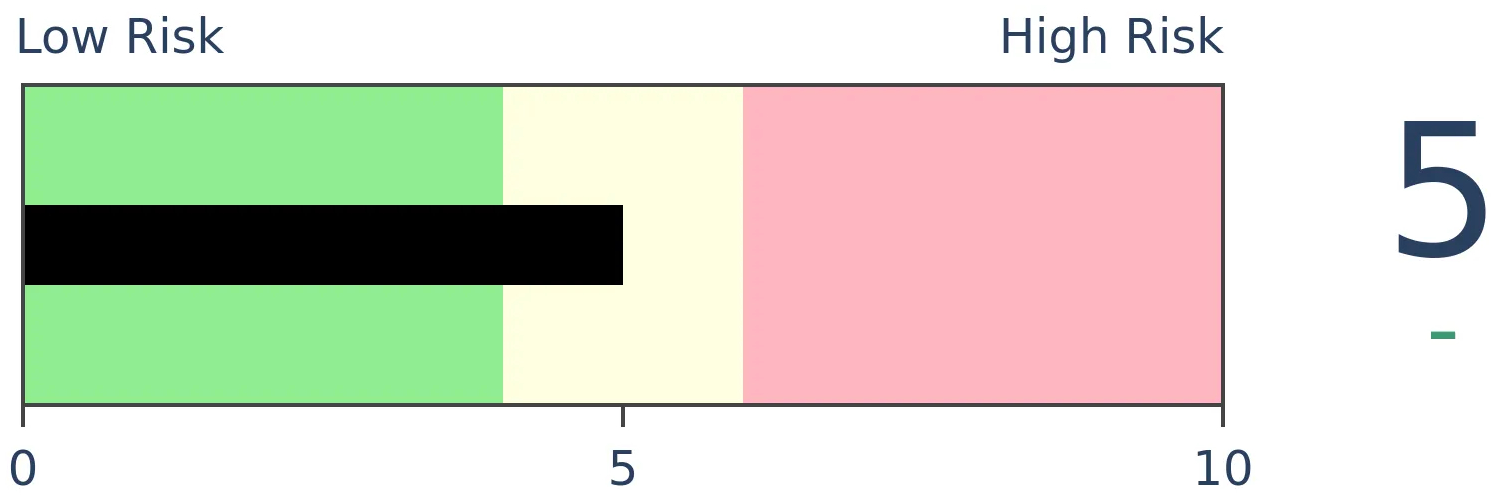
Crude Oil

|
|
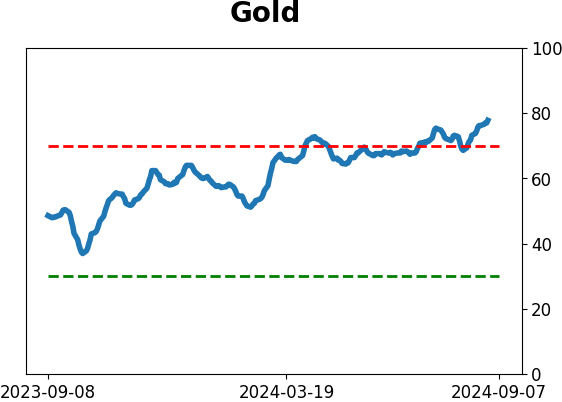
Gold
|
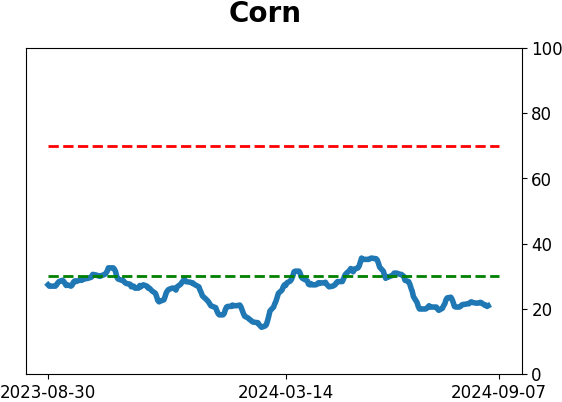
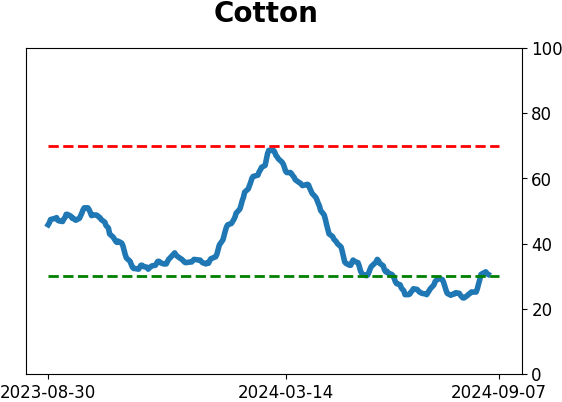
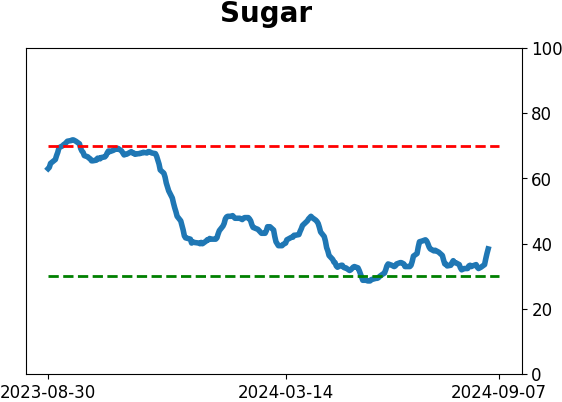
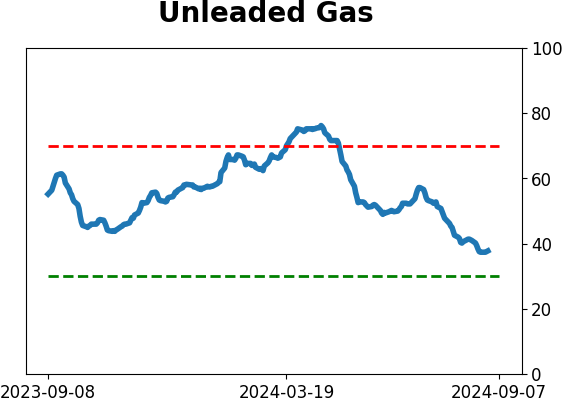
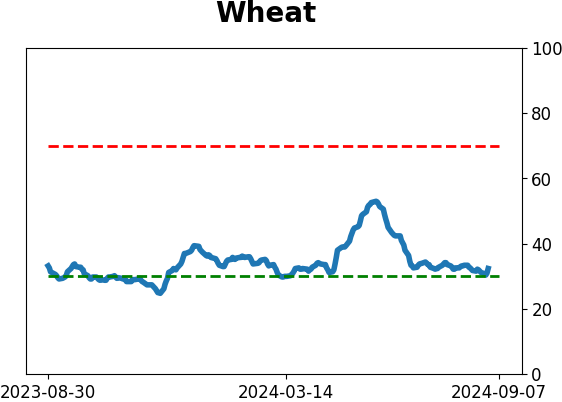
Agriculture
|
|
Research
By Dean Christians
BOTTOM LINE
The Correlation Pattern Match tool now includes a trend filter. A CPM study found 85 other S&P 500 periods that mirrored the last 18 sessions, with the index above its 200-day average. Similar price patterns produced favorable returns and consistency for the world's most benchmarked index, suggesting the uptrend persists.
FORECAST / TIMEFRAME
None
|
Key points:
- The Correlation Pattern Match tool now includes a trend filter, adding valuable context to the analysis
- A CPM study found 85 other S&P 500 periods that mirrored the last 18 sessions with a 98% correlation
- Similar correlations, with the S&P 500 above its 200-day average, suggest the uptrend in stocks persists
If history rhymes, the S&P 500 should continue to trend higher
I strongly encourage those who haven't used our Correlation Pattern Match software to do so. This tool excels in price pattern analysis and serves as an additional resource to our backtest engine, allowing users to assess the likely outcome of historical patterns from a risk/reward perspective.
Our programming team continues to innovate, and the latest upgrade to the CPM includes a trend filter feature.
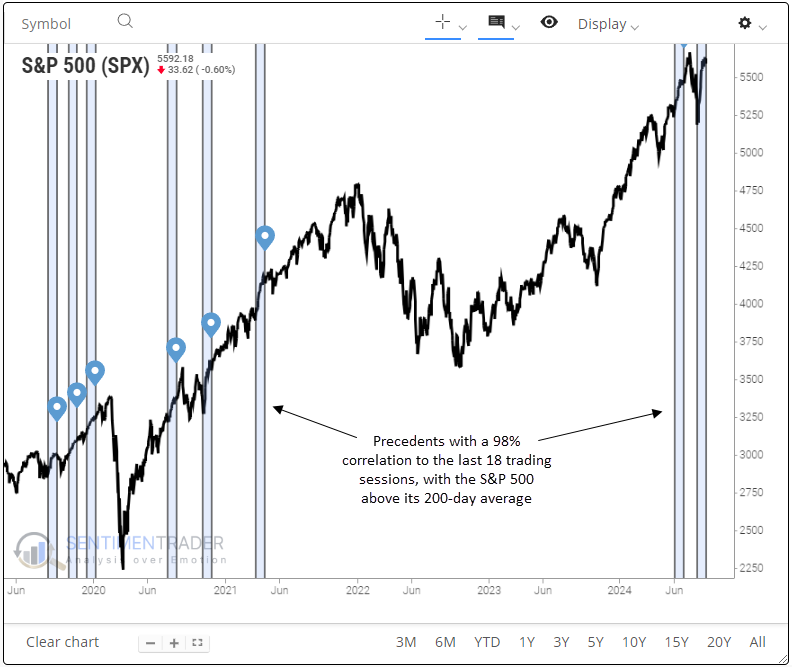
Given this new enhancement, let's examine all other periods that match the previous 18 sessions for the S&P 500 with a 98% correlation when the S&P 500 traded above its 200-day average. The CPM displays a blue background on the chart wherever pattern matches are detected.
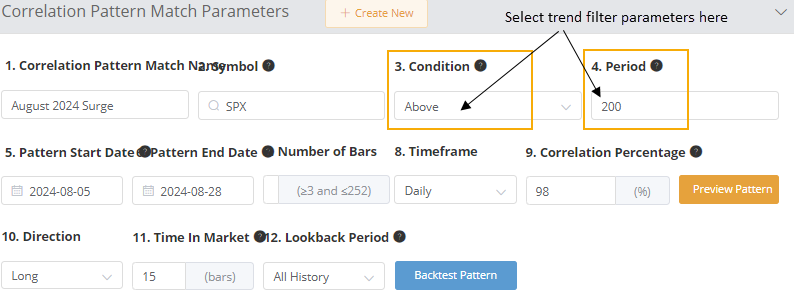
A user-friendly interface
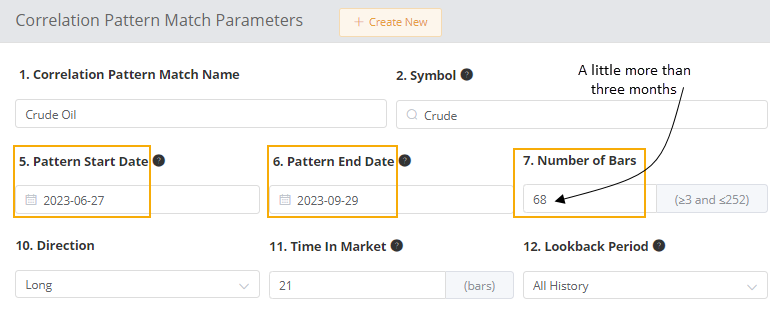
The CPM parameters interface now features a dedicated section for the trend filter. Users can choose above or below and set the moving average to any desired duration.
Similar correlations in a long-term uptrend preceded positive returns
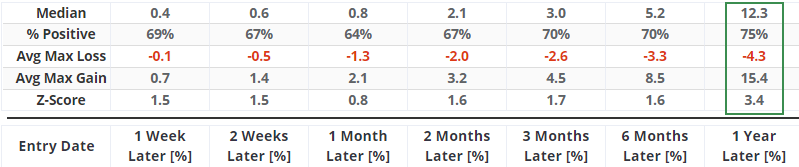
Following a 98% correlation match to the last 18 sessions when the S&P 500 exceeded its 200-day average, the world's most benchmarked index displayed a consistent upward bias over the following year. While the 1-year time frame is the only interval to show significance relative to random returns, several other horizons exceeded 1.5, suggesting a favorable environment but not an overwhelming edge.
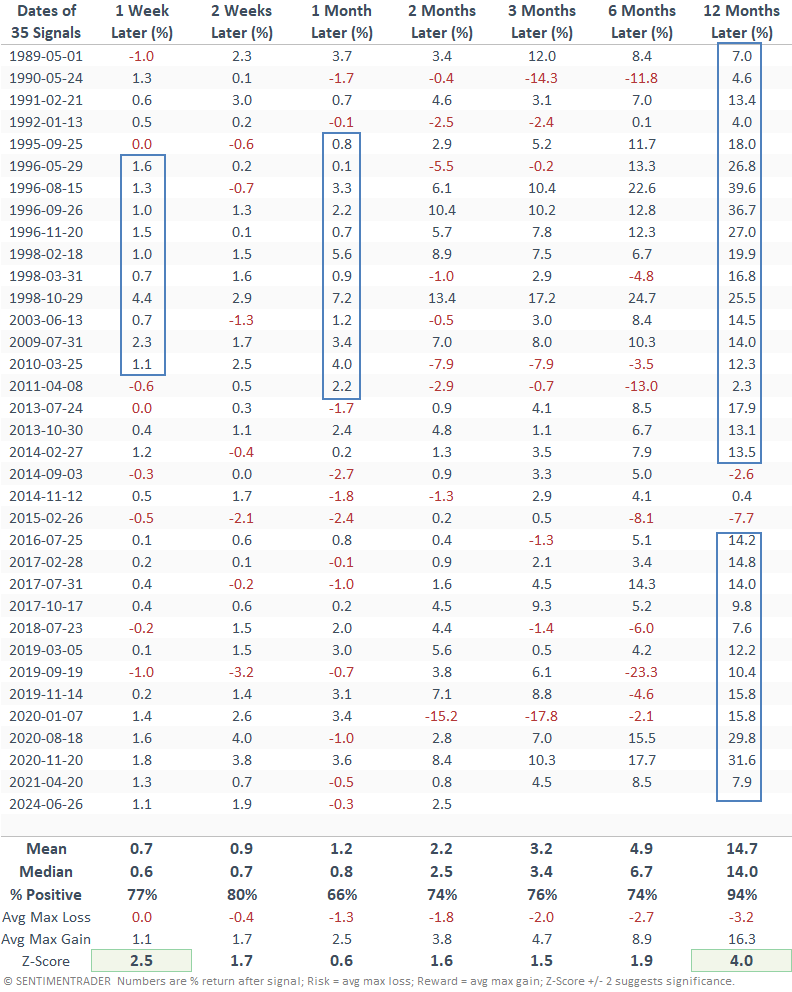
More recent signals
Suppose we examine precedents since 1989. In that case, the current price pattern has achieved more favorable returns and consistency over the last 35 years, with several win streaks surpassing ten consecutive gains.
In the following year, the S&P 500 increased 94% of the time, suggesting that these sharp price accelerations above the 200-day moving average were associated with sustainable long-term uptrends. As always, one-year time frames are susceptible to some volatility in between, and this one is no different, with nine maximum losses exceeding -10% since 1989.
An example of how I stumbled upon a notable pattern in crude oil
A significant benefit of the CPM is its versatility. Users aren't required to focus solely on recent daily returns for historical comparisons. The tool allows for the input of specific dates, enabling the assessment of price patterns from different historical points, which can be crucial for identifying unique market trends.
Intrigued by crude oil's potential trajectory following a notable surge in 2023, I used the CPM to analyze the trend over a defined start and end date. The parameters section and accompanying chart below highlight this selected period.
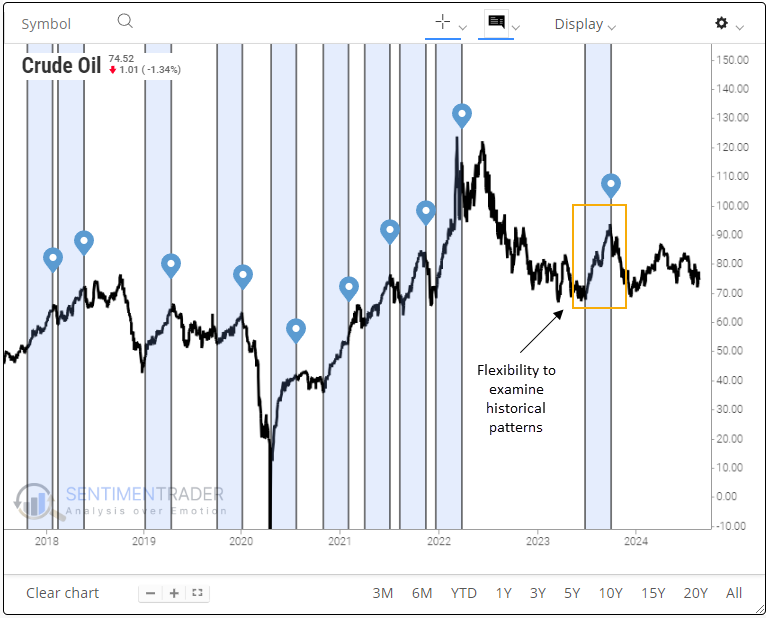
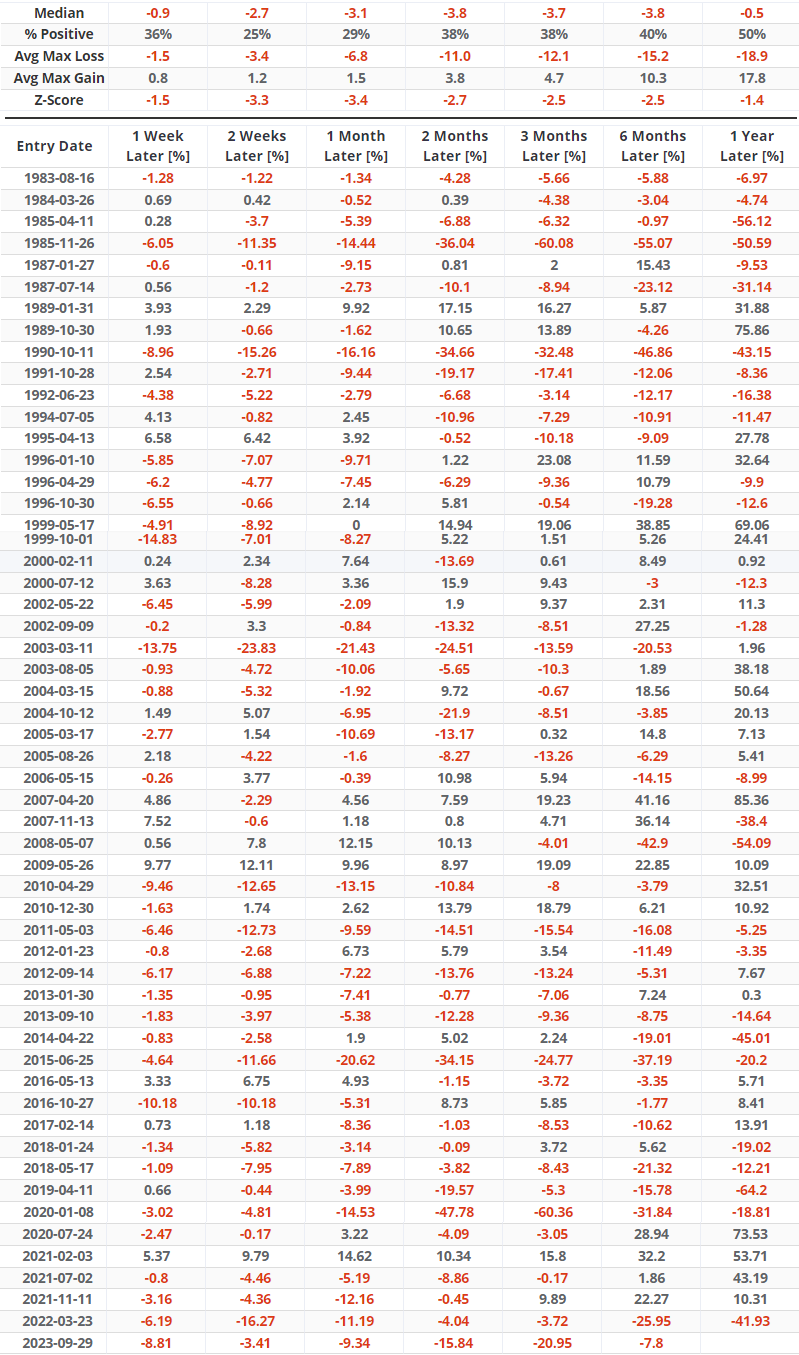
Following similar correlations in crude oil, the outlook for the commodity was abysmal. Consequently, I now understand that when oil rallies in a similar three-month pattern, it's best to avoid the long side of a trade.
What the research tells us...
Over the past 18 sessions, the S&P 500 has surged, gaining in 12 of those 18 days. Using the newly enhanced Correlation Pattern Match tool, which now permits a trend filter condition, the outlook for the world's most benchmarked index suggests the uptrend persists. This has been especially the case since 1989, with the index rising 94% of the time over the subsequent year. For now, investors should give the market the benefit of the doubt as bullish studies continue to outweigh bearish ones.
Indicators at Extremes
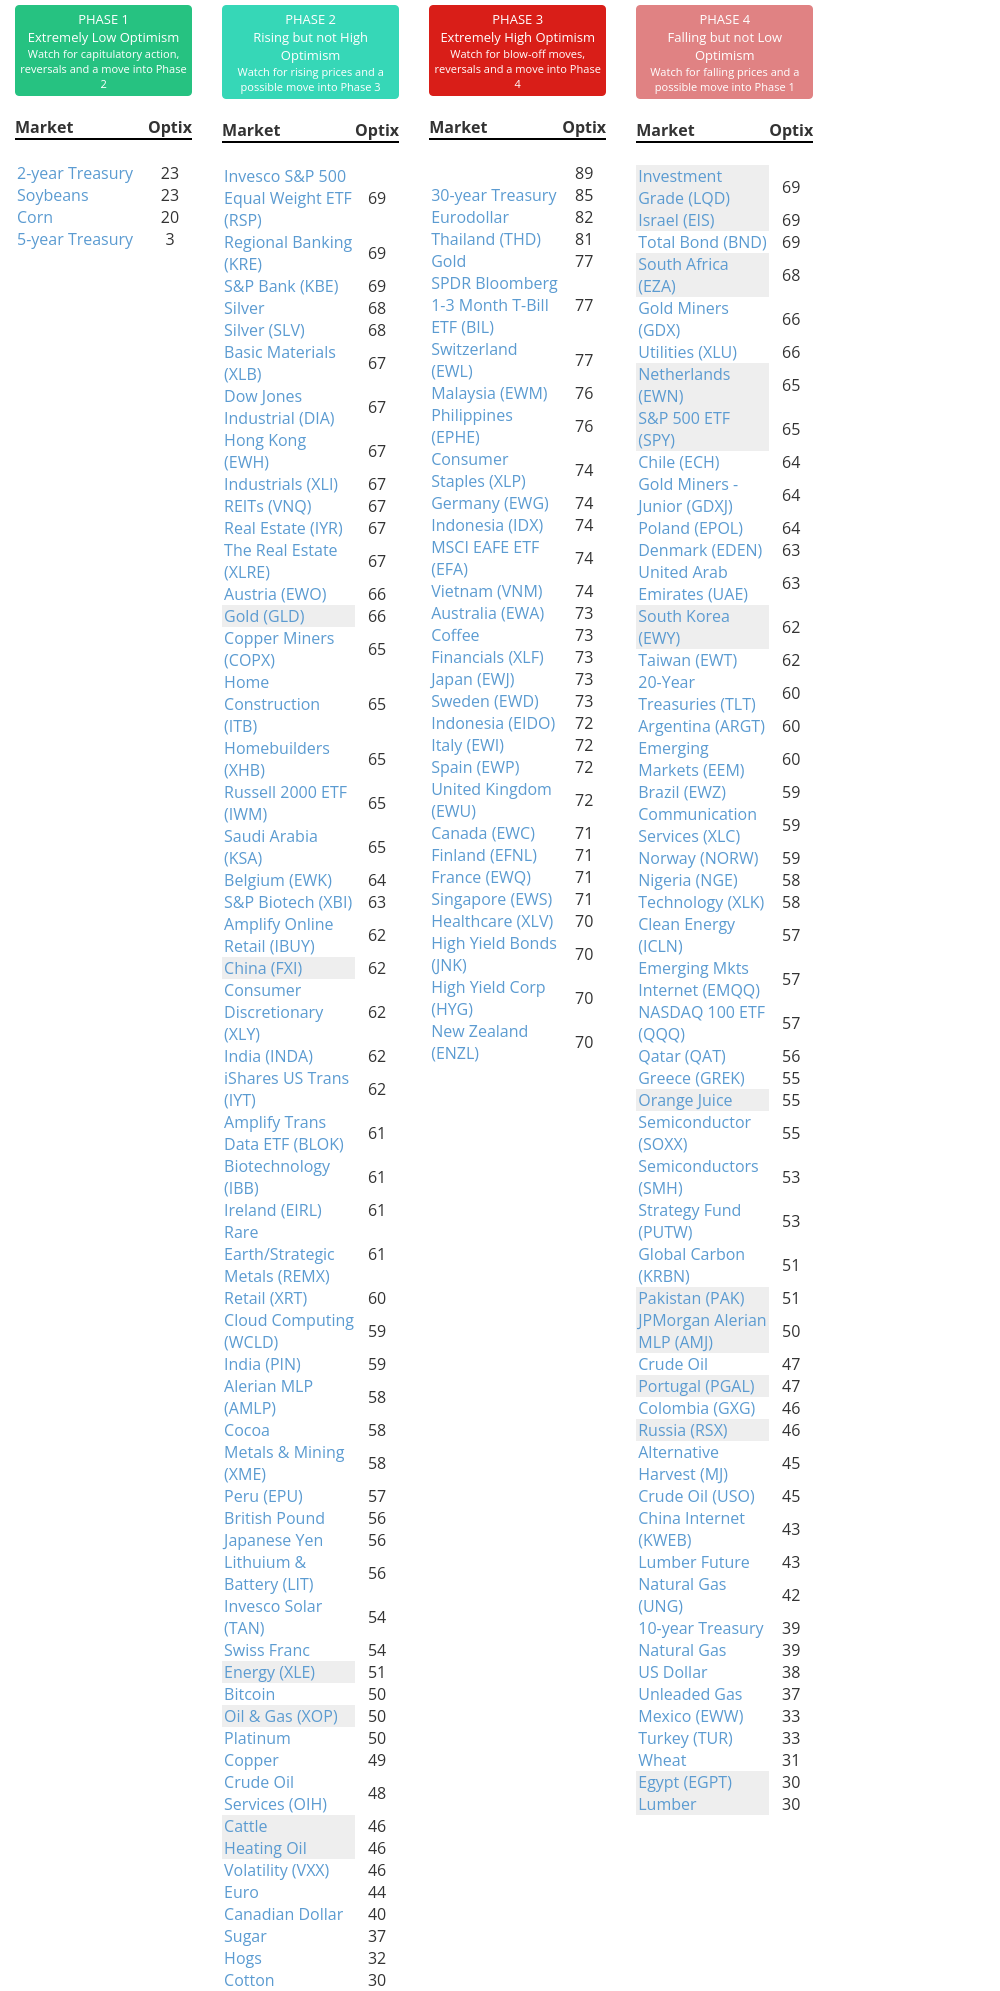
Phase Table
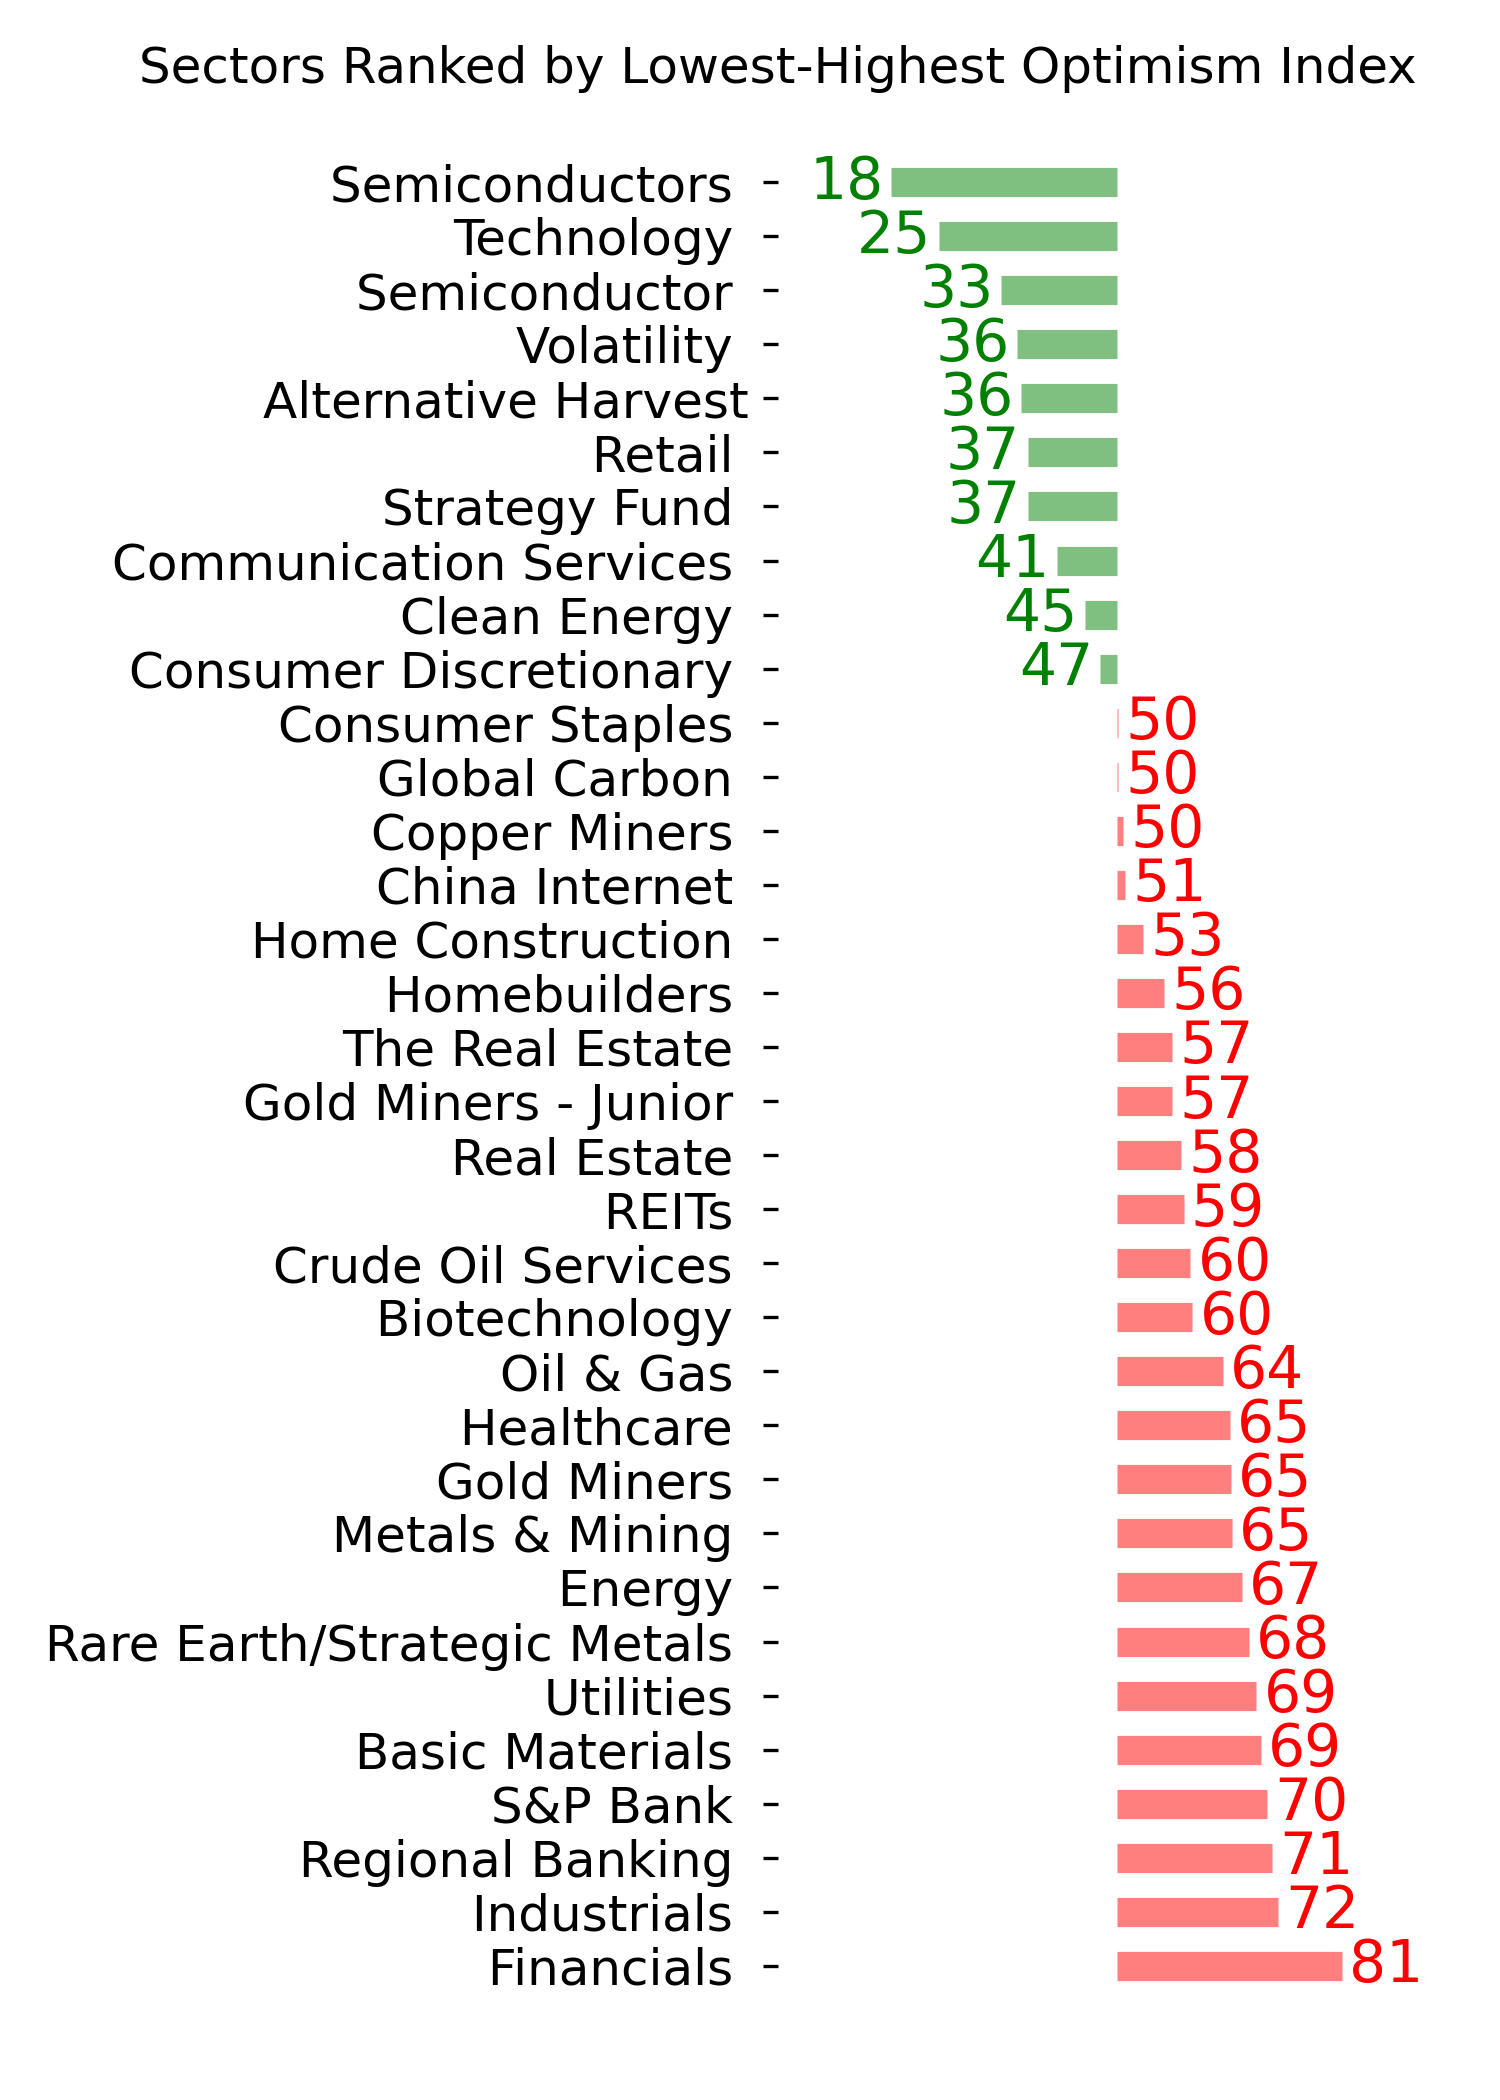
Ranks
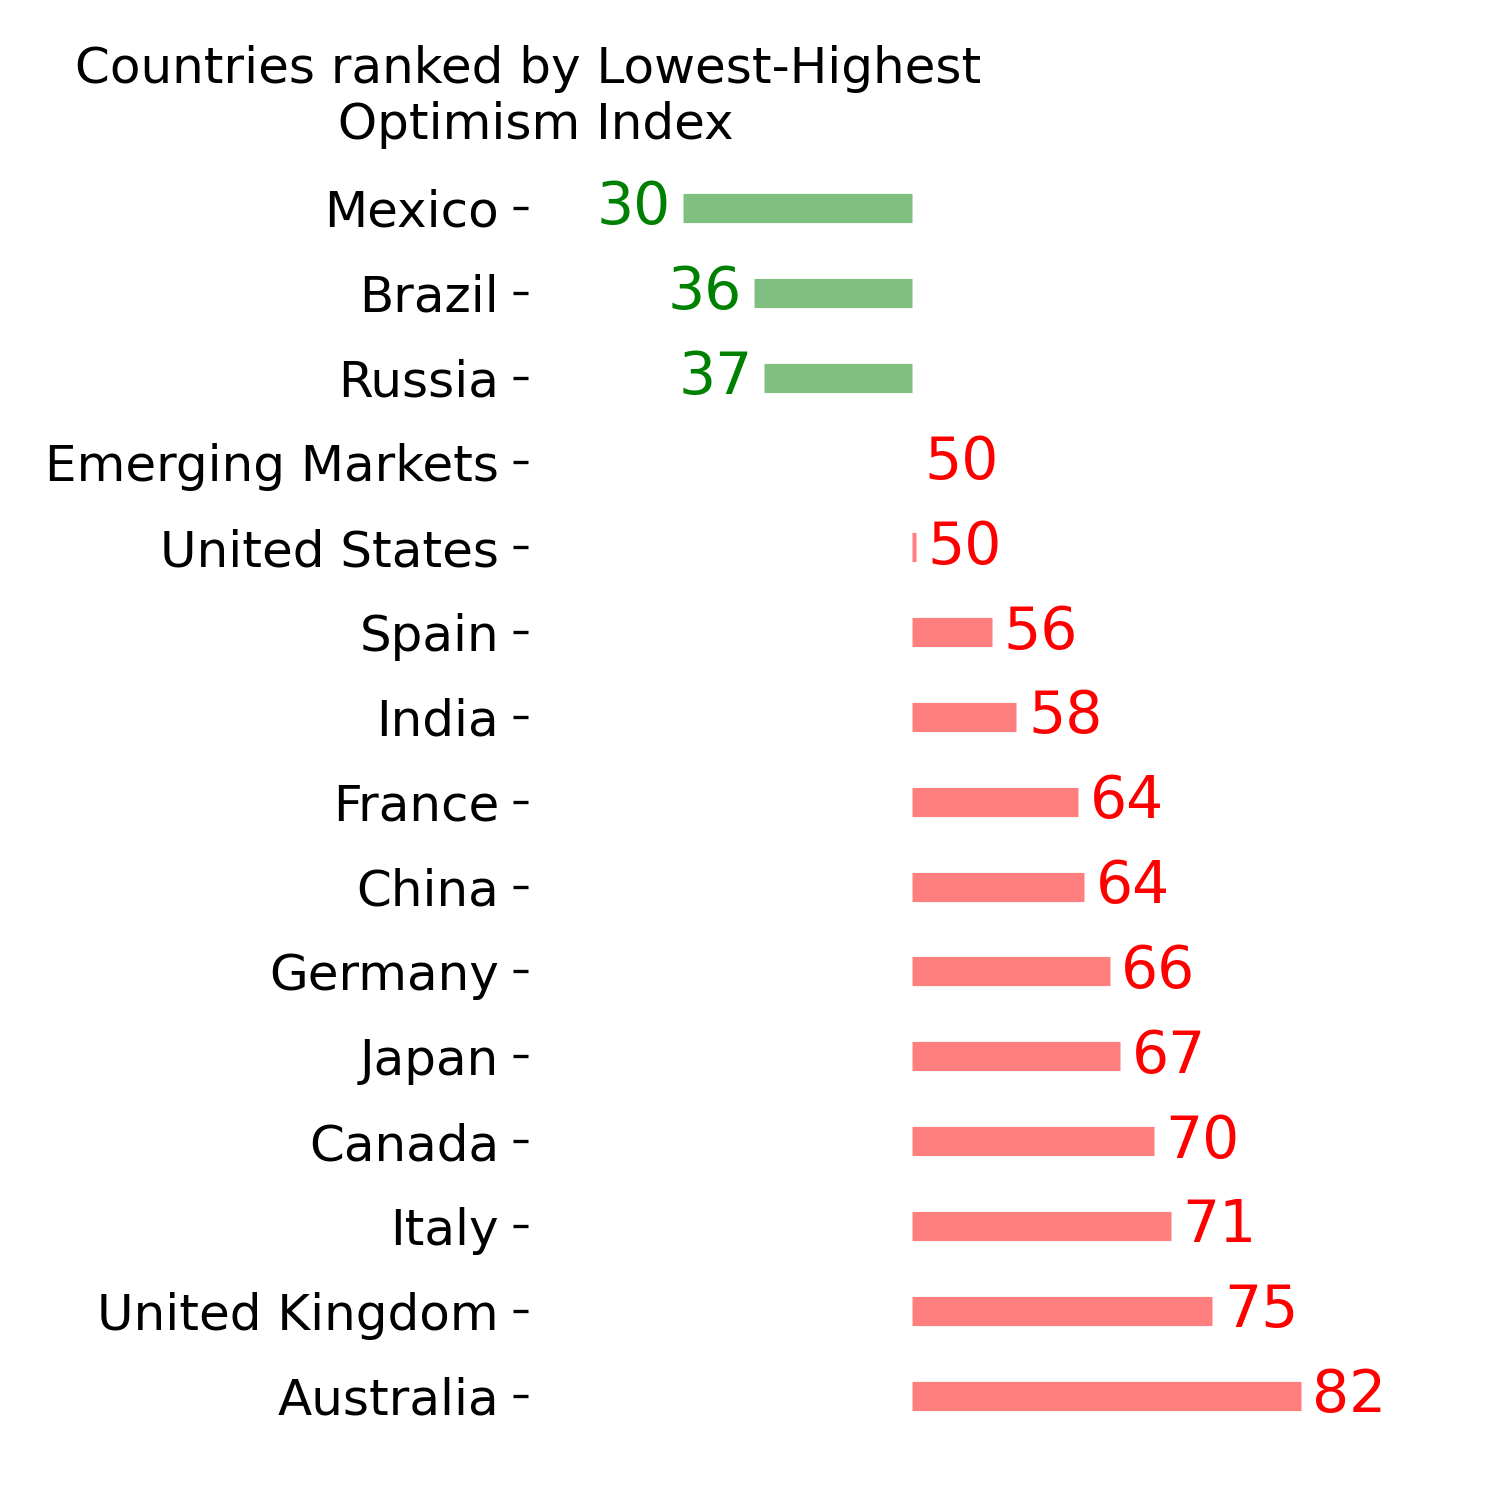
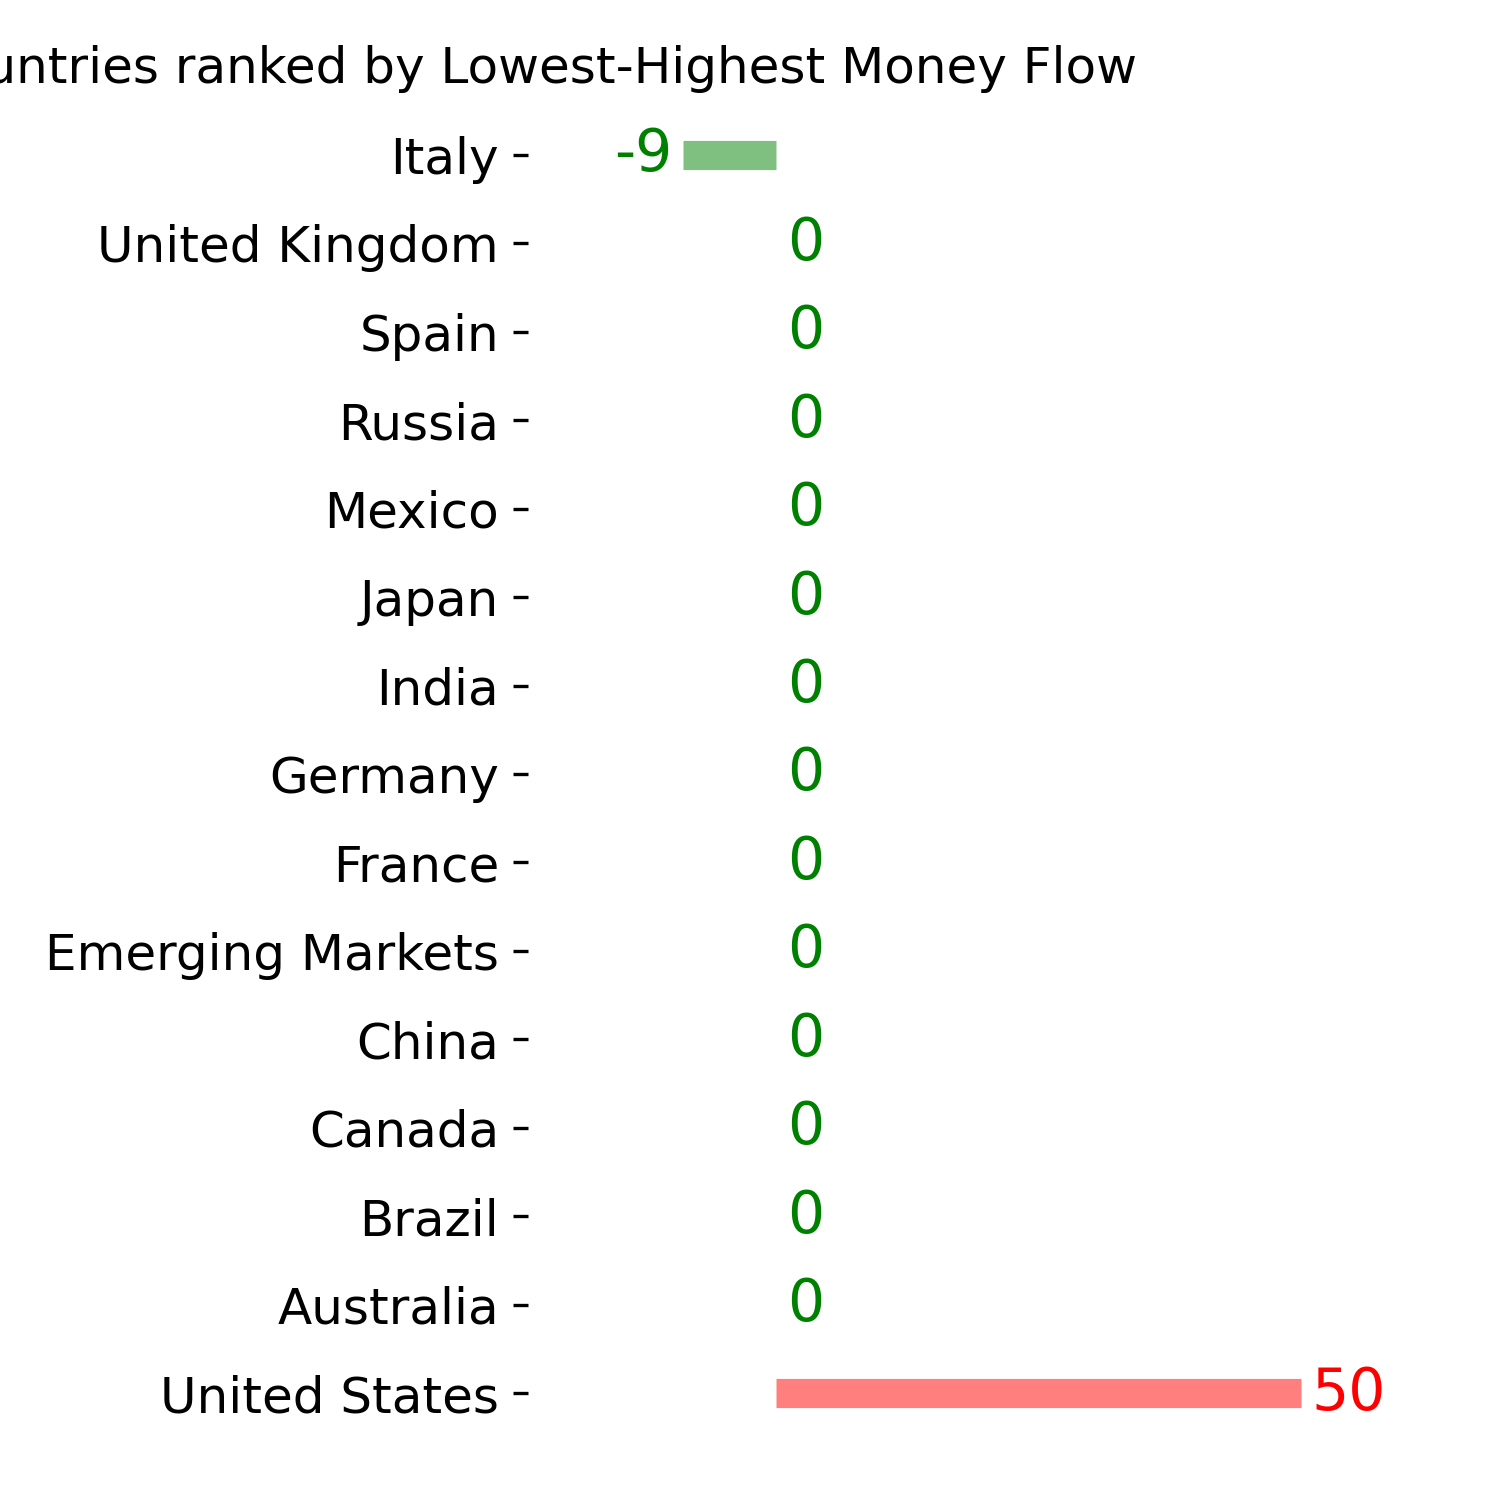
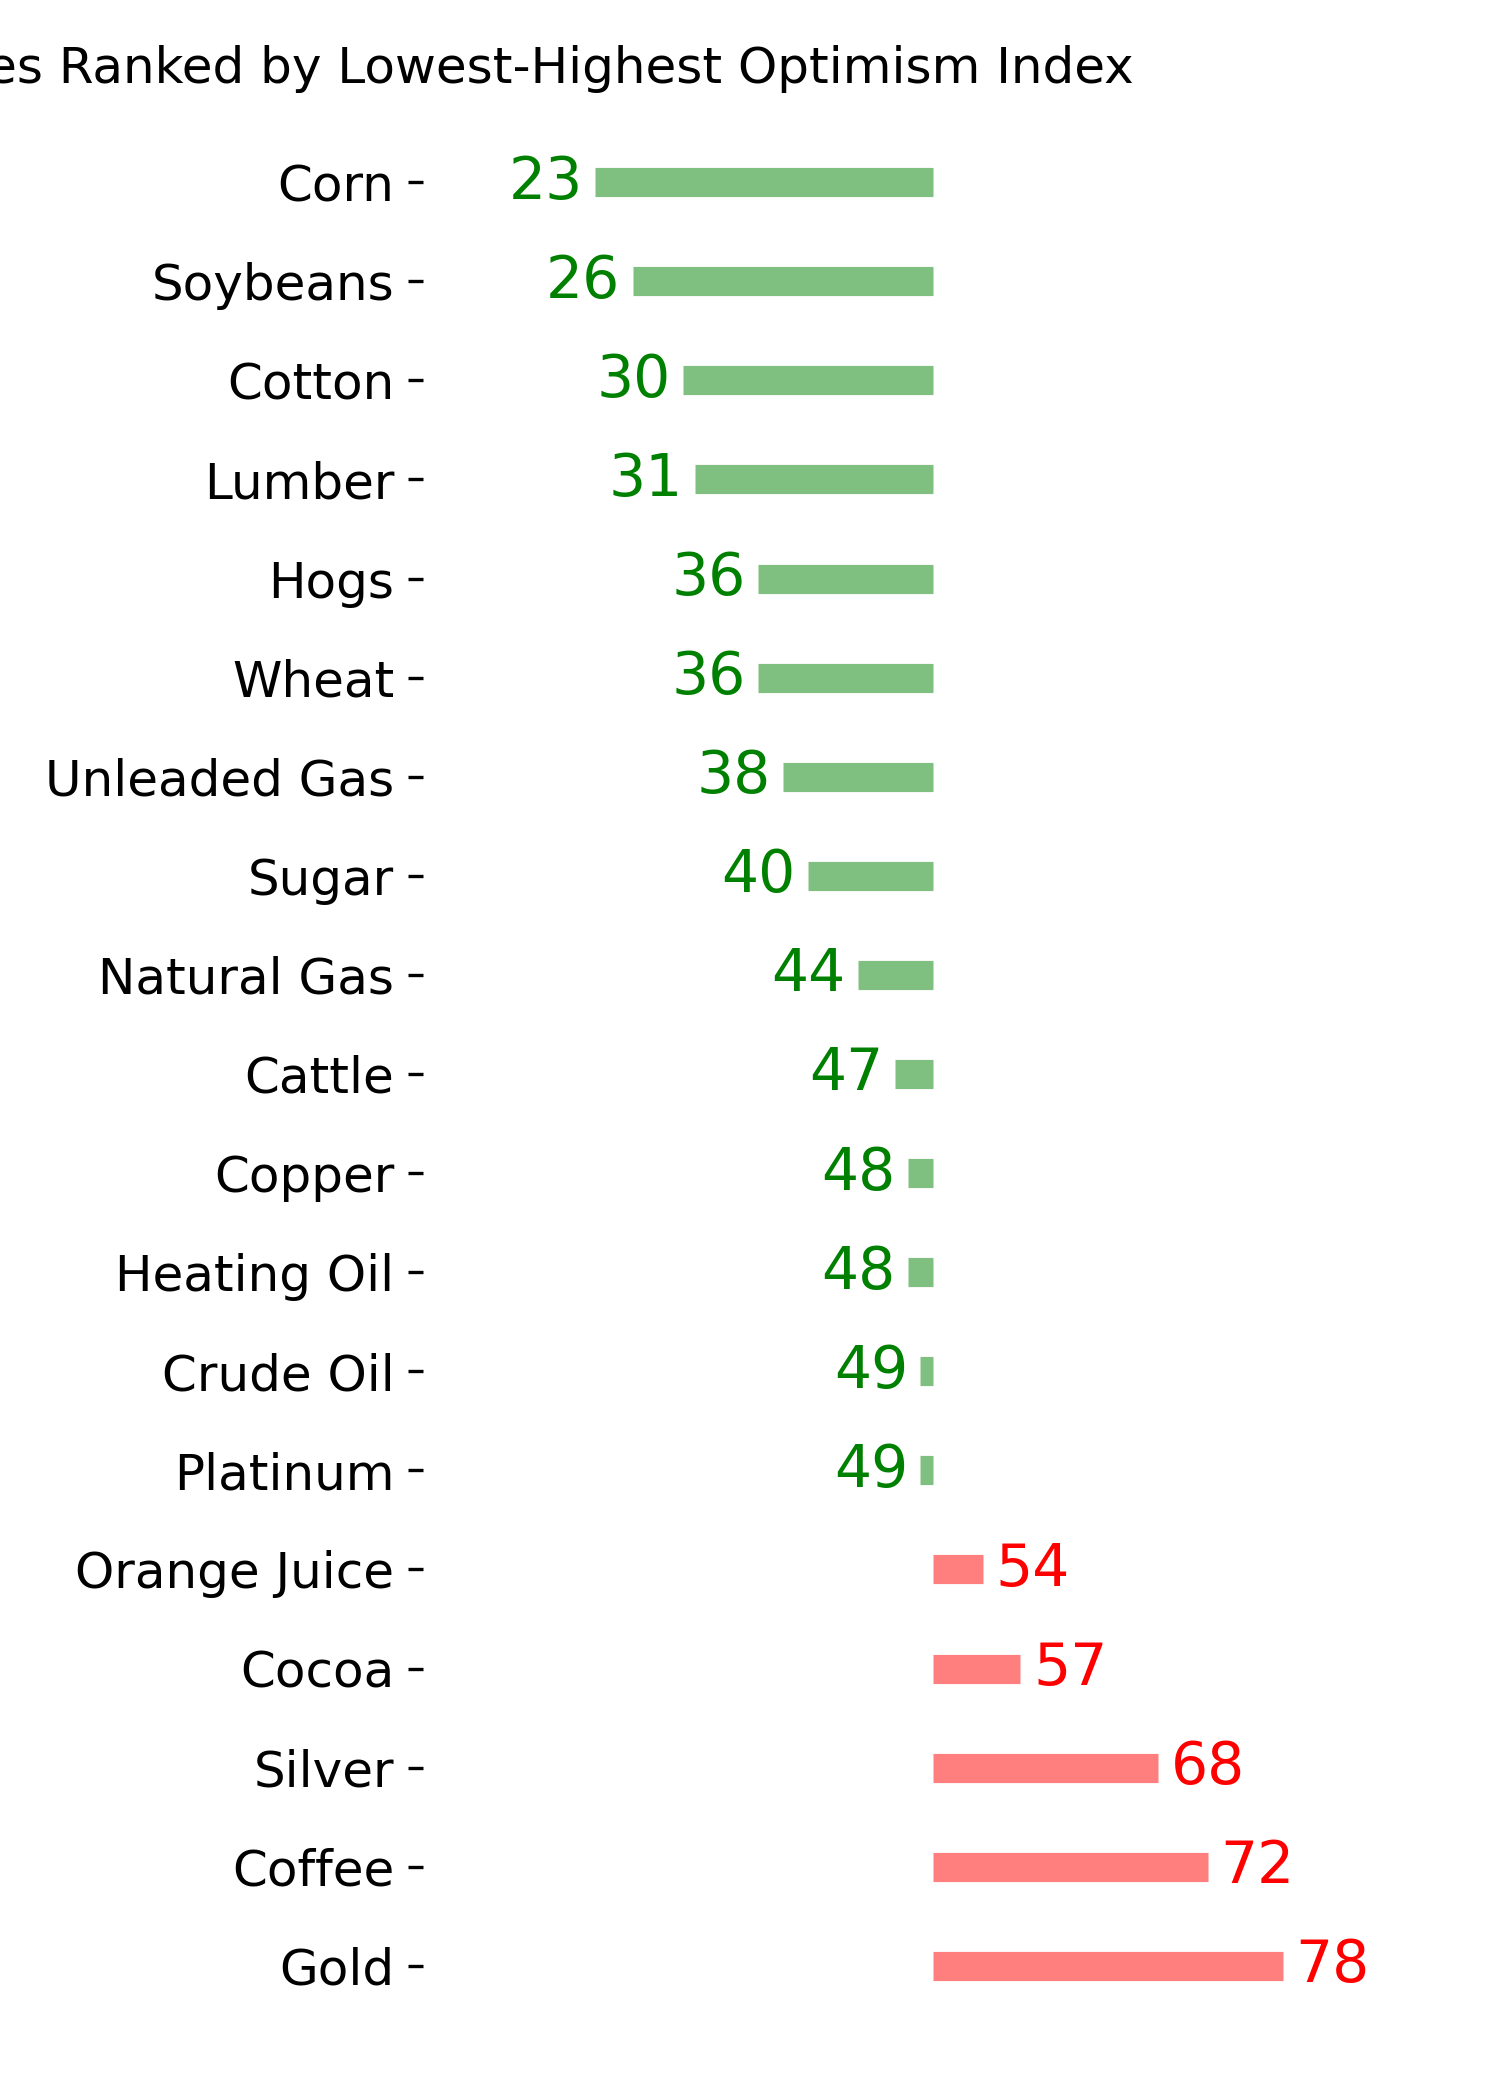
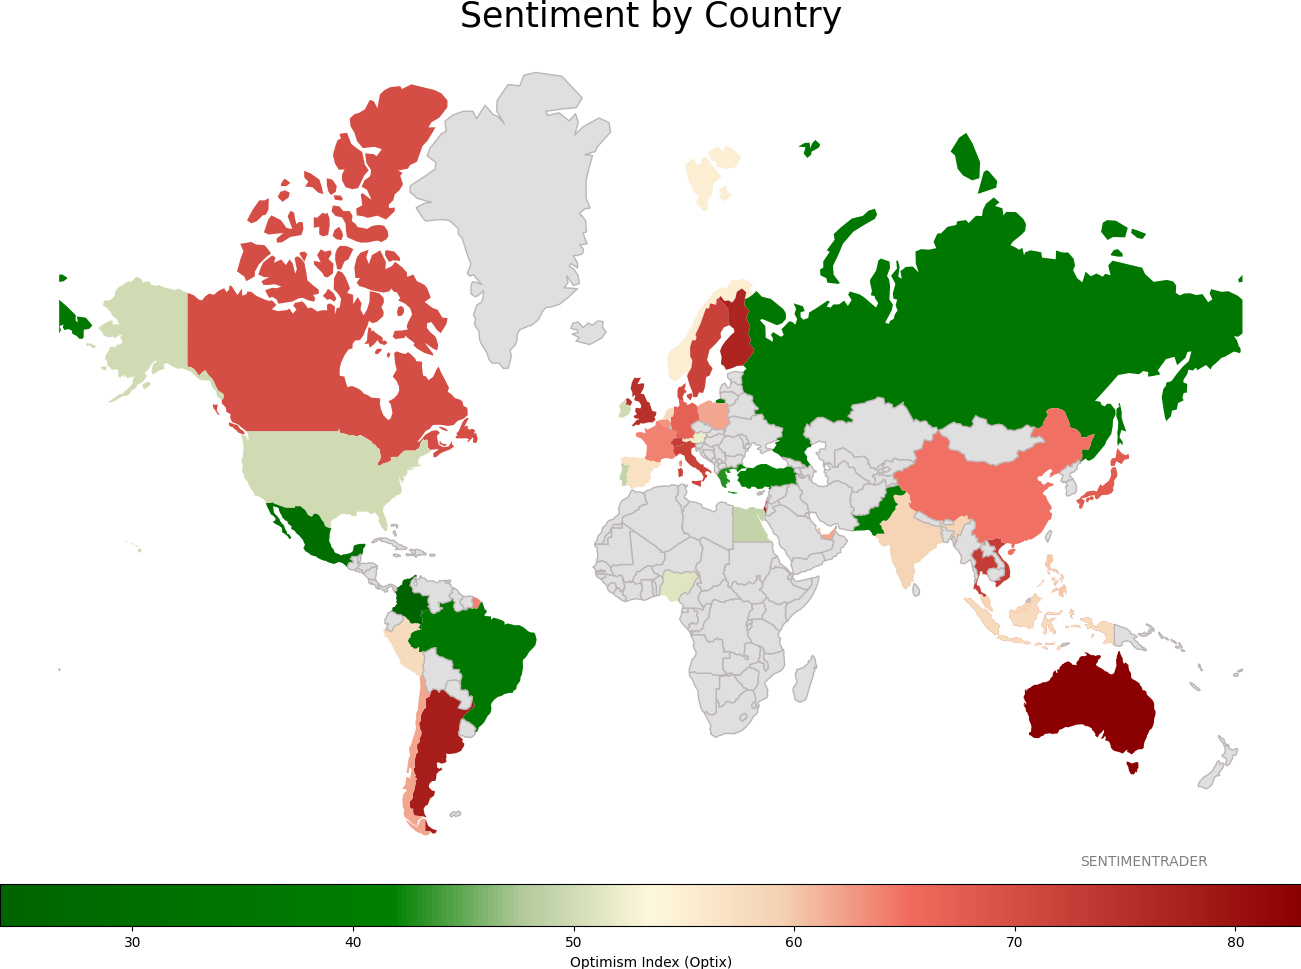
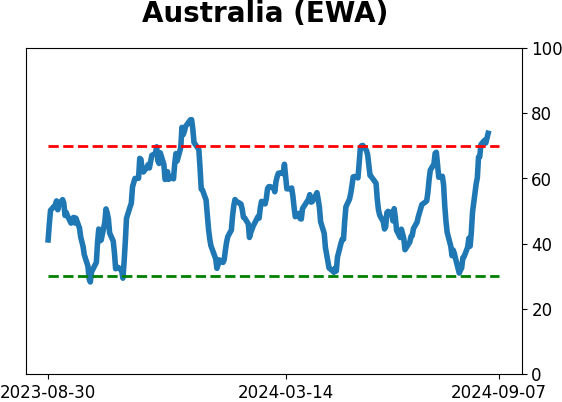
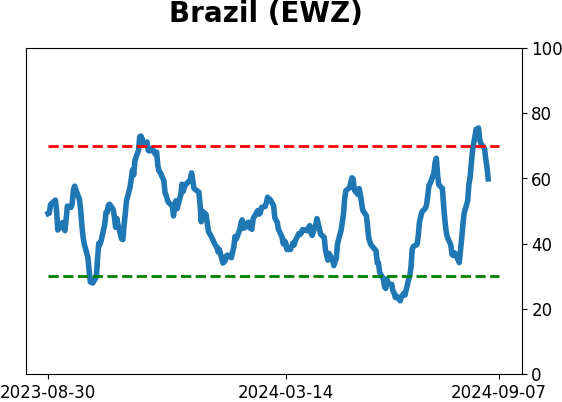
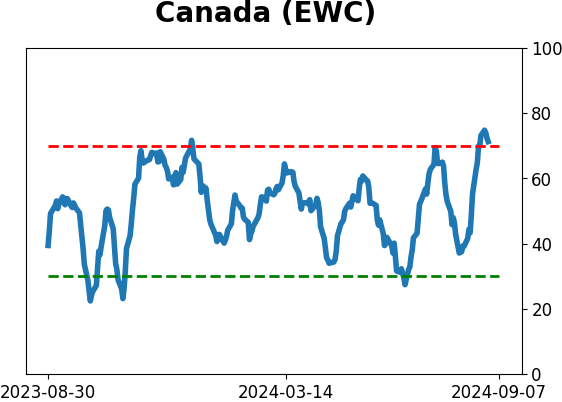
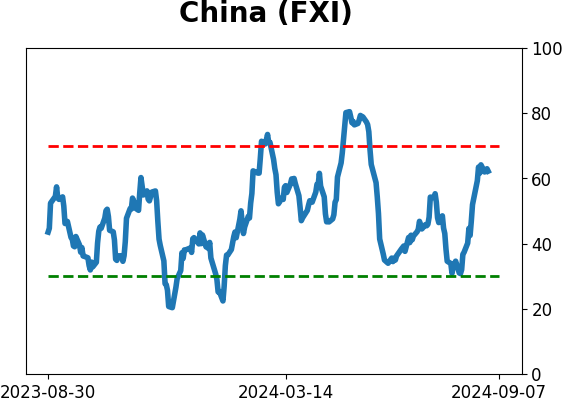
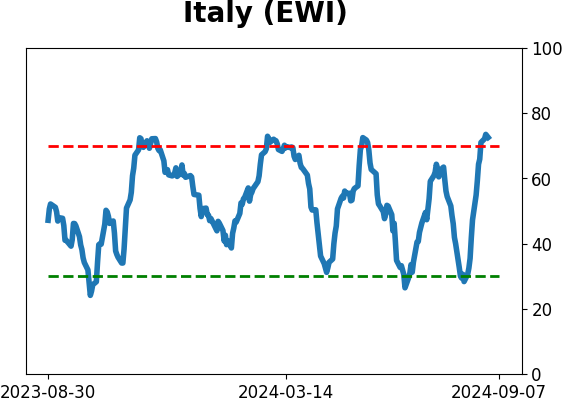
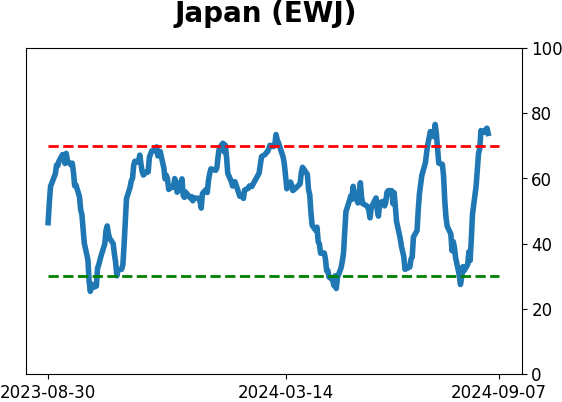
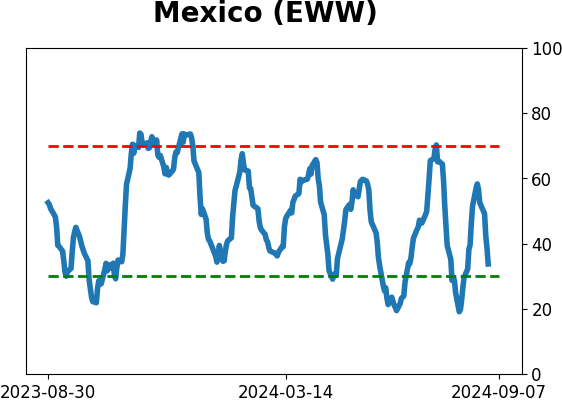
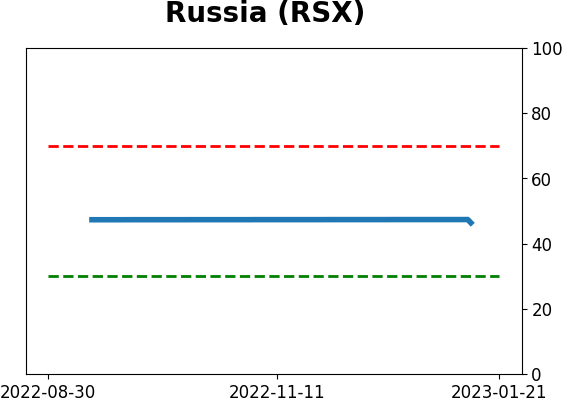
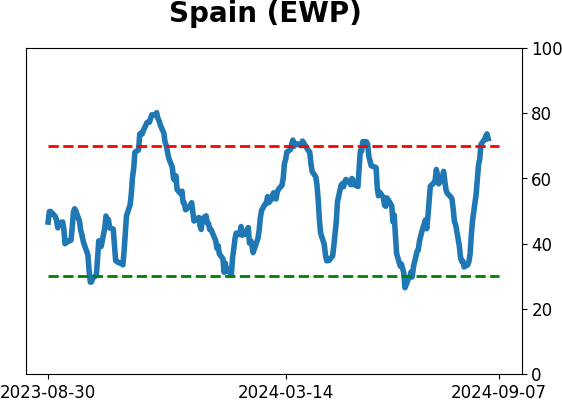
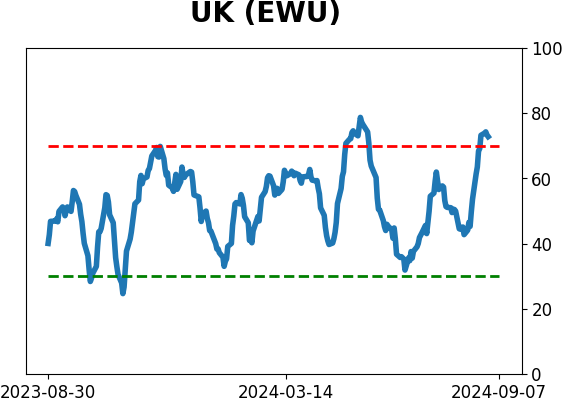
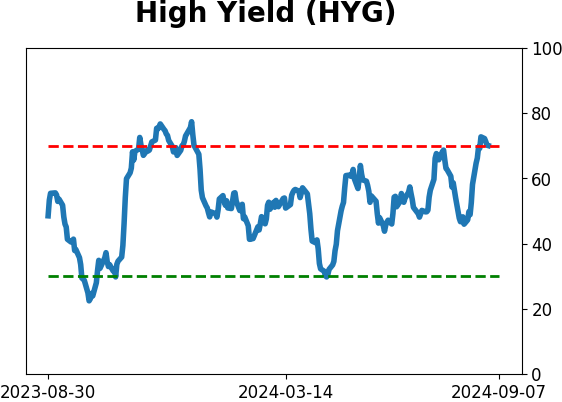
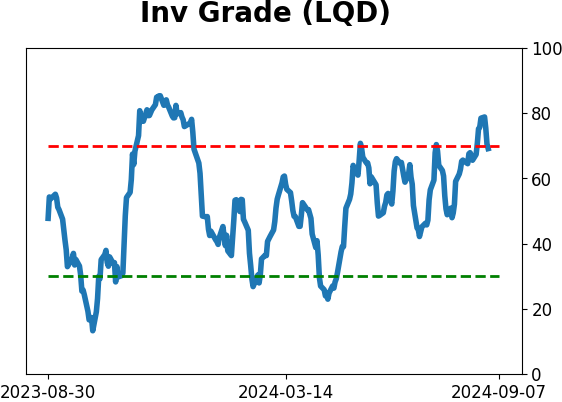
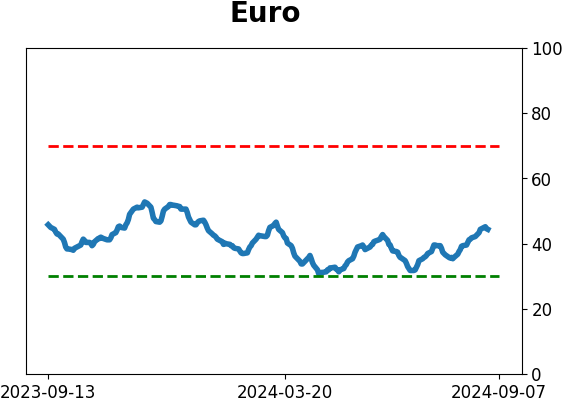
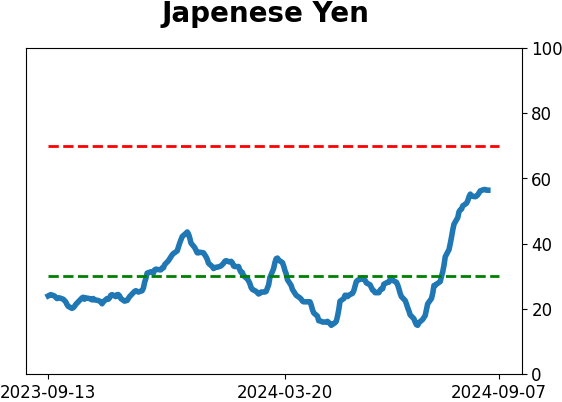
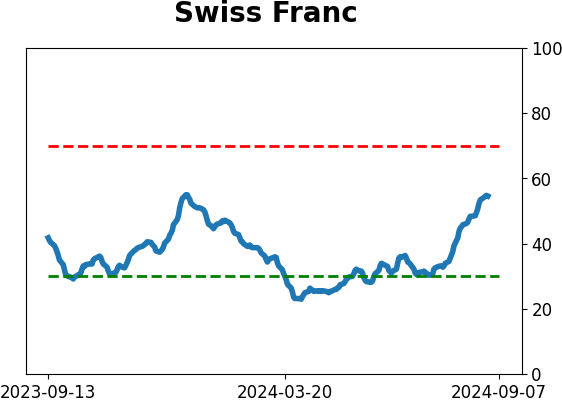
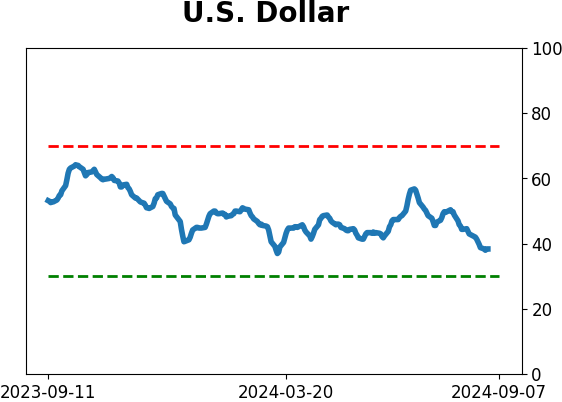
Sentiment Around The World
Optimism Index Thumbnails
|
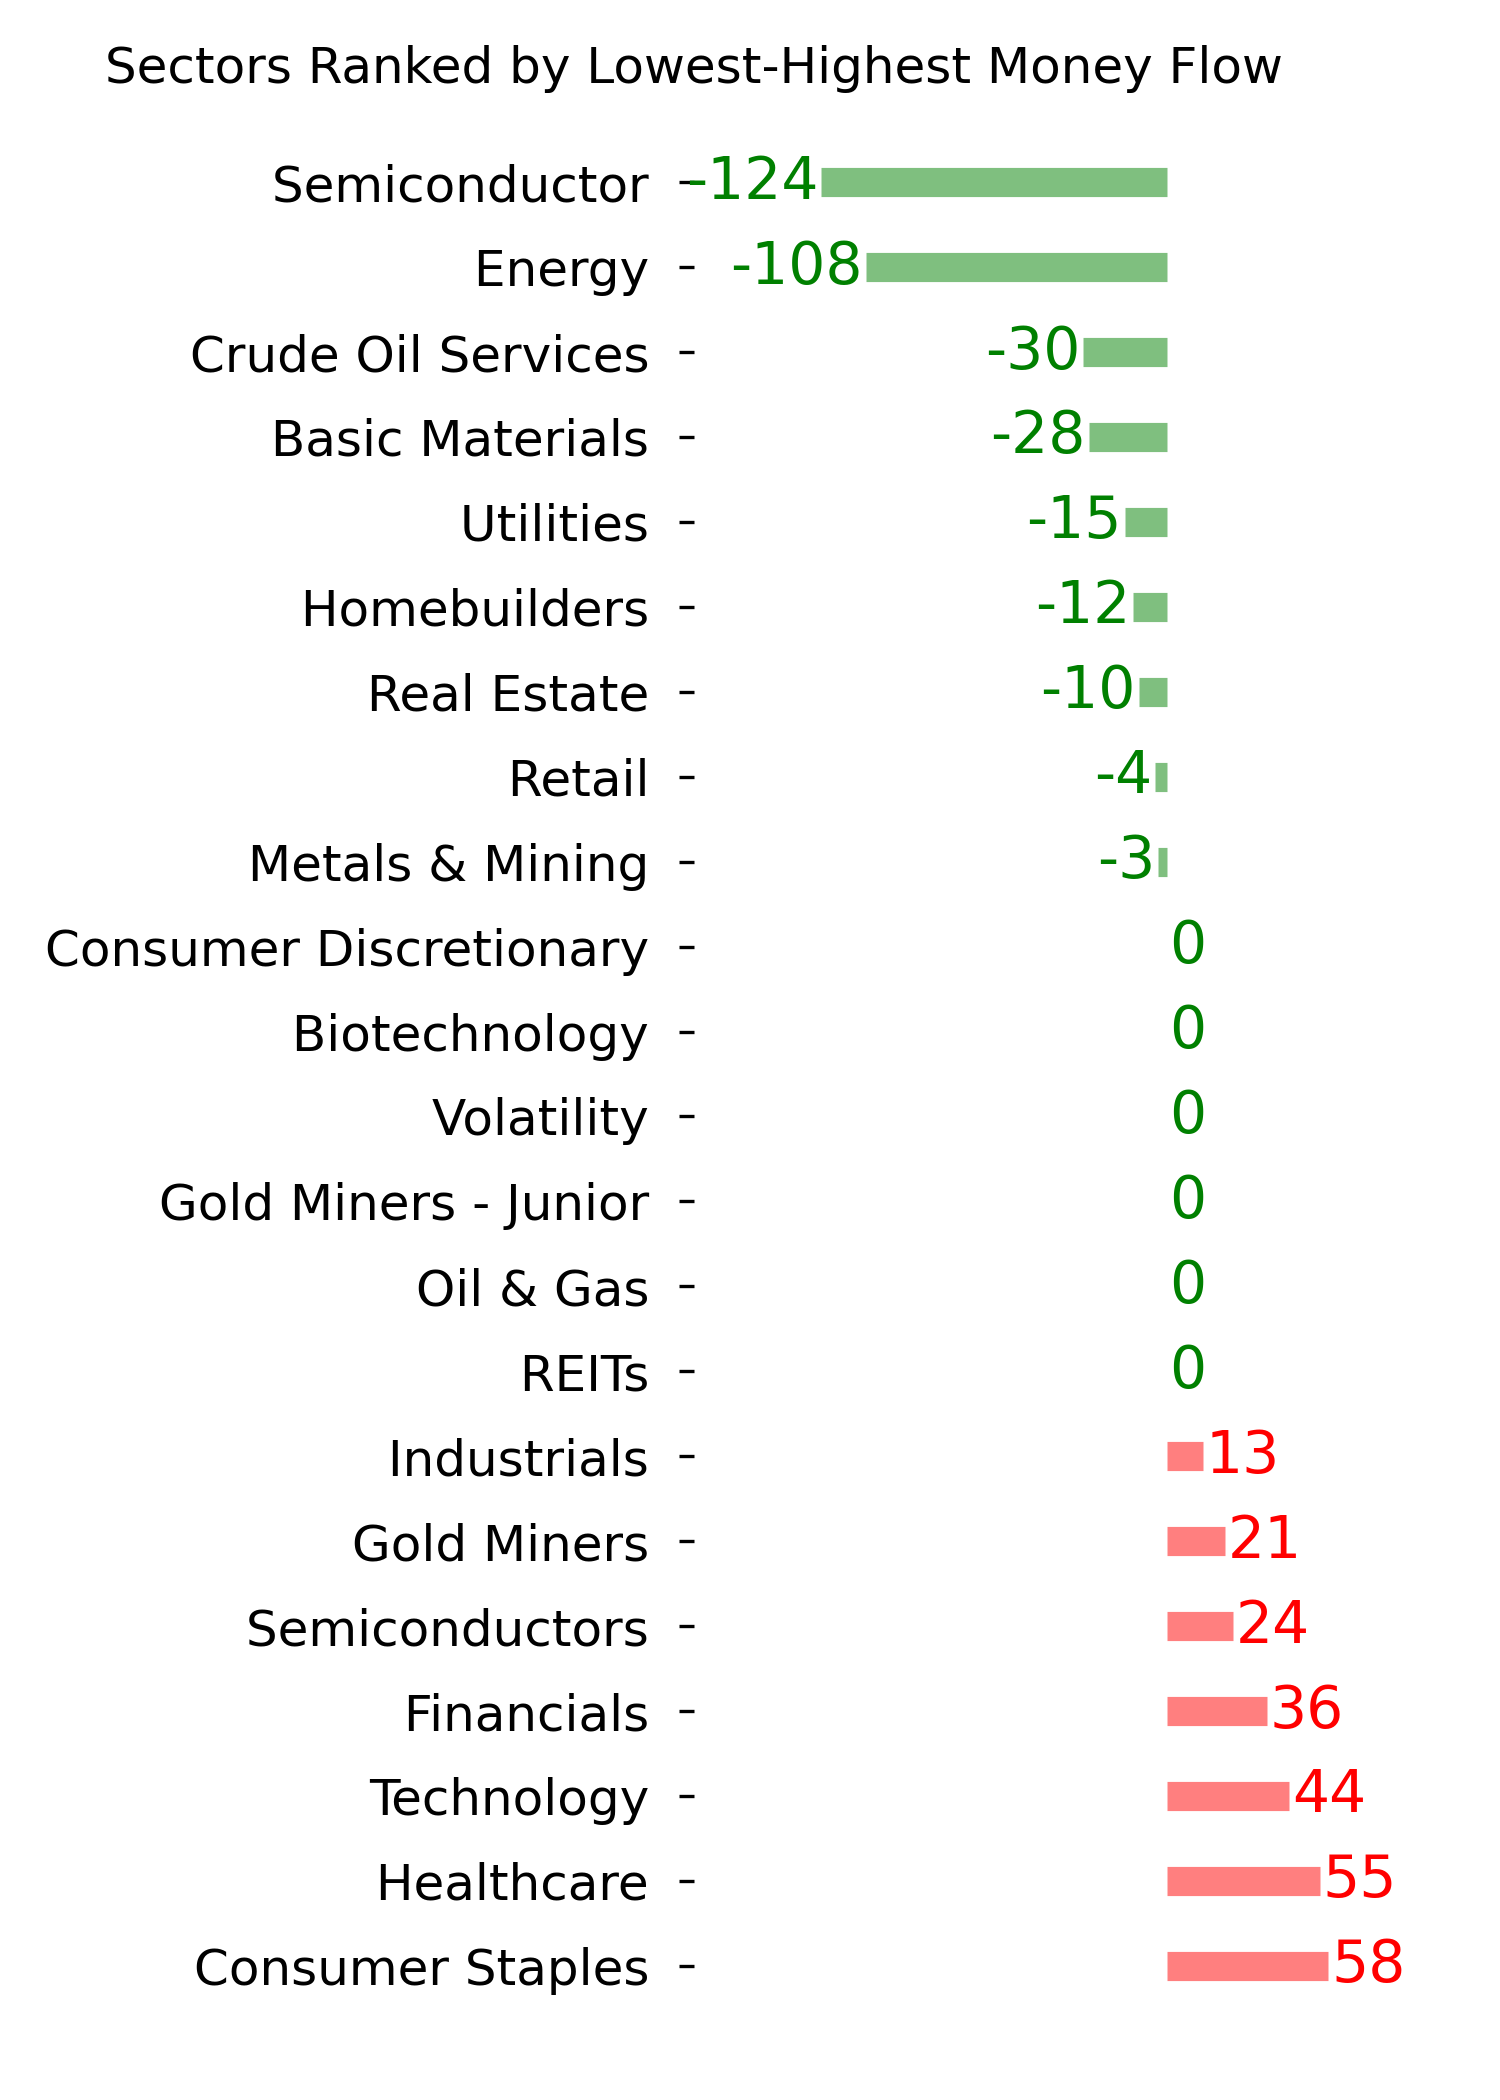
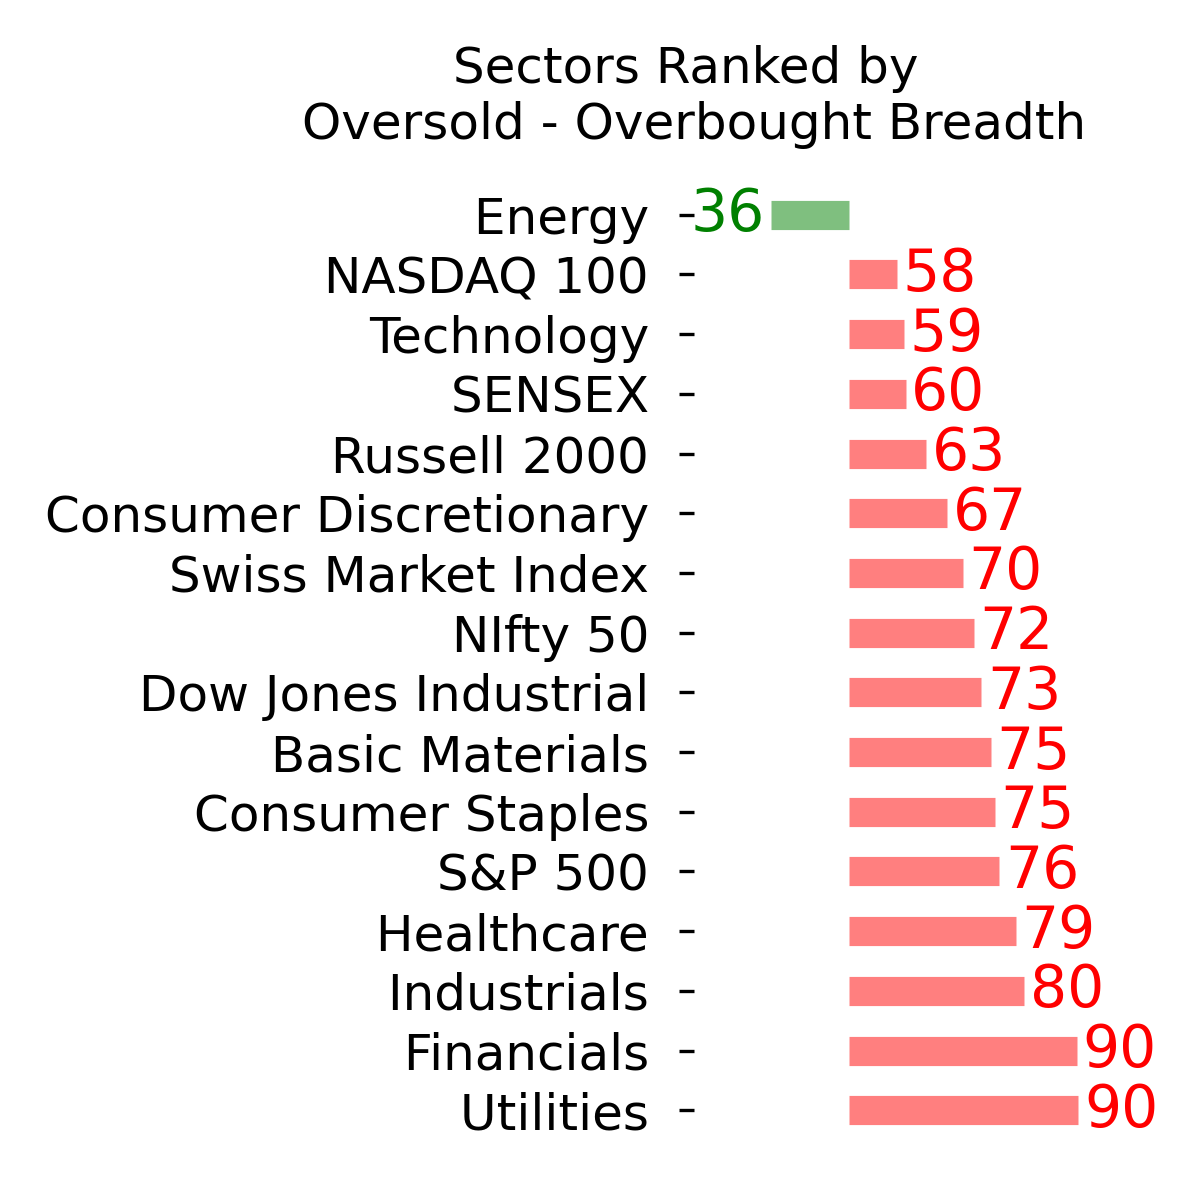
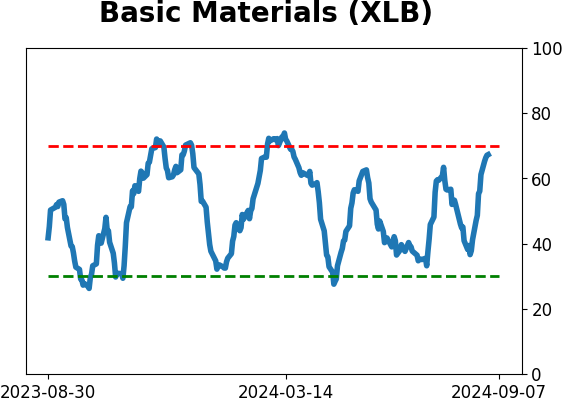
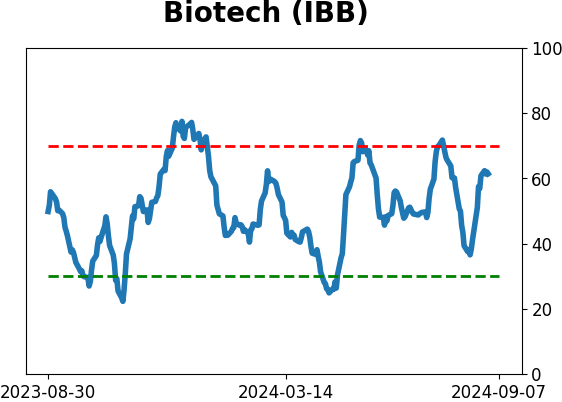
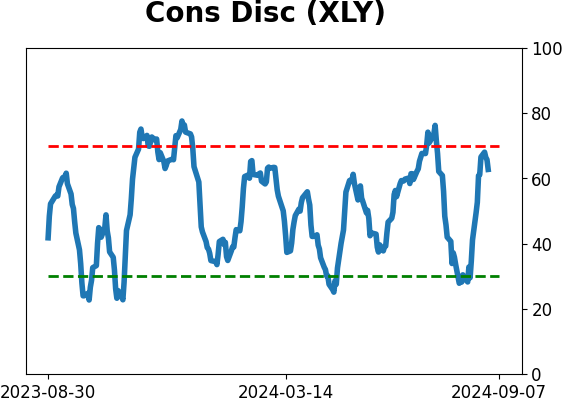
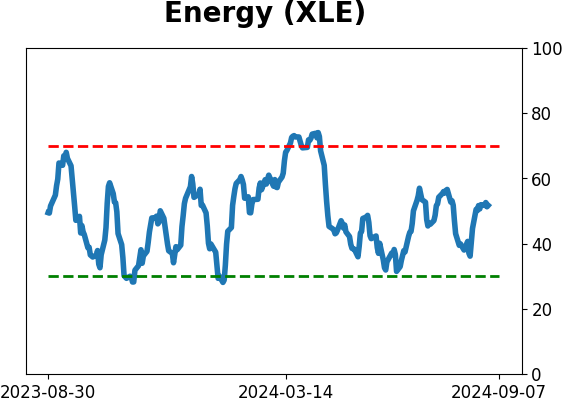
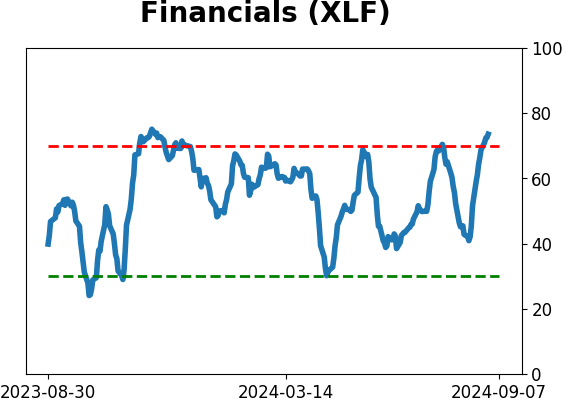
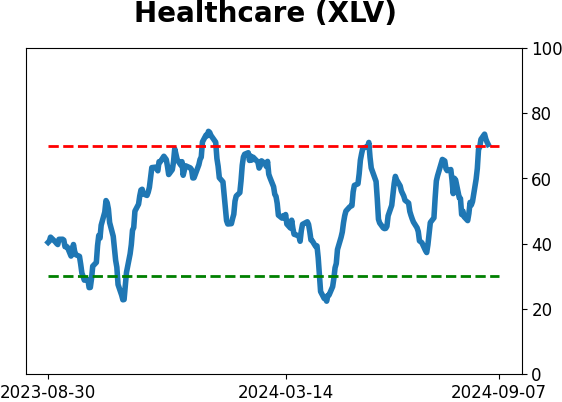
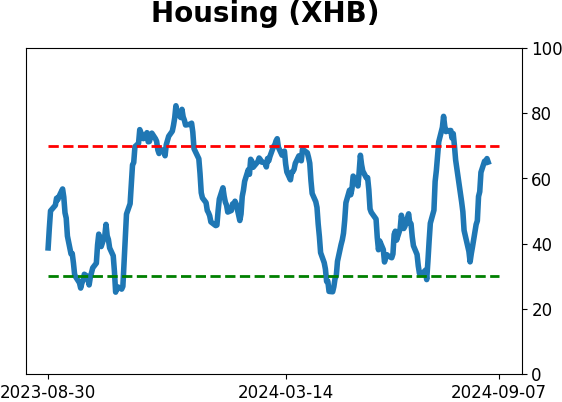
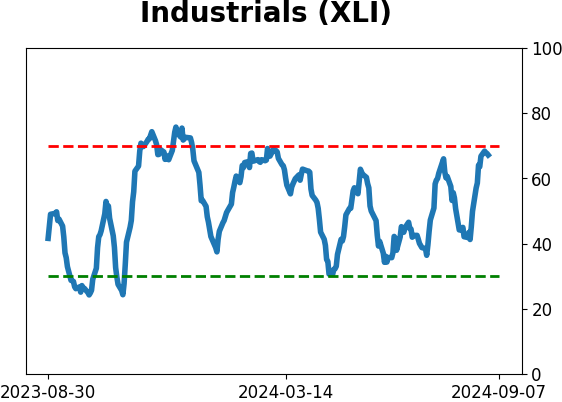
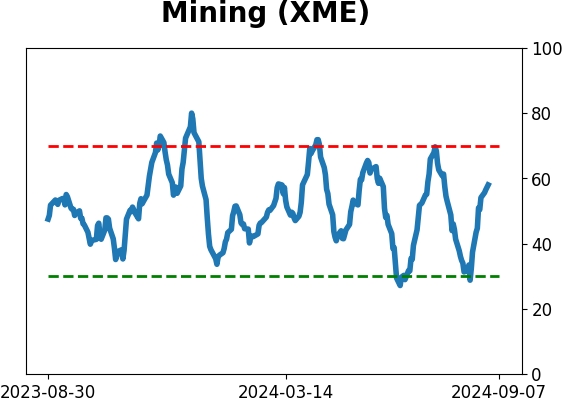
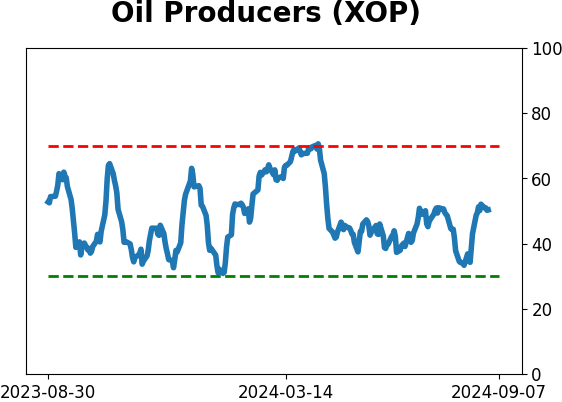
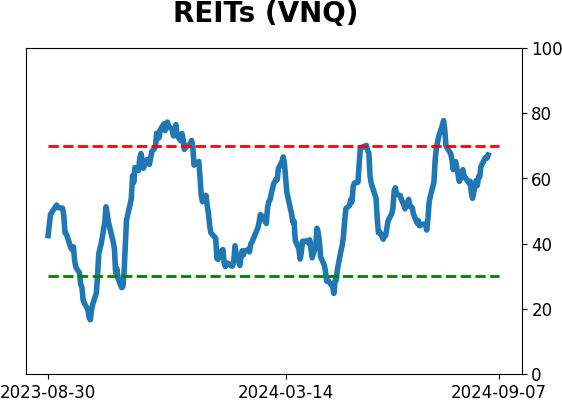
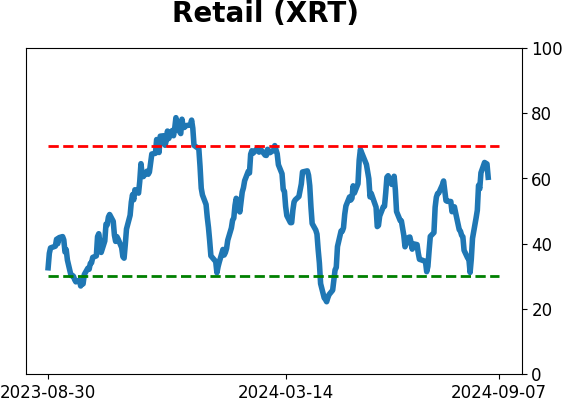
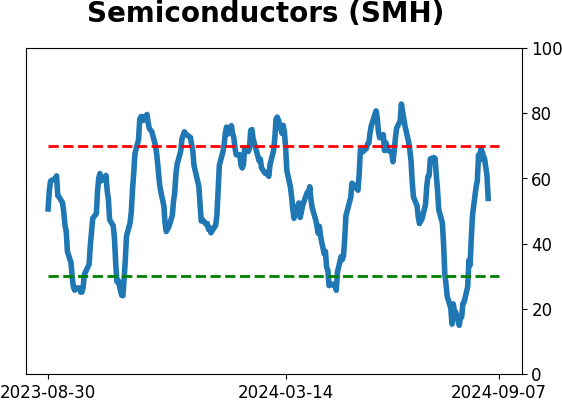
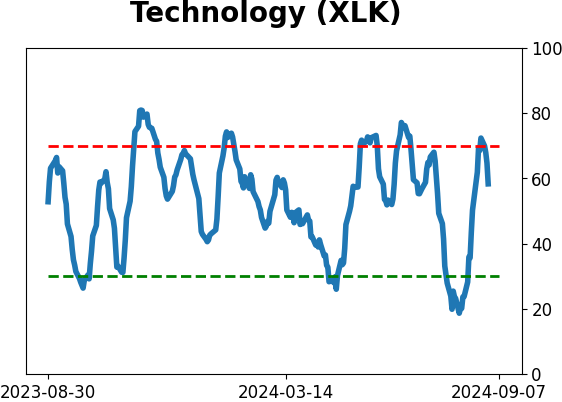
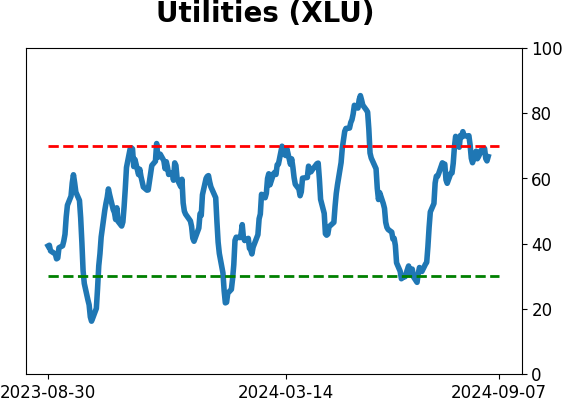
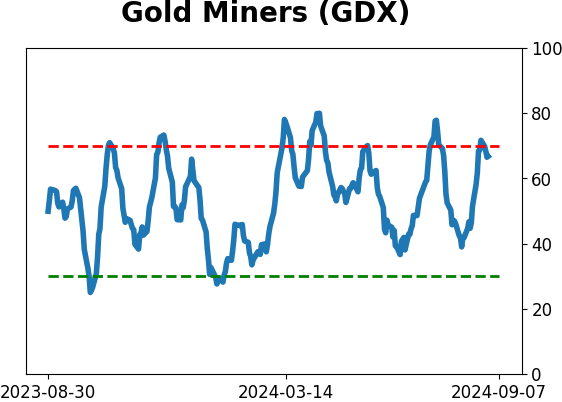
Sector ETF's - 10-Day Moving Average
|
|
|
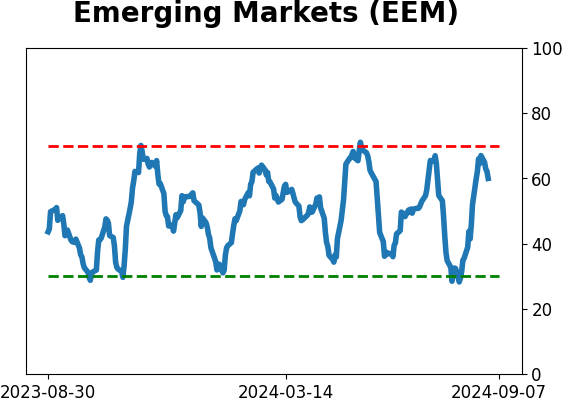
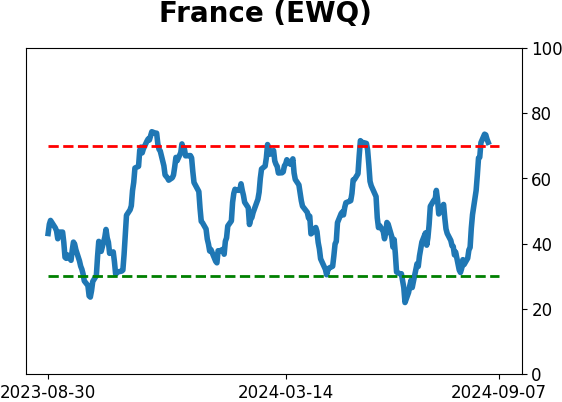
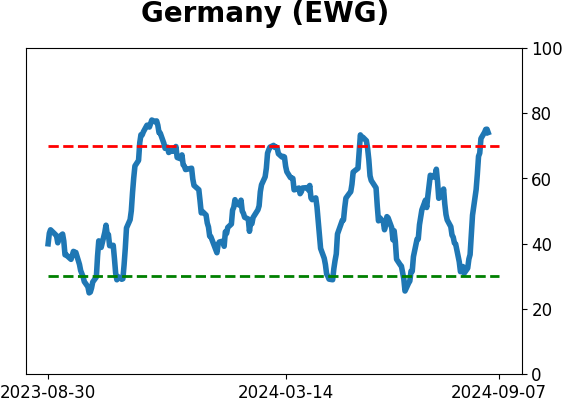
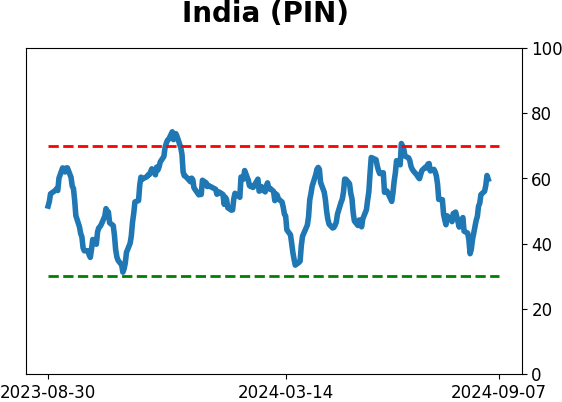
Country ETF's - 10-Day Moving Average
|
|
|
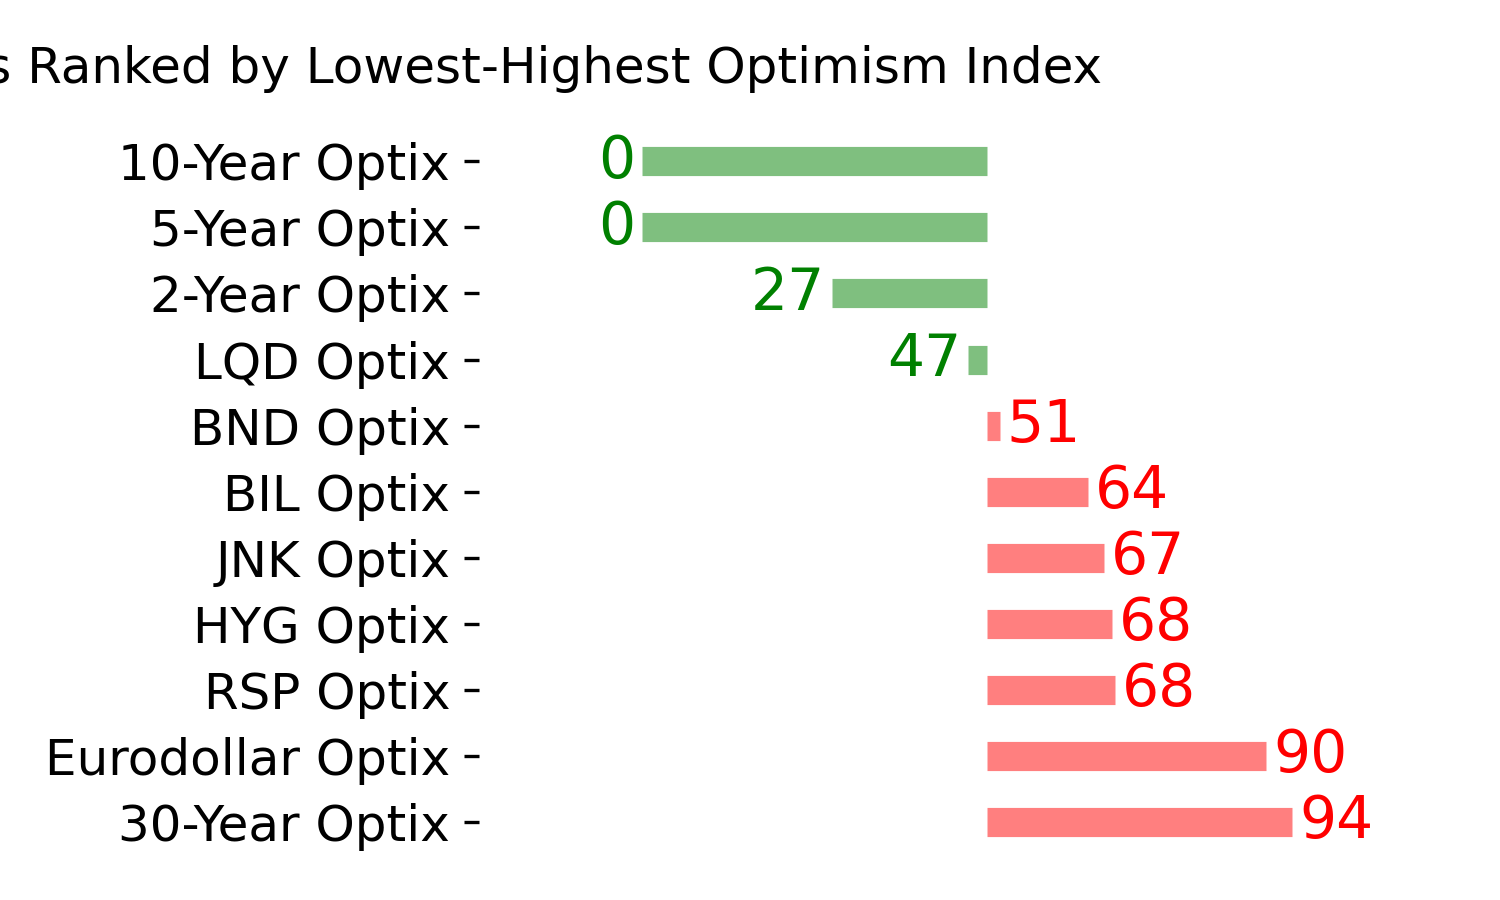
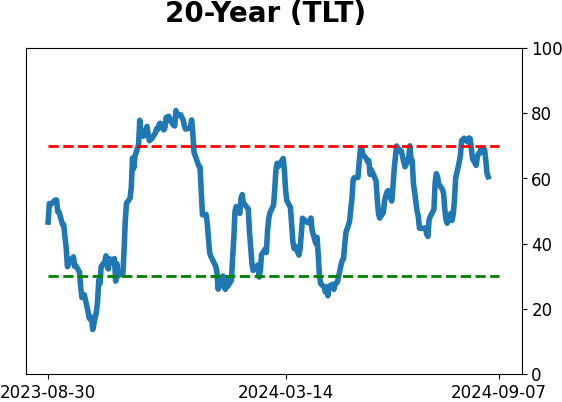
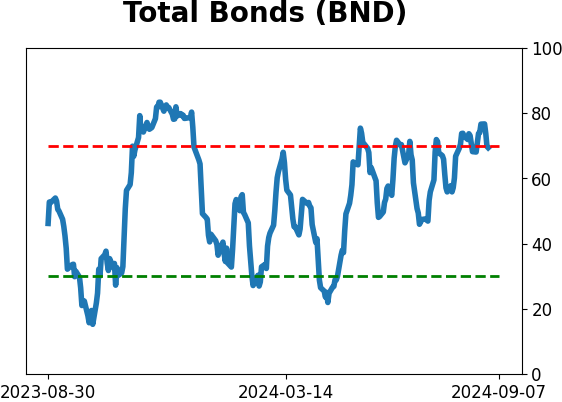
Bond ETF's - 10-Day Moving Average
|
|
|
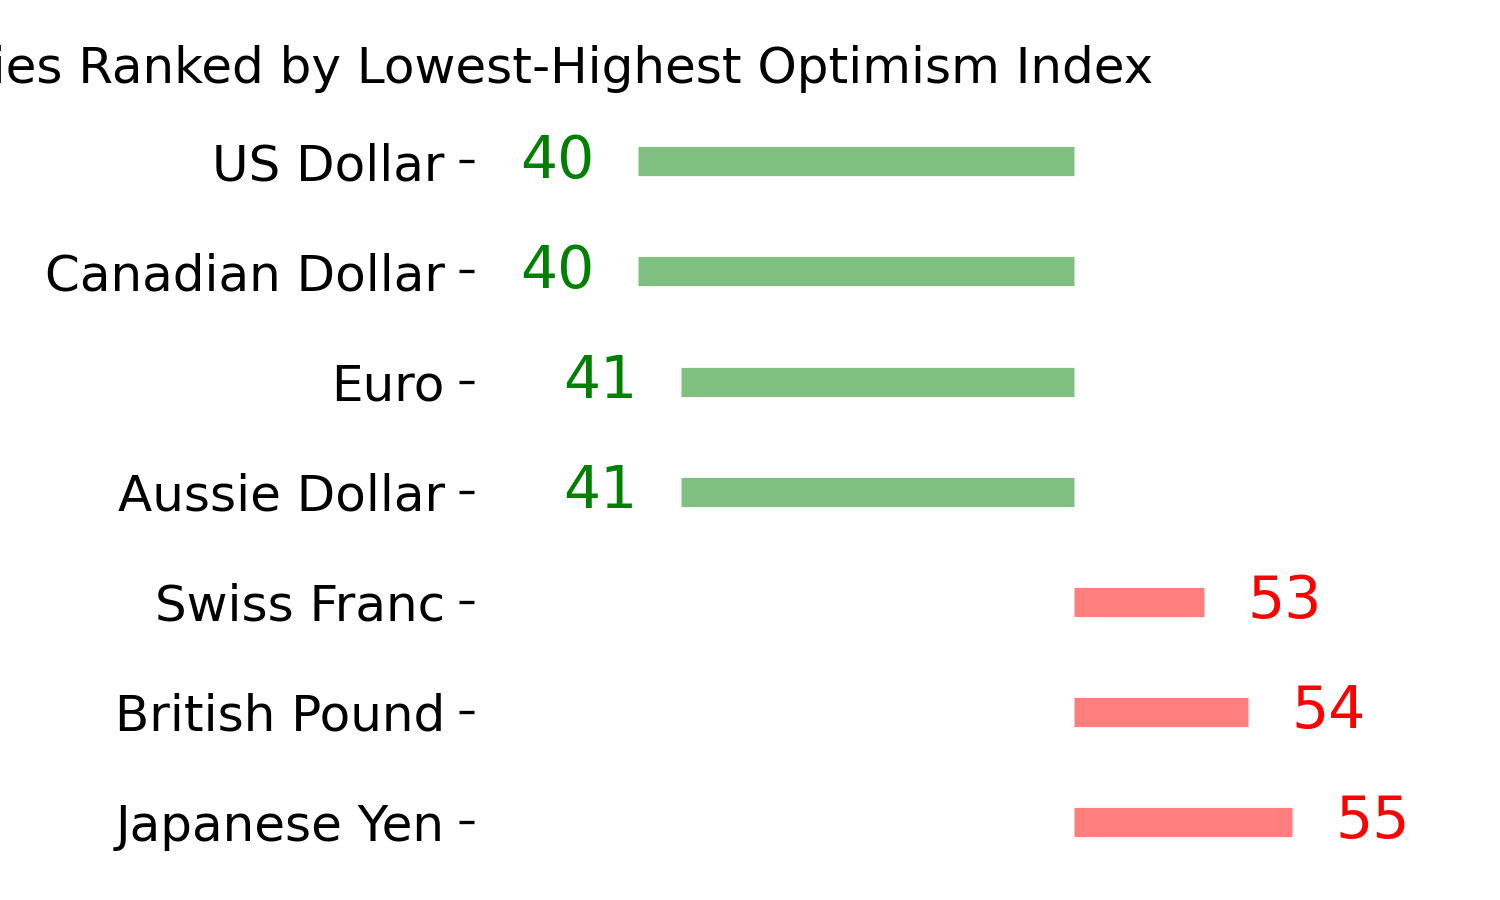
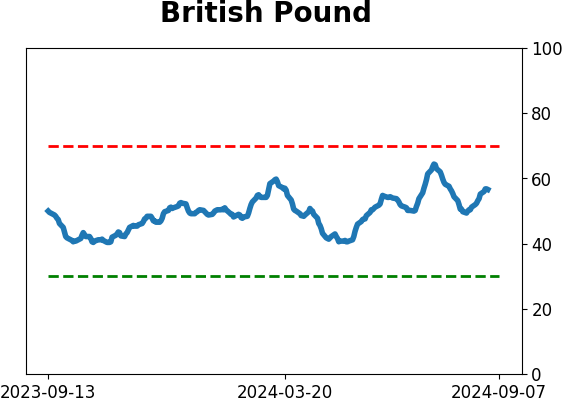
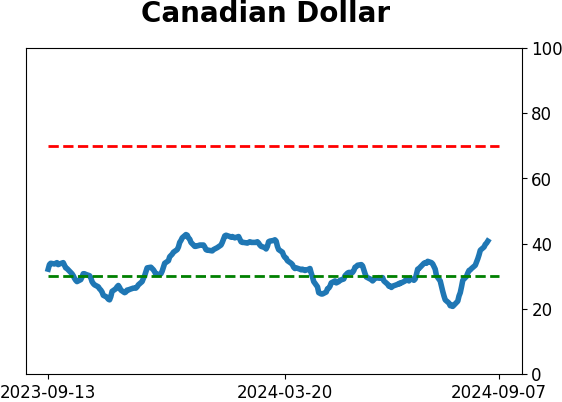
Currency ETF's - 5-Day Moving Average
|
|
|
Commodity ETF's - 5-Day Moving Average
|
|