Headlines
|
|
A record level of negative news on Chinese markets:
News articles about China are the most persistently negative than at any point in the past decade. That coincides with selling pressure in the stocks that rival the worst declines of the recent bear market, though not all indicators agree.
|
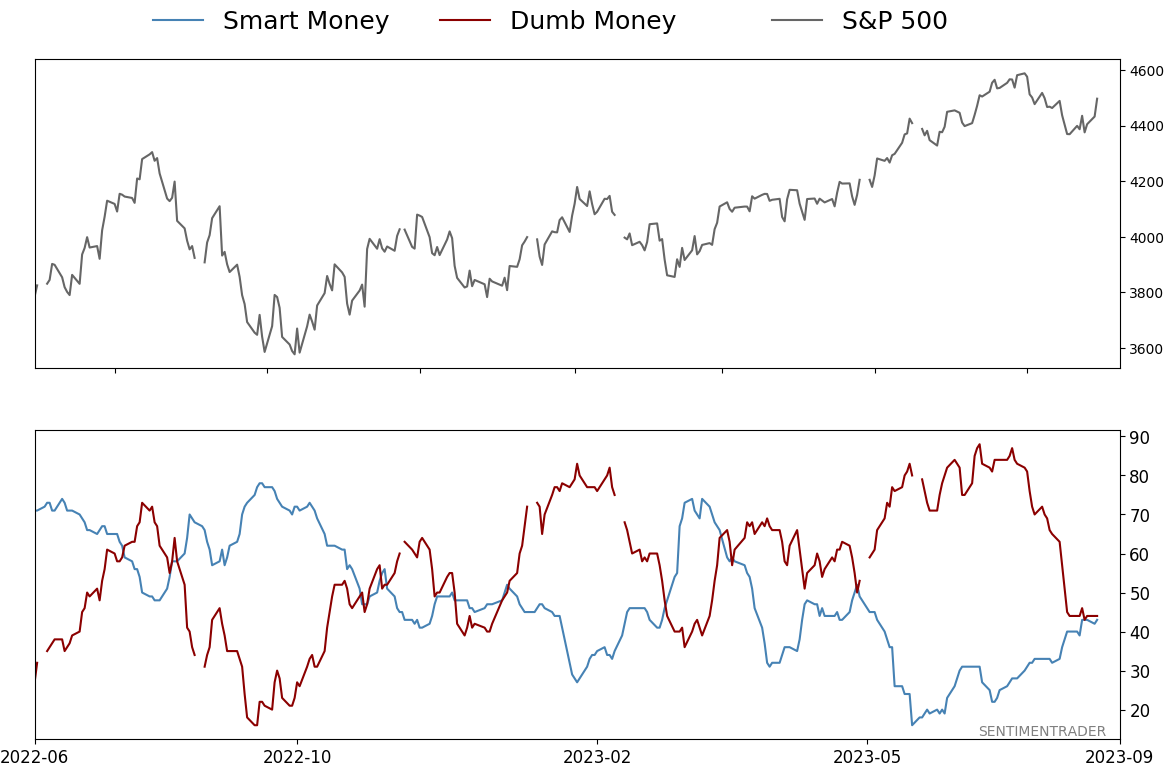
Smart / Dumb Money Confidence
|
Smart Money Confidence: 43%
Dumb Money Confidence: 44%
|
|
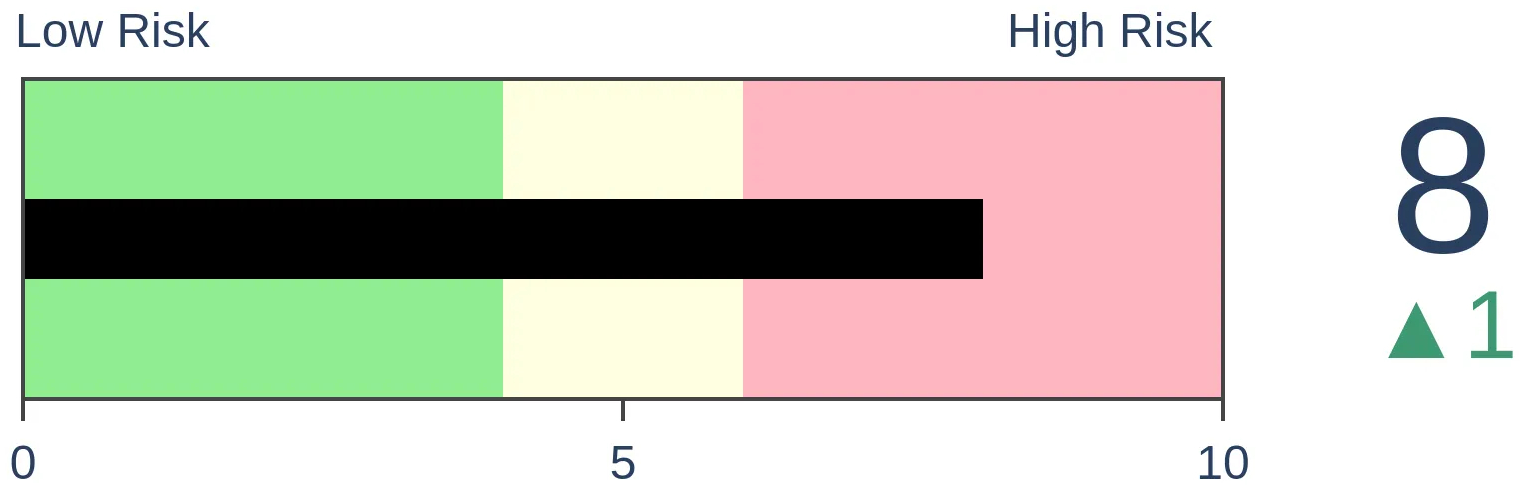
Risk Levels
Stocks Short-Term
|
Stocks Medium-Term
|
|
Bonds
|
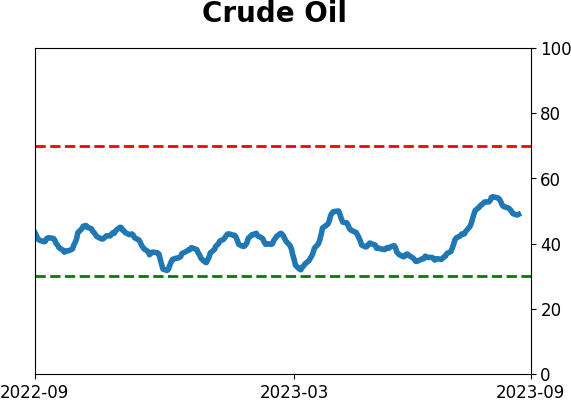
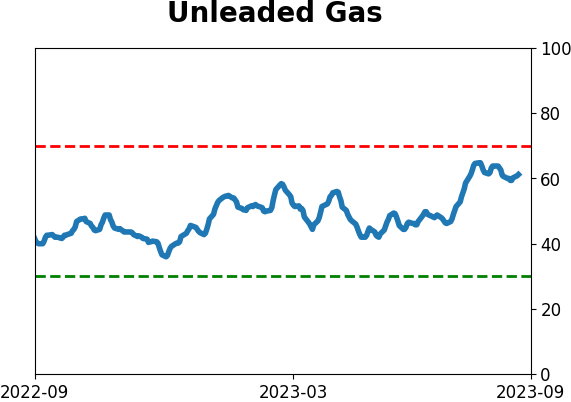
Crude Oil

|
|
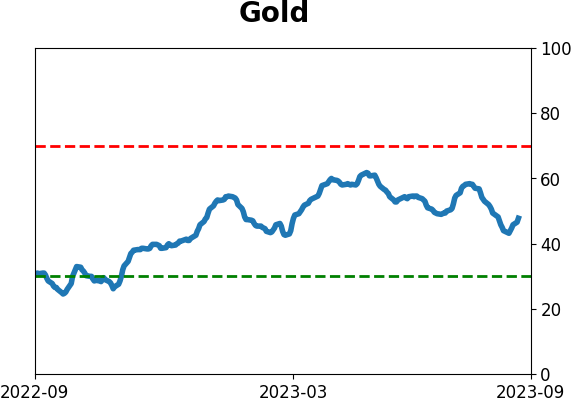
Gold

|
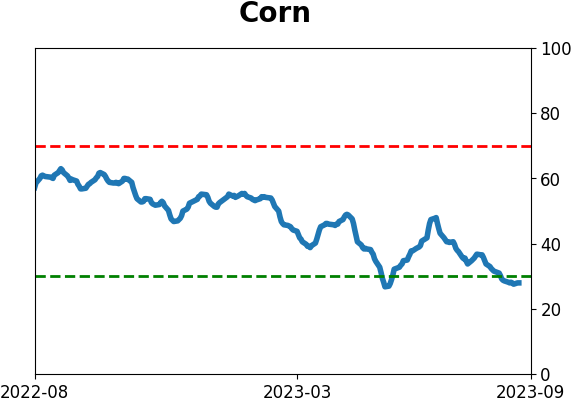
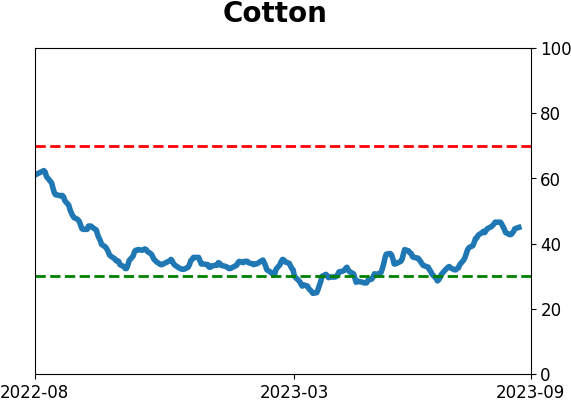
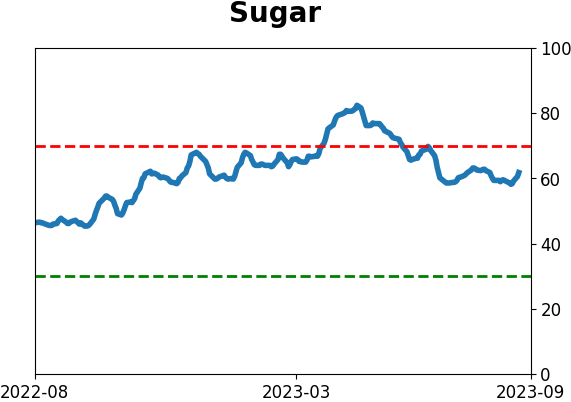
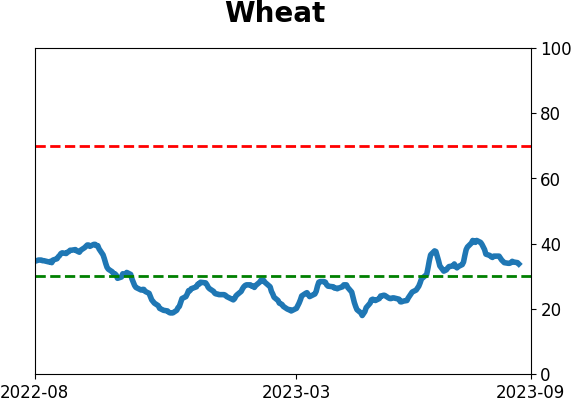
Agriculture
|
|
Research
By Jason Goepfert
BOTTOM LINE
News articles about China are the most persistently negative than at any point in the past decade. That coincides with selling pressure in the stocks that rival the worst declines of the recent bear market, though not all indicators agree.
FORECAST / TIMEFRAME
None
|
Key points:
- News articles about China have the most negative spin in a decade
- Some breadth indicators show the worst selling of the most recent bear market
- Not all indicators are showing historic extremes...which isn't necessarily a good thing
It's tough to find a positive spin on China
Finding a mainstream financial news article about China with a positive spin is nearly impossible. It seems to be literally impossible, actually, and not only for a positive overall vibe - just a positive mention of anything whatsoever. That's particularly the case in Western media and especially those that are U.S.-based.
This isn't just subjective. According to the Bloomberg database of news articles across all sources dating back a decade, there has never been a week with more negative news articles about the country as a percentage of all articles. We used the following terms: weak, warning, risk, problem, struggle, worse, fall, gloom, disappoint, contagion, loss, negative, and slump.
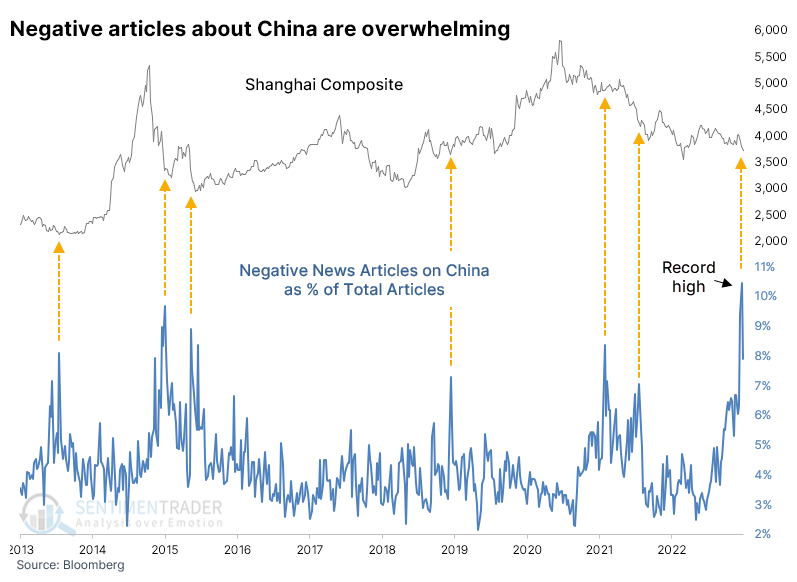
The only other time period that came close was the last week of August 2015, also a time of great turbulence in that market that was met with similar policy responses.
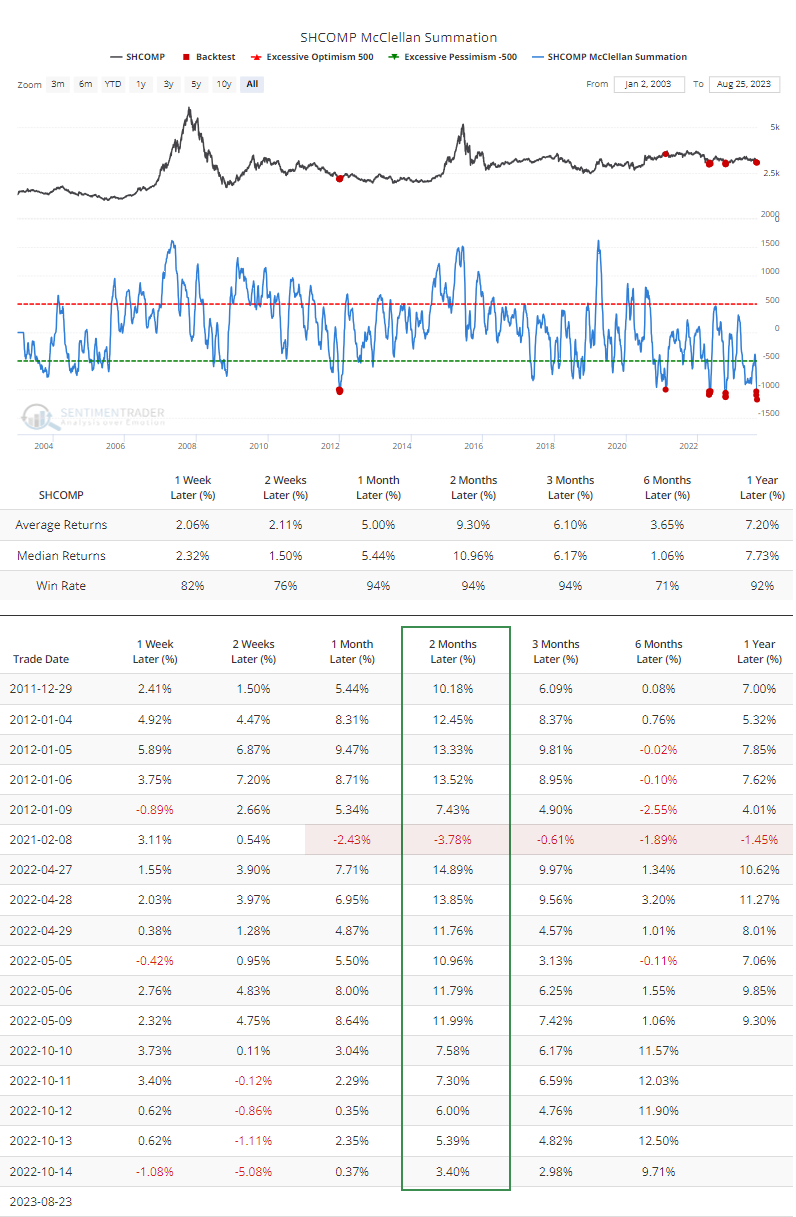
The persistent and severe selling pressure pushed the McClellan Summation Index for the Shanghai Composite to a record low in recent days. The Backtest Engine shows that after the few other times it crossed below -1000, the Composite had already suffered the worst of its losses for a while.
If we look at the index's forward returns after all days when the Summation Index was below -1000, there was only one loss over the next two months, in February 2021. That was kind of a weird one anyway, because the index was just coming off multi-year highs with severe internal deterioration, while this time the index has been melting for months, more like the other instances.
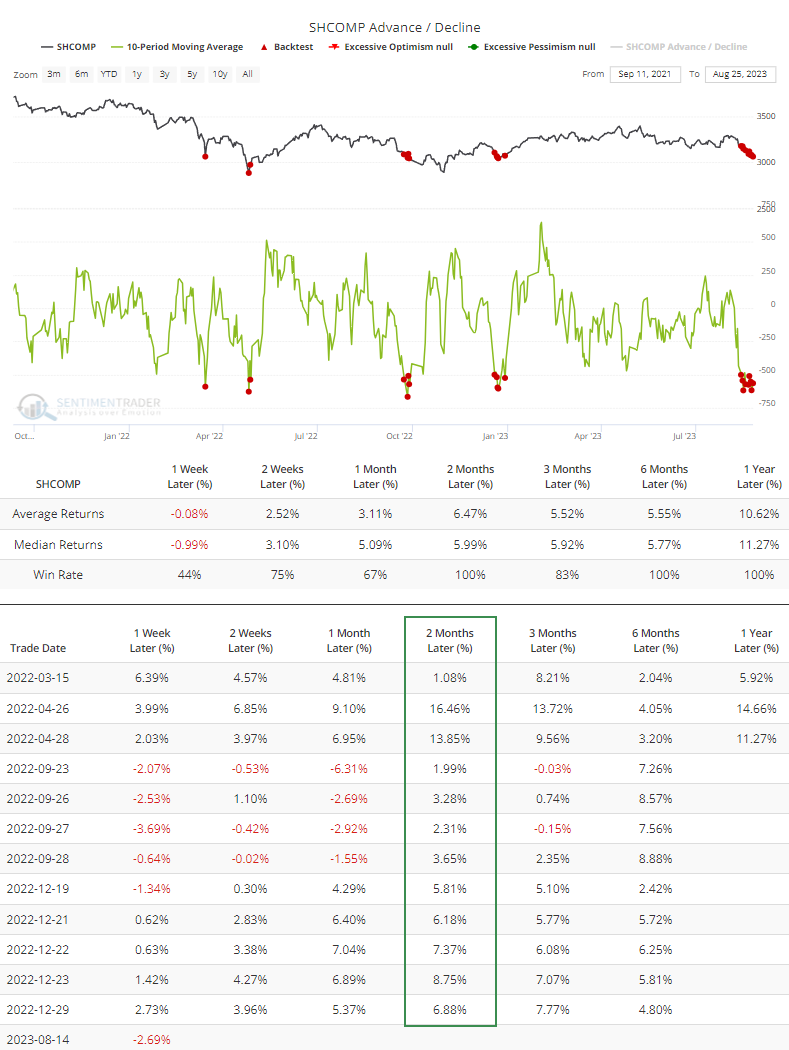
We can see just how severe and pervasive the losses have been lately by the advance/decline figures. Over the past ten sessions, an average of more than 500 more stocks in the Shanghai Composite declined than advanced. Just considering other instances since the market peaked in 2021, it rebounded each time after the others got this bad.
The Backtest Engine shows that even during this protracted bear market, the Shanghai rebounded each time over the next two months.
What the research tells us...
It's hard to be optimistic on any market when it is nigh on impossible to read anything with a positive spin. That's definitely the case for Chinese stocks in recent weeks, with a level of pervasive negativity perhaps never seen before. Selling pressure in the stocks has been heavy, though many breadth indicators aren't showing the level of panic of past lows. That could be either a good thing (stocks are holding up better than they should) or a bad one (sellers have not yet been washed out). A few indicators show historic extremes, which have preceded rebounds after similar behavior, but it's not a consensus.
Indicators at Extremes
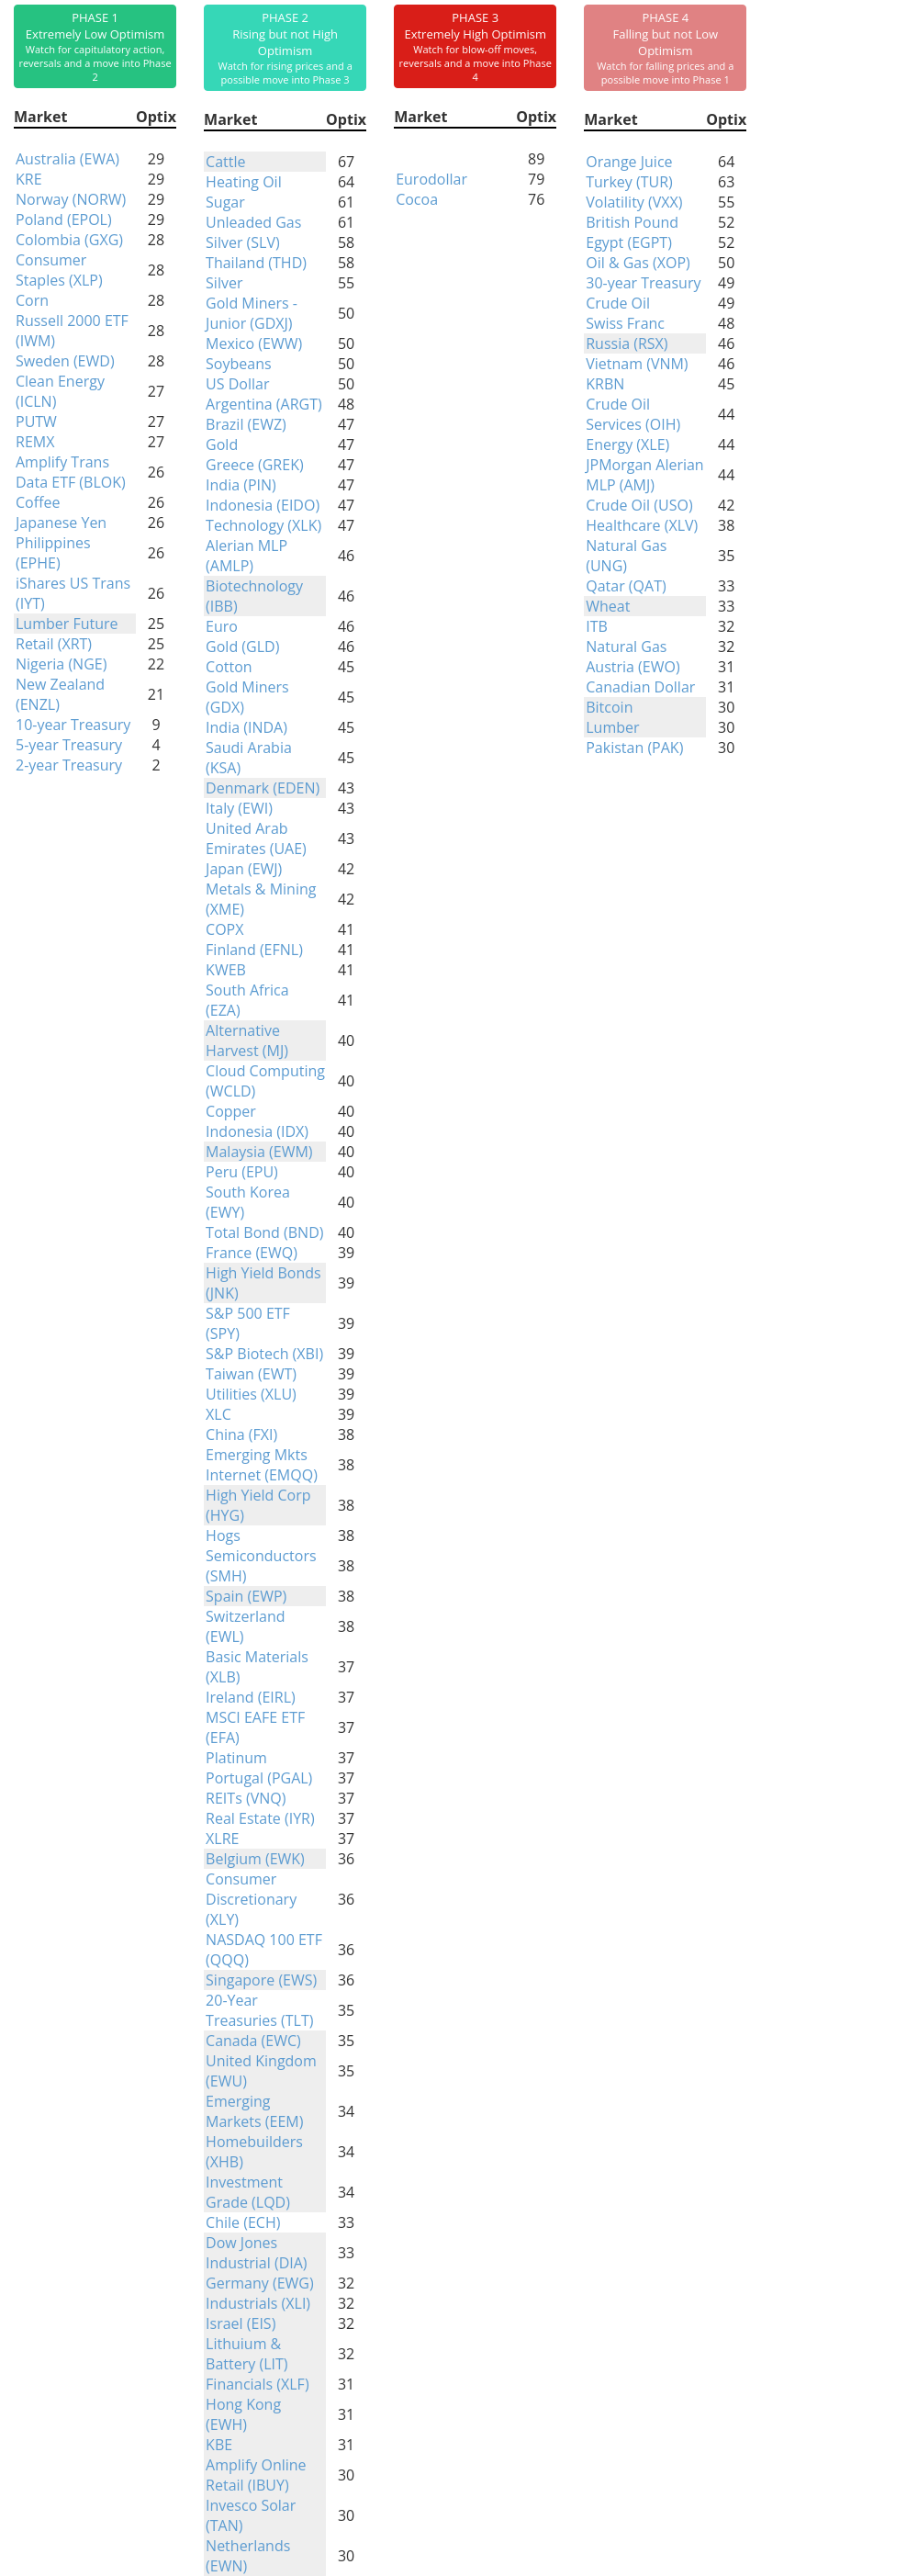
Phase Table
Ranks
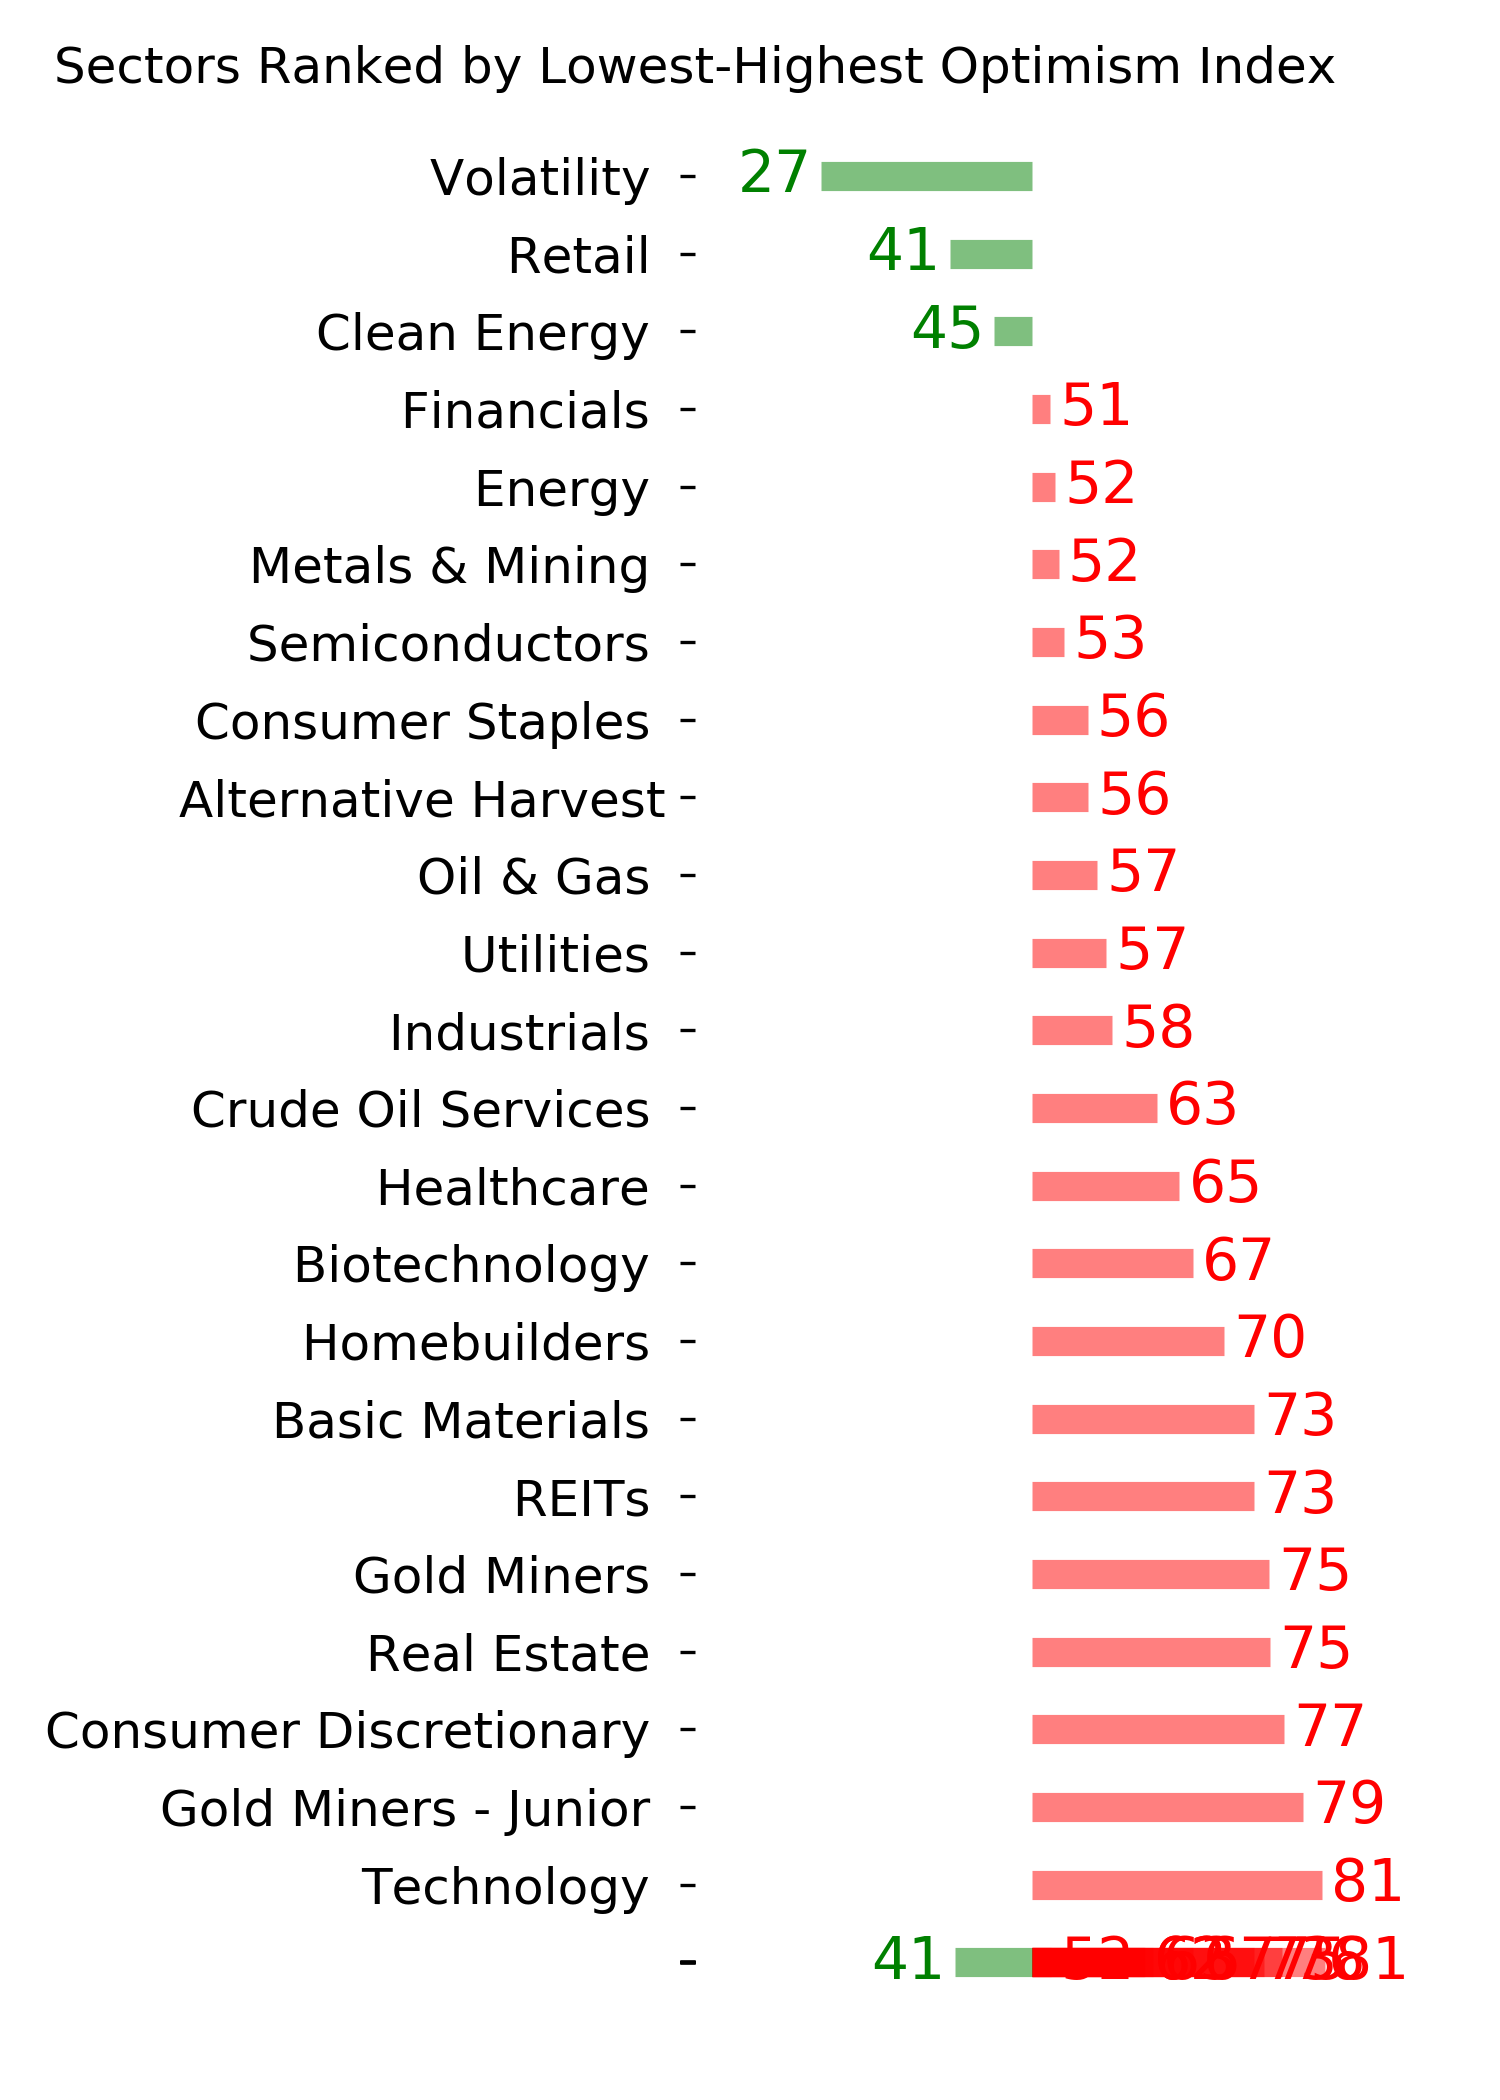
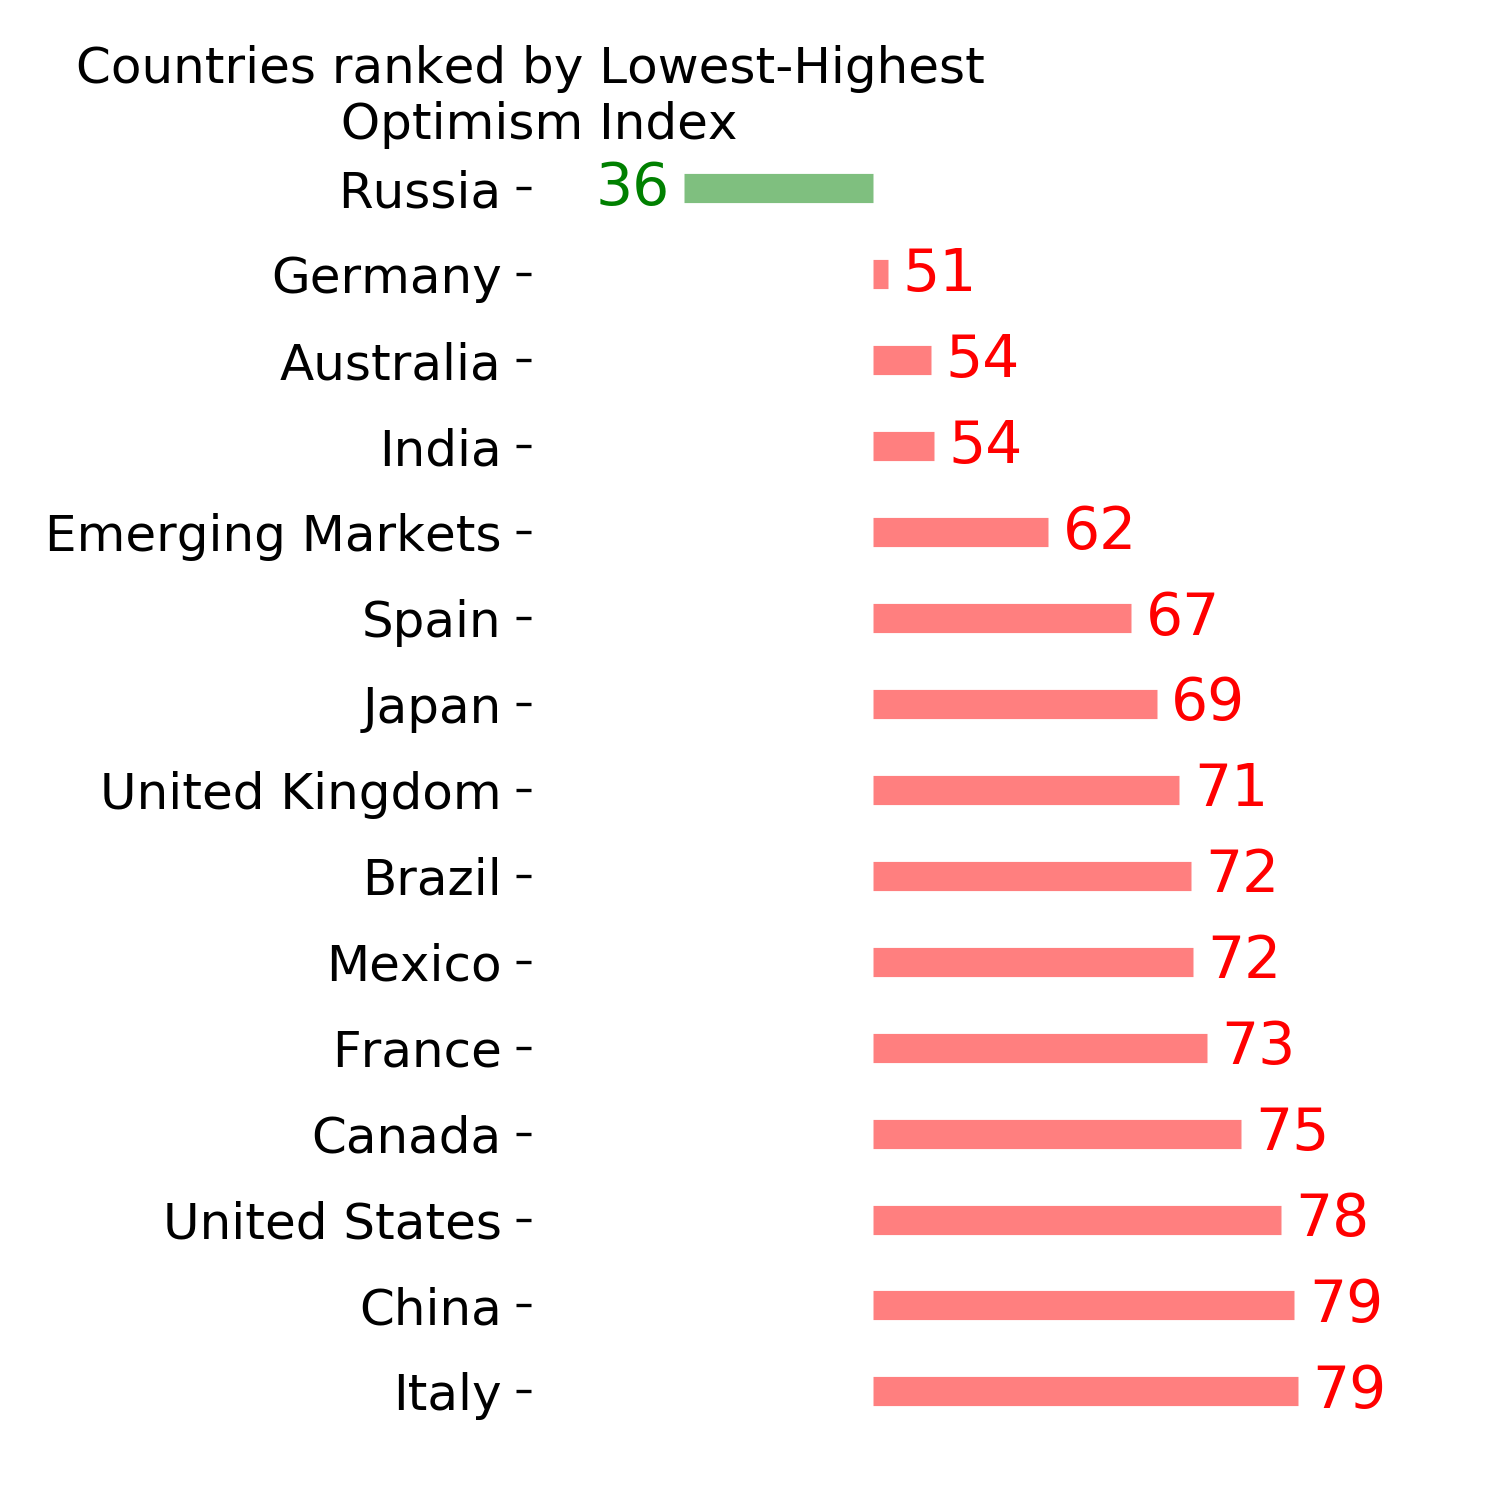
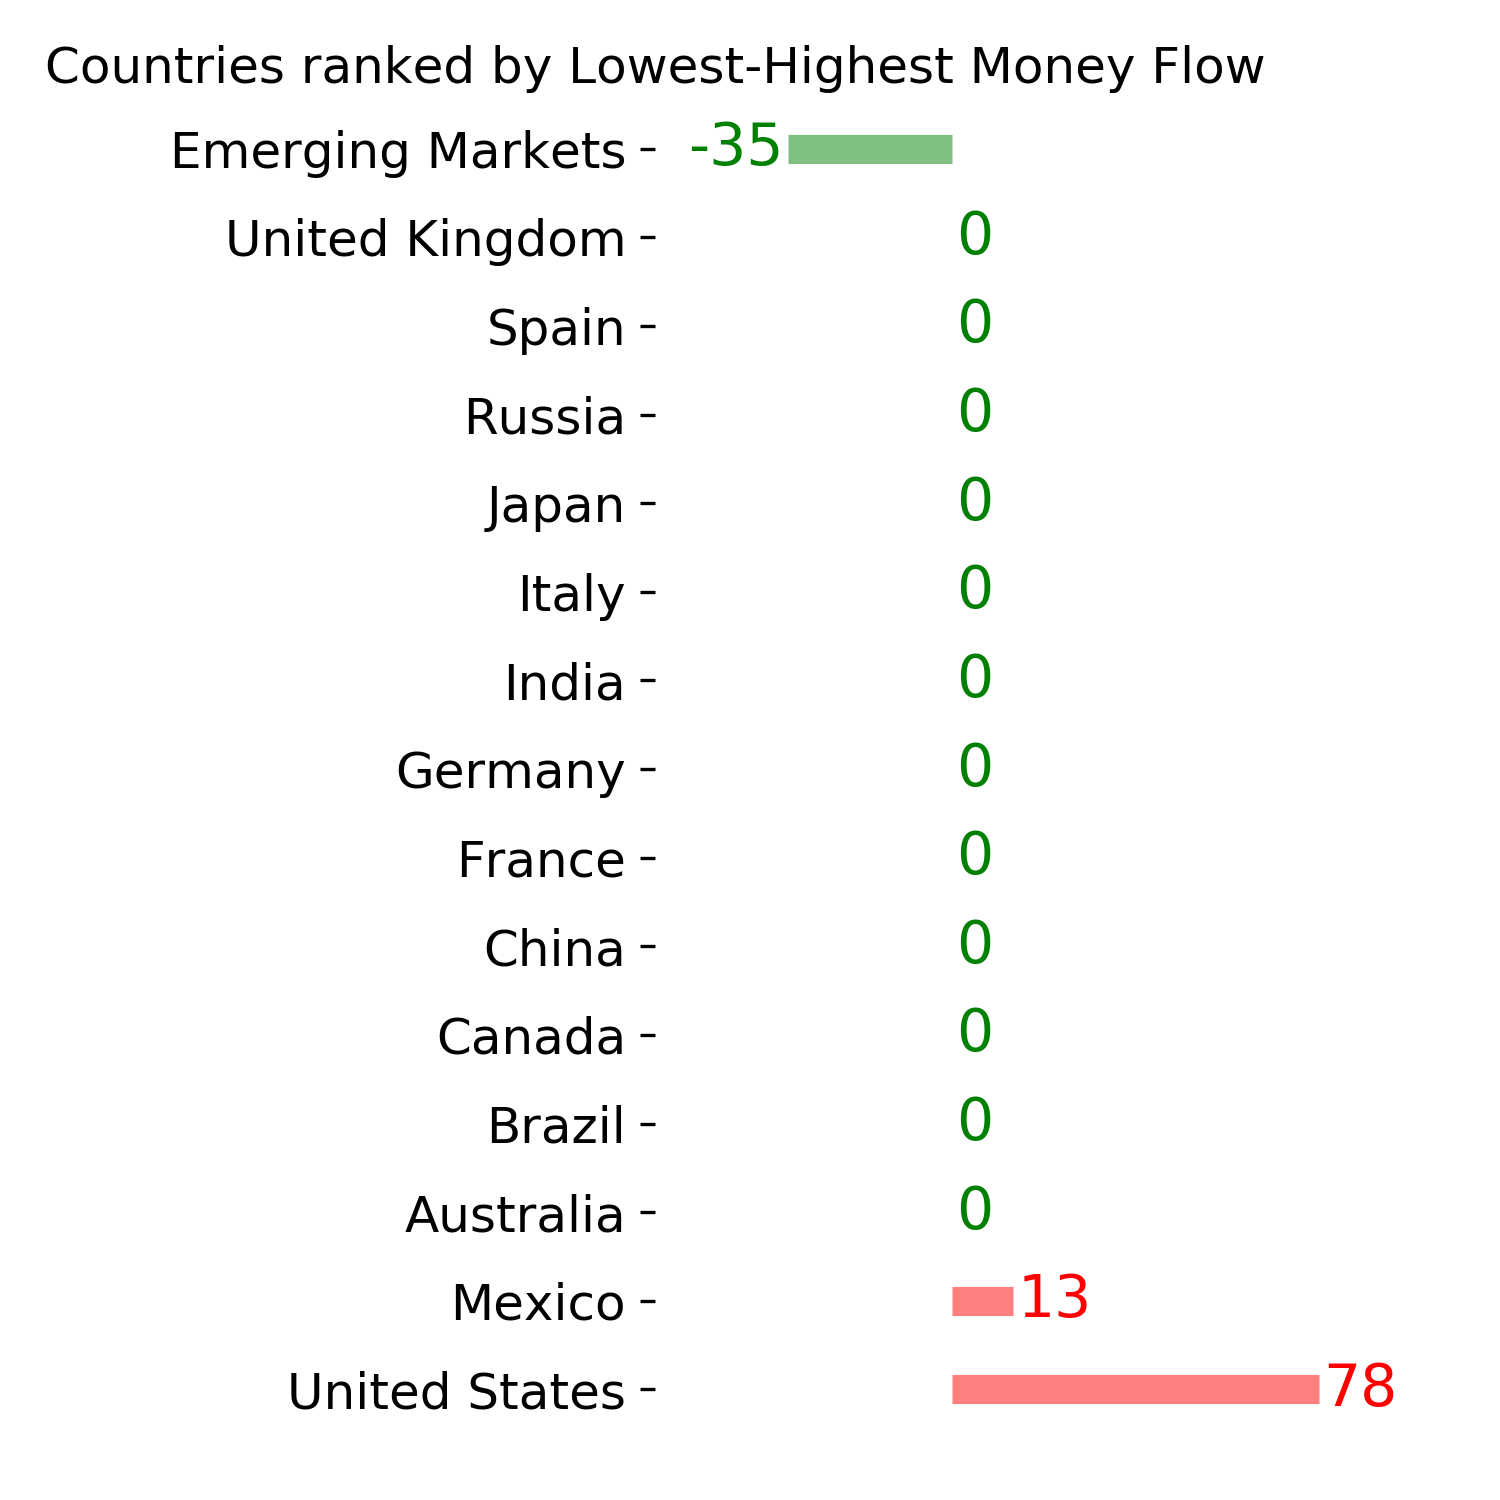
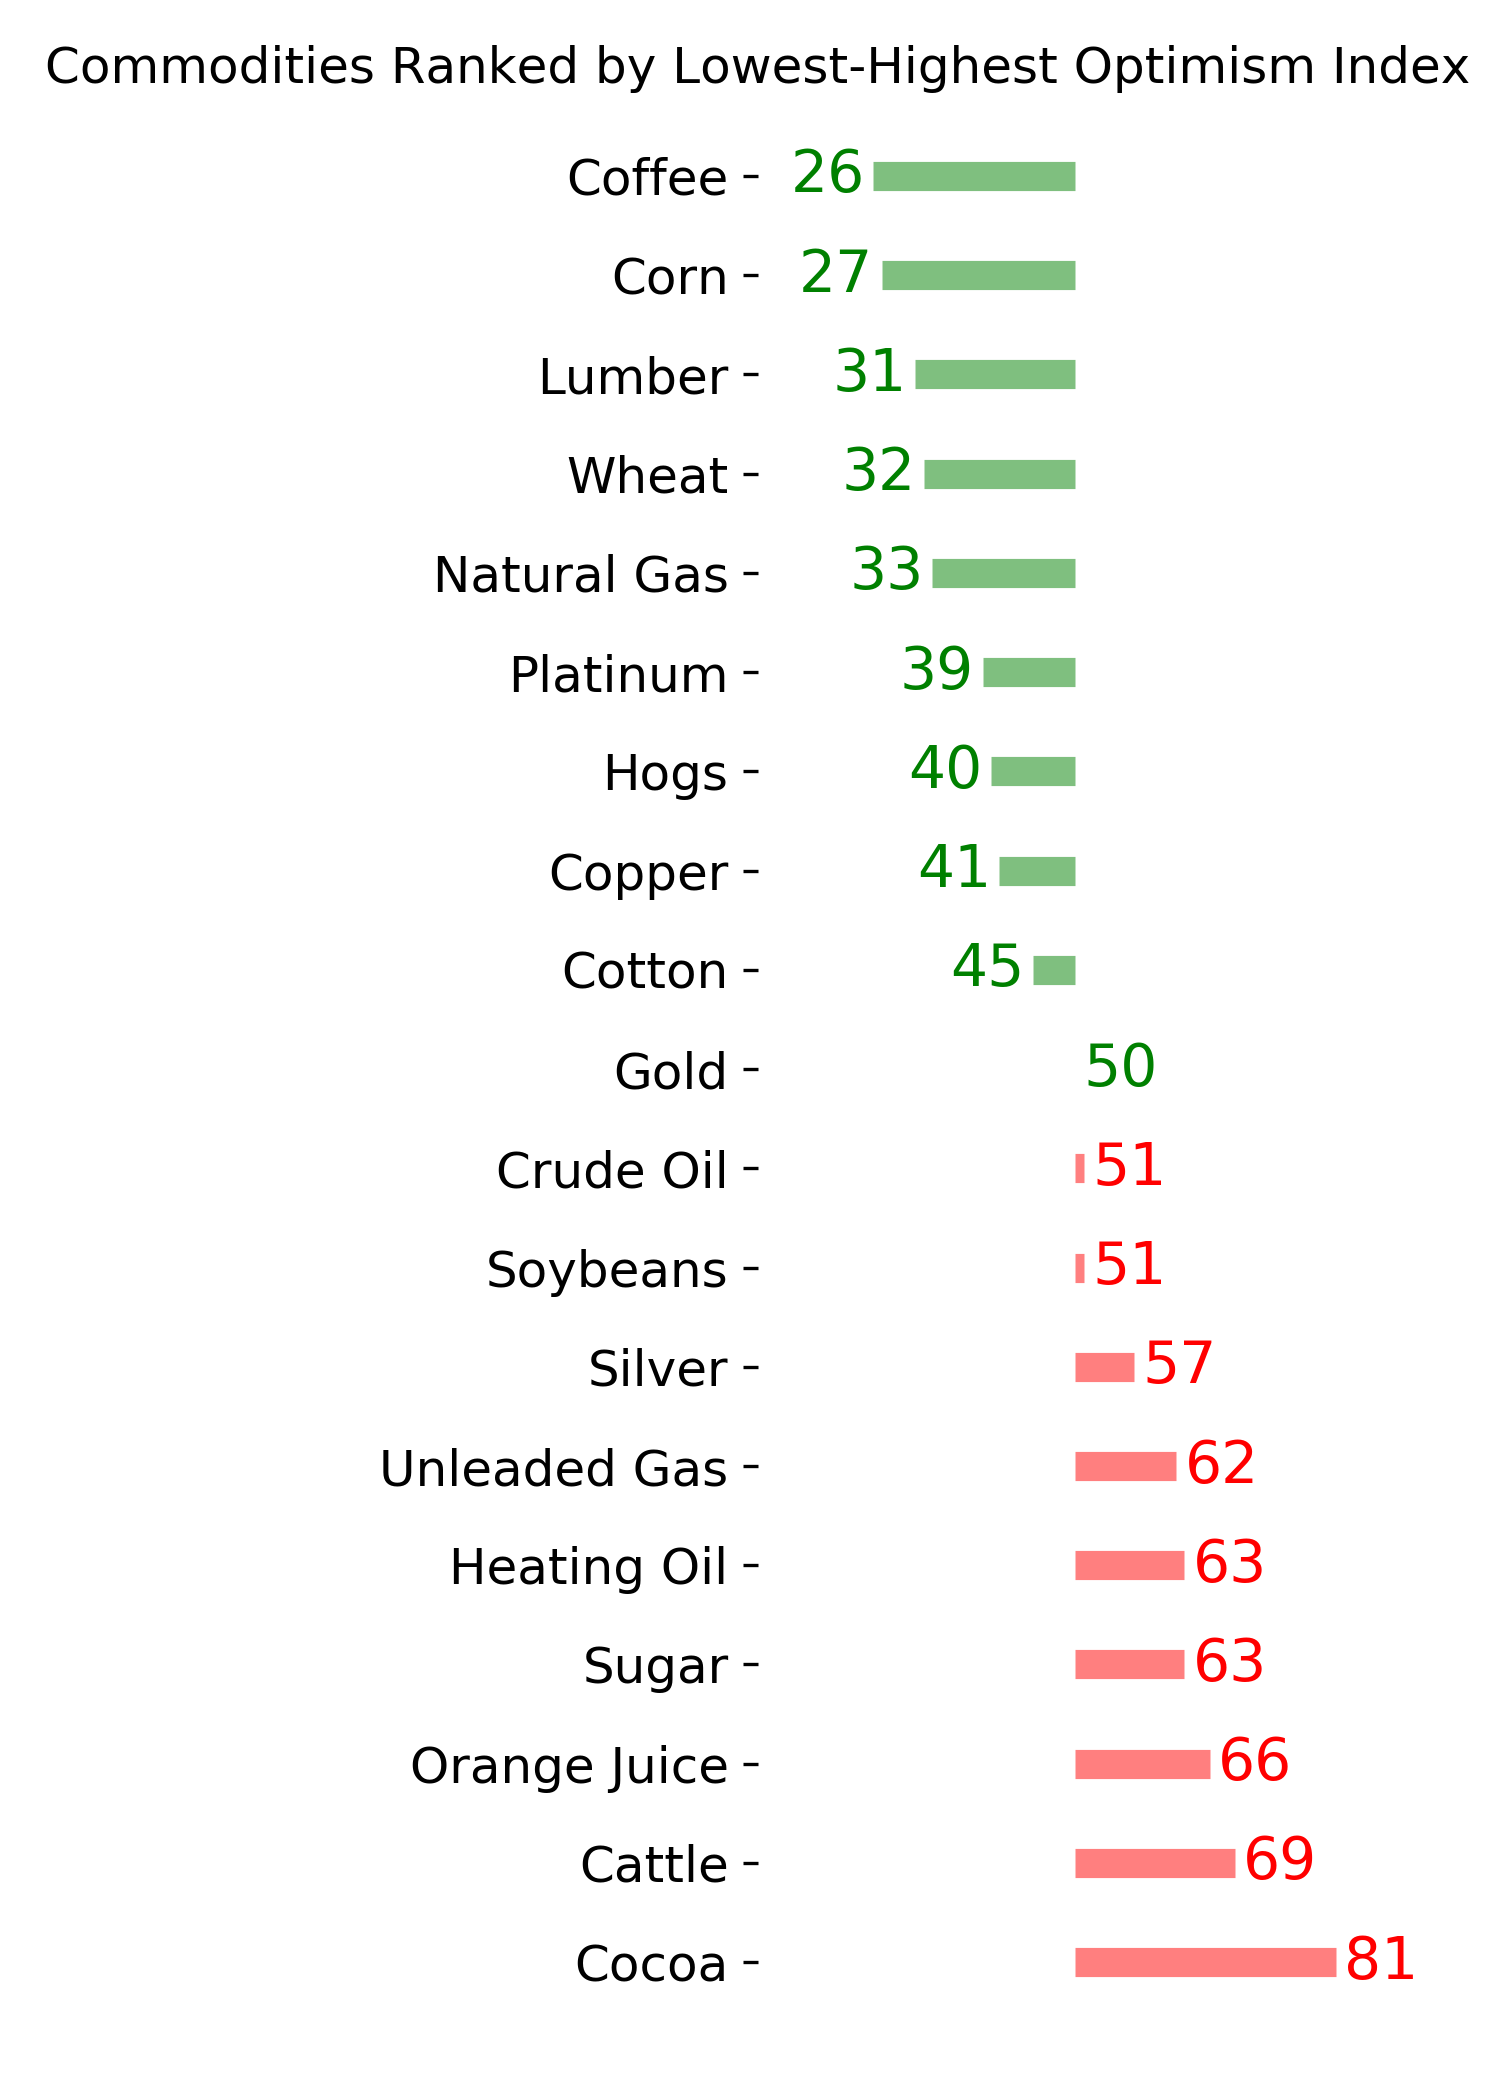
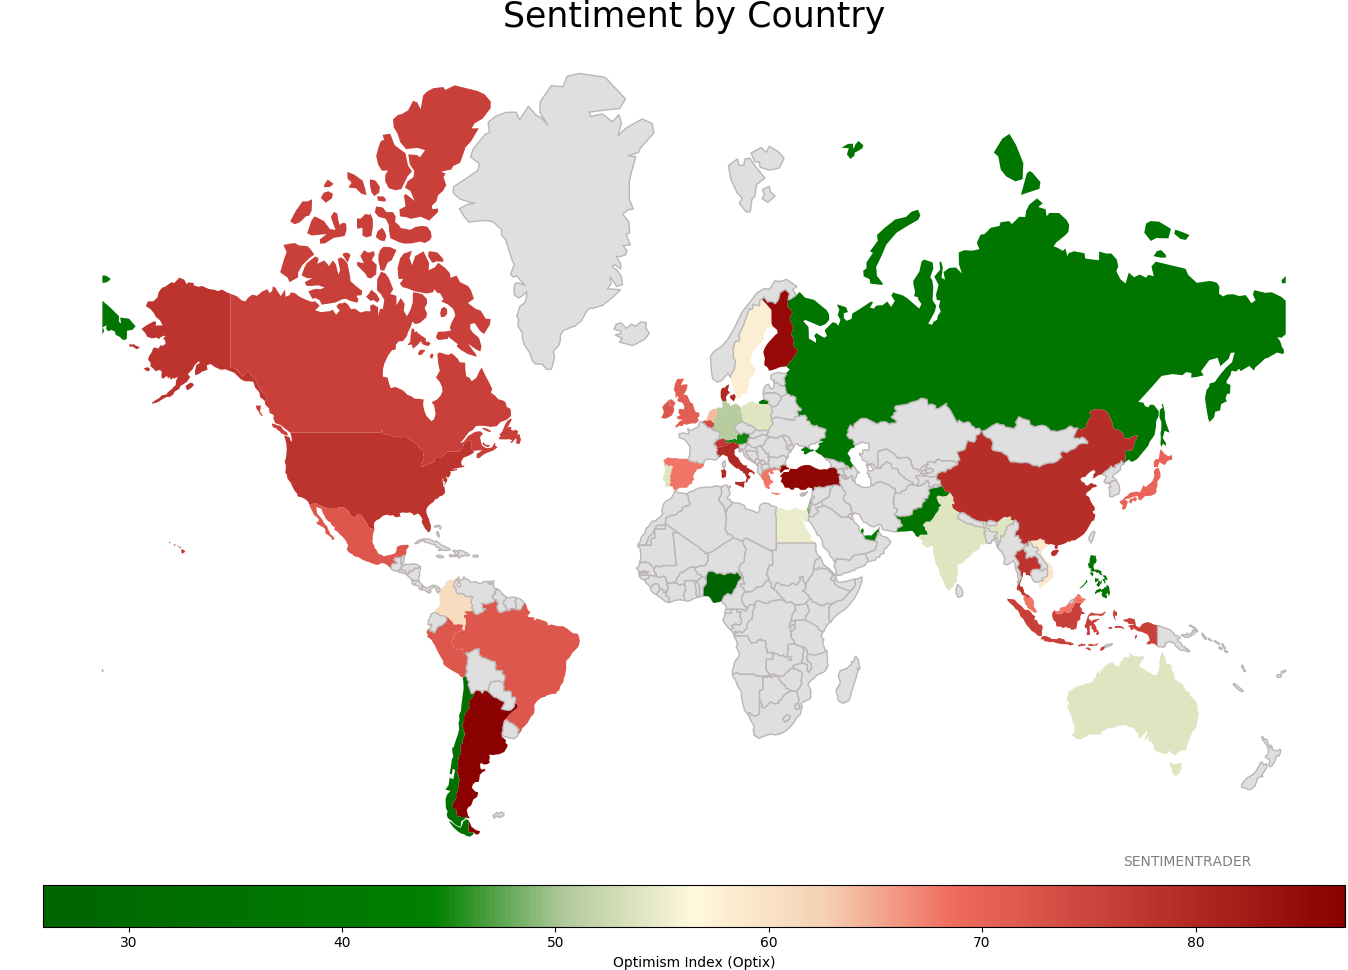
Sentiment Around The World
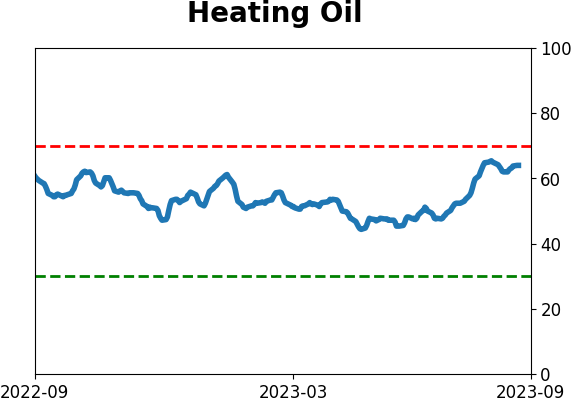
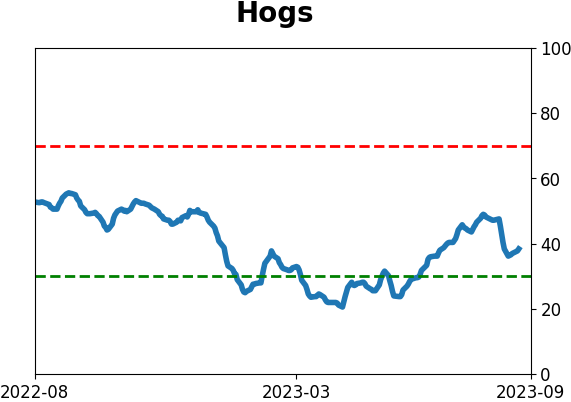
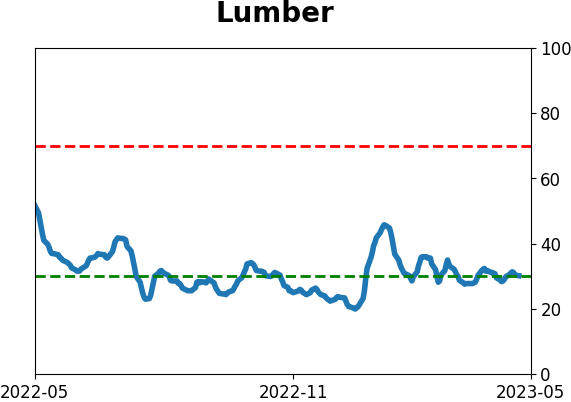
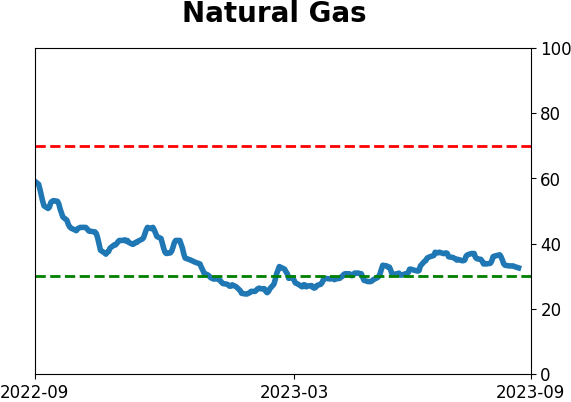
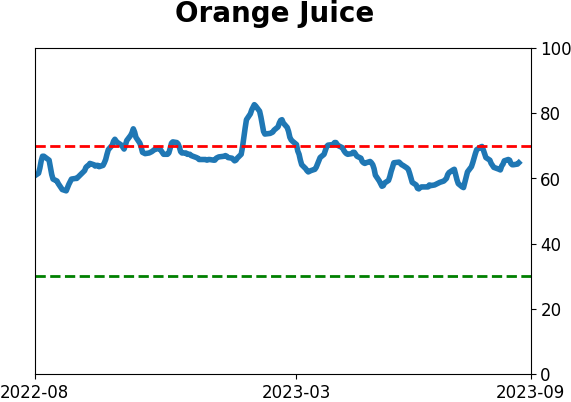
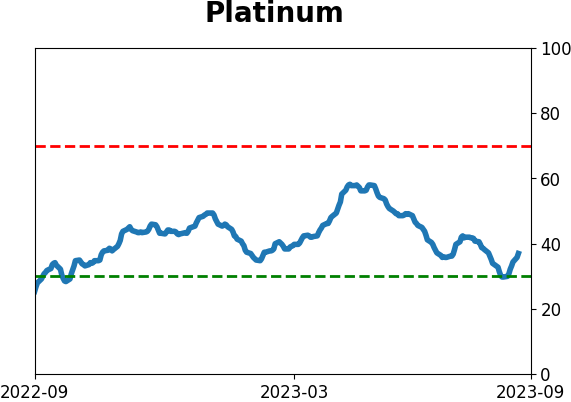
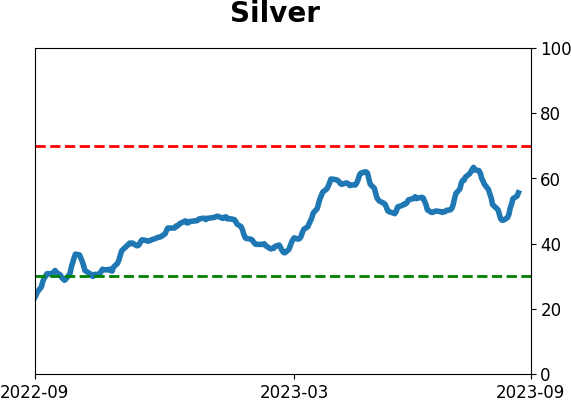
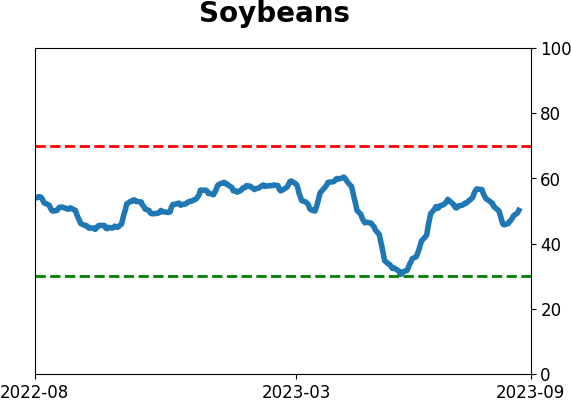
Optimism Index Thumbnails
|
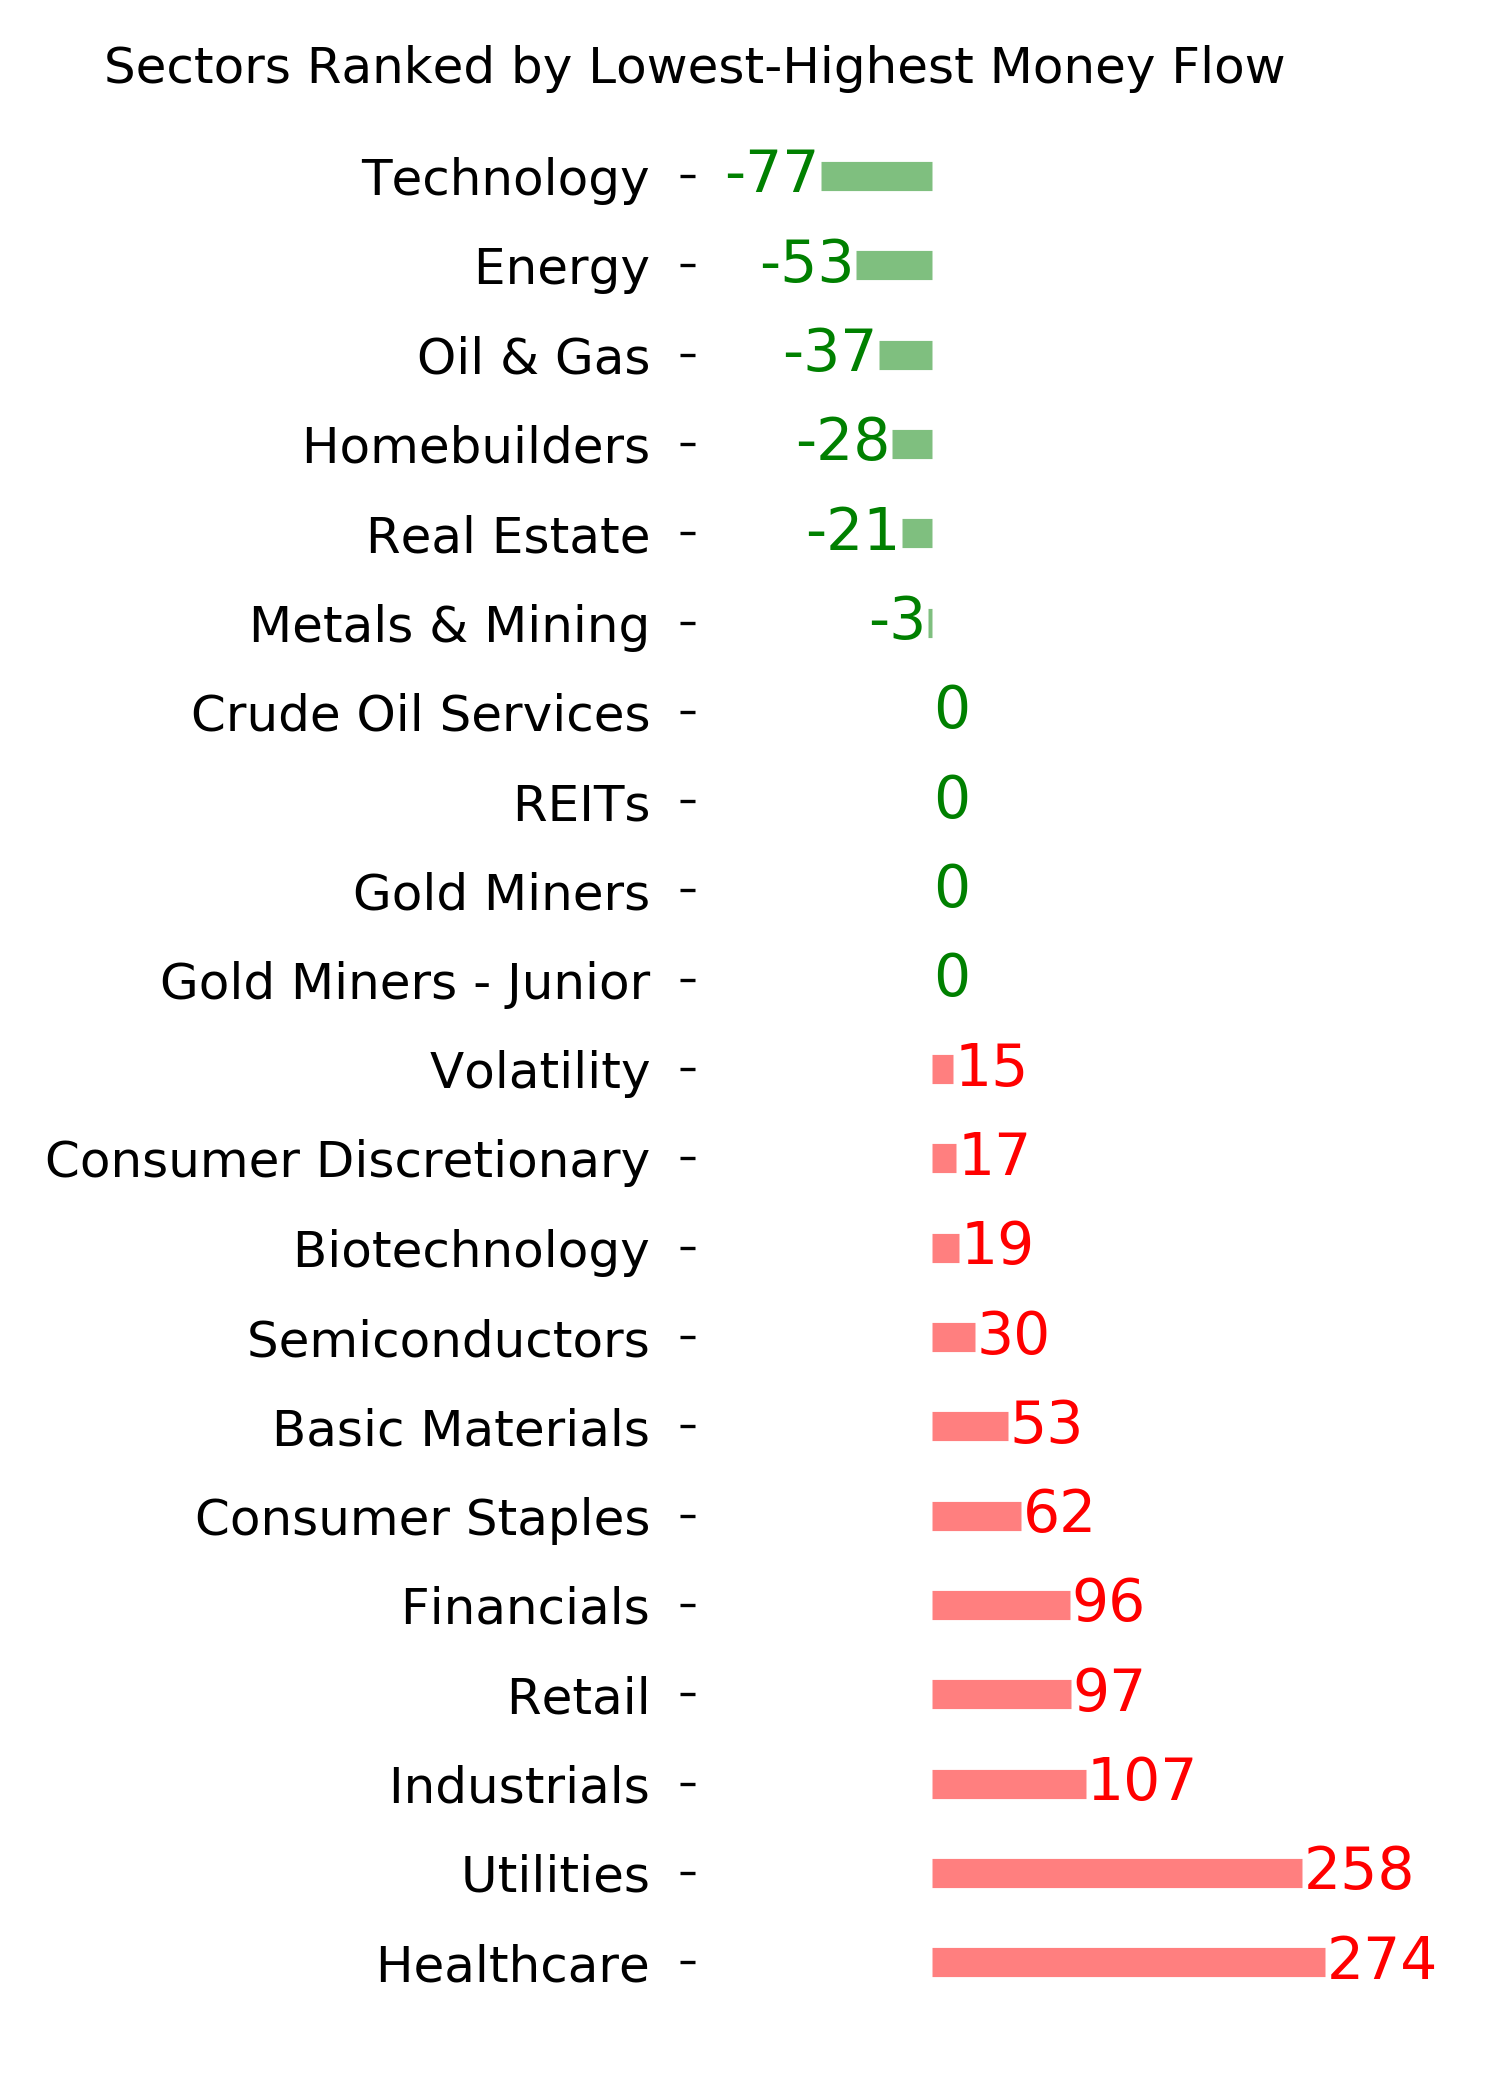
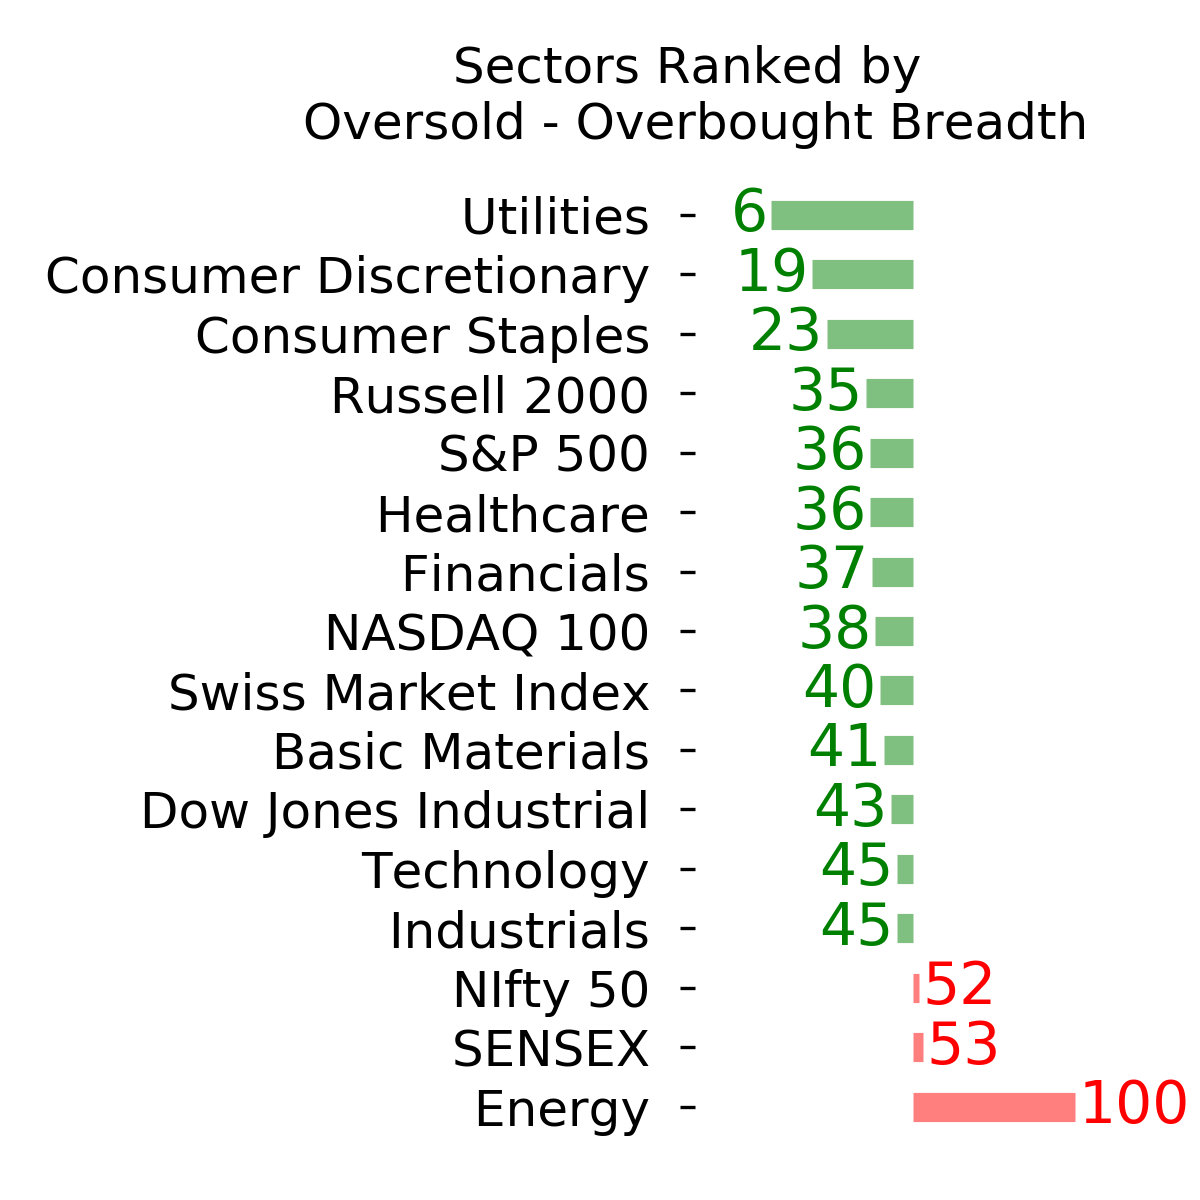
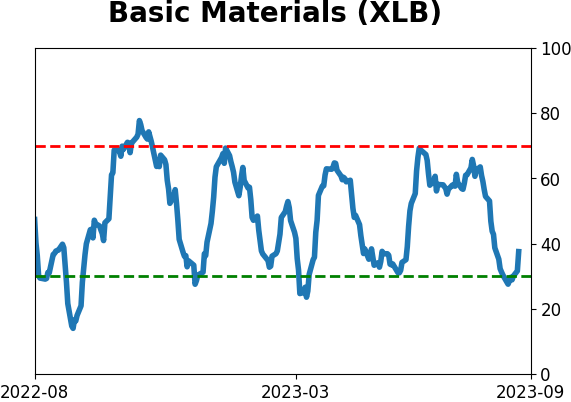
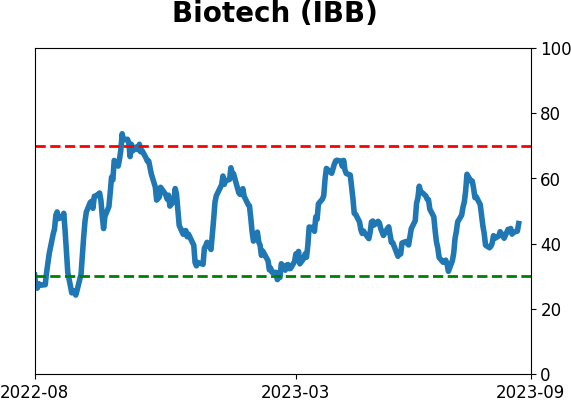
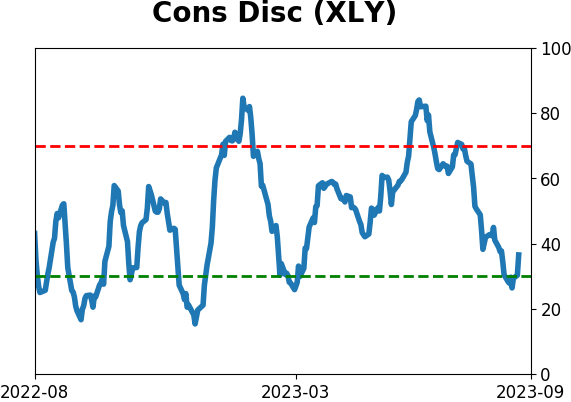
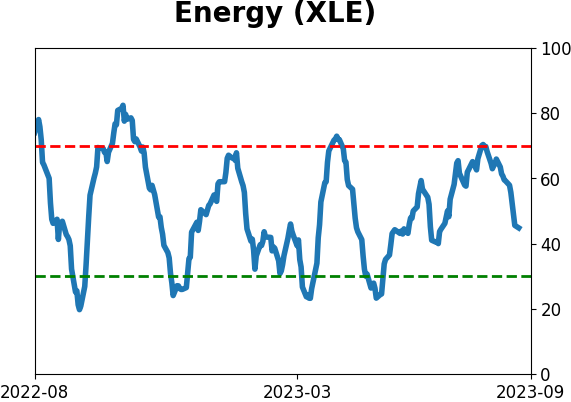
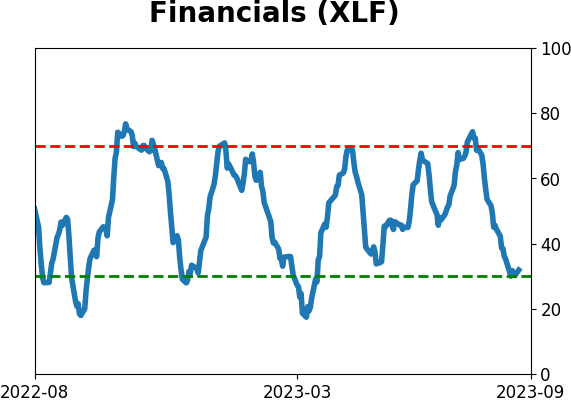
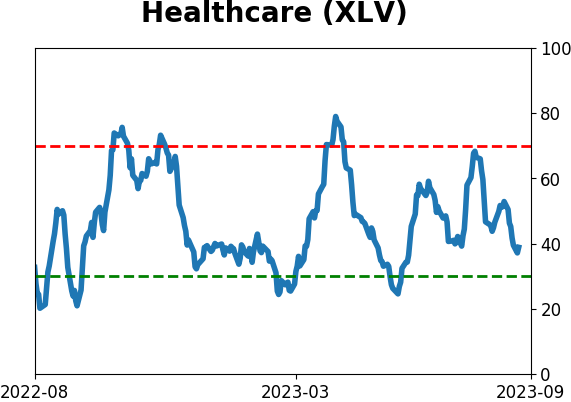
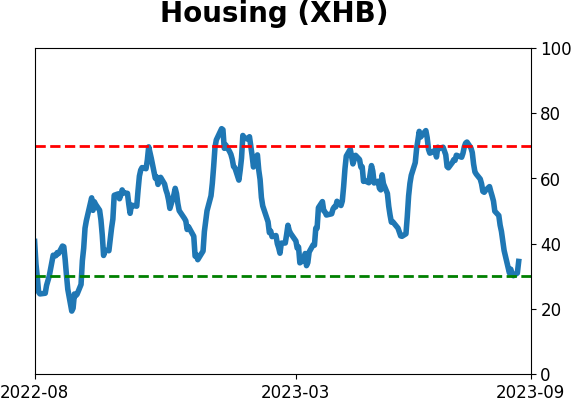
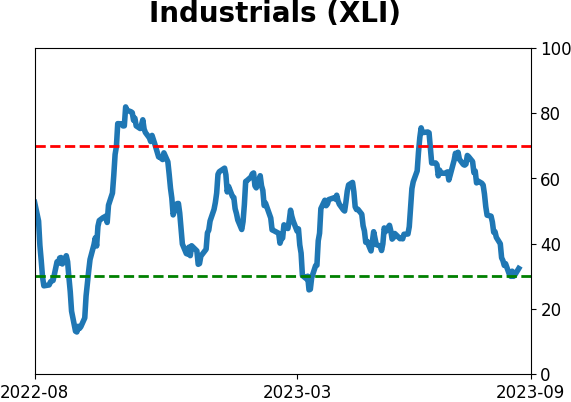
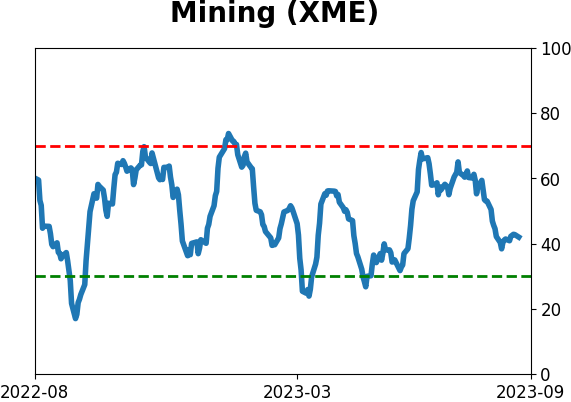
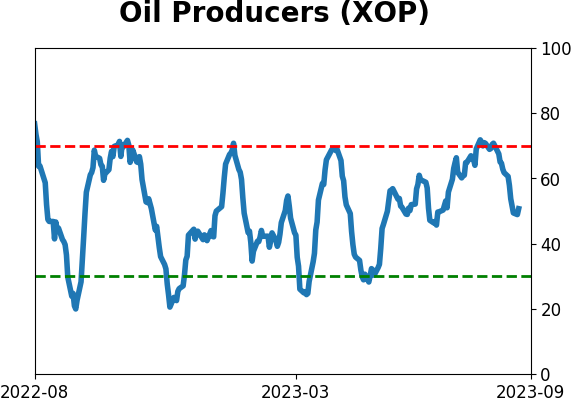
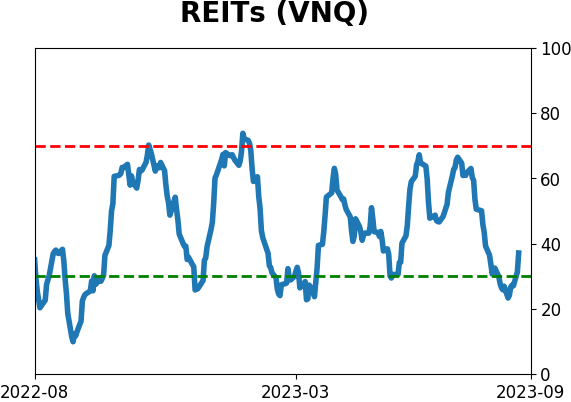
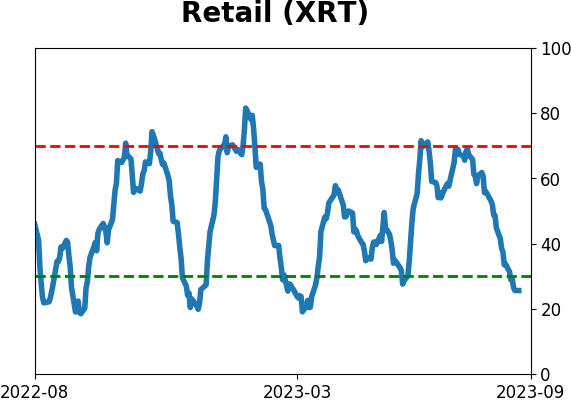
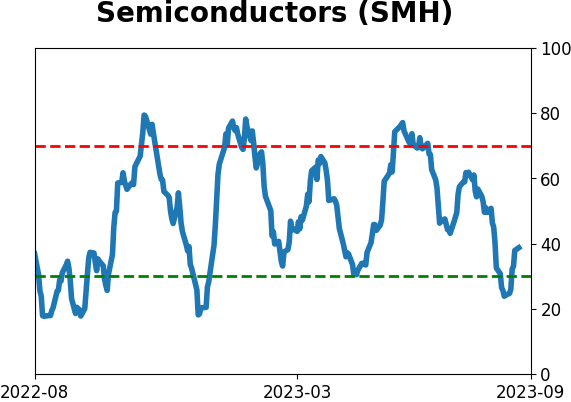
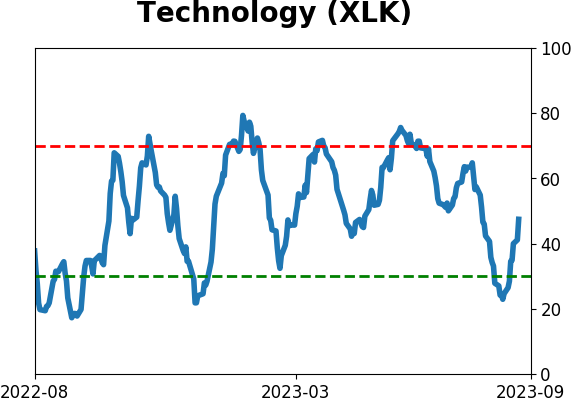
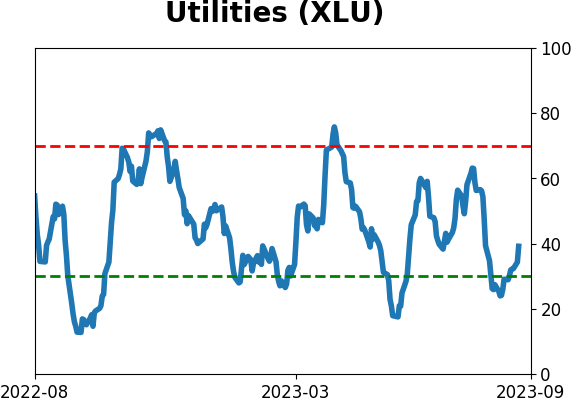
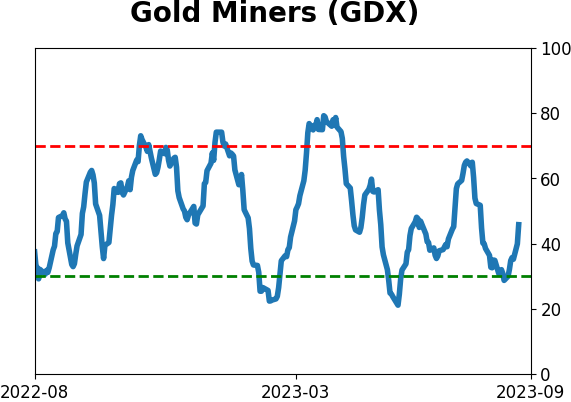
Sector ETF's - 10-Day Moving Average
|
|
|
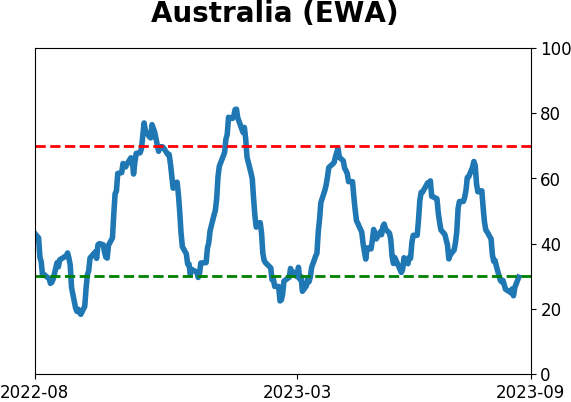
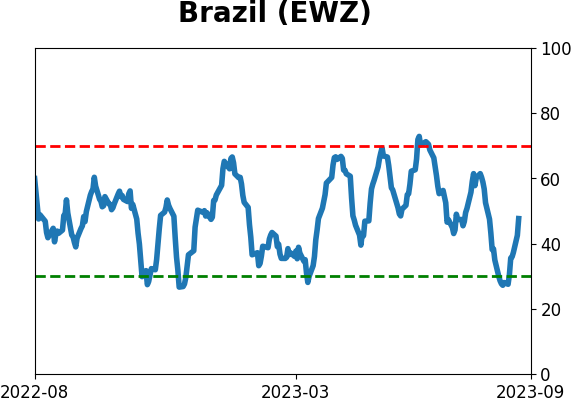
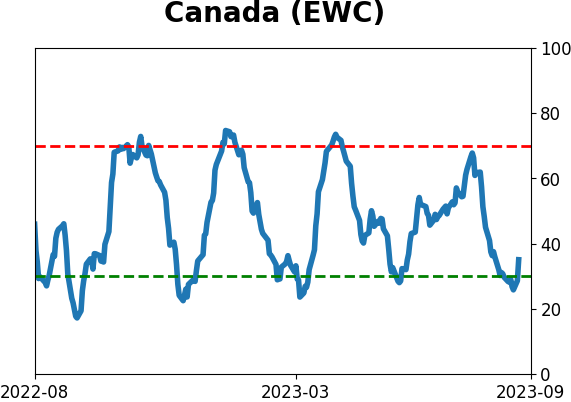
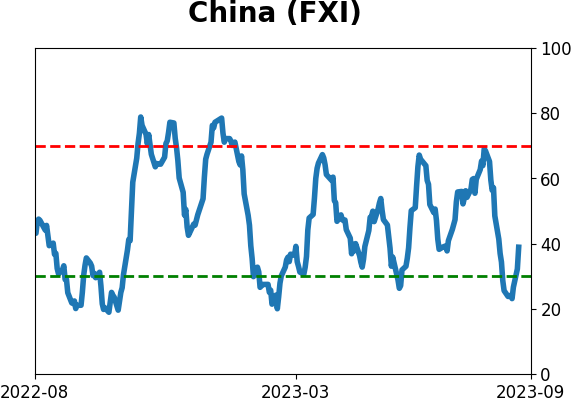
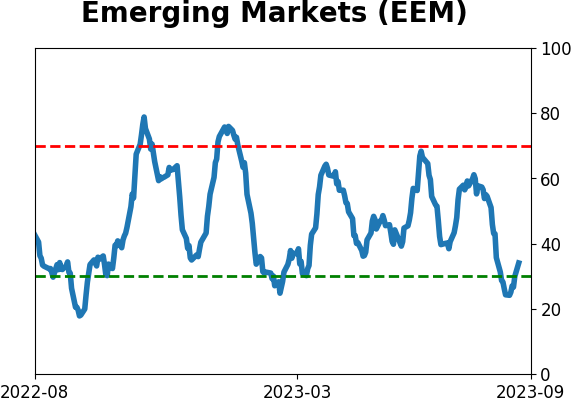
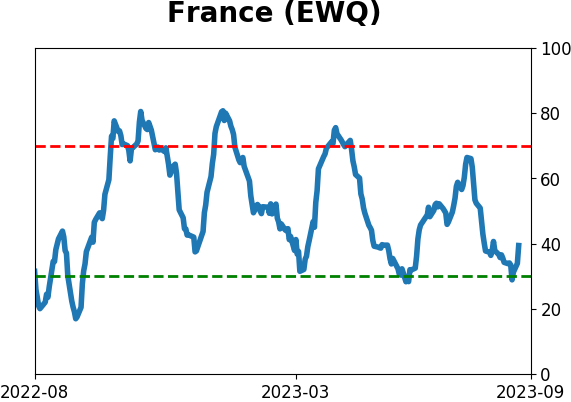
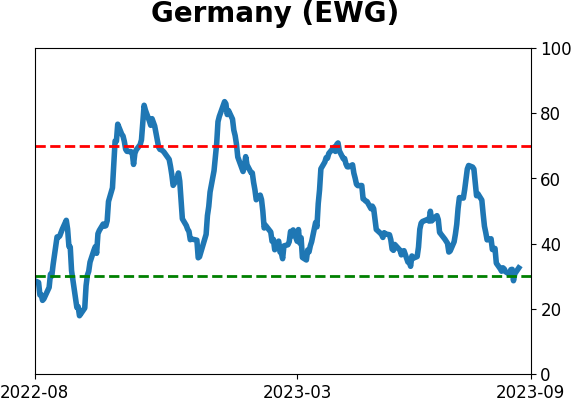
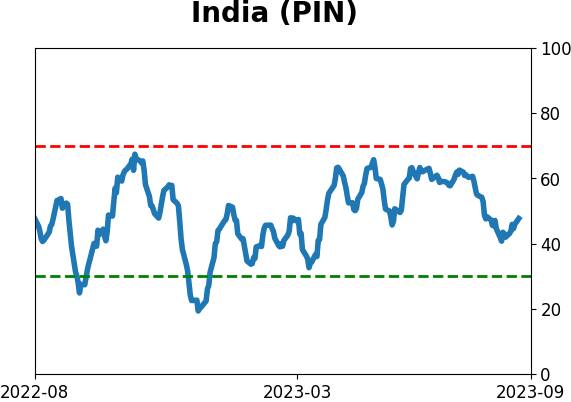
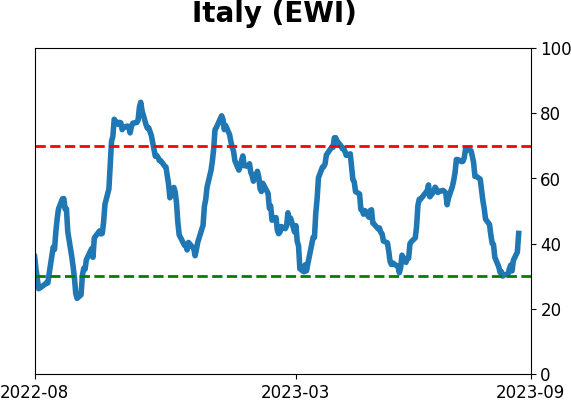
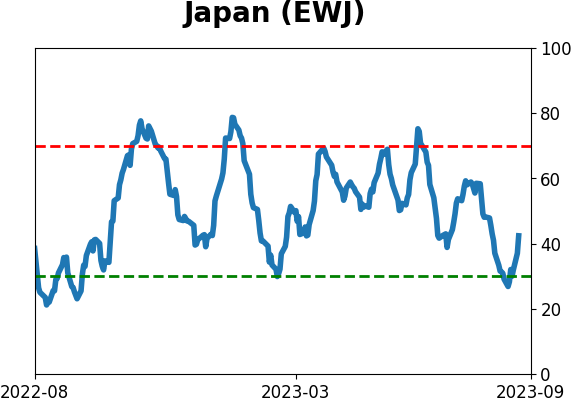
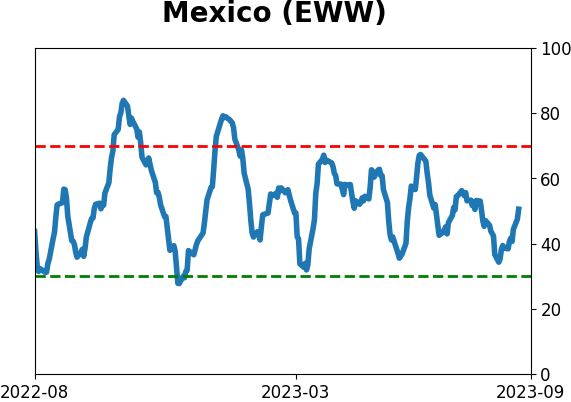
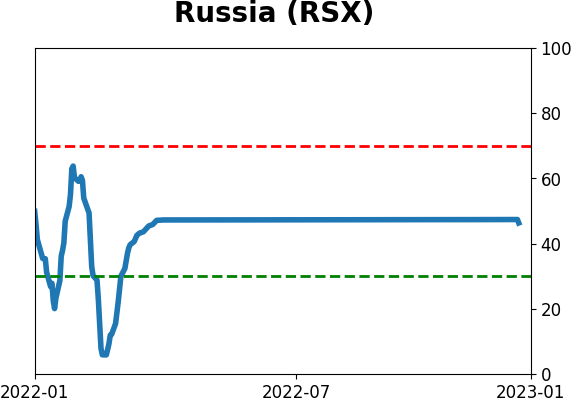
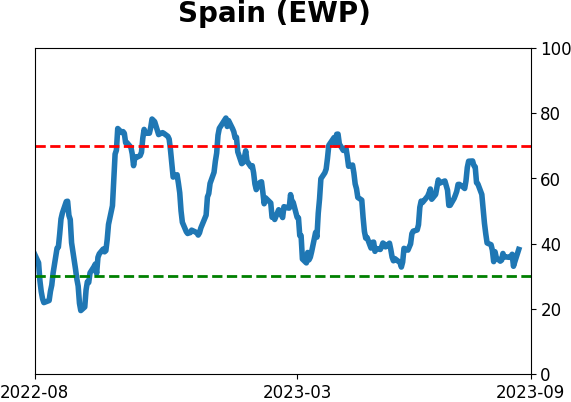
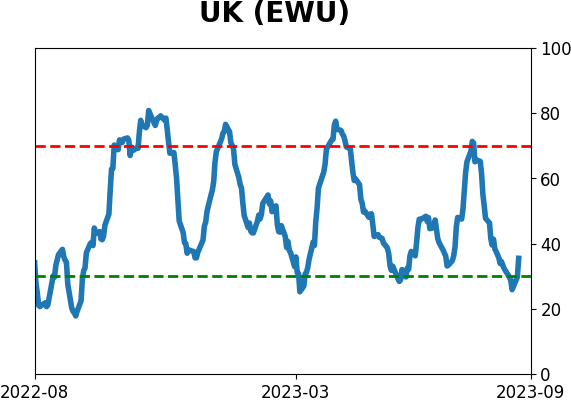
Country ETF's - 10-Day Moving Average
|
|
|
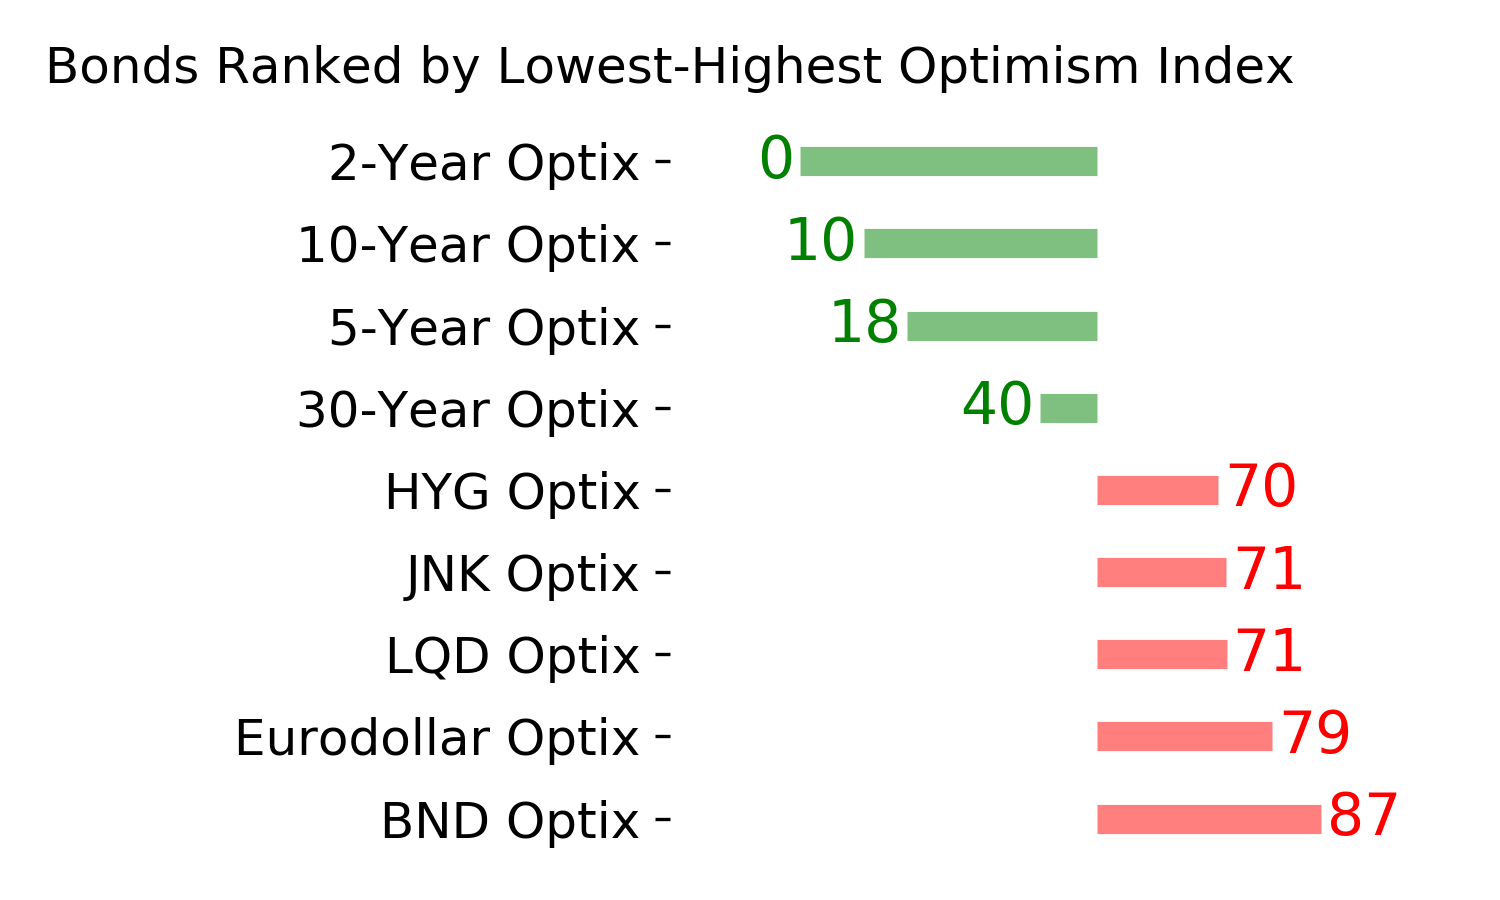
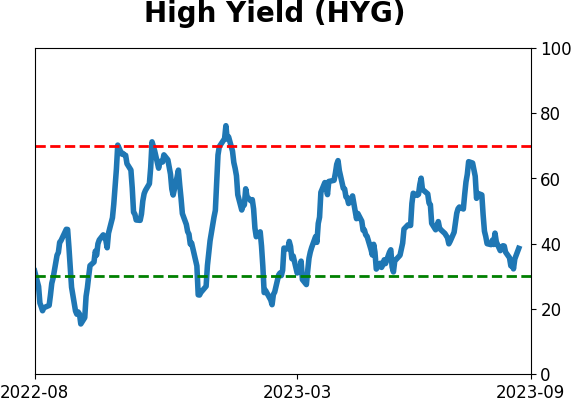
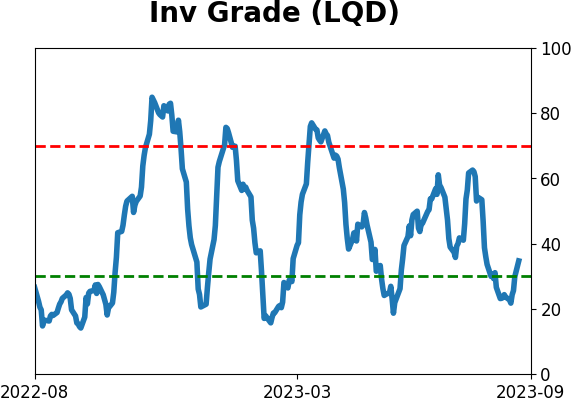
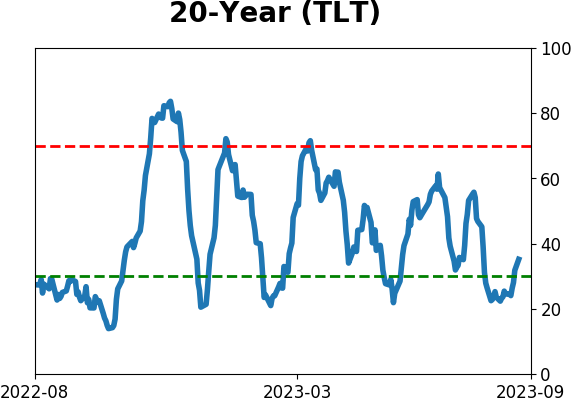
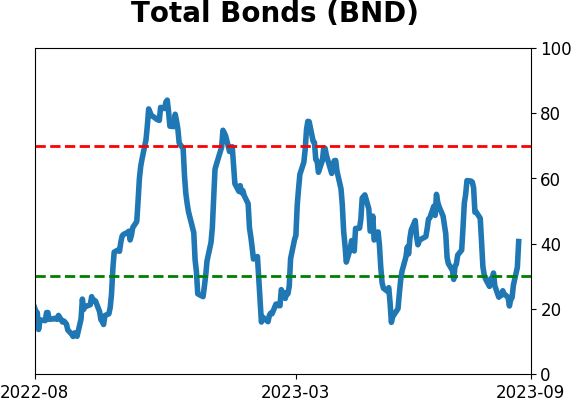
Bond ETF's - 10-Day Moving Average
|
|
|
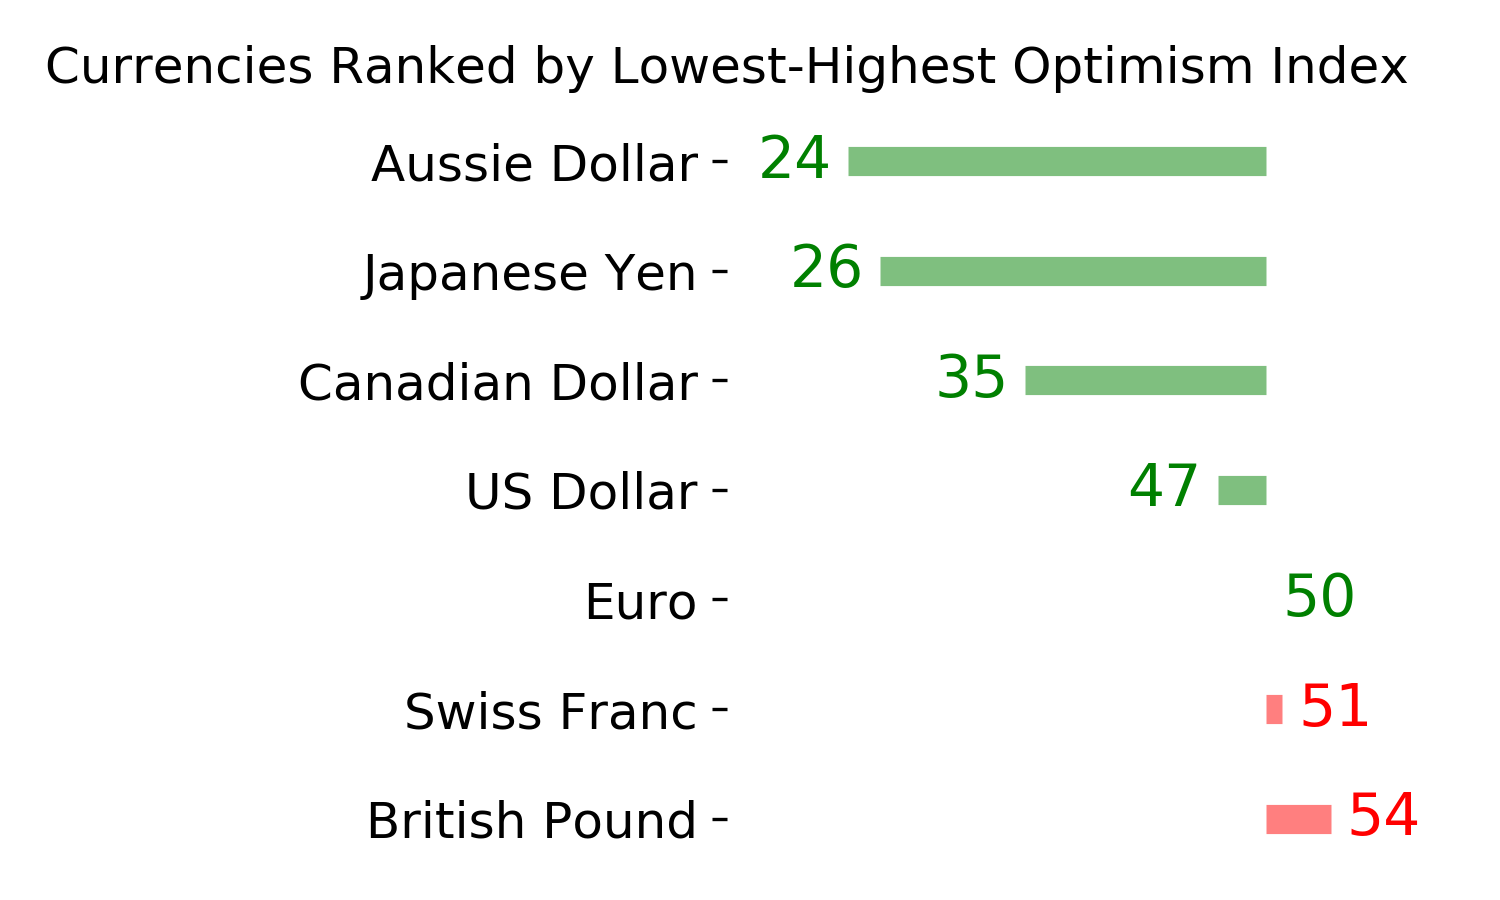
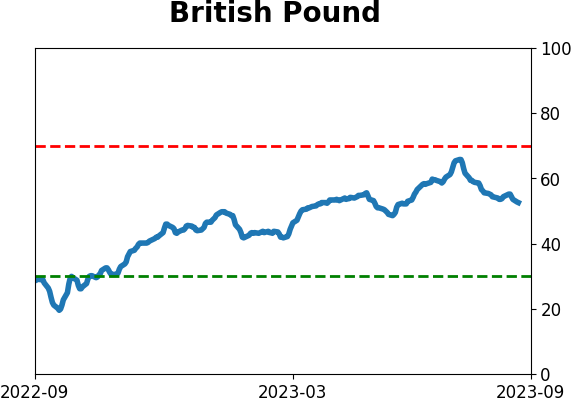
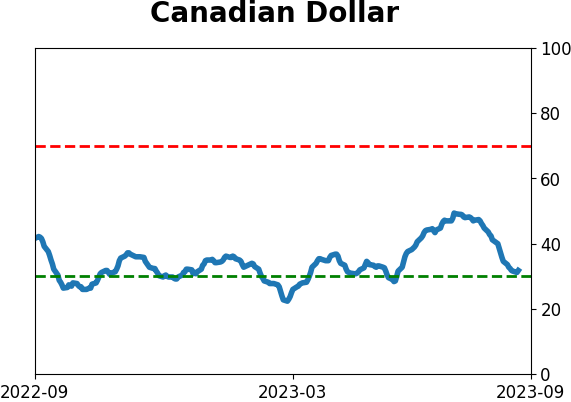
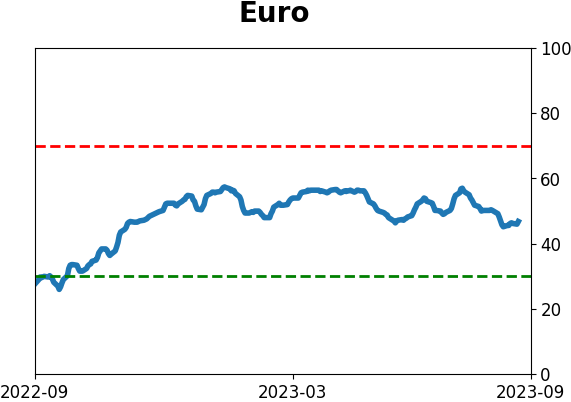
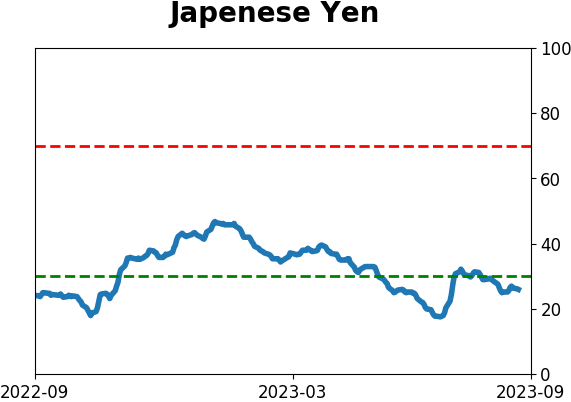
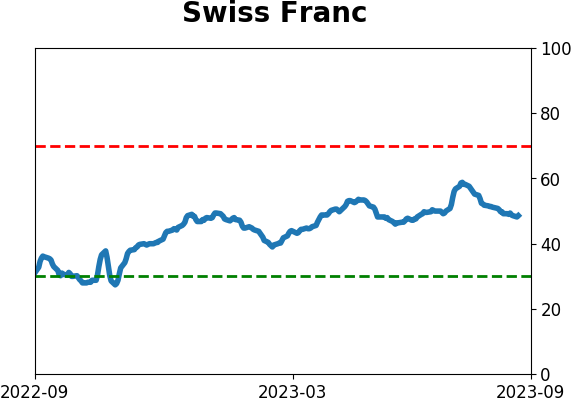
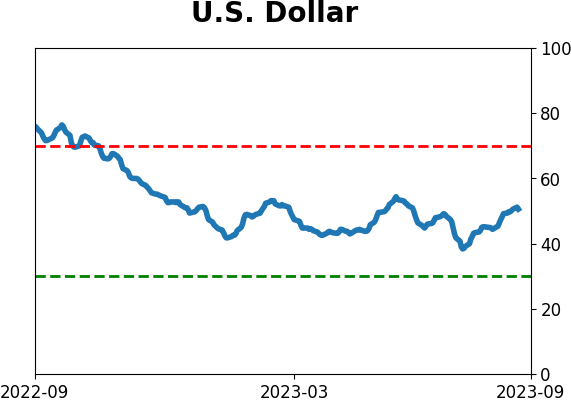
Currency ETF's - 5-Day Moving Average
|
|
|
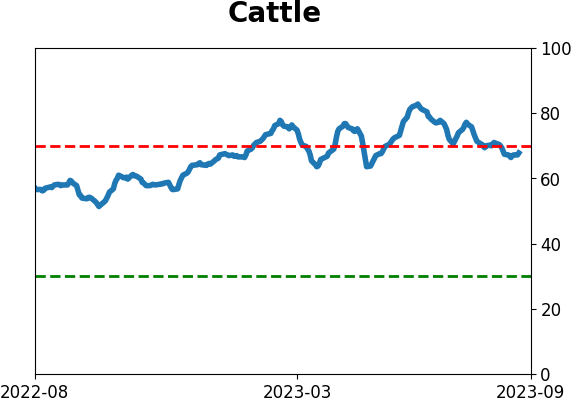
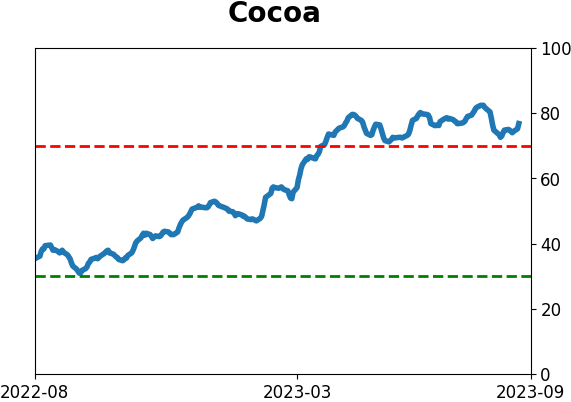
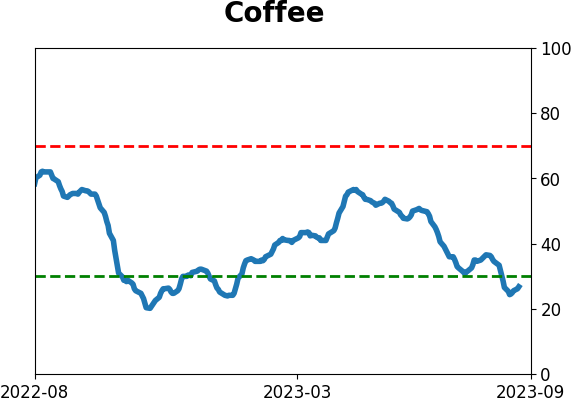
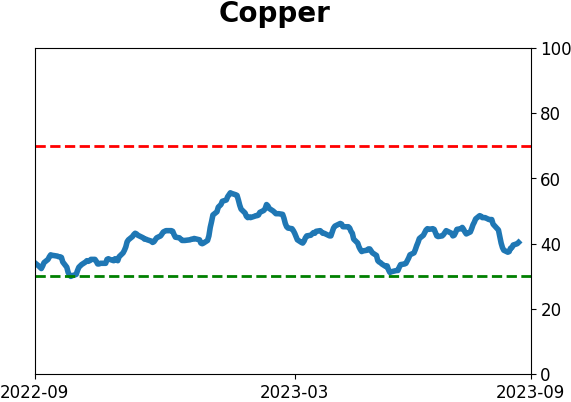
Commodity ETF's - 5-Day Moving Average
|
|