Headlines
|
|
Redux: The 20-Year Cycle (Part III):
This is a look back at a 2021 article written about the 20-year cycle in the stock market. This piece highlights 17 months within each 20 year cycle that have collectively experienced surprisingly - and consistently - poor performance.
|
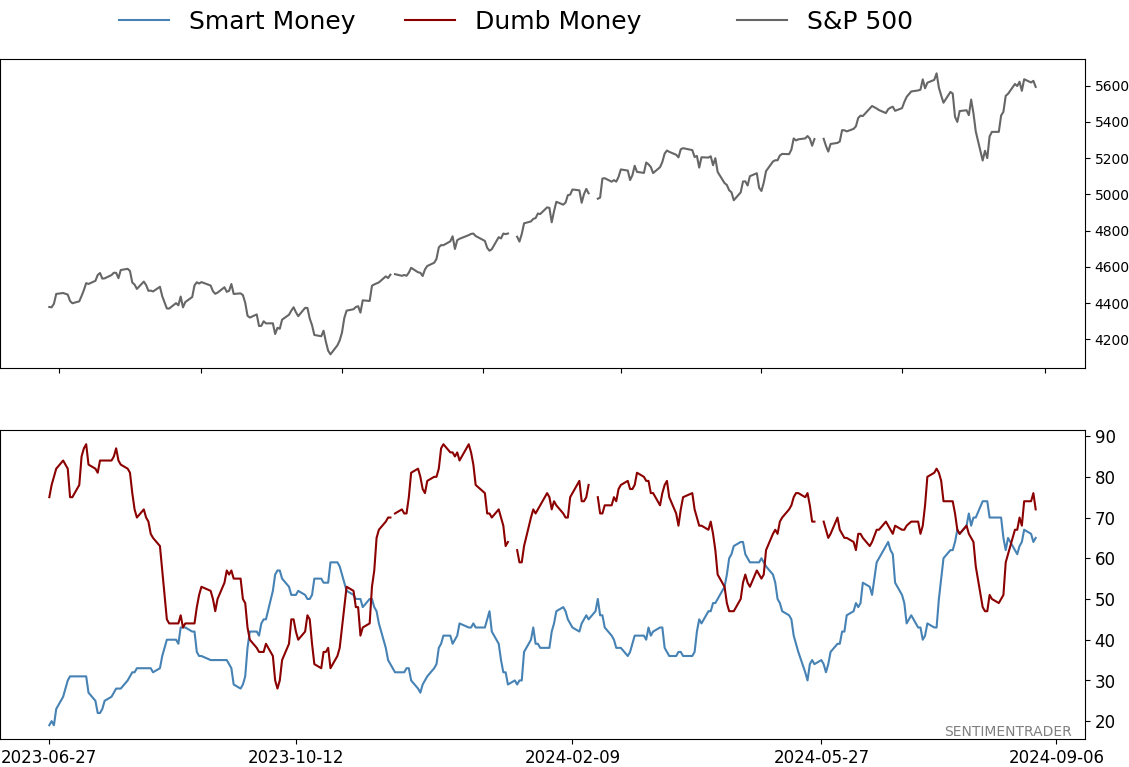
Smart / Dumb Money Confidence
|
Smart Money Confidence: 65%
Dumb Money Confidence: 72%
|
|
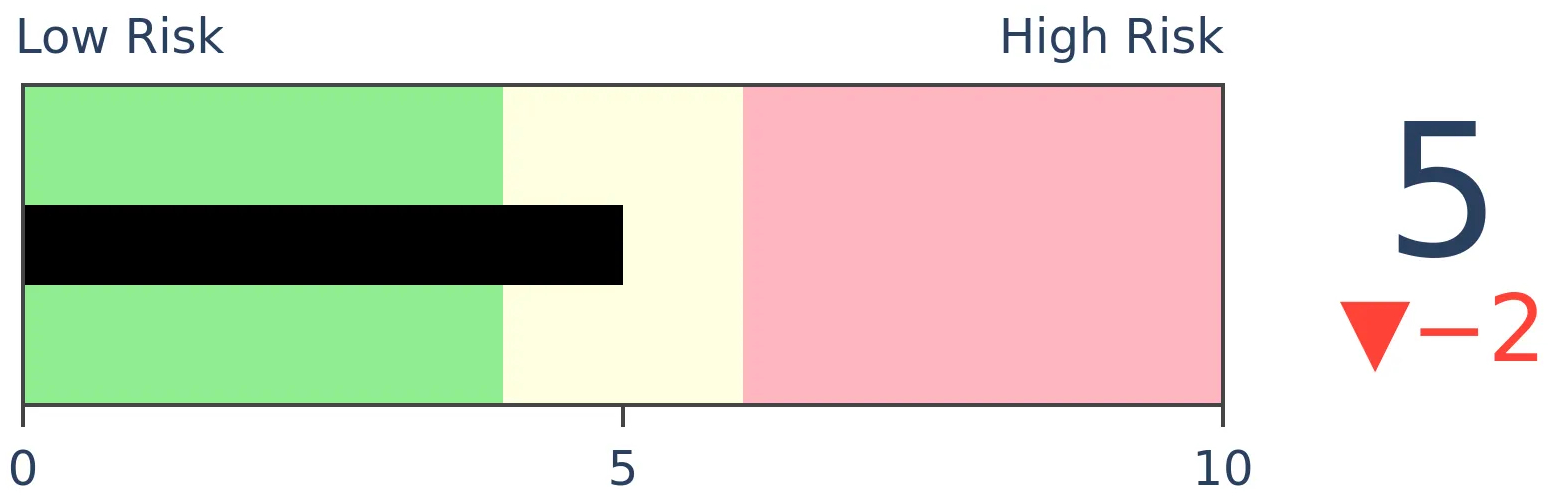
Risk Levels
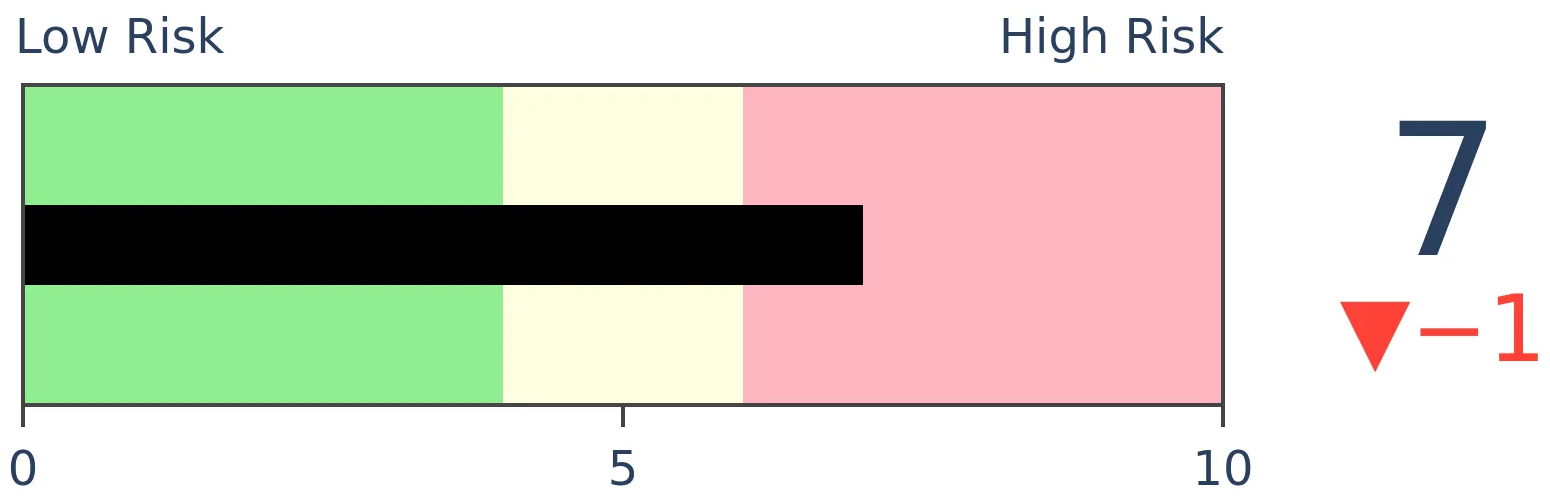
Stocks Short-Term
|
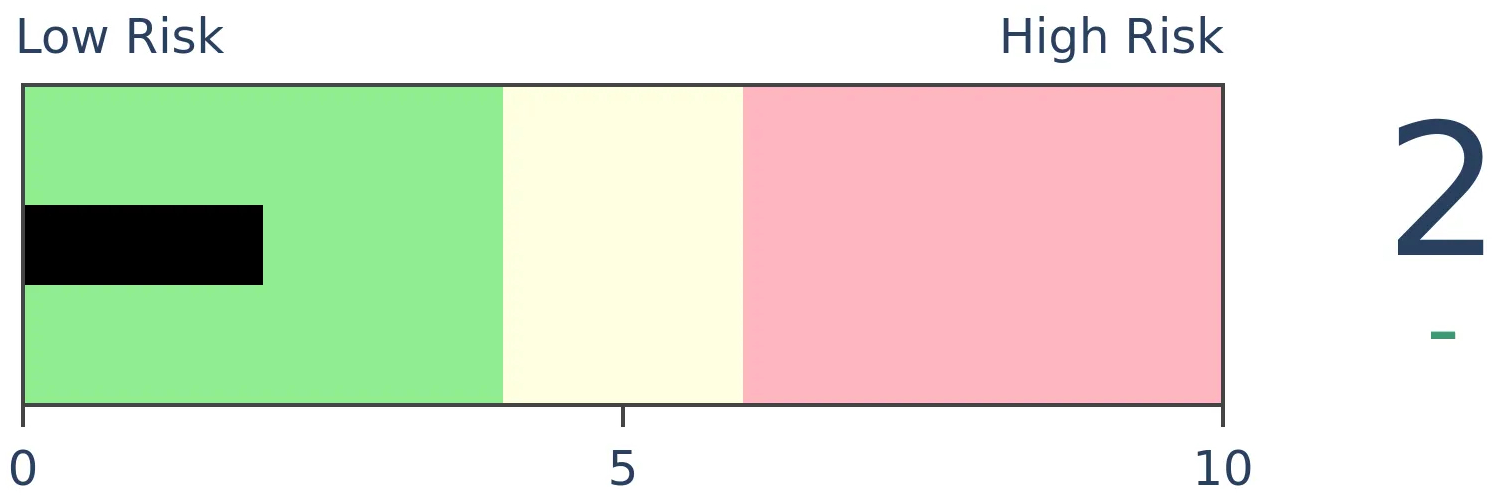
Stocks Medium-Term
|
|
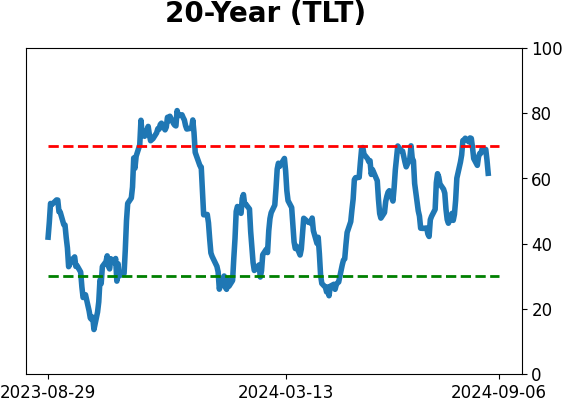
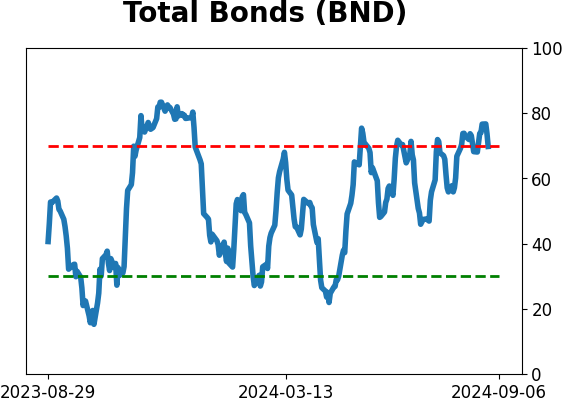
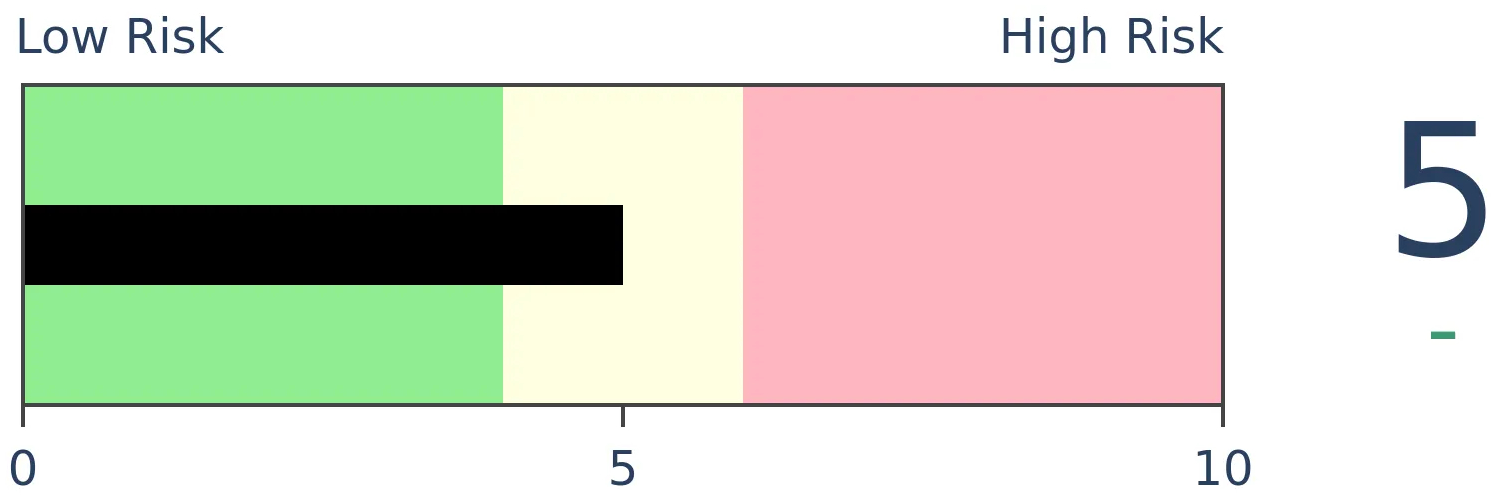
Bonds
|
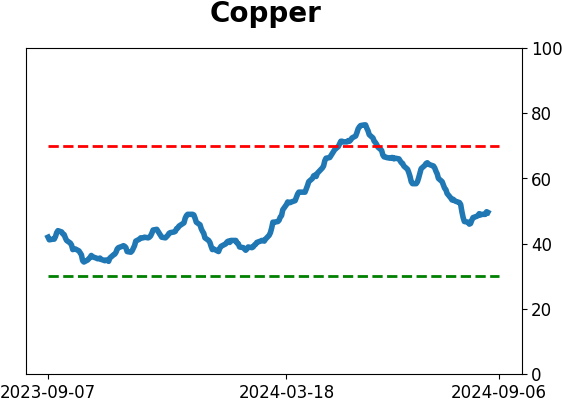
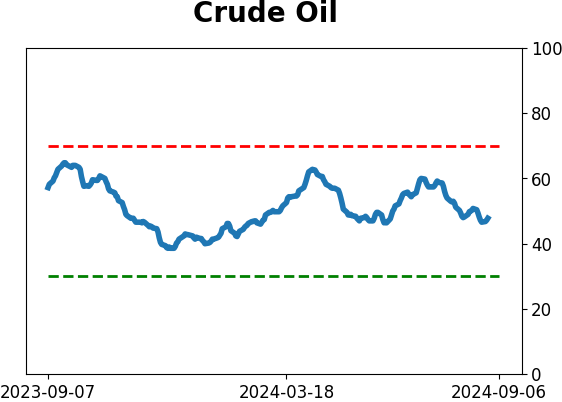
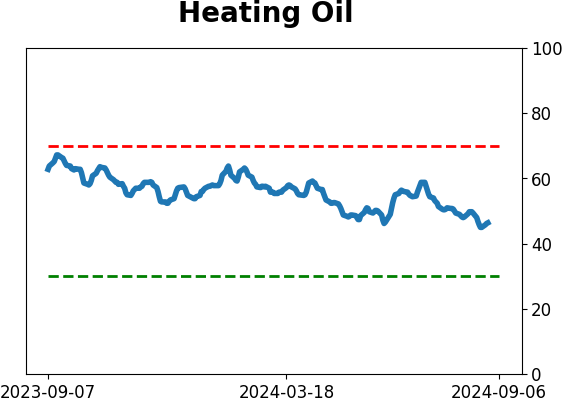
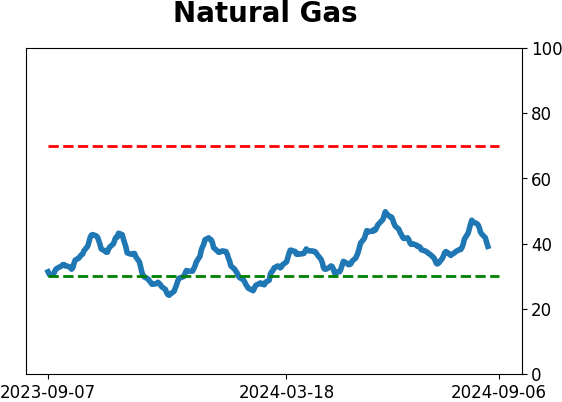
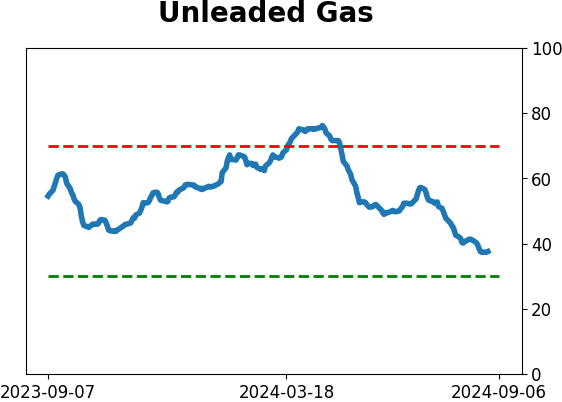
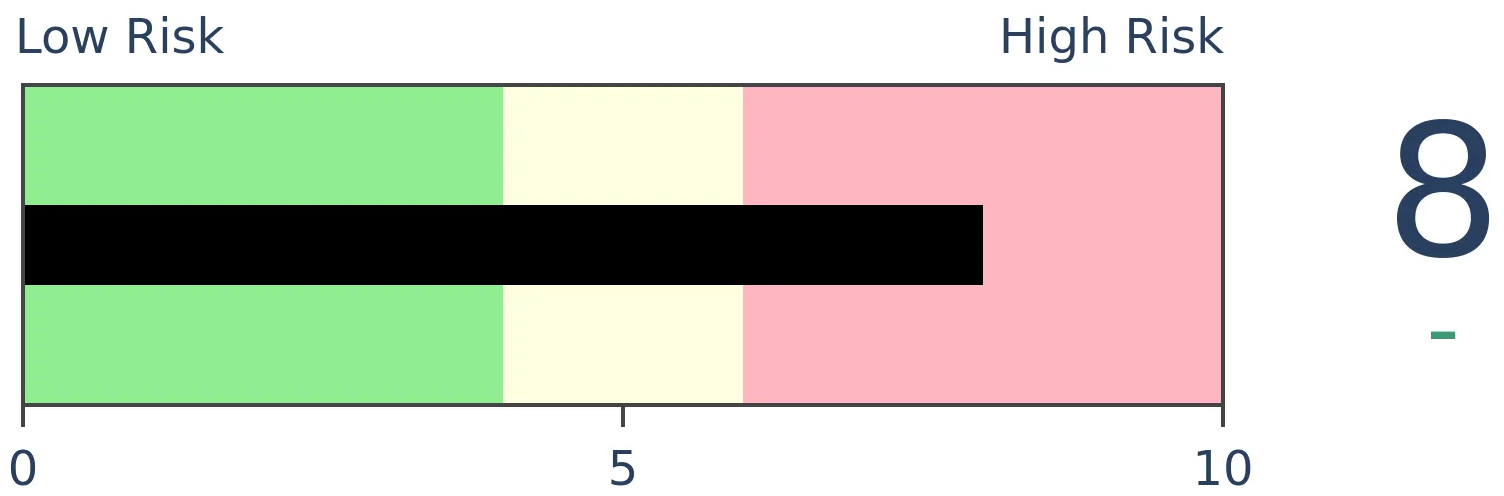
Crude Oil
|
|
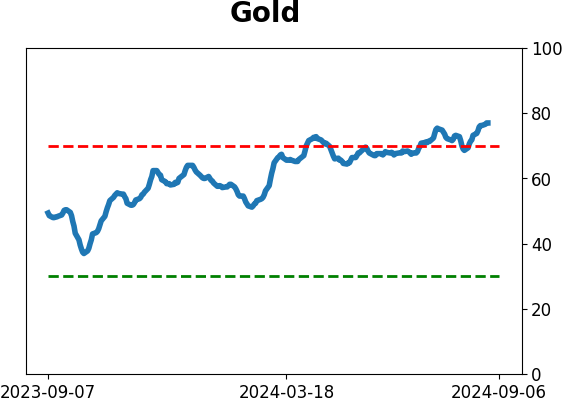
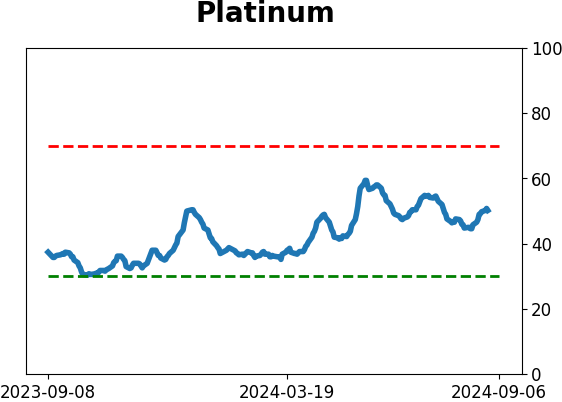
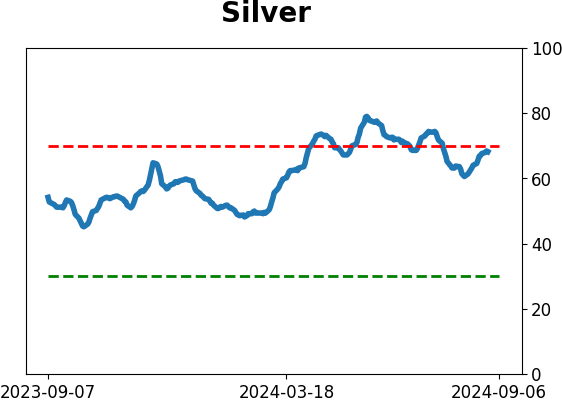
Gold
|
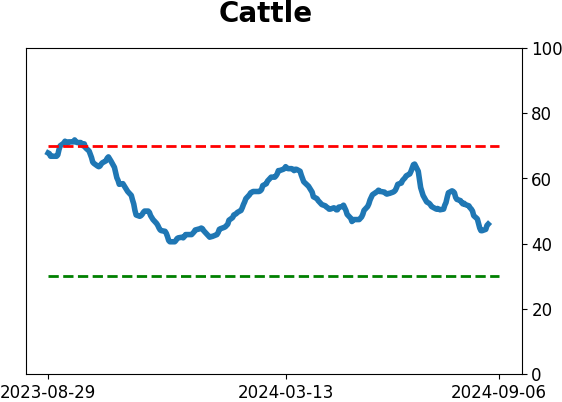
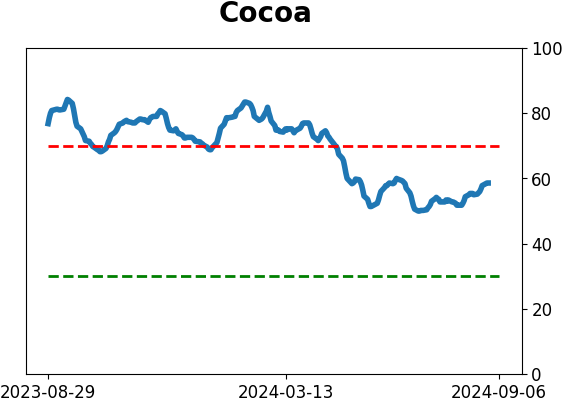
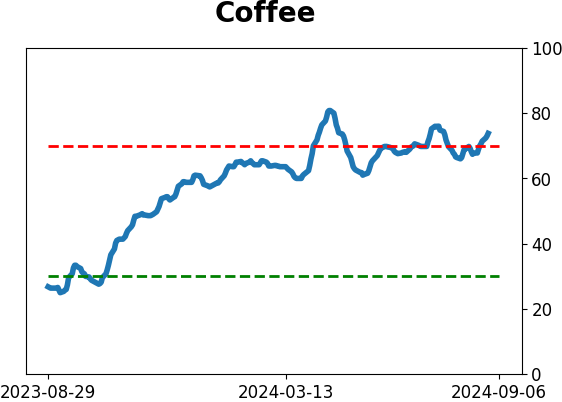
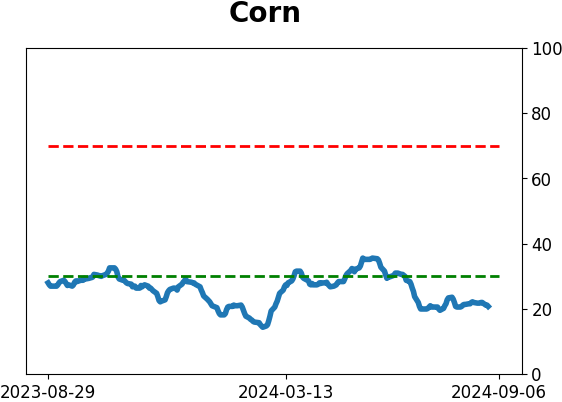
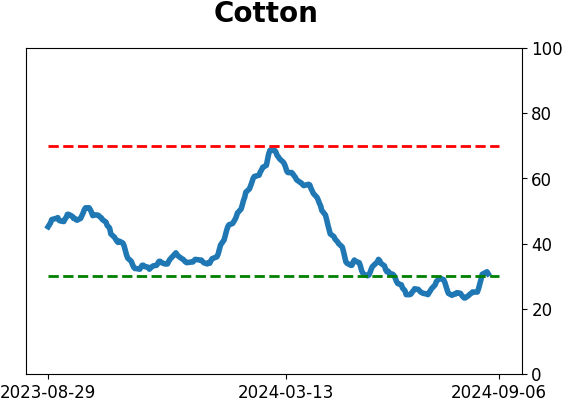
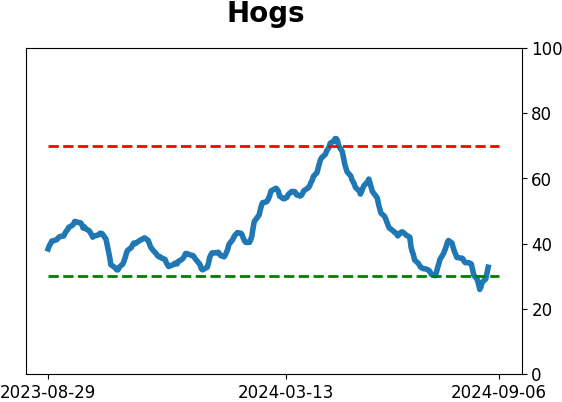
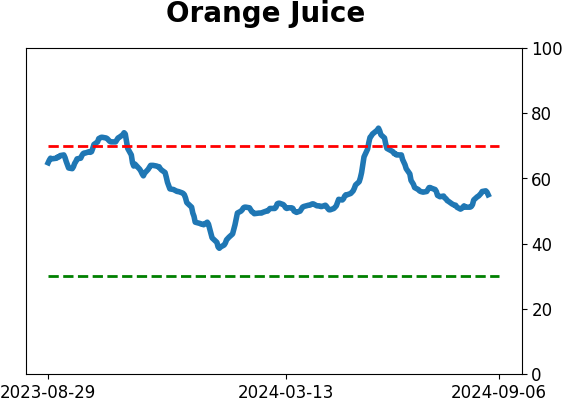
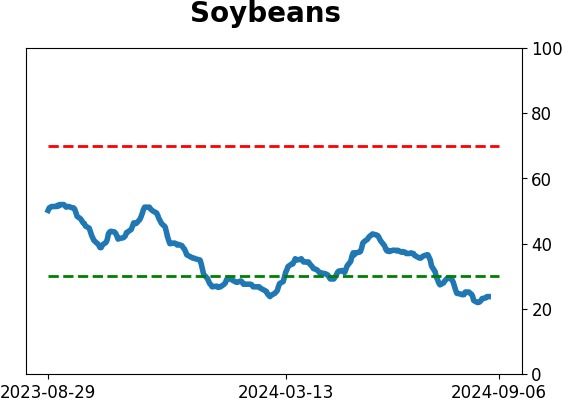
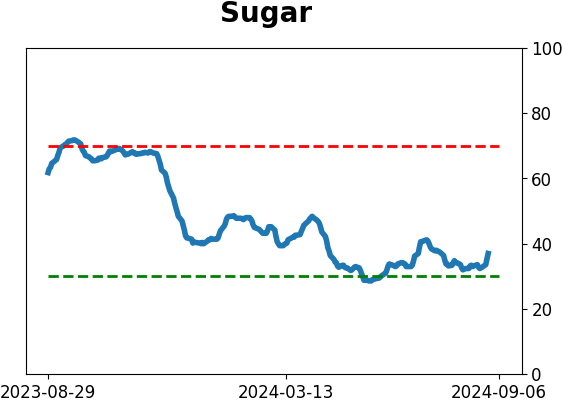
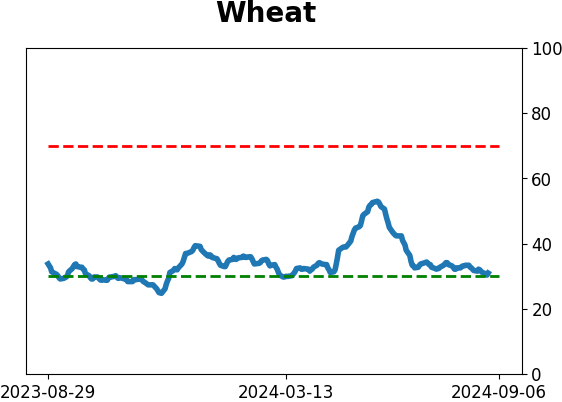
Agriculture

|
|
Research
By Jay Kaeppel
BOTTOM LINE
This is a look back at a 2021 article written about the 20-year cycle in the stock market. This piece highlights 17 months within each 20 year cycle that have collectively experienced surprisingly - and consistently - poor performance.
FORECAST / TIMEFRAME
None
|
I am on vacation this week but have decided to rerun some older pieces that have proven useful - and which will hopefully continue to be useful. This piece is Part III of a three-part series on the 20-Year Cycle in the stock market, which originally ran on 2021-02-12. It highlights 17 recurring months within each 20-year period which collectively have experienced surprisingly - and consistently - dreadful results.
This is Part III of a three-part series regarding the 20-year cycle in the stock market.
Part I of this series contained some "Bad News," and Part II contained some "Good News." Part III contains more bad news-that can potentially be twisted into good news. A close examination of stock market performance on a repetitive 20-year basis reveals some months that are consistently poor performers. That's the bad news. The good news is that by avoiding these particular months, an investor might be able to gain an "edge."
The 20-Year Pattern - Part III
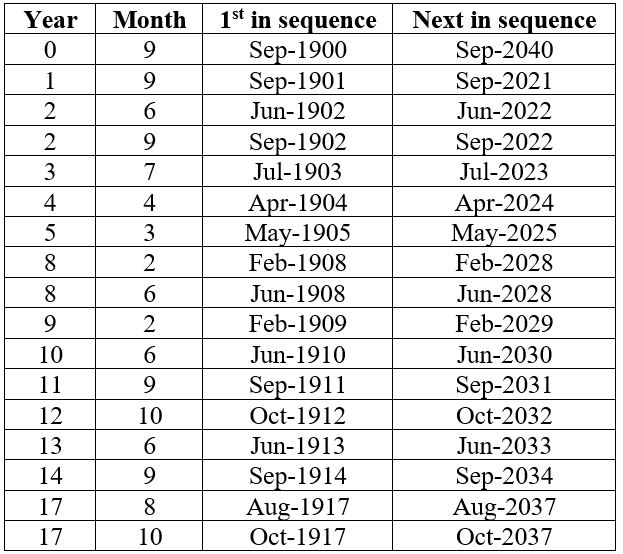
The months we will look at are what I refer to as the "Ugly 17". These are 17 months out of every 240 months (i.e., 20-year cycles starting in 1900) that have tended to witness poor stock market performance cycle after cycle.
For our purposes, each 20-year cycle starts with "Year 0" (i.e., 1900, 1920, 1940, etc.) and ends with "Year 19" (i.e., 1919, 1939, 1959, etc.).
For openers, let's consider just one example. The first month in the "Ugly 17" is "September of Year 0." The figure below displays the price change for the Dow Jones Industrial Average during that month in the past.
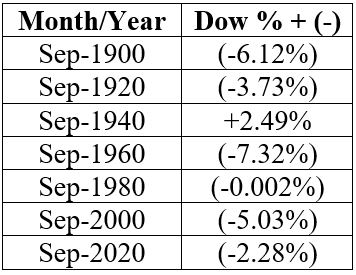
As you can see, every 20 years (starting in 1900) - with one exception (1940) - the month of September has come up a clinker. This represents only one of the "Ugly 17" months. The others are:
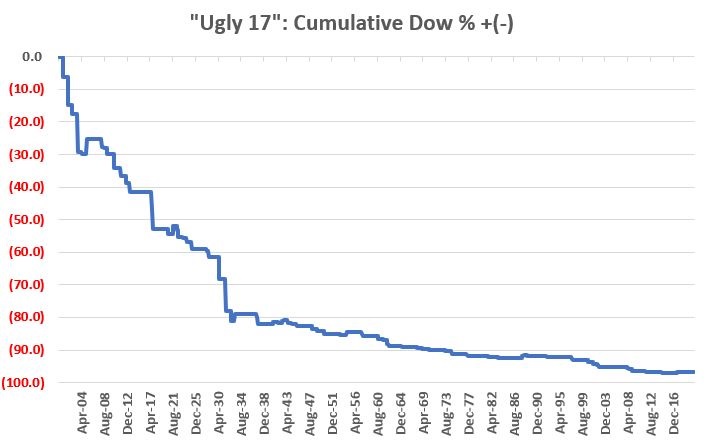
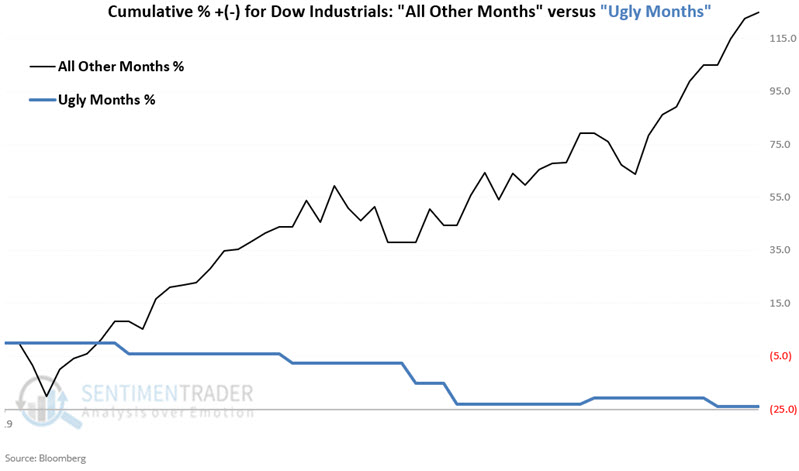
Now let's consider the performance of the Dow ONLY during these "Ugly 17" months as a whole. The chart below displays the cumulative % +(-) (with an emphasis on the minus sign) for the Dow Jones Industrial Average ONLY during these same 17 months during each 20-year cycle starting in 1900.
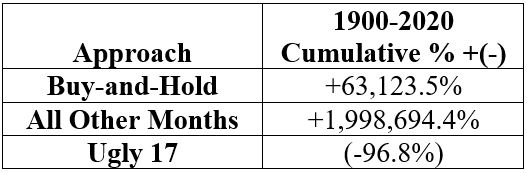
To get an idea, the table below displays the cumulative % +(-) across each 20-year cycle for:
- Ugly 17 Months ONLY
- All Other Months ONLY
- Buy-and-Hold
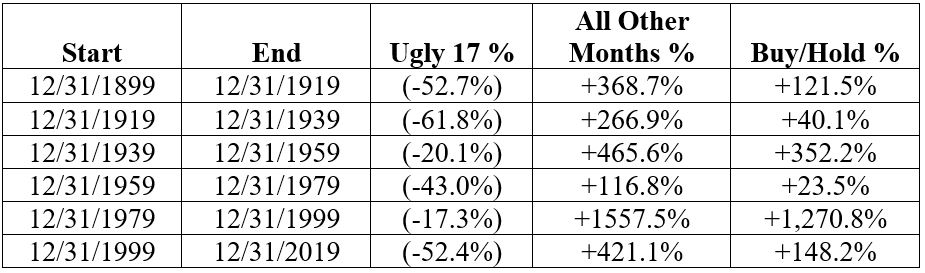
So, what's the "Good News" in the "Ugly 17"? By avoiding these 17 months each 20-year cycle (for our test purposes we assume a 0% return during the "Ugly 17" months and a return equal to the percent price change for the Dow Jones Industrial Average during all other months), an investor might have vastly outperformed a buy-and-hold approach.
2024 Update
The chart below displays the cumulative % return for the Dow Jones Industrial Average since the end of 2019 for both the "17 Ugly Months" (blue line) and "All Other Months" (black line). From 2019-12-31 through July 2024:
- All Other Months have gained +125%
- The "17 Ugly Months" have lost -24%
The next "Ugly Month" in the sequence is May 2025.
Summary
So, can an investor simply "follow the calendar" and outperform buy-and-hold by a significant sum? Well, maybe. The results above are fairly compelling, particularly since they rely on the exact same set of months on a repetitive 20-year basis. Still, as I always say, relying on any type of seasonality requires something of a leap of faith, as there is never any guarantee that what worked last time around will work again this time around.
Indicators at Extremes
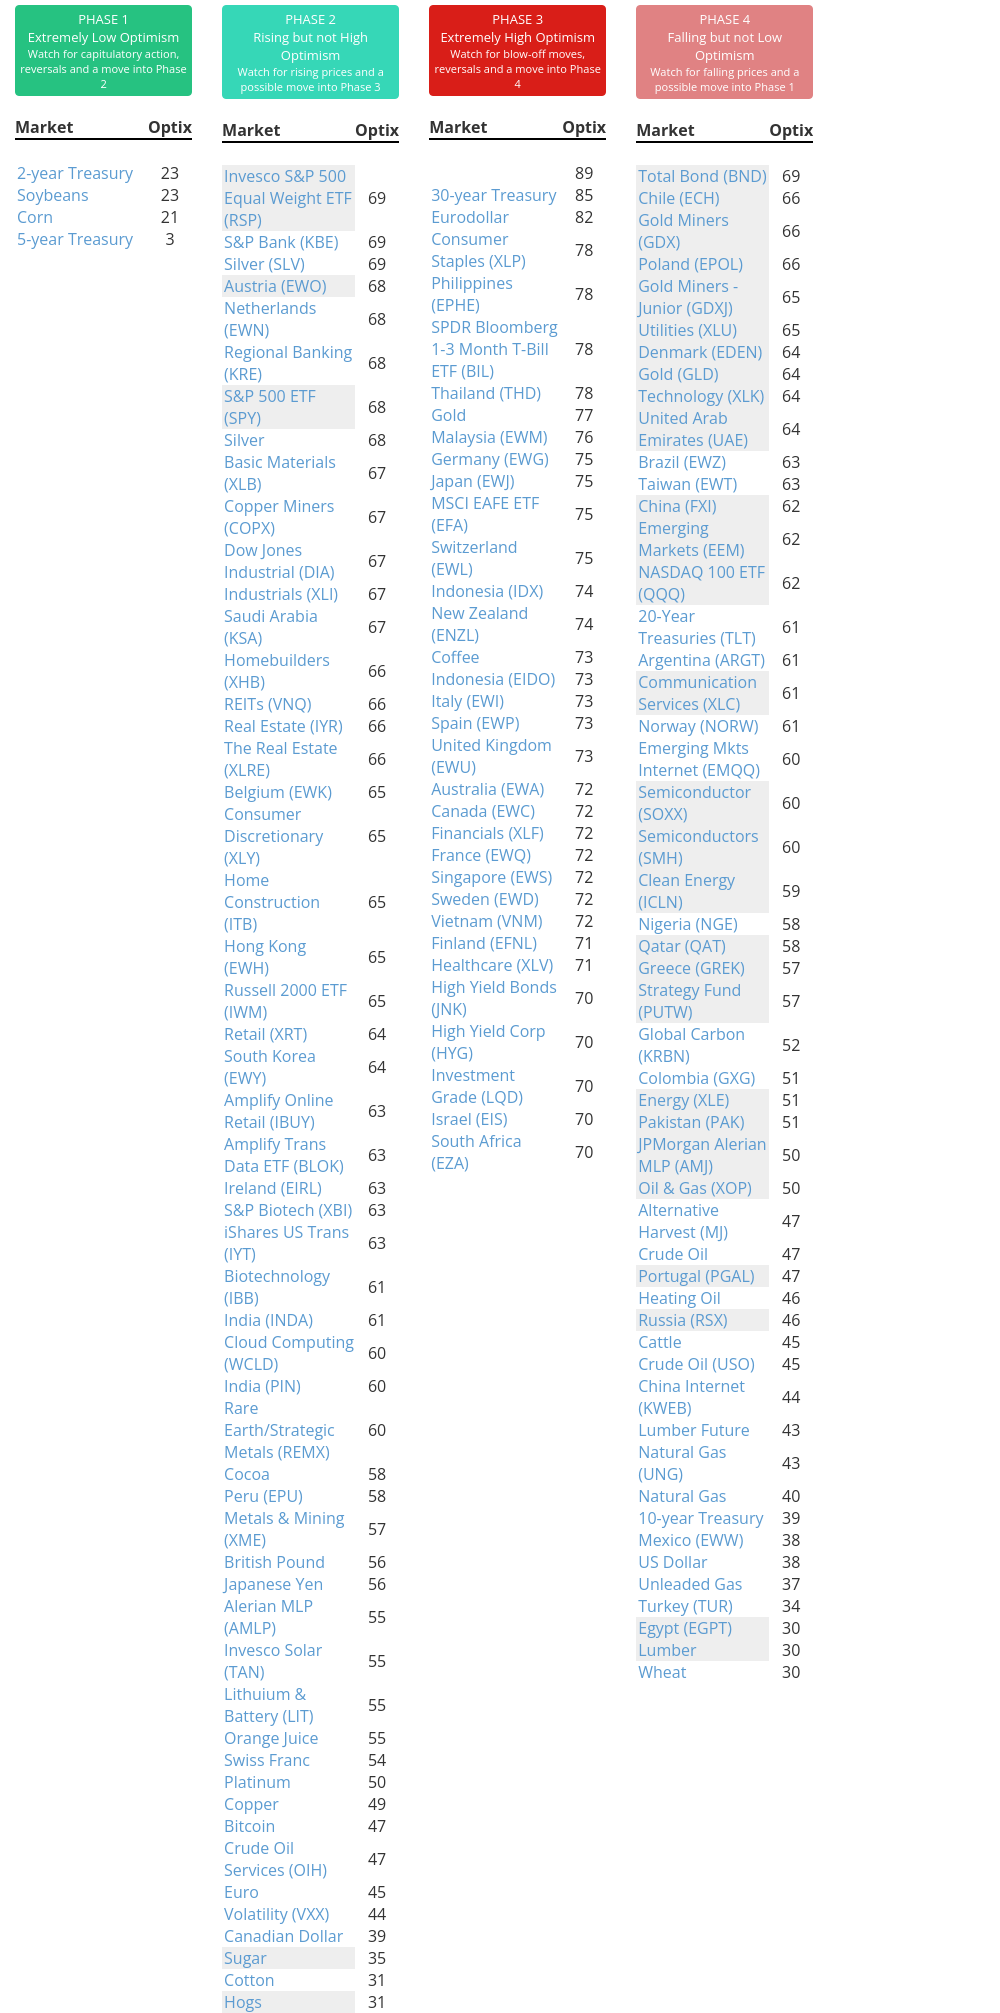
Phase Table
Ranks
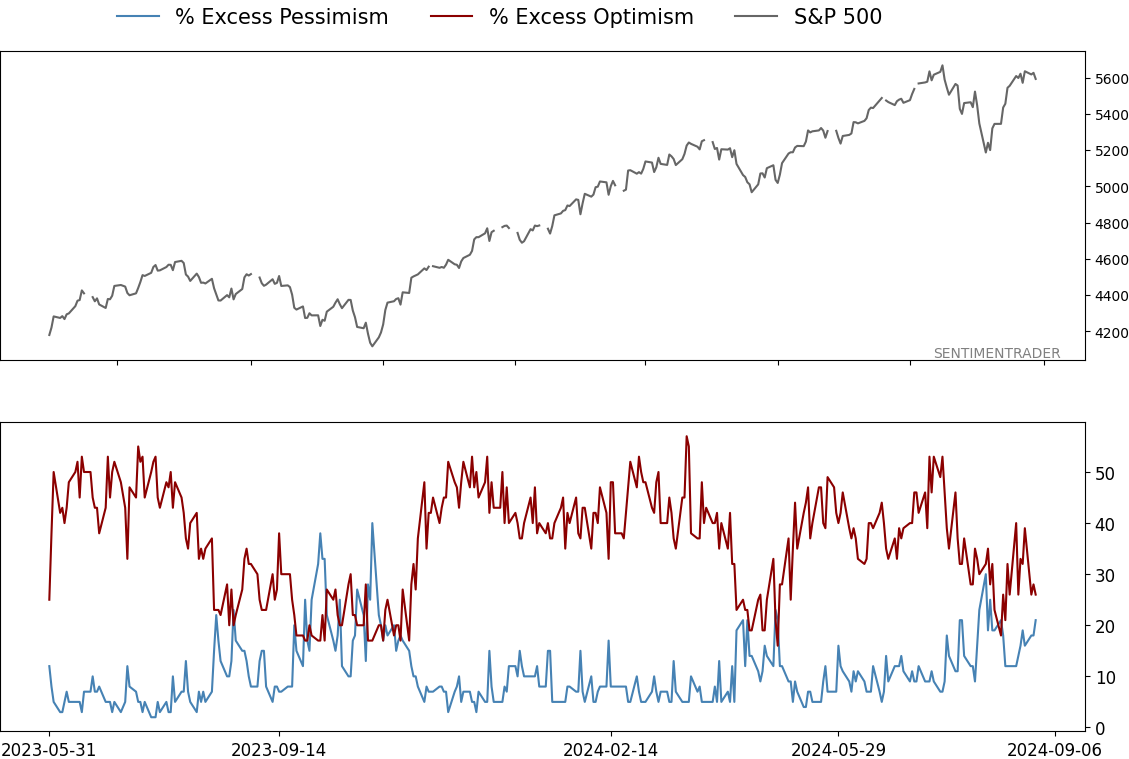
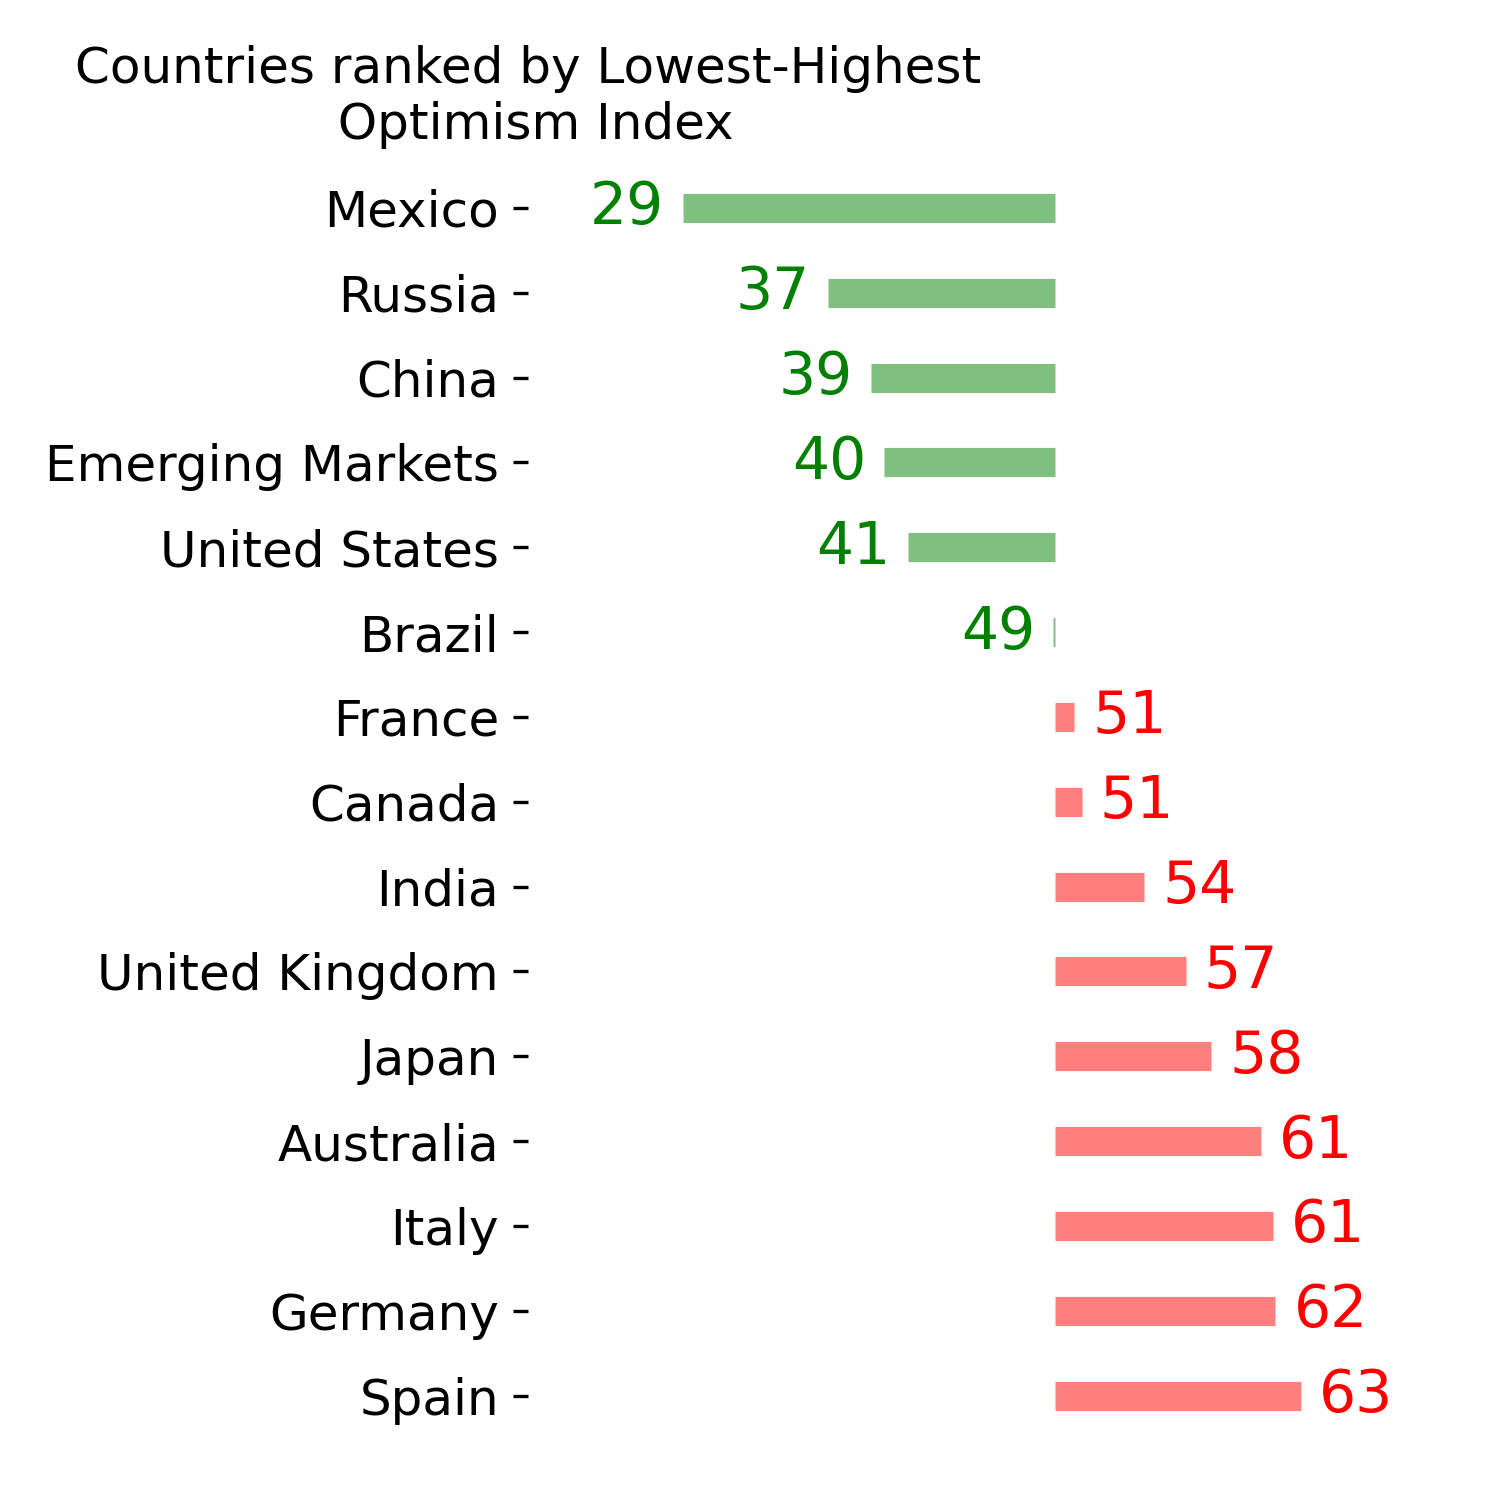
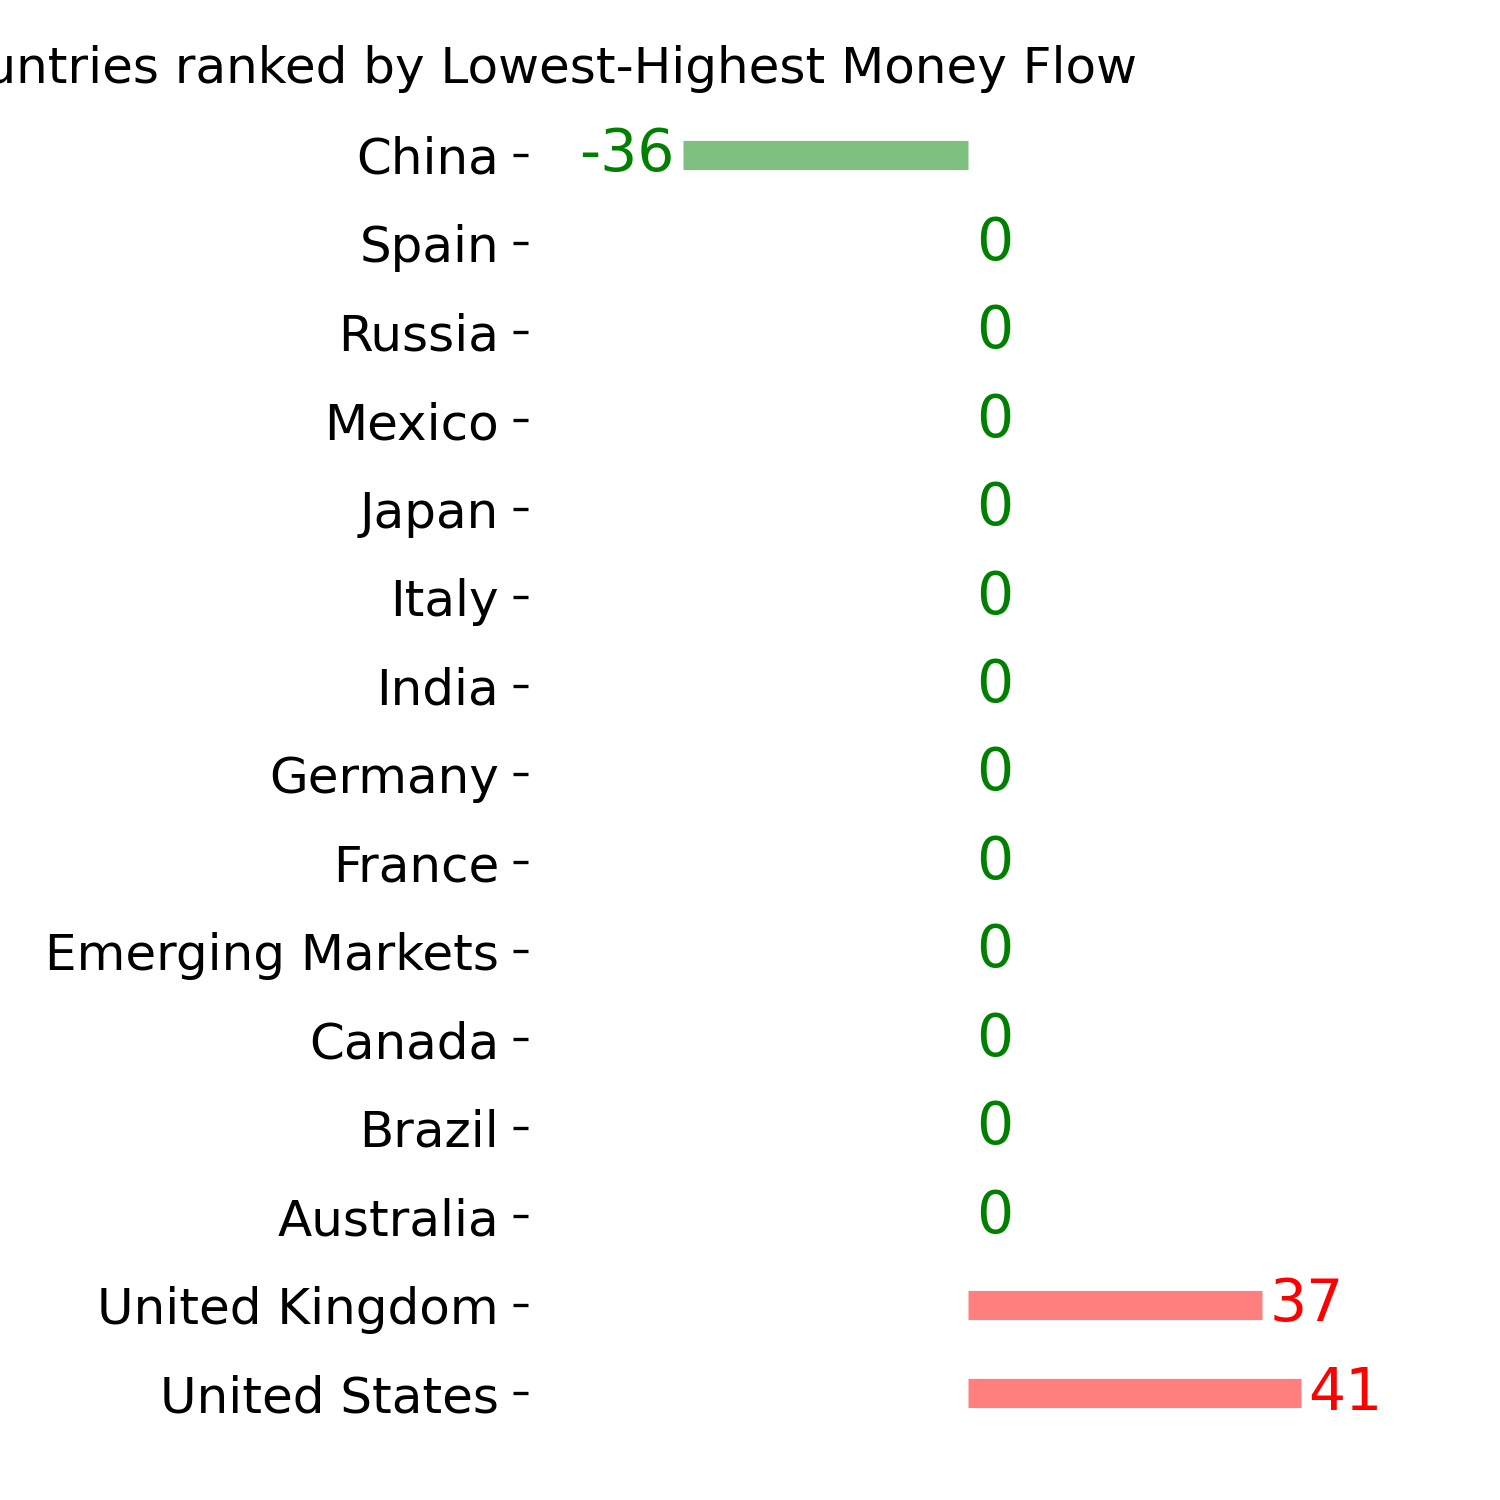
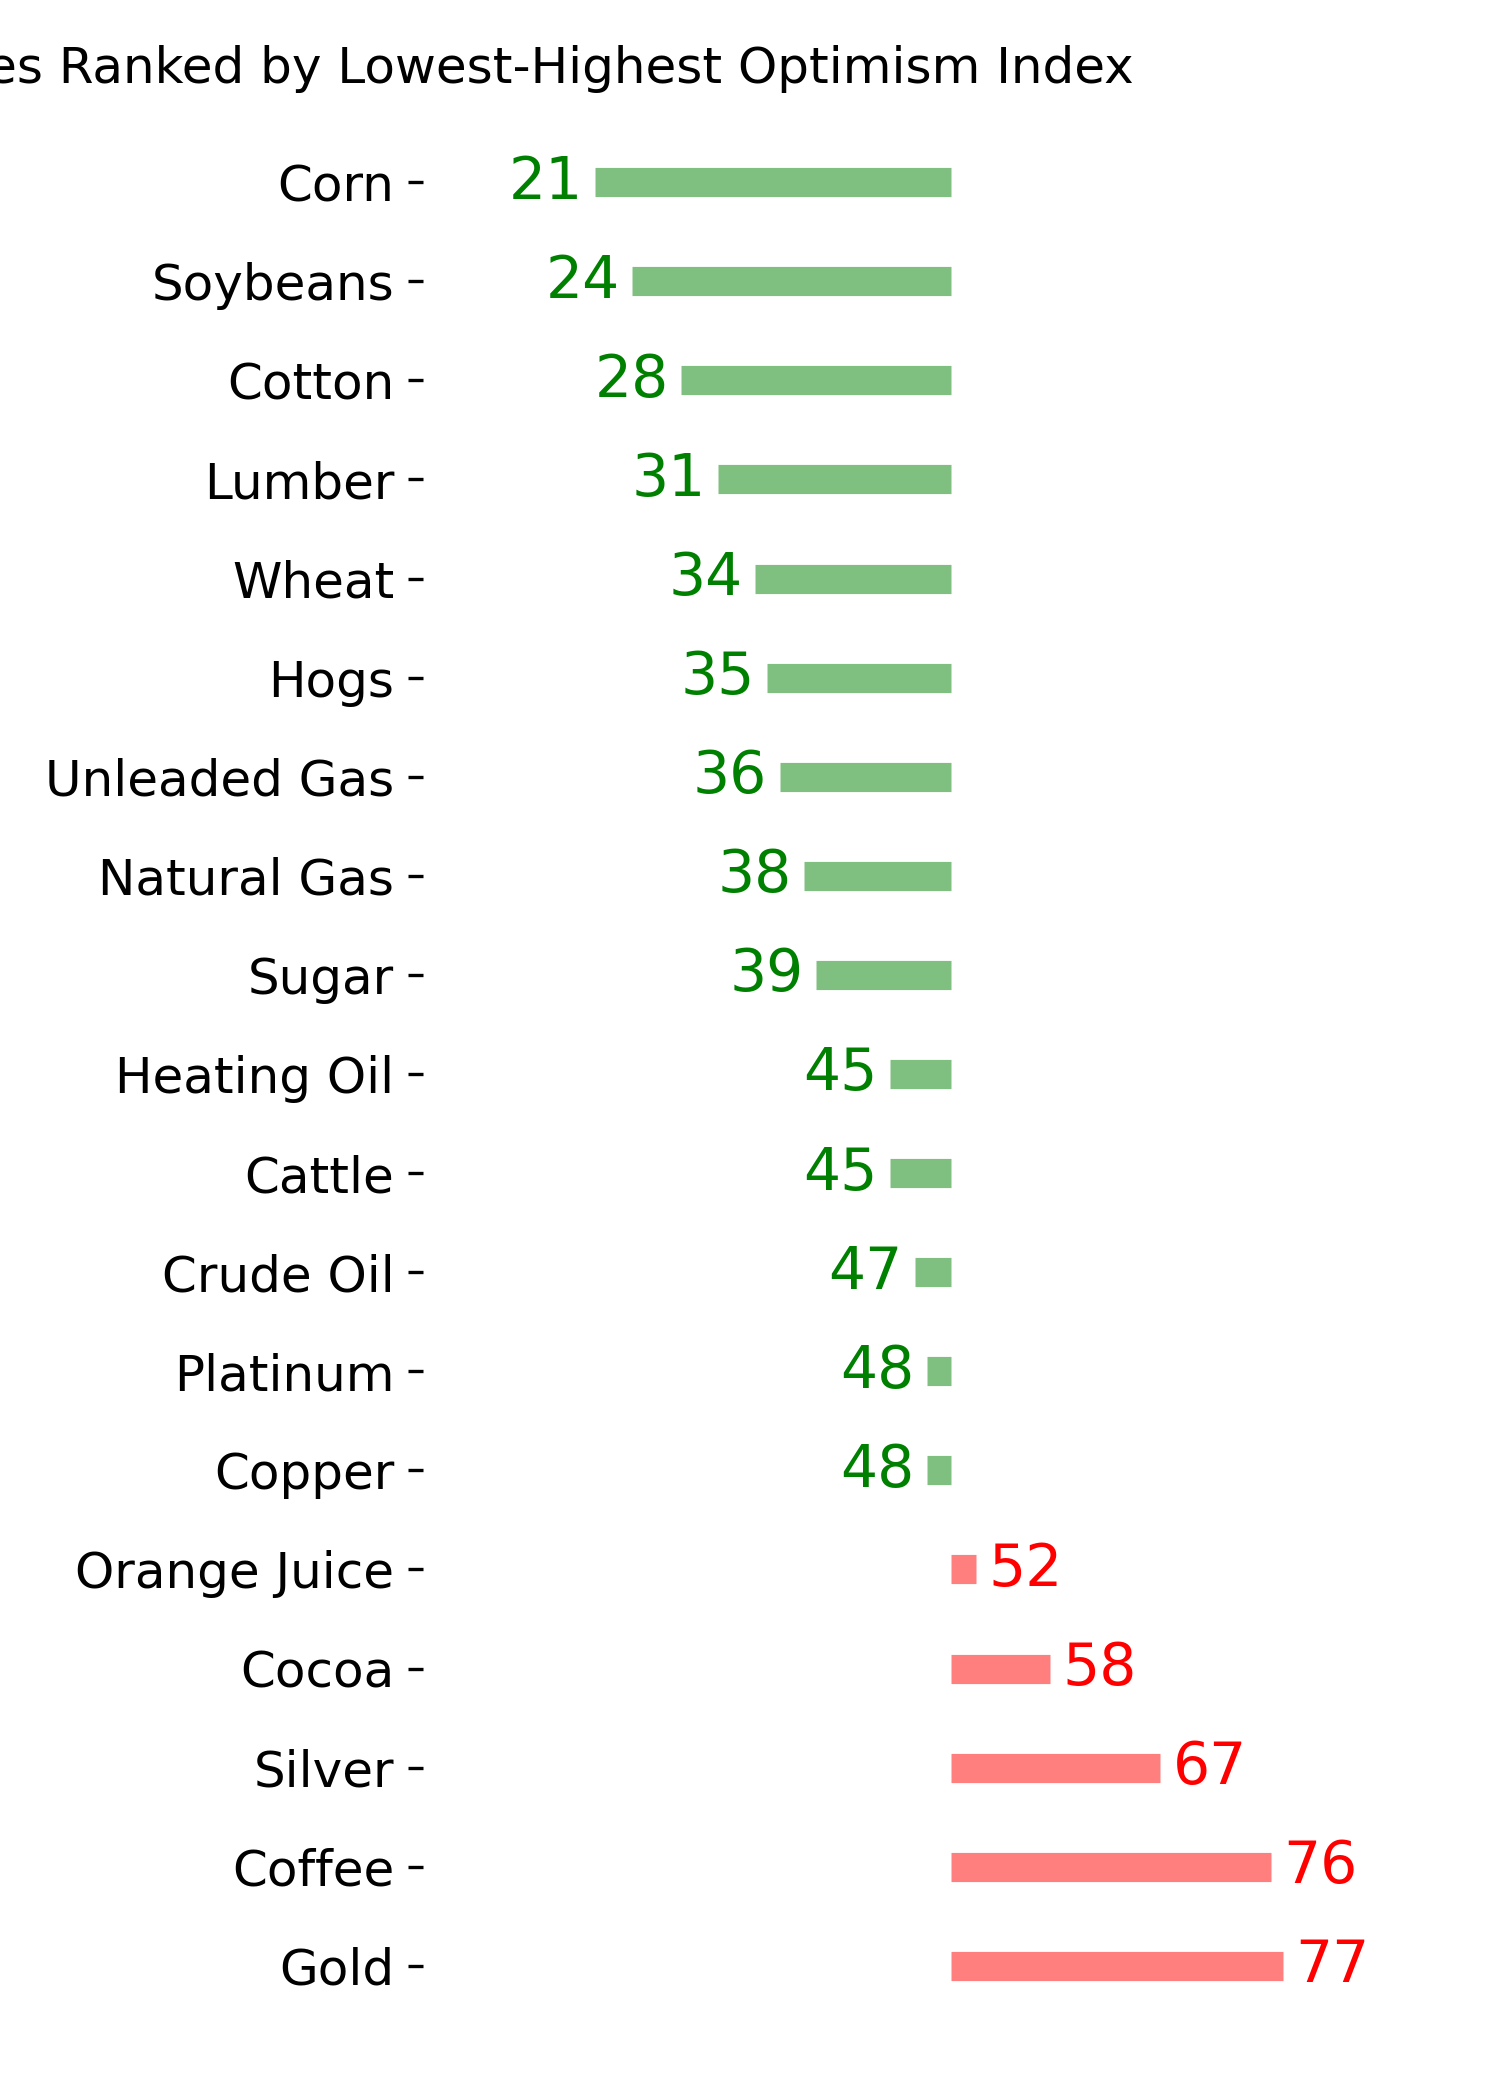
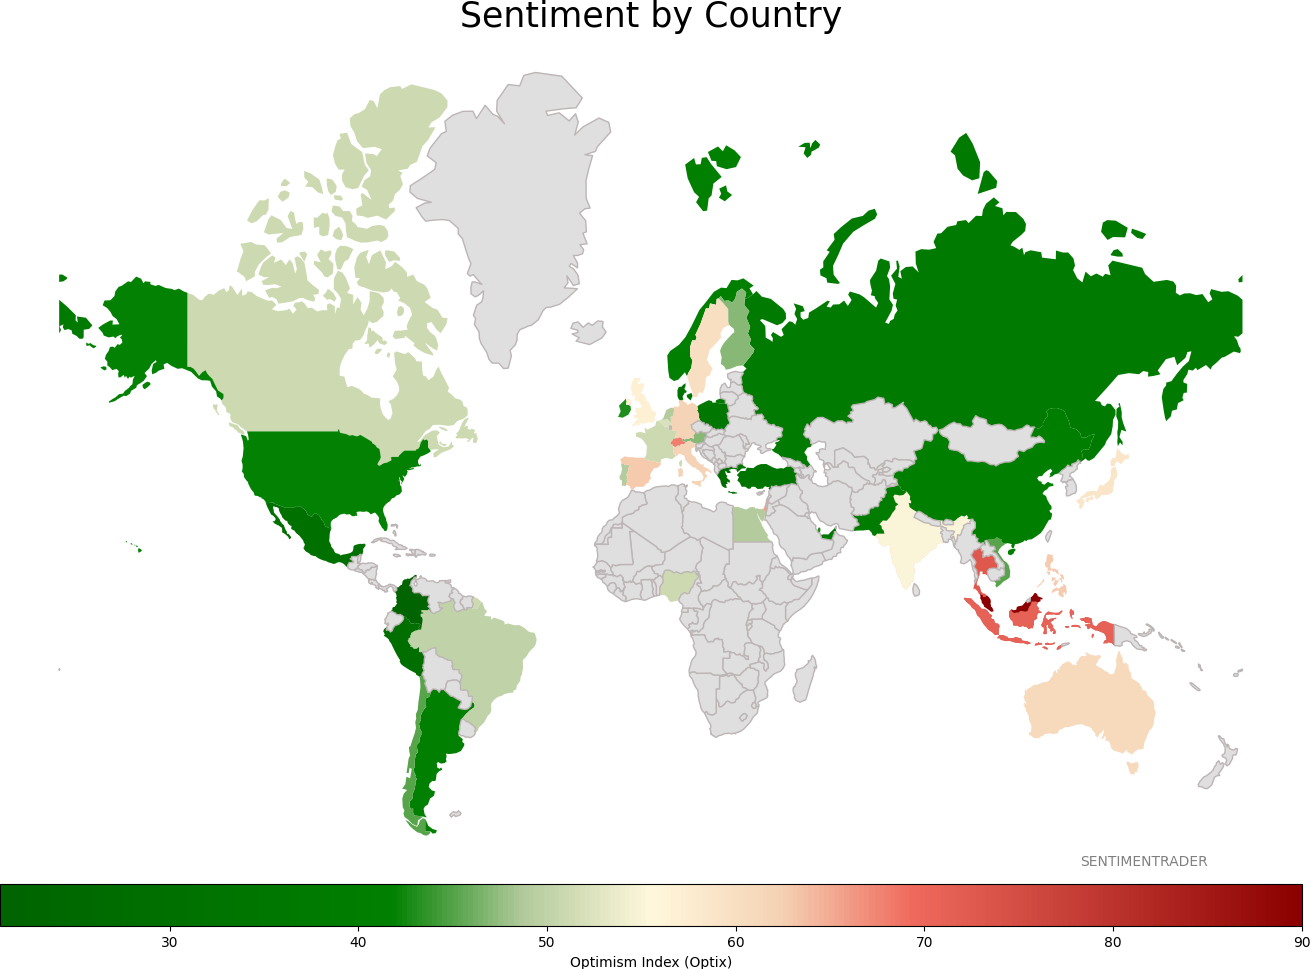
Sentiment Around The World
Optimism Index Thumbnails
|
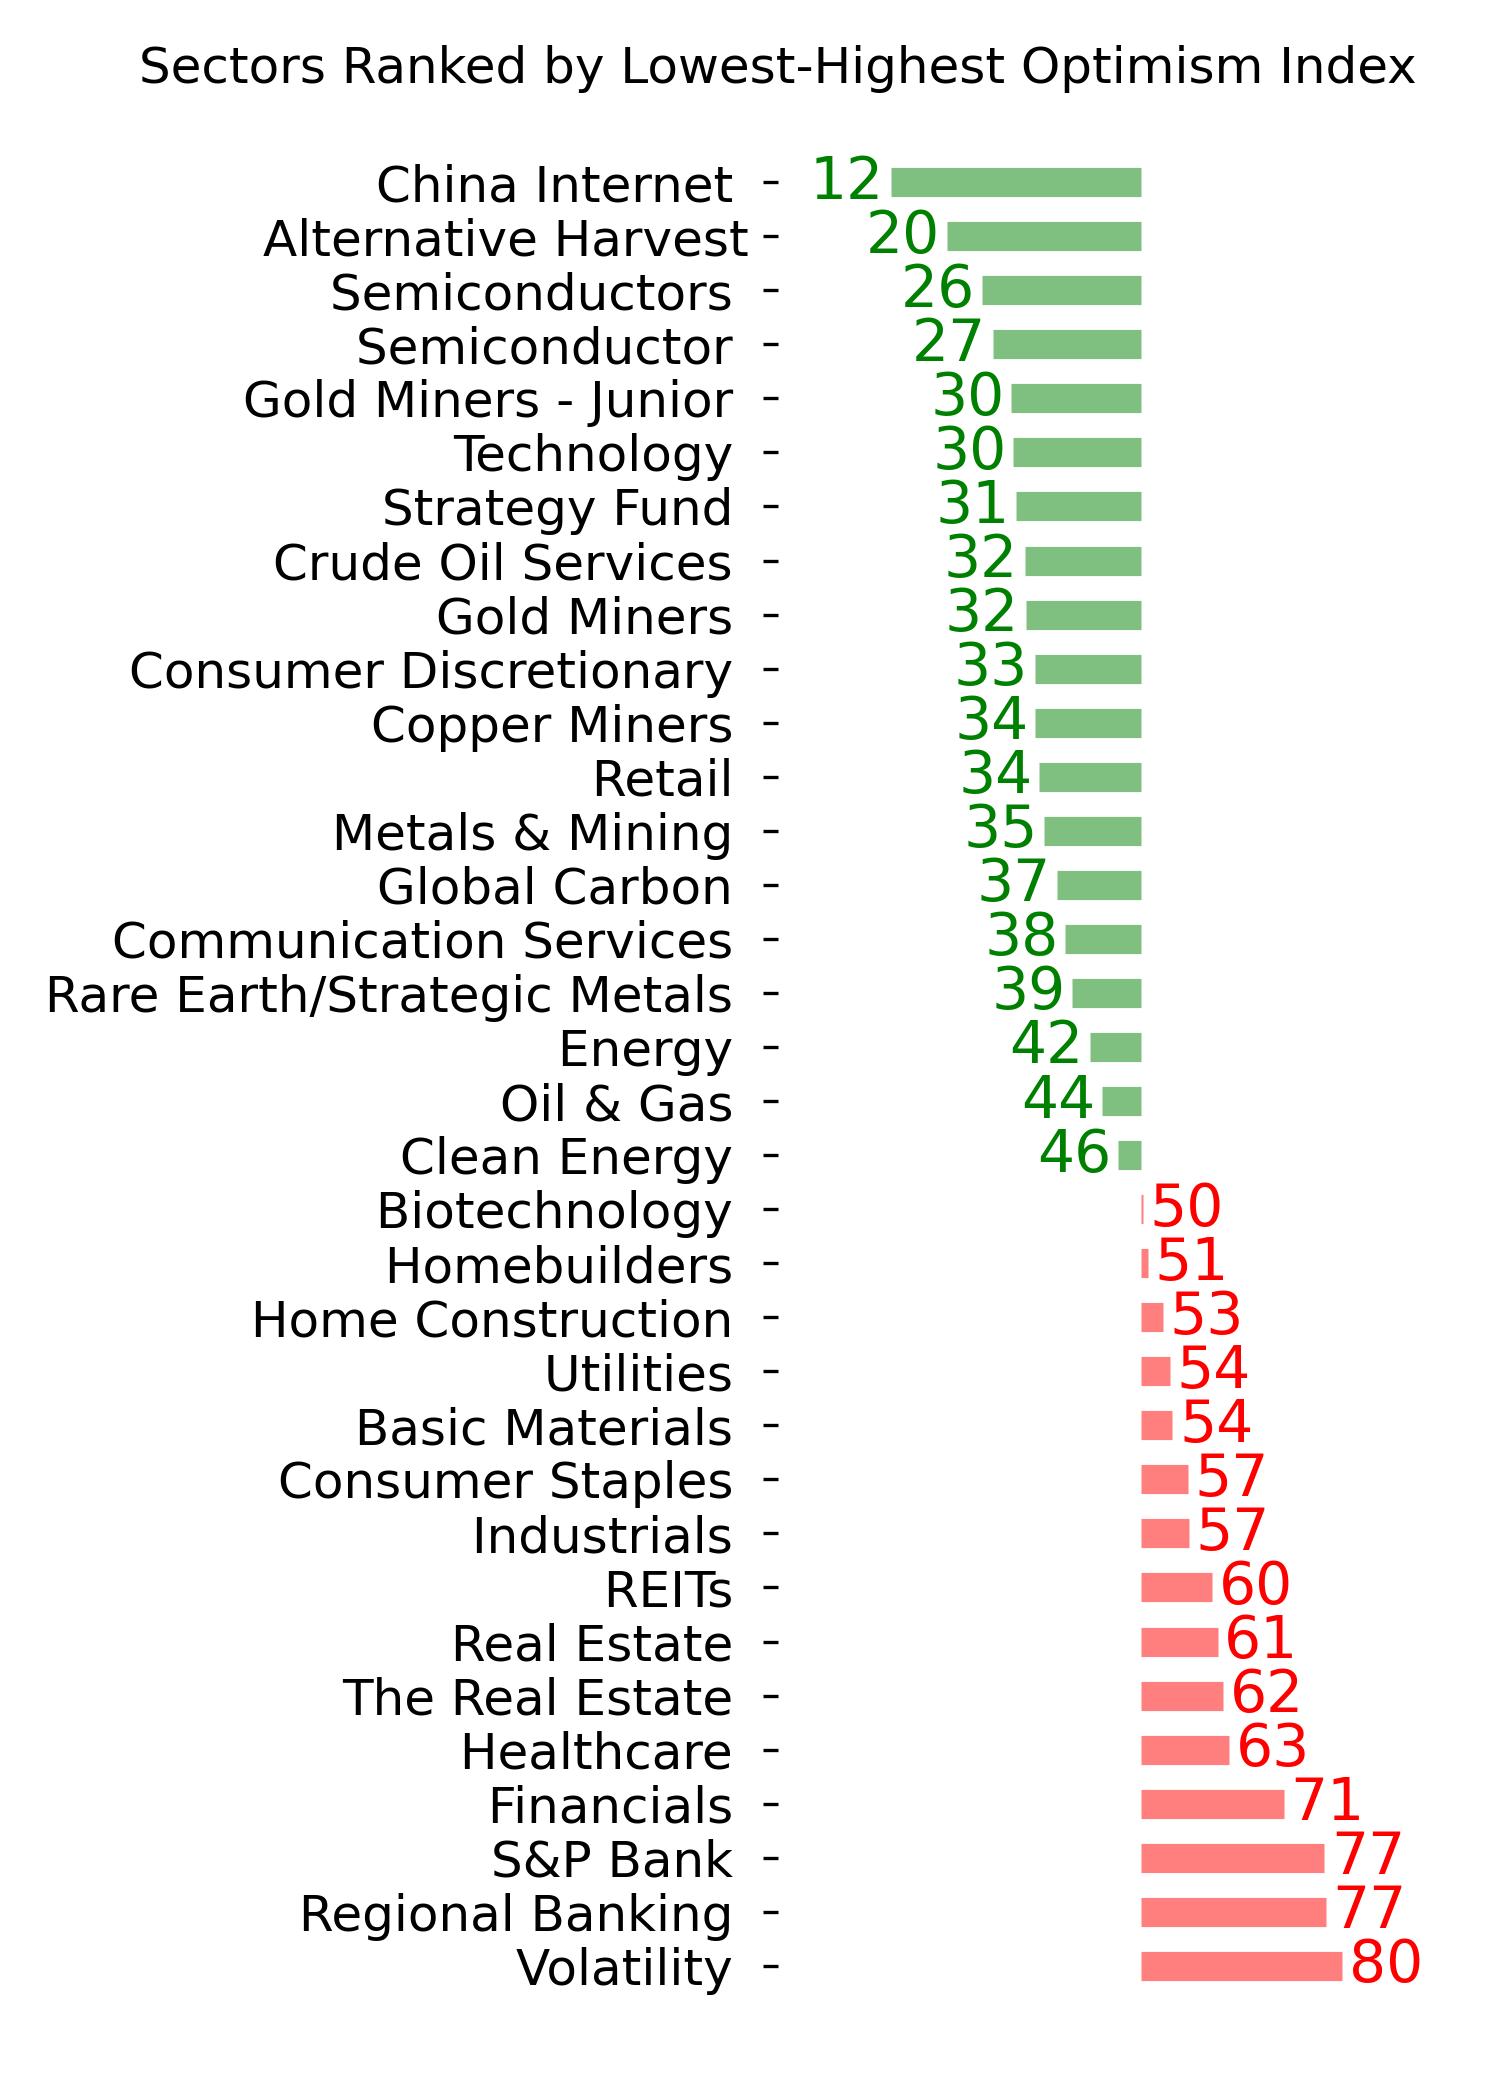
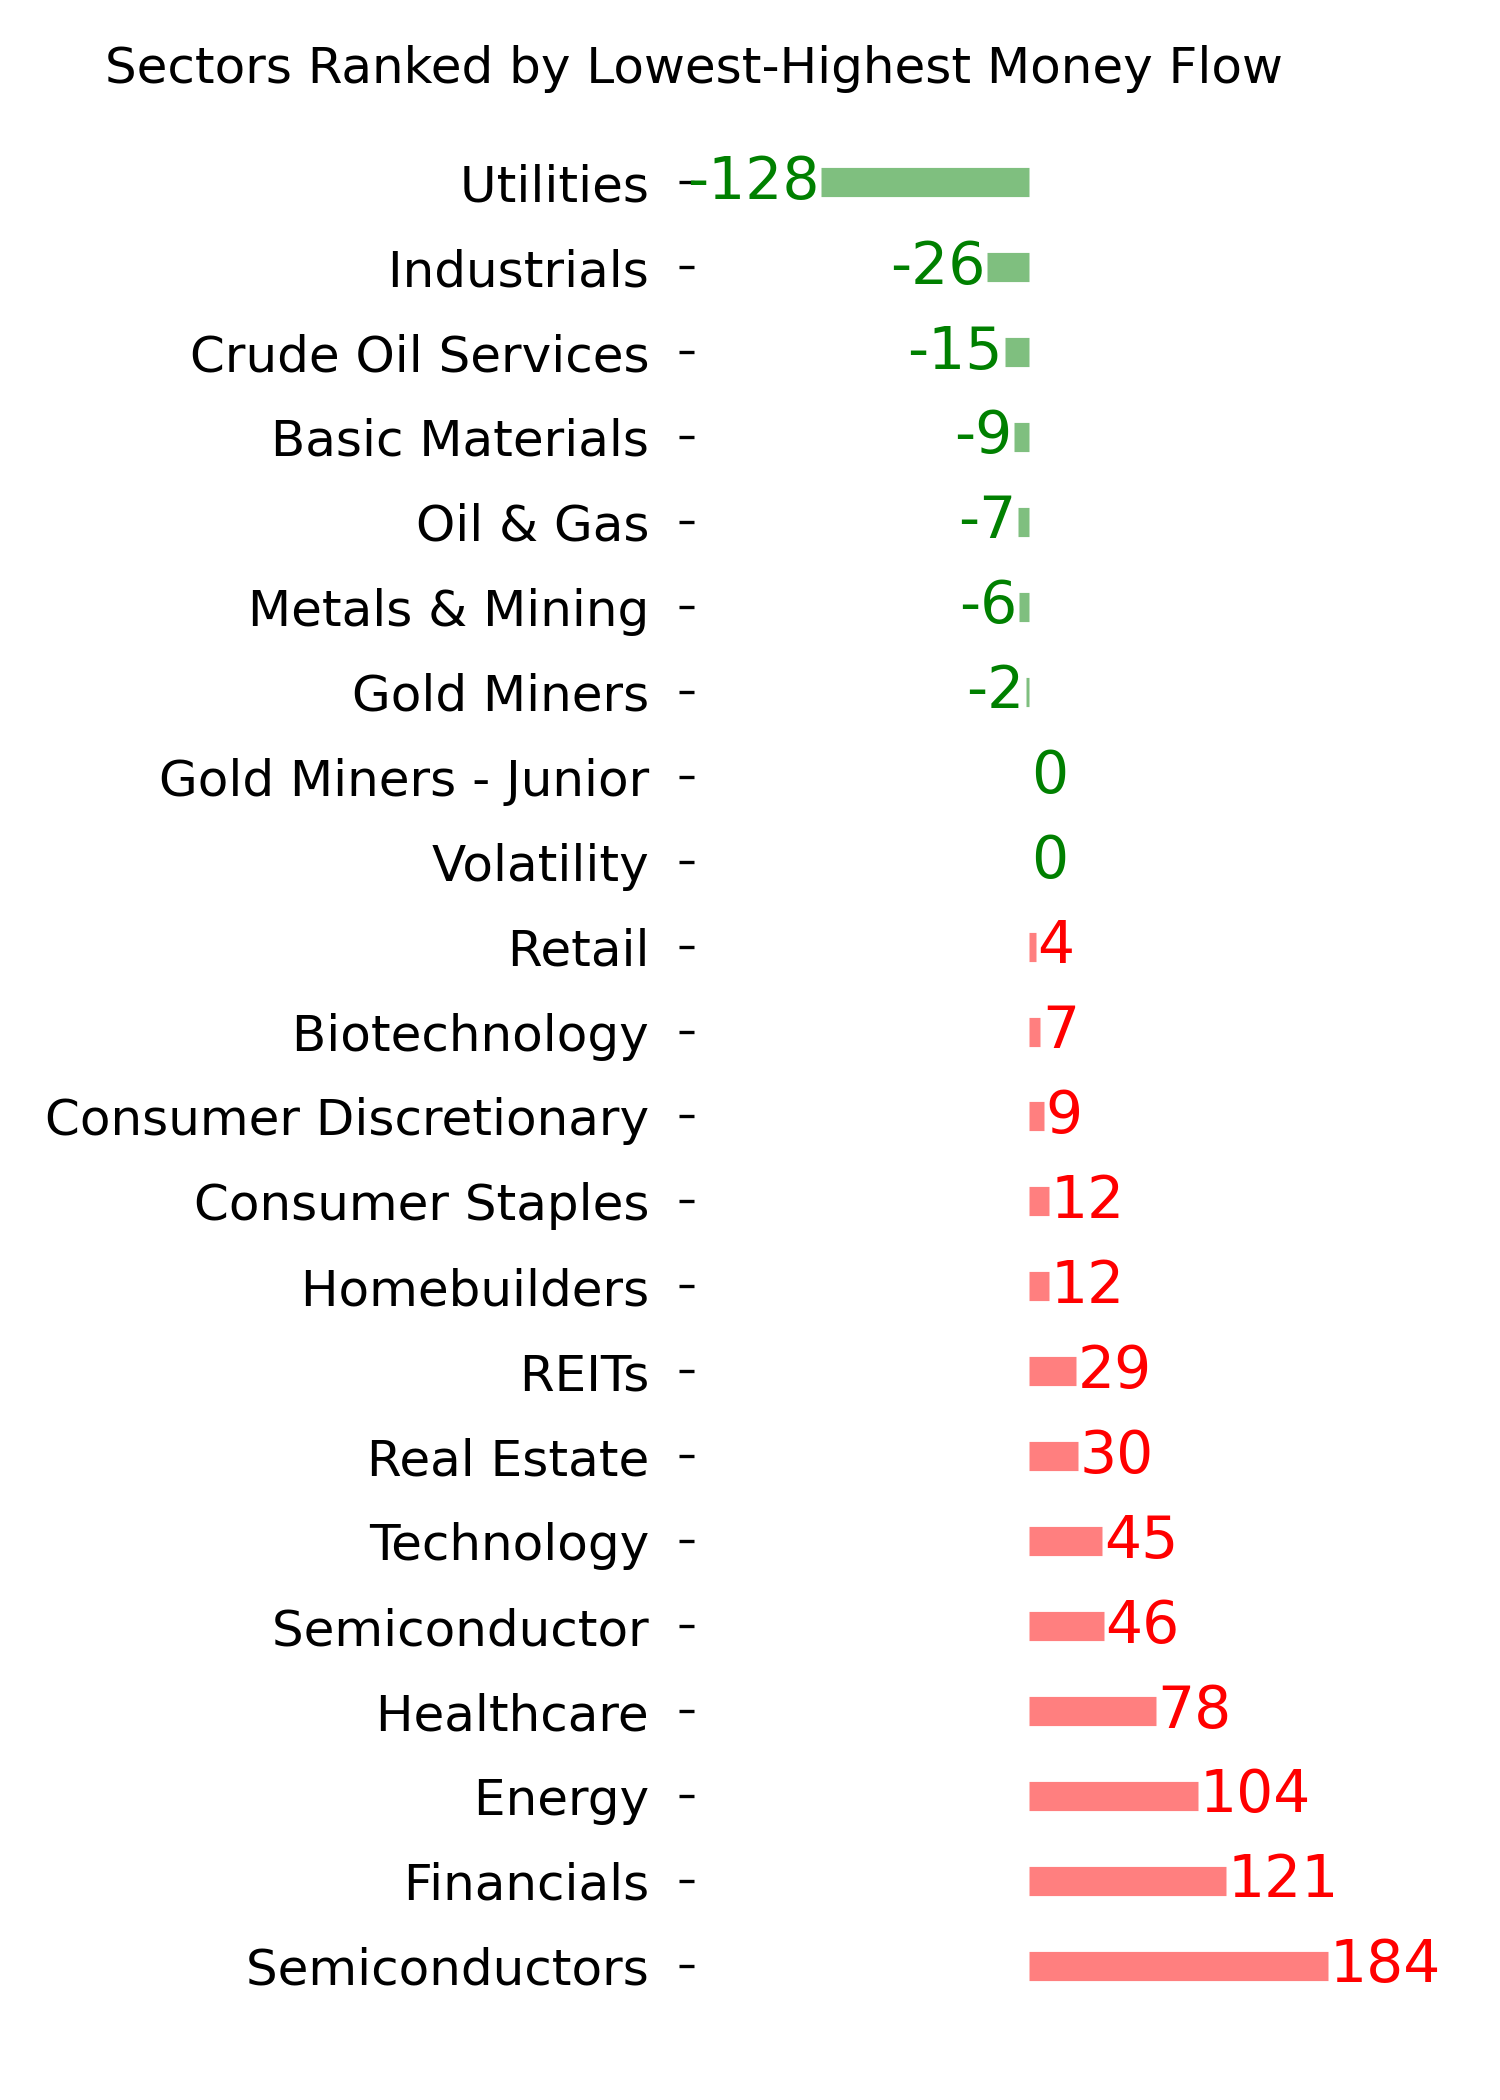
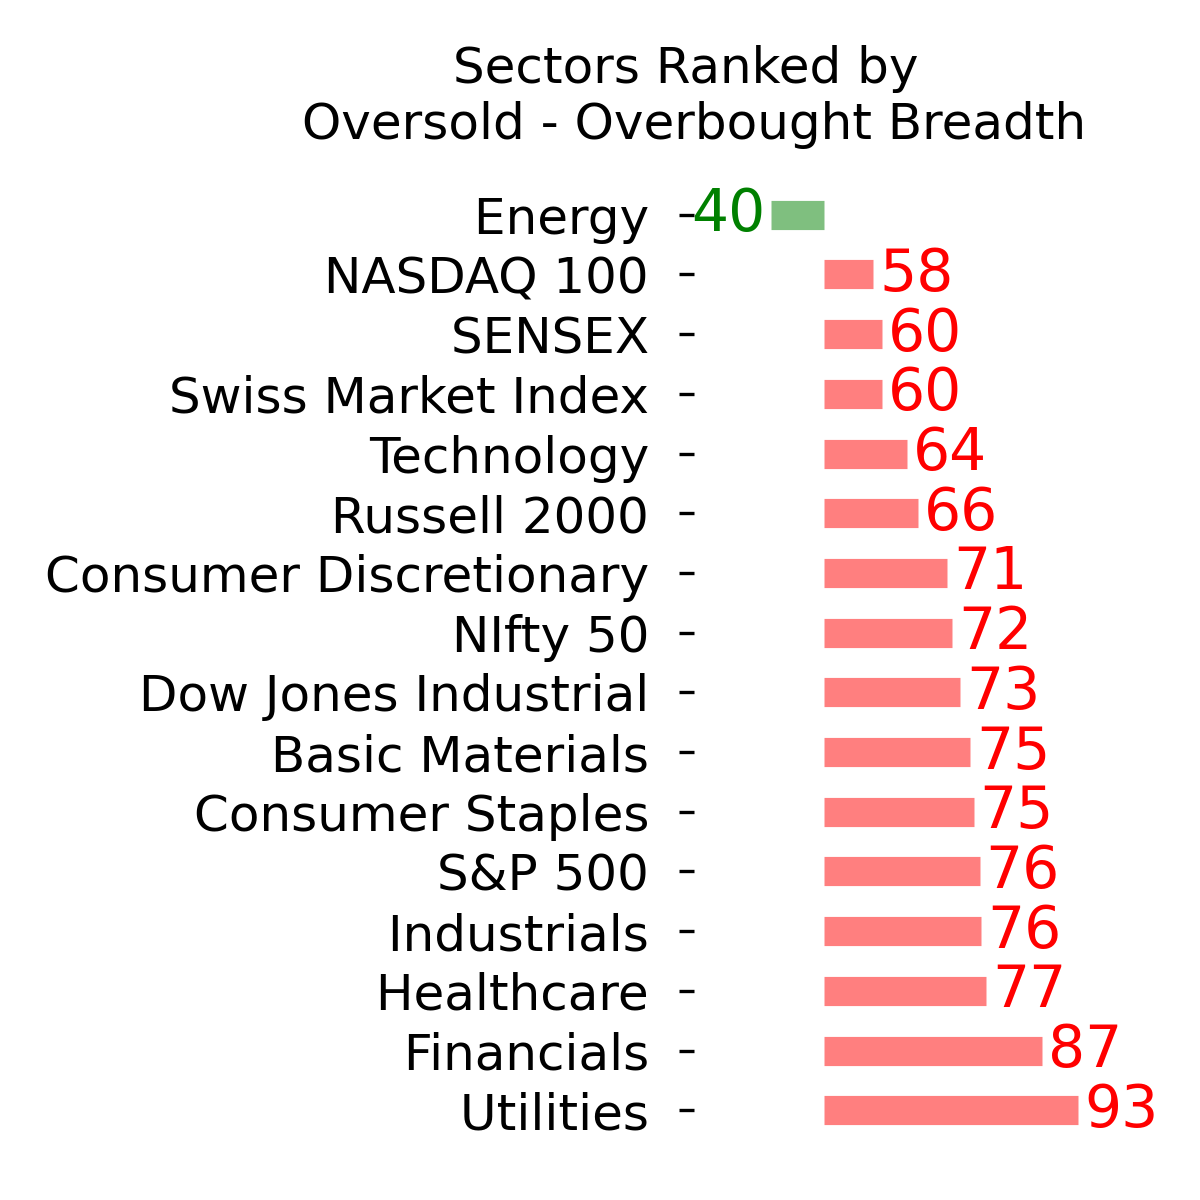
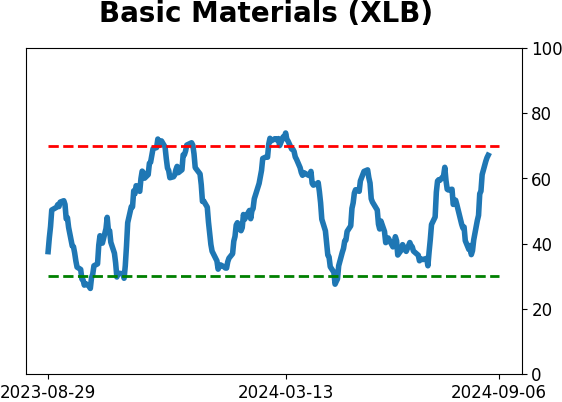
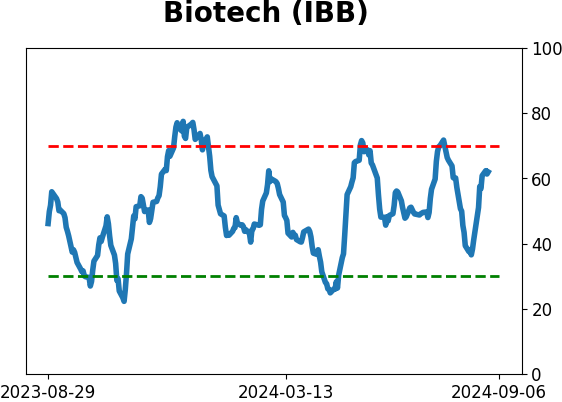
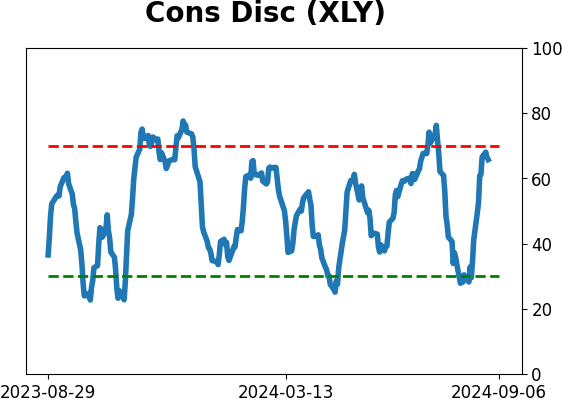
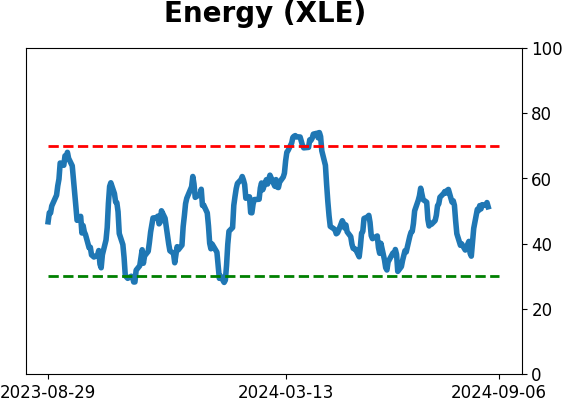
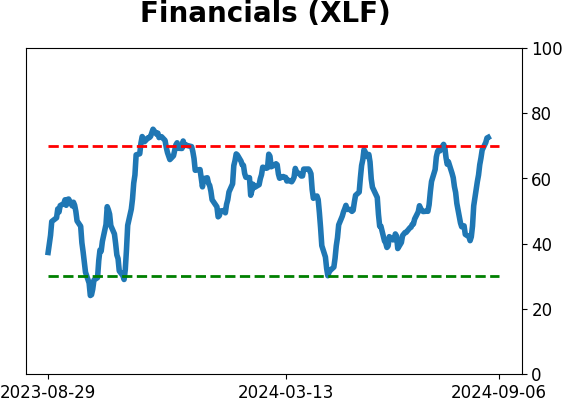
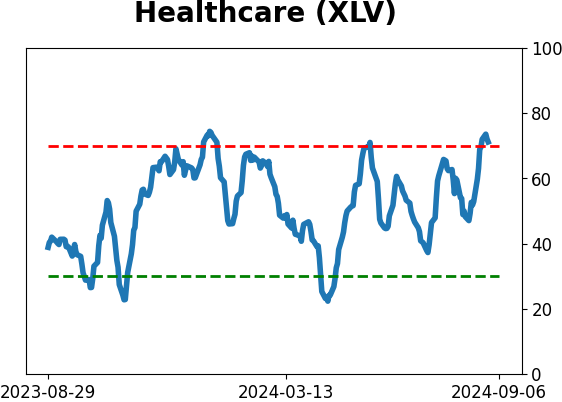
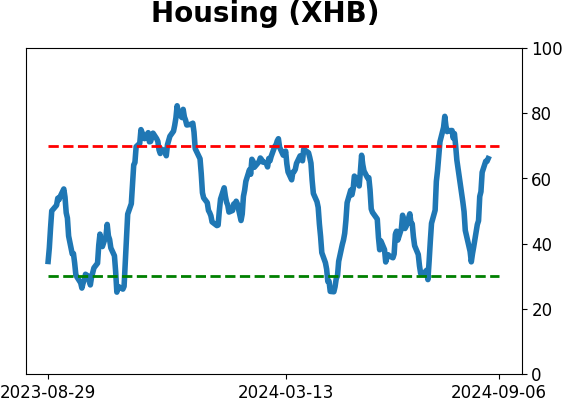
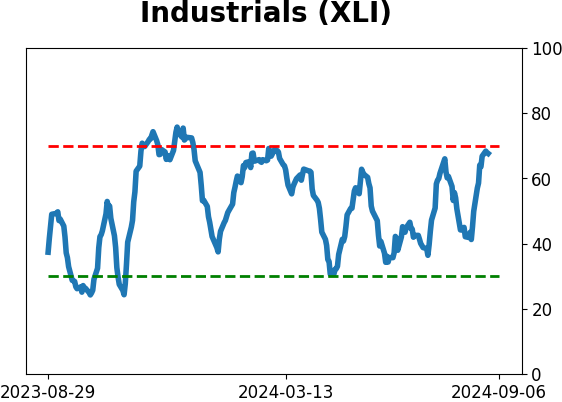
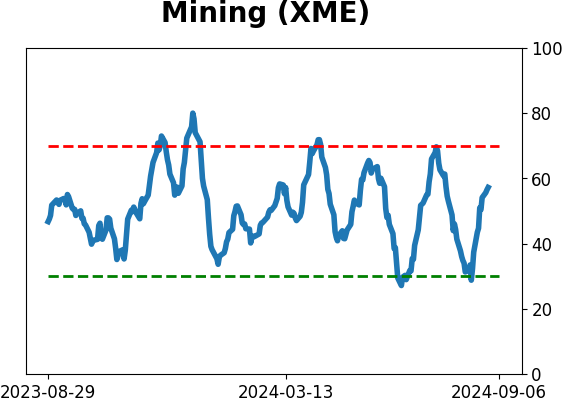
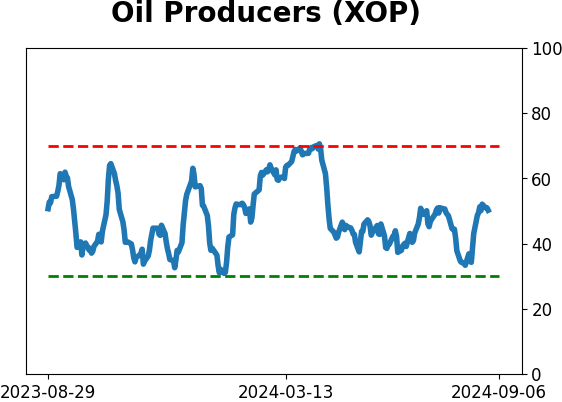
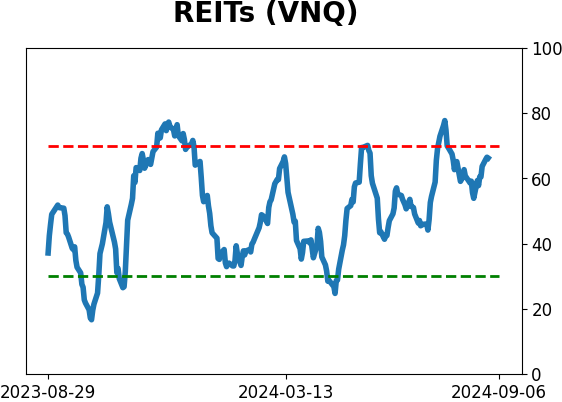
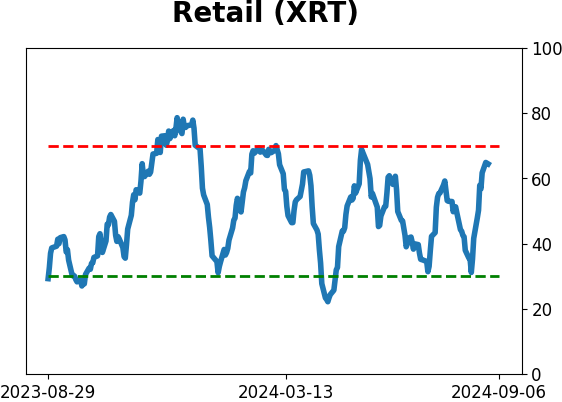
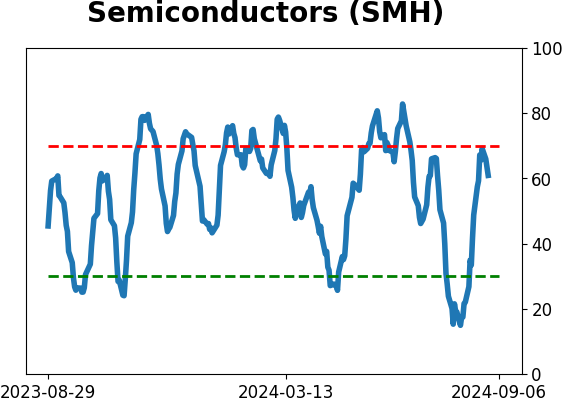
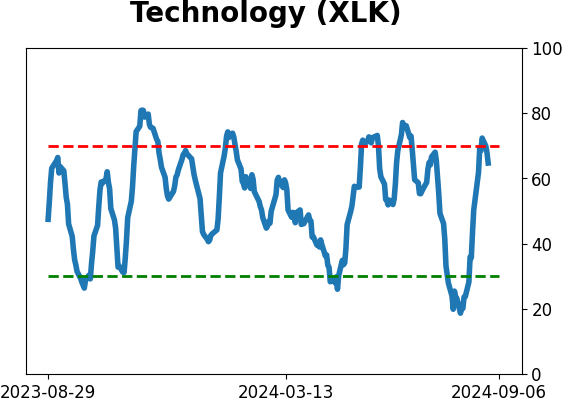
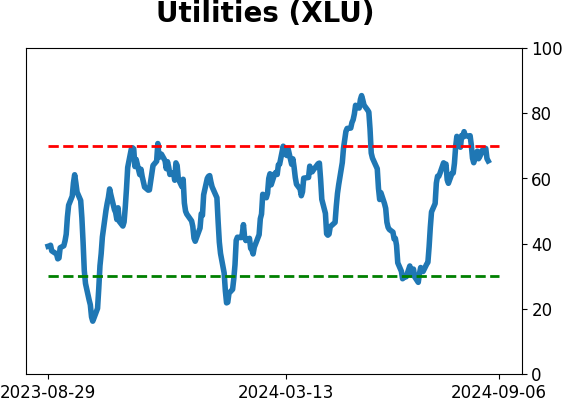
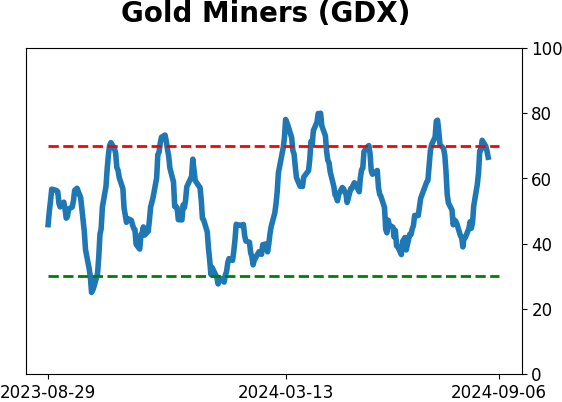
Sector ETF's - 10-Day Moving Average
|
|
|
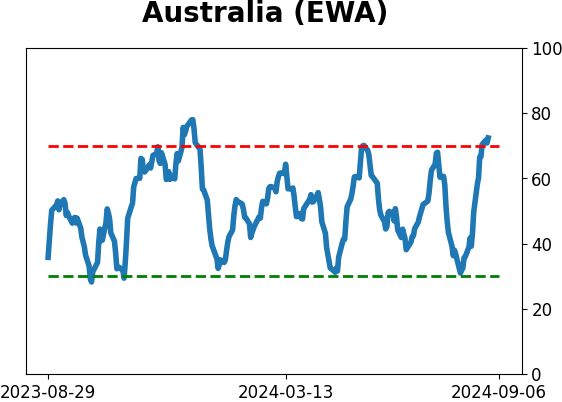
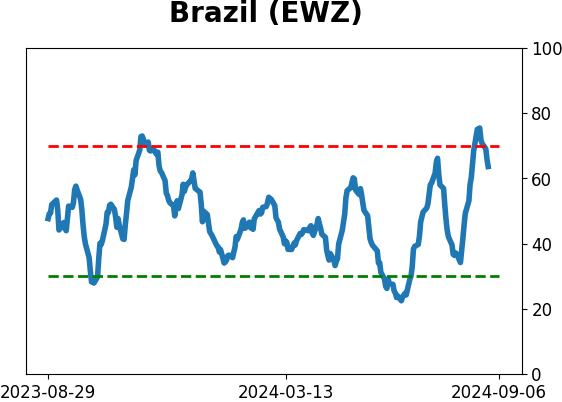
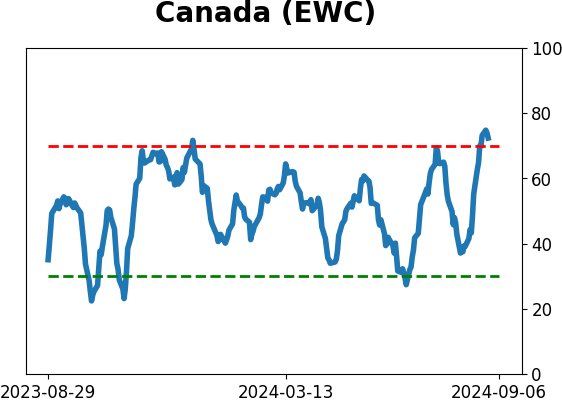
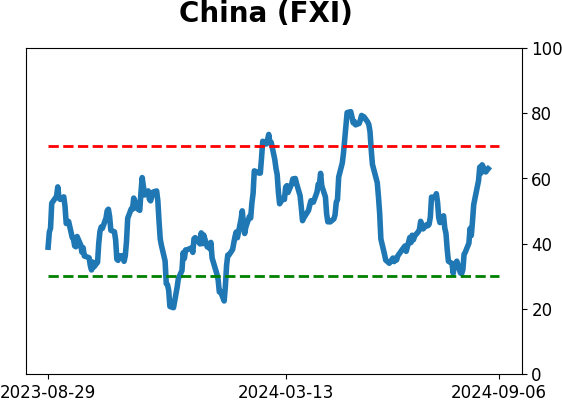
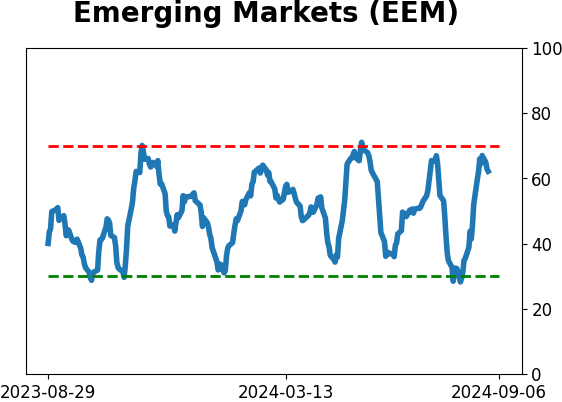
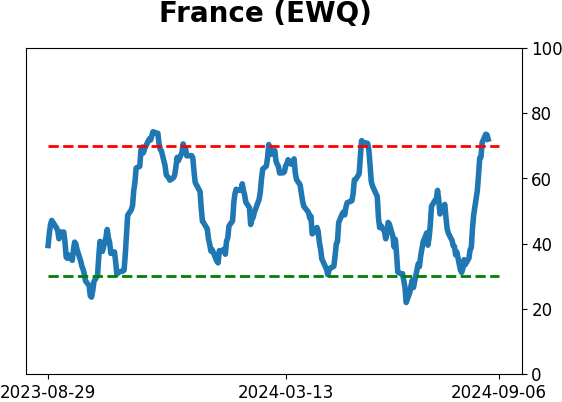
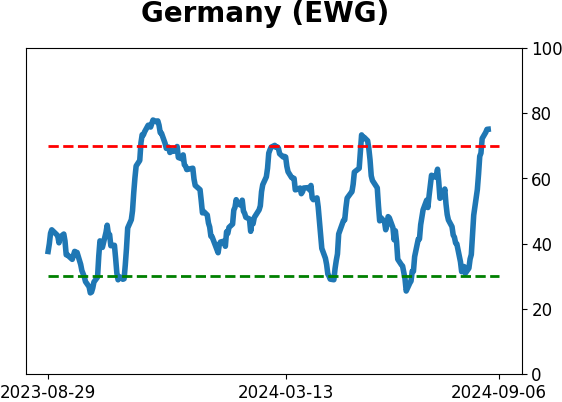
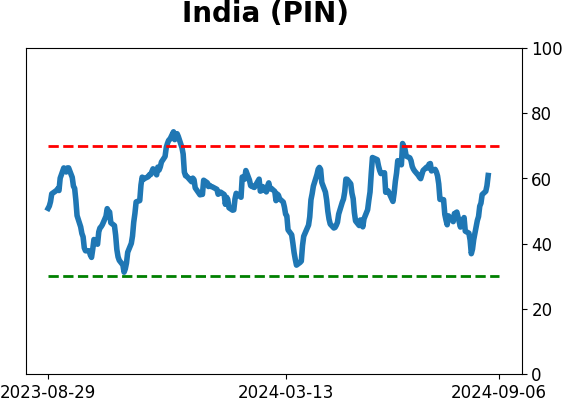
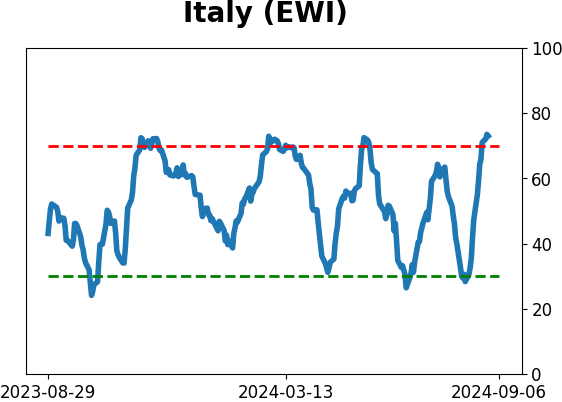
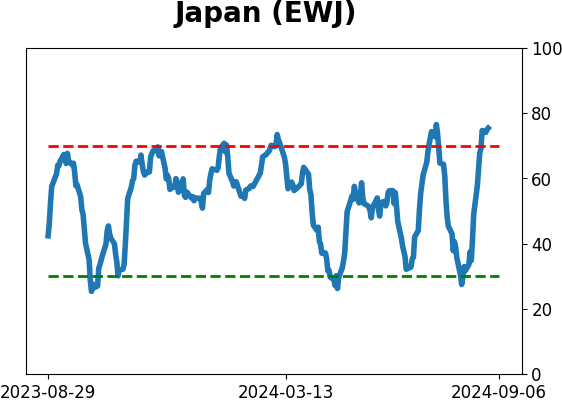
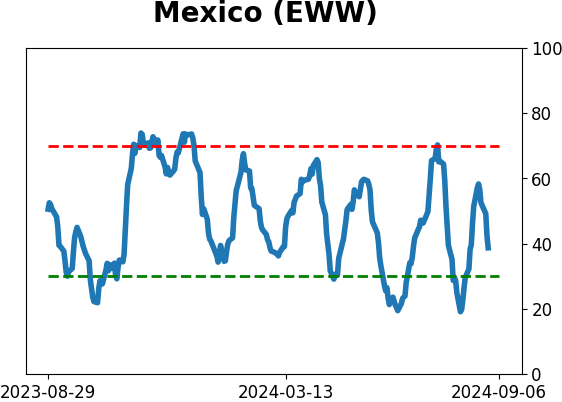
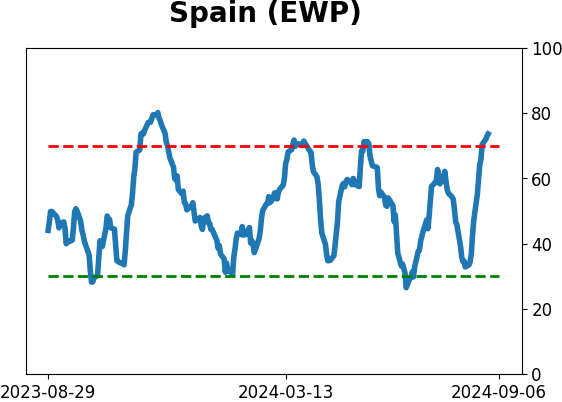
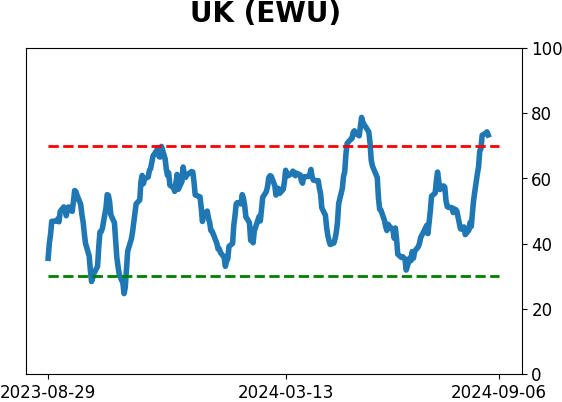
Country ETF's - 10-Day Moving Average
|
|
|
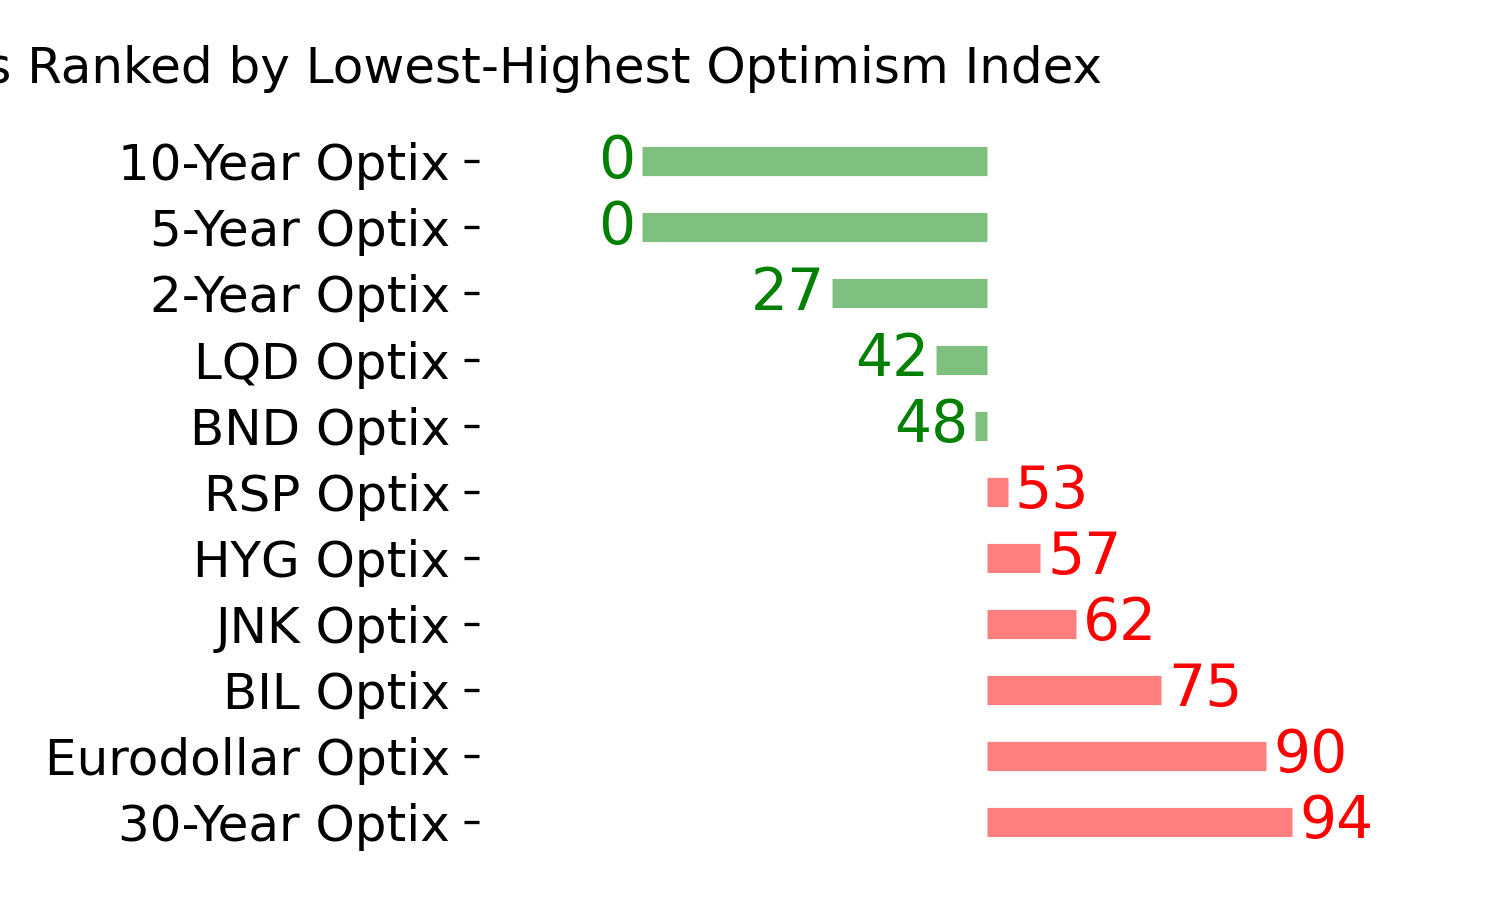
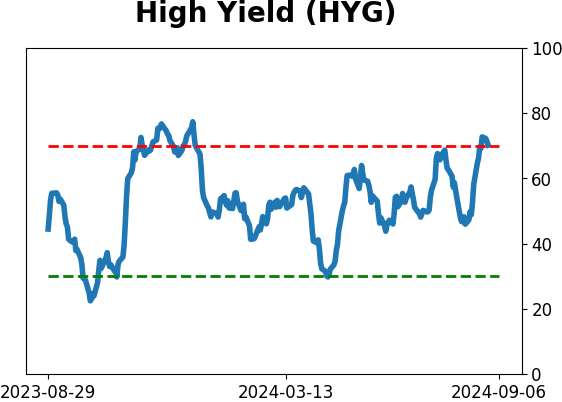
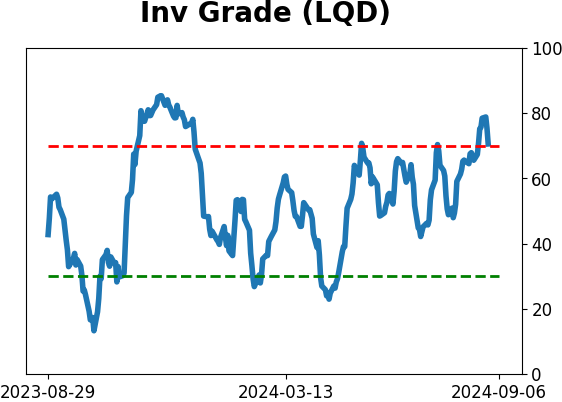
Bond ETF's - 10-Day Moving Average
|
|
|
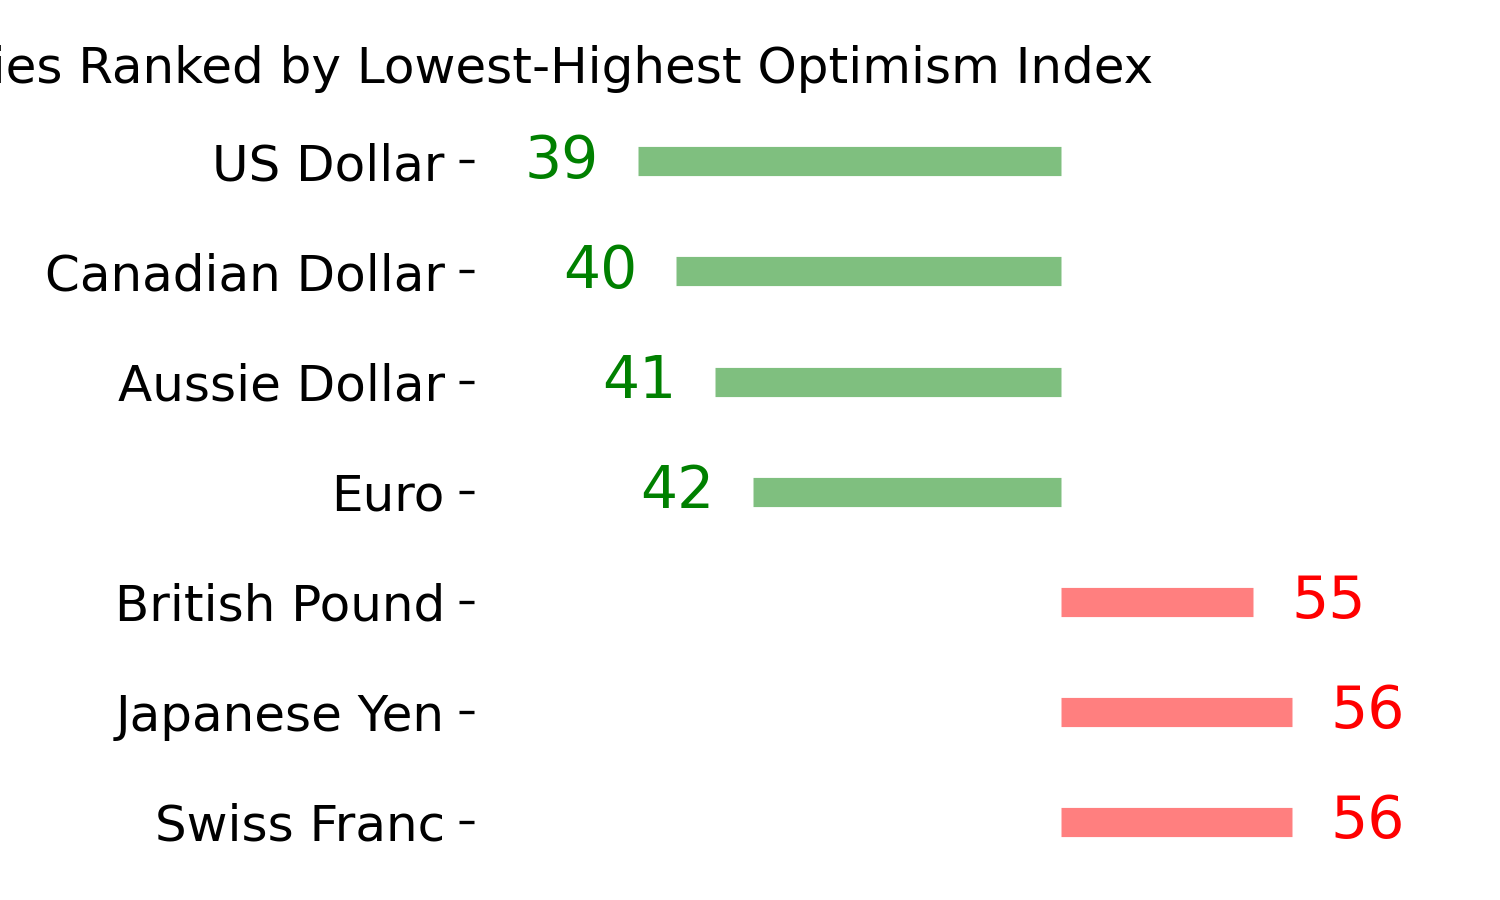
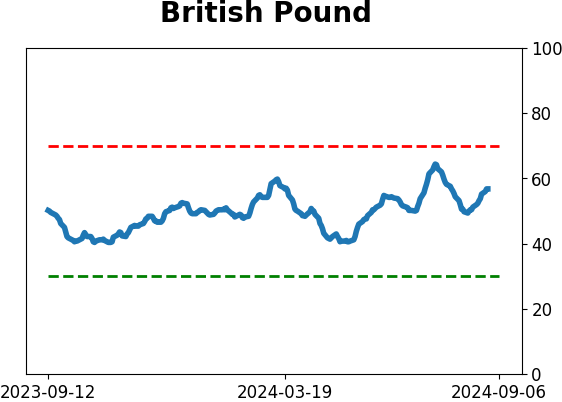
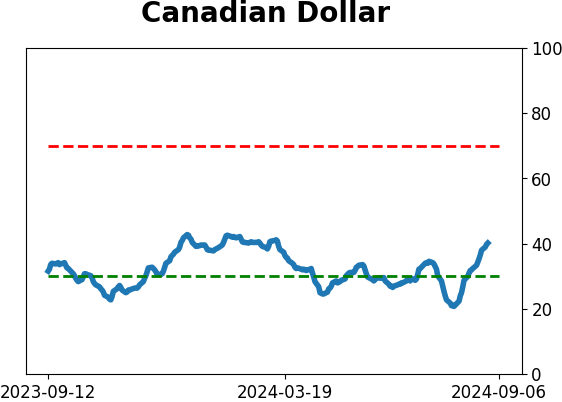
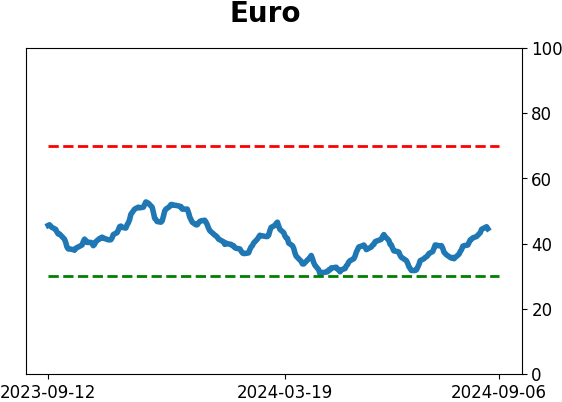
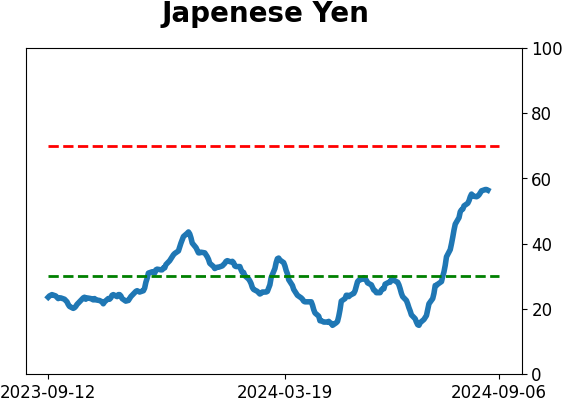
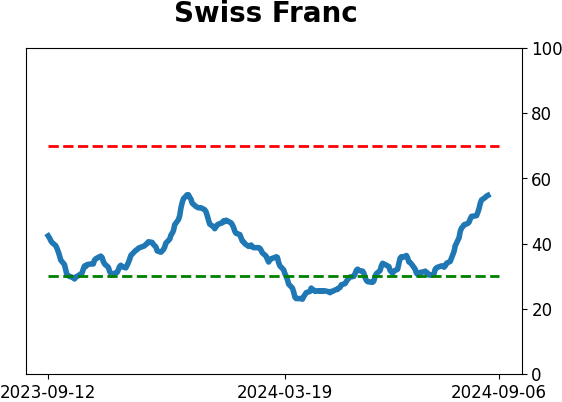
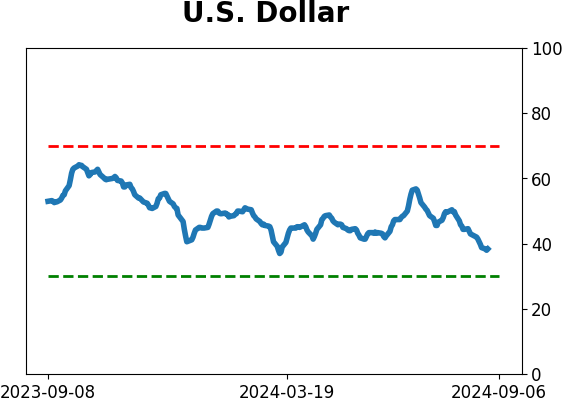
Currency ETF's - 5-Day Moving Average
|
|
|
Commodity ETF's - 5-Day Moving Average
|
|