Headlines
|
|
Watch how traders react to gold's high risk:
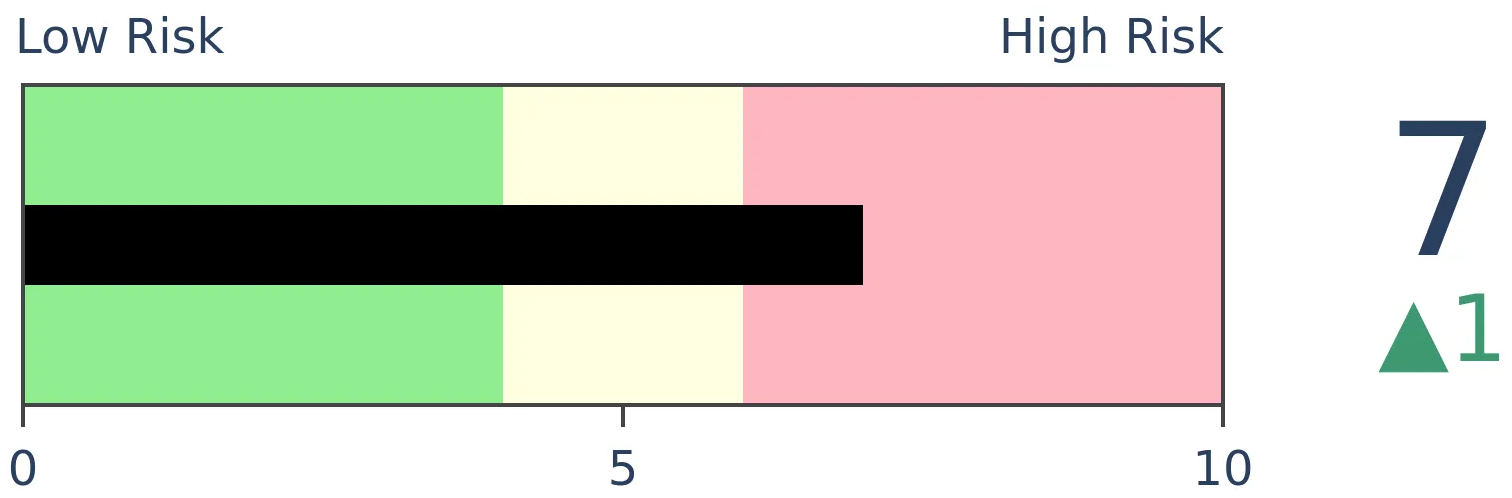
Due to persistently high sentiment levels, the Risk Level on gold has risen to the highest level in four years, right as gold was peaking. Risk Level readings this high have typically preceded losses in the metal, though there were three exceptions. After each of those, buyers ignored all warnings and continued to bid up prices across all time frames.
|
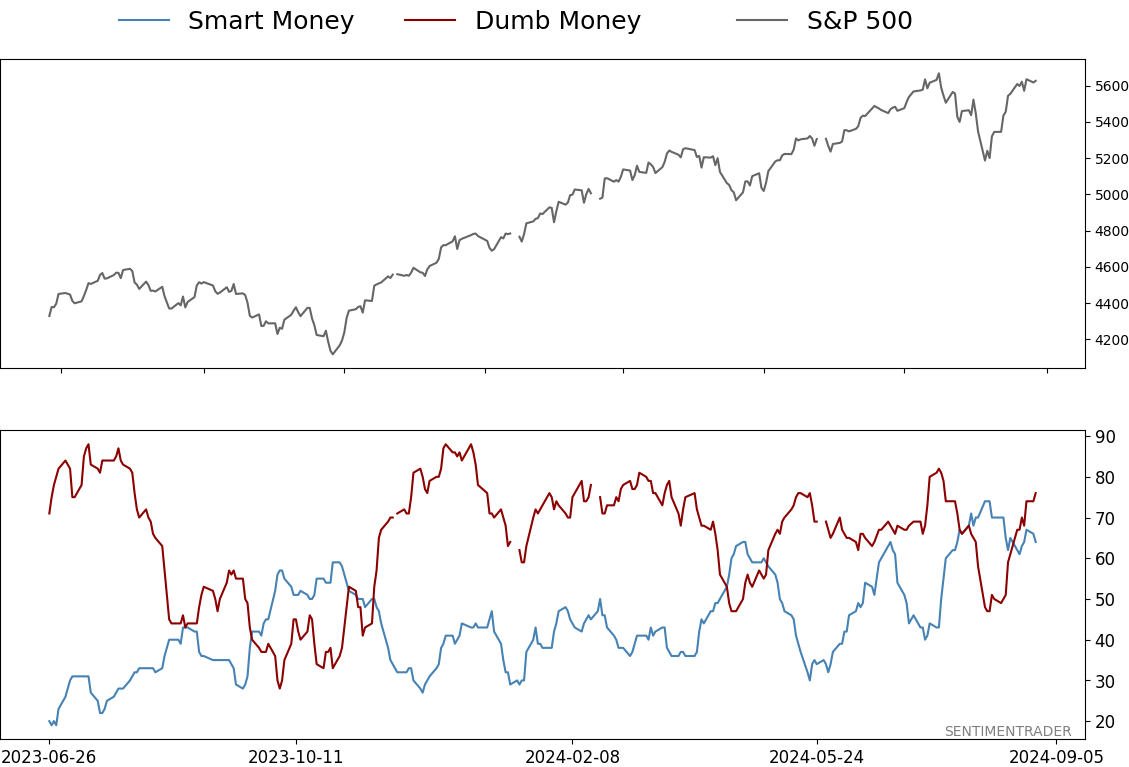
Smart / Dumb Money Confidence
|
Smart Money Confidence: 64%
Dumb Money Confidence: 76%
|
|
Risk Levels
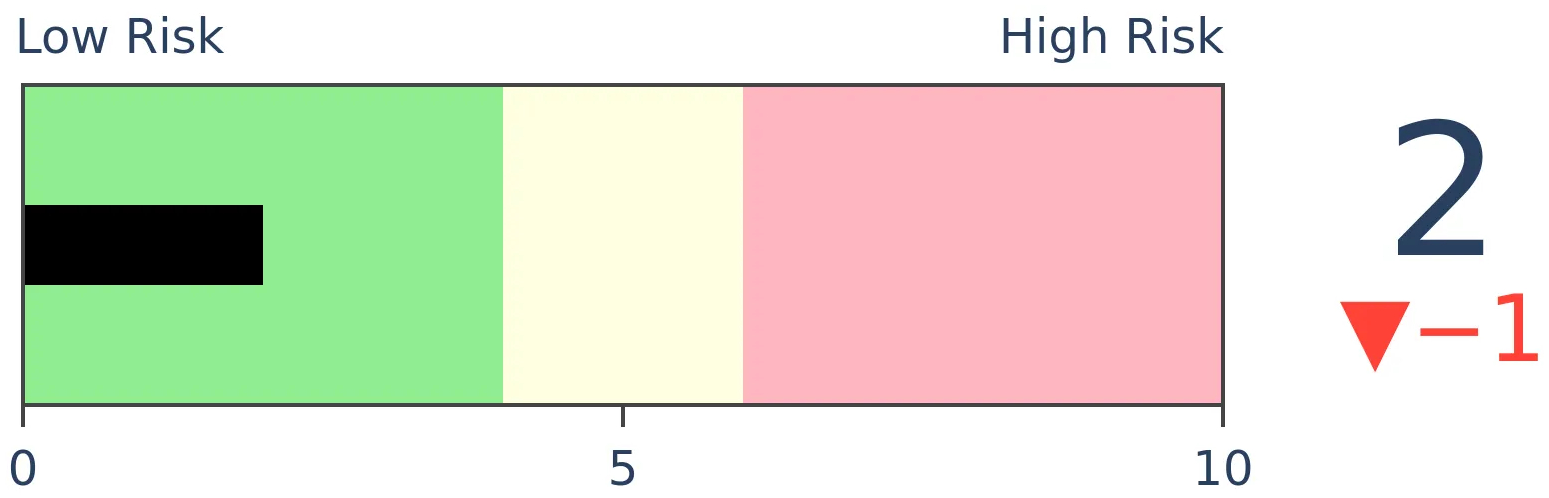
Stocks Short-Term
|
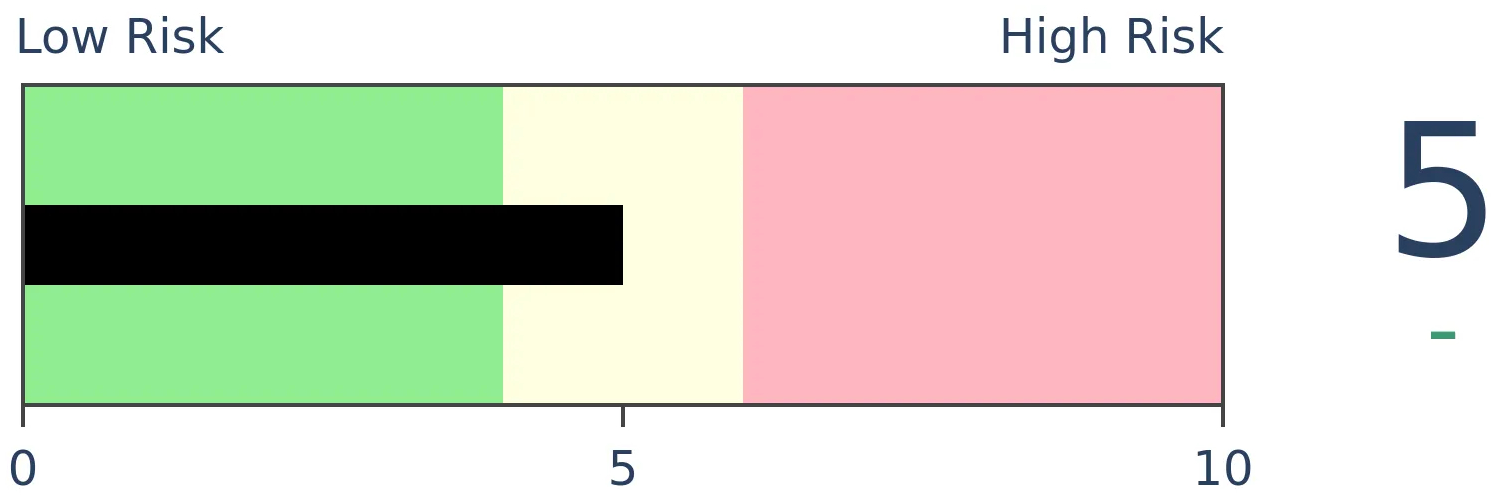
Stocks Medium-Term
|
|
Bonds
|
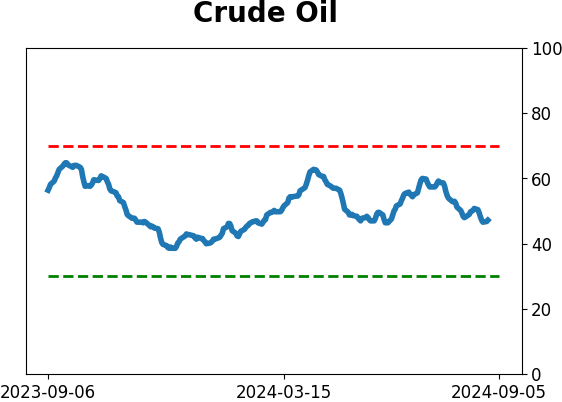
Crude Oil

|
|
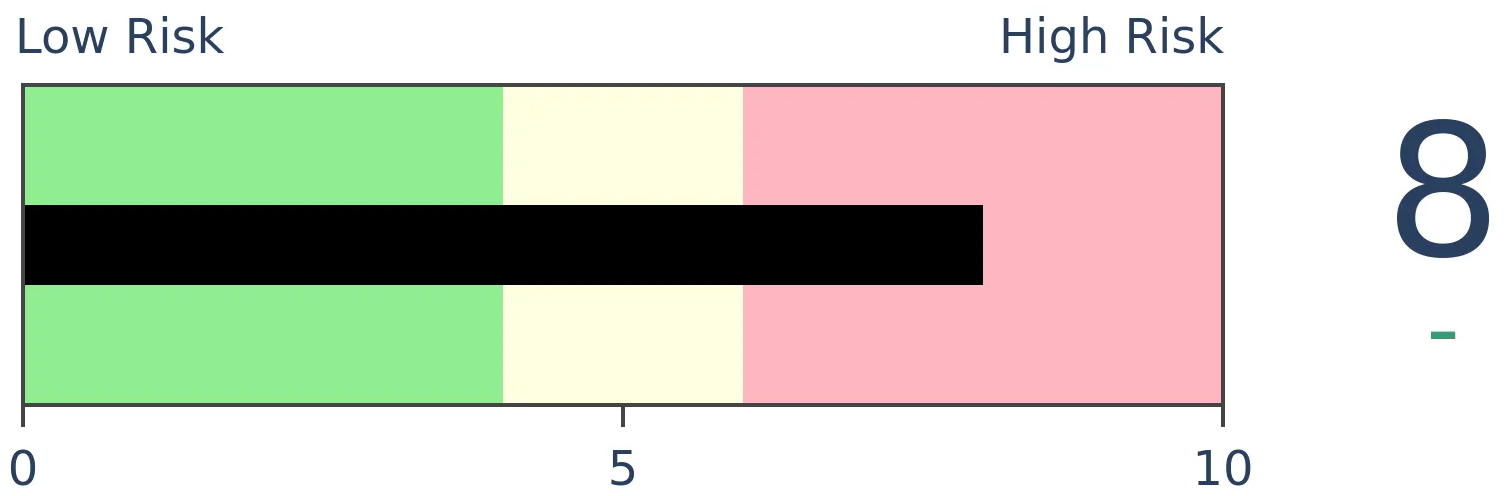
Gold

|
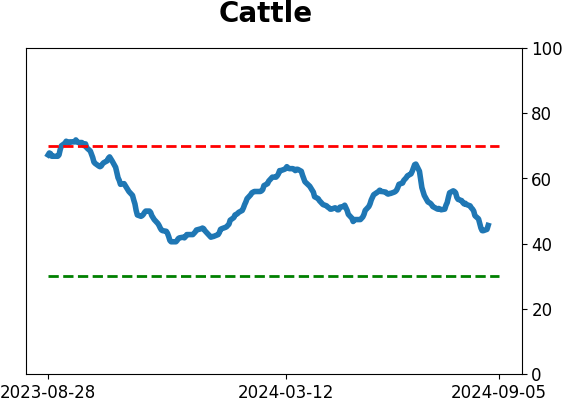
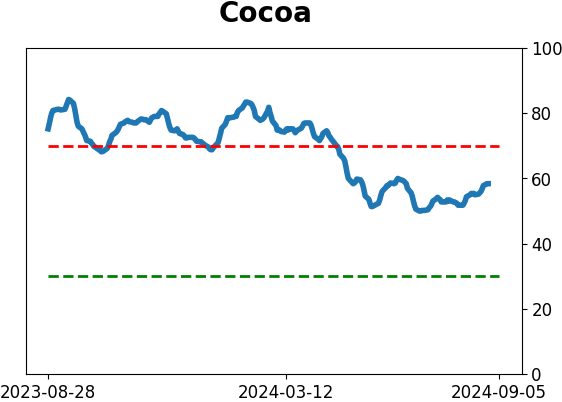
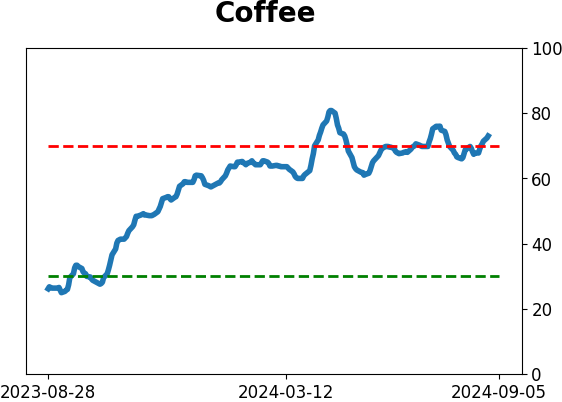
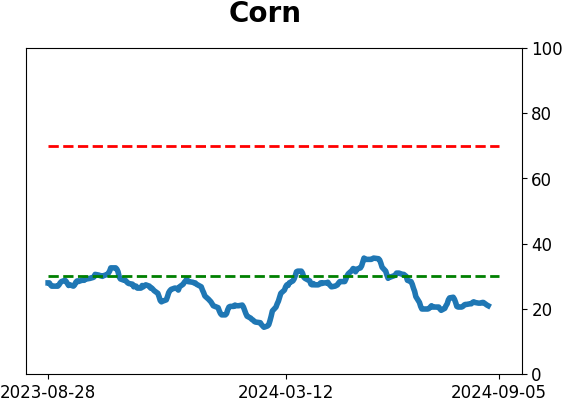
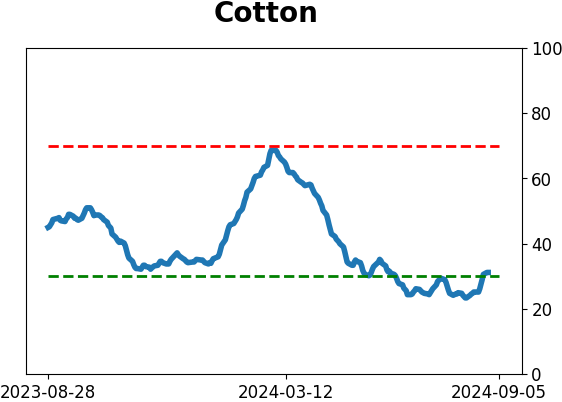
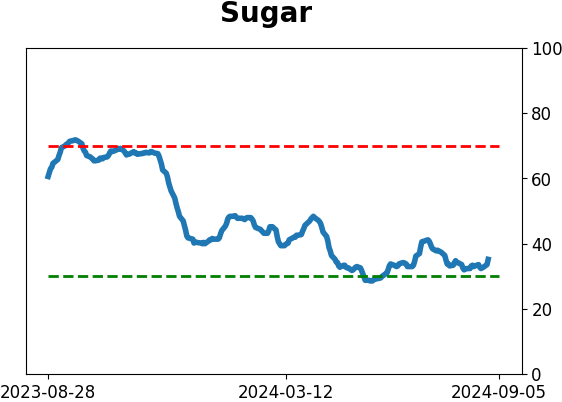
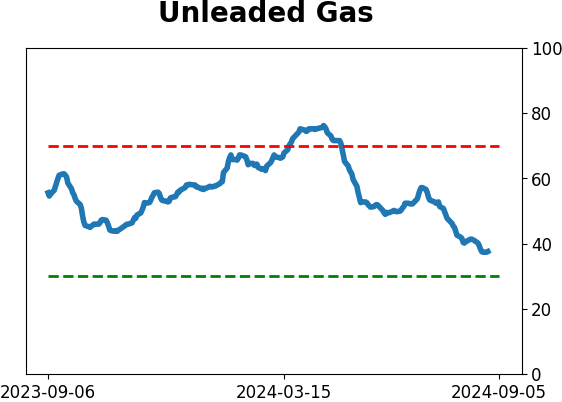
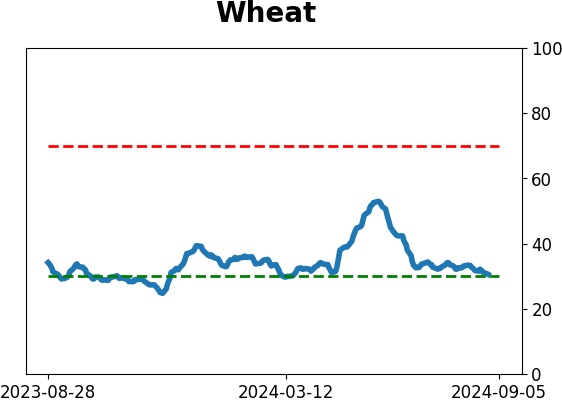
Agriculture
|
|
Research
By Jason Goepfert
BOTTOM LINE
Due to persistently high sentiment levels, the Risk Level on gold has risen to the highest level in four years, right as gold was peaking. Risk Level readings this high have typically preceded losses in the metal, though there were three exceptions. After each of those, buyers ignored all warnings and continued to bid up prices across all time frames.
FORECAST / TIMEFRAME
None
|
Key points:
- Over the past 20 sessions, the Risk Level on gold has been historically elevated
- The last time the Risk Level was this high for this long, it coincided with a multi-year peak
- There have been 3 exceptions, when gold kept on rising, and short-term returns provided an important clue
Gold's risk is rising
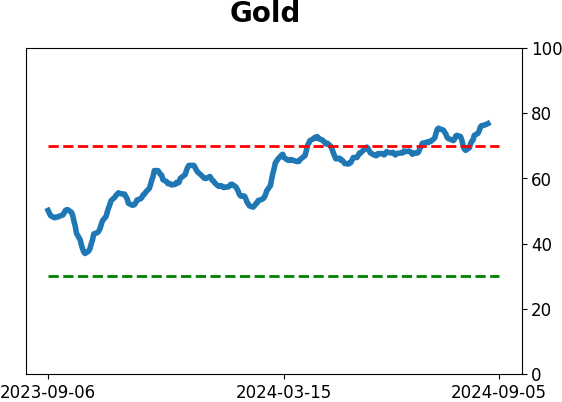
Gold's rise has captured more investors' attention, and it's impacting sentiment levels. The various inputs that go into the Optimism Index calculation have been hovering near the tops of their long-term ranges, a complete 180 from September - October 2022.
The Optimism Index powers gold's Risk Level based on how the metal performed after different sentiment levels. Over the past 20 days, that Risk Level has averaged 7, the 2nd-highest in five years. The last time it reached this level coincided with the 2020 peak.
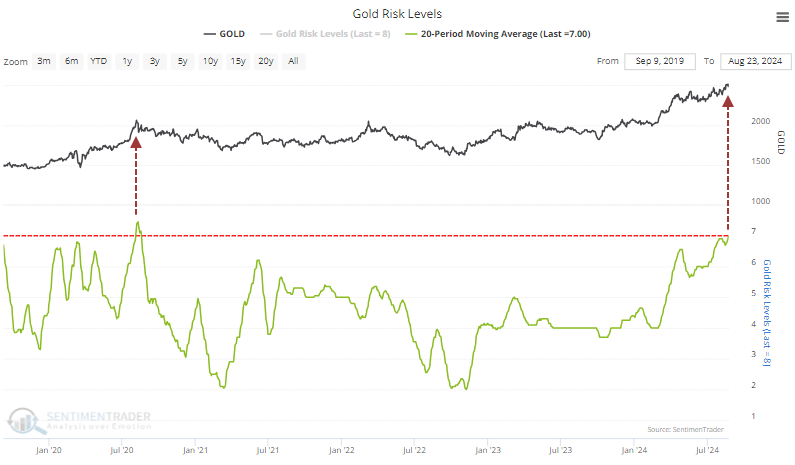
Backtest Engine 2.0 shows that when the 20-day average Risk Level reaches 7 for the first time in months, it wasn't a clear-cut sell signal (click here to load the test and then the Run Backtest button to execute it). Three times, this triggered right before substantial runs in the metal, highlighted with green boxes in the chart below.
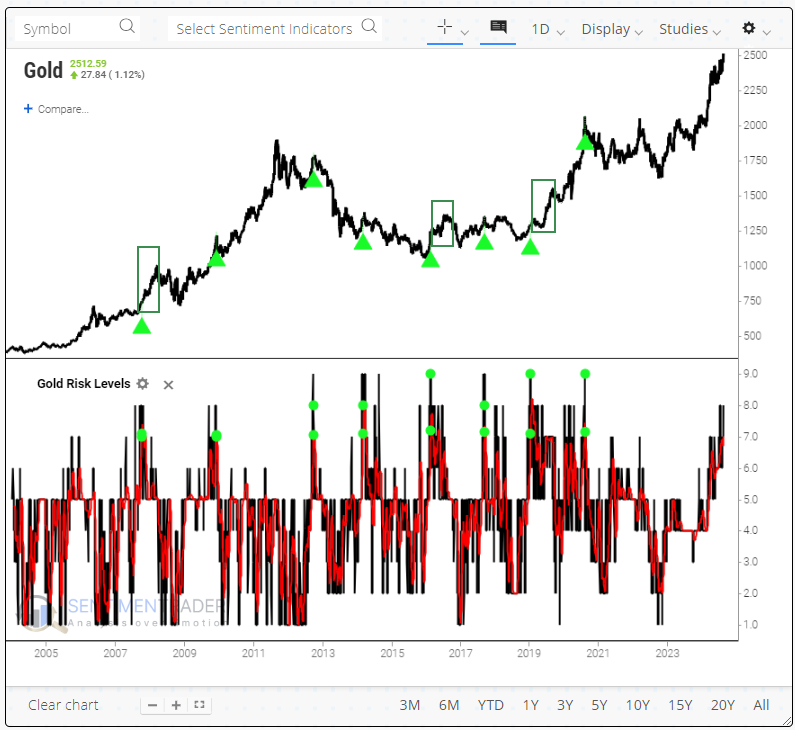
The table below shows returns in gold after these signals. We can see the three dates with double-digit gains either six or twelve months later, in 2007, 2016, and 2019. All the others showed losses, at least over the next few months.
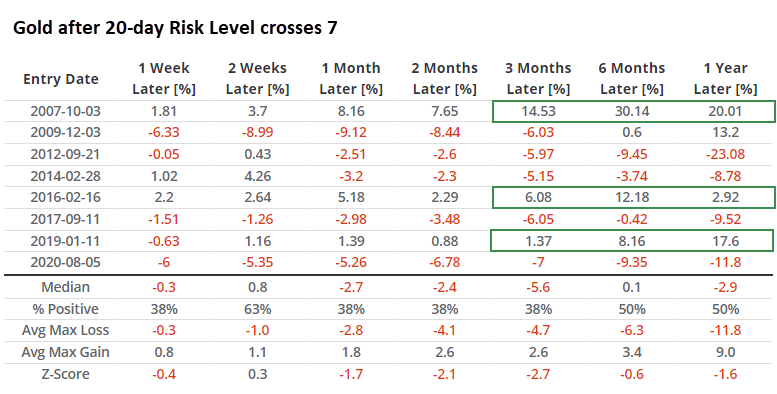
If you use the Engine, you can click the Max Gain and Loss tab to see the drawdowns and drawups across time frames. What sticks out is that the three signals that witnessed substantial gains all witnessed minimal selling - if any - after the 20-day Risk Level first crossed 7.
Even a month later, all three saw no more than a -0.76% drop in gold as buyers never let up. All the other signals saw more significant losses than gains, or close to it. This suggests that if buyers continue to bid up gold in the weeks ahead, we have some compelling evidence that this will be one of the exceptions when other factors overwhelm sentiment and potentially lead to sustained gains.
Good for the dollar, stocks
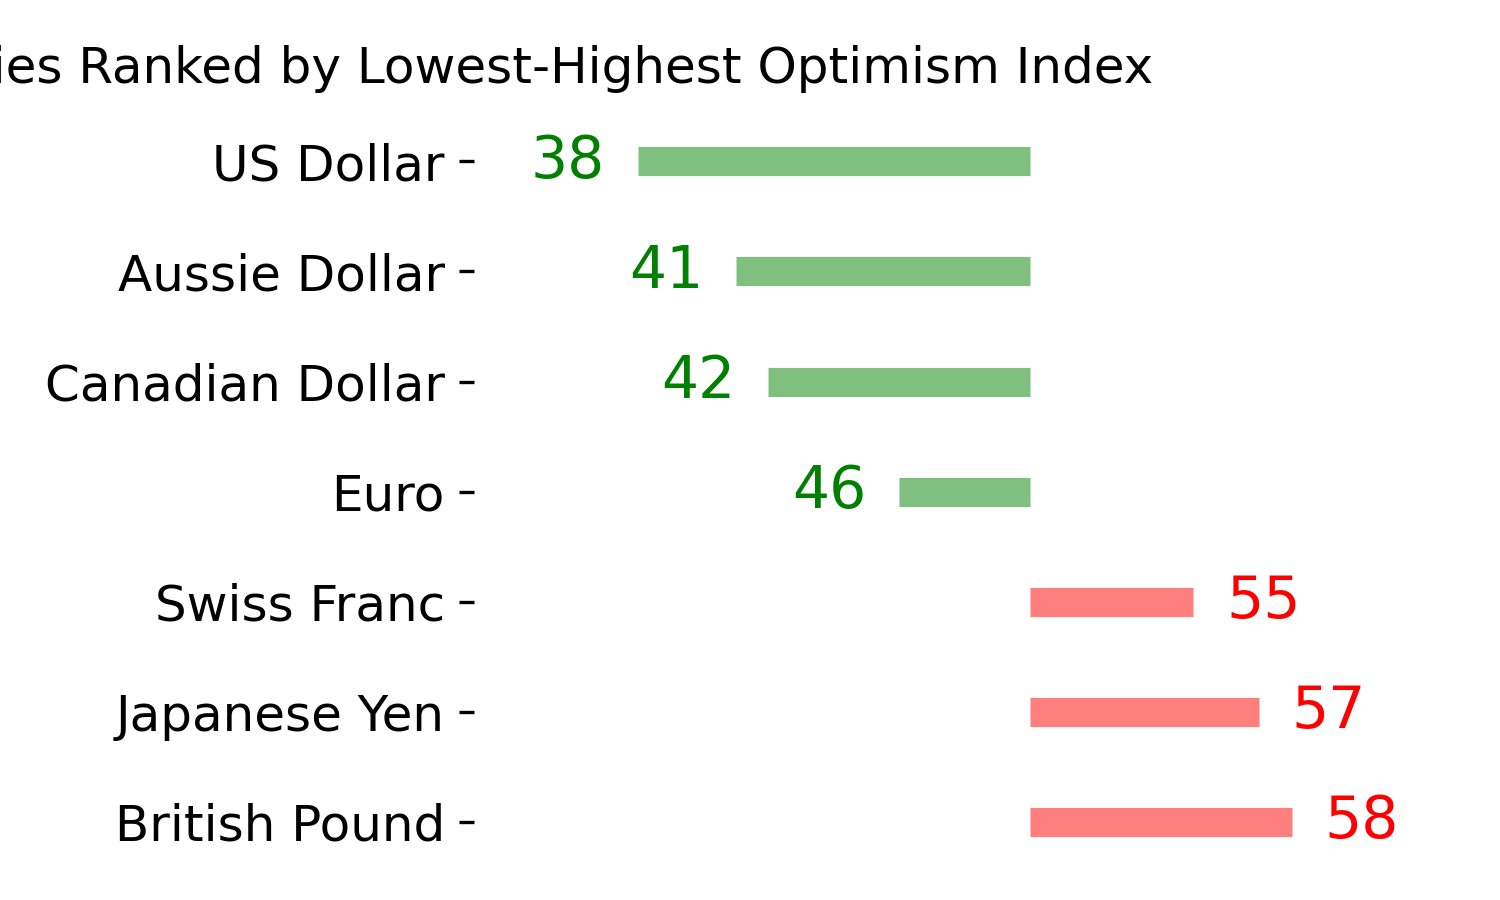
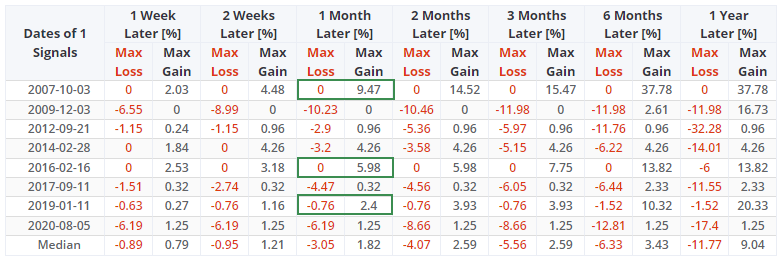
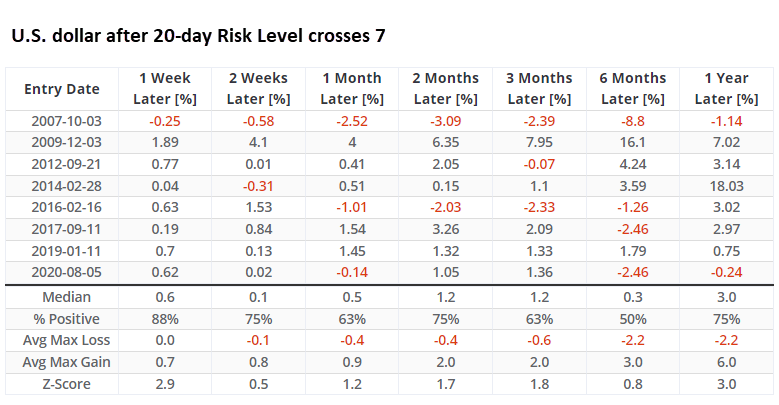
The gains in gold have come as the dollar has declined, which is unsurprising. The two have a primarily negative correlation, though it's not perfect. So, we can use the same test, but instead of gold, we can test it against the dollar.
The table shows that by the time sentiment had reached this level on gold and risk had been elevated for this long, it typically coincided with oversold conditions in the buck. It rose six times over the next couple of months and declined twice.
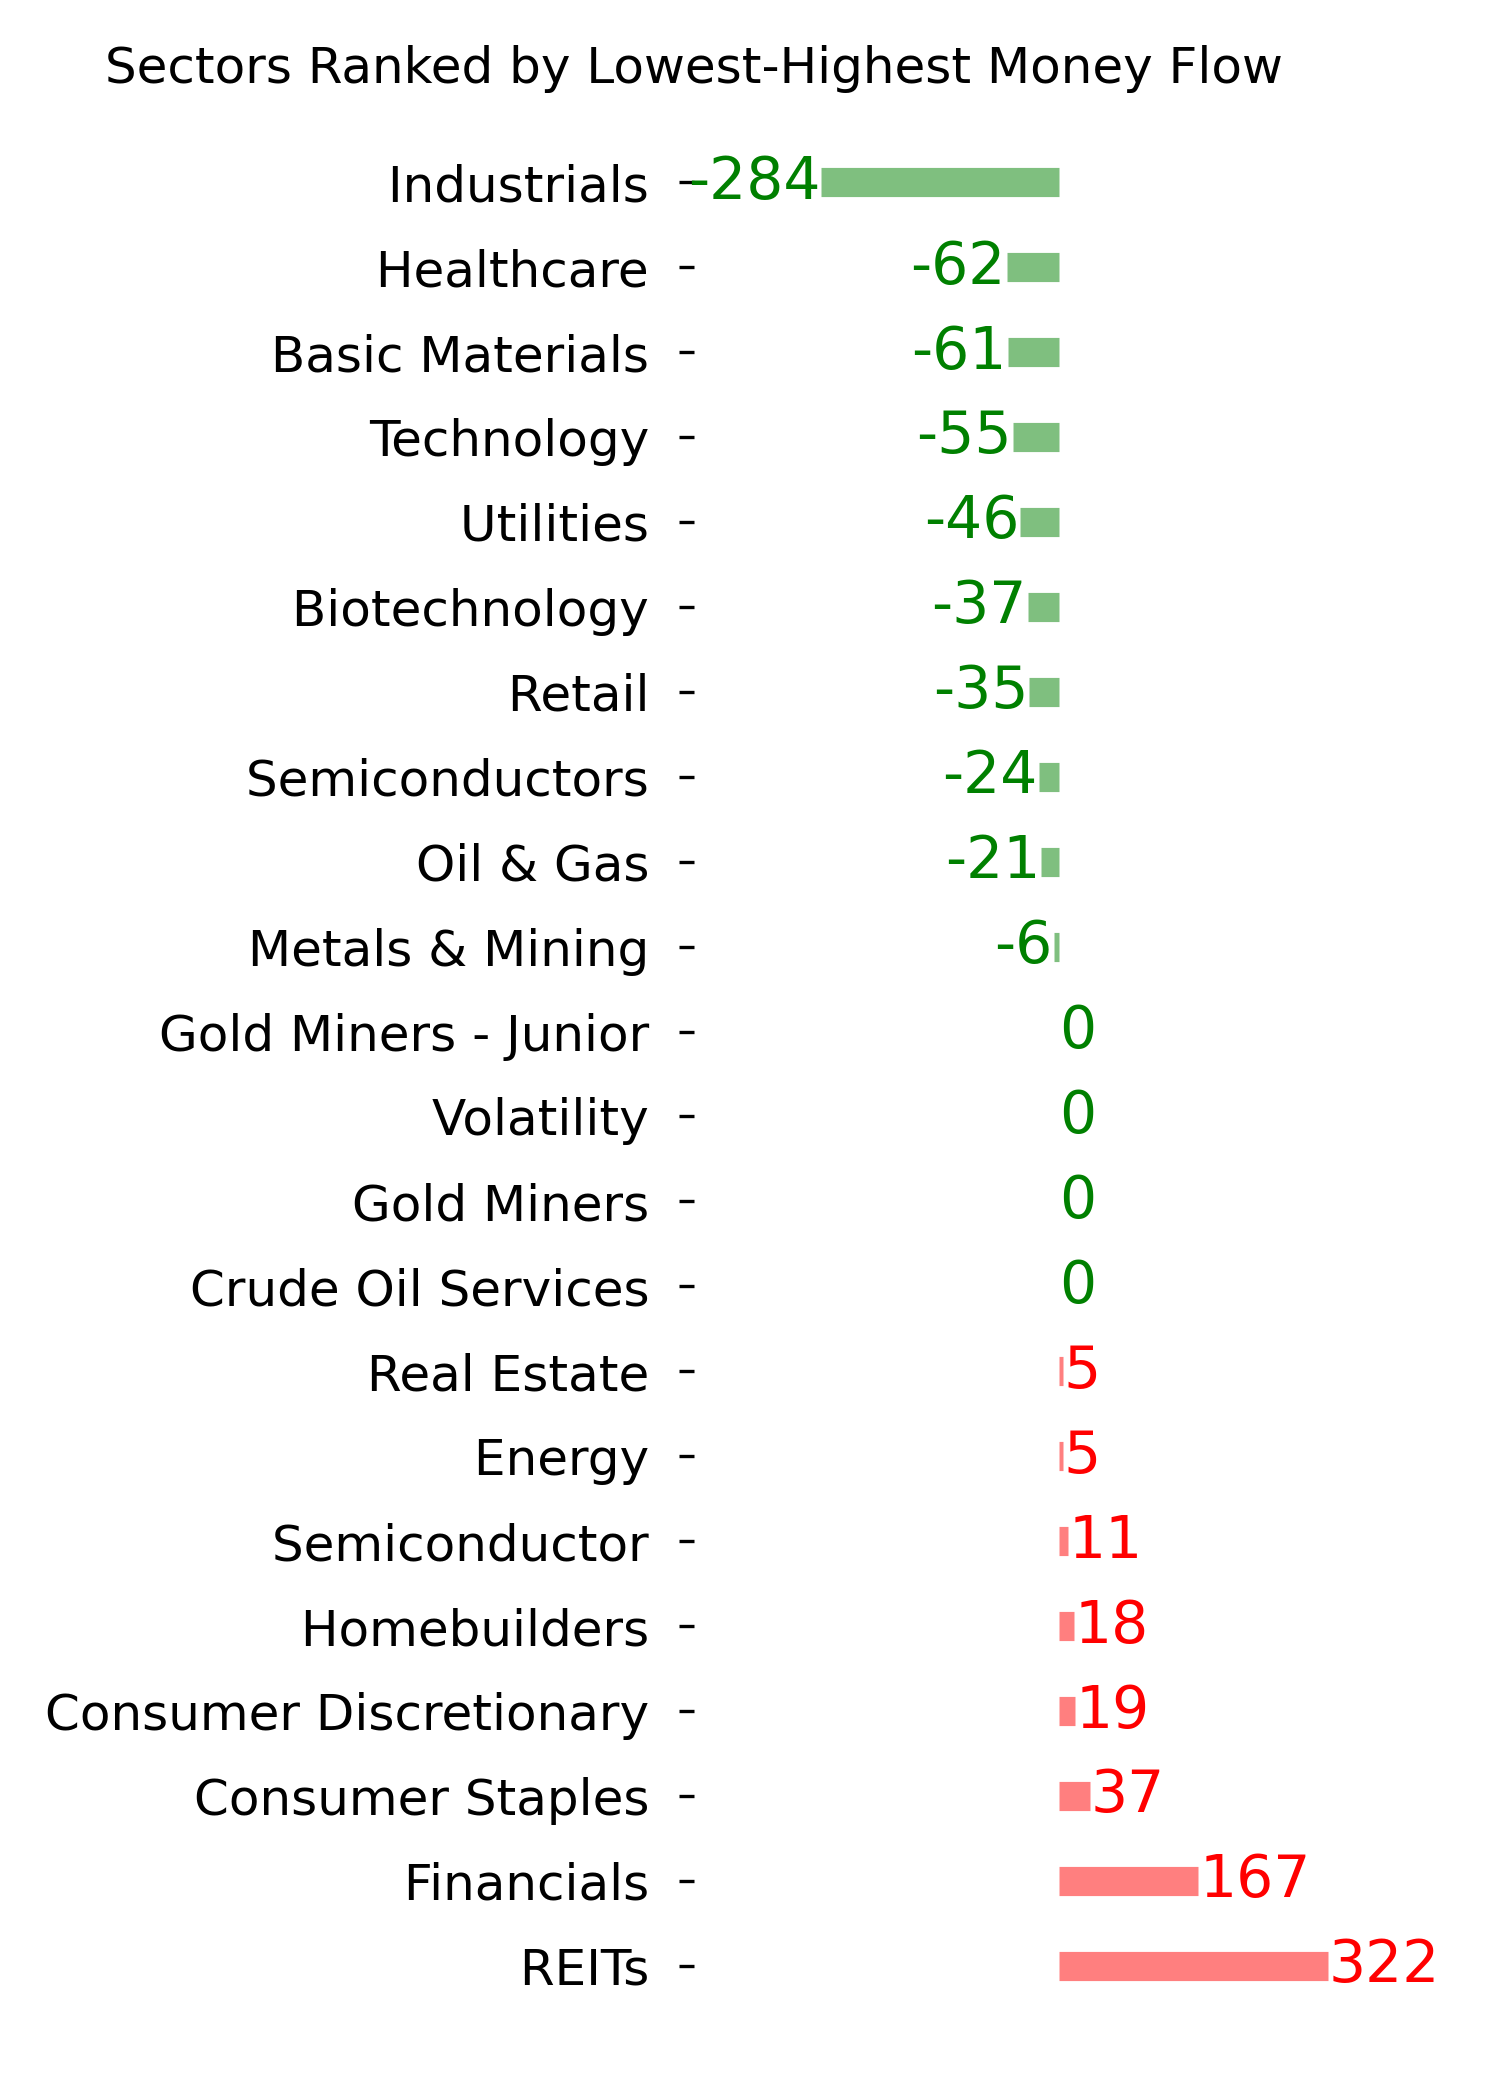
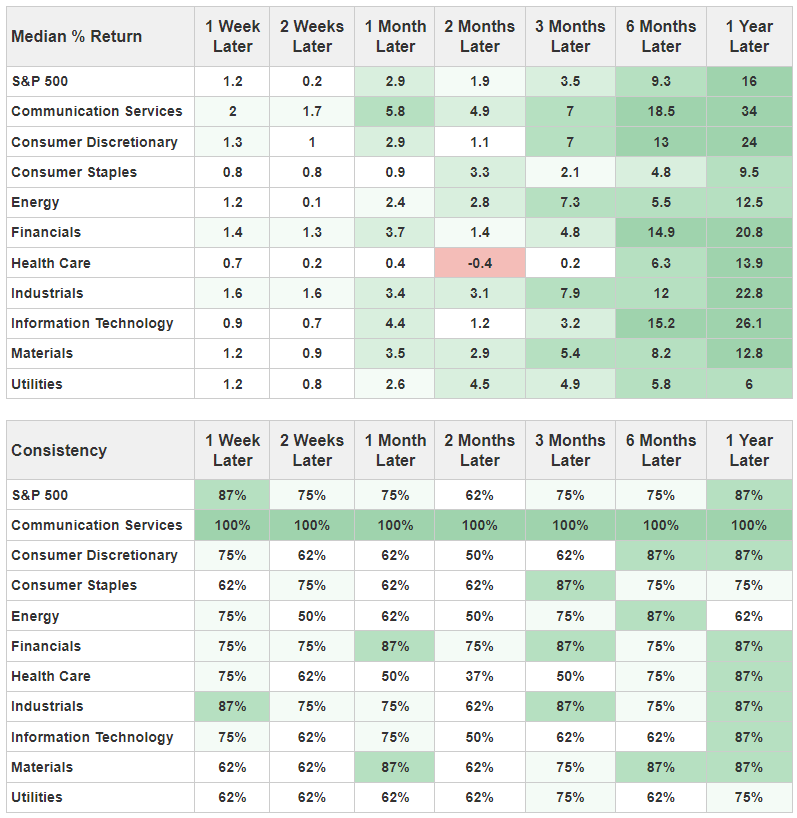
After these gold signals, the S&P 500 did quite well. Over the next year, it rose 87% of the time by an average of +16%. Gains were widespread among its sectors, with financials among the more consistent beneficiaries-which is a bit surprising, given assumptions that big gains in gold come ahead of economic trouble, where financials are usually among the hardest hit.
What the research tells us...
Gold has performed exceptionally well this year and shows little sign of slowing down. Investors are taking notice, and some measures are becoming quite stretched. Most of the time, this has meant a plateau in the metal or an outright peak. However, there have been some exceptions, and fortunately, those have been consistent in their clues. When investors ignored the warning signs and continued to bid up gold prices anyway, it preceded substantial and sustained gains. The other signals did not see this behavior, which suggests we should pay attention to how well gold can hold up in the weeks ahead.
Indicators at Extremes
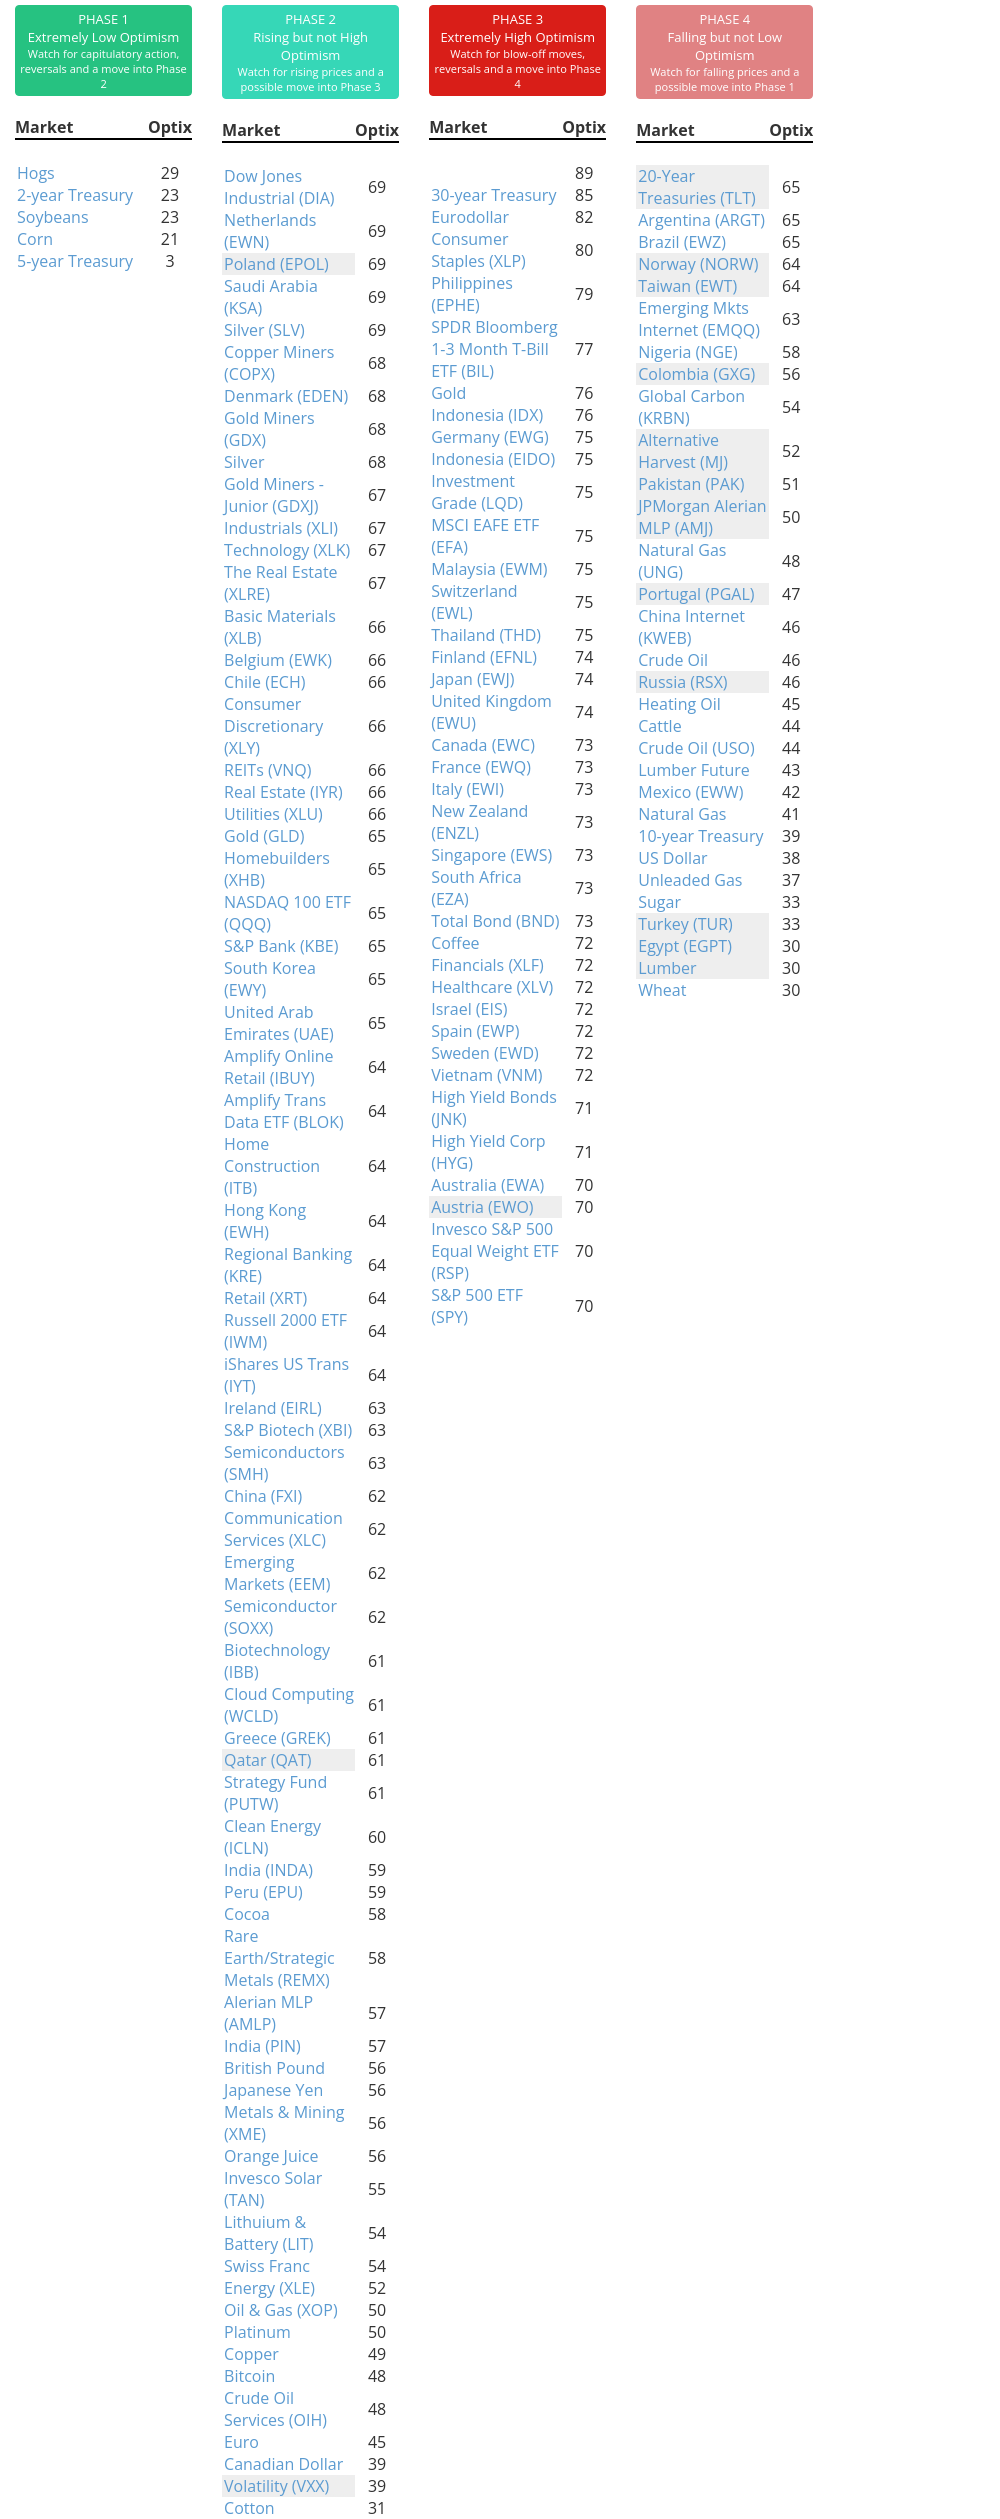
Phase Table
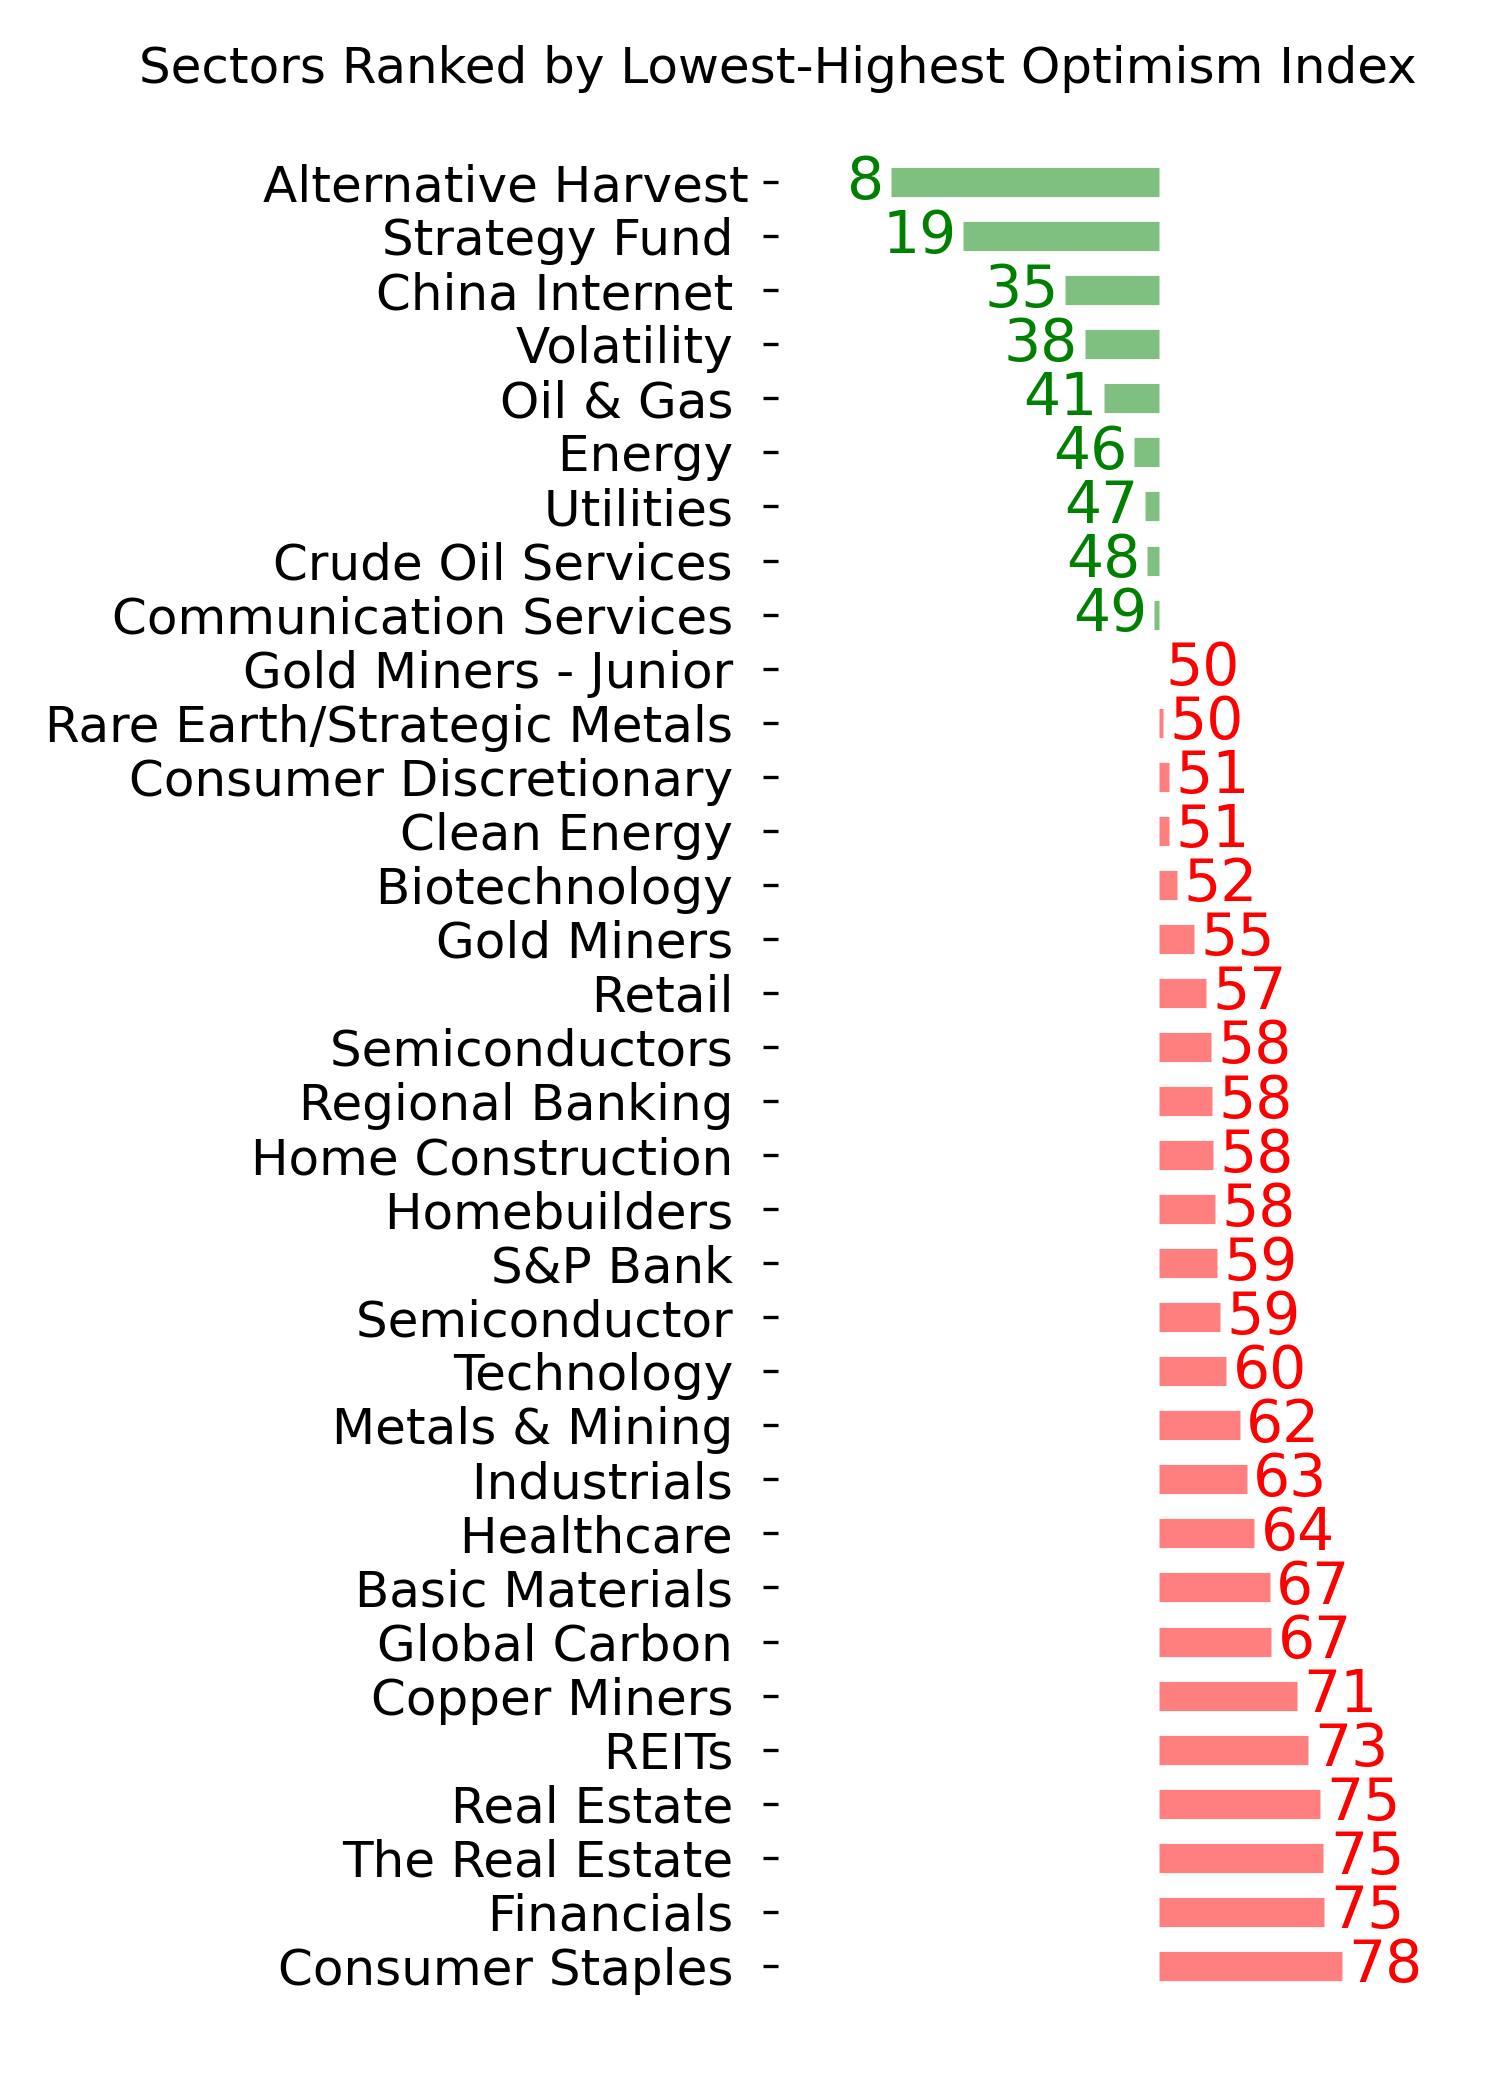
Ranks
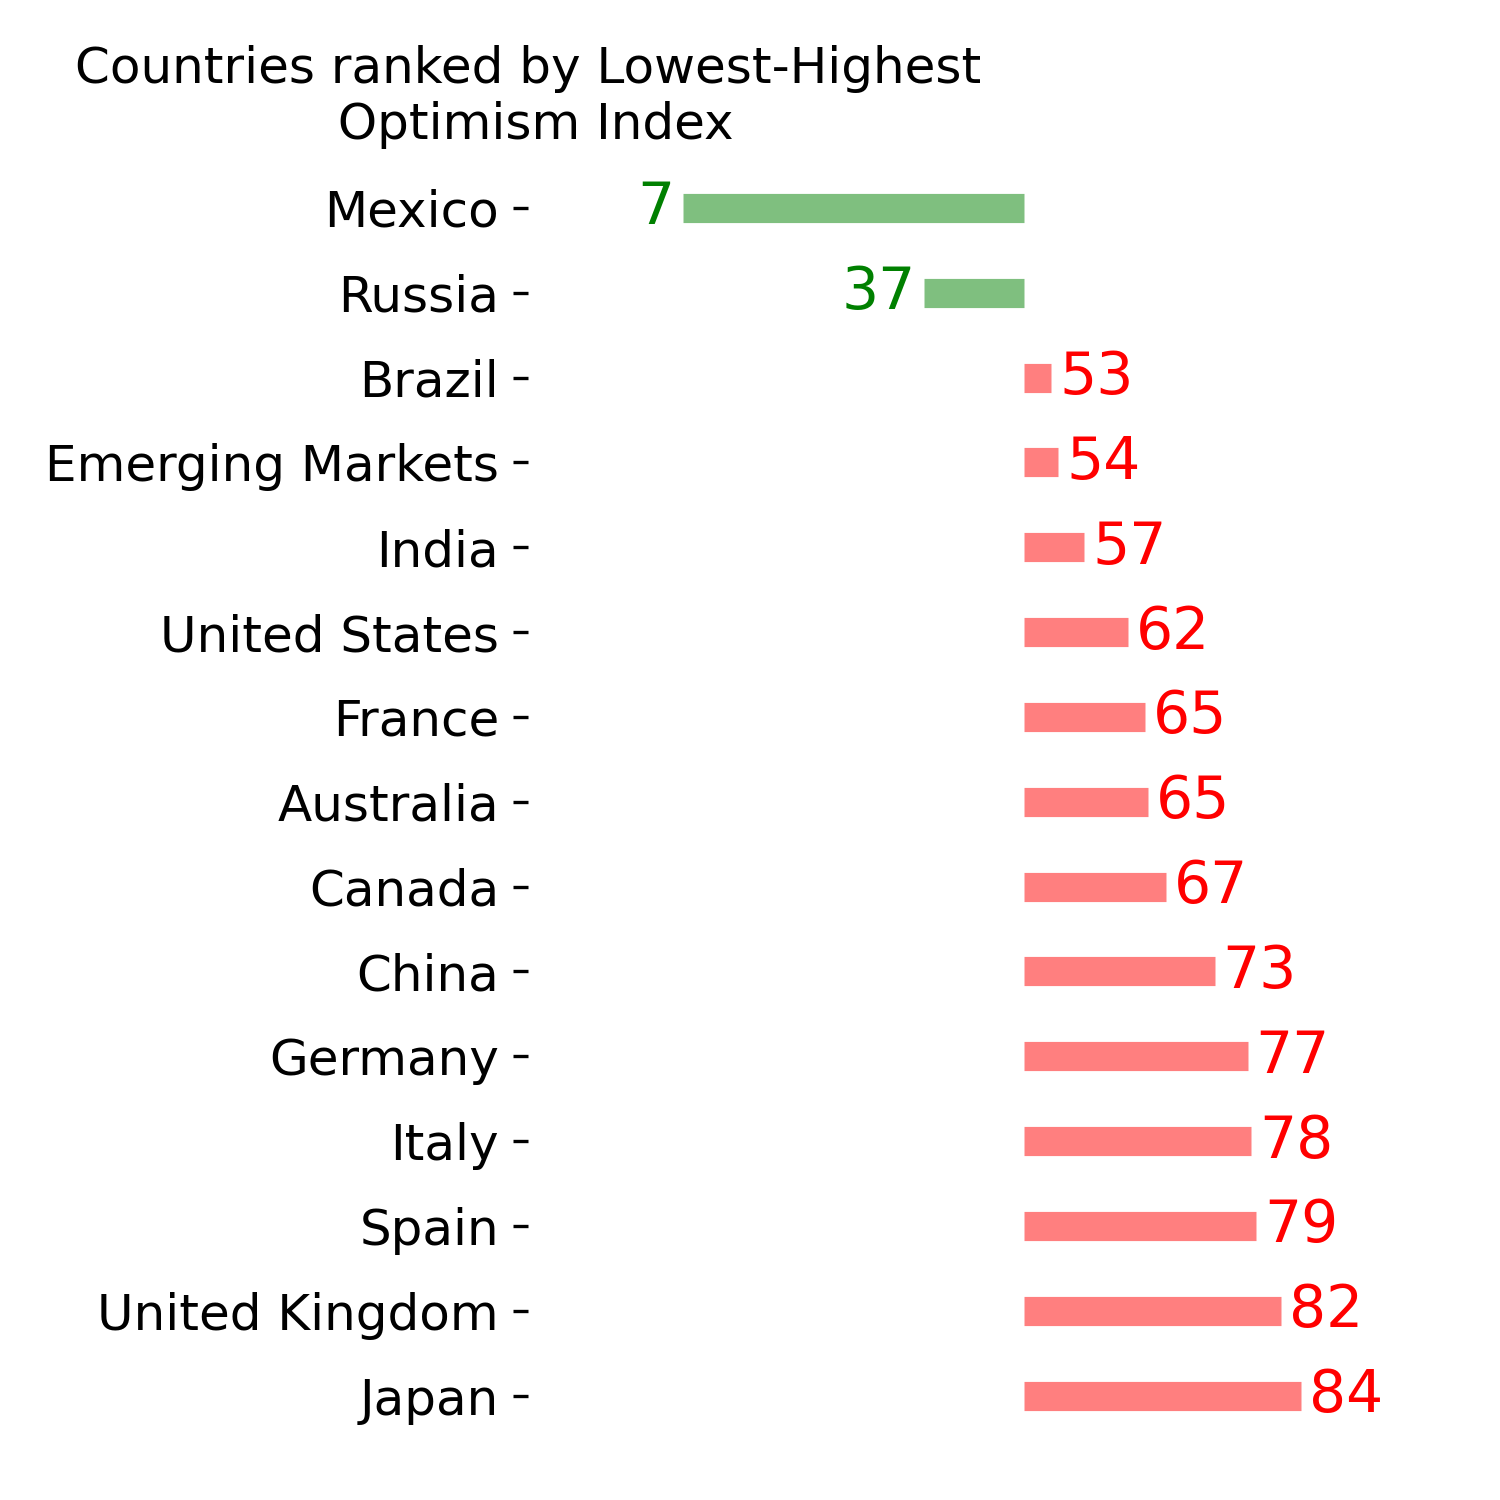
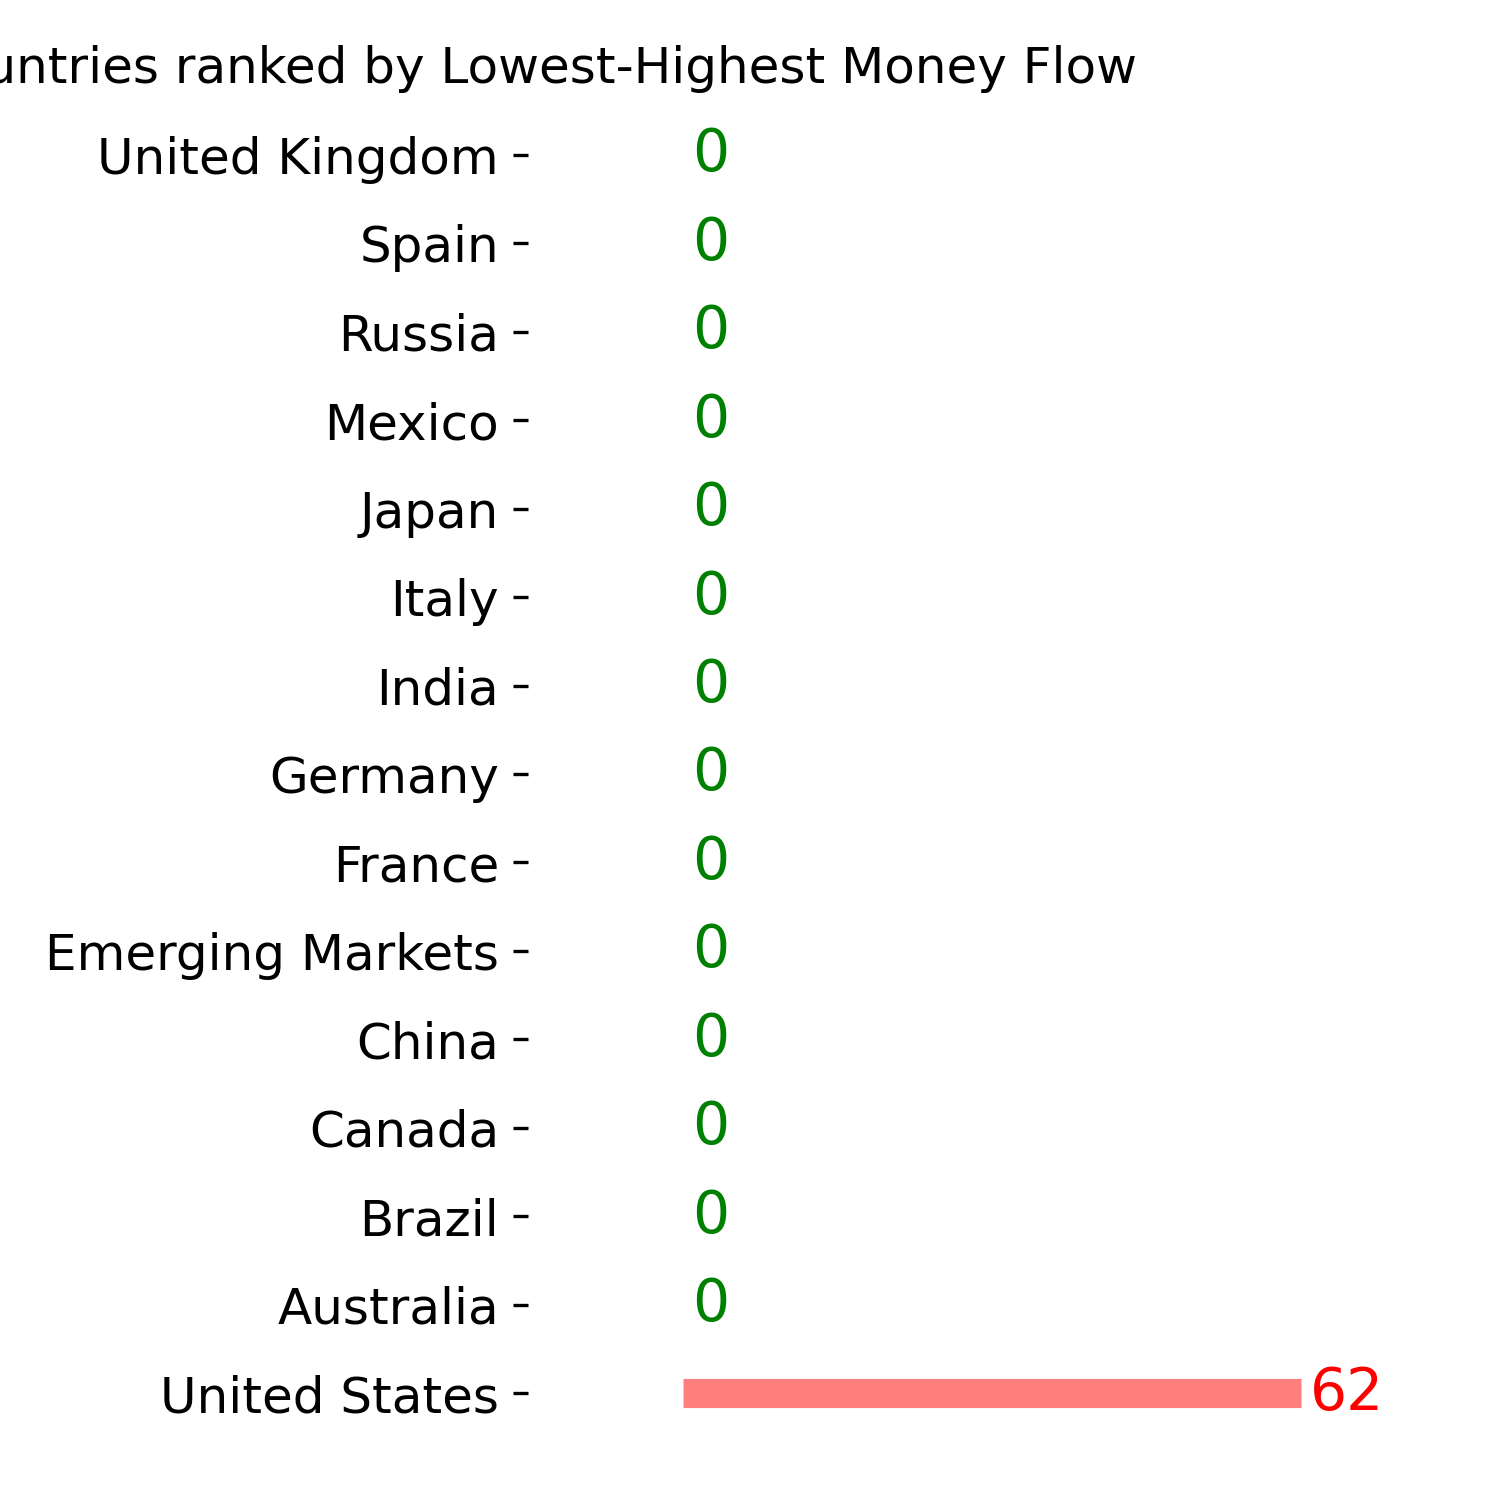
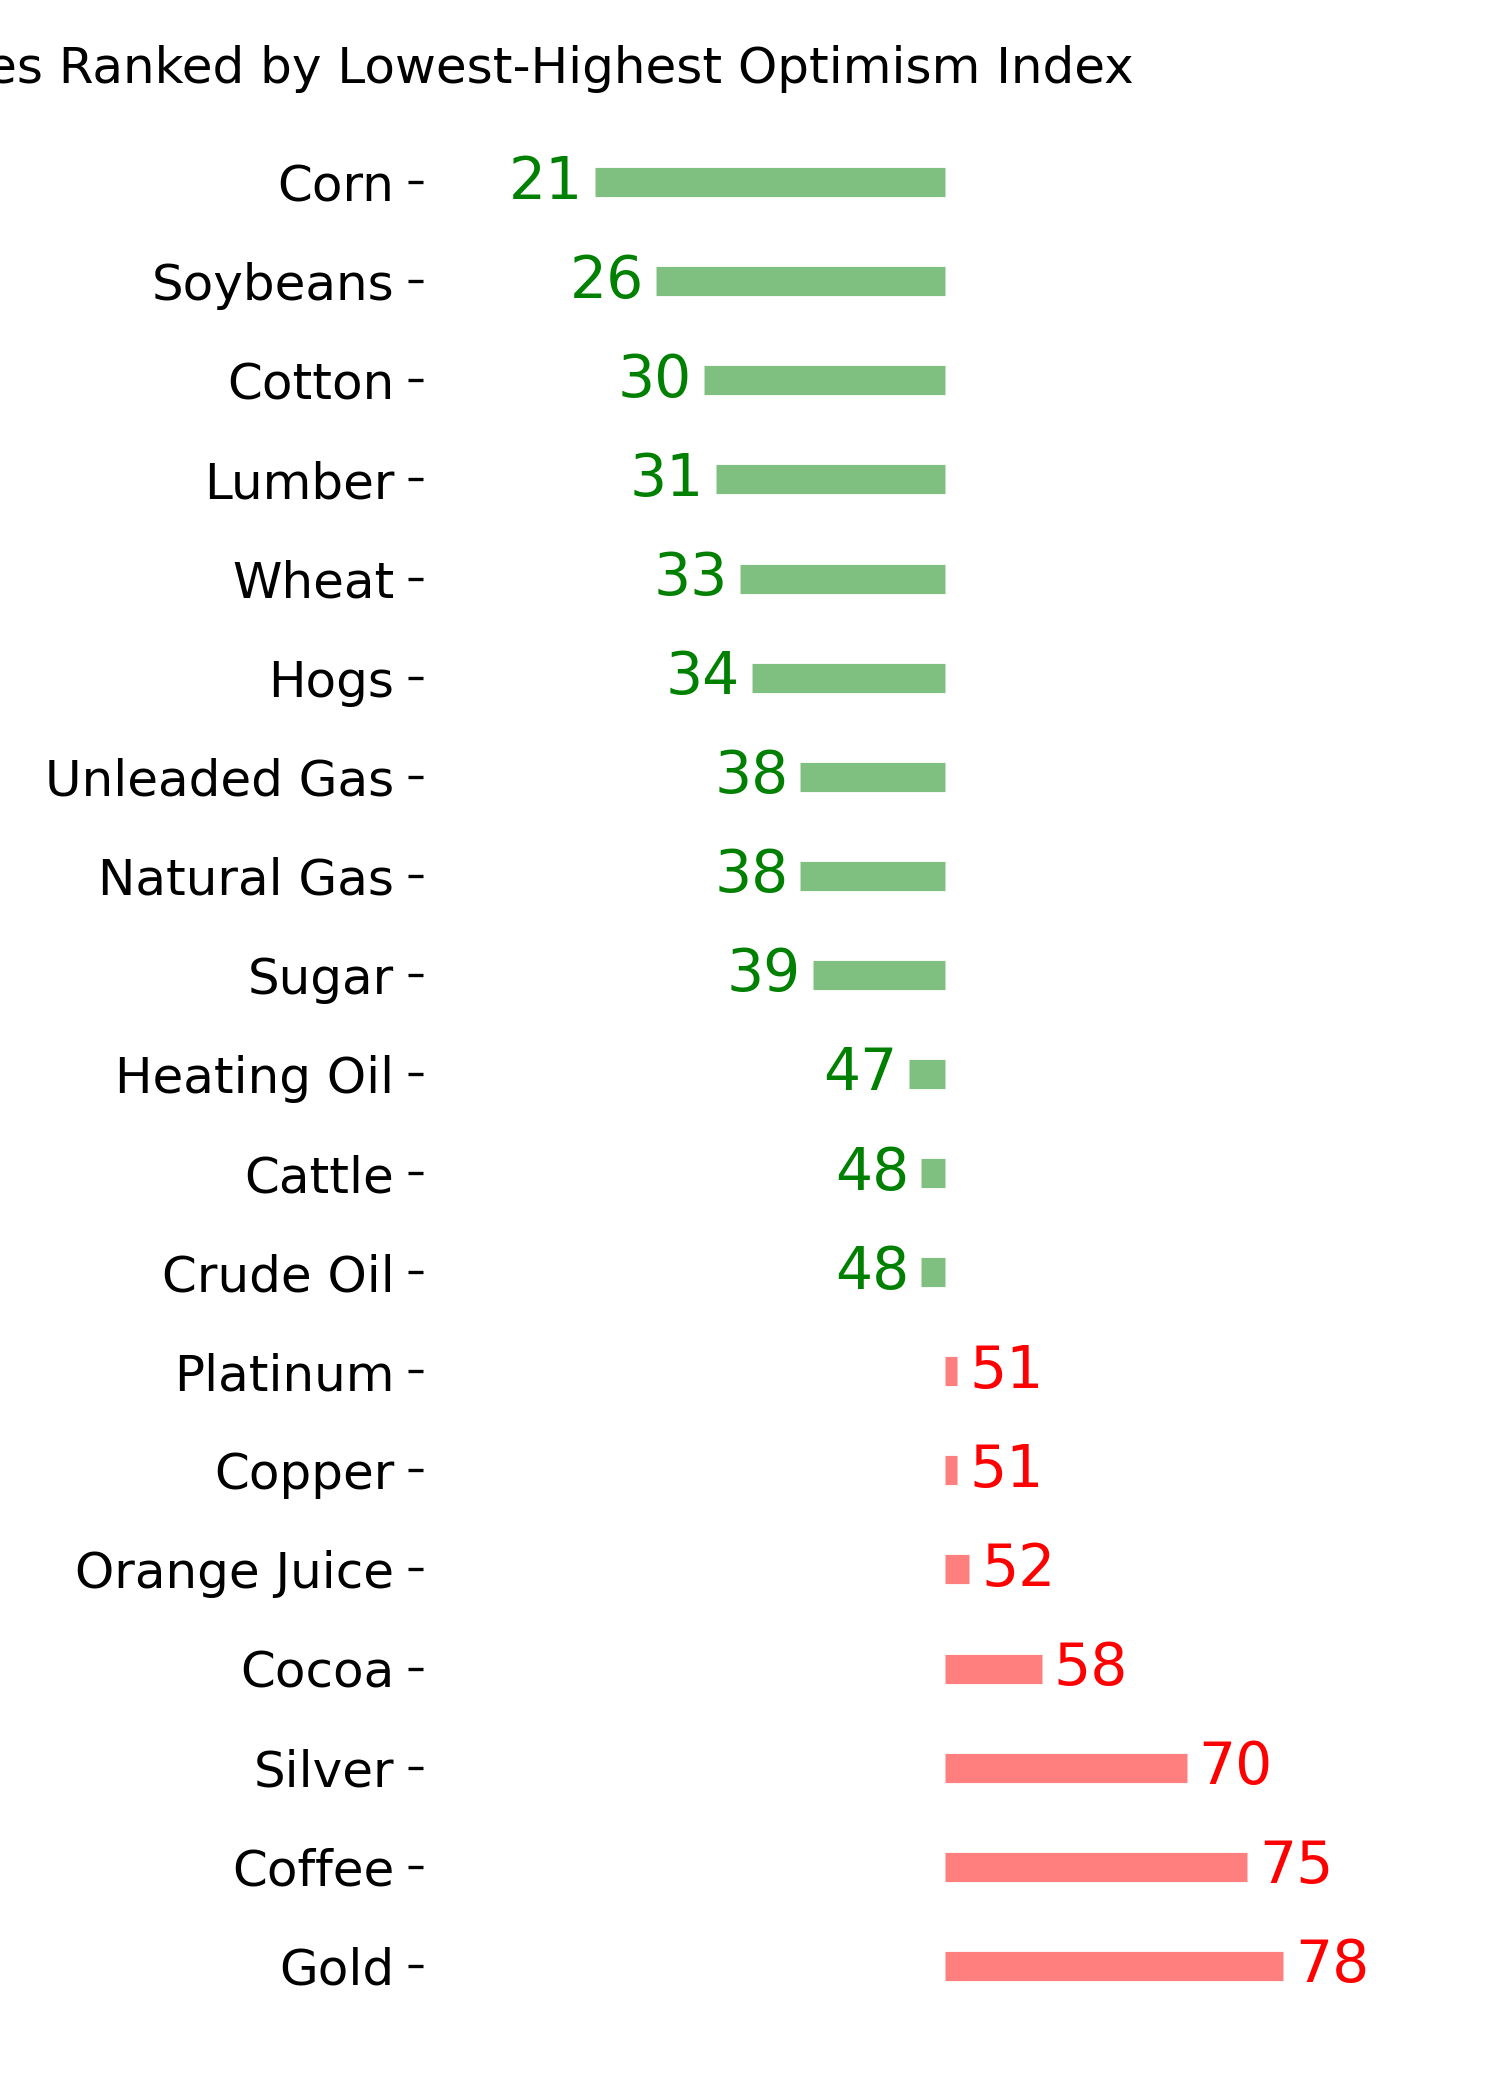
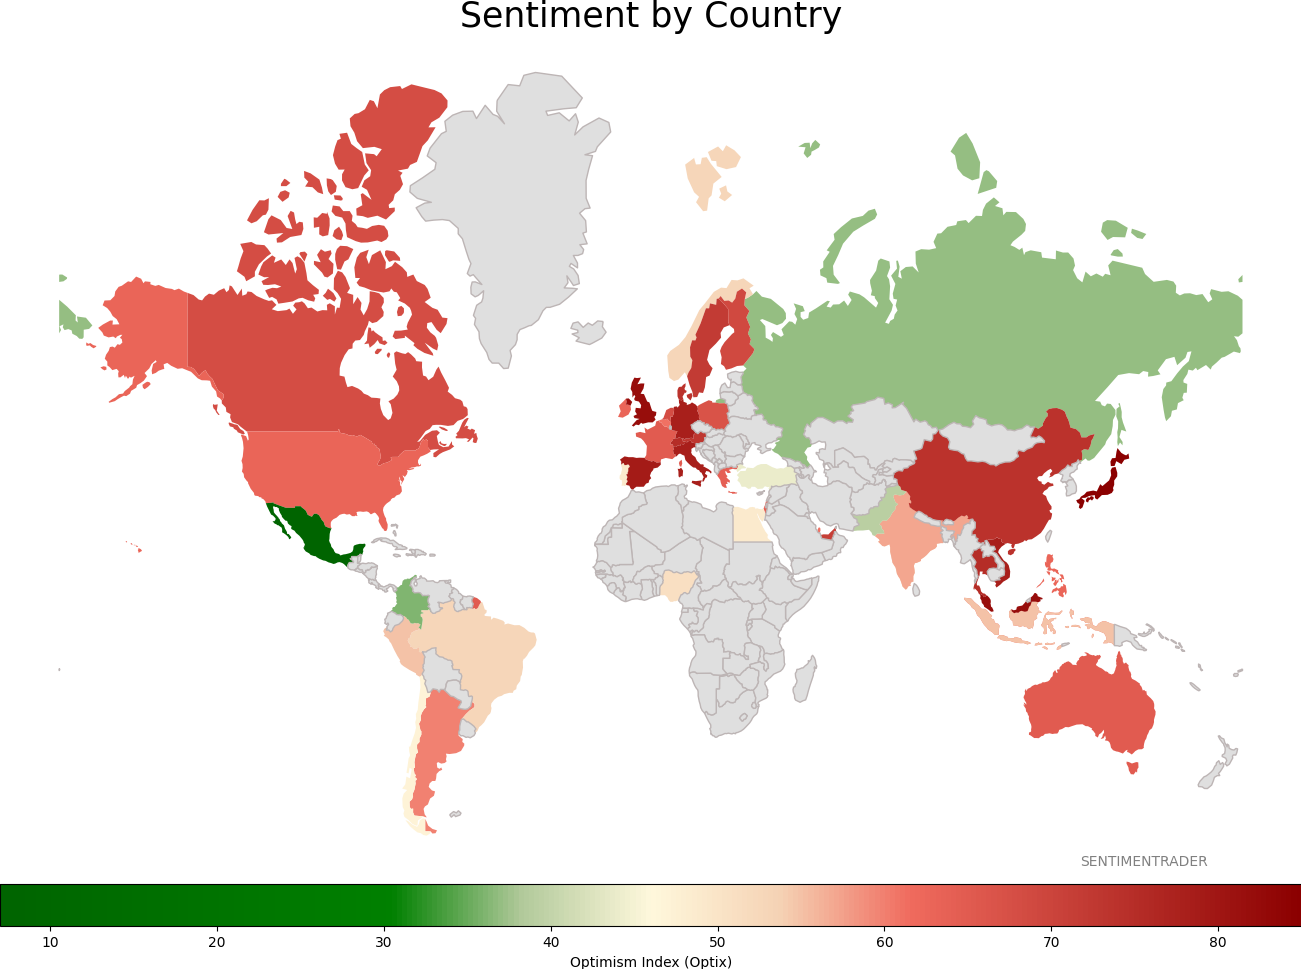
Sentiment Around The World
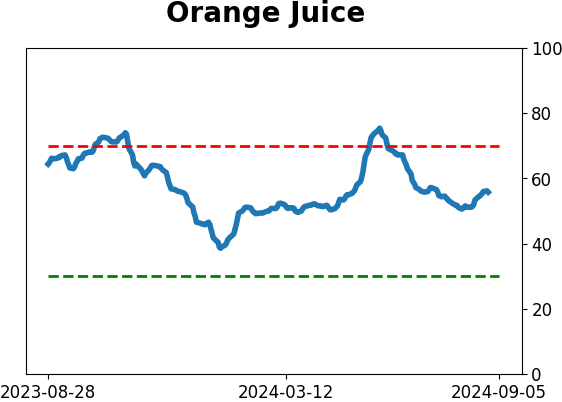
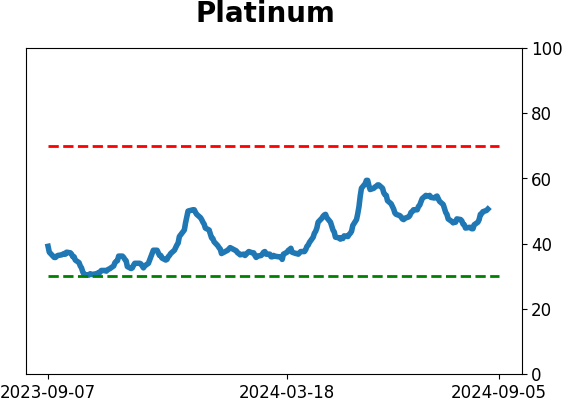
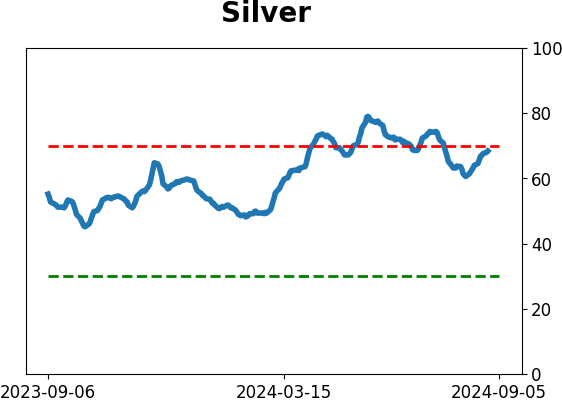
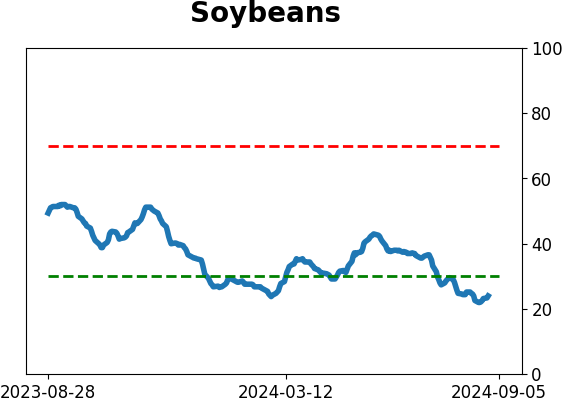
Optimism Index Thumbnails
|
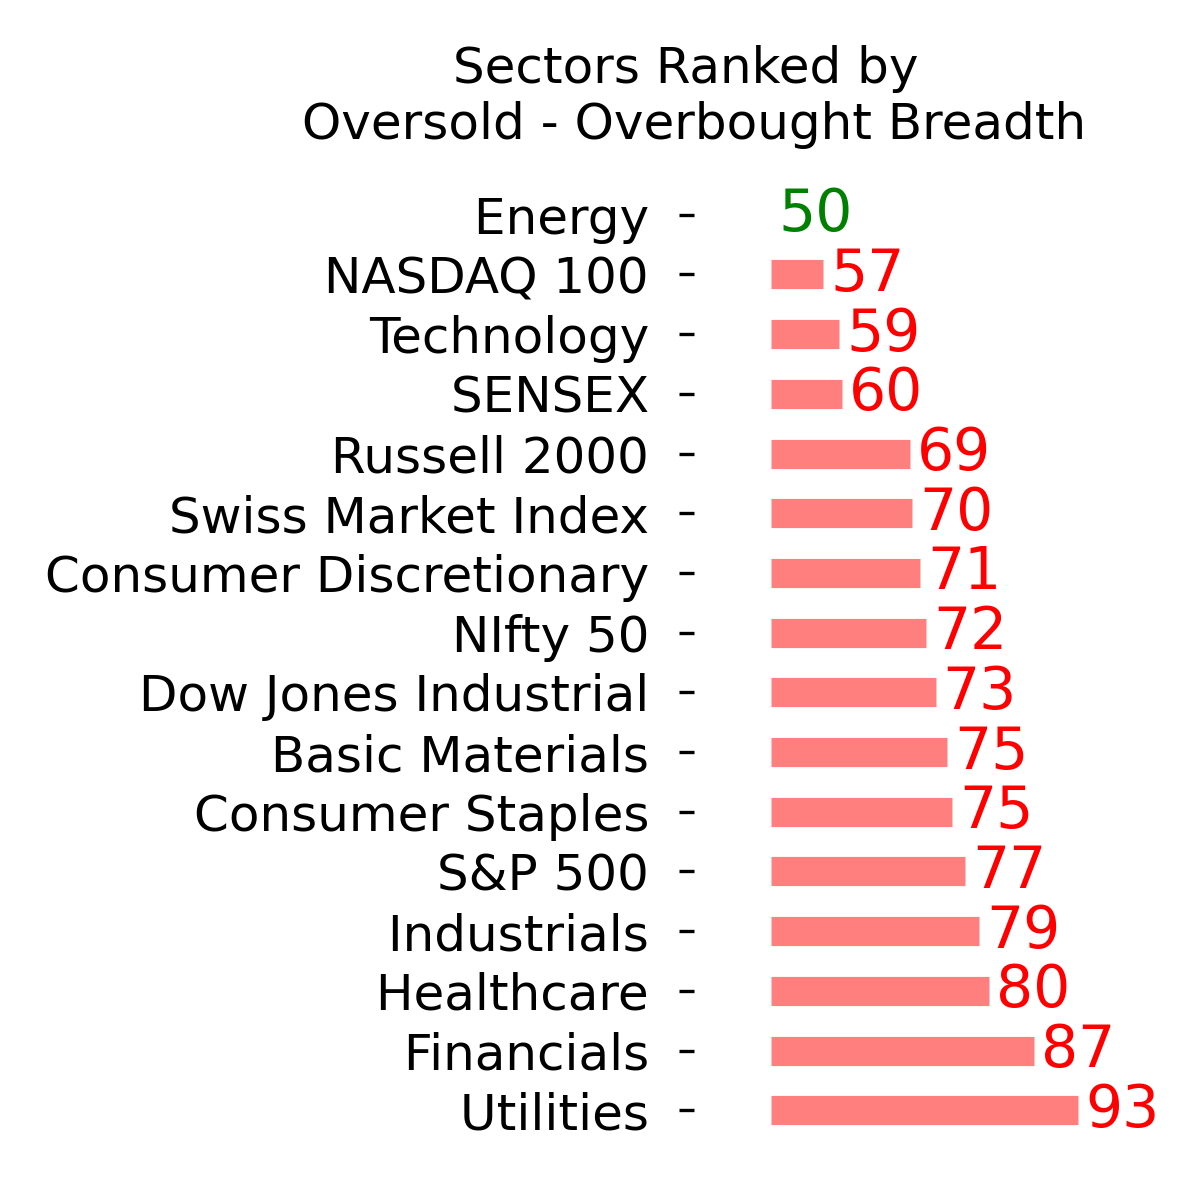
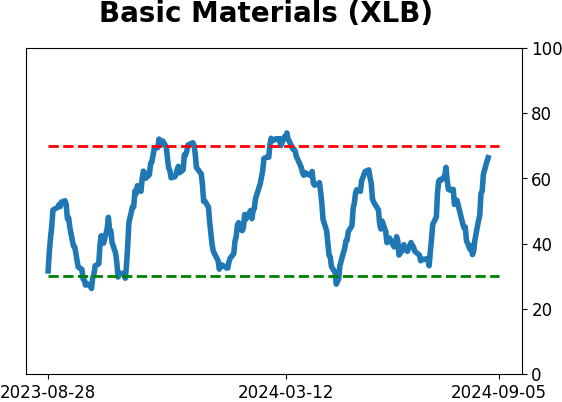
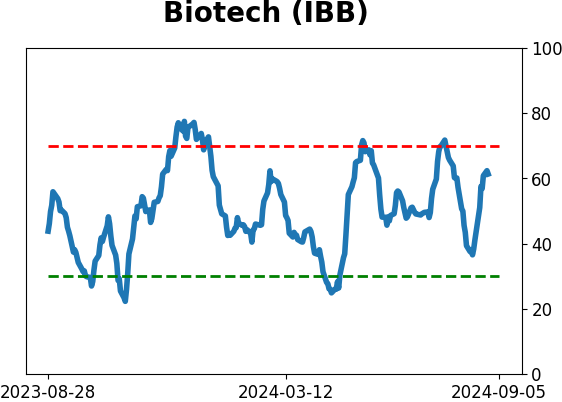
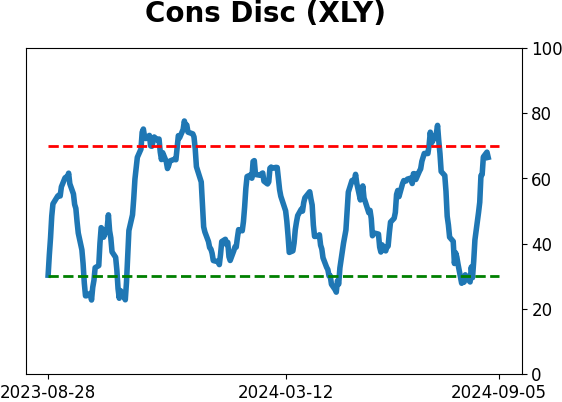
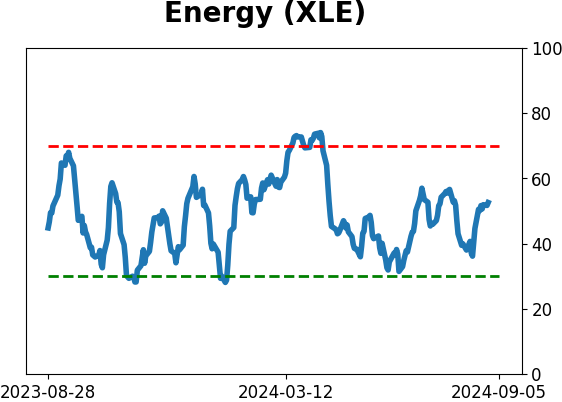
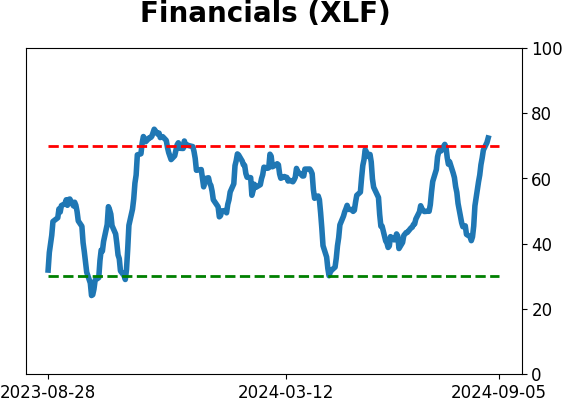
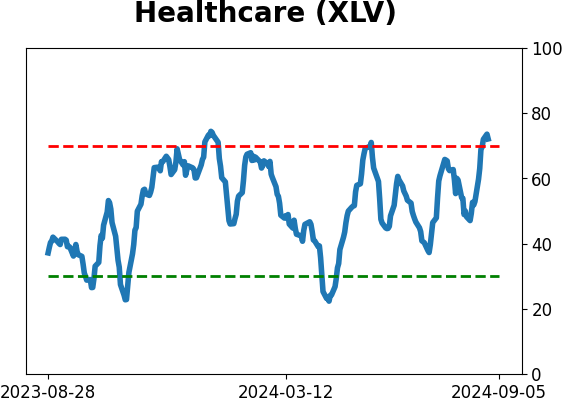
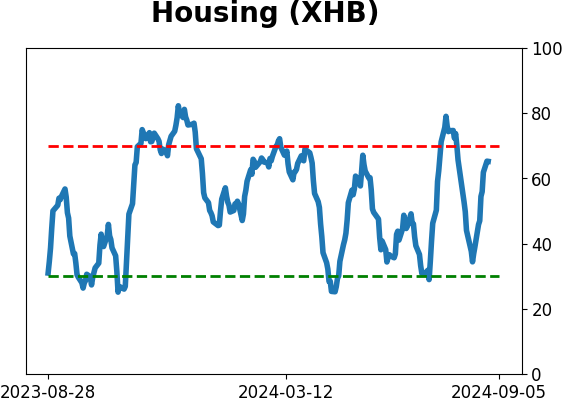
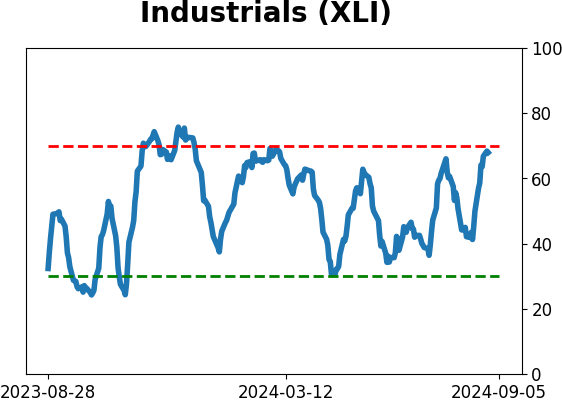
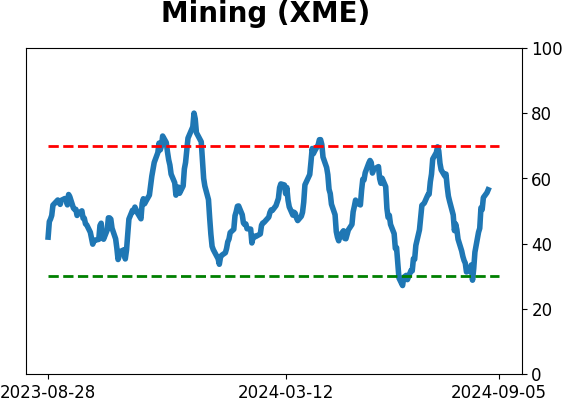
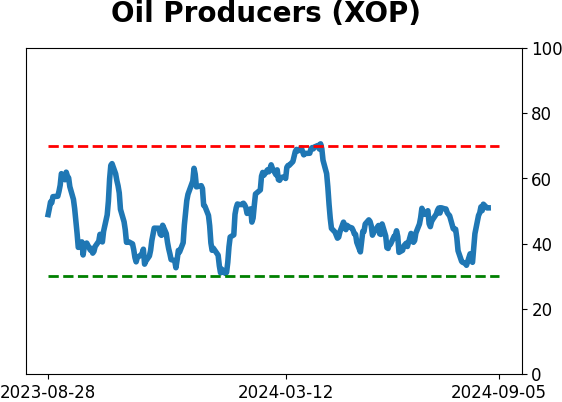
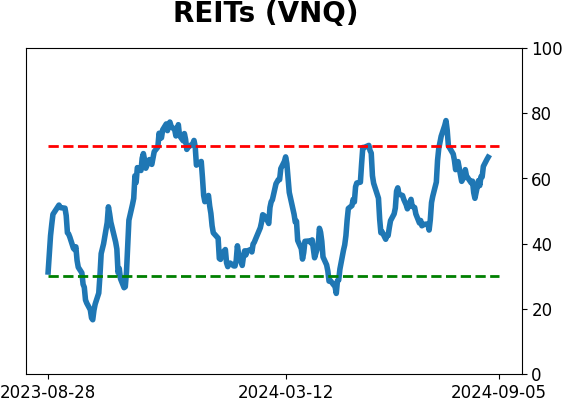
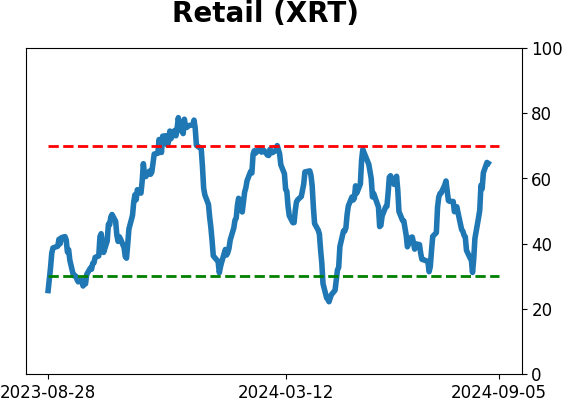
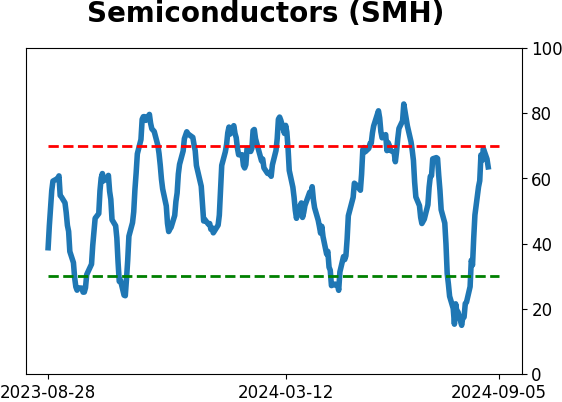
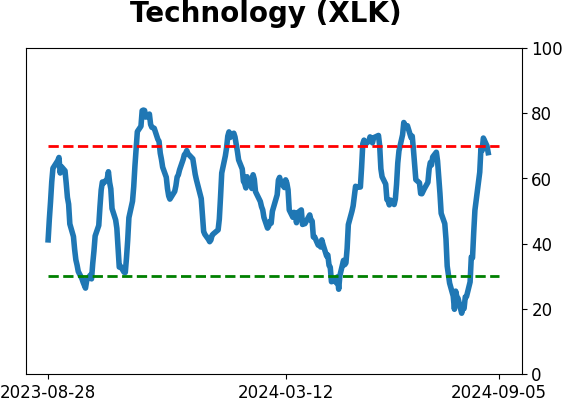
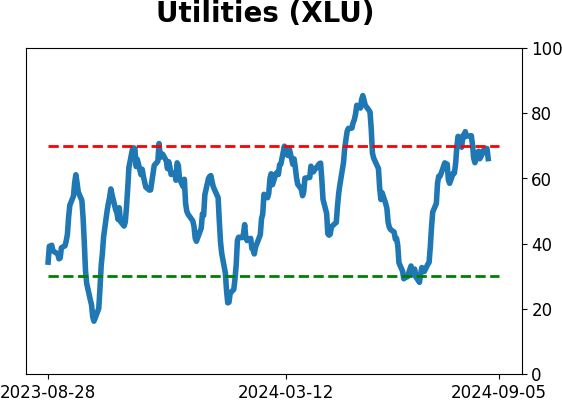
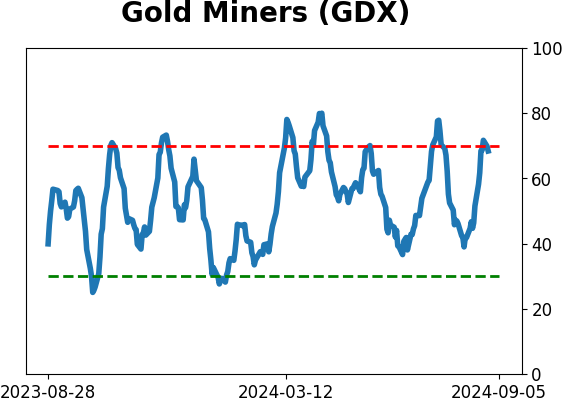
Sector ETF's - 10-Day Moving Average
|
|
|
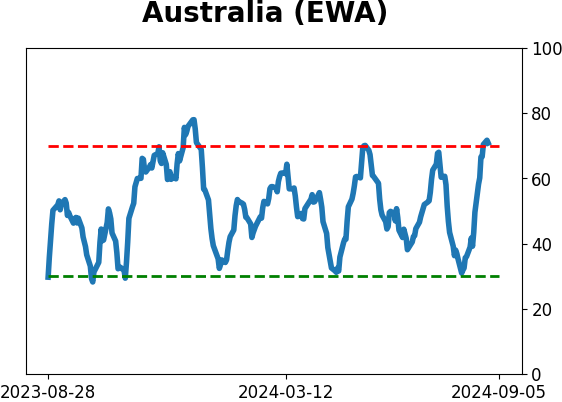
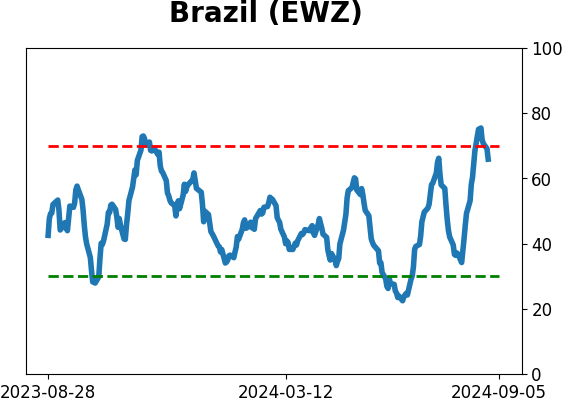
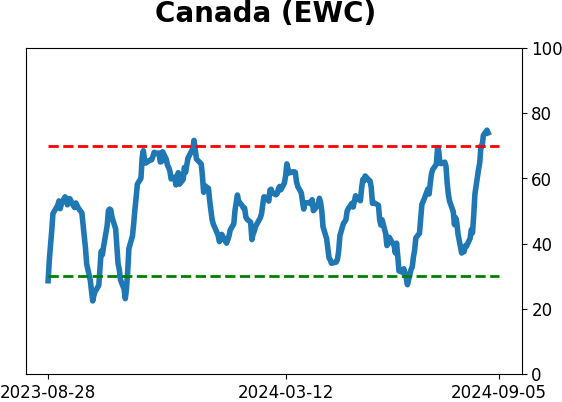
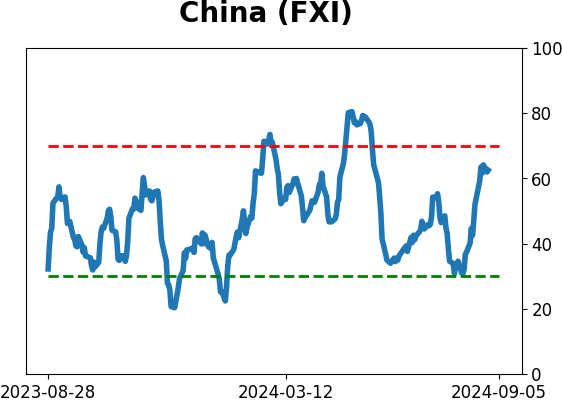
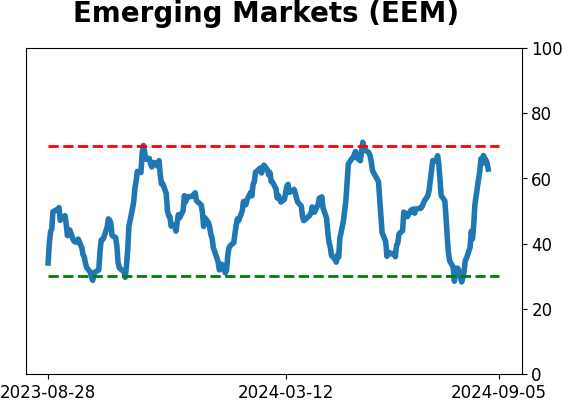
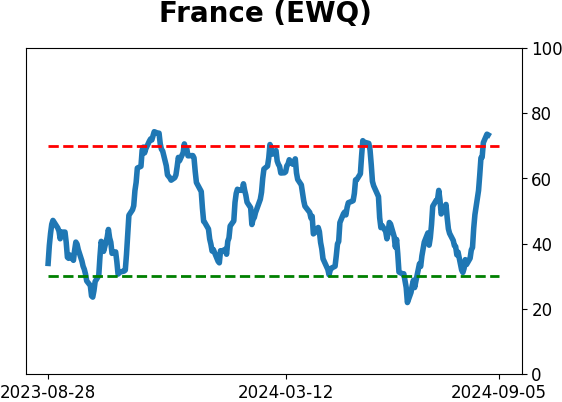
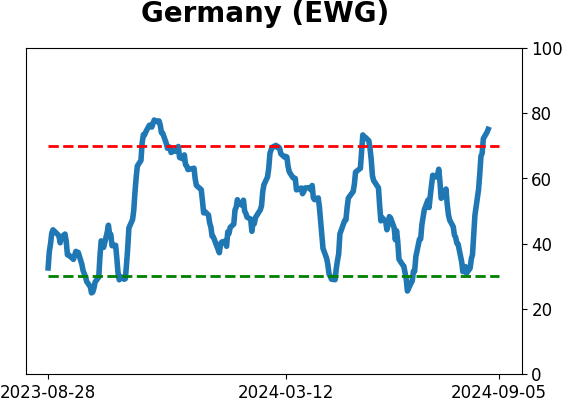
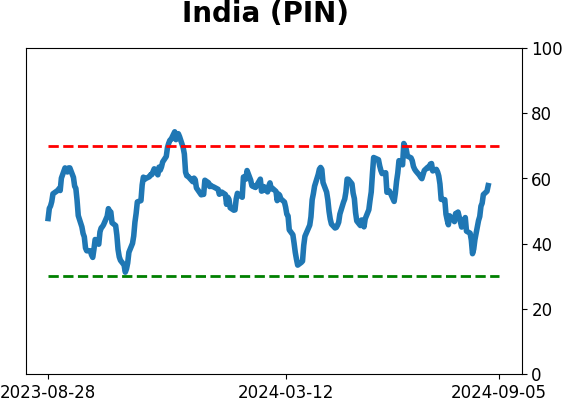
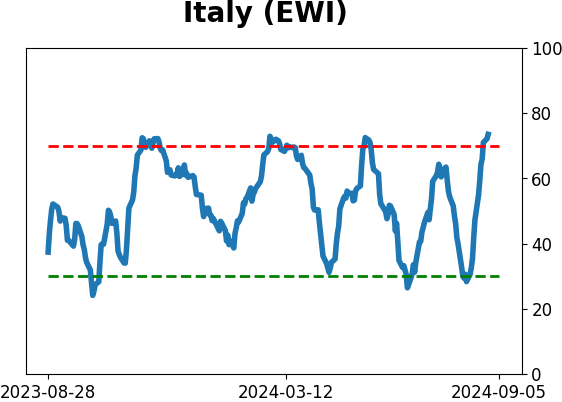
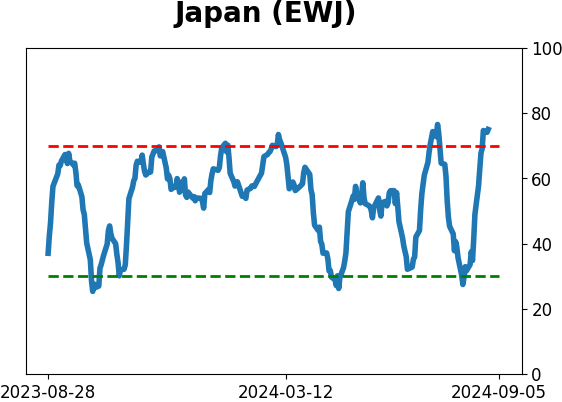
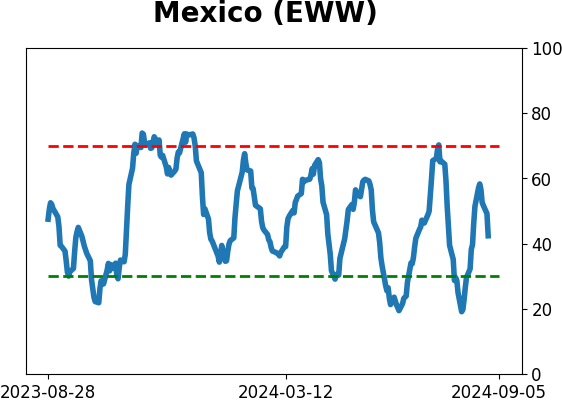
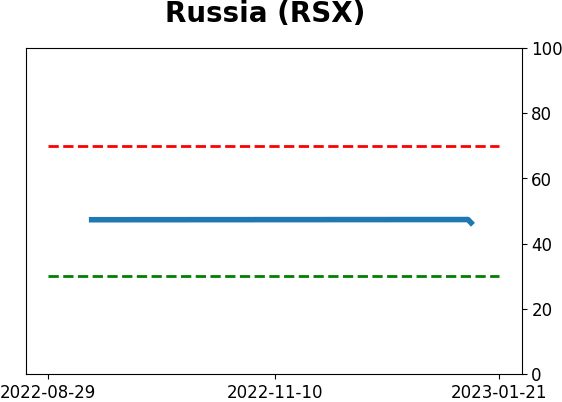
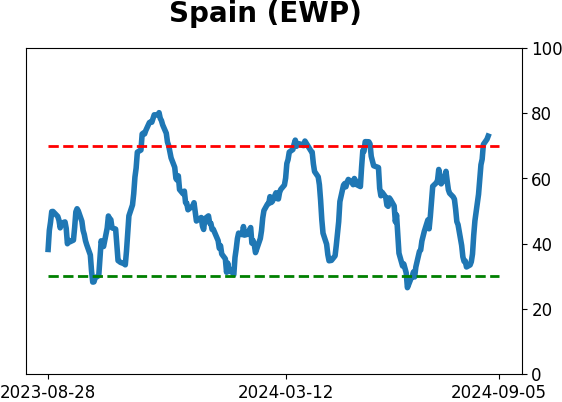
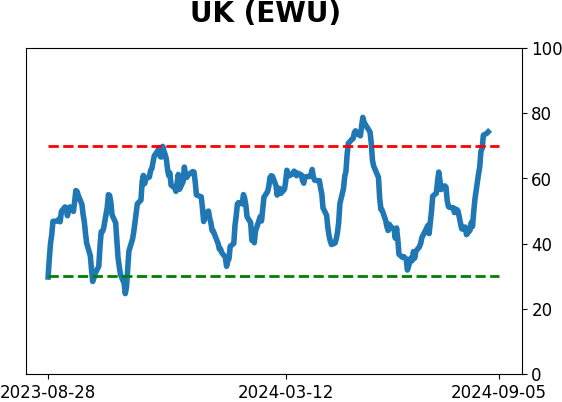
Country ETF's - 10-Day Moving Average
|
|
|
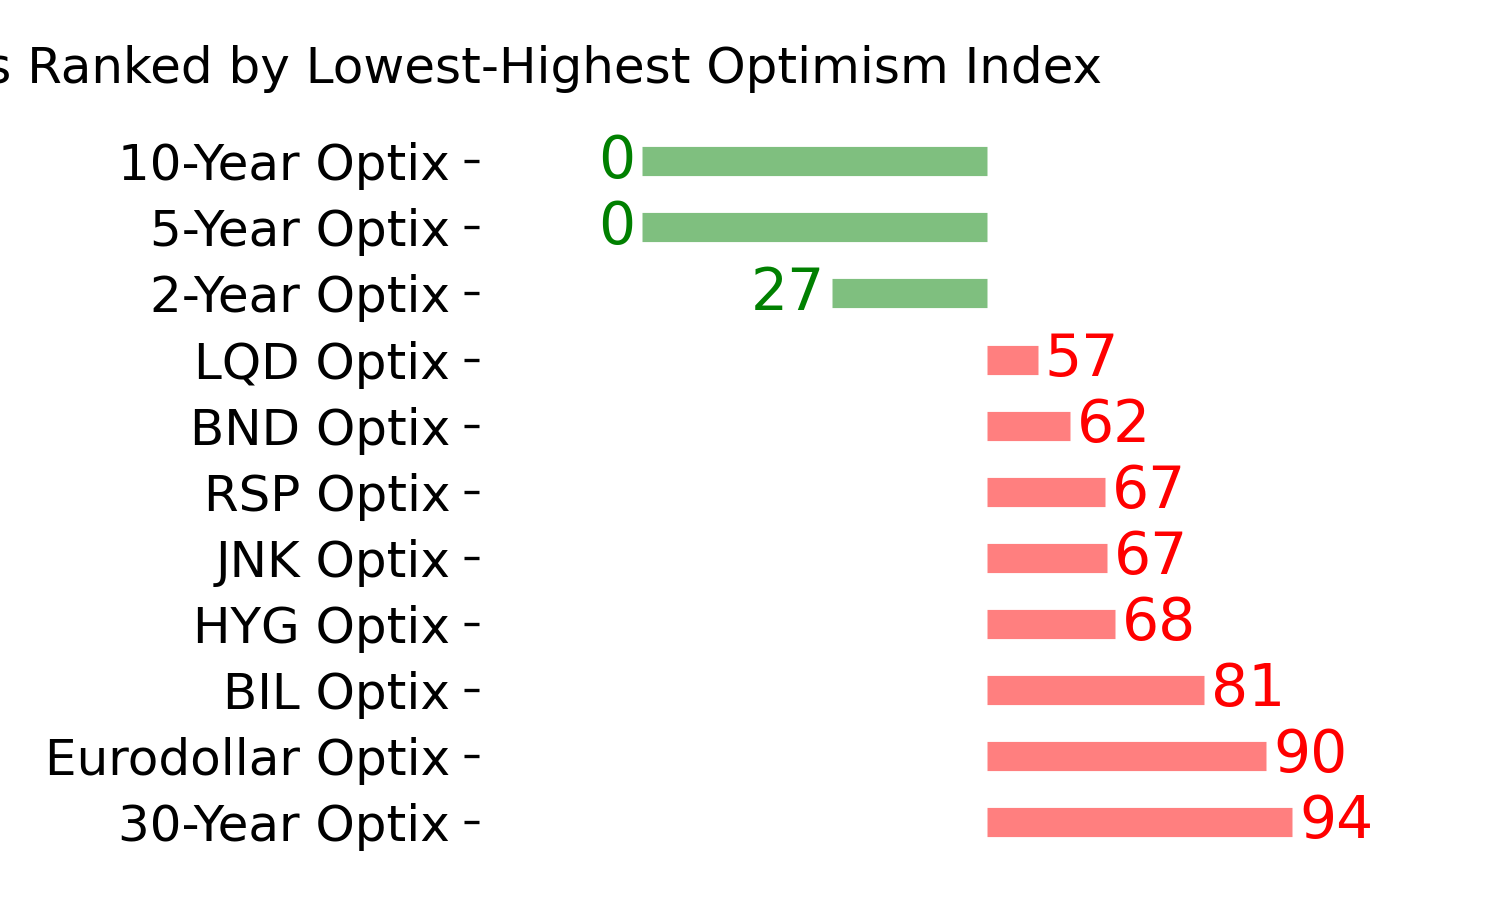
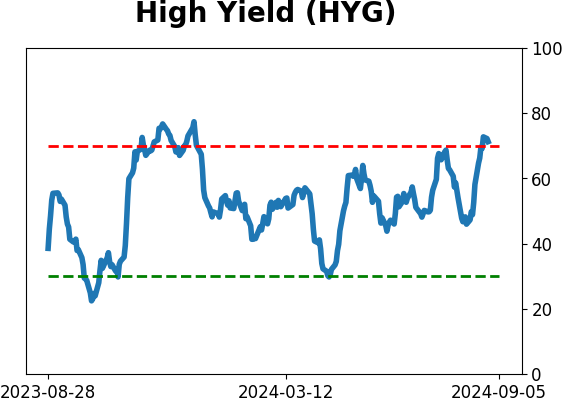
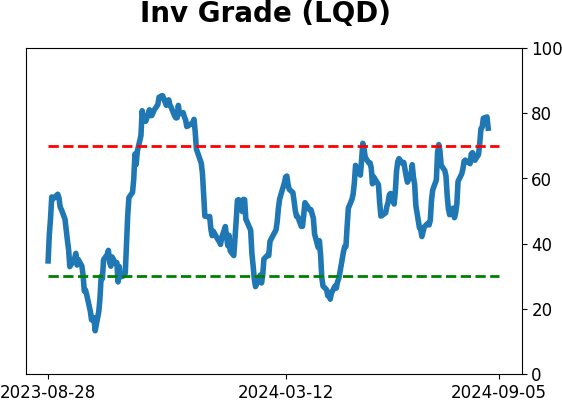
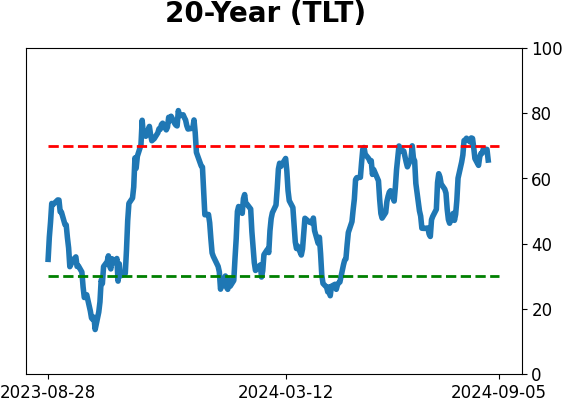
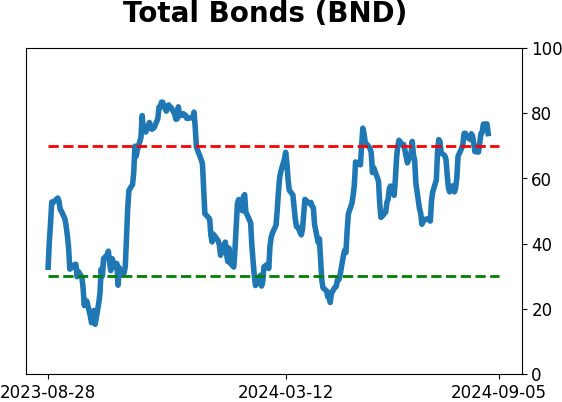
Bond ETF's - 10-Day Moving Average
|
|
|
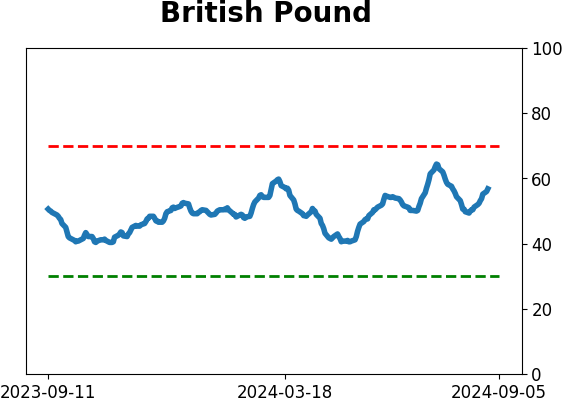
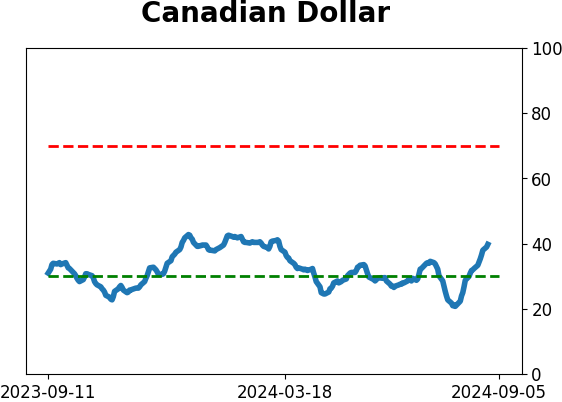
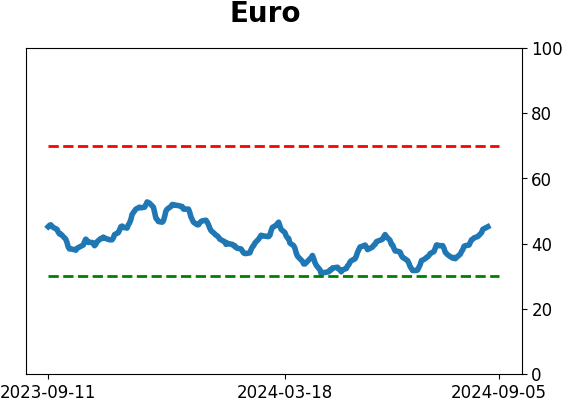
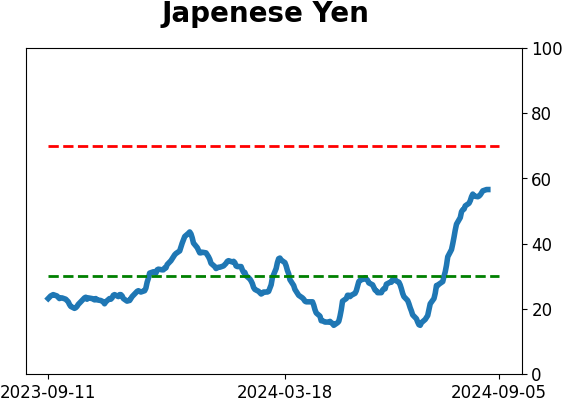
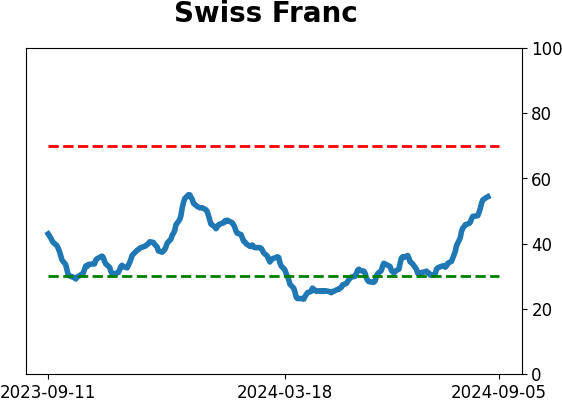
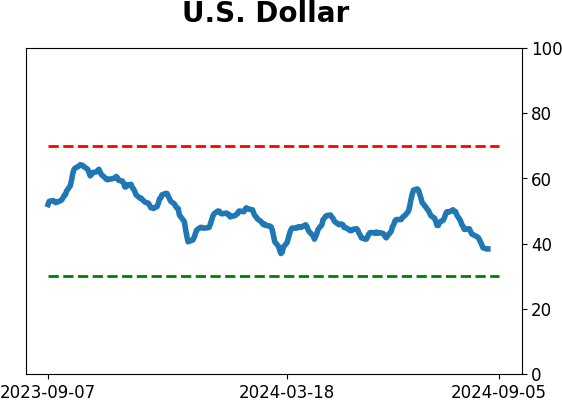
Currency ETF's - 5-Day Moving Average
|
|
|
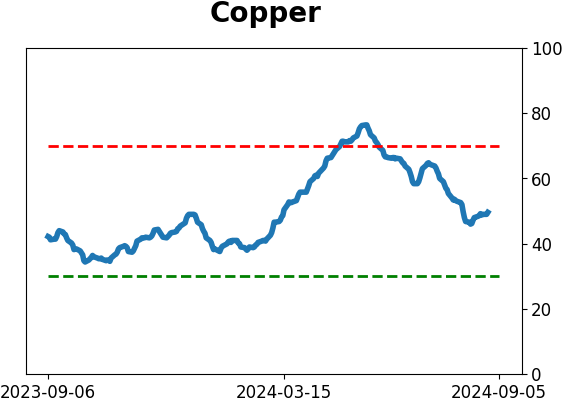
Commodity ETF's - 5-Day Moving Average
|
|