Headlines
|
|
An amazingly quick pullback recovery:
The S&P 500 equal weight index, which assigns the same weight to all 500+ stocks in the index, enjoyed a near-historically quick recovery from a pullback of more than -5%. Other quick recoveries in that index tended to lead to more gains in the months ahead, both absolutely and relative to the capitalization-weighted index.
|
Smart / Dumb Money Confidence
|
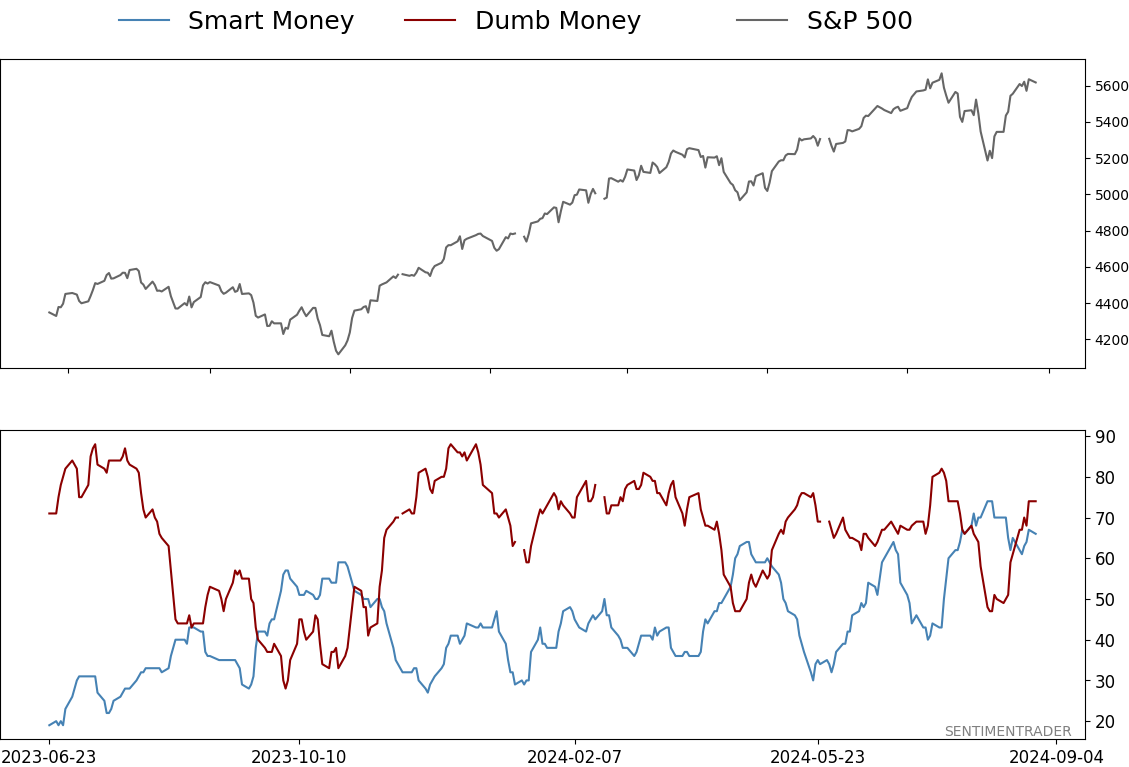
Smart Money Confidence: 66%
Dumb Money Confidence: 74%
|
|
Risk Levels
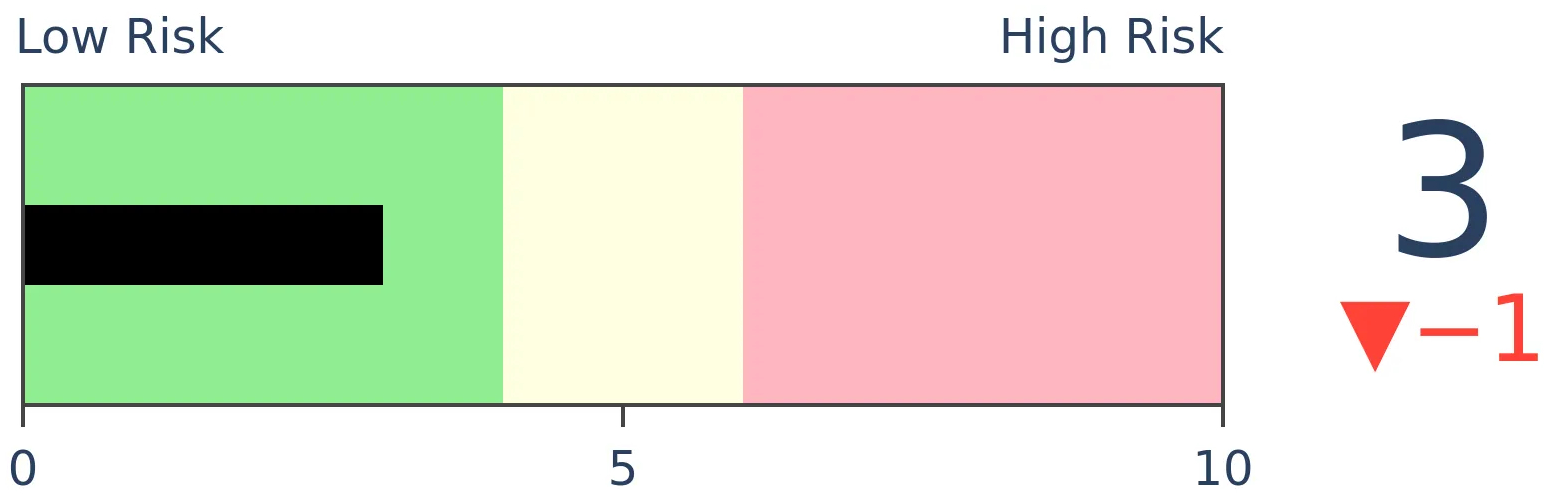
Stocks Short-Term
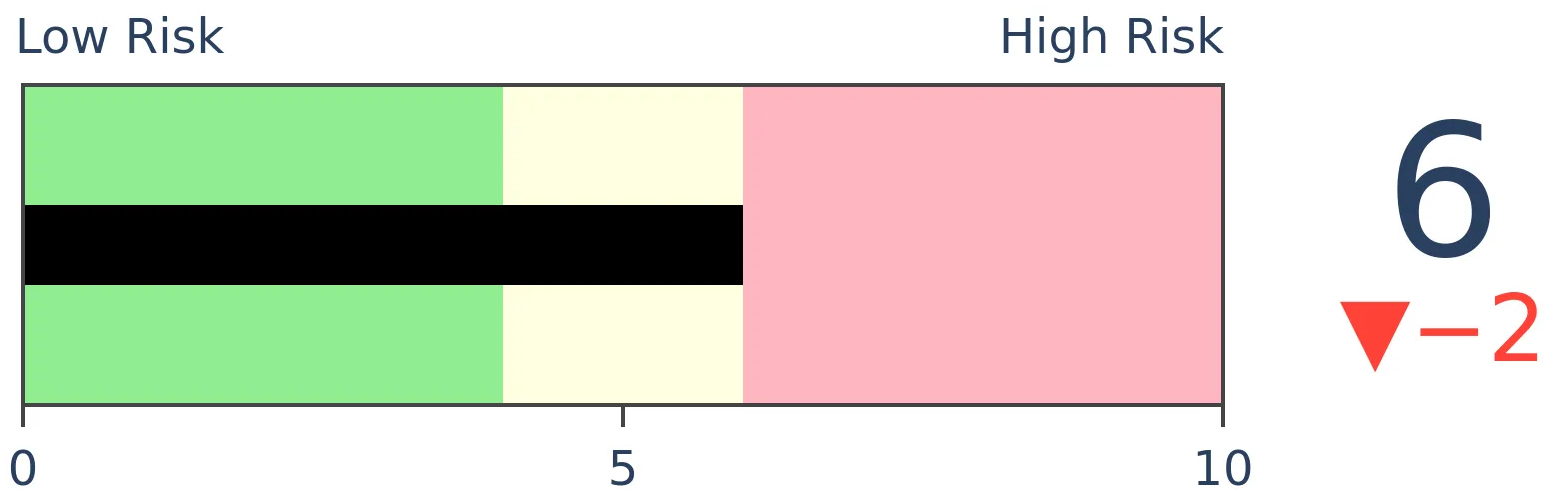
|
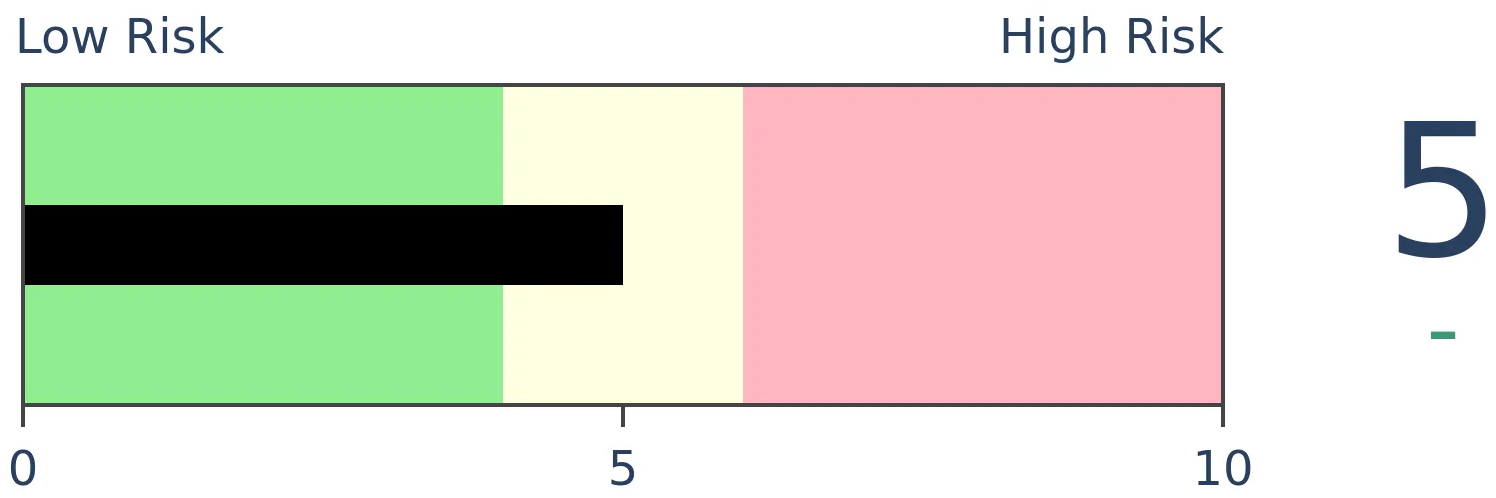
Stocks Medium-Term
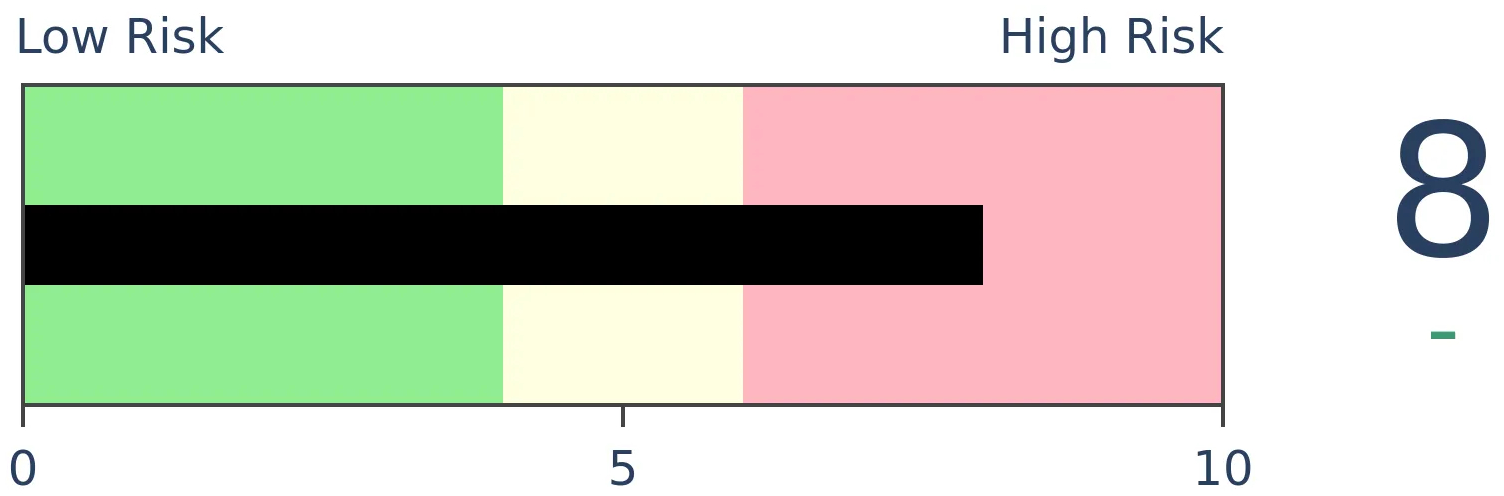
|
|
Bonds
|
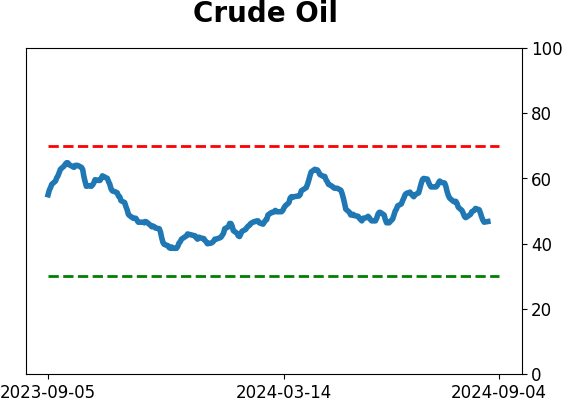
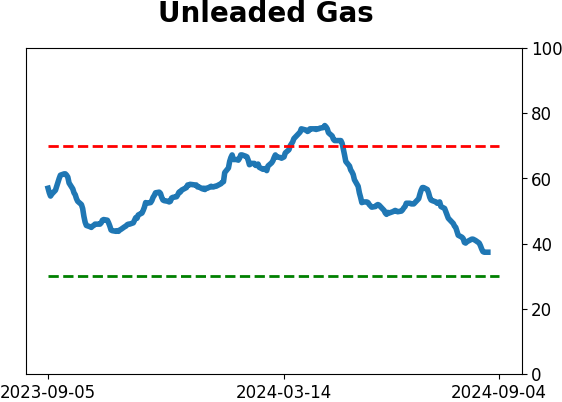
Crude Oil
|
|
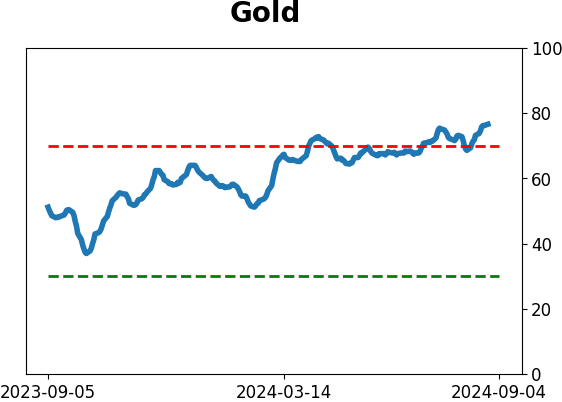
Gold

|
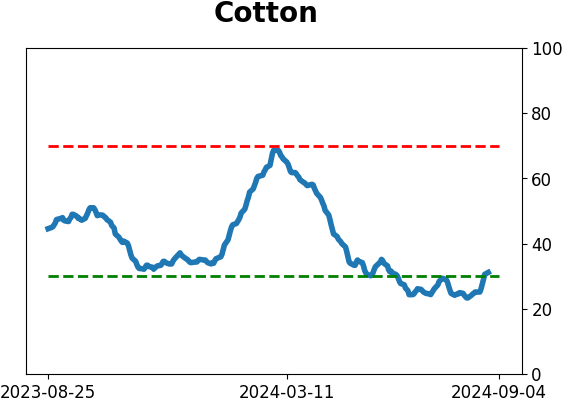
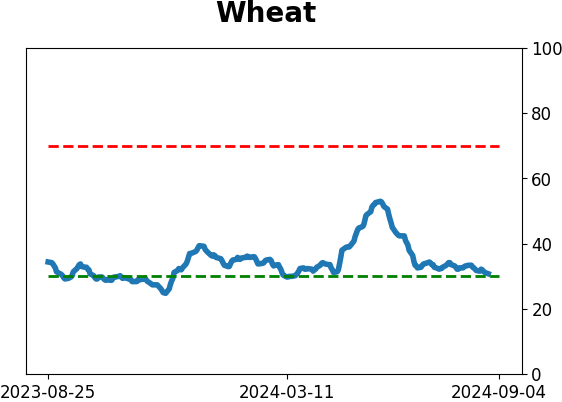
Agriculture

|
|
Research
By Jason Goepfert
BOTTOM LINE
The S&P 500 equal weight index, which assigns the same weight to all 500+ stocks in the index, enjoyed a near-historically quick recovery from a pullback of more than -5%. Other quick recoveries in that index tended to lead to more gains in the months ahead, both absolutely and relative to the capitalization-weighted index.
FORECAST / TIMEFRAME
None
|
Key points:
- The S&P 500 equal weight index has fully recovered from a pullback in only 23 sessions
- This is one of the quickest pullback recoveries in history
- Other quick recoveries provided a tailwind in the months ahead, both absolutely and relatively
The average stock has fully recovered in near-record time
The v-shaped recovery from the brief mini-panic in early August has continued almost unabated. The persistence and breadth of the rally allow the equal-weight version of the S&P 500 to close at fresh record highs, further recovering from a historic period of underperformance.
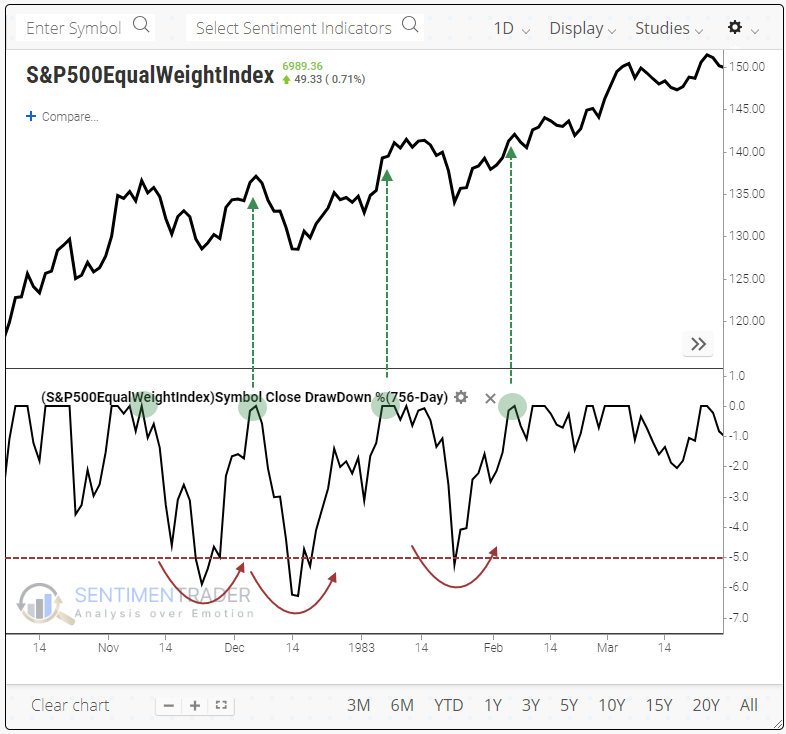
That version of the index, which equally weights all 500+ stocks in the index, had previously set a record high in mid-July, then pulled back just over 5% during the selling interlude.
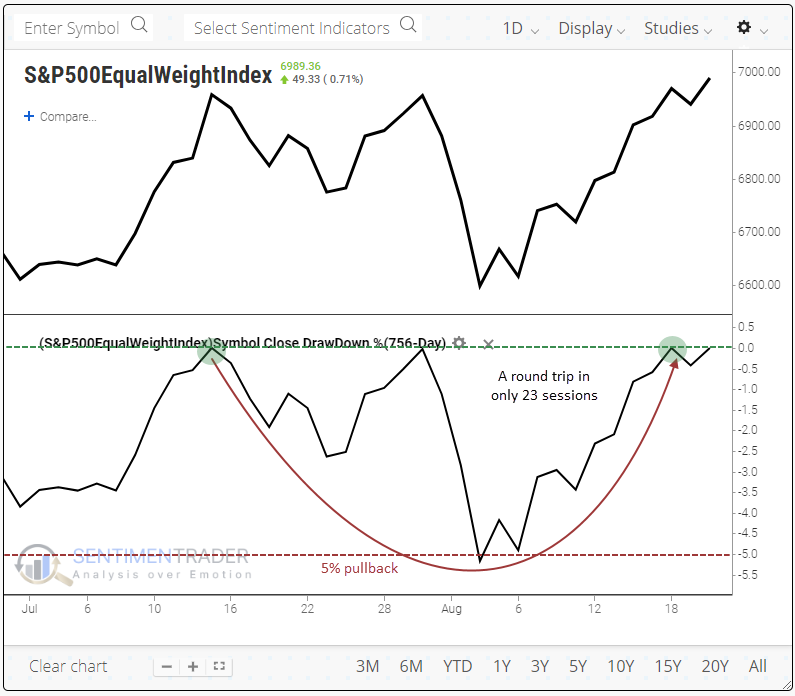
Dating back to 1957, this was one of the fastest-ever roundtrips from a pullback. The index took only 23 trading days to go from a record high to at least a -5% pullback and back to a new record. There were only four other times it made such a quick recovery, and each of them was a good sign for the index.
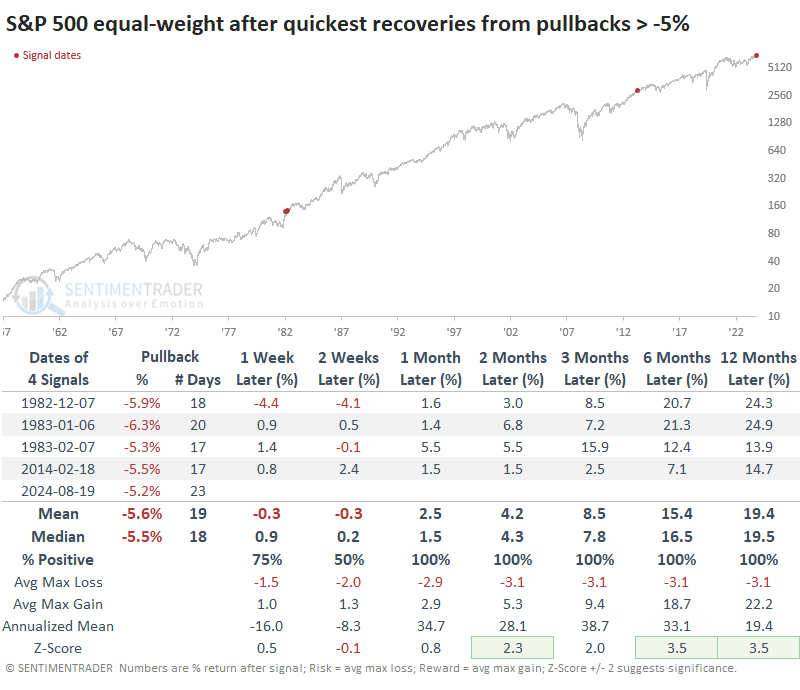
Unfortunately, the sample size is minuscule. And three of the four signals were clustered over a three-month period after the initial push off the generational 1982 market bottom. After the explosive buying binge from the low, the equal-weight S&P suffered three consecutive -5% pullbacks that were quickly snapped up by buyers.
Quick recoveries were good for the average stock
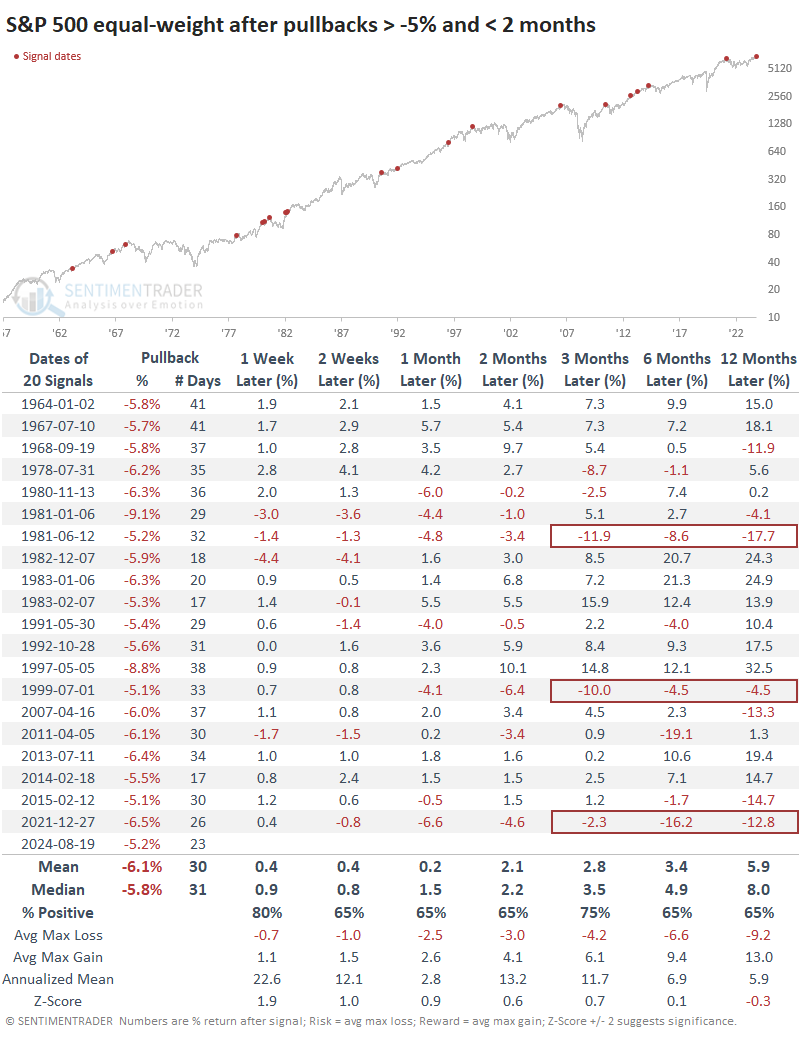
To generate a larger sample size, the table below shows recoveries from pullbacks that took a bit longer but still less than two months. Returns after these weren't nearly as compelling. While returns were still generally positive, the risk/reward was uninspiring. On the plus side, only three signals showed meaningful and persistent losses over the medium to long term.
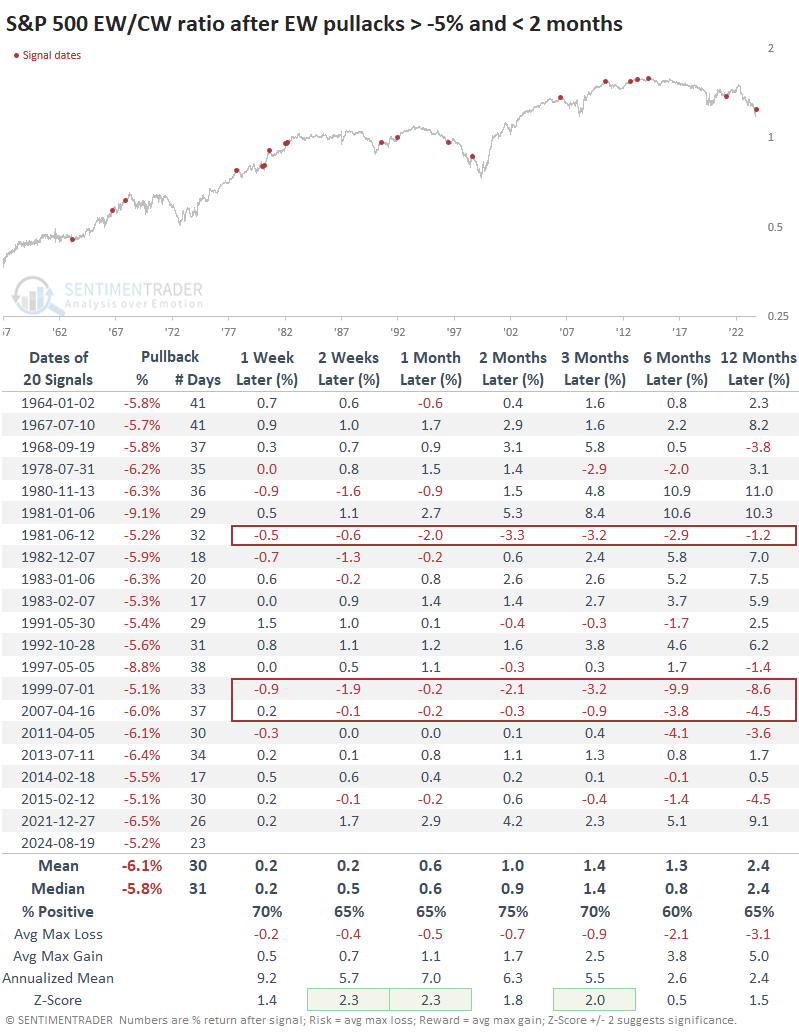
Regardless of what the much more popular capitalization-weighted index was doing then, these quick recoveries in the equally-weighted index tended to precede outperformance for the equal-weight version. Over the next two months, the equal-weight version of the S&P sported a higher return than the cap-weight version 75% of the time. There were only three outright failures out of the twenty signals.
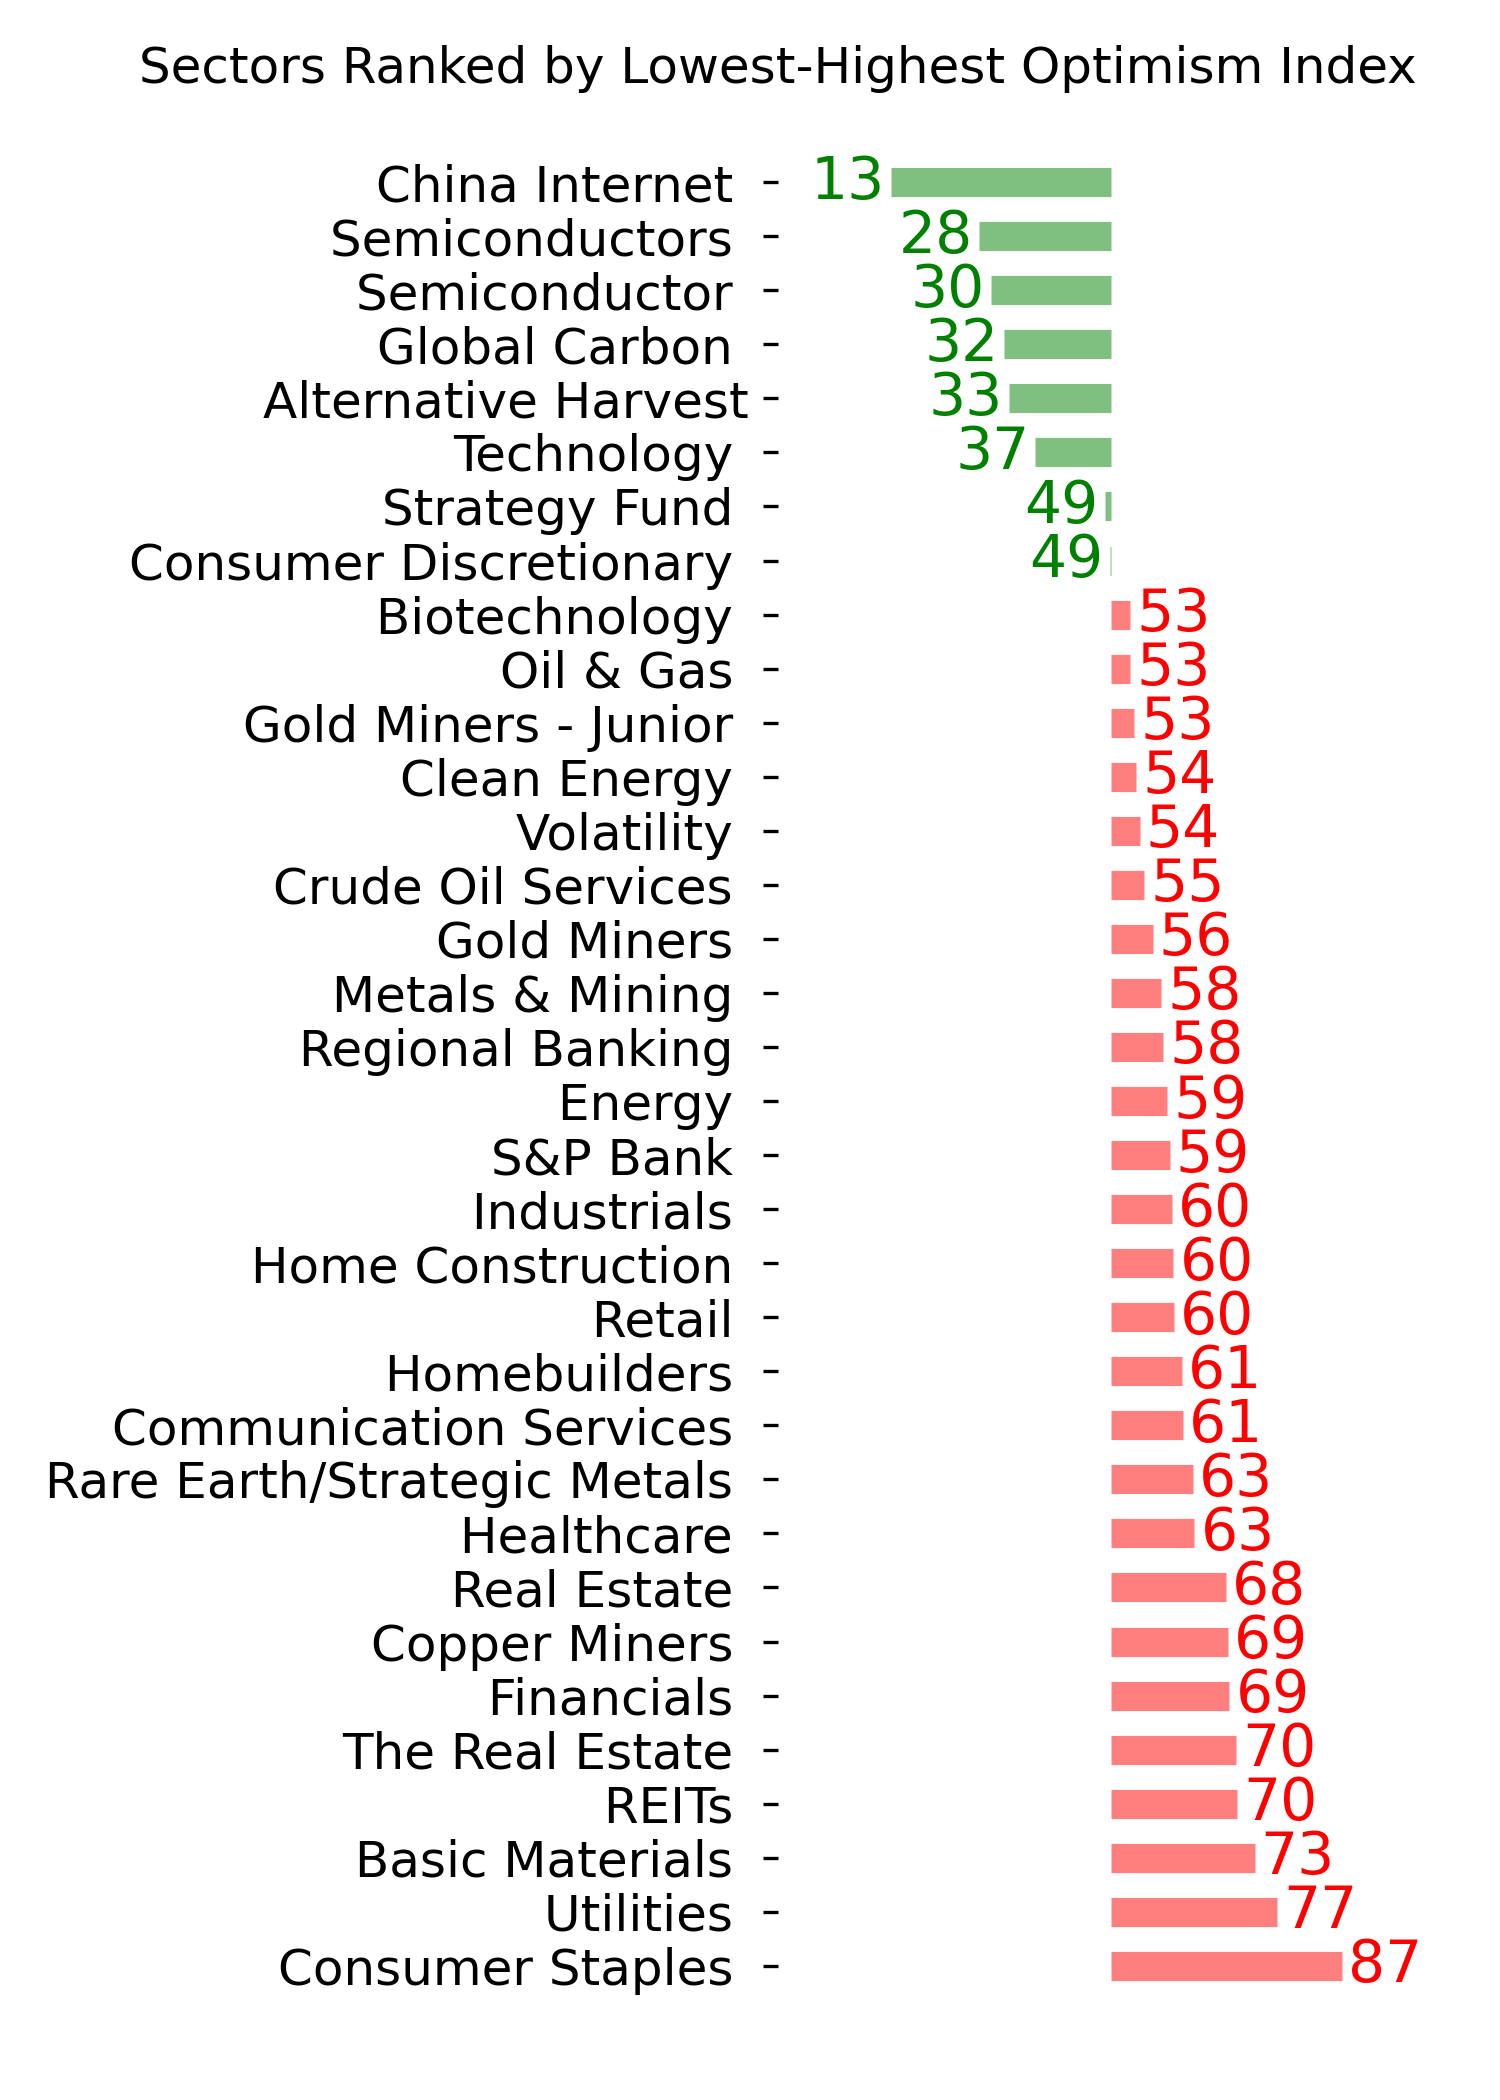
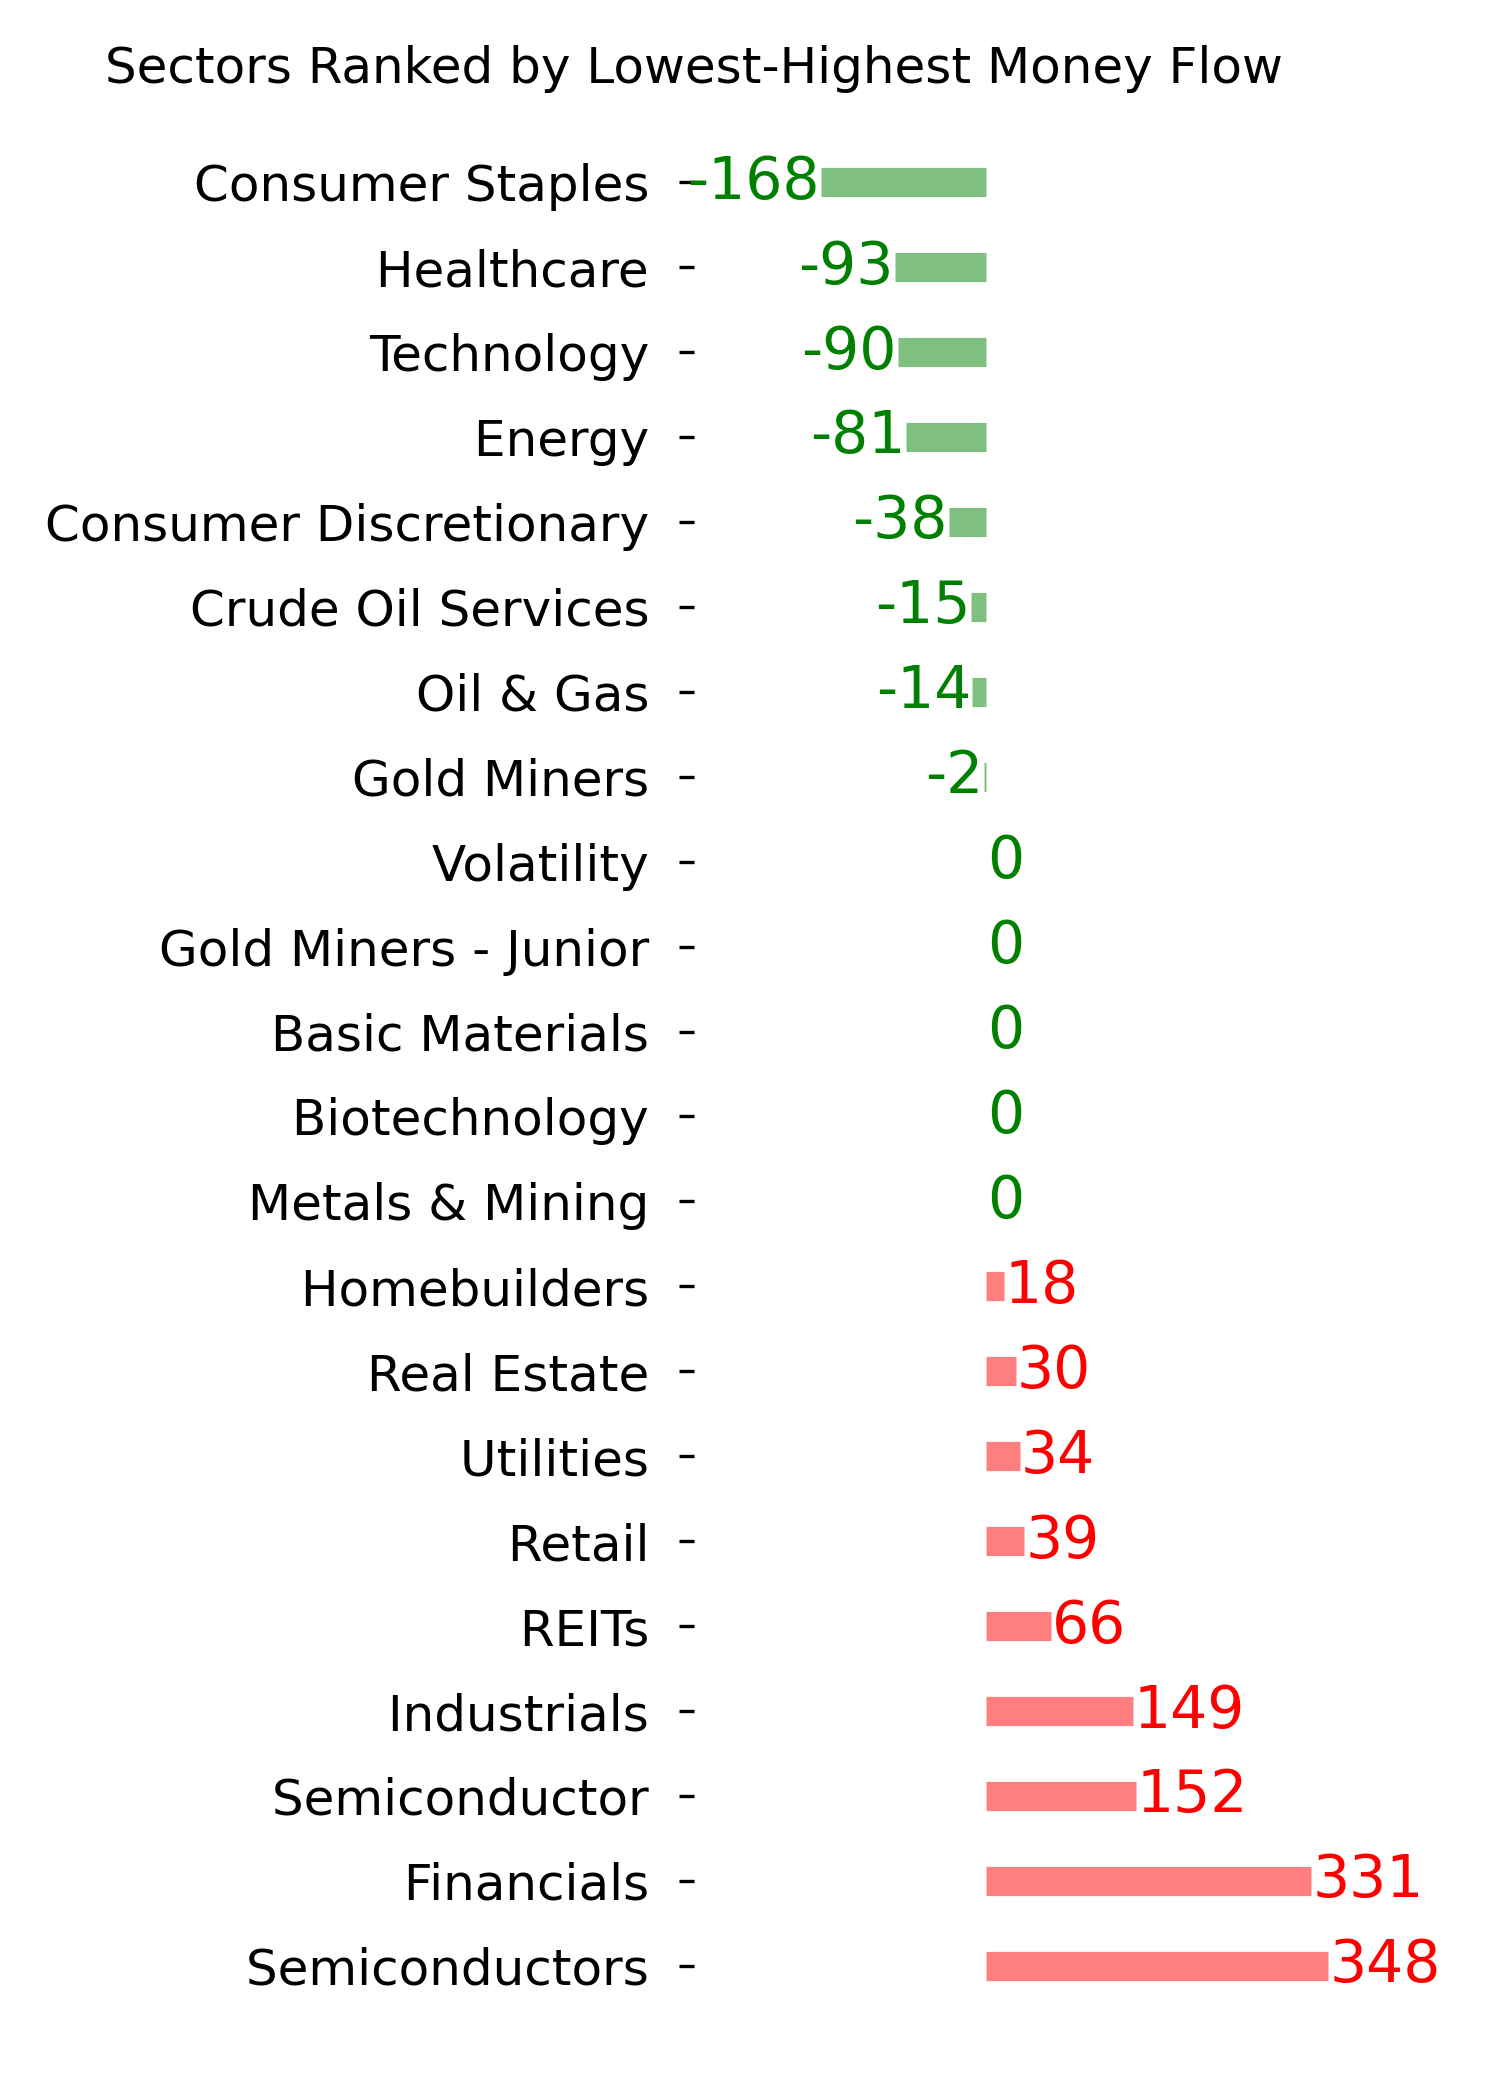
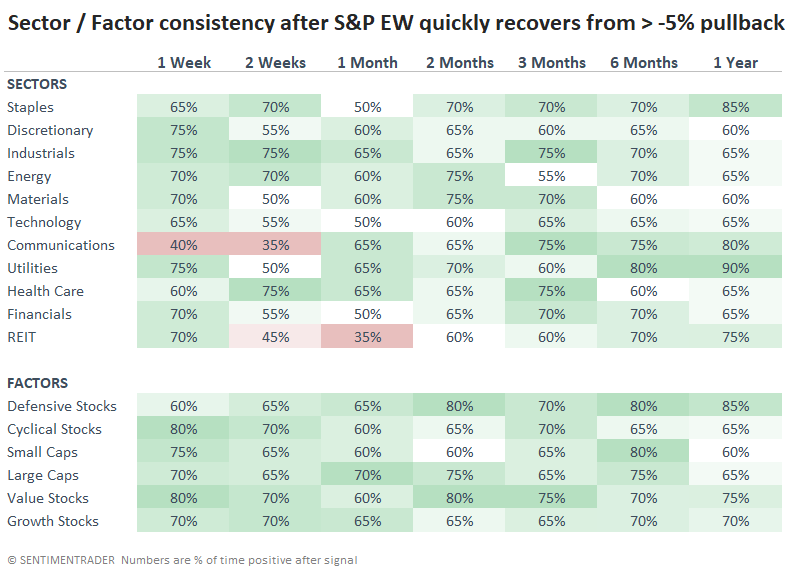
As for which sectors tended to benefit from the equally weighted recovery, the table below shows the best returns over the medium to long term were concentrated in energy, small, and value stocks.
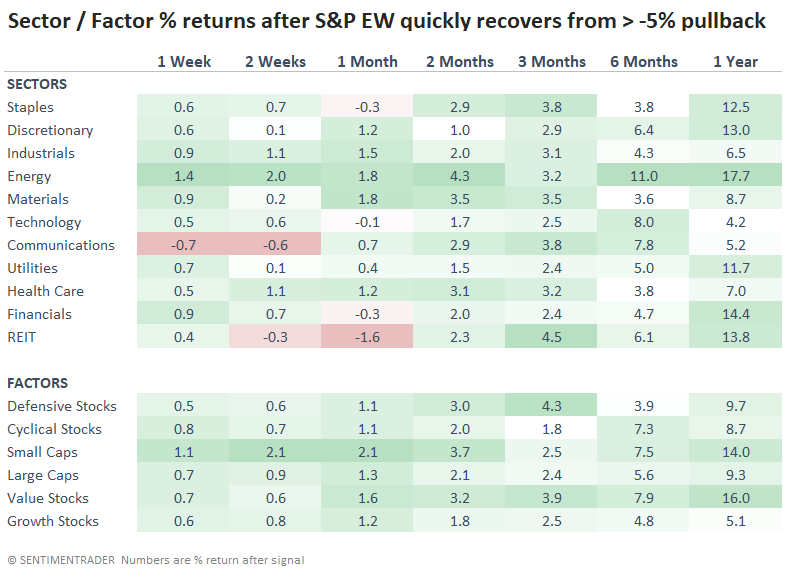
The win rates show us that there wasn't a standout winner, but defensive and value factors showed the best consistency across time frames.
What the research tells us...
The total recovery from a pullback in the average stock has been a good sign that has typically confirmed buyers' interest. It was rare for the equally weighted S&P 500 index to suffer a meaningful loss after quickly recovering from a pullback.
"Rare" did not mean "never," but there were clues. If buyers hesitate in the week(s) ahead, it will suggest a lack of confidence, and that would be a yellow flag since most of the failures saw limited buying immediately after the breakout. The latest recovery should also be another good sign for this version of the index versus its much more popular capitalization-weighted brother. Typically, pullback recoveries led to further gains for the average stock over and above the benchmark index.
Indicators at Extremes
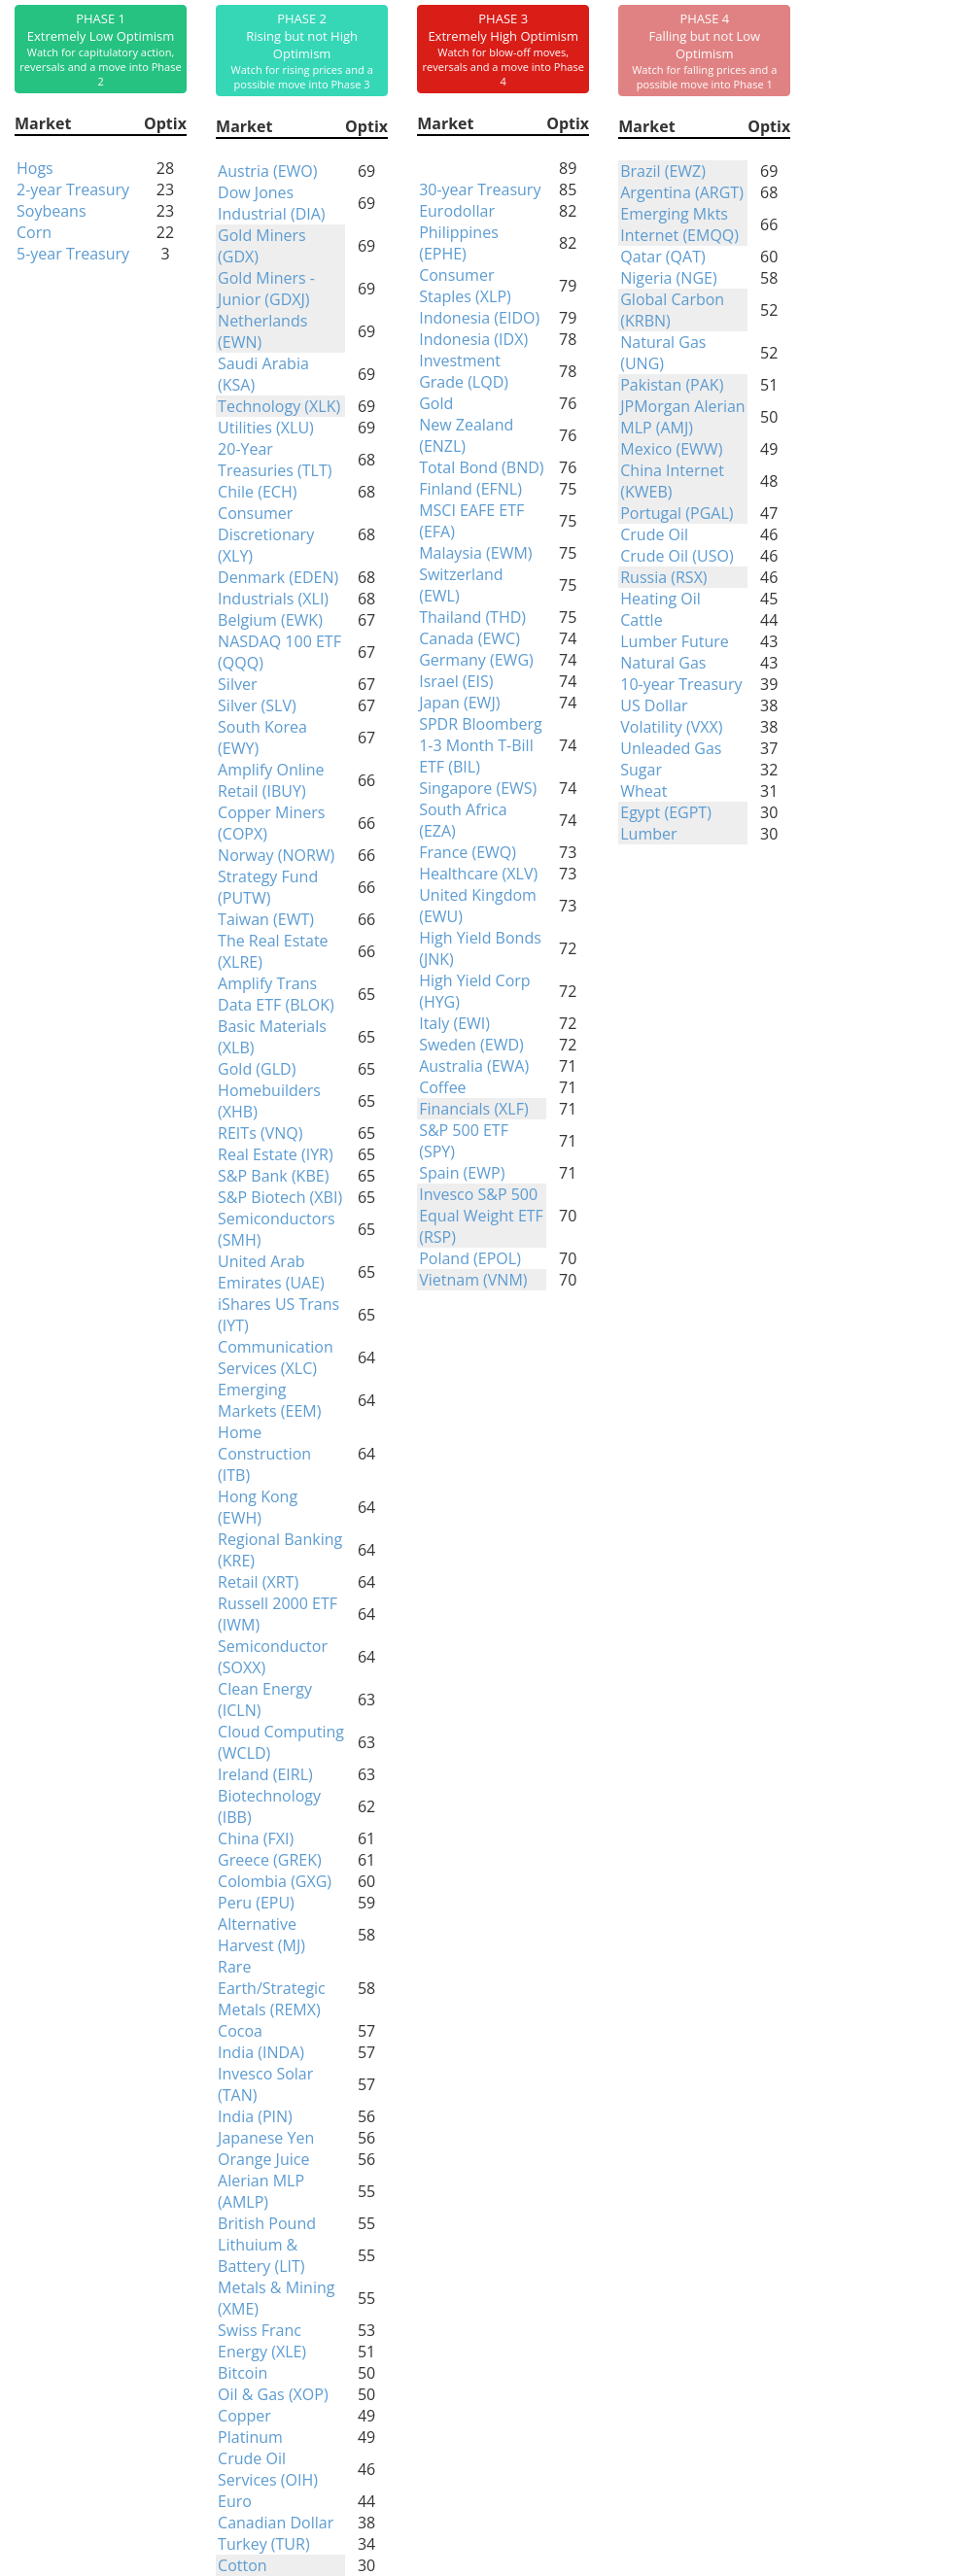
Phase Table
Ranks
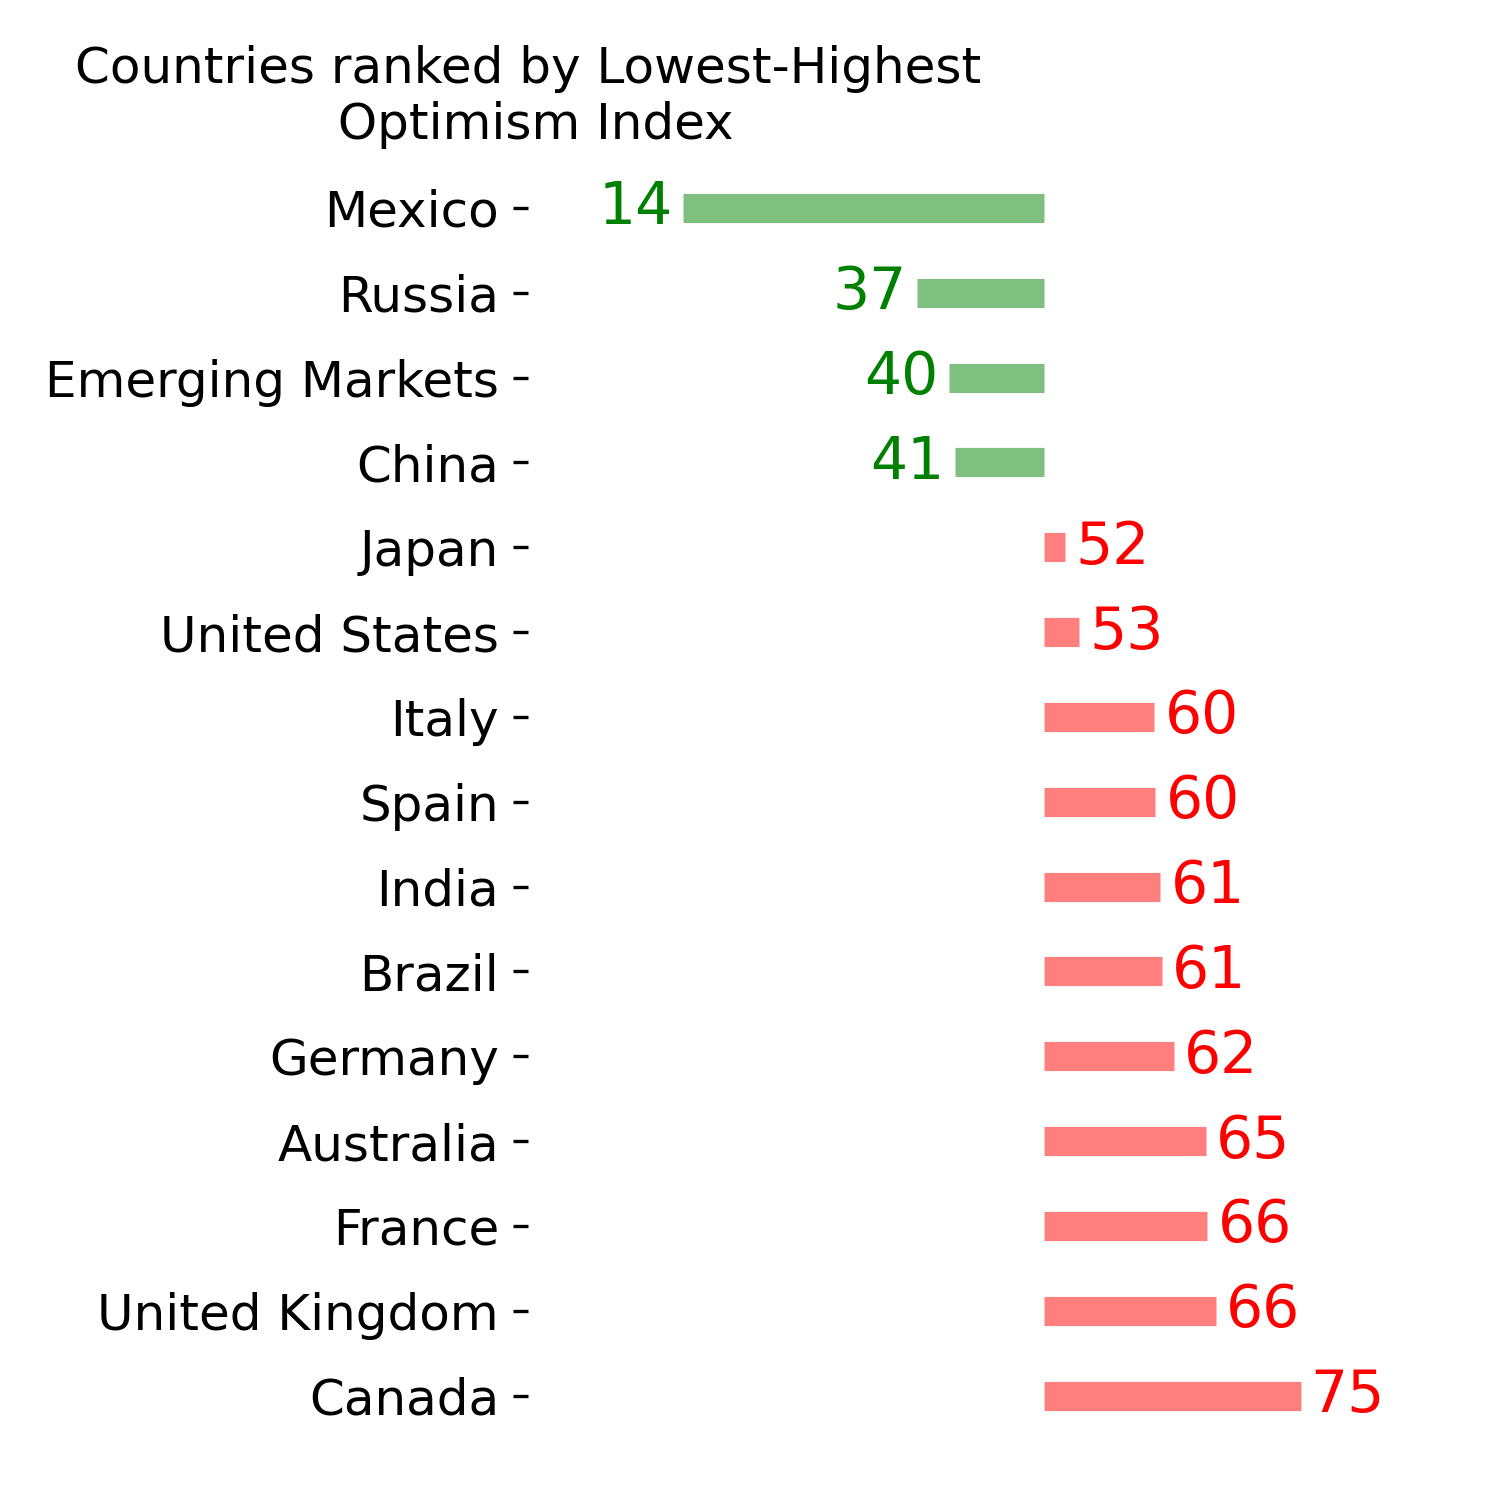
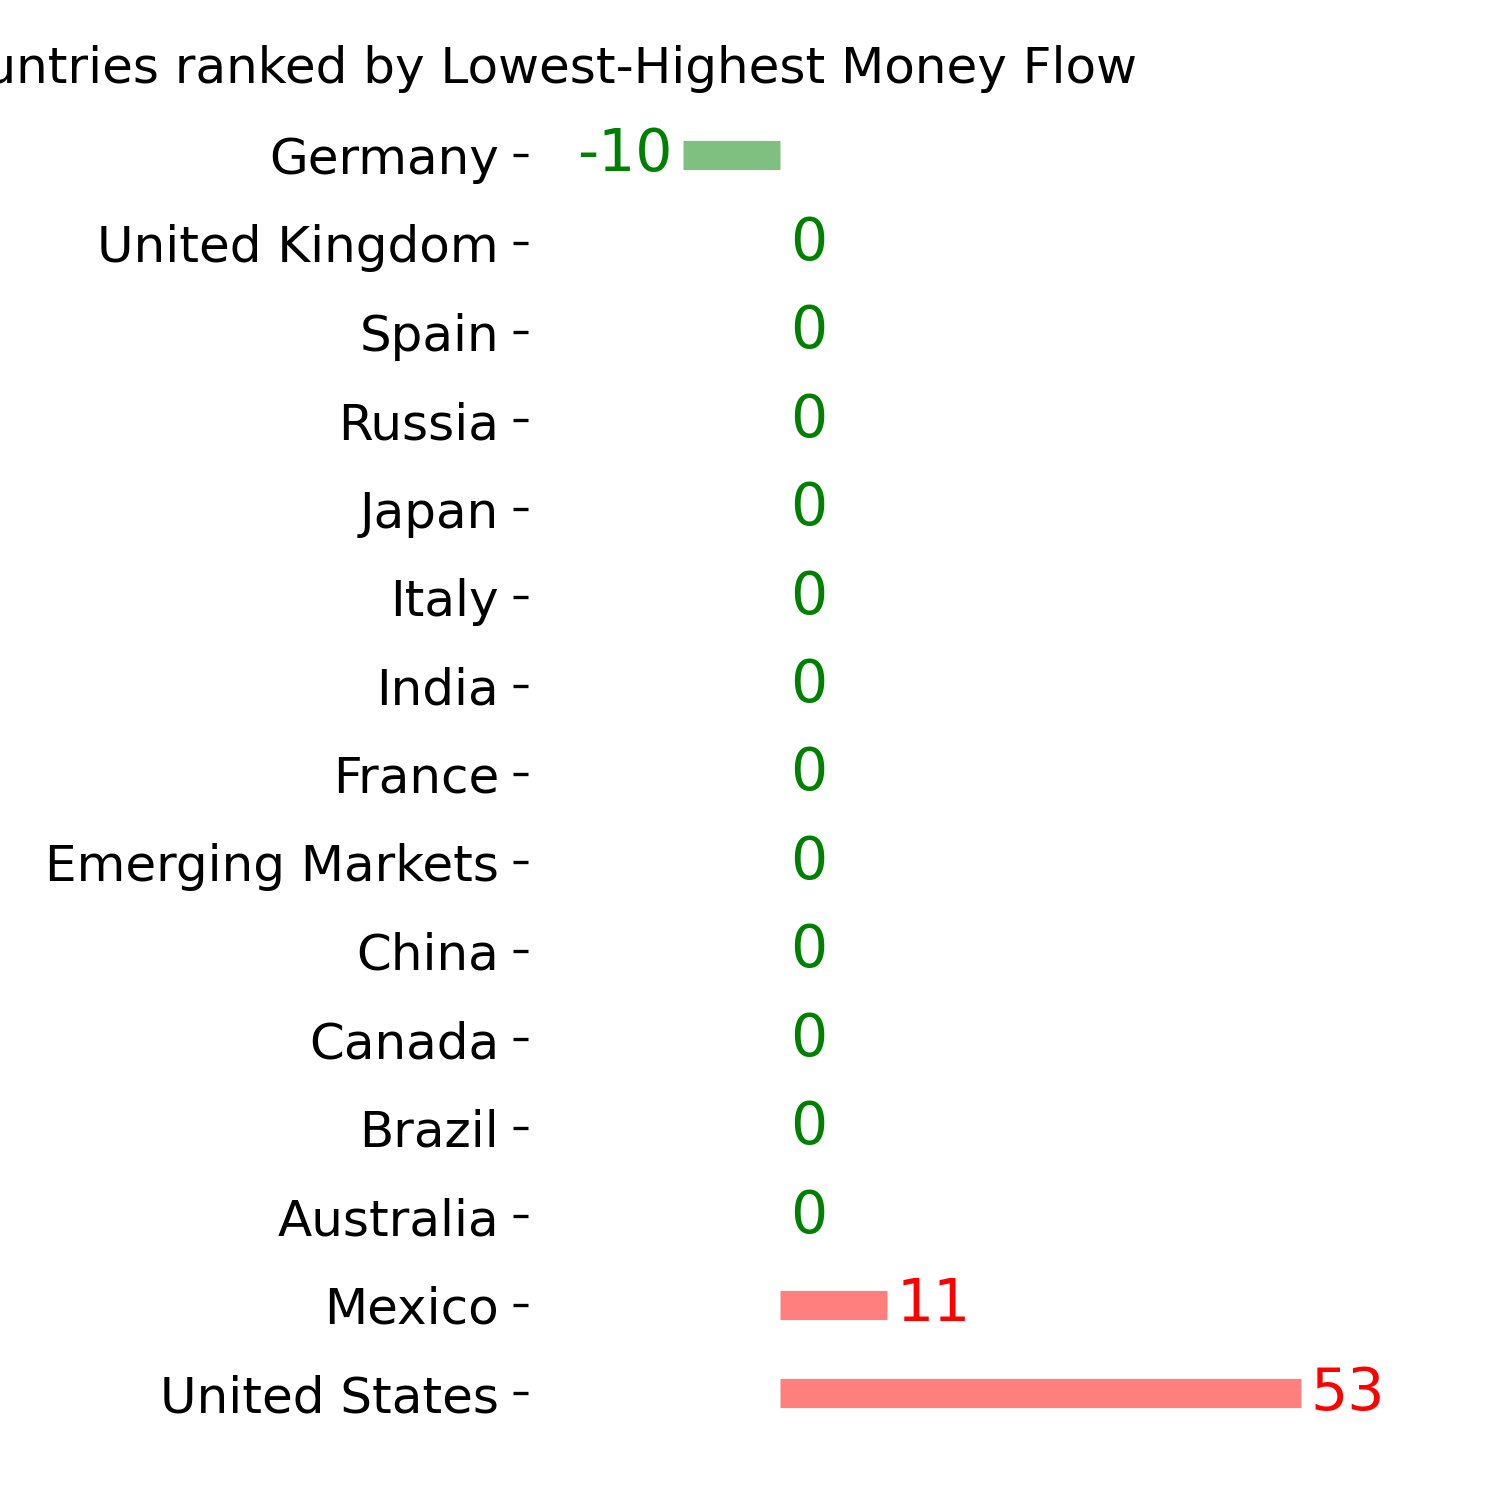
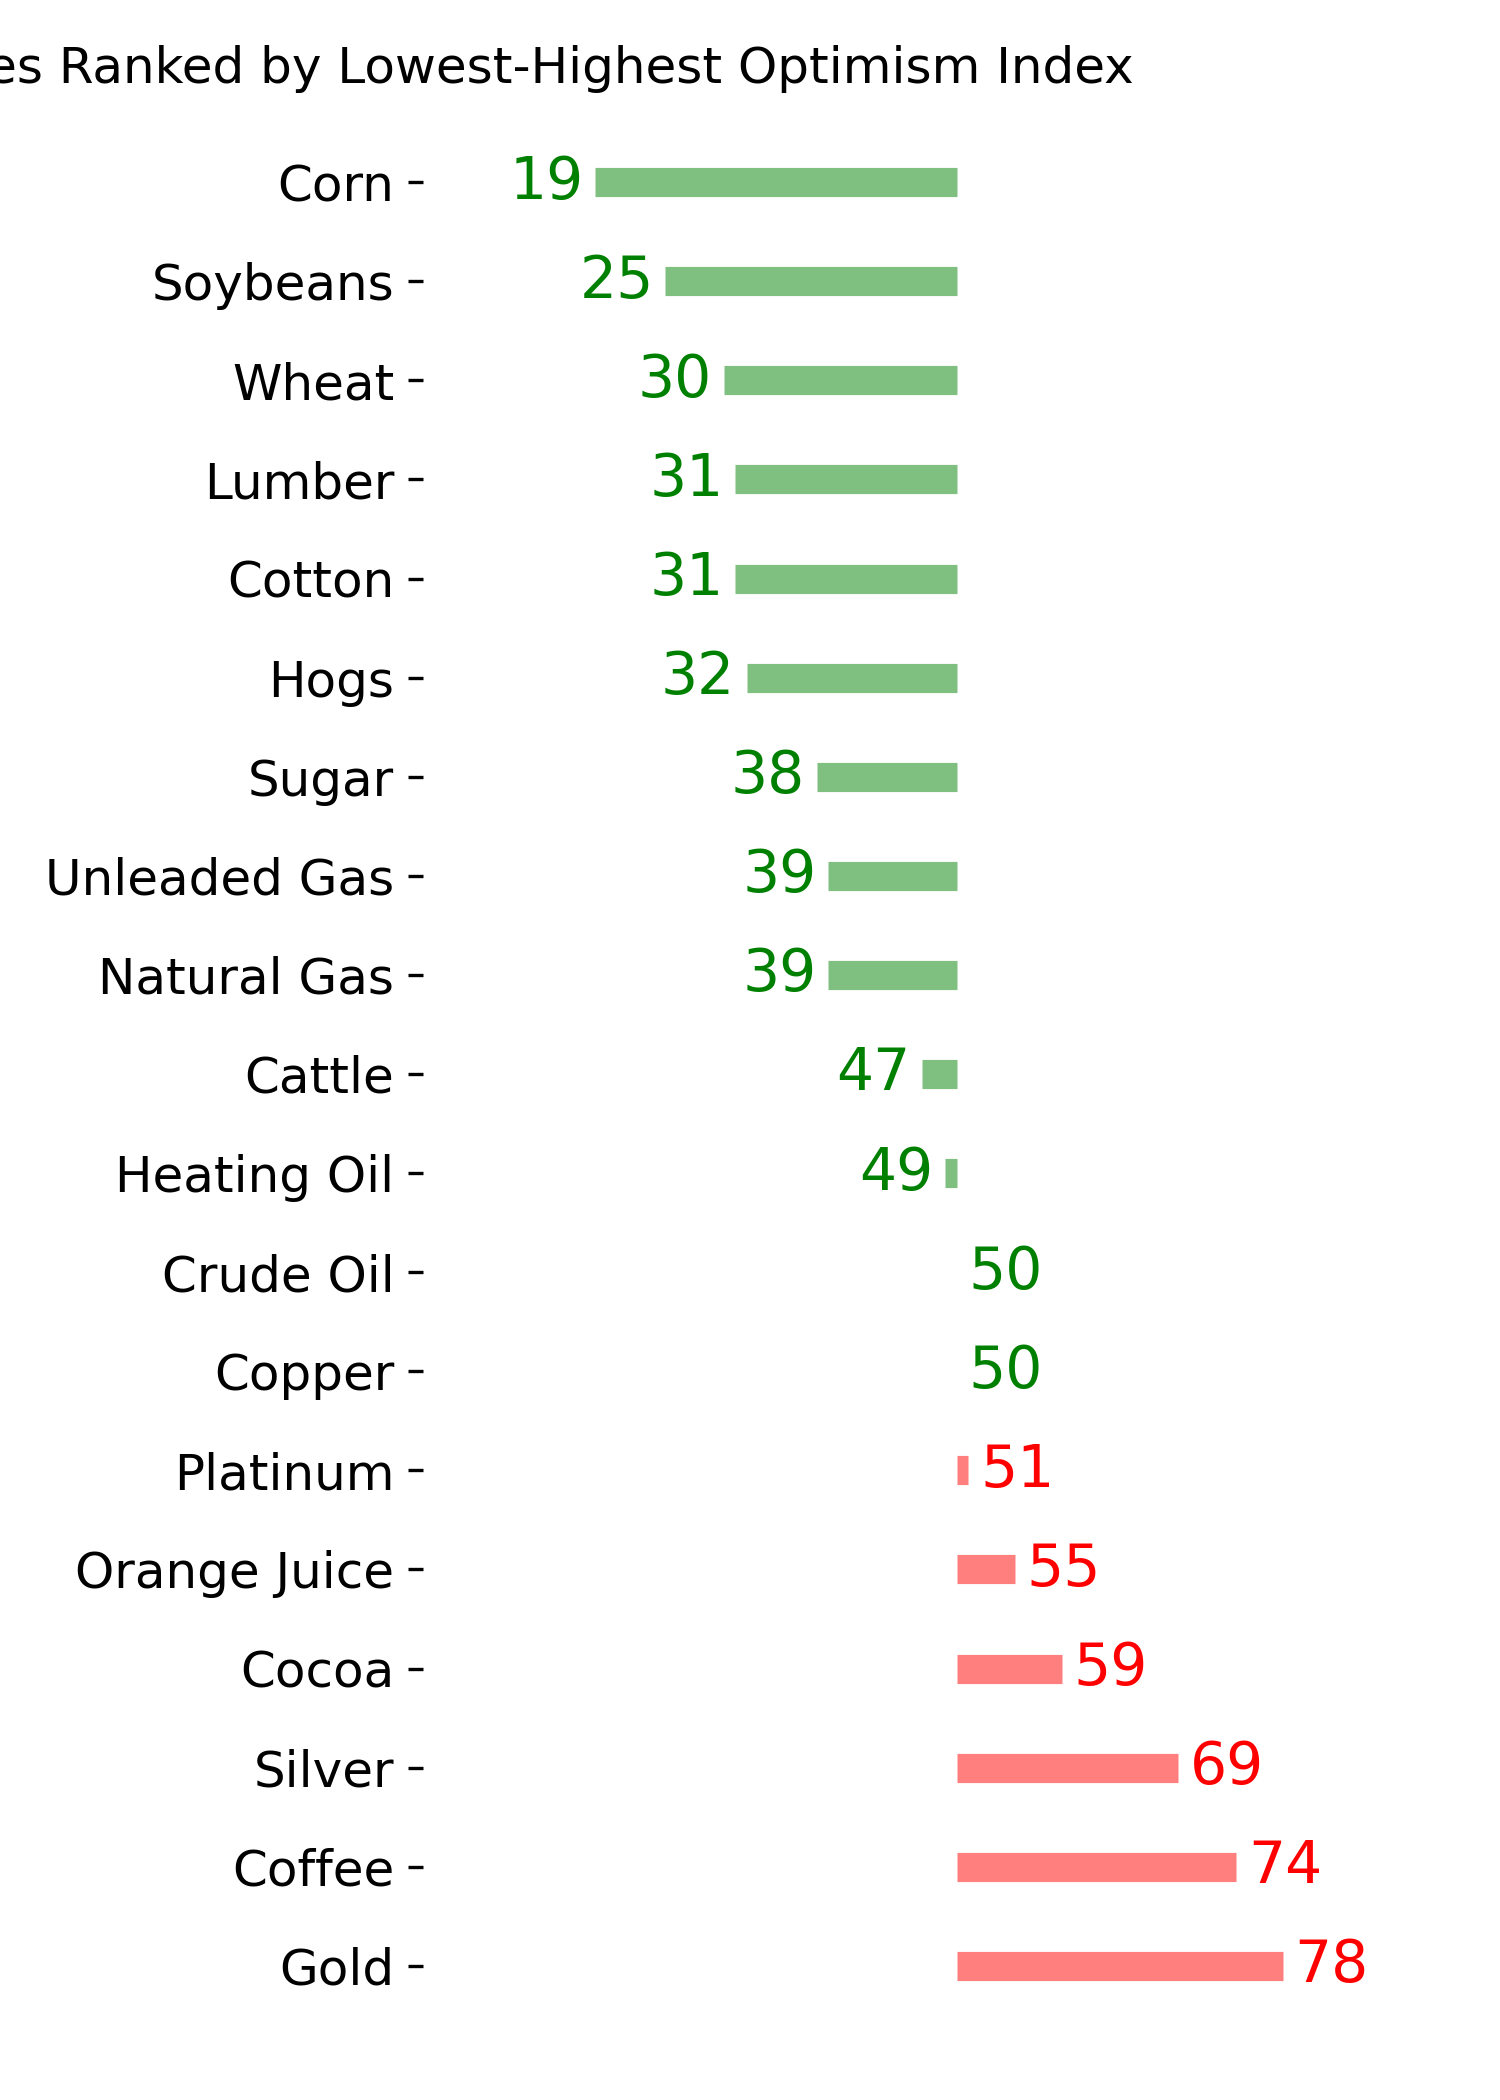
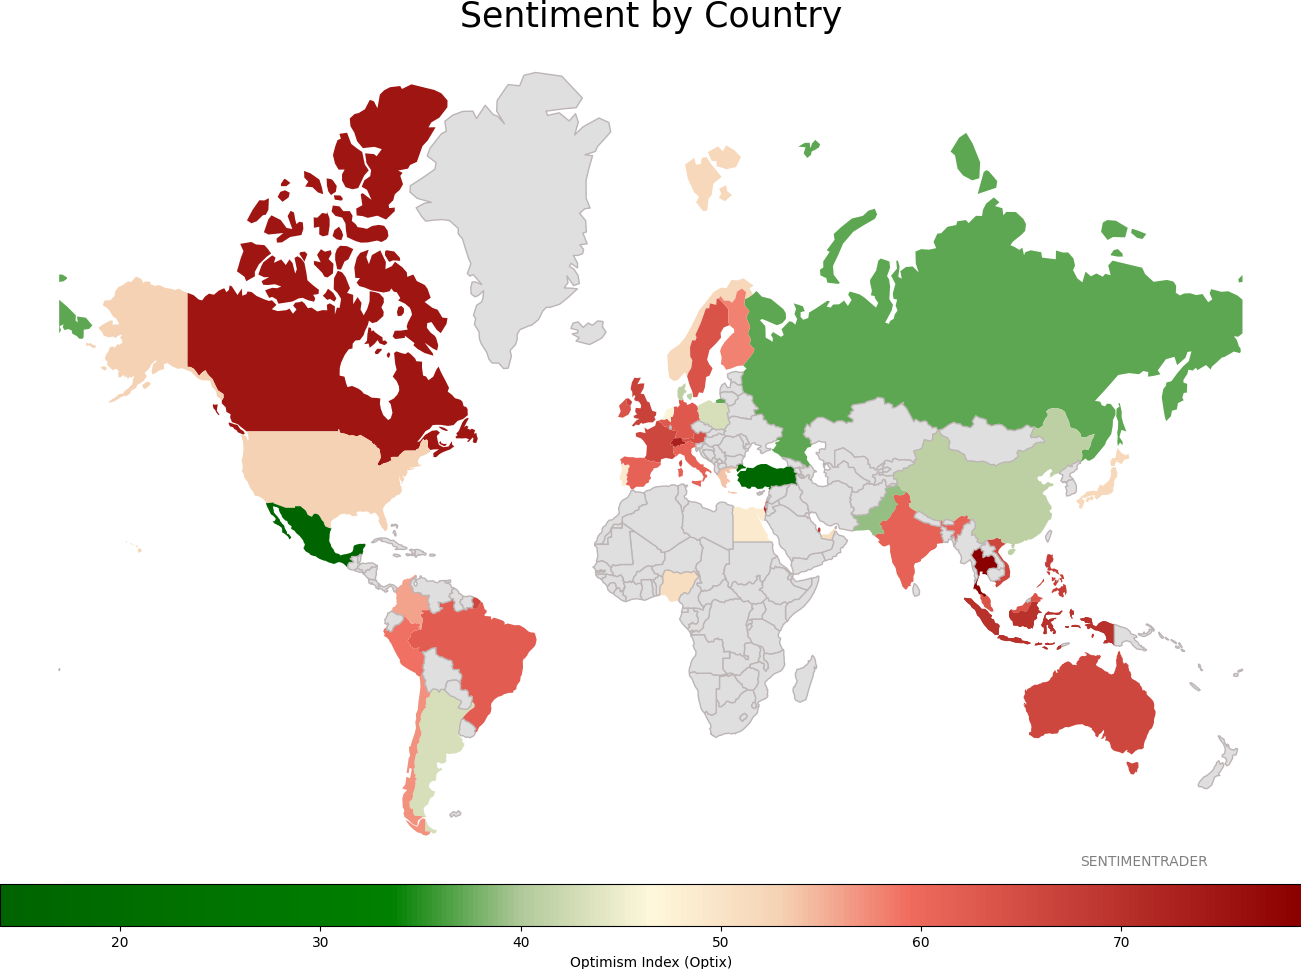
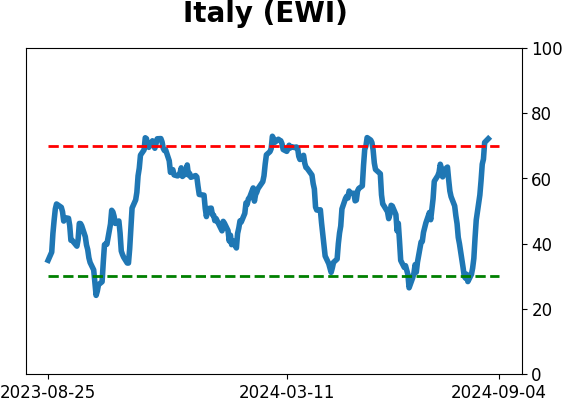
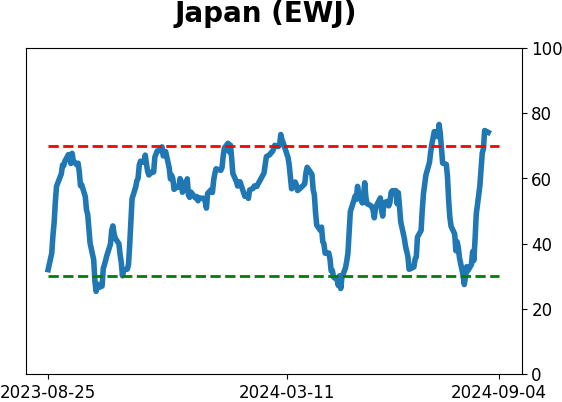
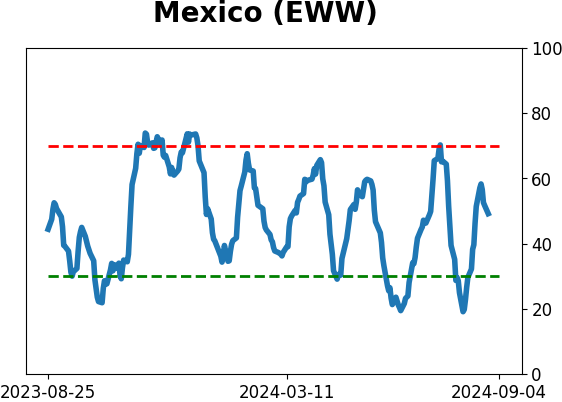
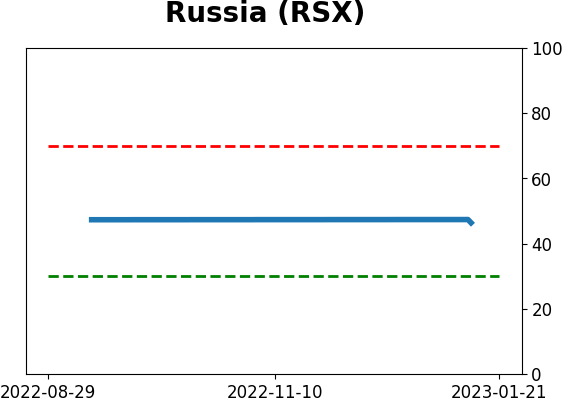
Sentiment Around The World
Optimism Index Thumbnails
|
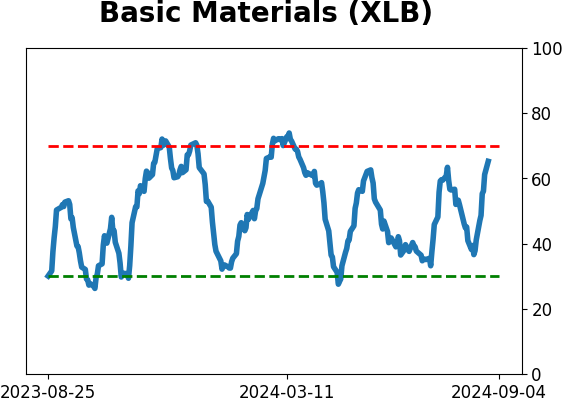
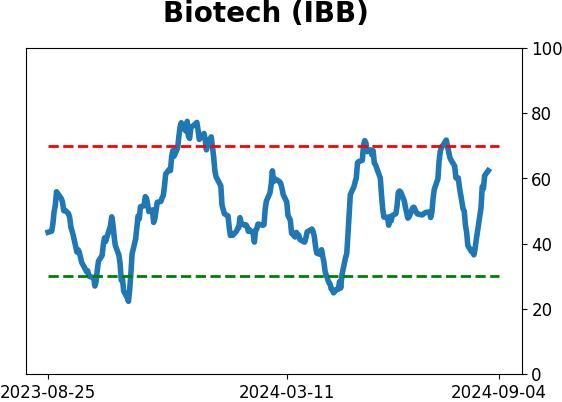
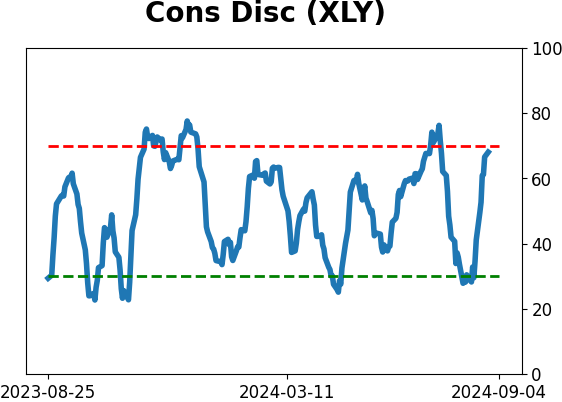
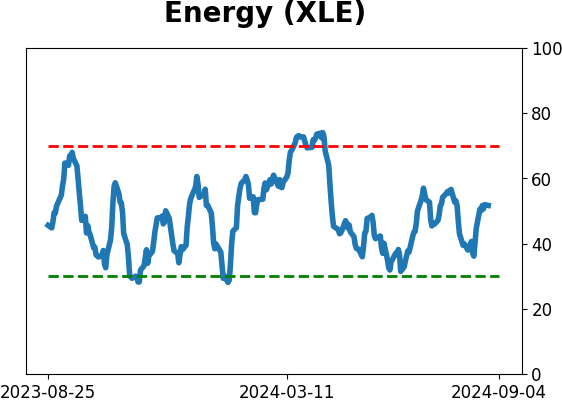
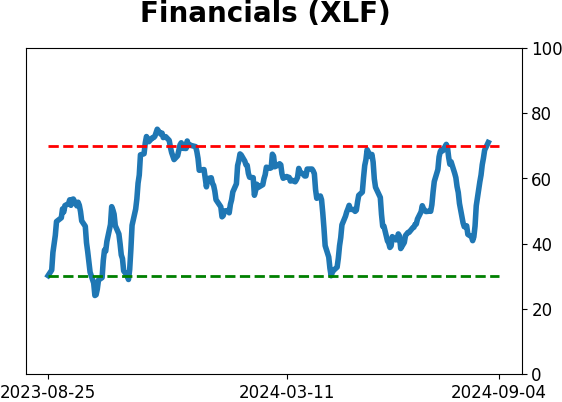
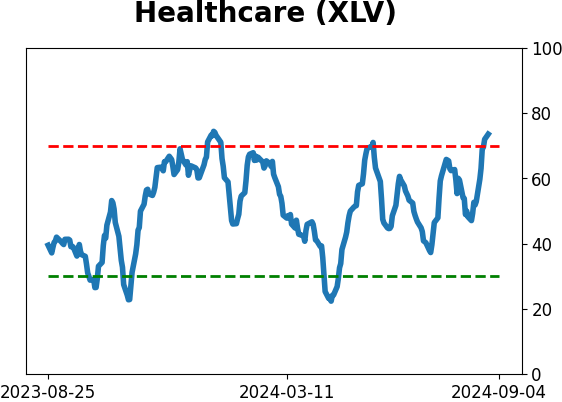
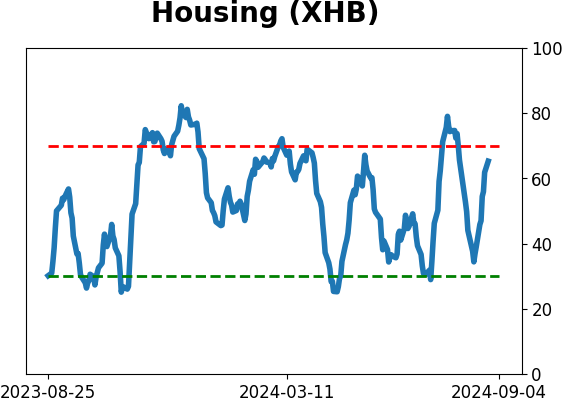
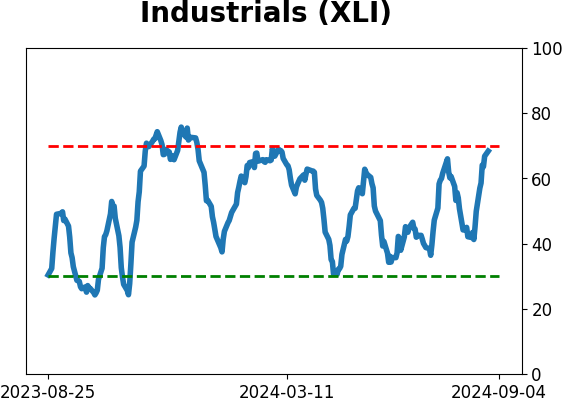
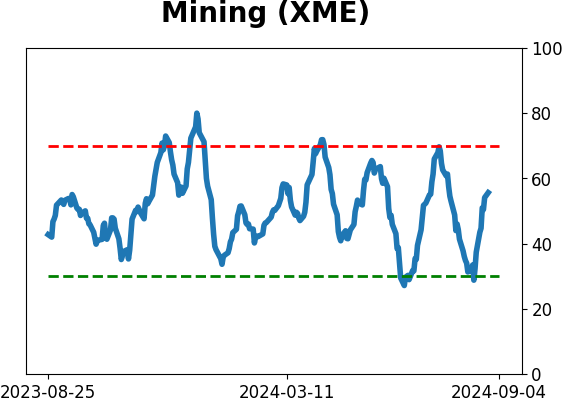
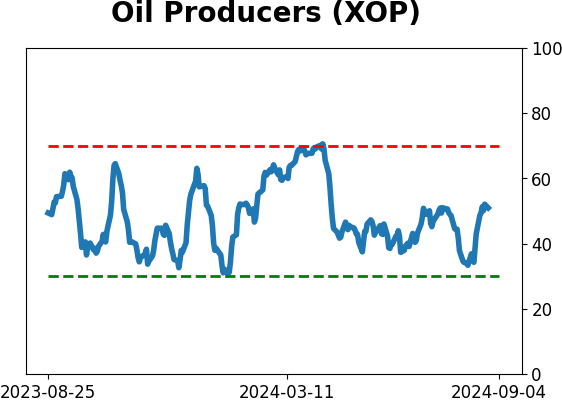
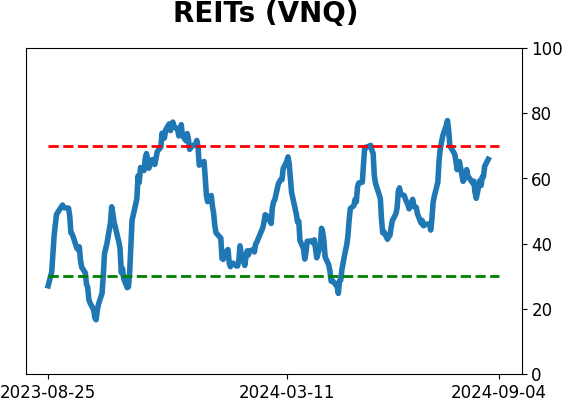
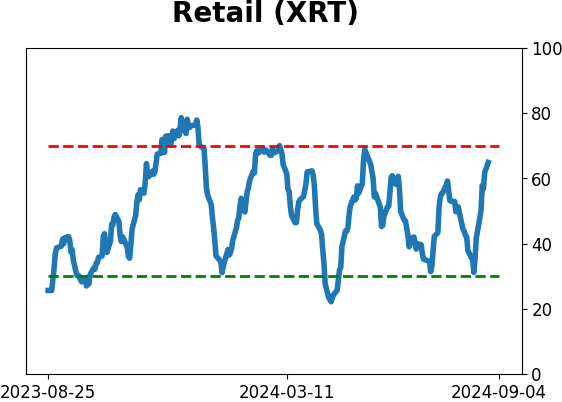
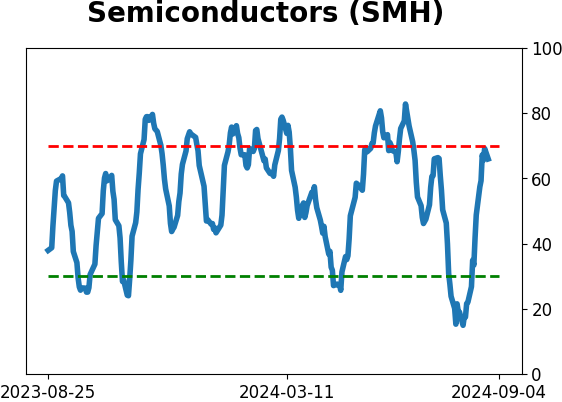
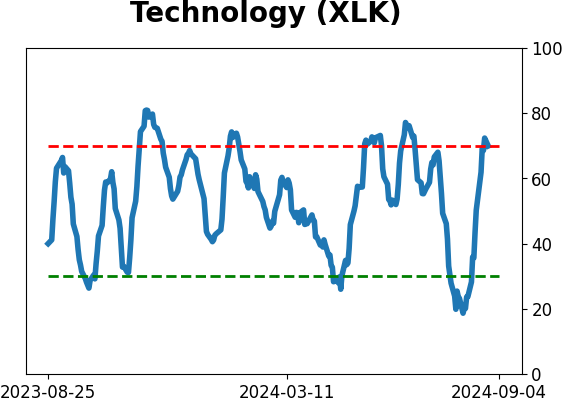
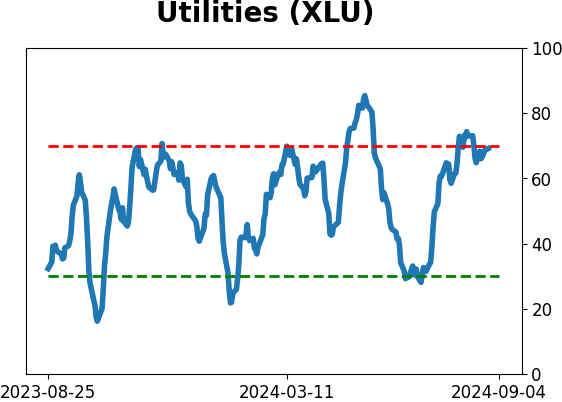
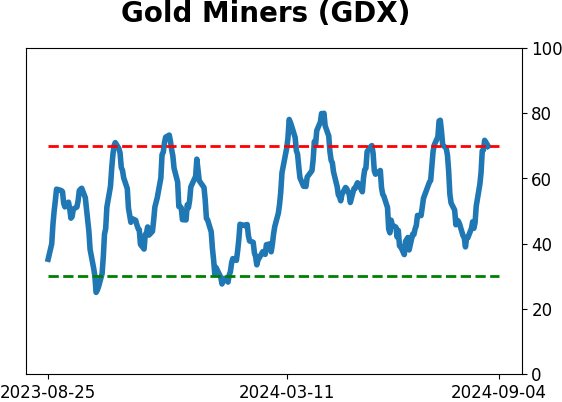
Sector ETF's - 10-Day Moving Average
|
|
|
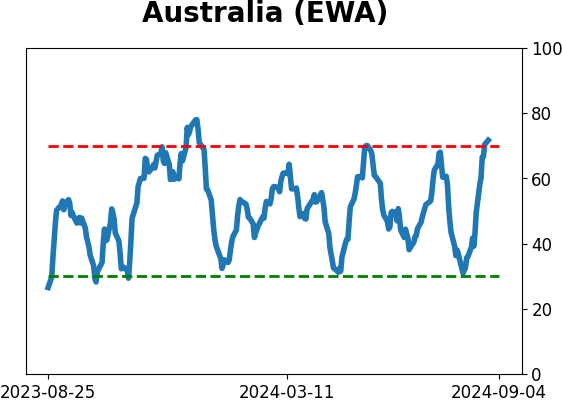
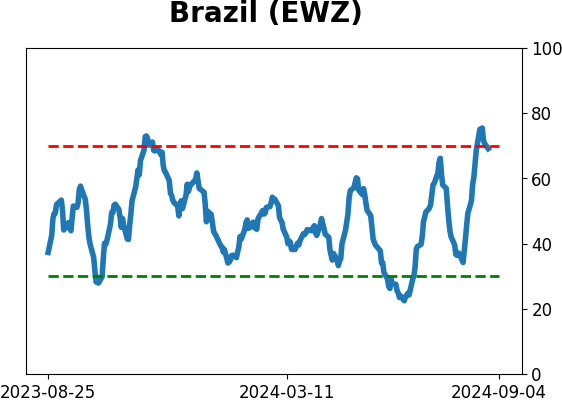
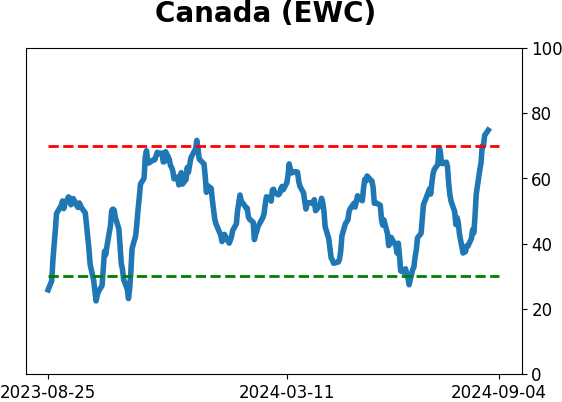
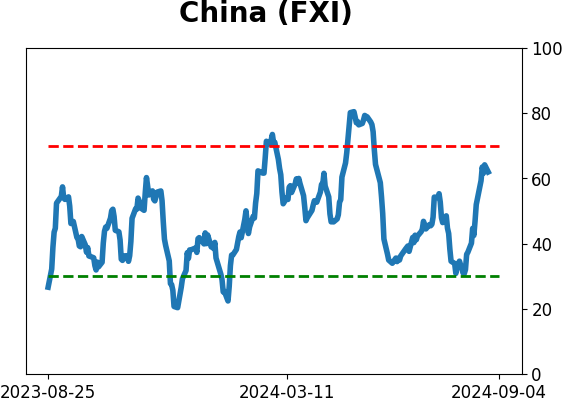
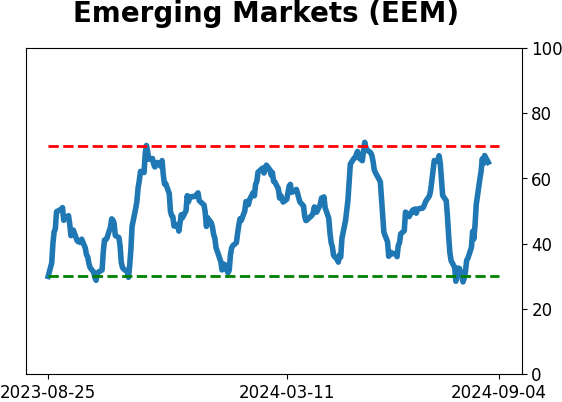
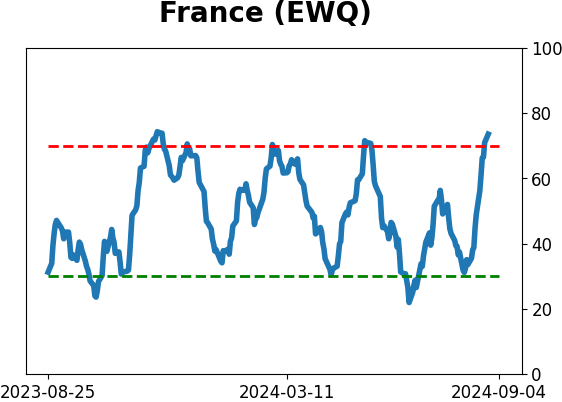
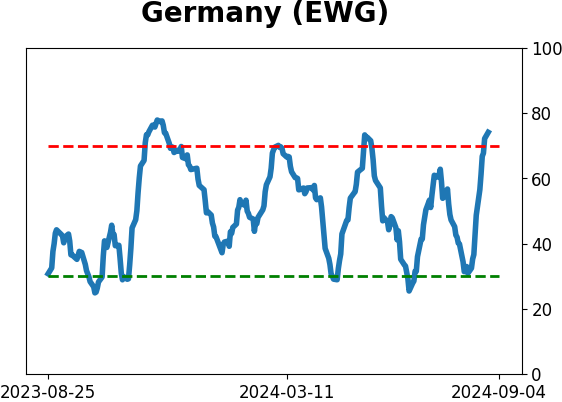
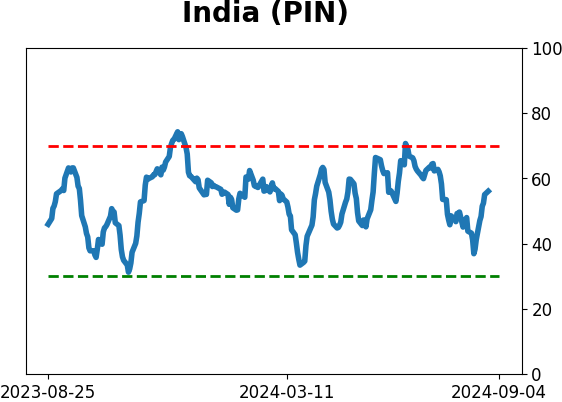
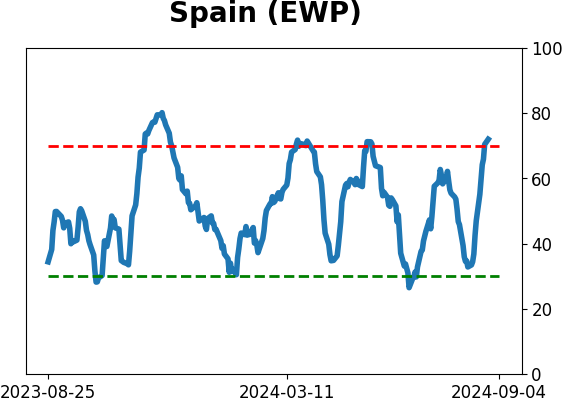
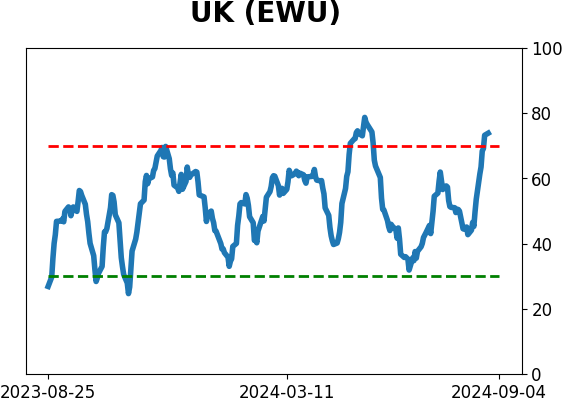
Country ETF's - 10-Day Moving Average
|
|
|
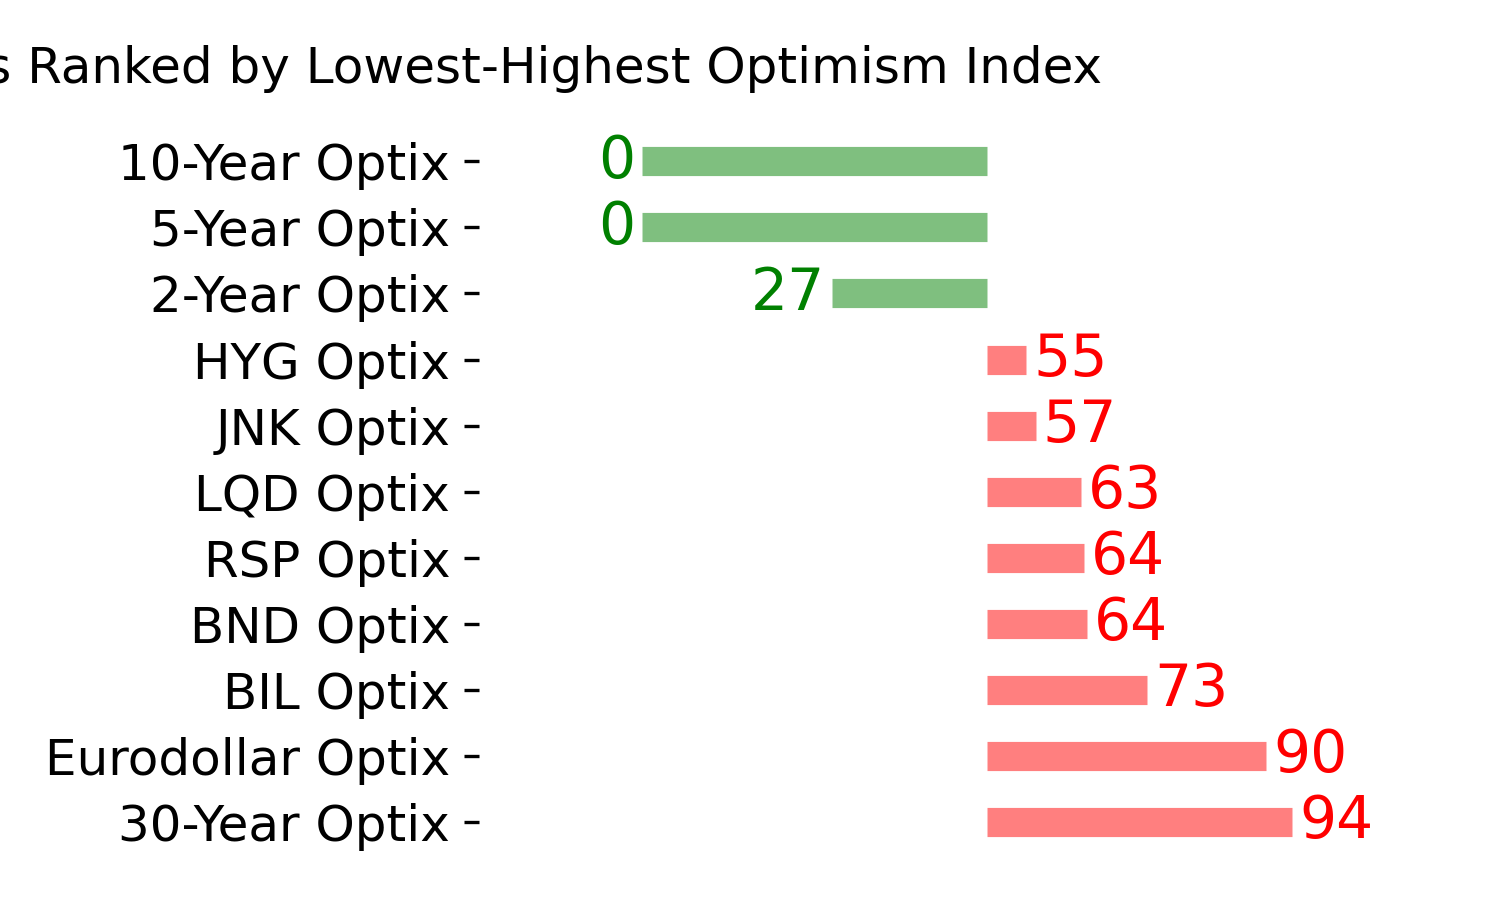
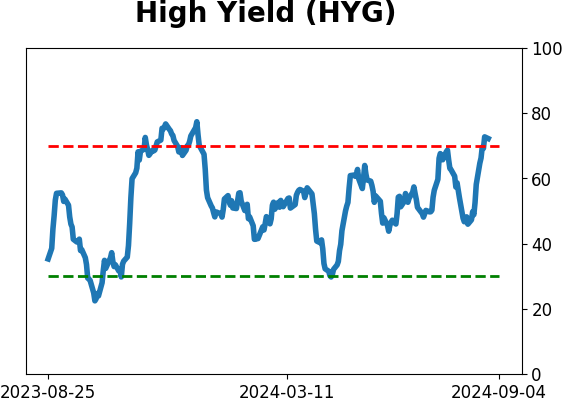
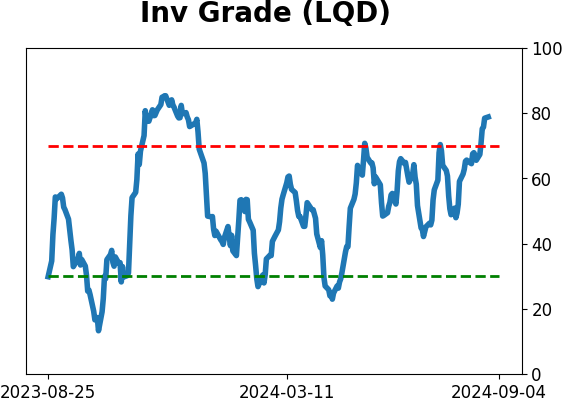
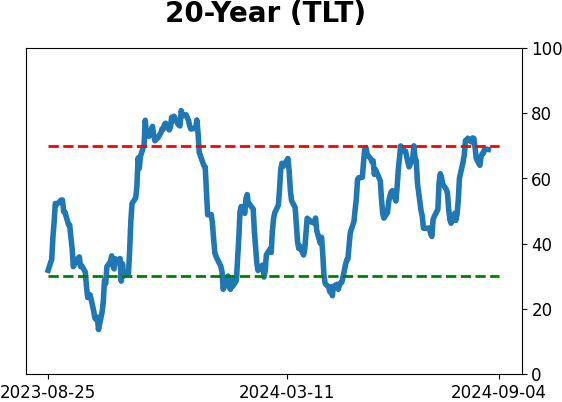
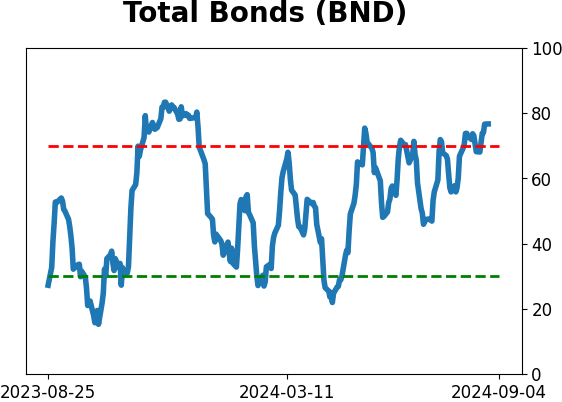
Bond ETF's - 10-Day Moving Average
|
|
|
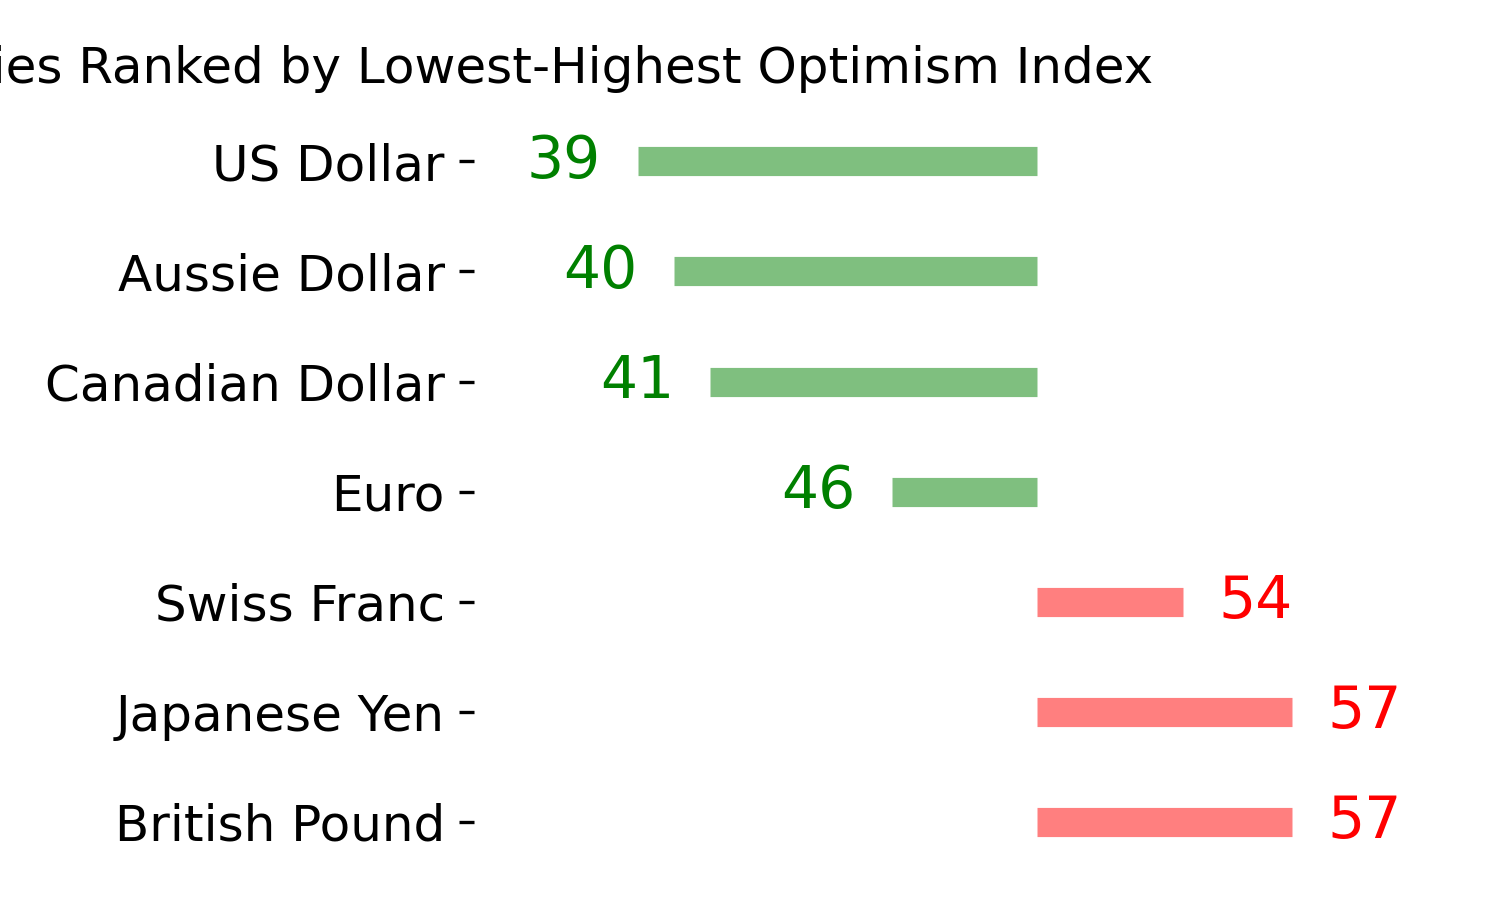
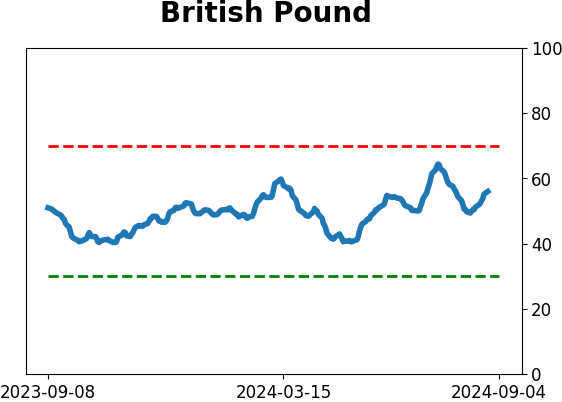
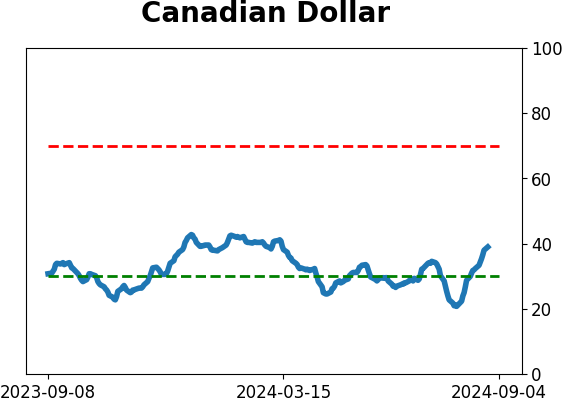
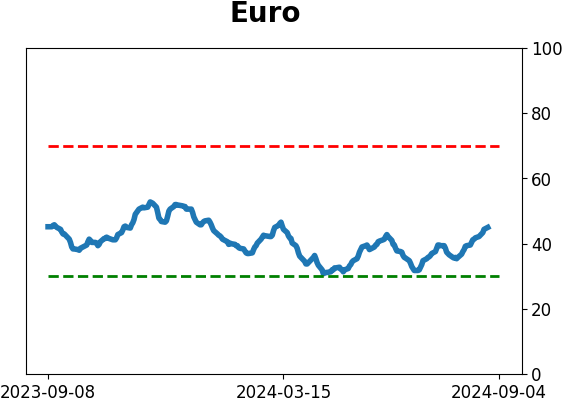
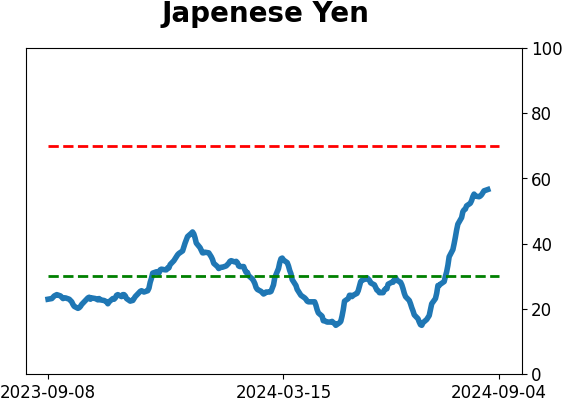
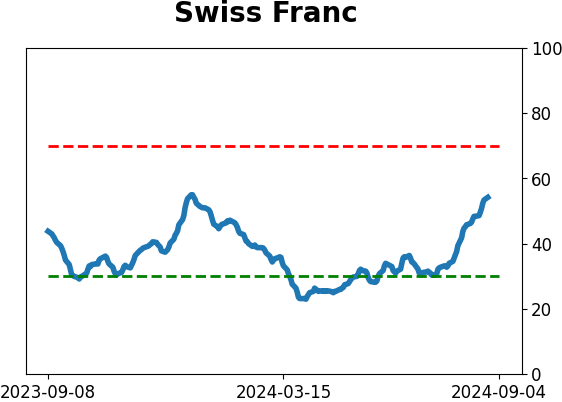
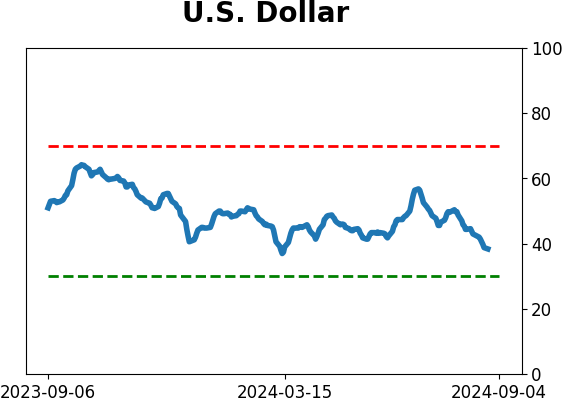
Currency ETF's - 5-Day Moving Average
|
|
|
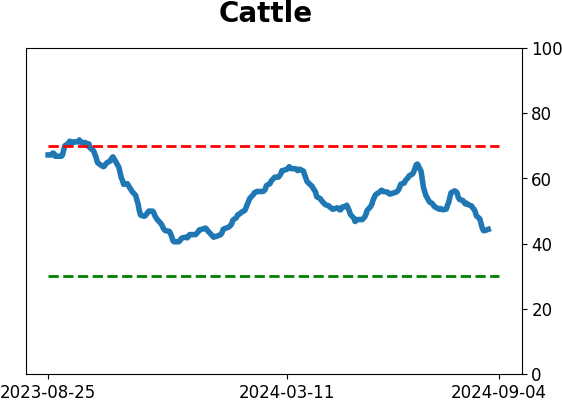
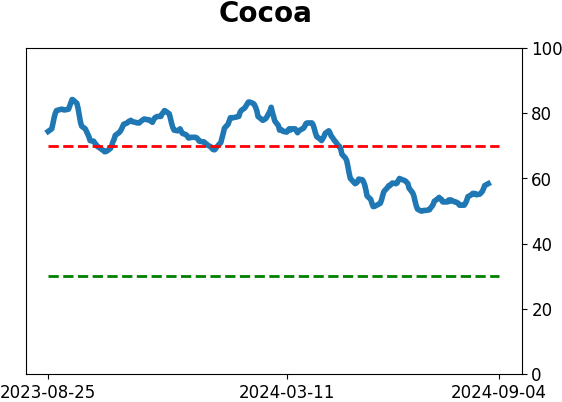
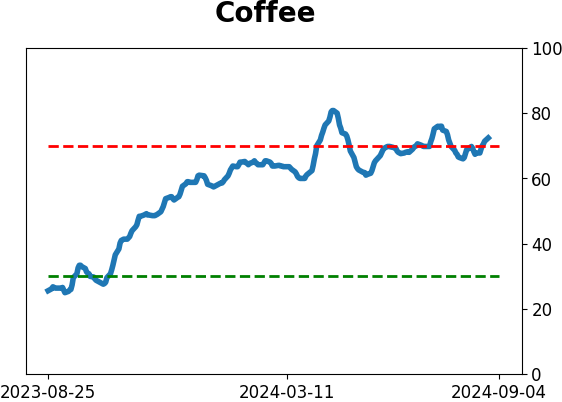
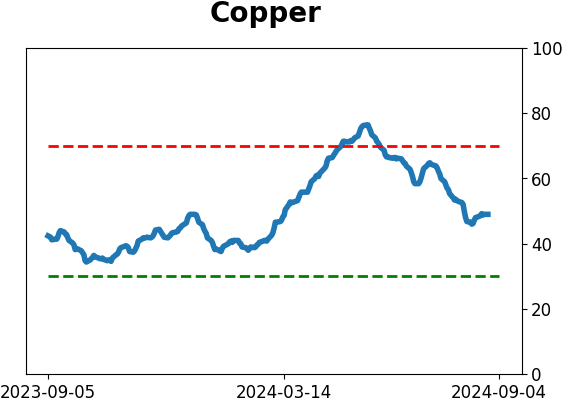
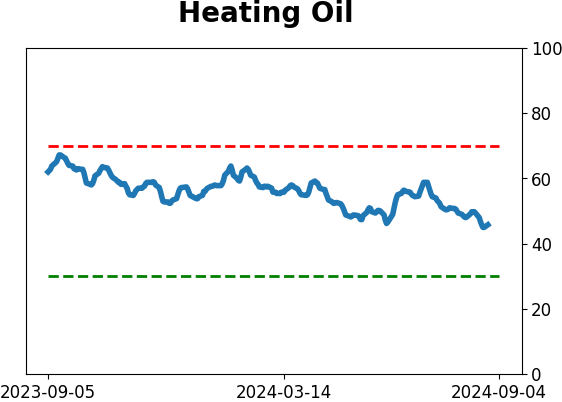
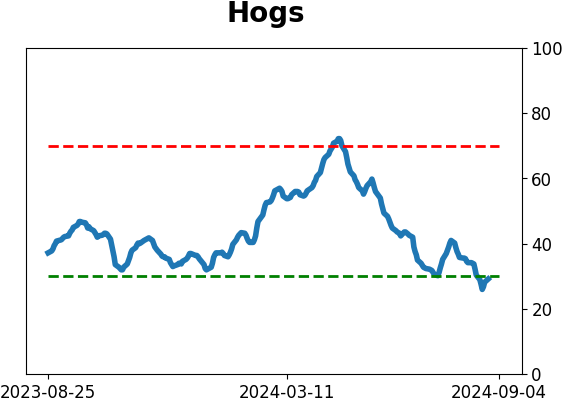
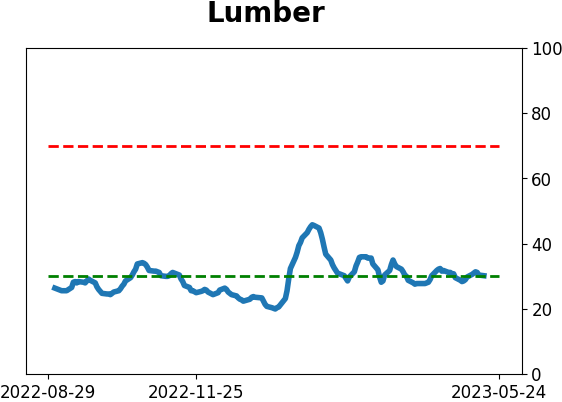
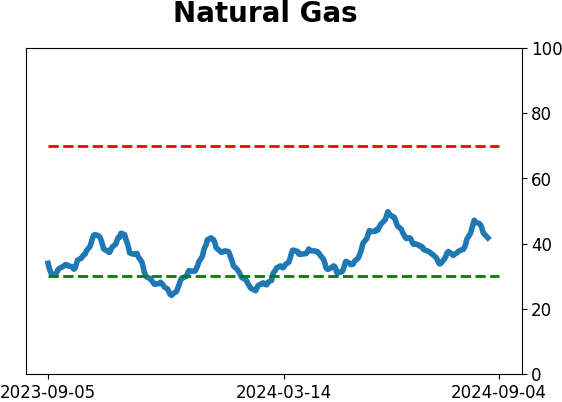
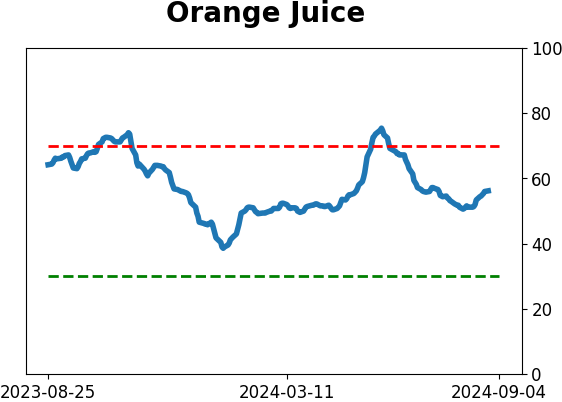
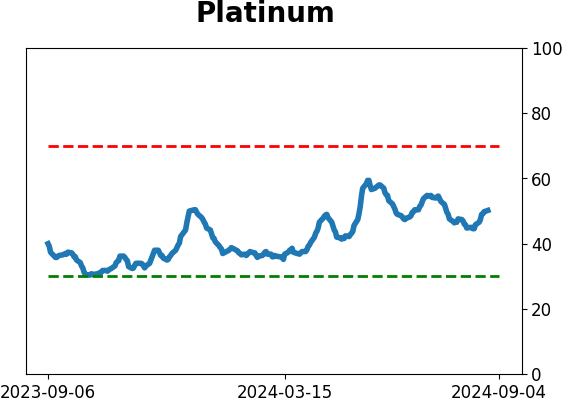
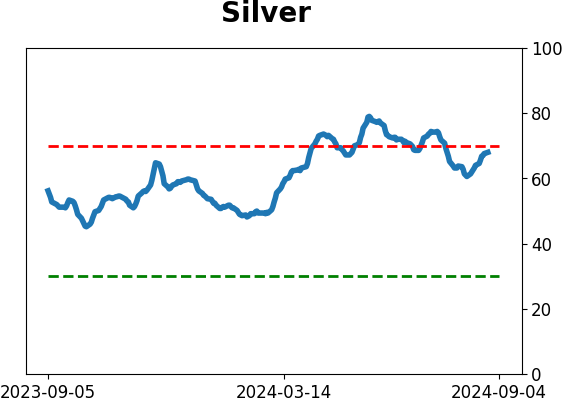
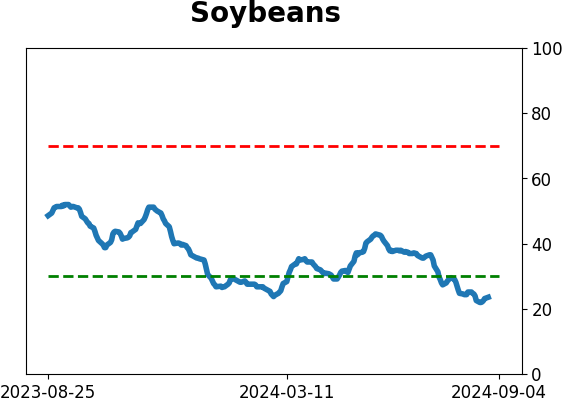
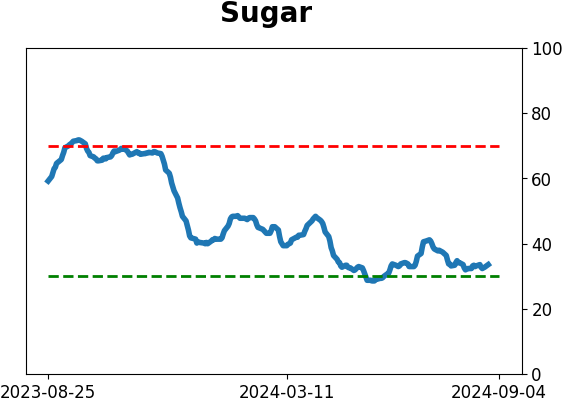
Commodity ETF's - 5-Day Moving Average
|
|