Headlines
|
|
Leading indicators trigger a buy signal for stocks:
The OECD Composite Leading Indicators for the United States reversed higher from contraction territory, triggering a buy signal from the S&P 500. After similar reversals in leading indicators, the world's most benchmarked index was higher over the next two months every time.
|
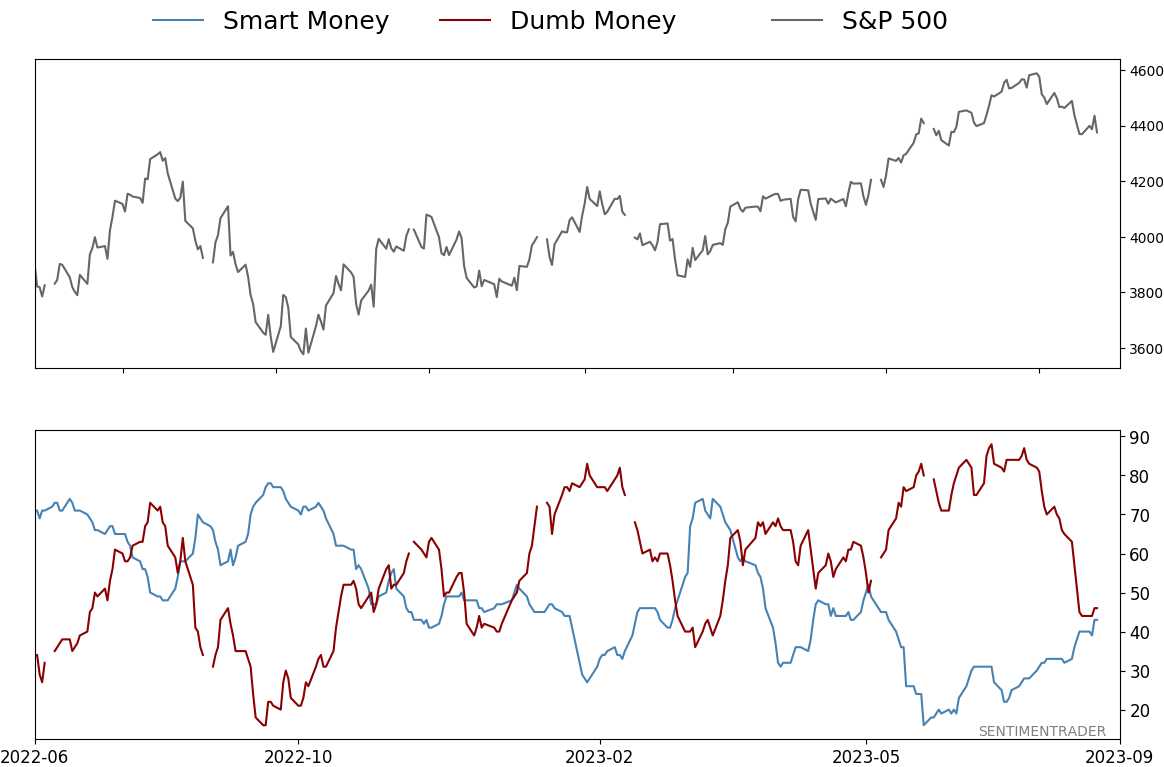
Smart / Dumb Money Confidence
|
Smart Money Confidence: 43%
Dumb Money Confidence: 46%
|
|
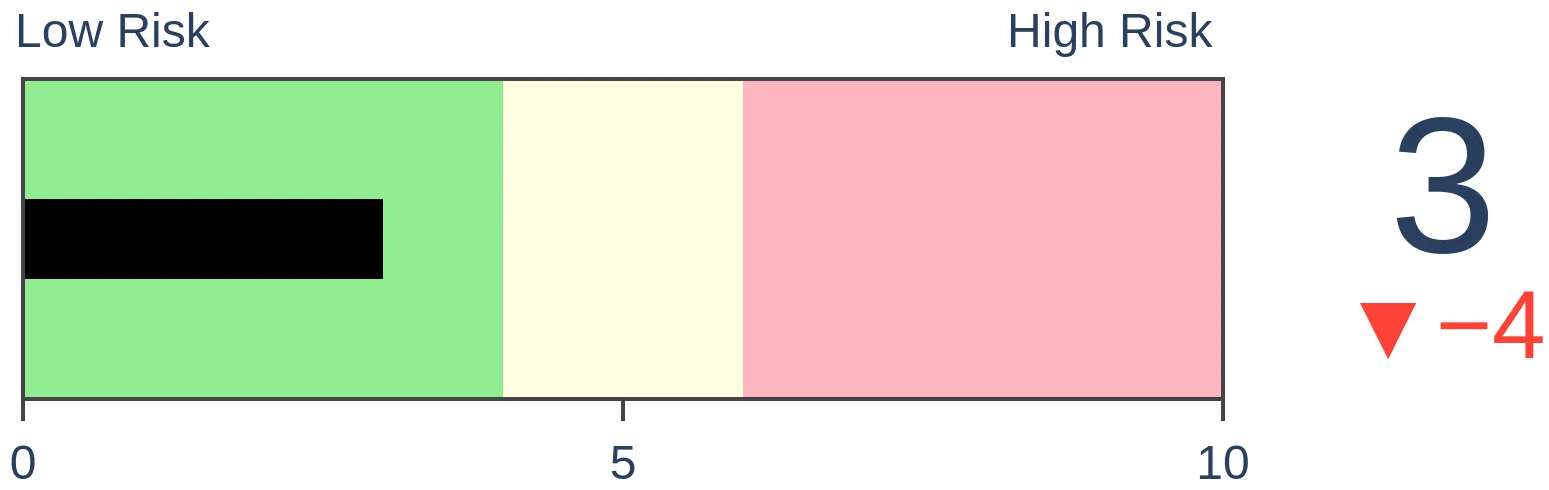
Risk Levels
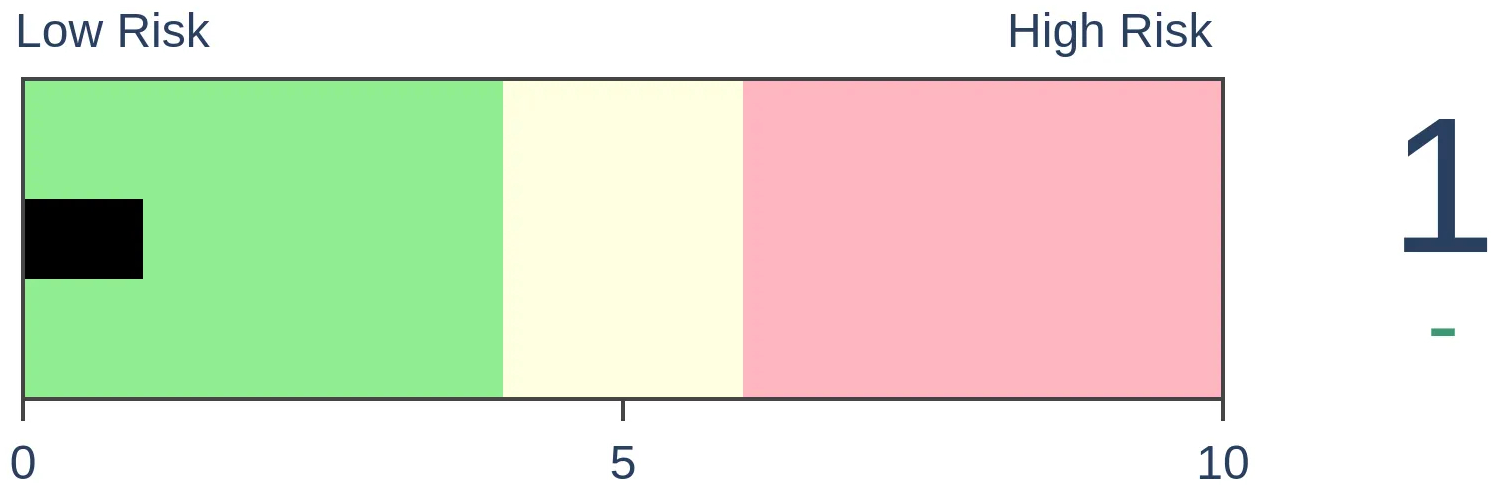
Stocks Short-Term
|
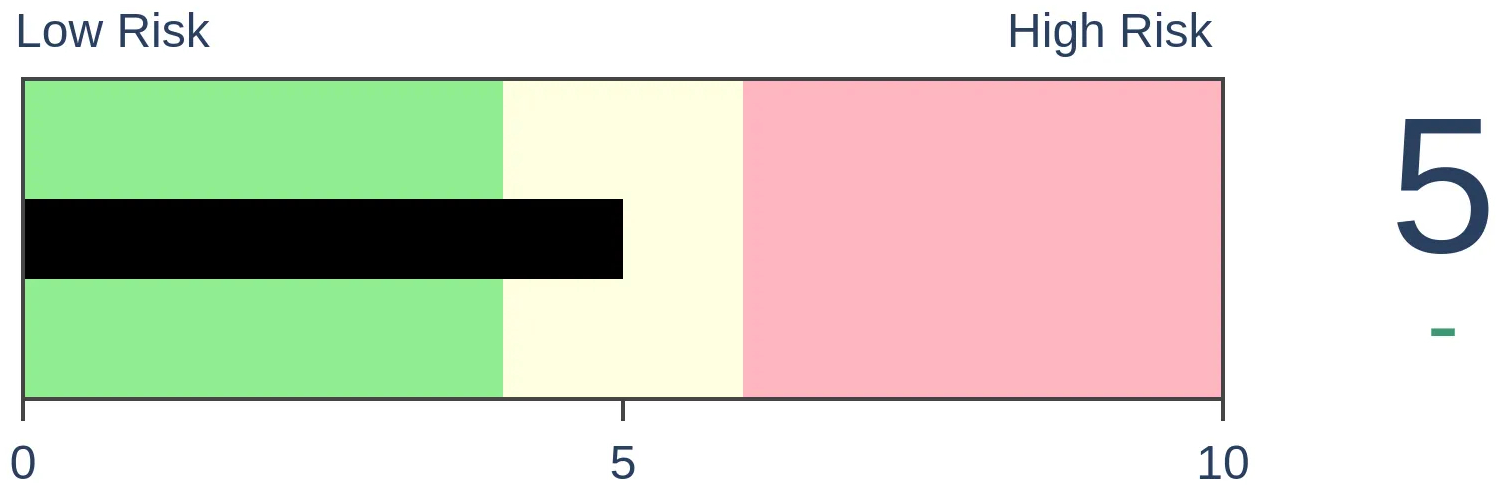
Stocks Medium-Term

|
|
Bonds
|
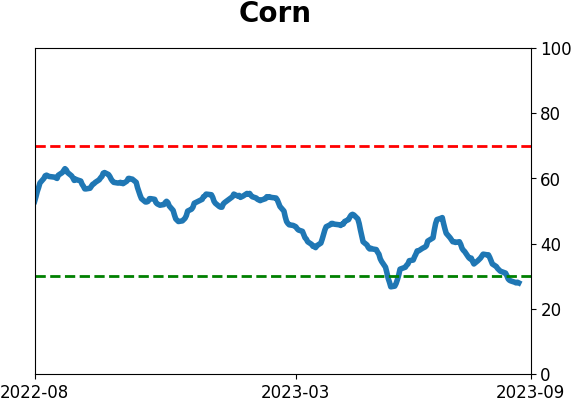
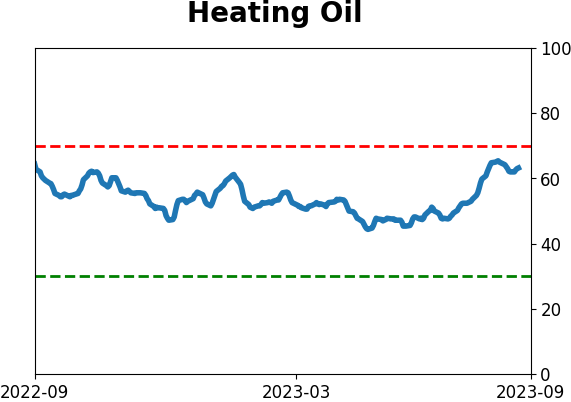
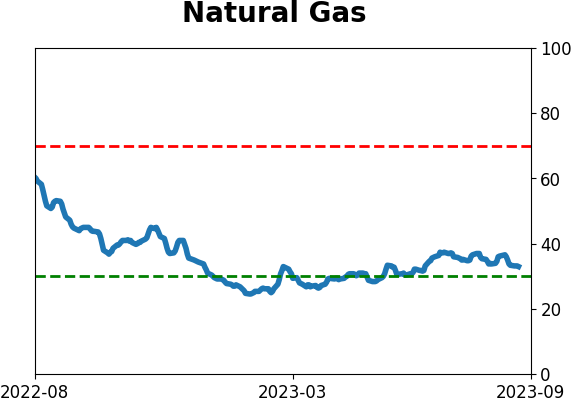
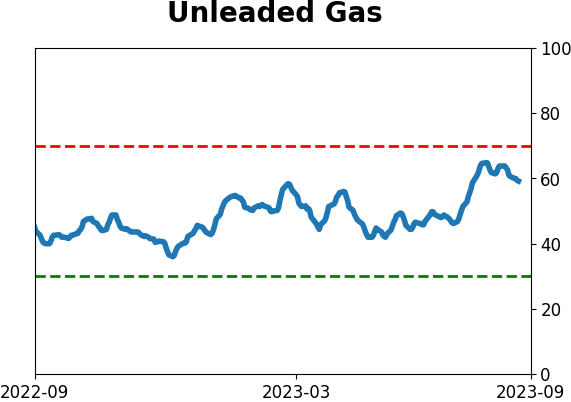
Crude Oil
|
|
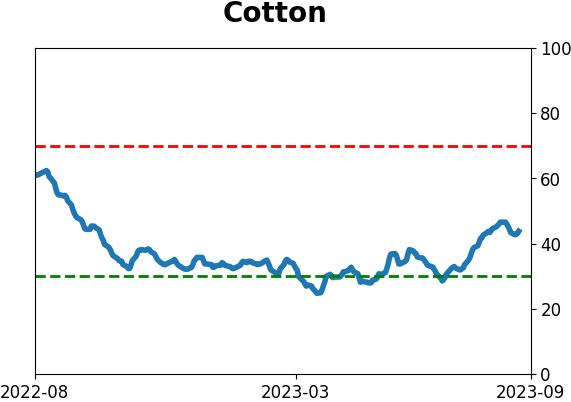
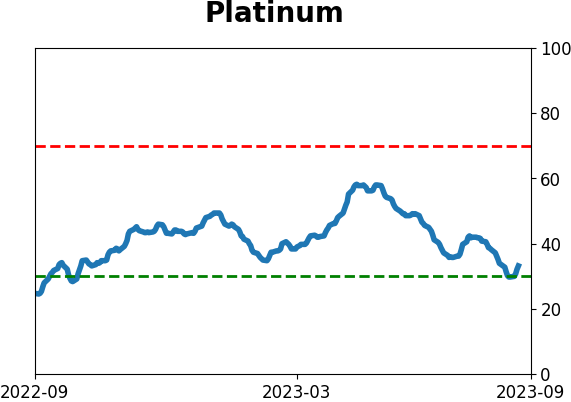
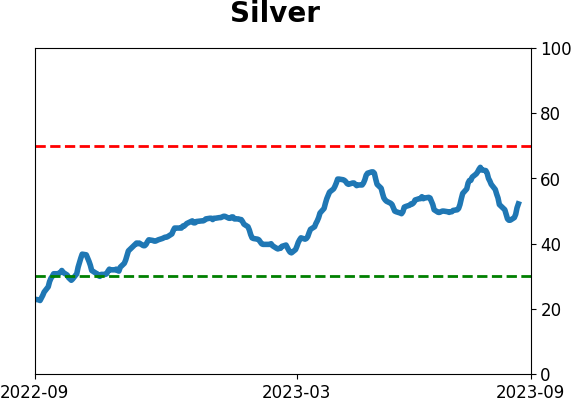
Gold
|
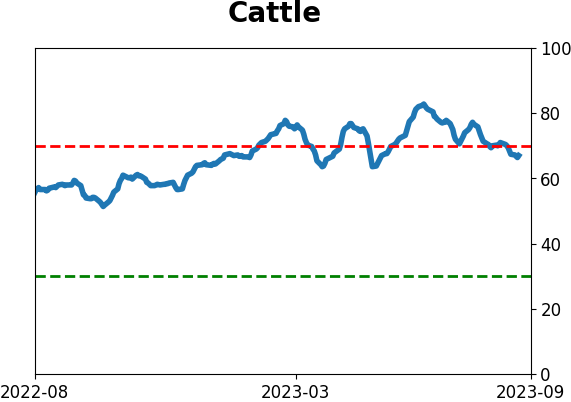
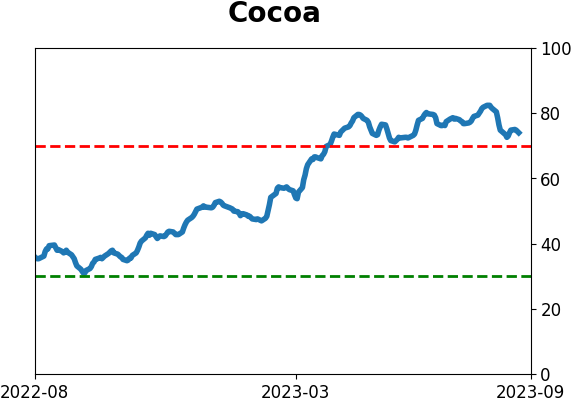
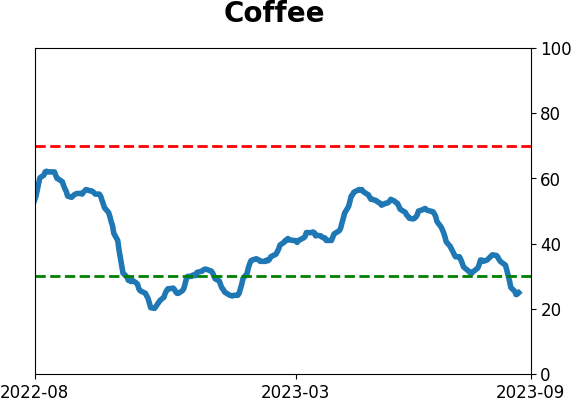
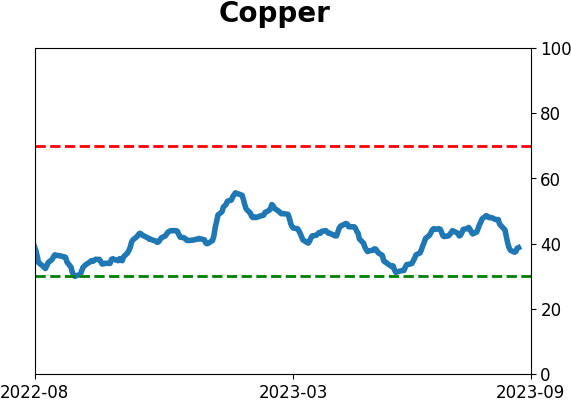
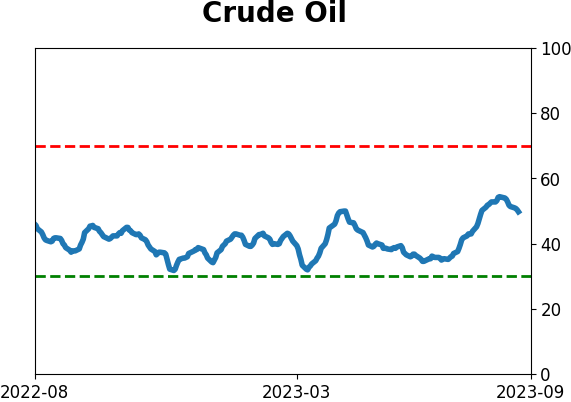
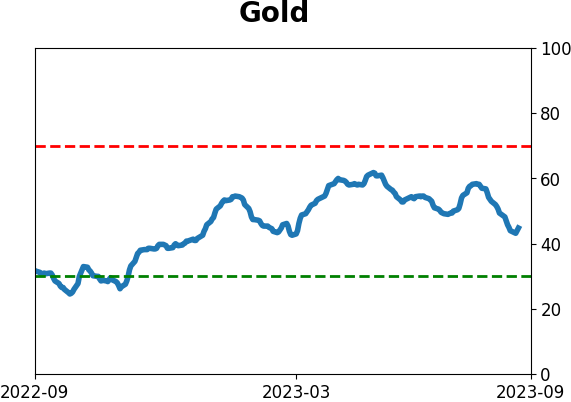
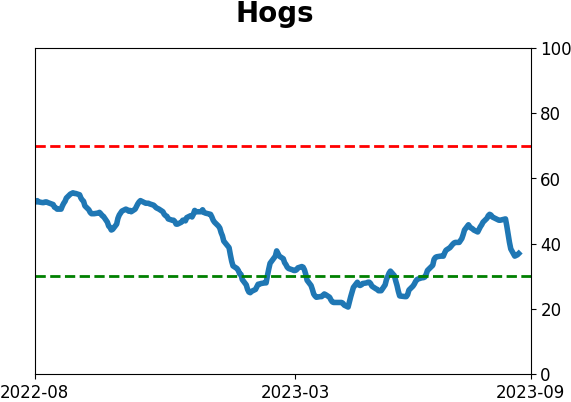
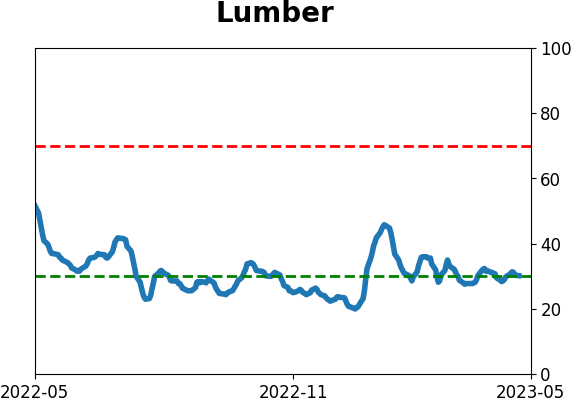
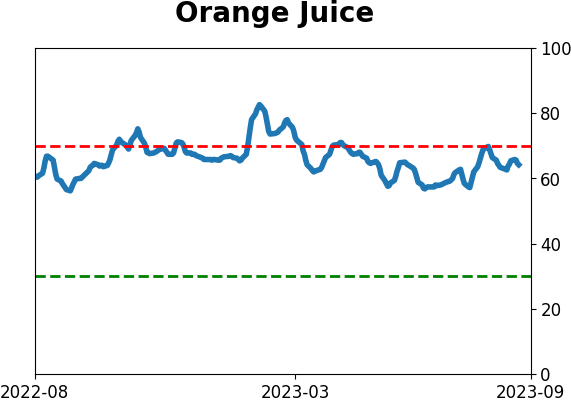
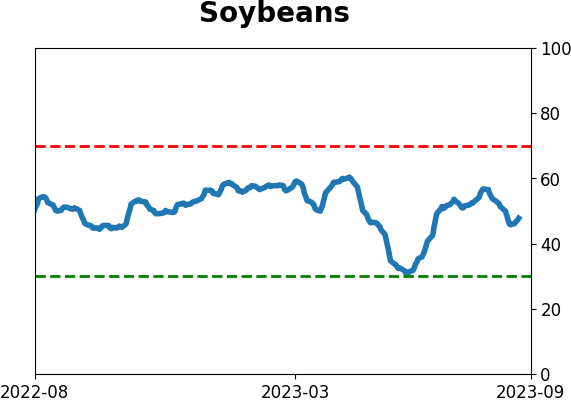
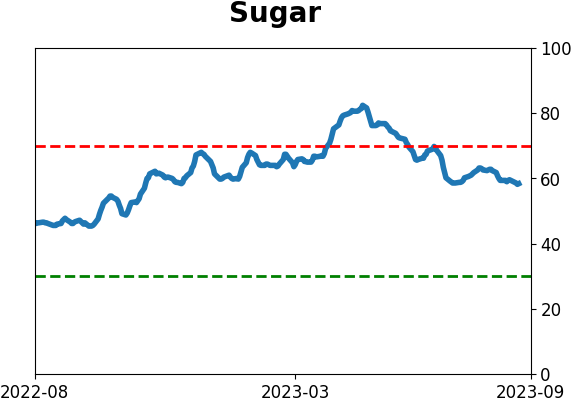
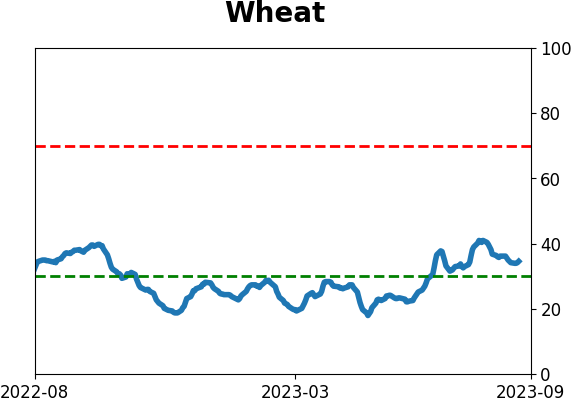
Agriculture

|
|
Research
By Dean Christians
BOTTOM LINE
The OECD Composite Leading Indicators for the United States reversed higher from contraction territory, triggering a buy signal from the S&P 500. After similar reversals in leading indicators, the world's most benchmarked index was higher over the next two months every time.
FORECAST / TIMEFRAME
None
|
Key points:
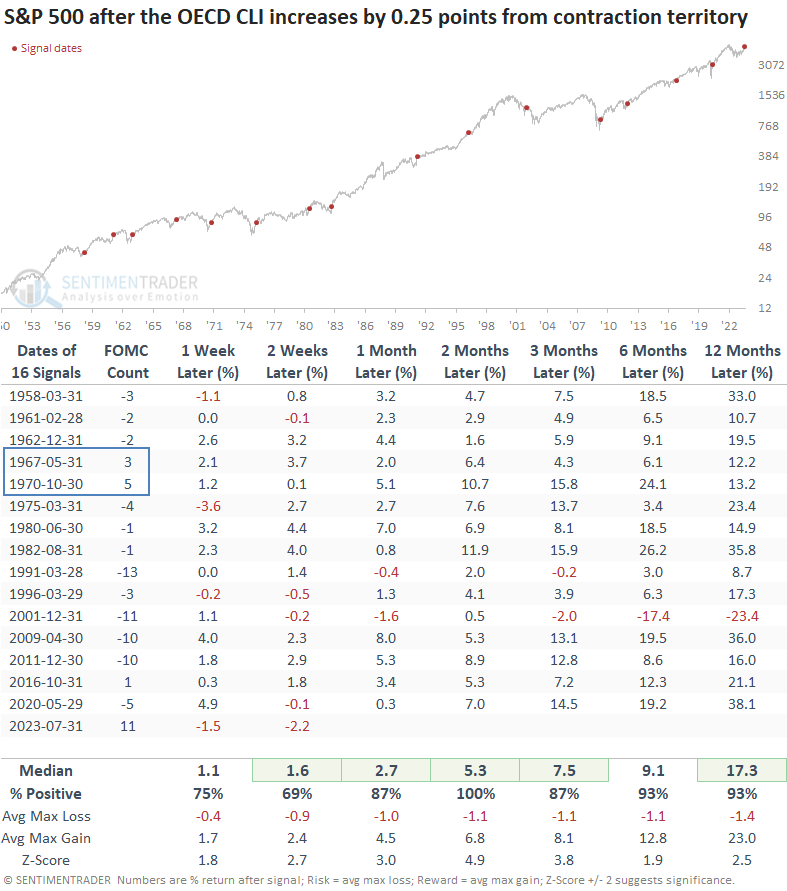
- The OECD Composite Leading Indicators for the U.S. reversed higher from contraction territory
- Similar reversals led to extremely bullish outcomes for the S&P 500 over the next twelve months
- Early-cycle sectors tend to outperform after leading indicators shift higher, like now
One version of leading indicators for the United States triggers a buy signal
The Organization for Economic Cooperation and Development (OECD) compiles a composite of leading indicators for G20 countries. The CLIs can be aggregated into a diffusion index or used as a standalone measure for countries to identify an economic upswing that provides a bullish fundamental tailwind for stocks.
The model I use for individual countries requires the CLI to fall into contraction territory and rise by a user-defined amount from the subsequent low.
In the case of the United States, I require the CLI to fall below 99.5 and rise by 0.25 points from its trough, a condition that triggered a new buy signal with the most recent update from the OECD.
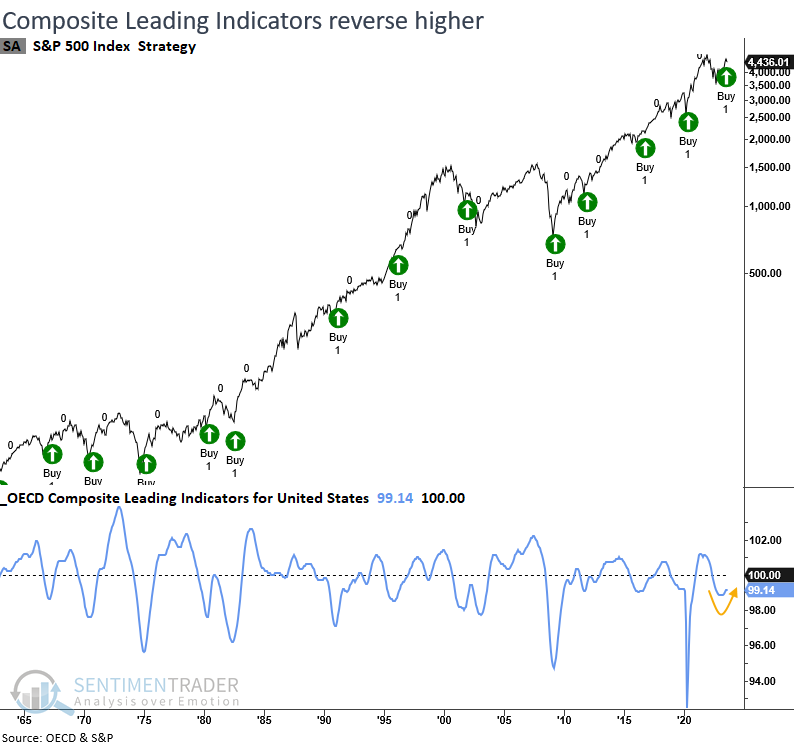
An upswing in the OECD Composite Leading Indicators precedes excellent returns
Whenever the OECD CLI for the United States falls below 99.5 and increases by 0.25 points from the subsequent low, the S&P 500 displays remarkable returns, win rates, and z-scores across all time frames. Two months later, the S&P 500 was higher every time.
In the two previous instances when the FOMC adopted a more restrictive monetary policy stance, returns remained positive, albeit falling short of the median over the next year.
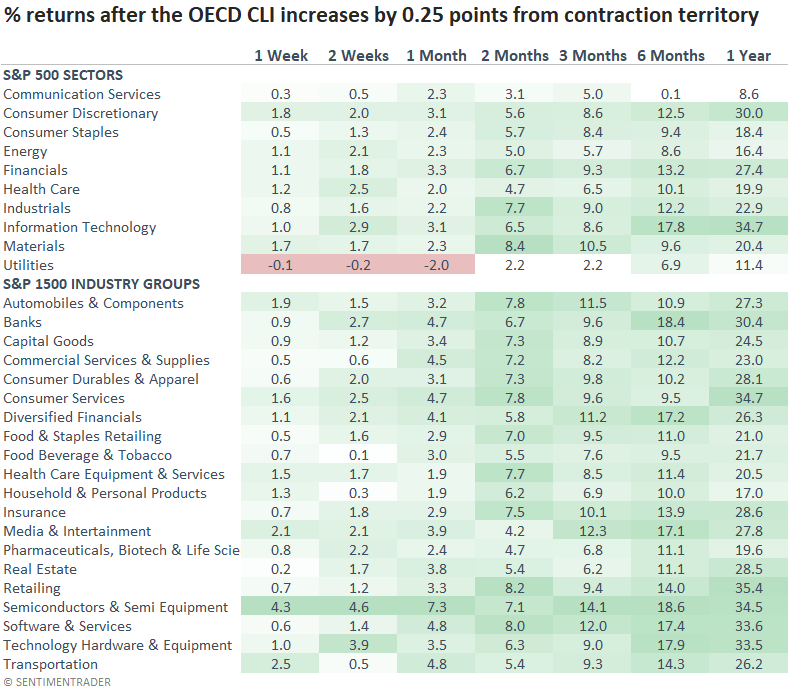
From a sector perspective, early cycle leaders like Consumer Discretionary and Technology are clear-cut winners, which aligns with current relative strength trends.
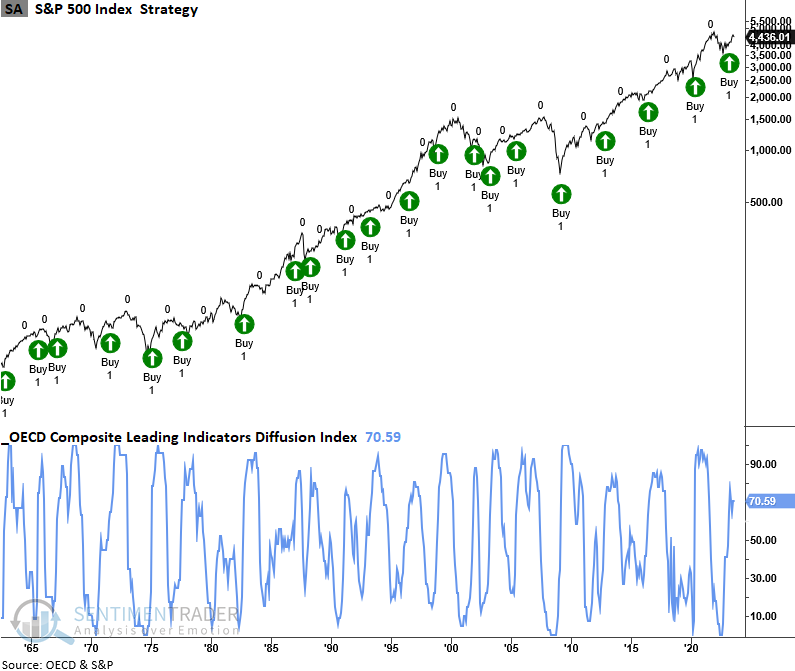
OECD Composite Leading Indicators Diffusion Index
The diffusion index, which aggregates individual country CLIs, continues to maintain a bullish level after triggering a buy signal in the spring.
What the research tells us...
When forecasting the macroeconomic backdrop, I rely most on the stock market for my outlook. Price leads fundamentals. As a secondary tool, I depend on leading economic indicators. One such measure from the OECD reversed higher from contraction territory, triggering a buy signal for stocks in the United States. After similar alerts, the S&P 500 displayed excellent returns and win rates bolstered by an advantageous fundamental backdrop. If this time is different, it's likely due to the delayed impact of a restrictive monetary policy stance.
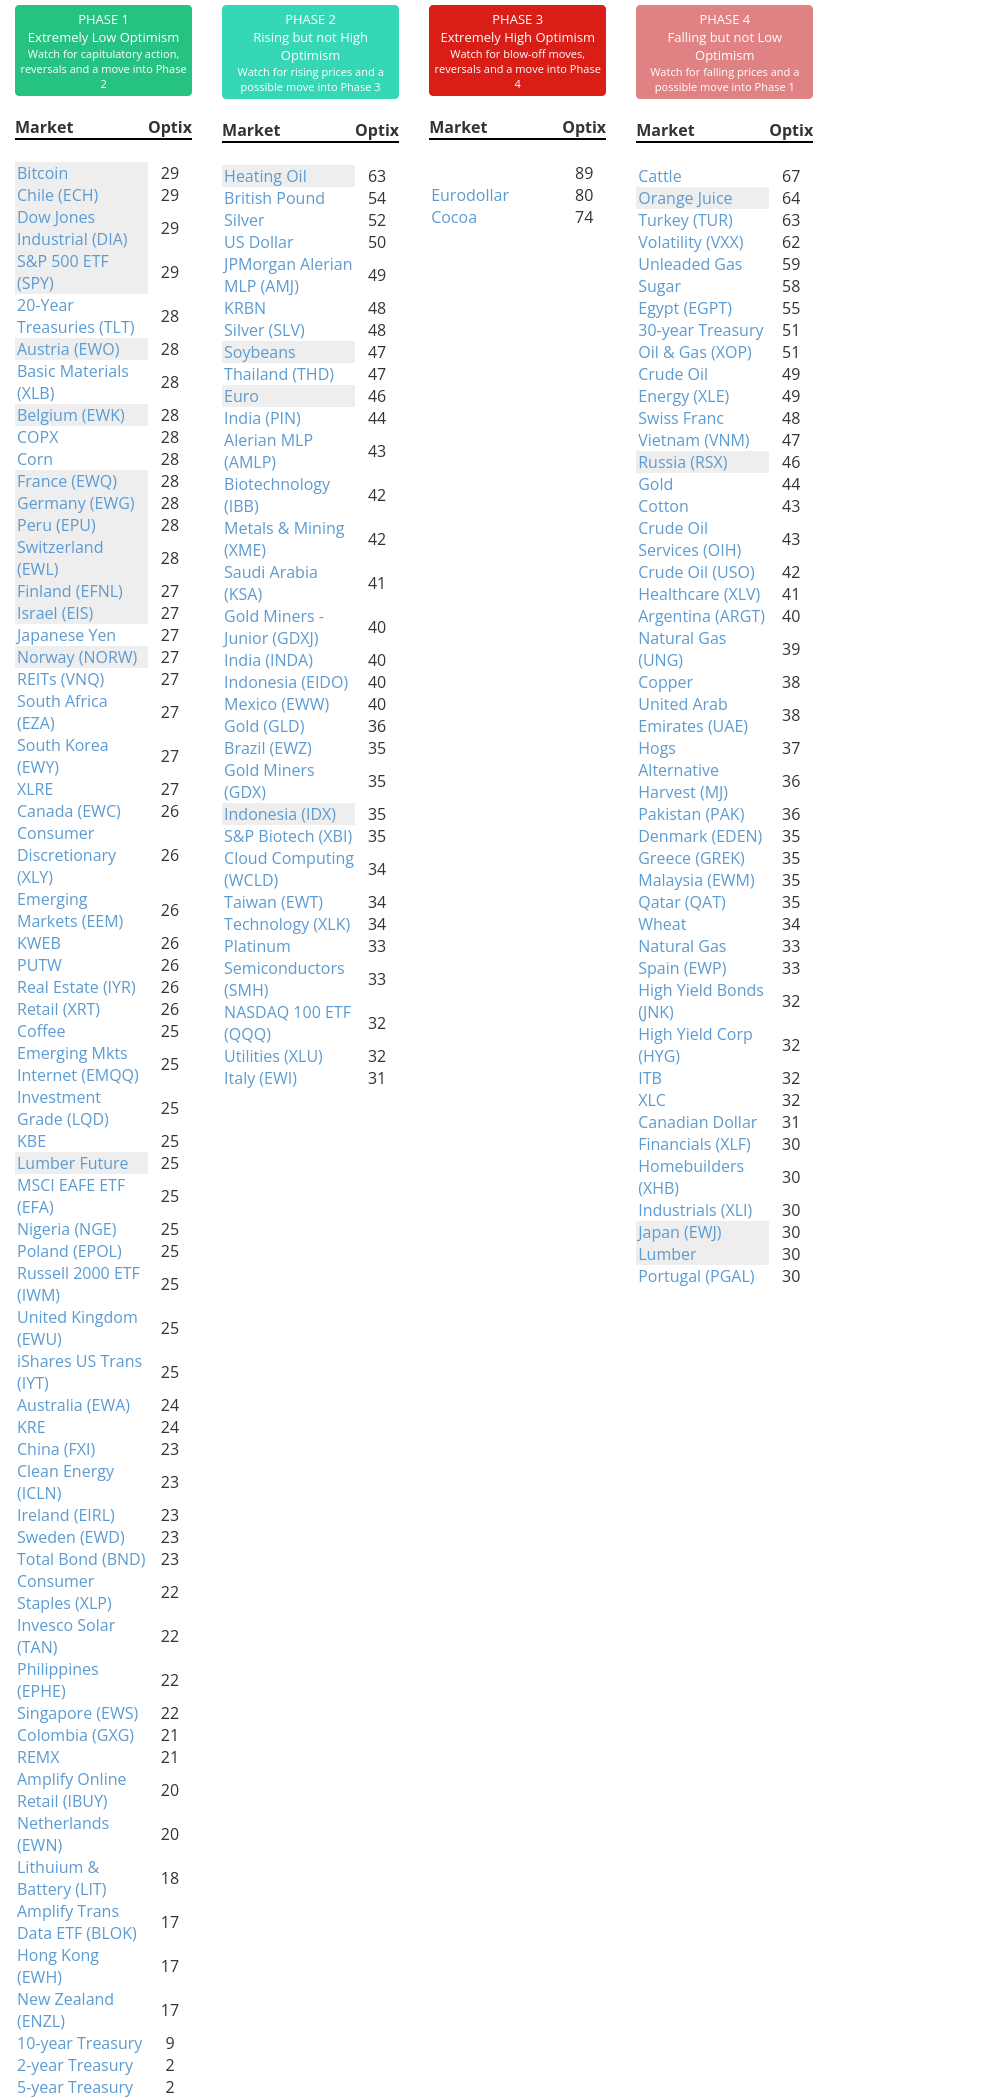
Indicators at Extremes
Phase Table
Ranks
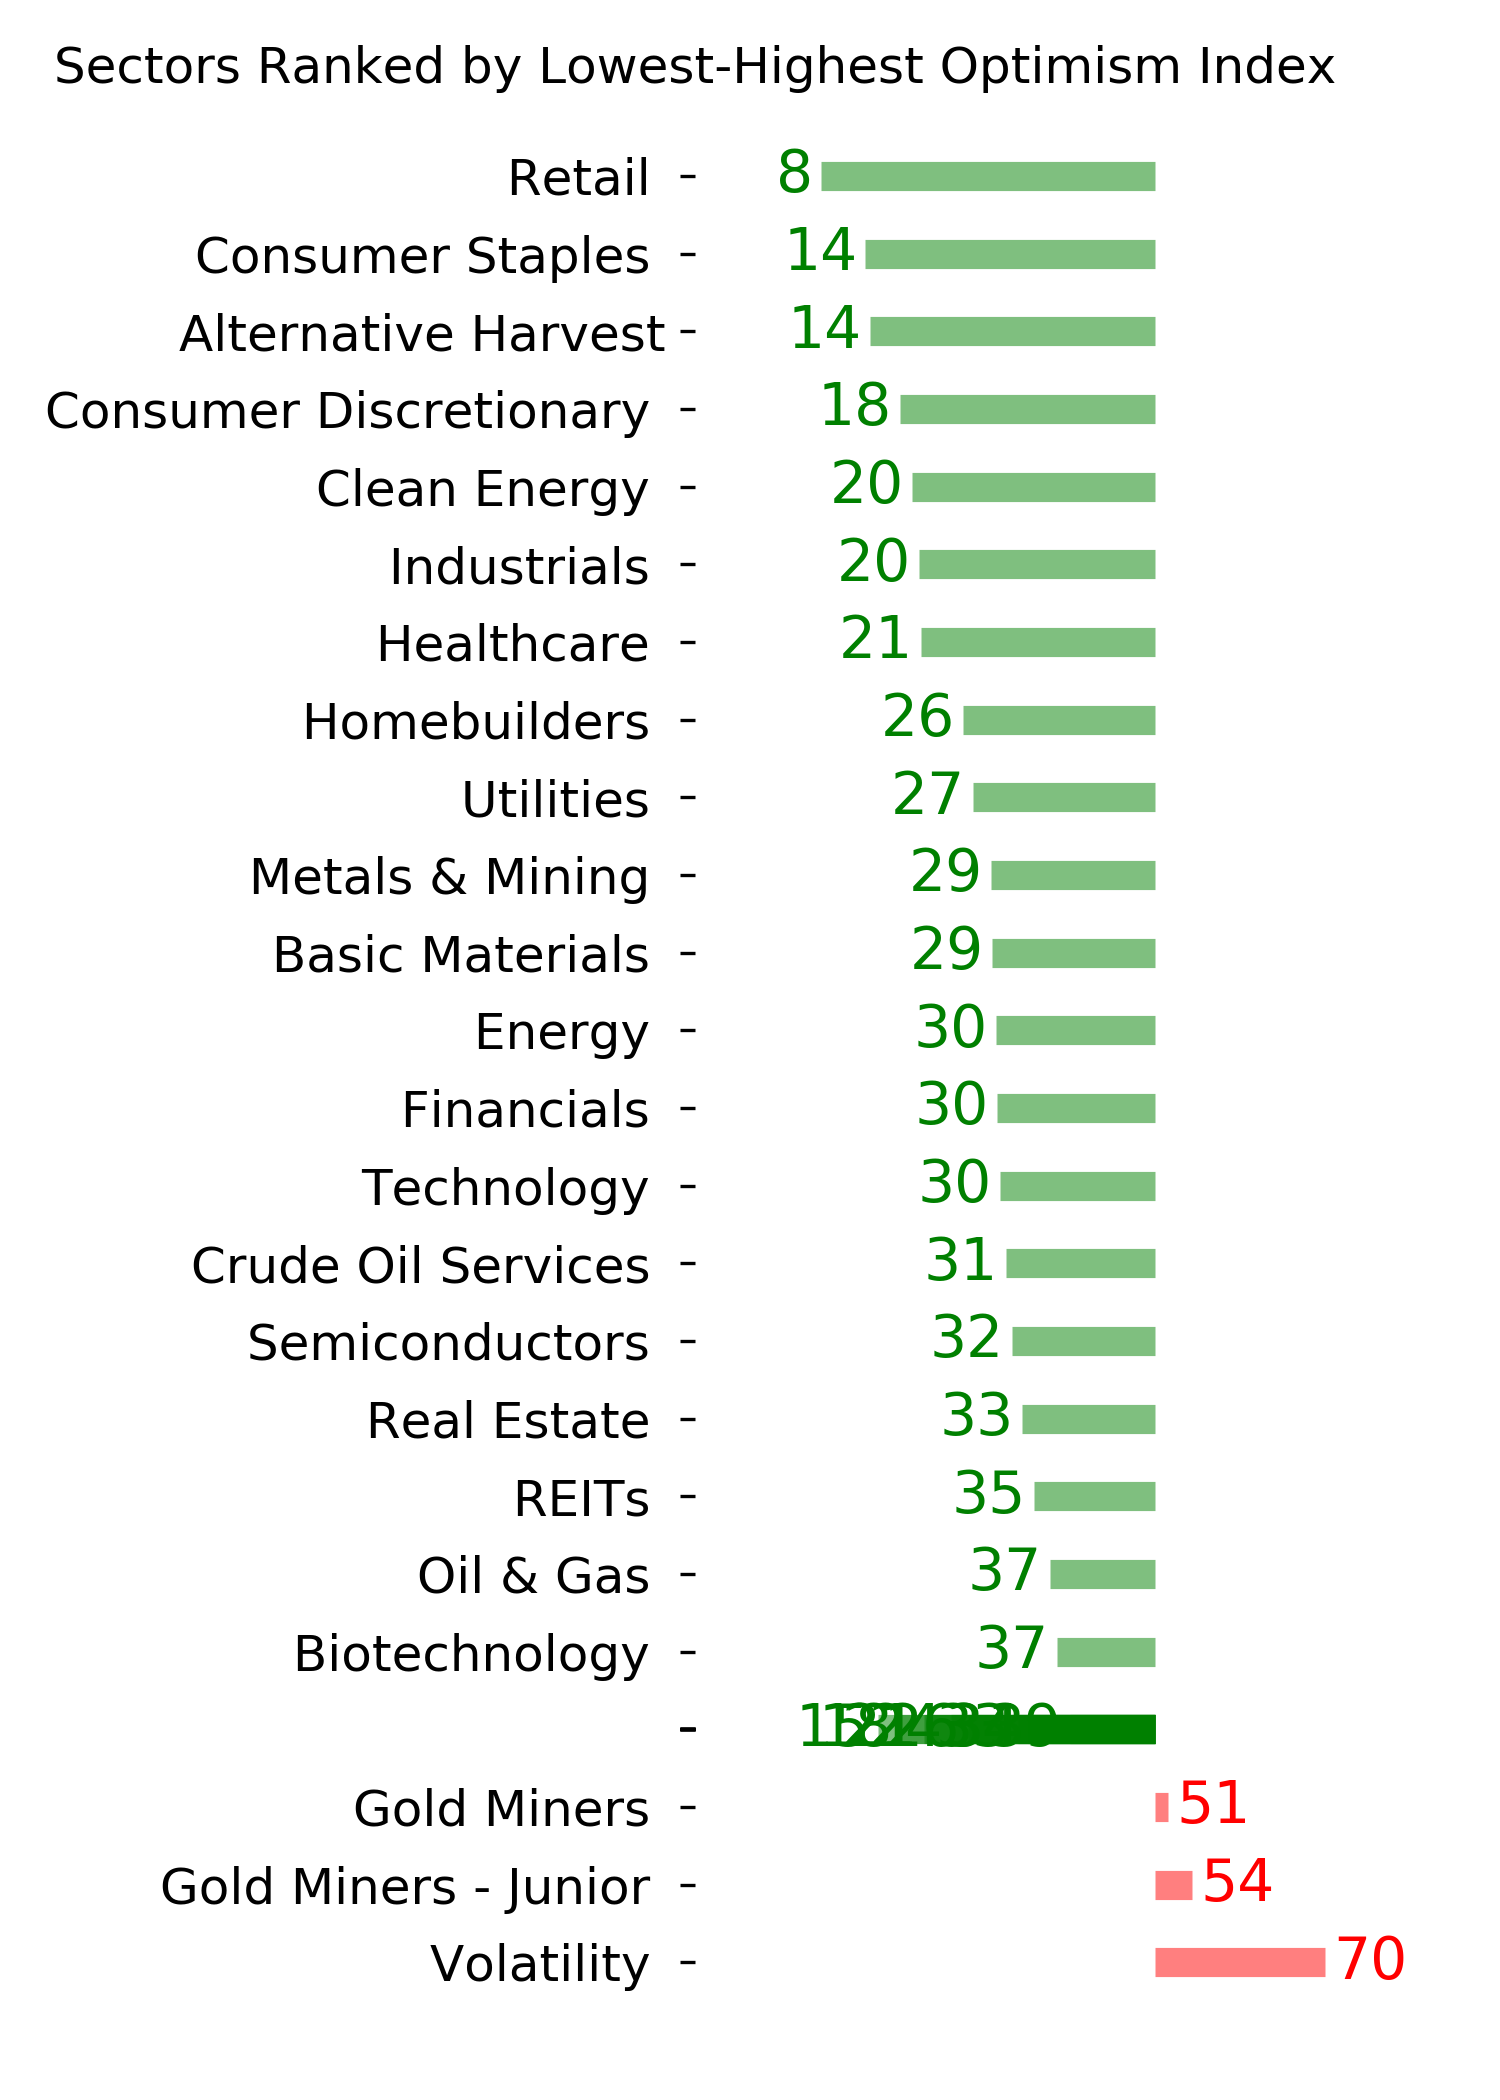
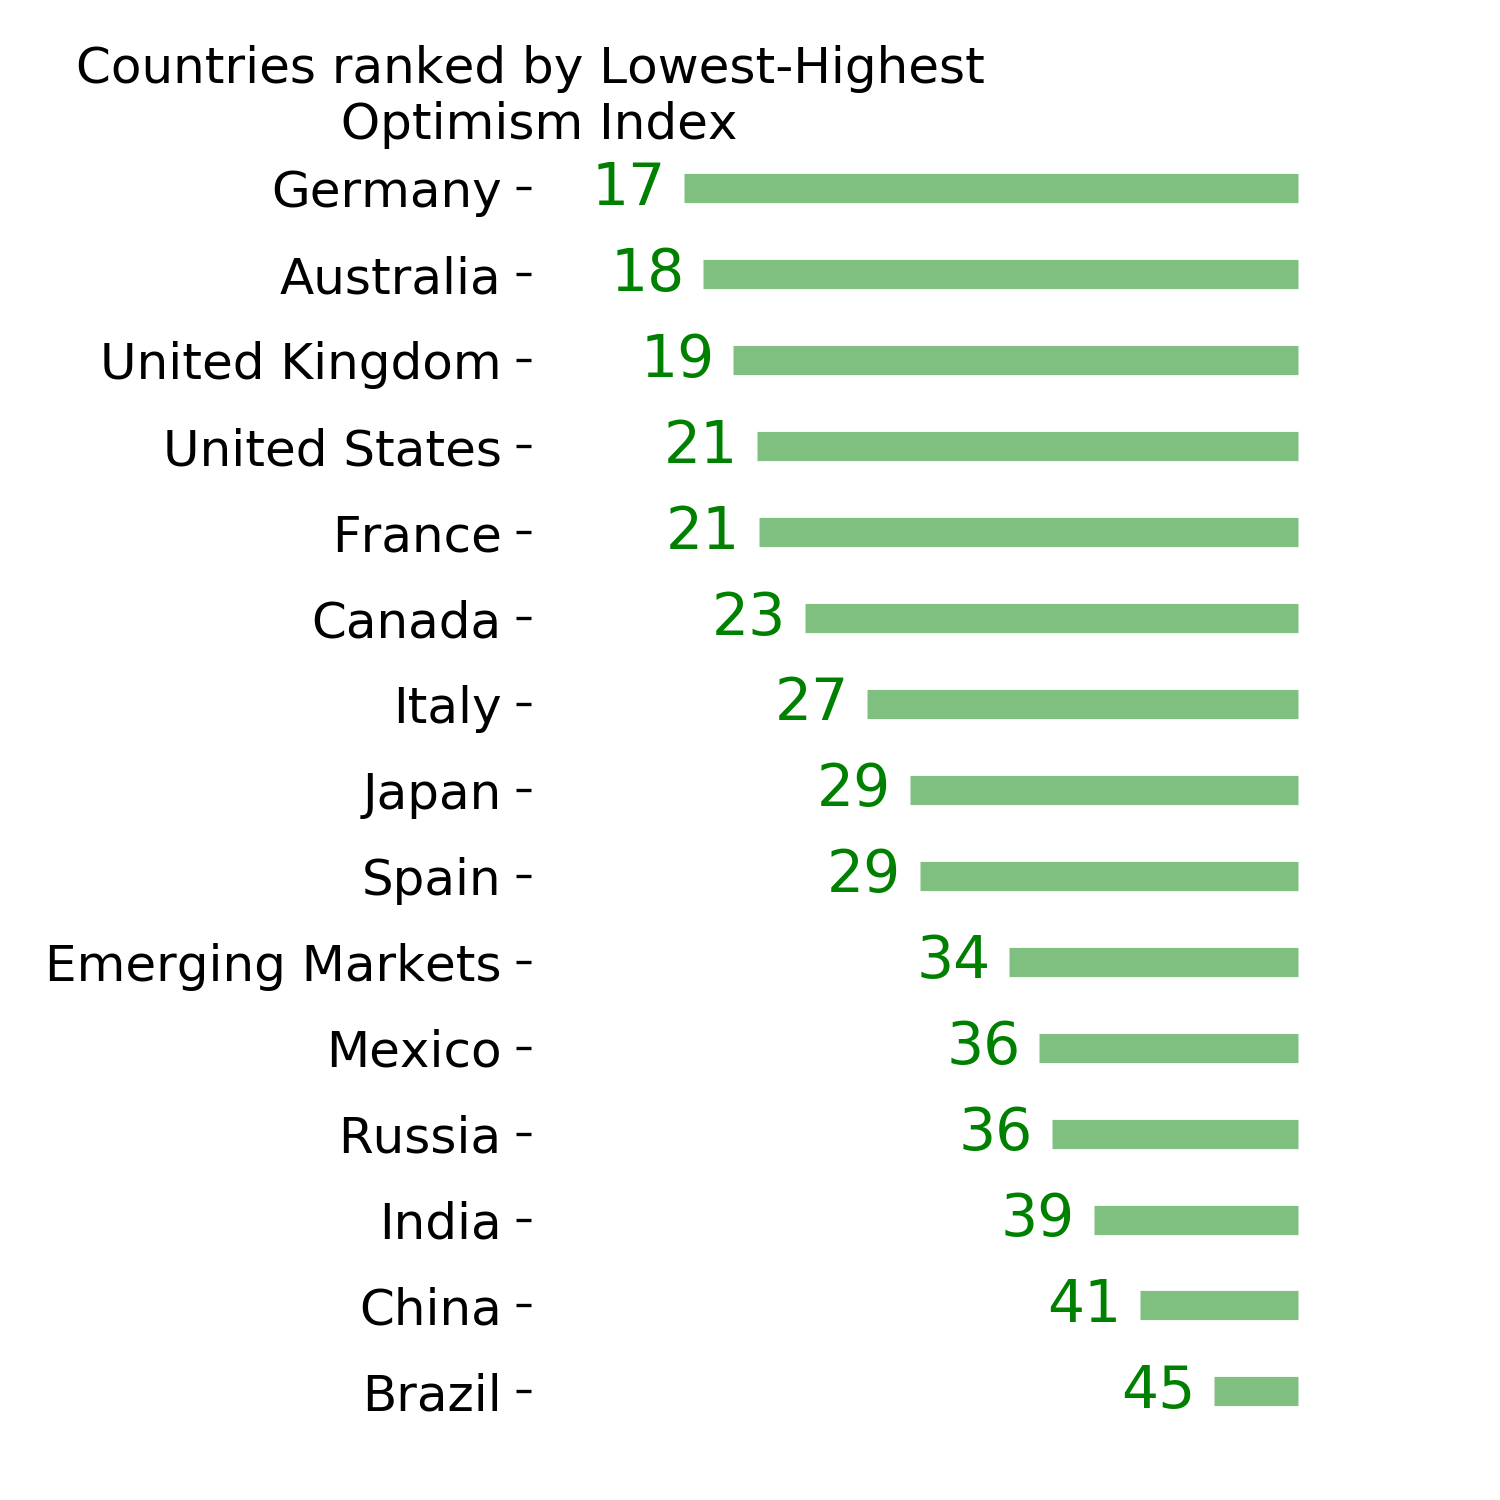
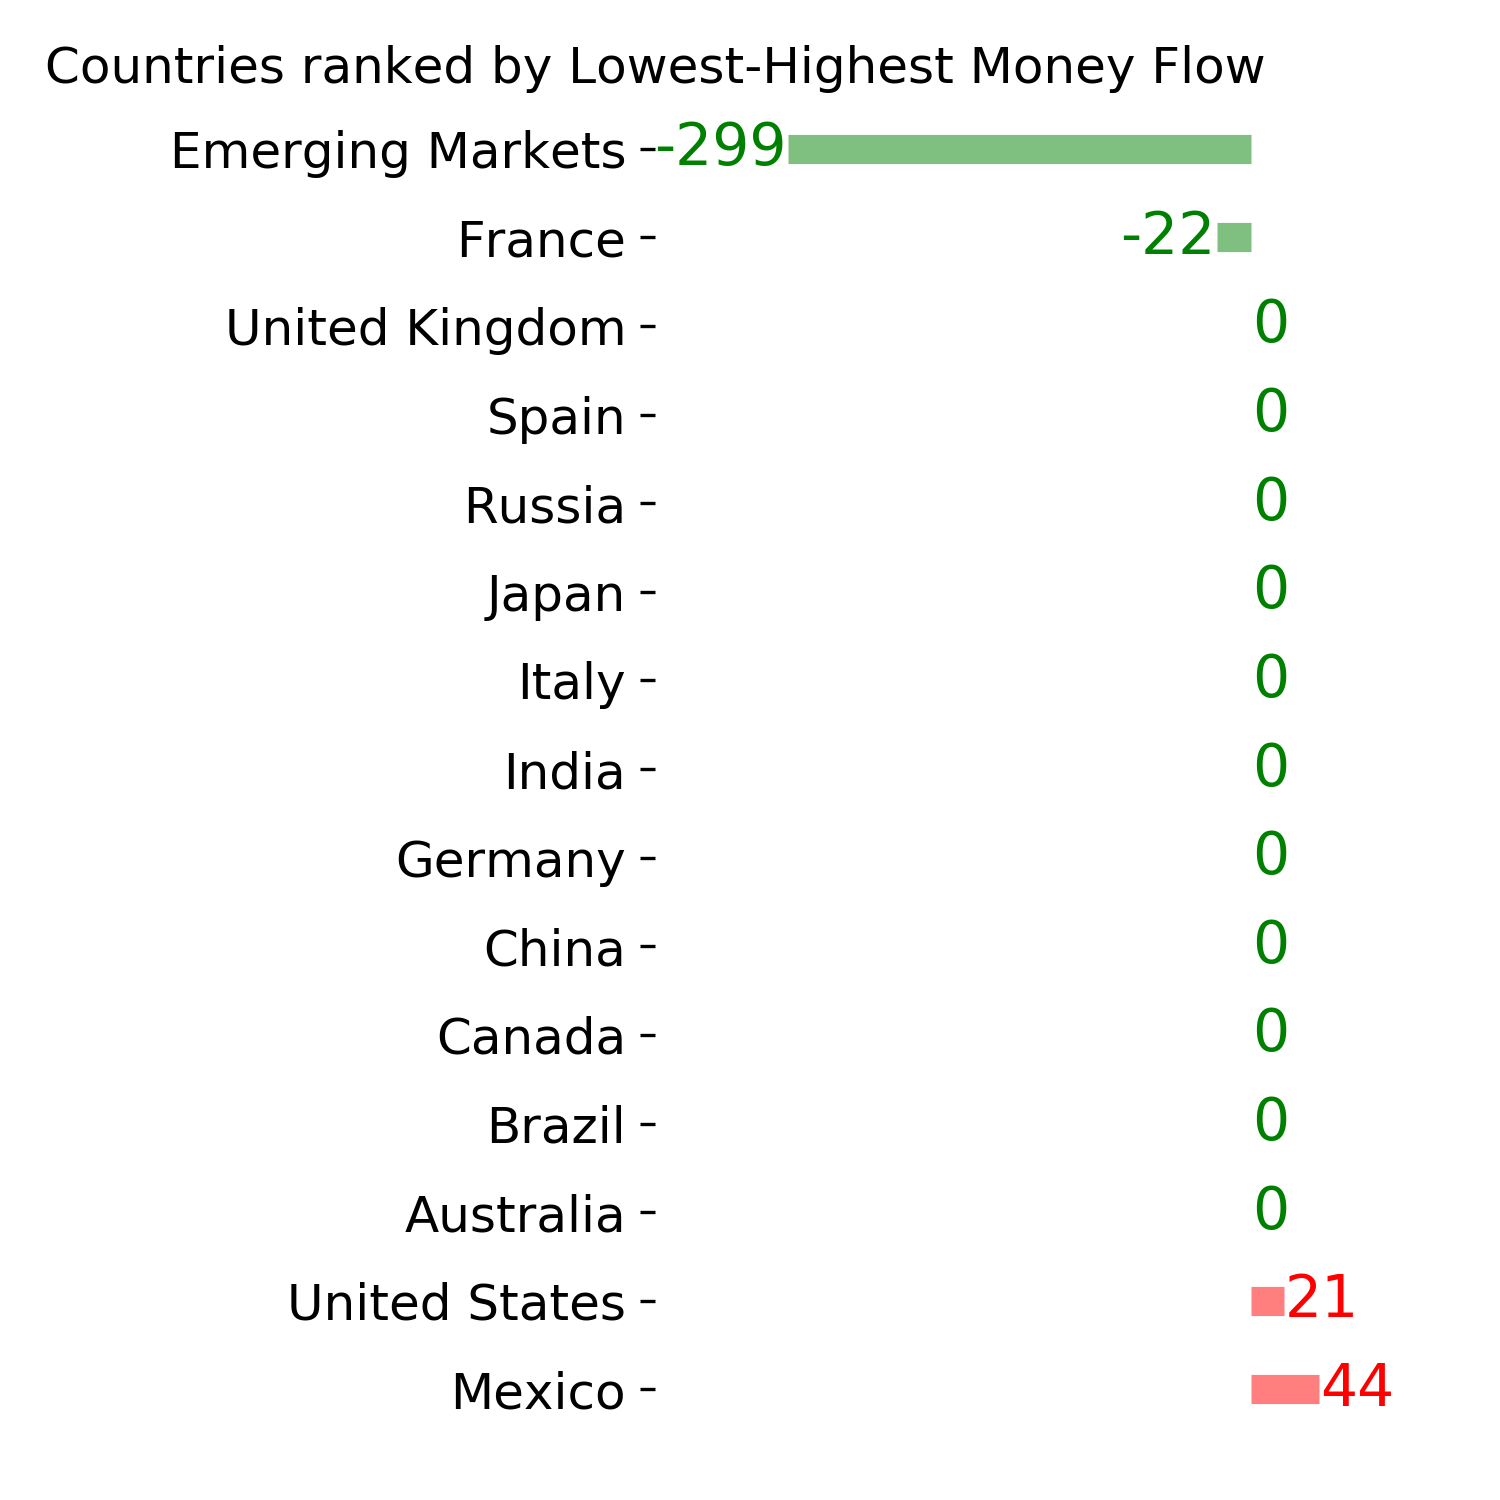
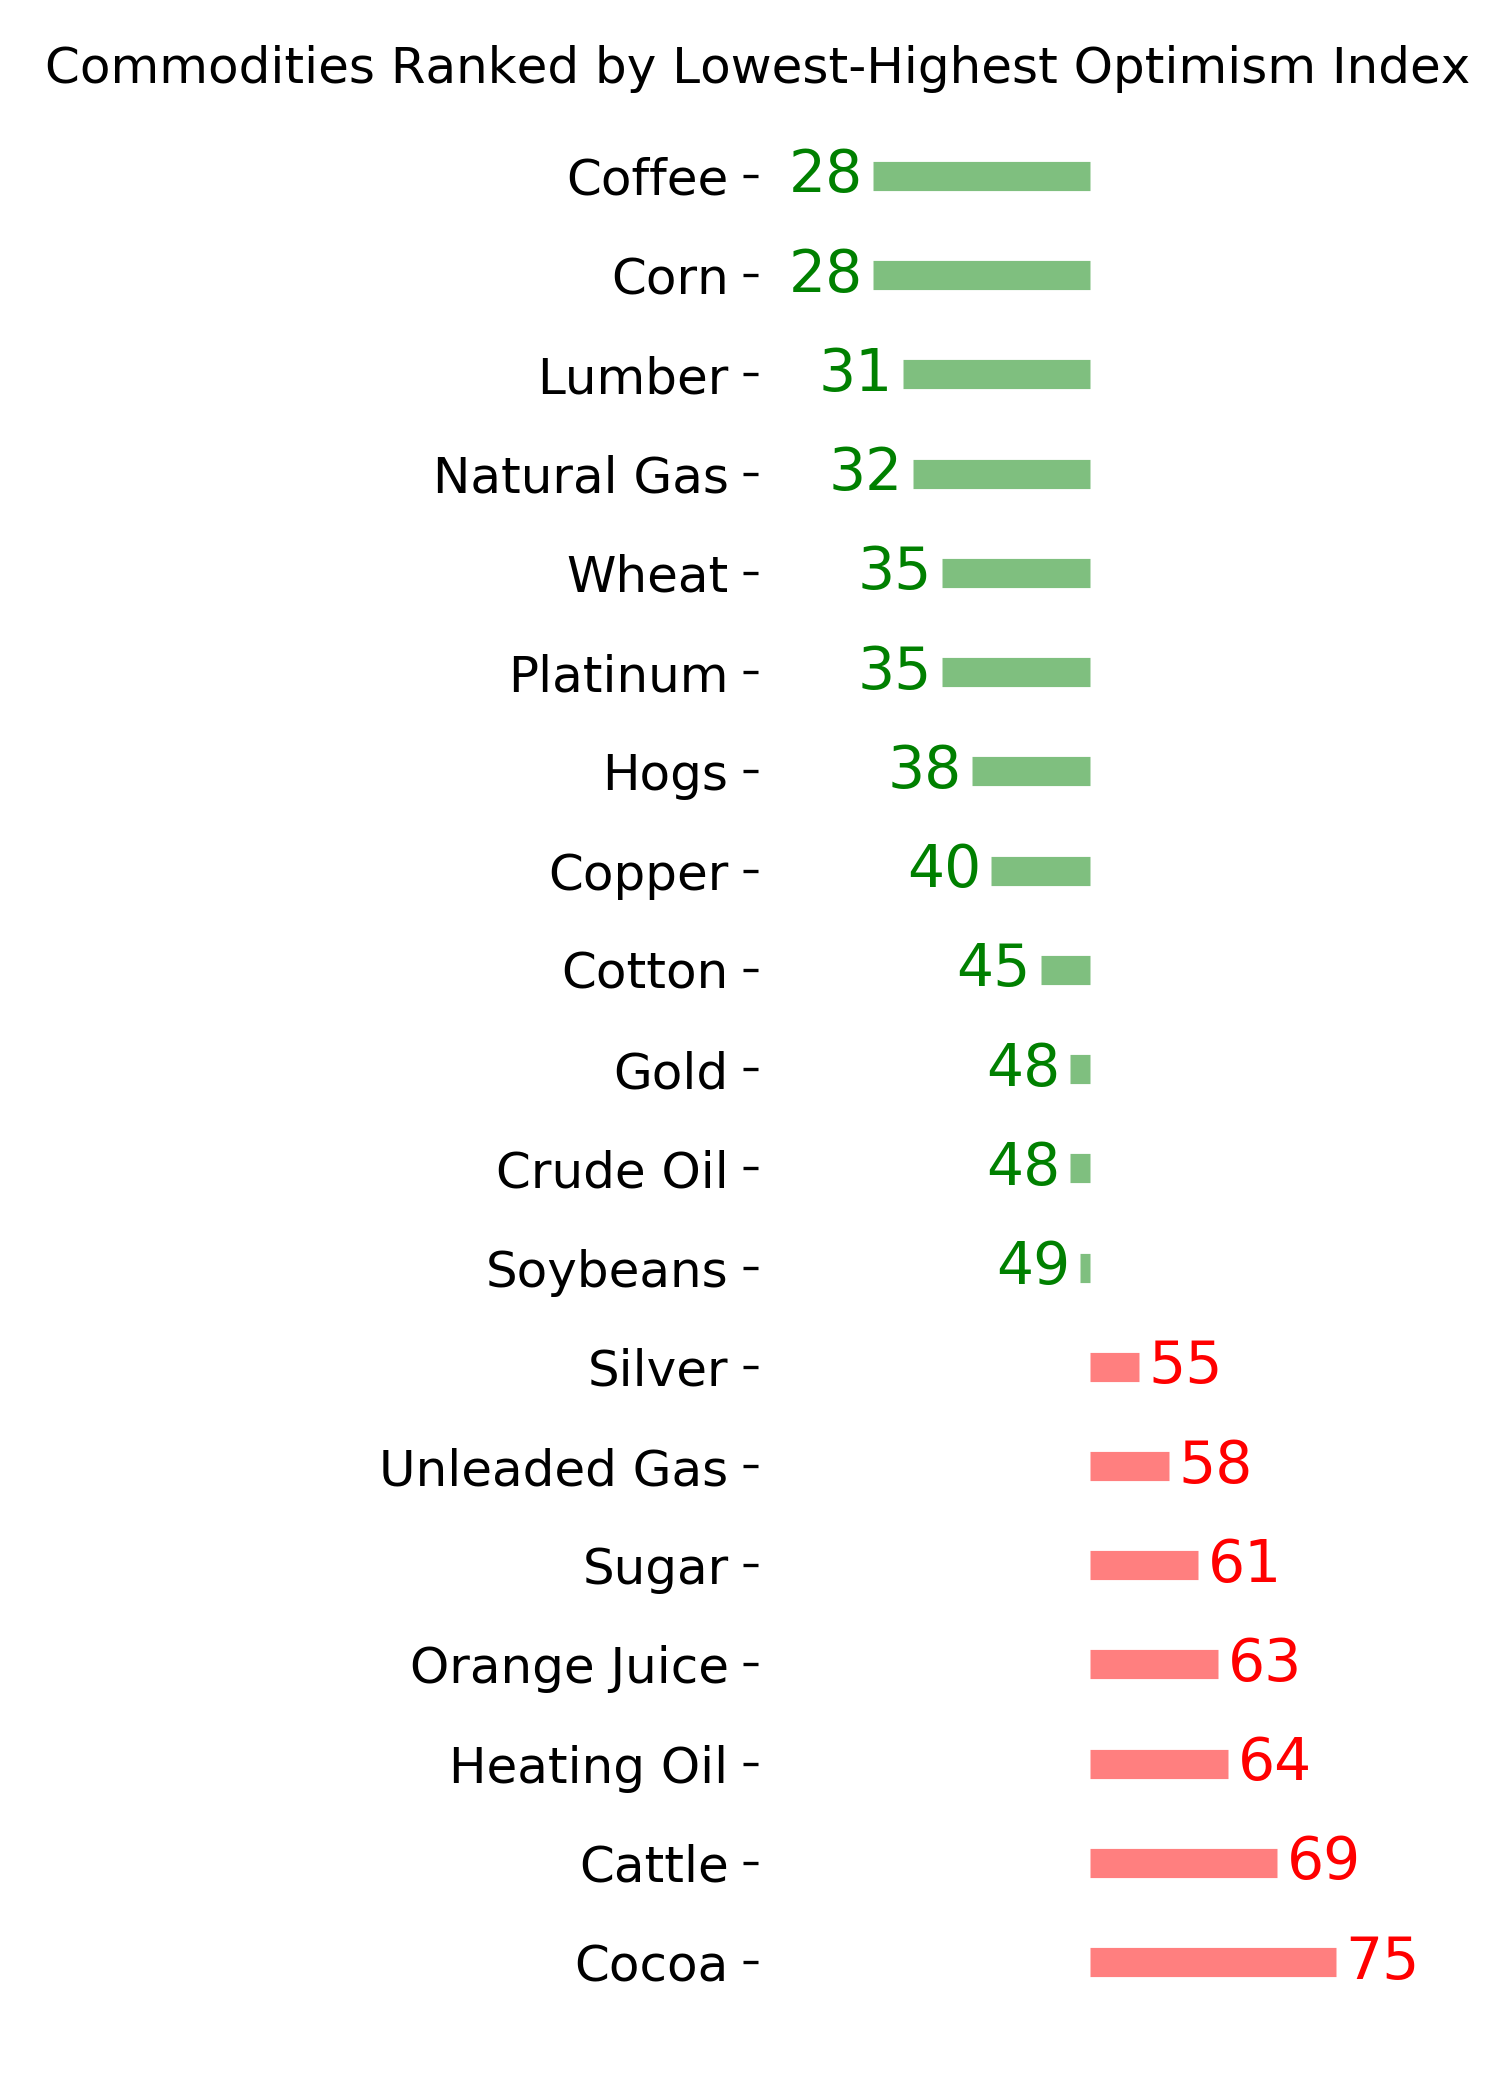
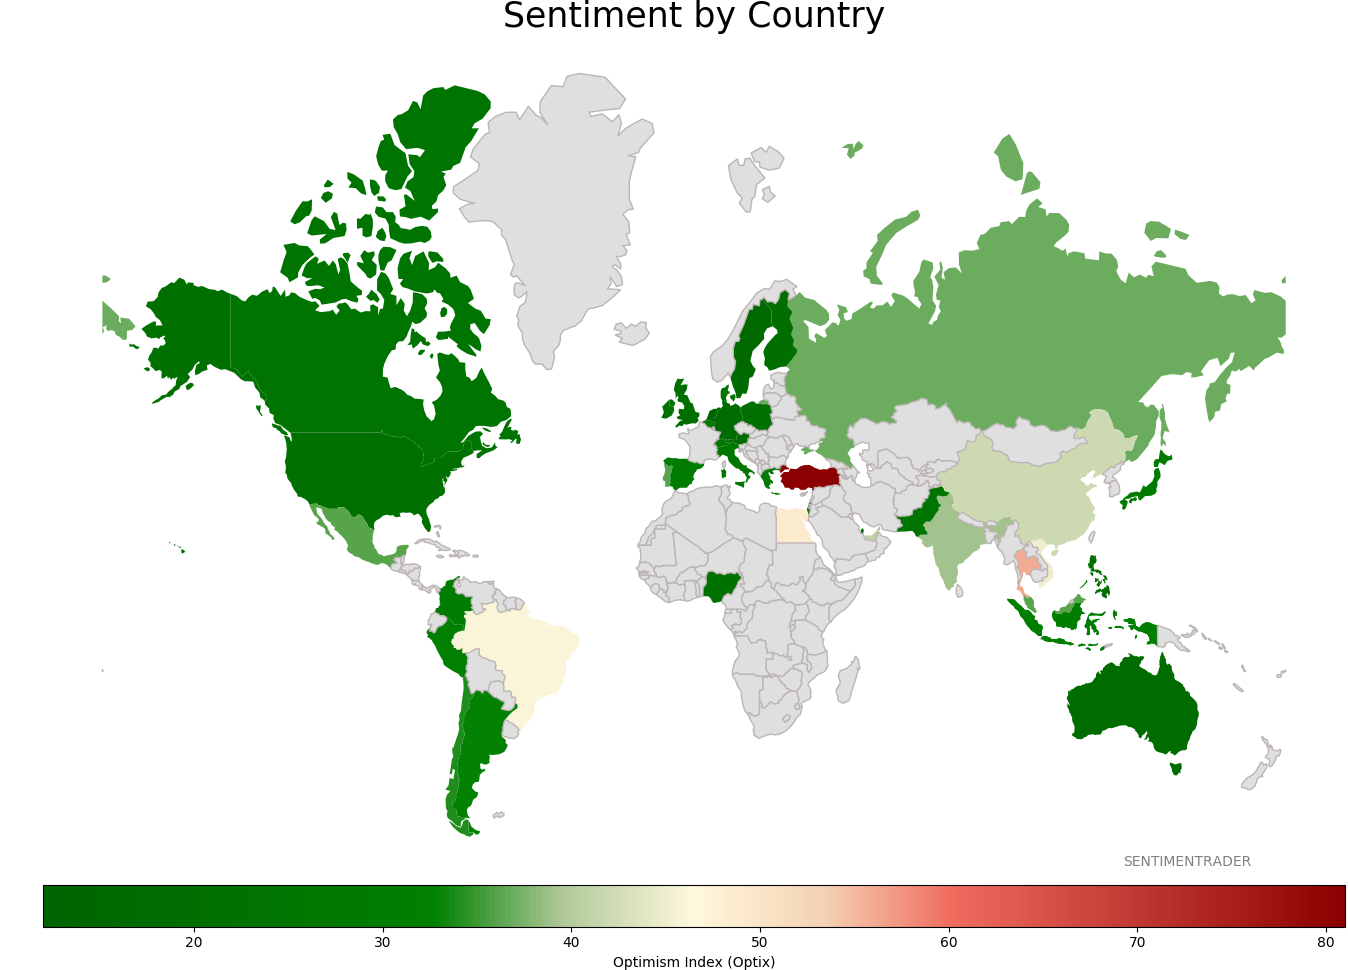
Sentiment Around The World
Optimism Index Thumbnails
|
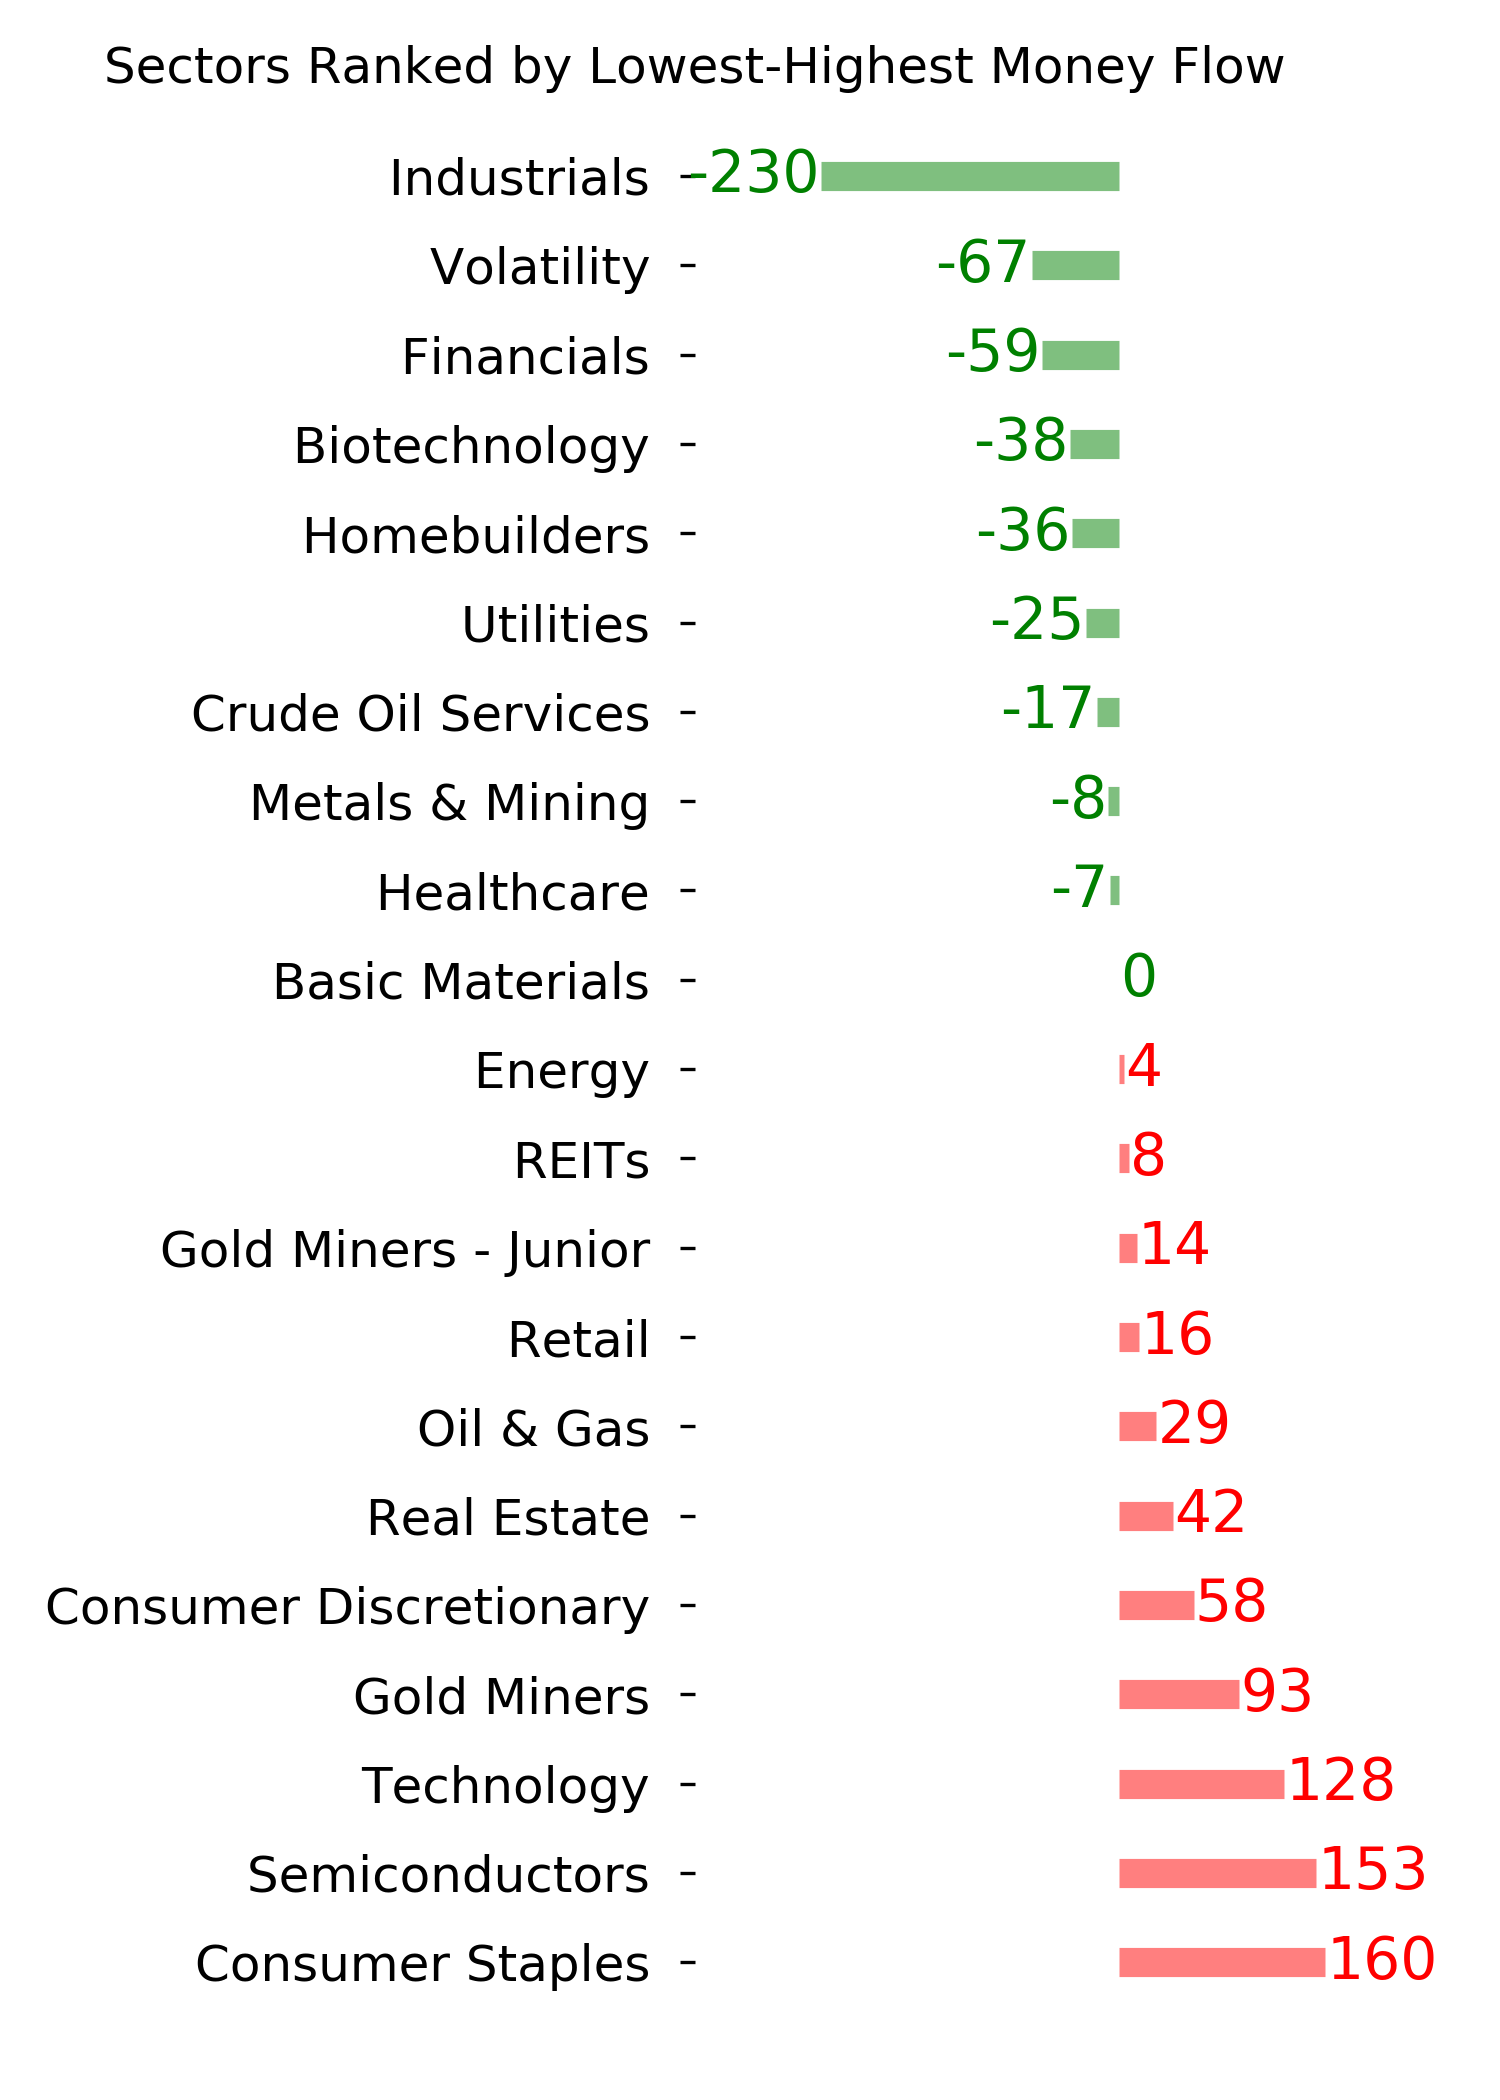
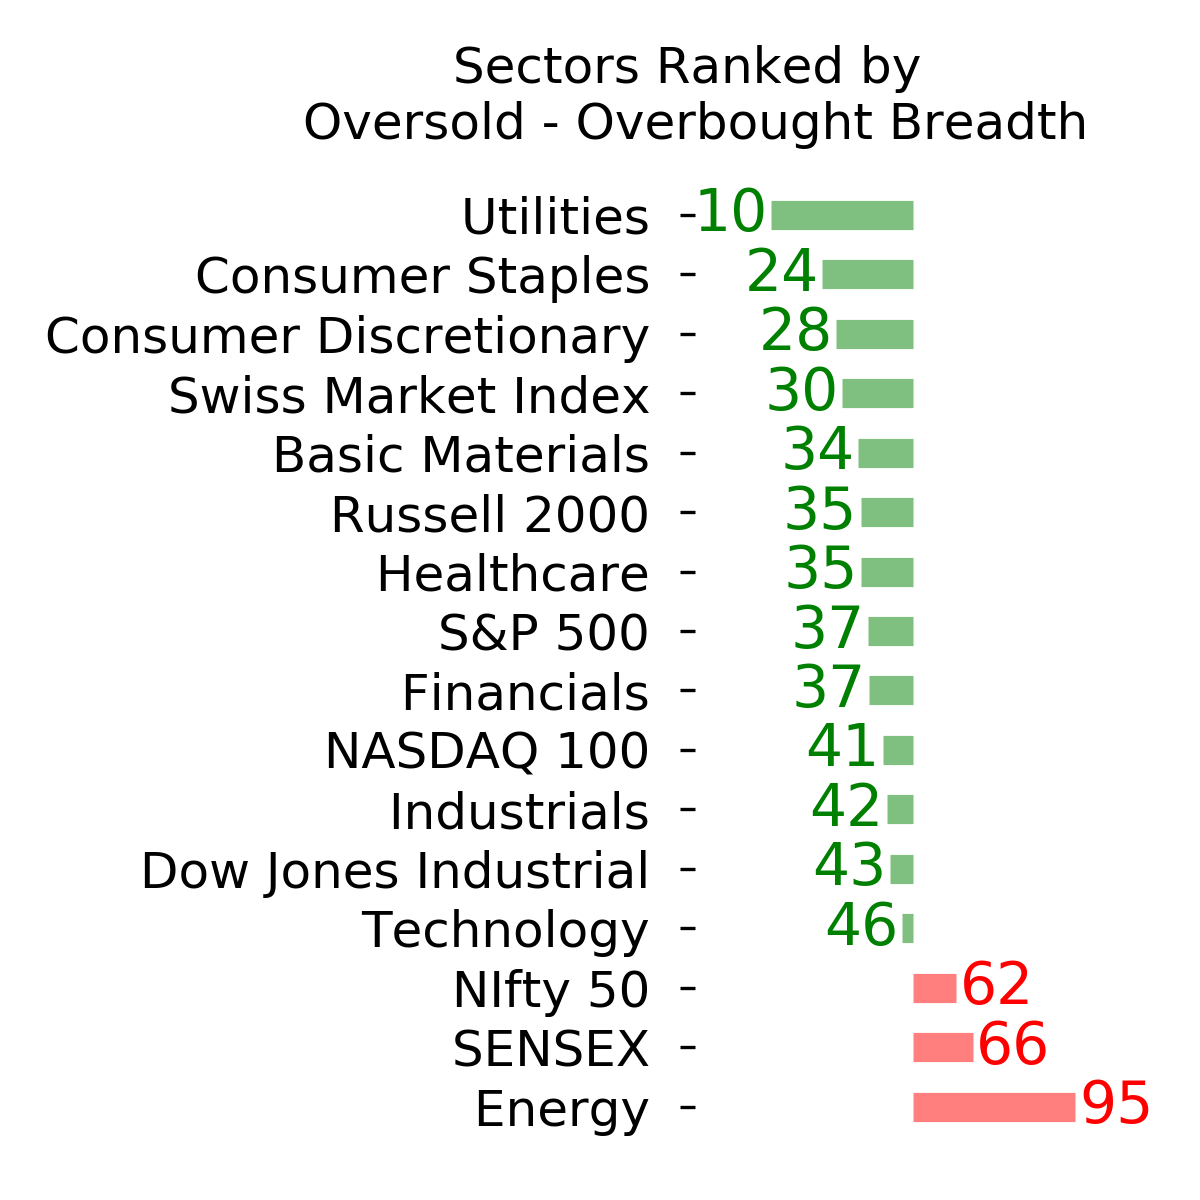
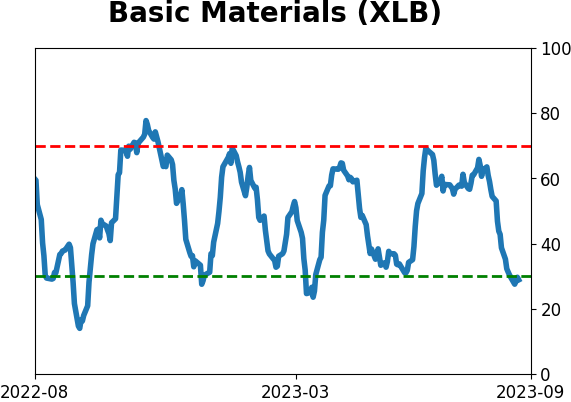
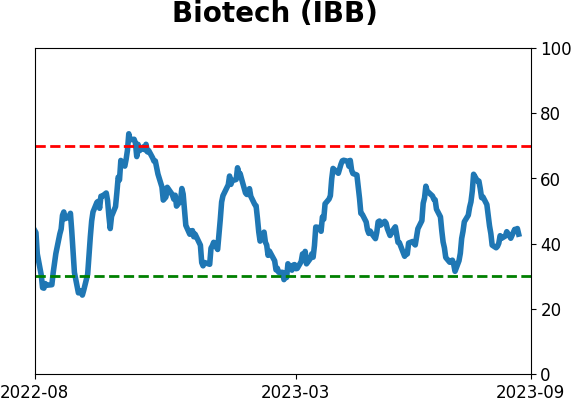
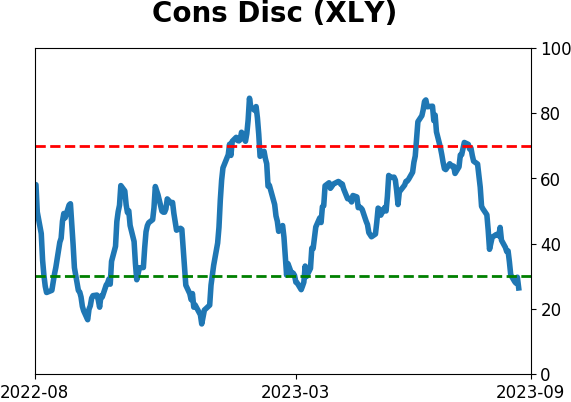
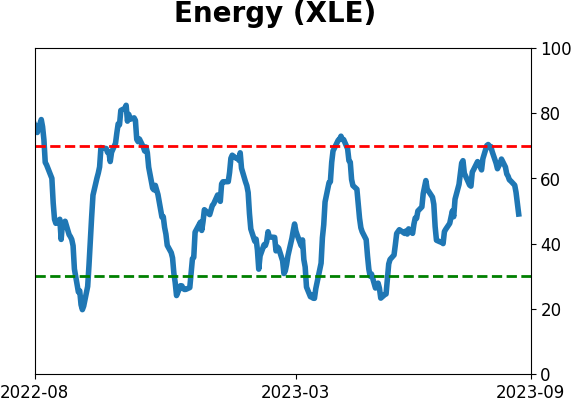
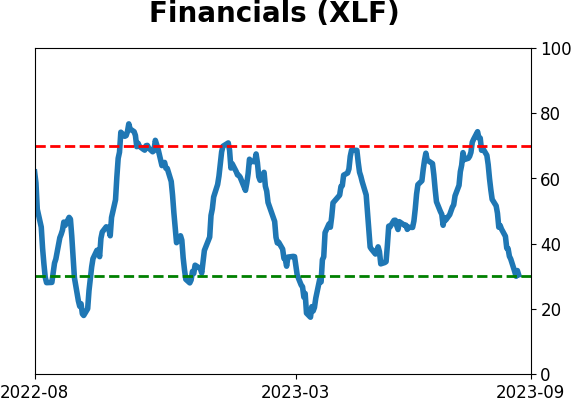
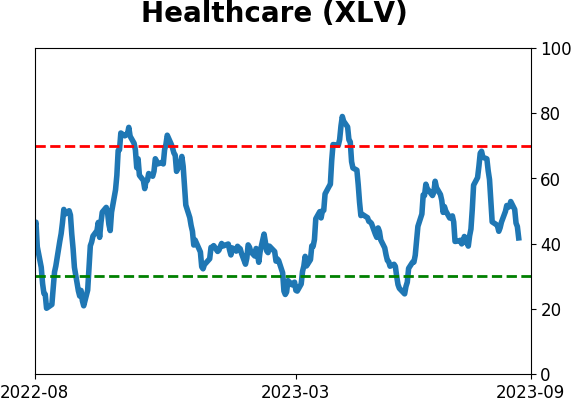
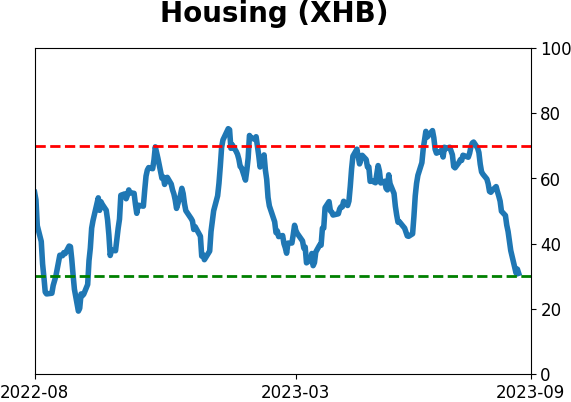
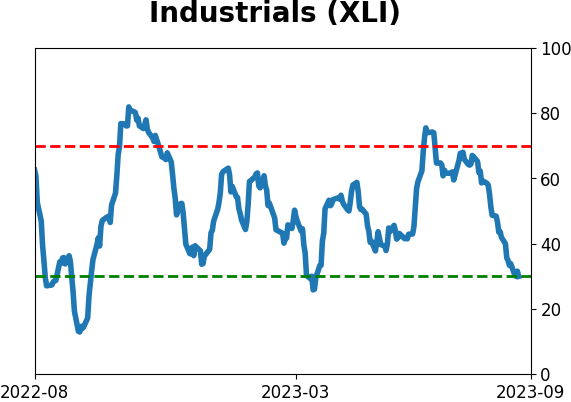
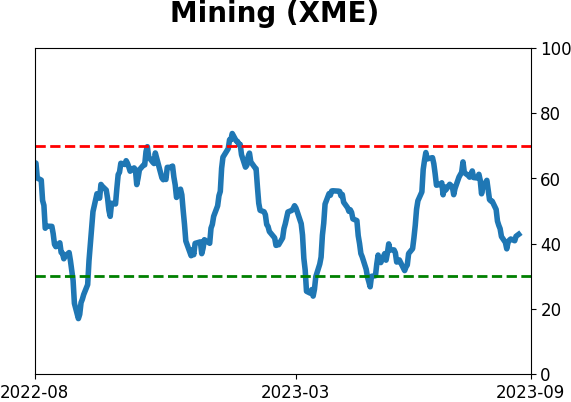
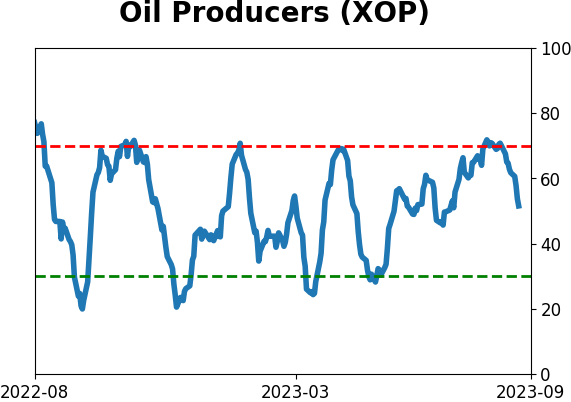
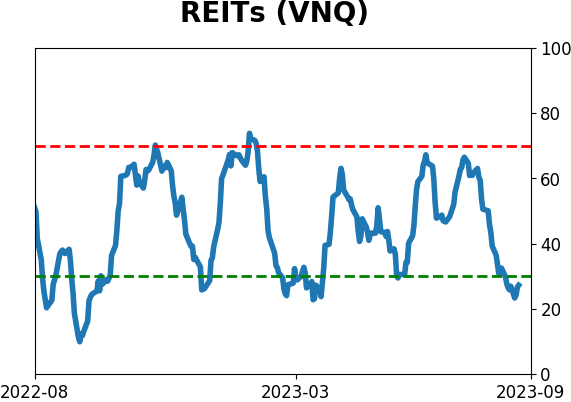
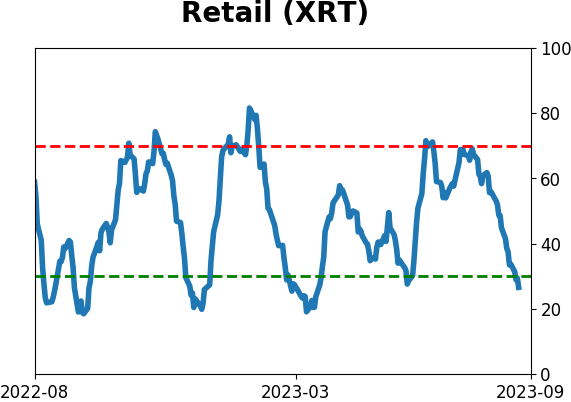
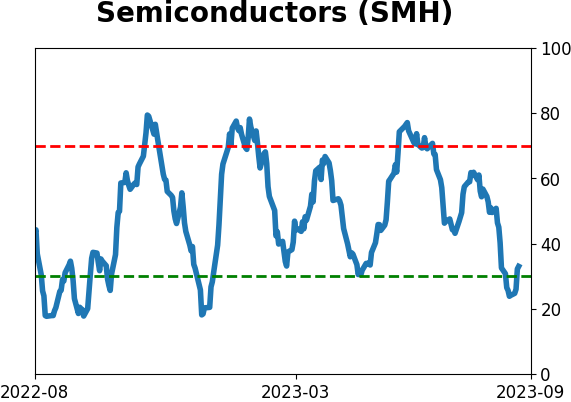
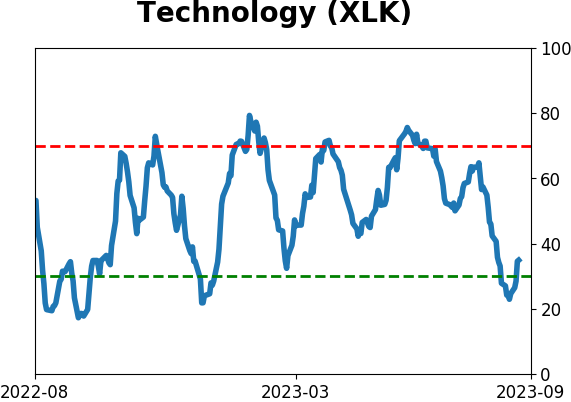
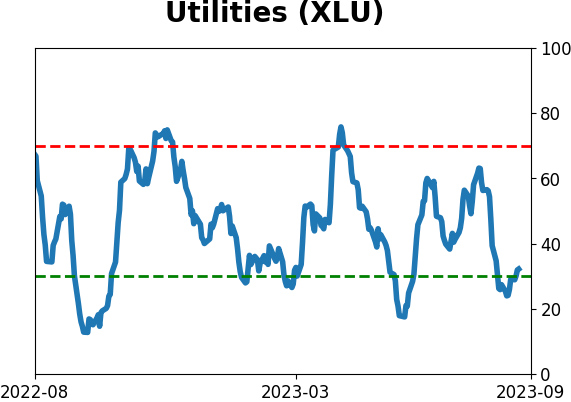
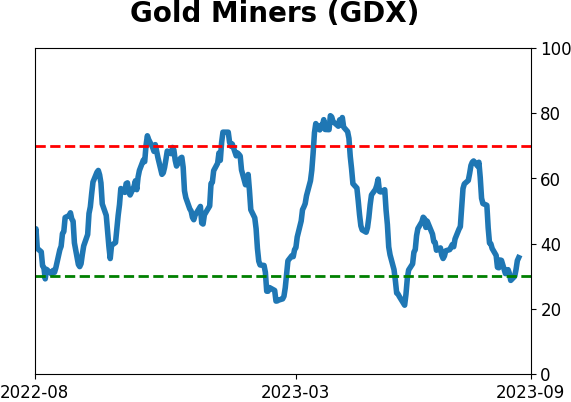
Sector ETF's - 10-Day Moving Average
|
|
|
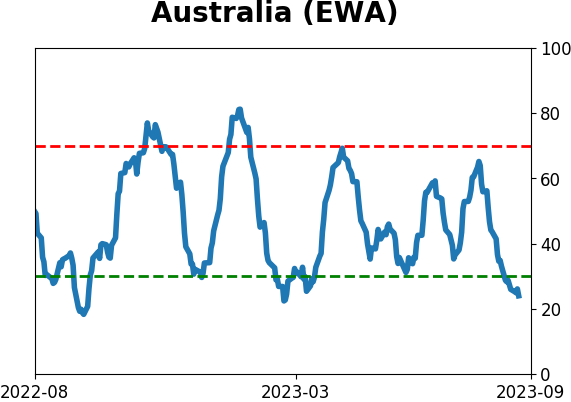
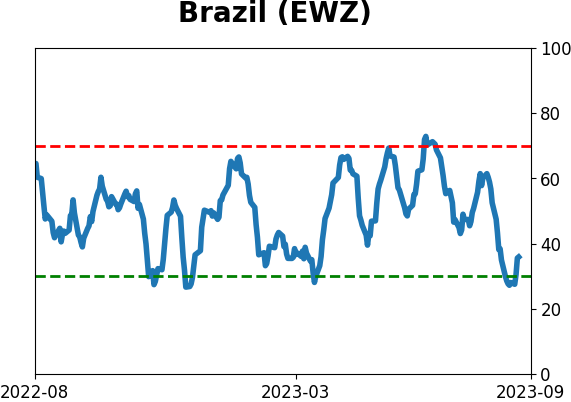
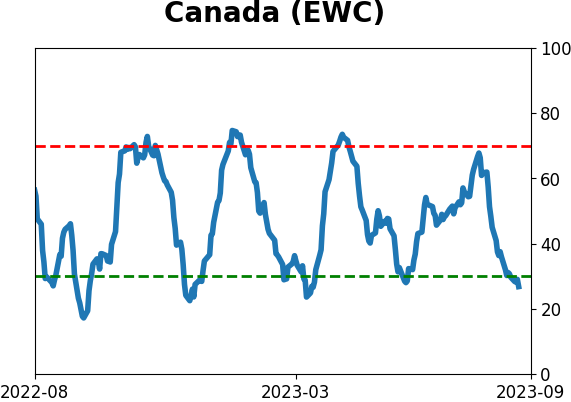
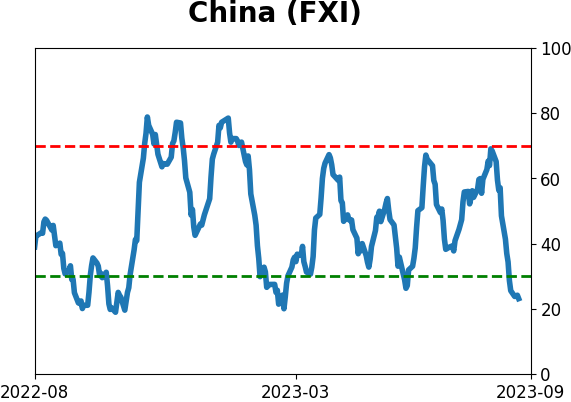
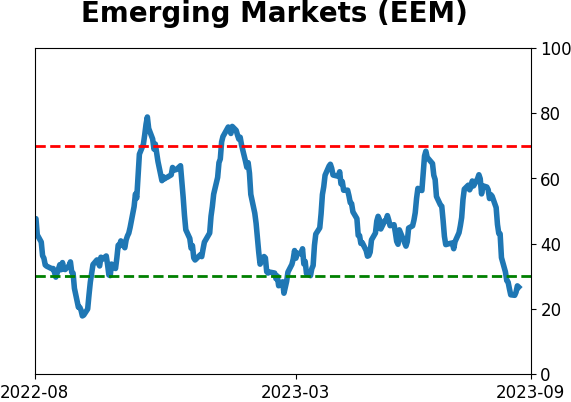
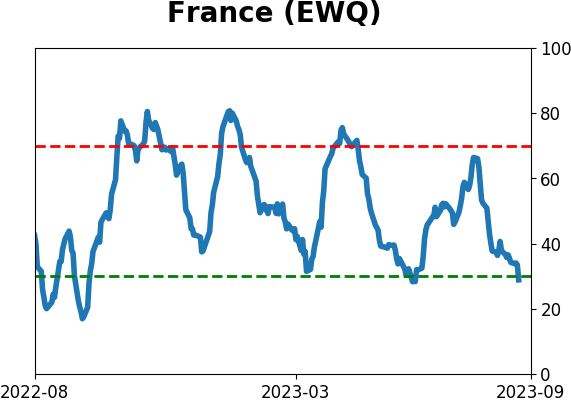
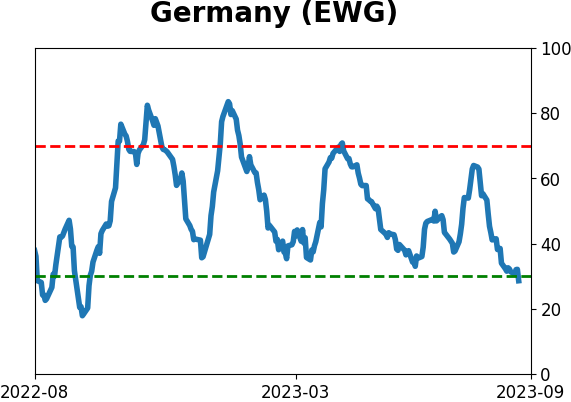
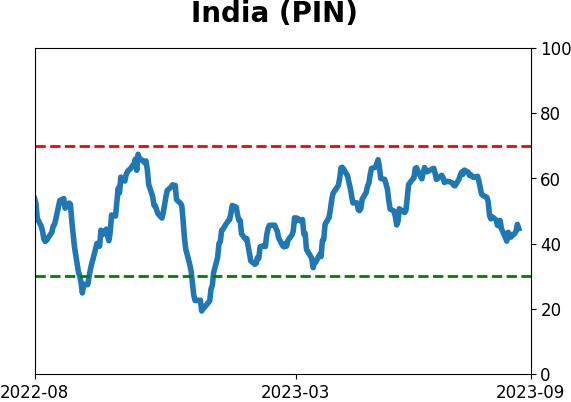
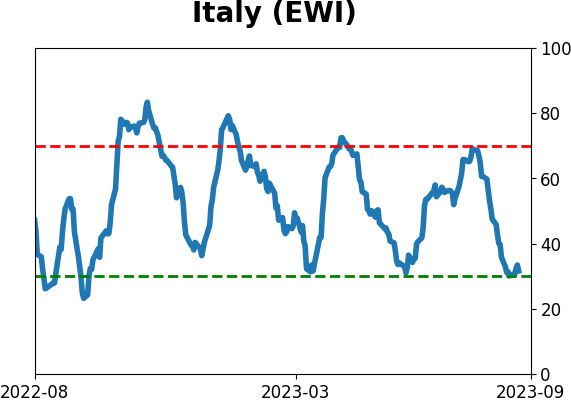
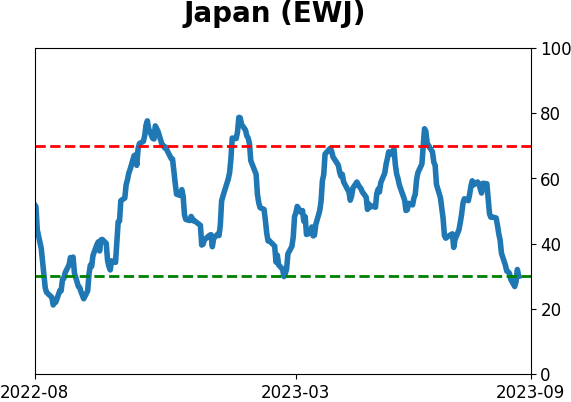
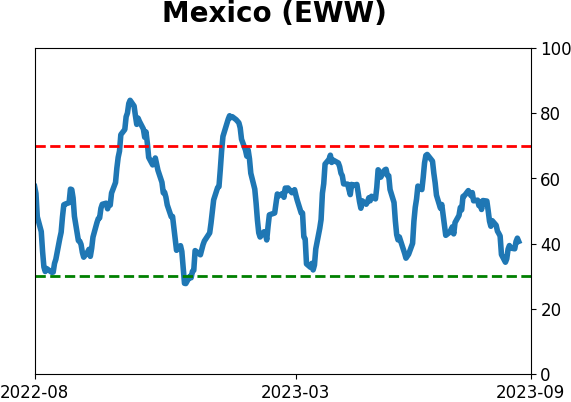
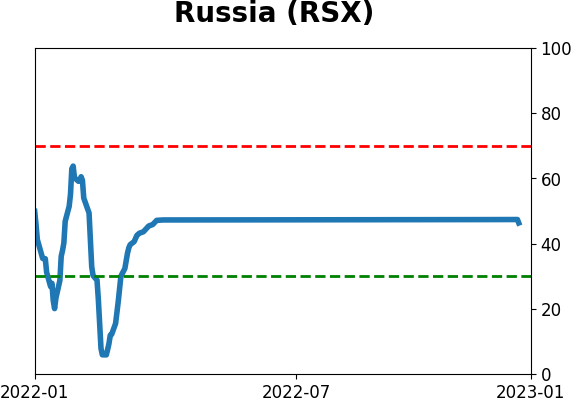
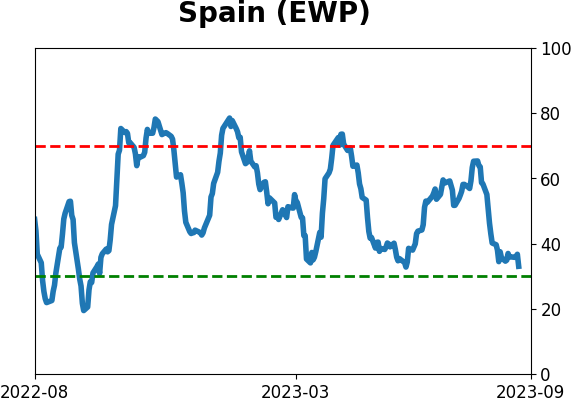
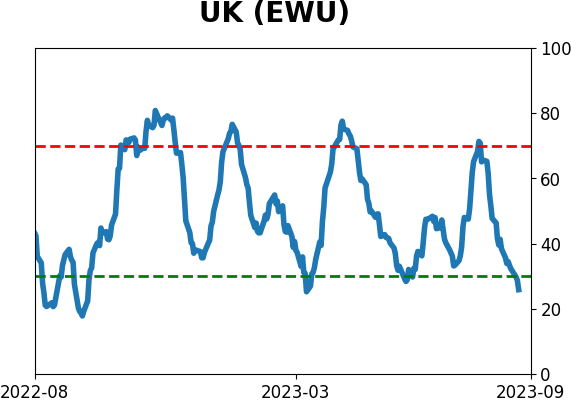
Country ETF's - 10-Day Moving Average
|
|
|
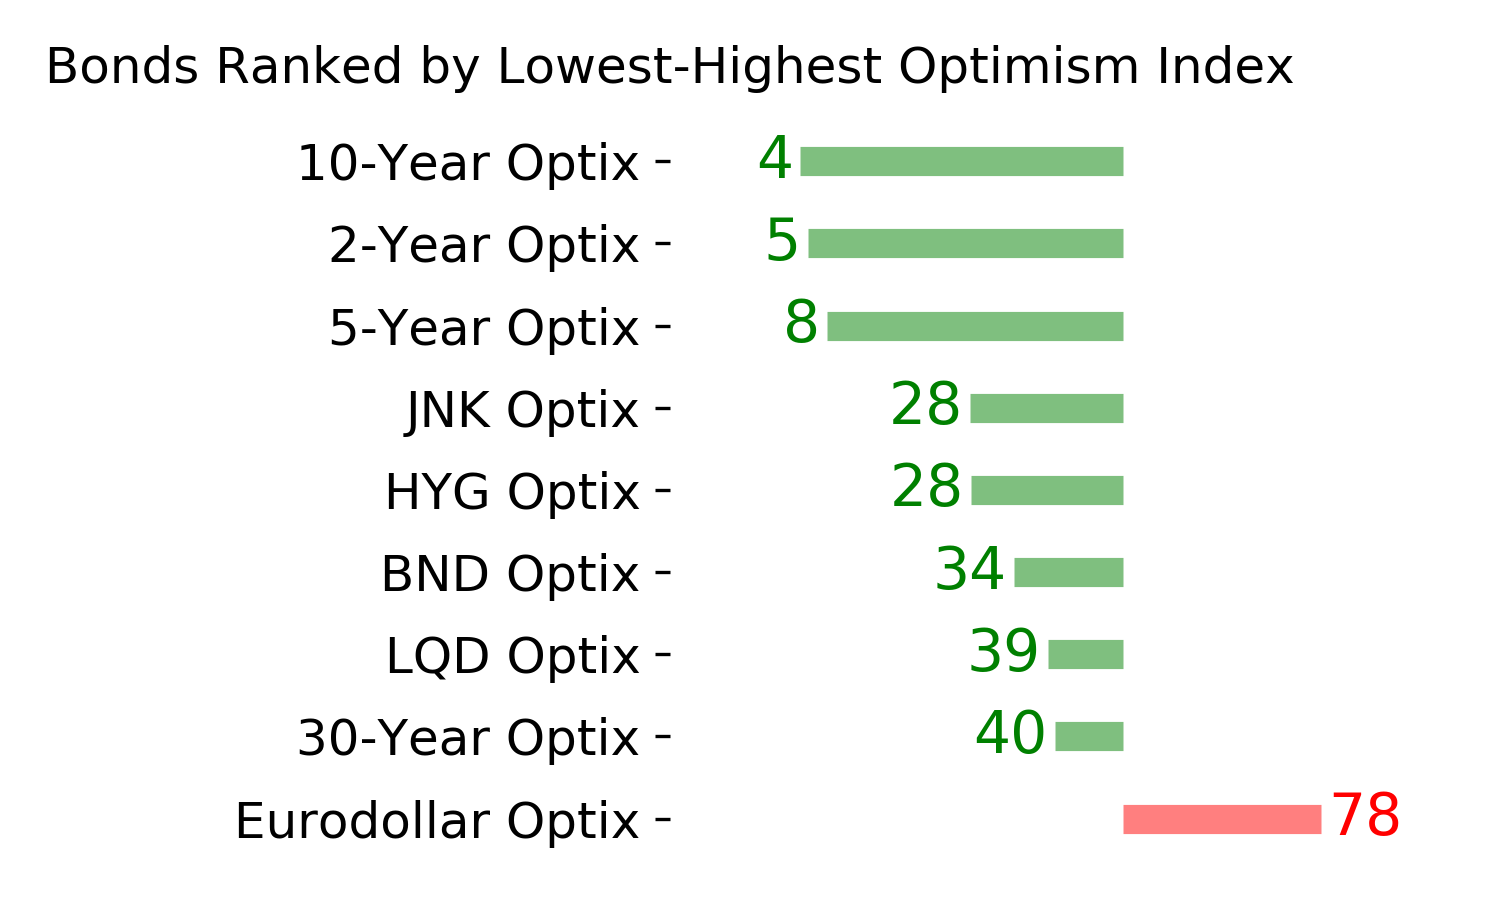
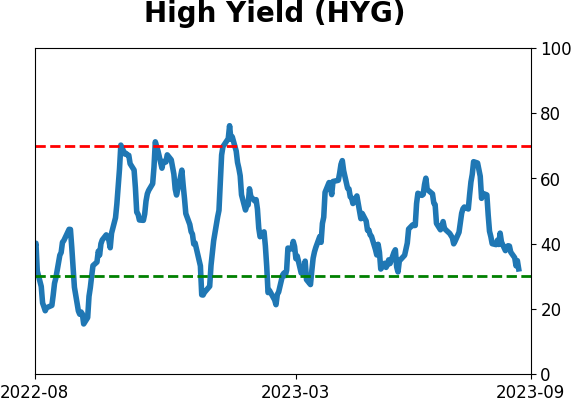
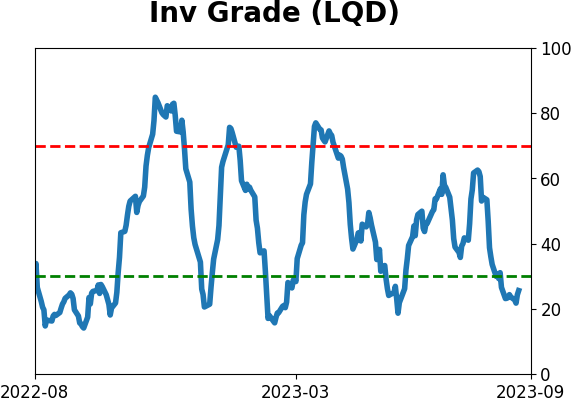
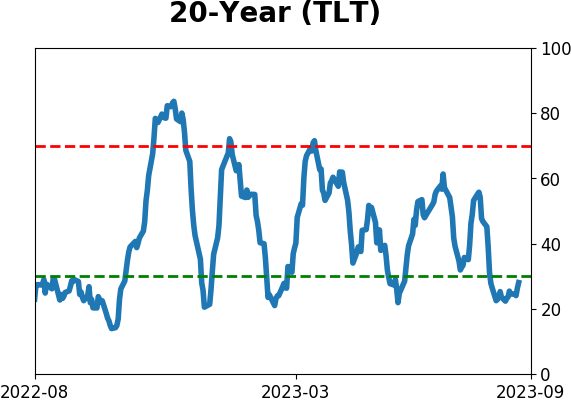
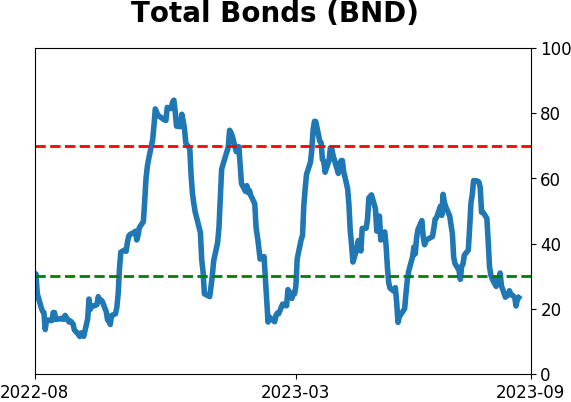
Bond ETF's - 10-Day Moving Average
|
|
|
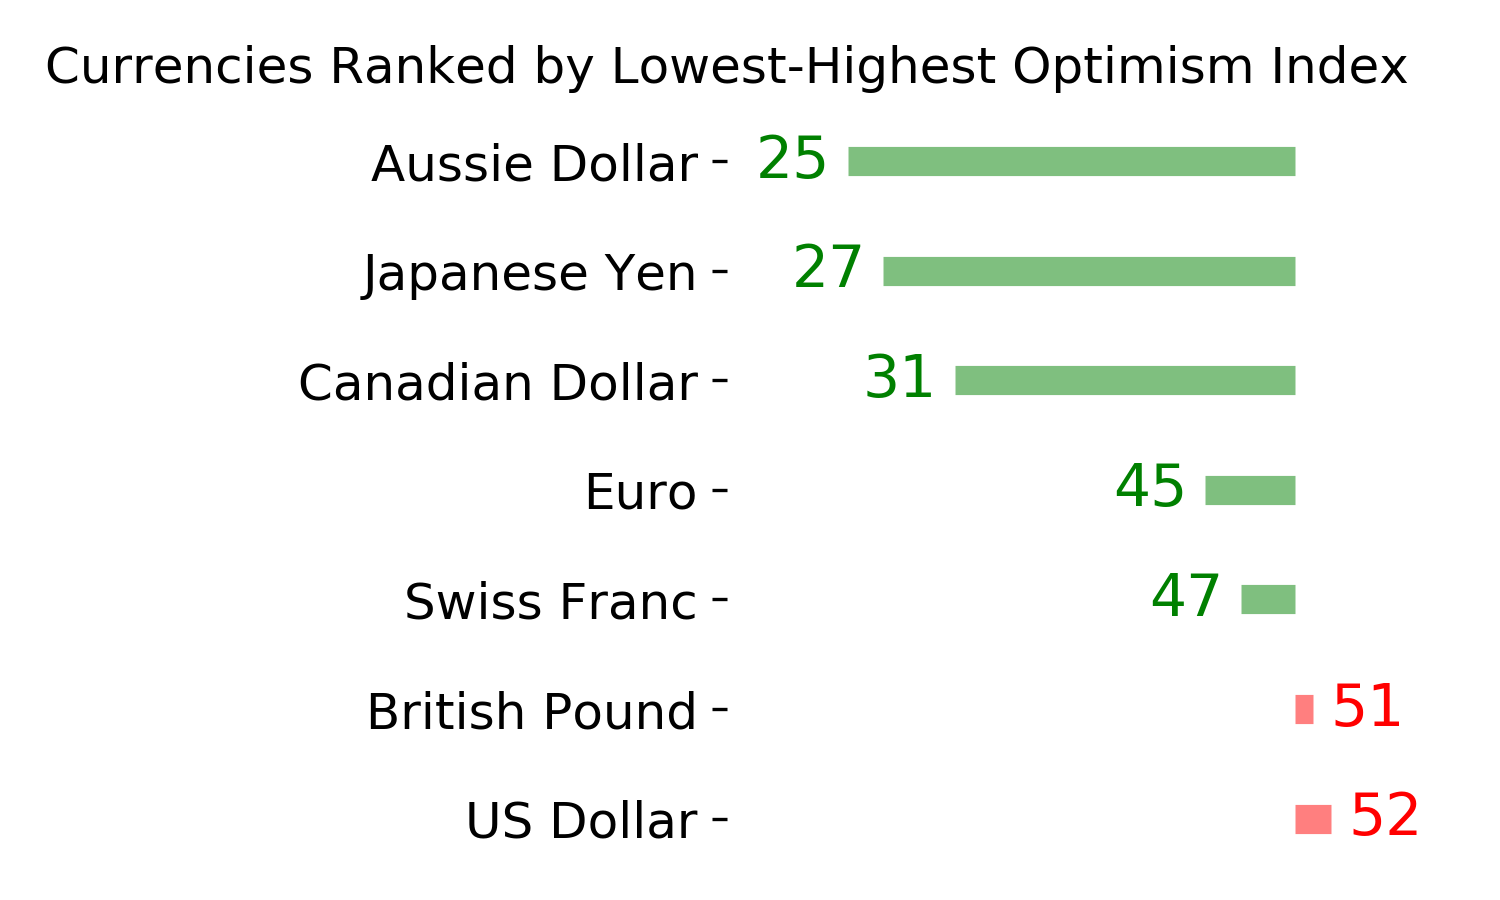
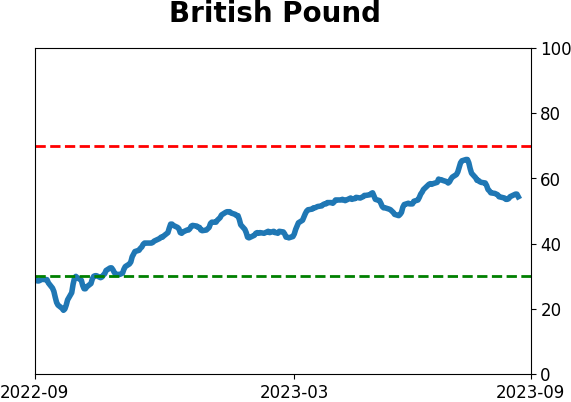
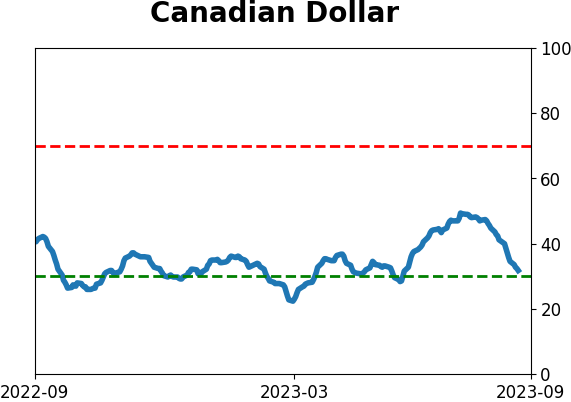
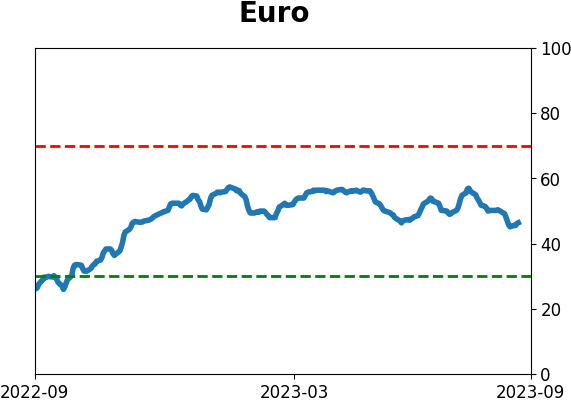
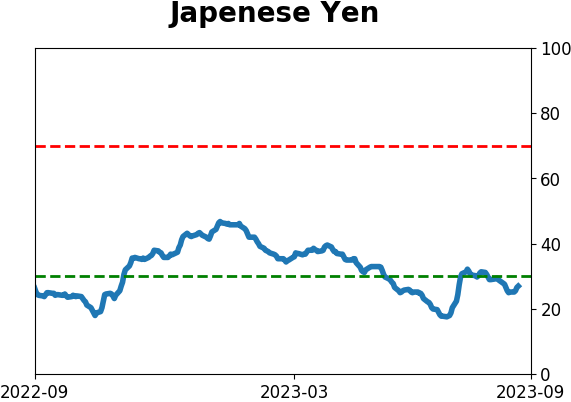
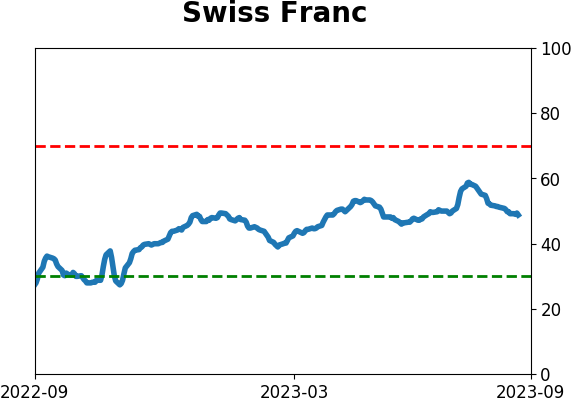
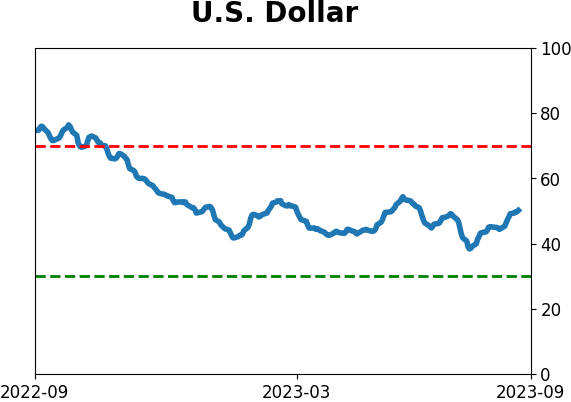
Currency ETF's - 5-Day Moving Average
|
|
|
Commodity ETF's - 5-Day Moving Average
|
|