Headlines
|
|
Leverage Drops as Stocks Surge:
The latest margin debt figures show yet another record low in the net worth of U.S. brokerage customers.
Rolling along: One of the wonderful (for bulls) and aggravating (for bears) characteristics of stocks in 2021 is that they immediately roll over any negatives. The past 3 days are clear evidence of more of the same. On the NYSE, more than 75% of volume has flowed into advancing securities. With the S&P 500 sitting at a 52-week high, this is the first such thrust since 1991. On Wednesday, we'll have more detail about what this has meant for forward returns.
Bottom Line:
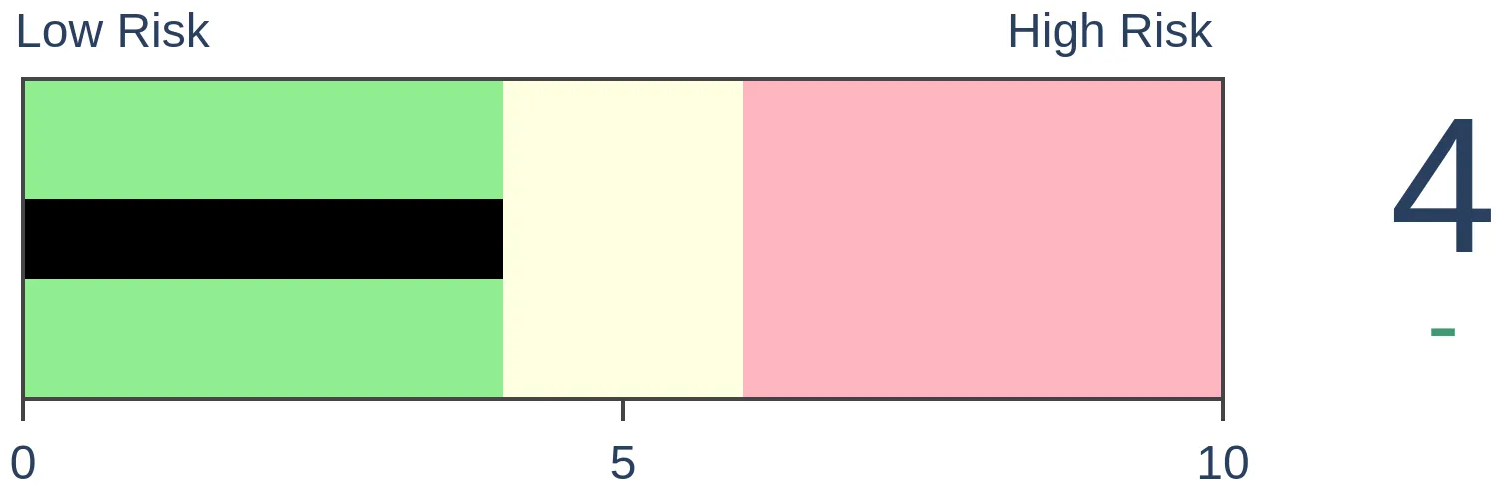
STOCKS: Hold
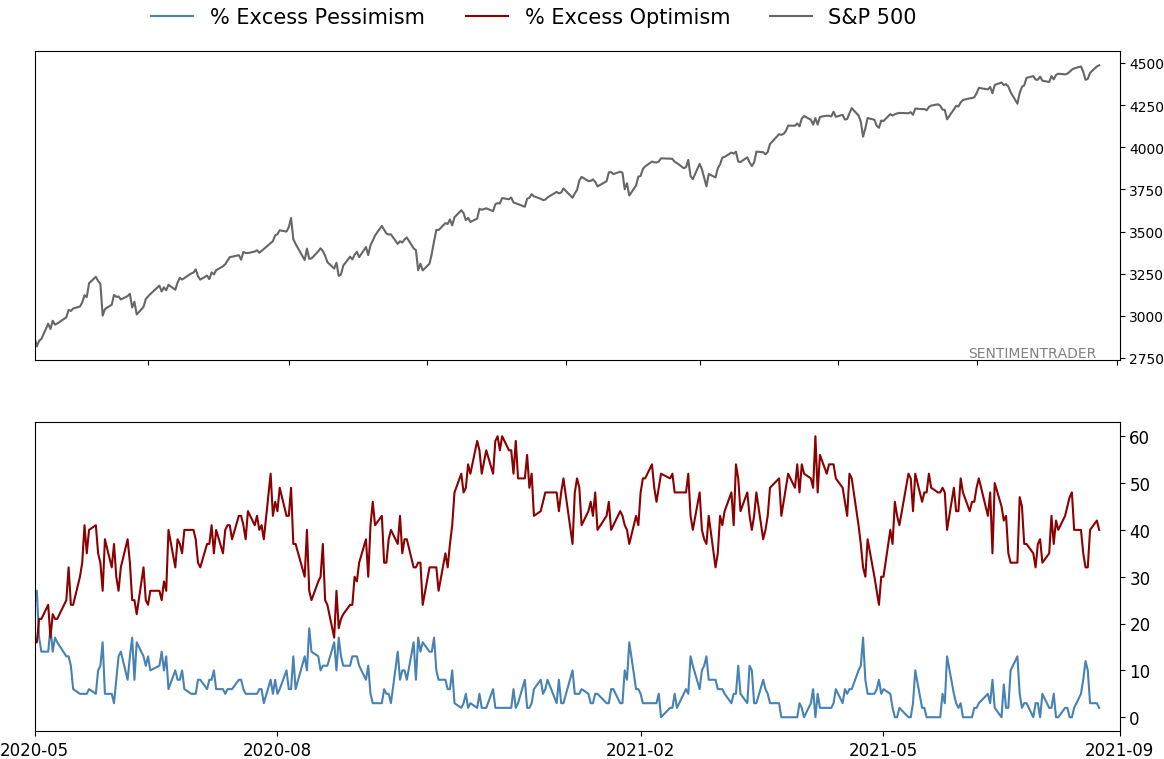
Sentiment continues to decline from the speculative February peak. With deteriorating breadth, this raises the risk of poor short- to medium-term returns until optimism and better breadth returns. See the Outlook & Allocations page for more. BONDS: Hold
Various parts of the market got hit in March, with the lowest Bond Optimism Index we usually see during healthy environments. Bond prices have modest recovered and there is no edge among the data we follow. GOLD: Hold
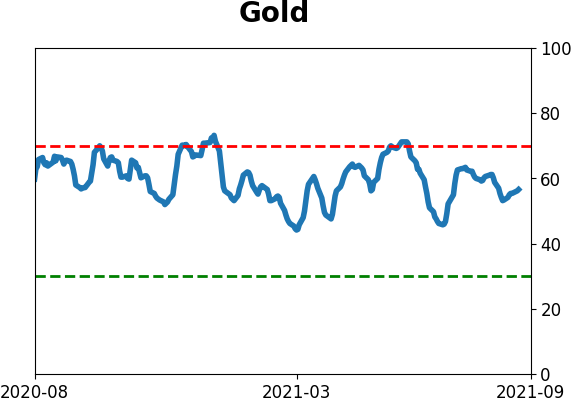
Gold and miners were rejected after trying to recover above their 200-day averages in May. Lately, some medium-term (not long-term) oversold extremes in breadth measures among miners have triggered.
|
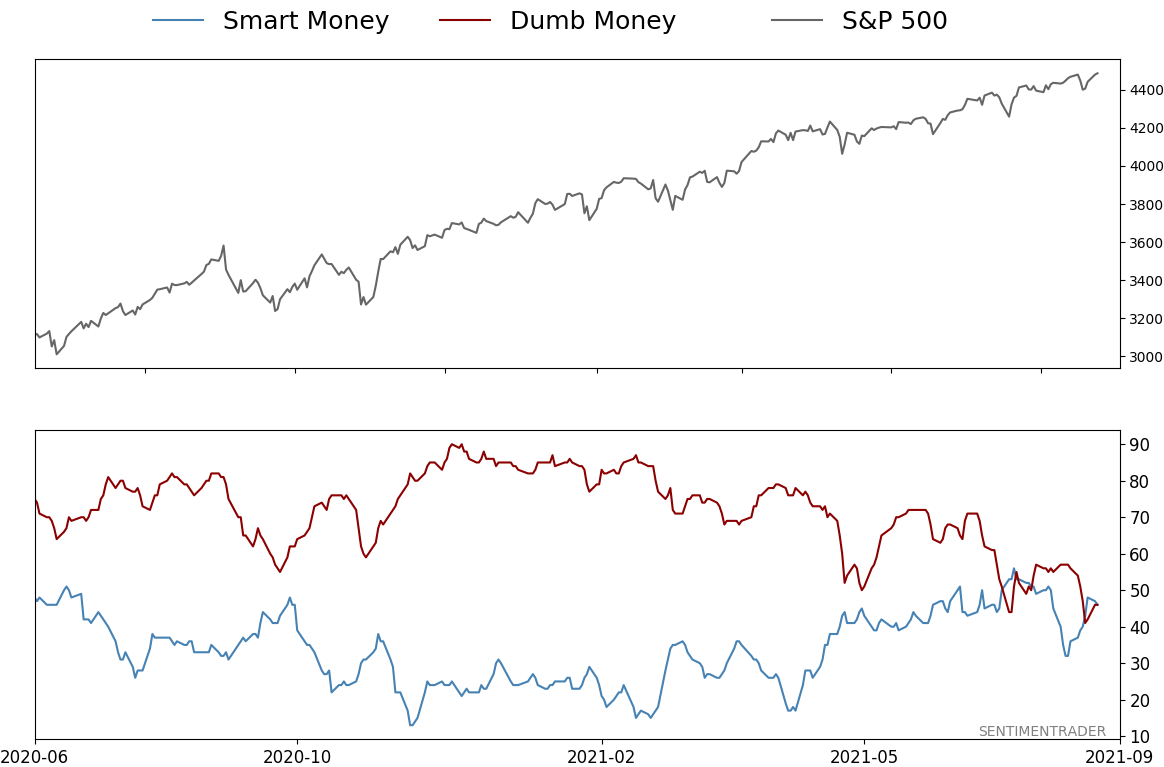
Smart / Dumb Money Confidence
|
Smart Money Confidence: 46%
Dumb Money Confidence: 46%
|
|
Risk Levels
Stocks Short-Term
|
Stocks Medium-Term
|
|
Bonds

|
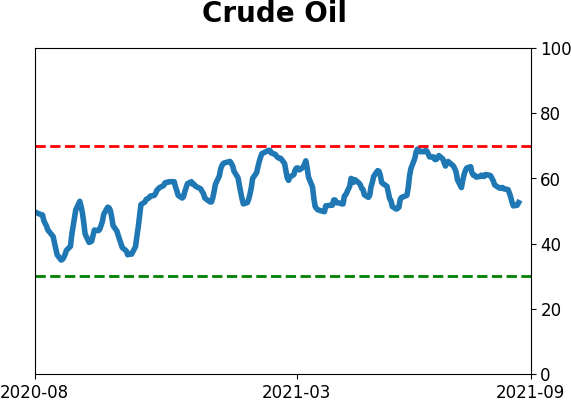
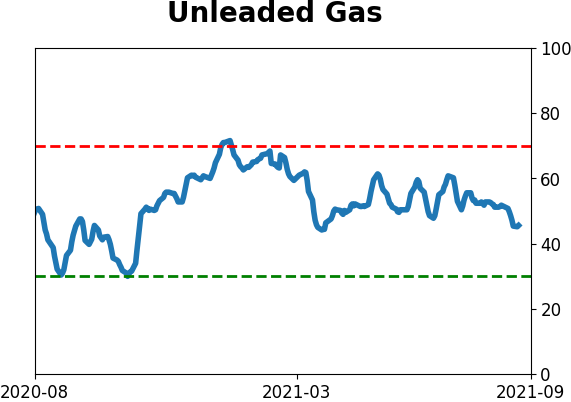
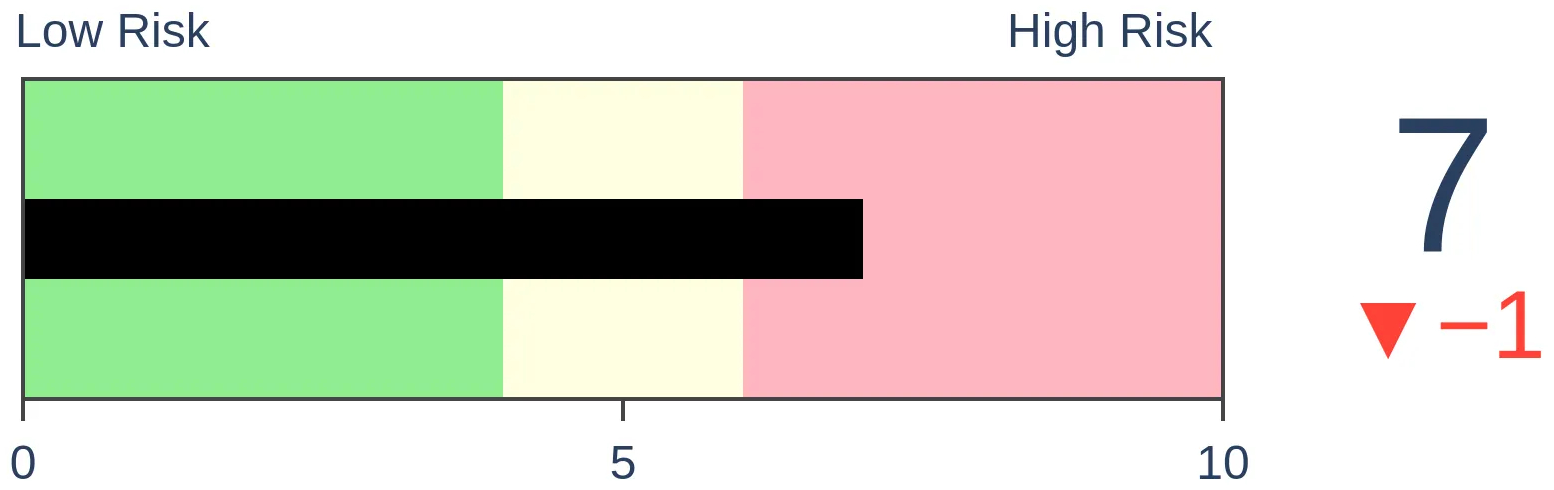
Crude Oil
|
|
Gold

|
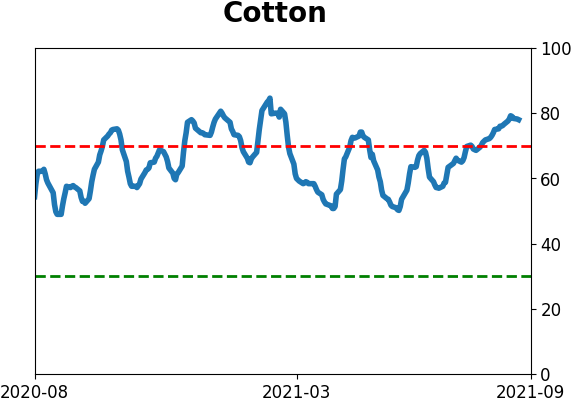
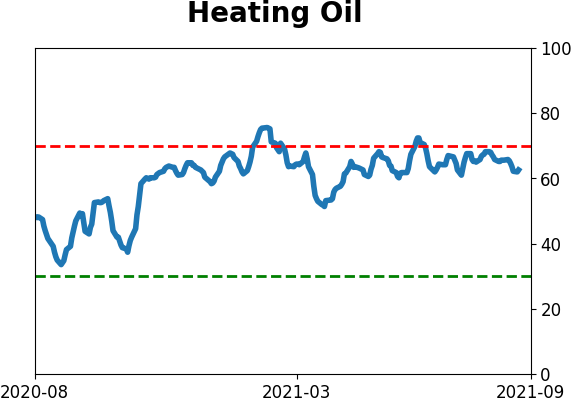
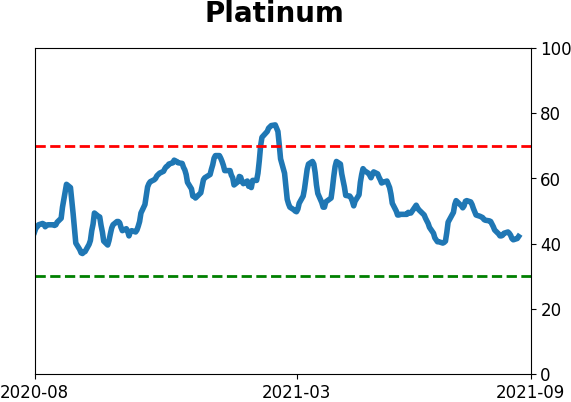
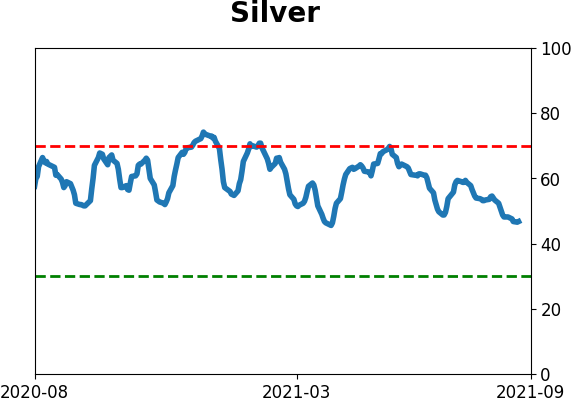
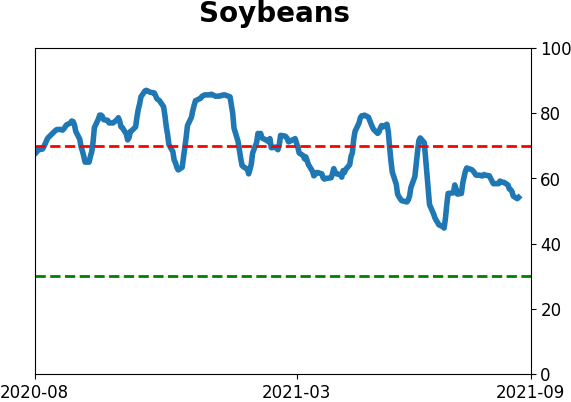
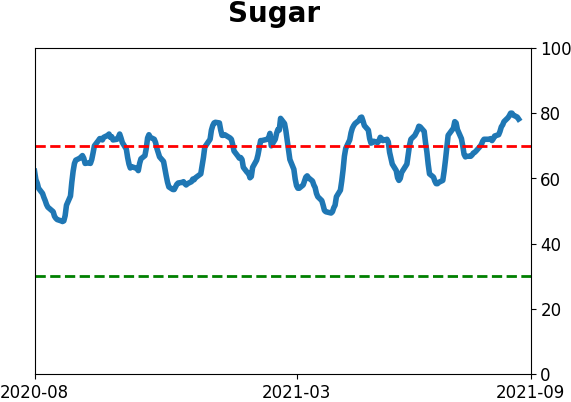
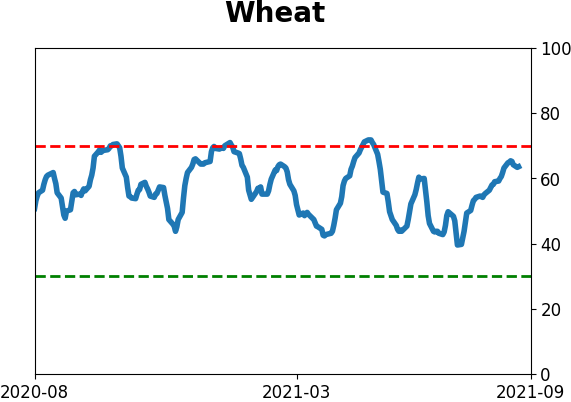
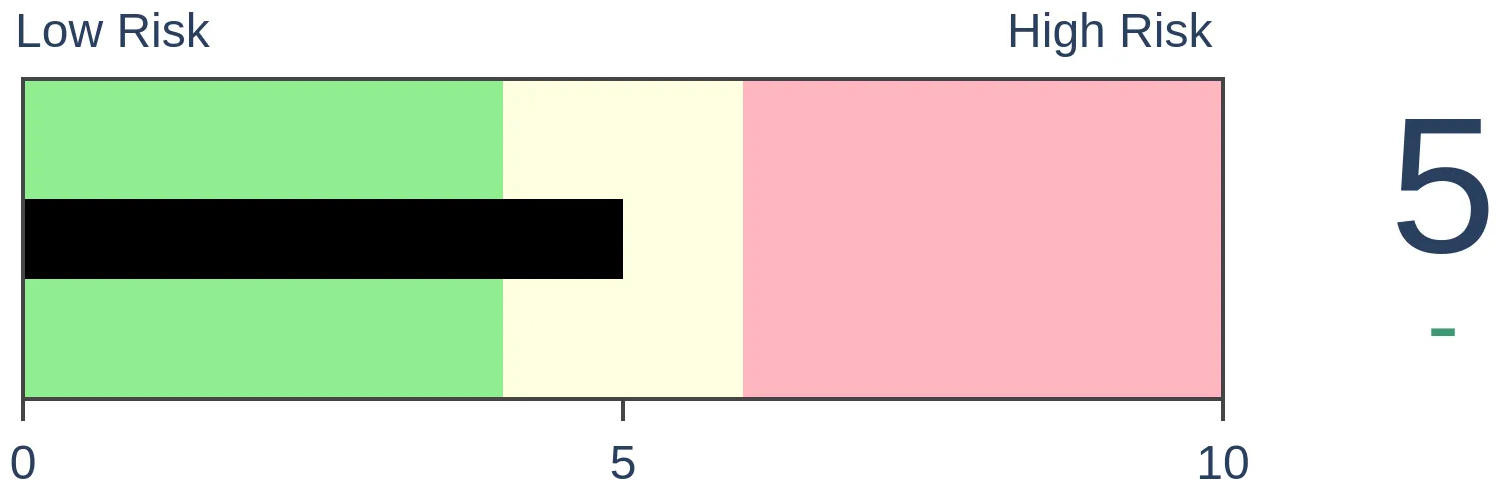
Agriculture

|
|
Research
By Jason Goepfert
BOTTOM LINE
The latest margin debt figures show yet another record low in the net worth of U.S. brokerage customers.
FORECAST / TIMEFRAME
None
|
People have been worried about the growth in margin debt for at least the last 6 years. There was no empirical reason to be worried until maybe this spring when the year-over-year change skyrocketed. And that worry was unfounded anyway, as the S&P 500 is sitting at all-time highs.
Curiously, even as the S&P has moved to new high after new high, investors have pulled back on the amount they're borrowing against their stock holdings. The latest figures, aggregating customer data through July, shows that Margin Debt dropped from record levels.
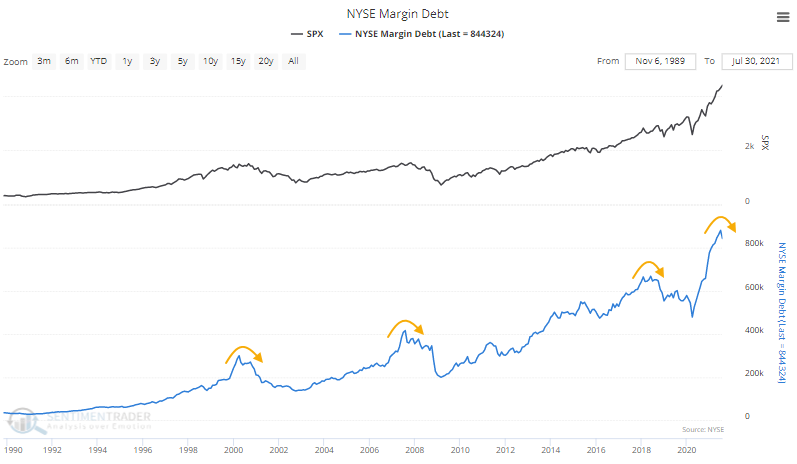
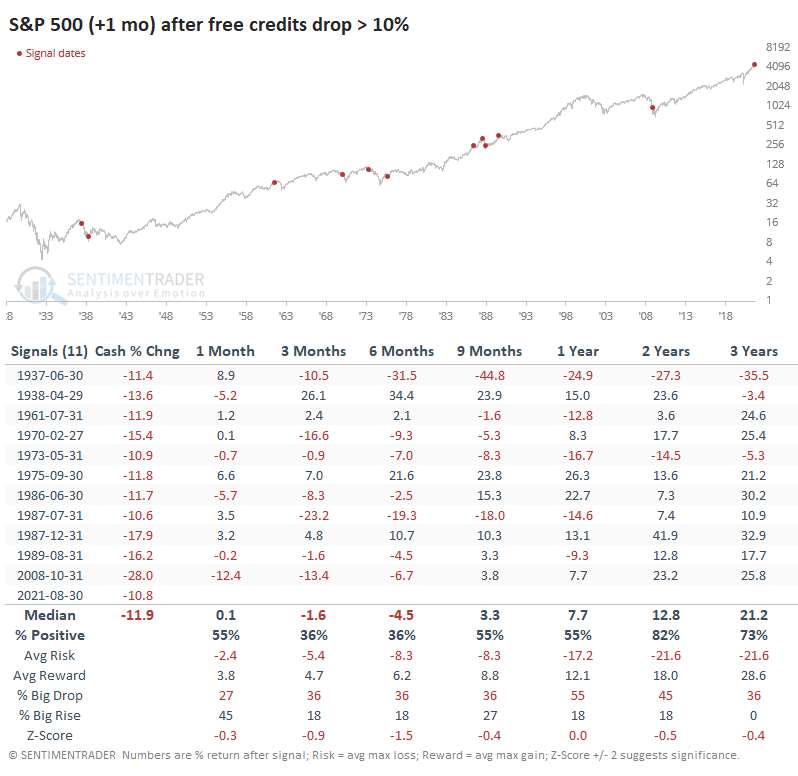
Margin debt more or less ebbs and flows with stock prices. So it's fairly unusual to see margin debt drop as stocks march to continual record highs. The table below shows that this is one of the largest-ever drops in debt during a month when the S&P hit a new high (dates in the table are advanced one month to account for reporting lags).
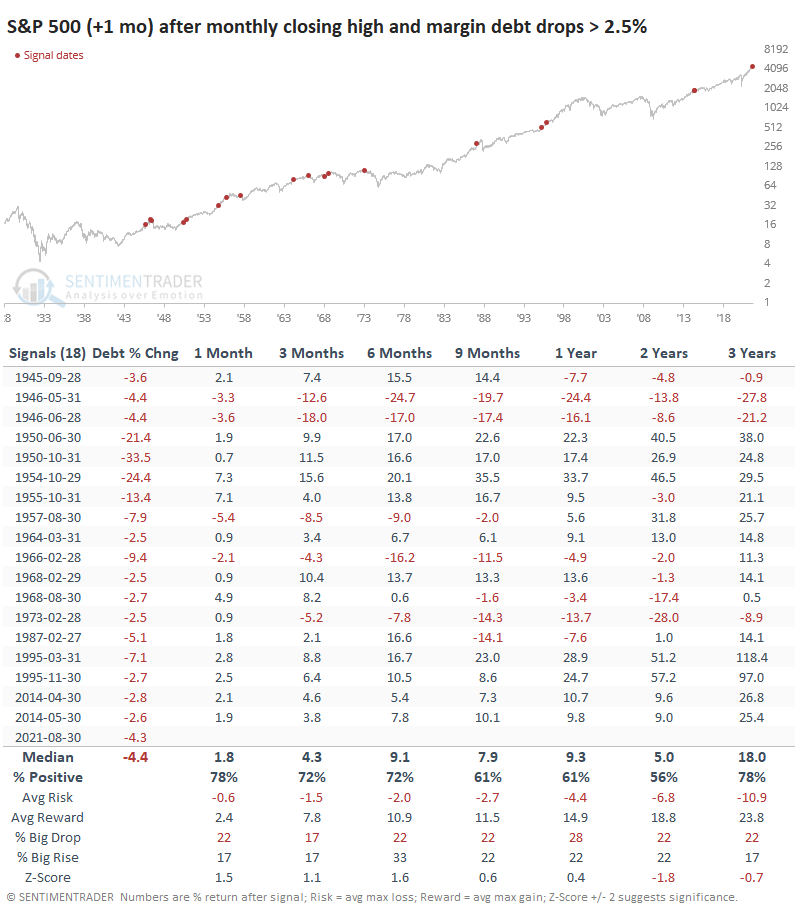
It didn't seem to have a huge impact on forward returns. The S&P did a bit better than random over the short- to medium-term, with gains moderating longer-term.
CASH HOLDINGS DROPPED, TOO
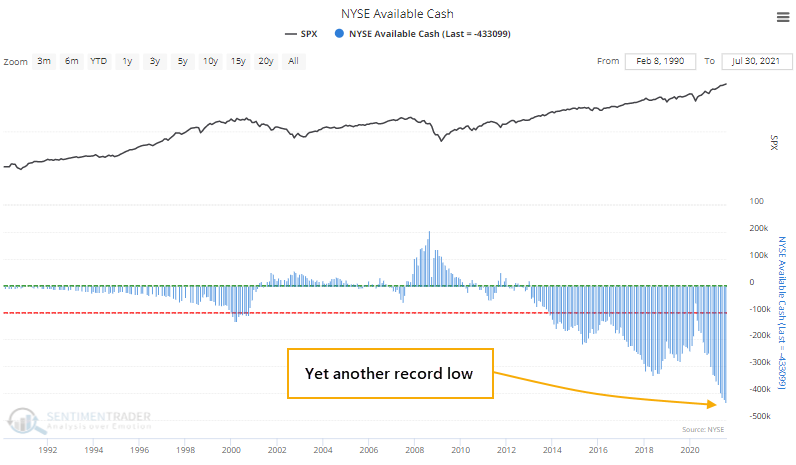
Investors pulled back on debt, but their cash cushion dropped even more. The total dollar value of Free Credits - cash available to brokerage account holders to withdraw - plunged by one of the largest degrees in 70 years in July.
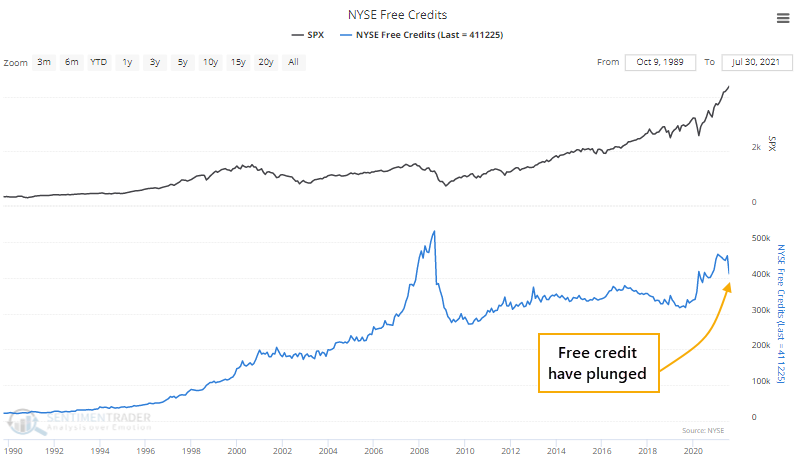
The 11% drop in free credits in July was the 11th-largest monthly drop in history. The only time it declined more than 10% during a month when the S&P was at new highs was June 1987 (again, the dates in the table below are advanced by one month).
A RECORD IN NEGATIVE NET WORTH
If cash drops more than debt, then the Available Cash figure, a kind of "net worth" for investors, will decline. And so, in July, it fell yet again to another record low.
The U.S. stock market has grown exponentially over the decades, so if we express that Available Cash as a percentage of the total market capitalization of the U.S. stock market, the extreme isn't quite as extreme. It's still among the lowest readings in history, though.
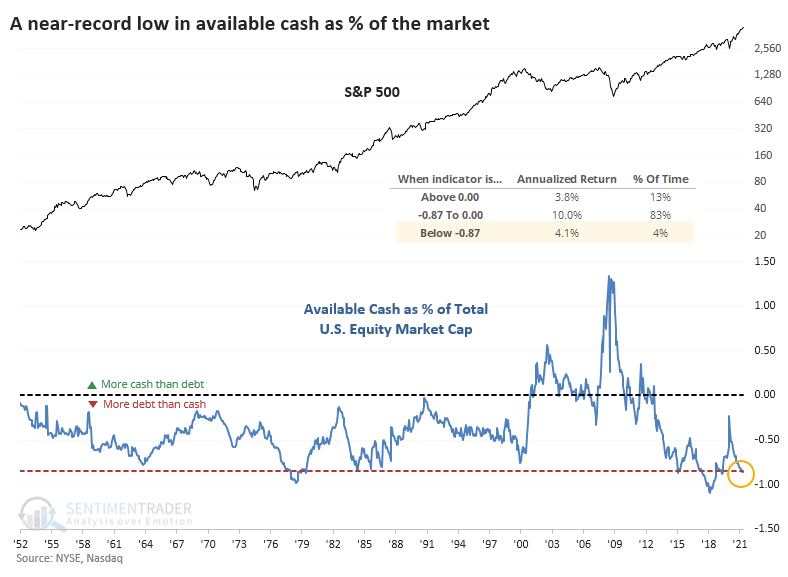
We can see from the chart that the S&P 500's annualized return when Available Cash was -.87% or less of market cap was +4.1%. That's positive, but below the returns when the net worth figure was less extreme.
Pointing out any negatives for stocks over the past 9 months has been an aggravating exercise in futility. Whatever is happening to drive the indexes higher [insert favorite excuse here], it continues unabated. For the first time in a long time, long-term breadth is negative, it's been persisting for months, and it's even worse on the Nasdaq. And yet buyers return to drive the indexes immediately to new highs, with the Nasdaq among the best performers on Monday. This is a heckuva mixed-up market, where nothing but blindly buying seems to work.
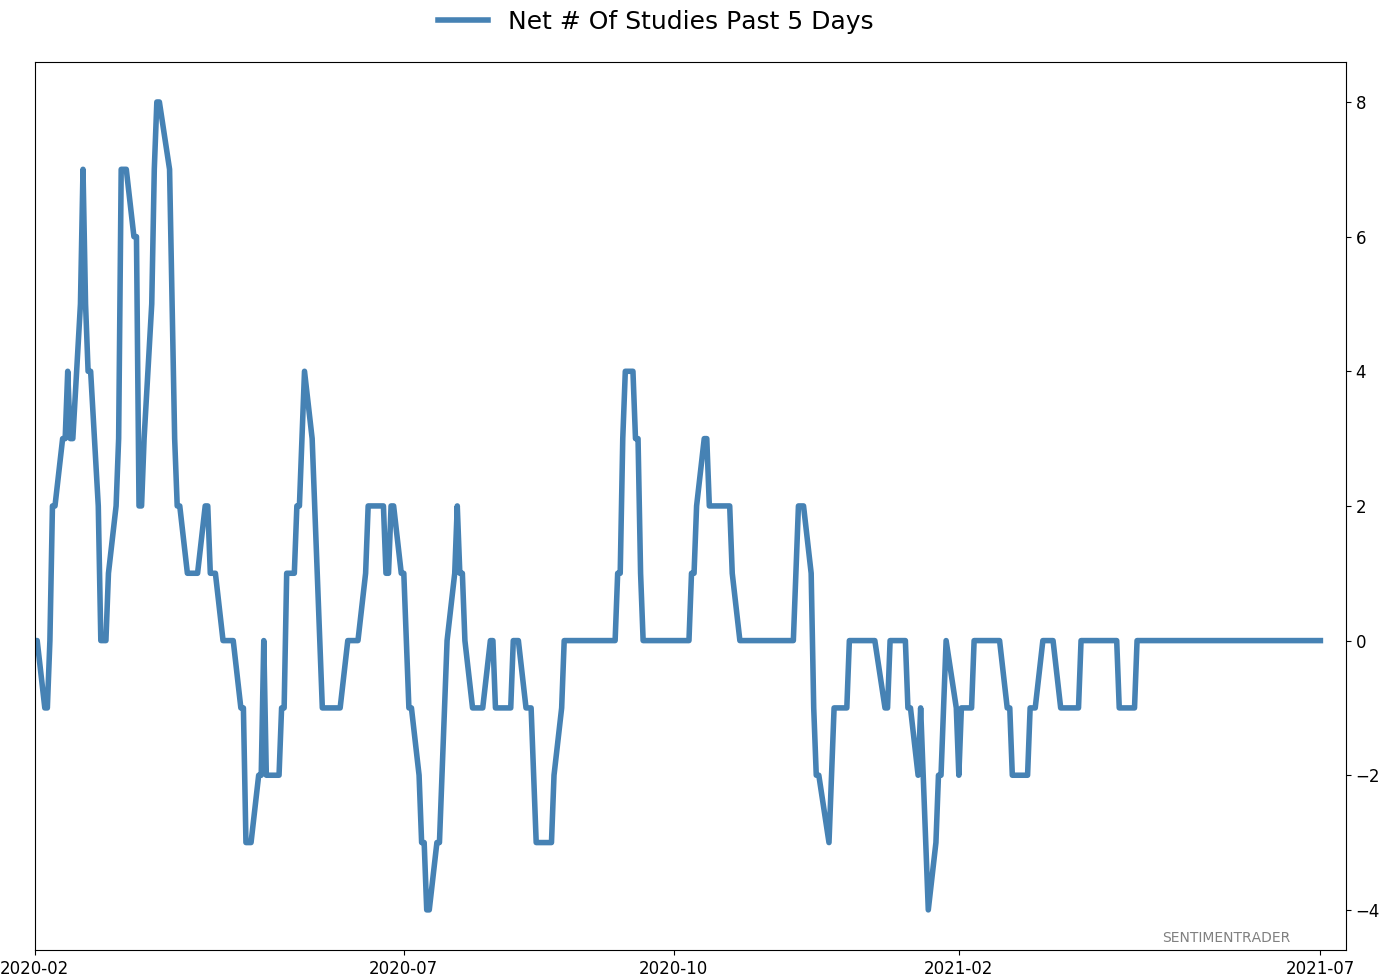
Active Studies
| Time Frame | Bullish | Bearish | | Short-Term | 0 | 5 | | Medium-Term | 4 | 3 | | Long-Term | 10 | 5 |
|
Indicators at Extremes
Portfolio
| Position | Description | Weight % | Added / Reduced | Date | | Stocks | RSP | 4.1 | Added 4.1% | 2021-05-19 | | Bonds | 23.9% BND, 6.9% SCHP | 30.7 | Reduced 7.1% | 2021-05-19 | | Commodities | GCC | 2.6 | Reduced 2.1%
| 2020-09-04 | | Precious Metals | GDX | 5.6 | Reduced 4.2% | 2021-05-19 | | Special Situations | 4.3% XLE, 2.2% PSCE | 7.6 | Reduced 5.6% | 2021-04-22 | | Cash | | 49.4 | | |
|
Updates (Changes made today are underlined)
Much of our momentum and trend work has remained positive for several months, with some scattered exceptions. Almost all sentiment-related work has shown a poor risk/reward ratio for stocks, especially as speculation drove to record highs in exuberance in February. Much of that has worn off, and most of our models are back toward neutral levels. There isn't much to be excited about here. The same goes for bonds and even gold. Gold has been performing well lately and is back above long-term trend lines. The issue is that it has a poor record of holding onto gains when attempting a long-term trend change like this, so we'll take a wait-and-see approach. RETURN YTD: 8.2% 2020: 8.1%, 2019: 12.6%, 2018: 0.6%, 2017: 3.8%, 2016: 17.1%, 2015: 9.2%, 2014: 14.5%, 2013: 2.2%, 2012: 10.8%, 2011: 16.5%, 2010: 15.3%, 2009: 23.9%, 2008: 16.2%, 2007: 7.8%
|
|
Phase Table
Ranks
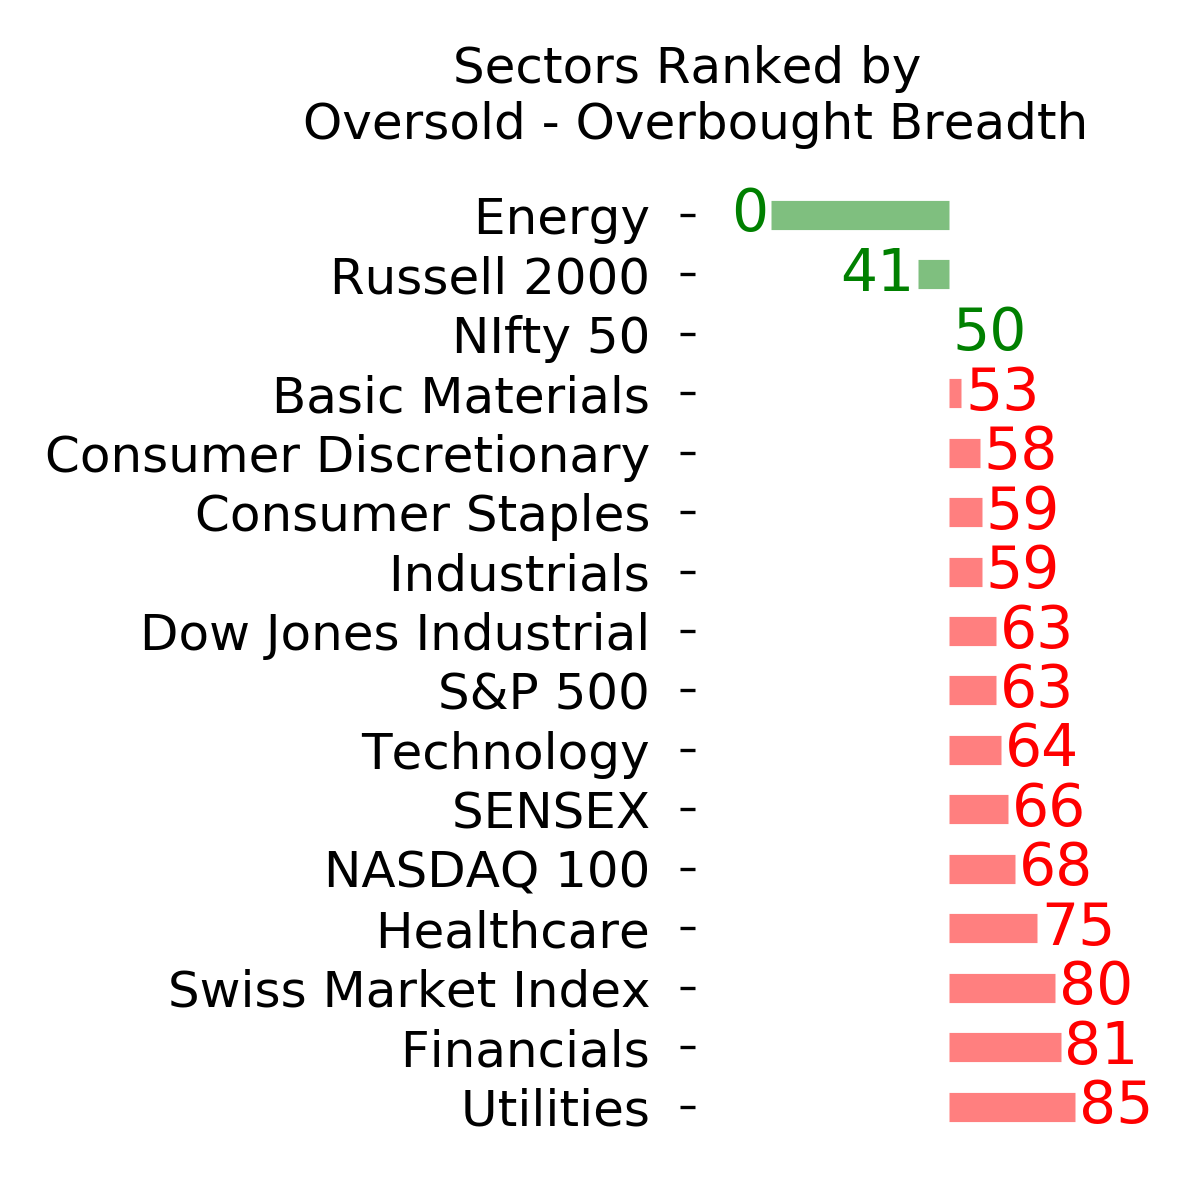
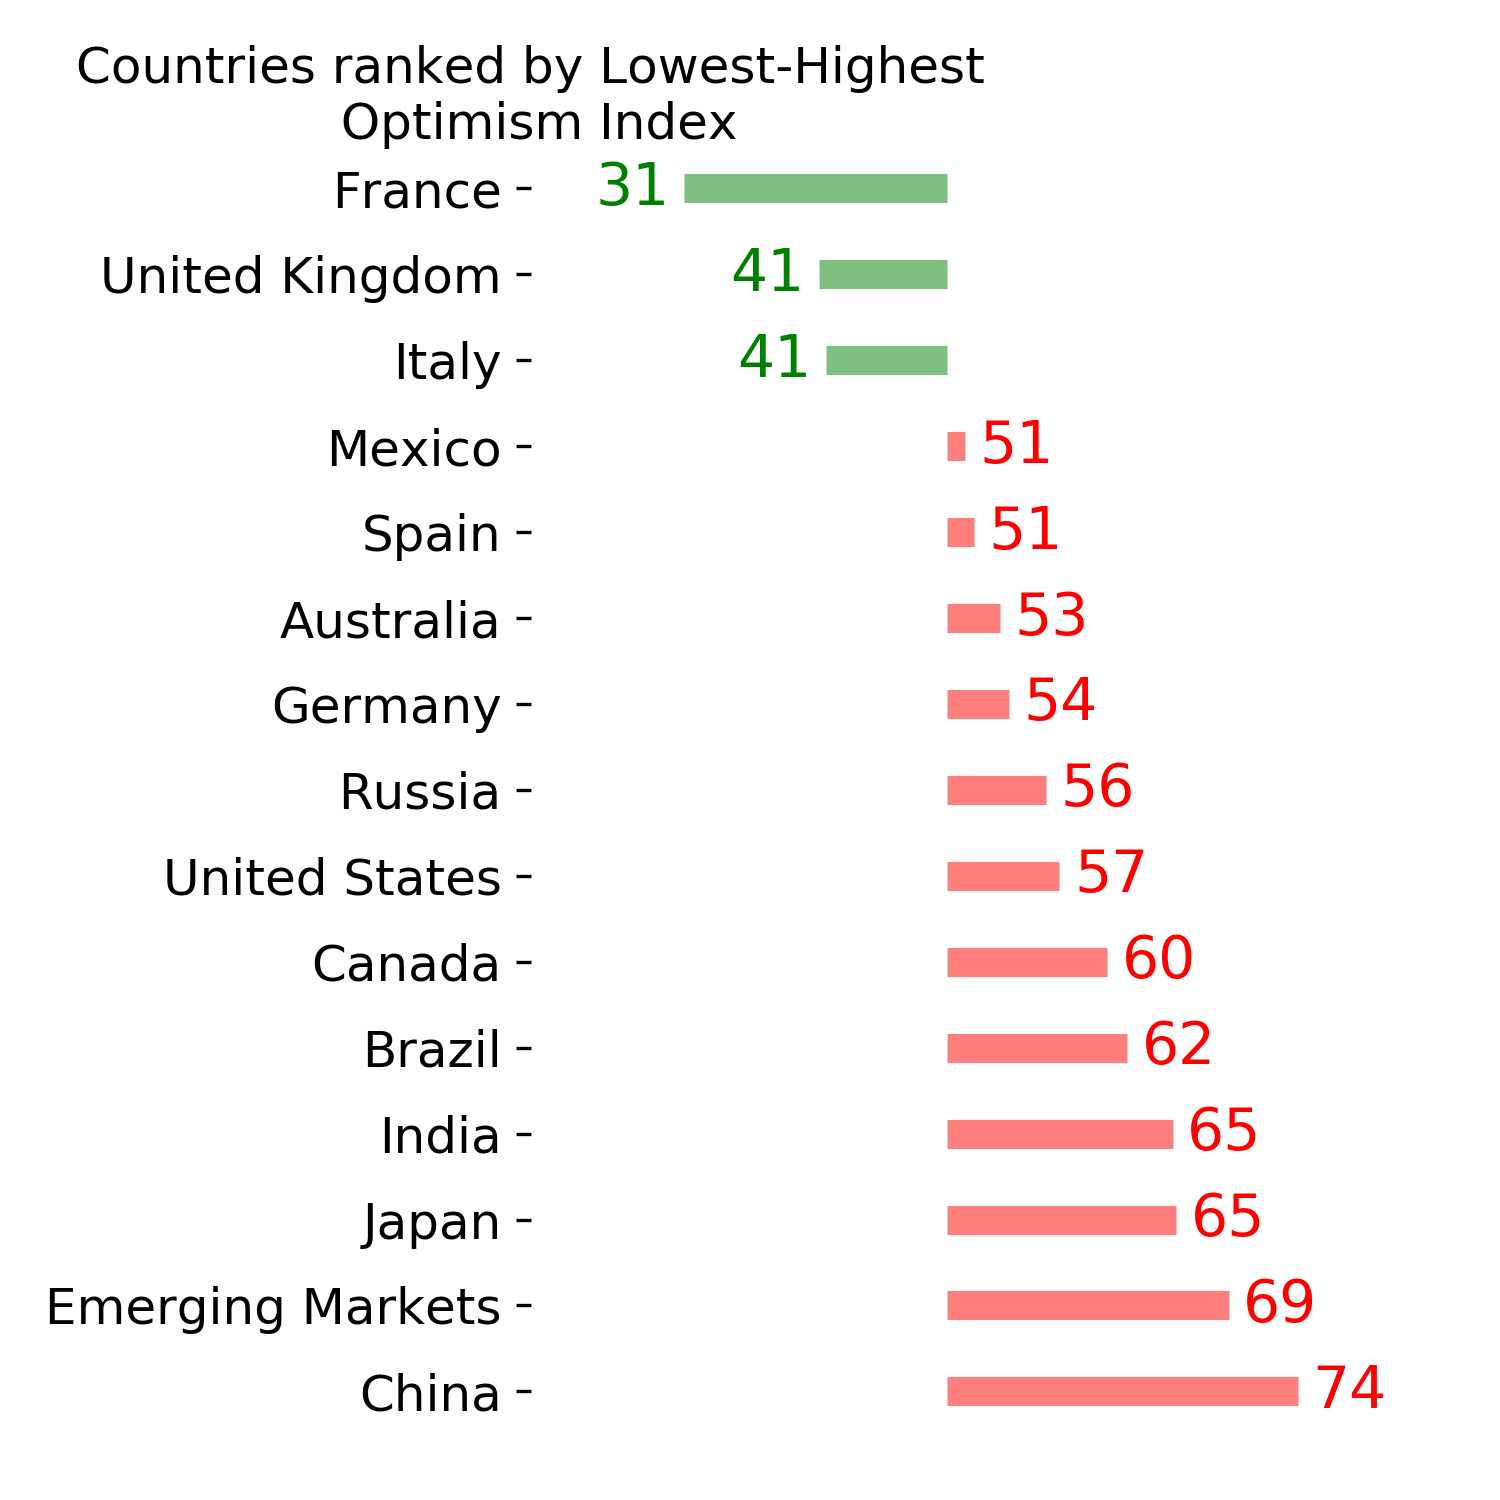
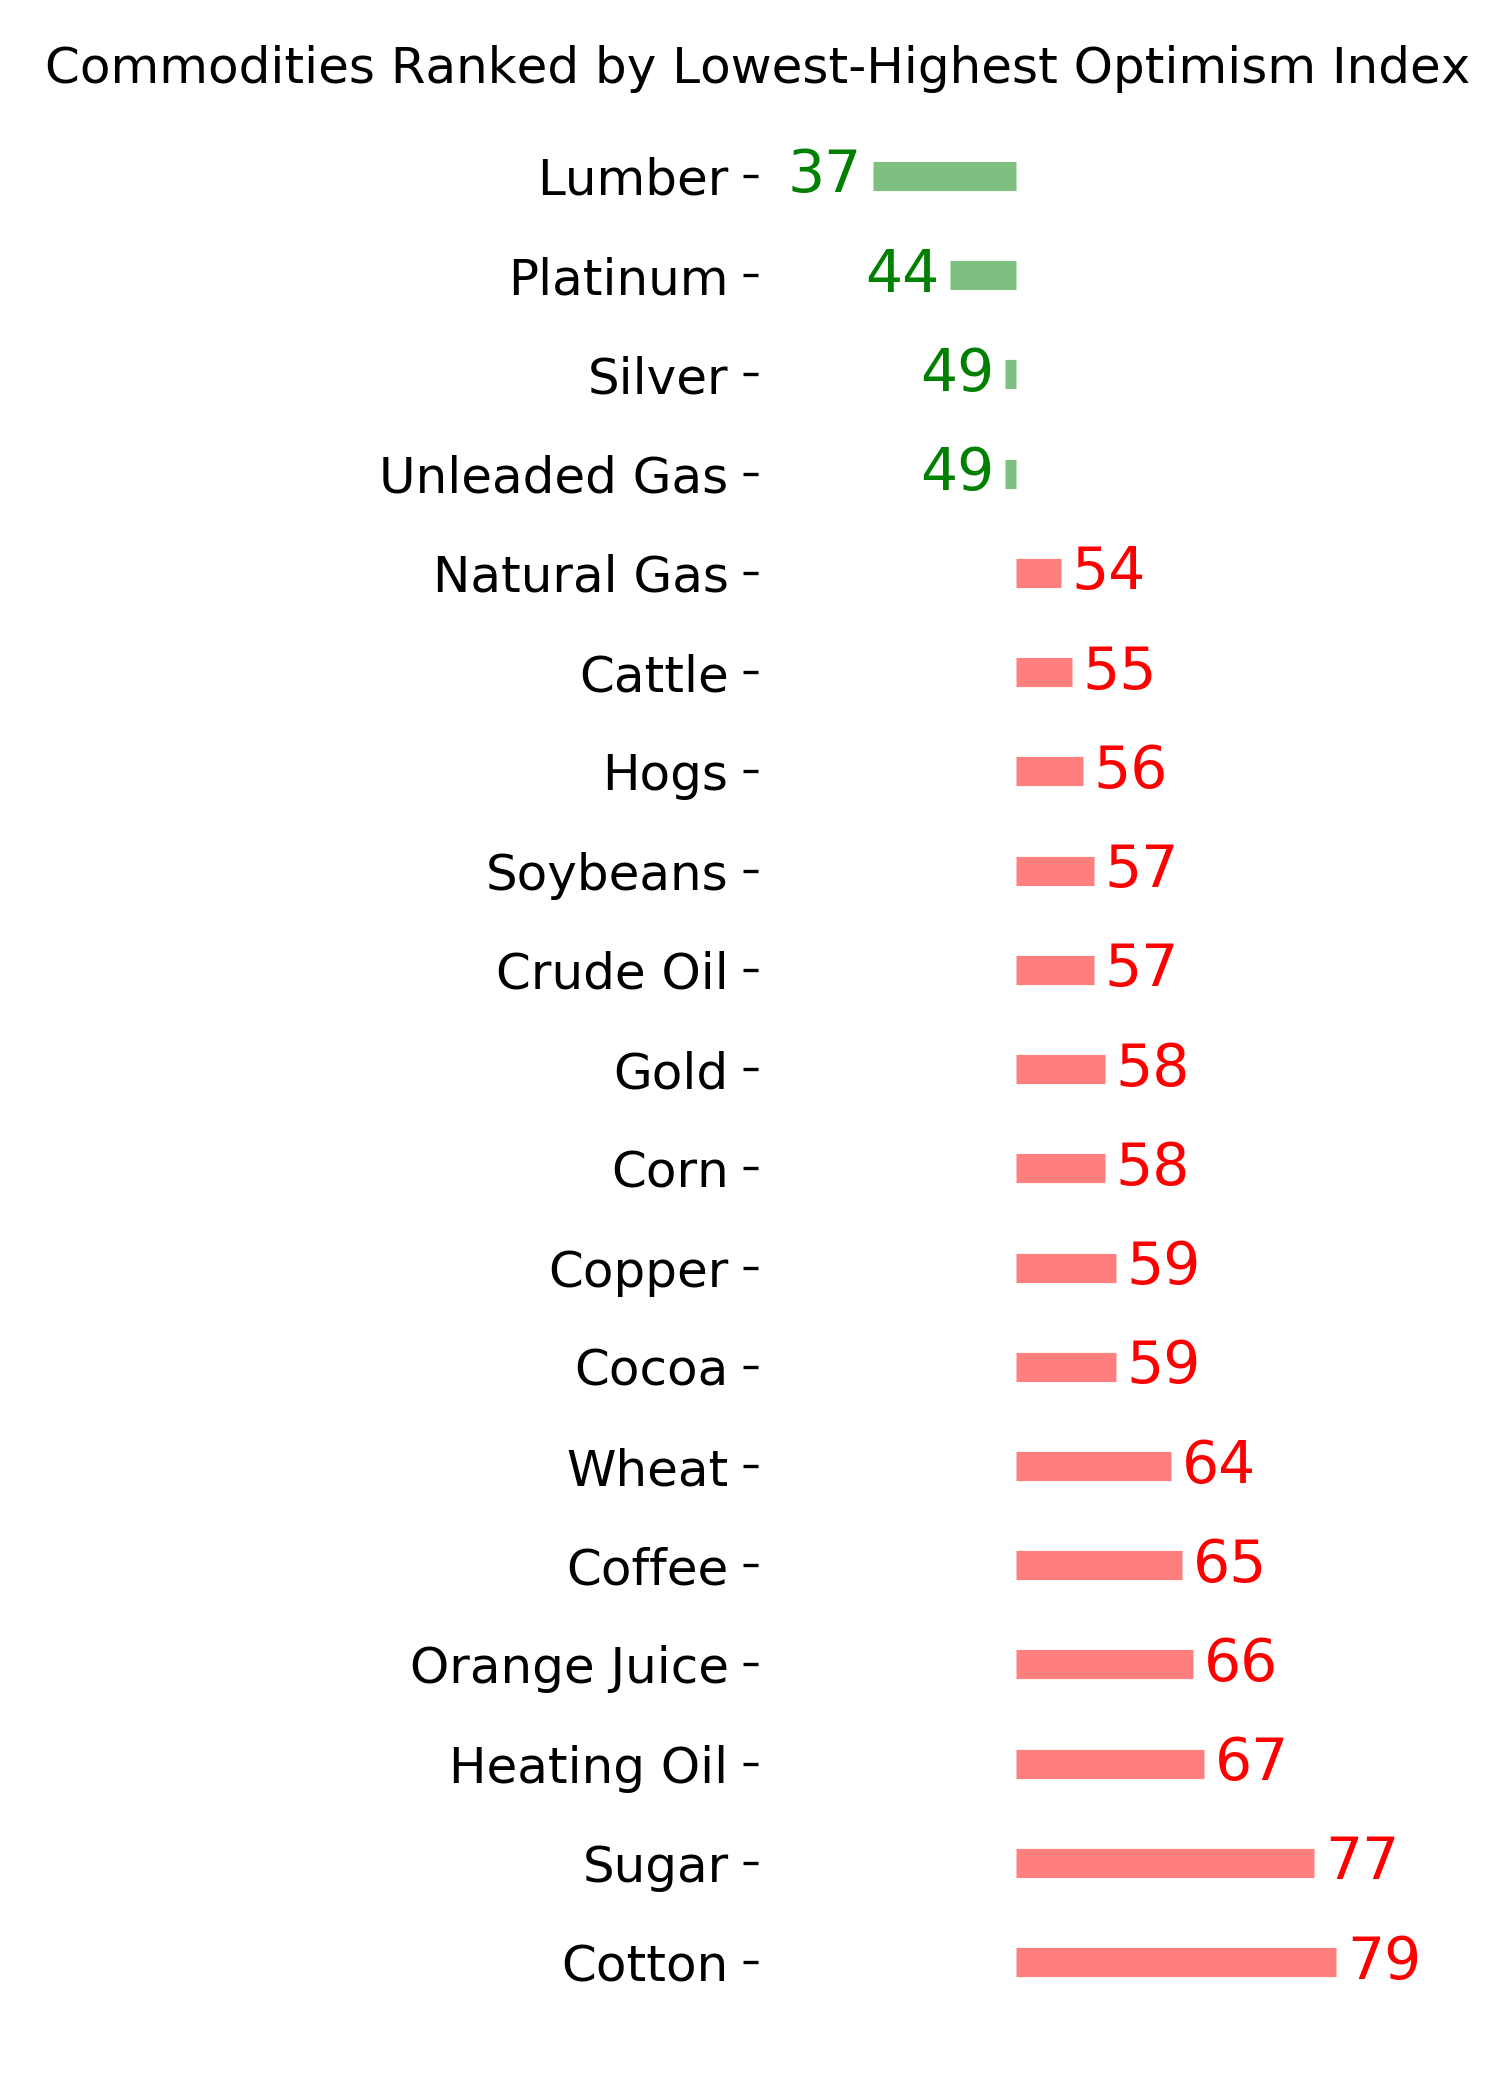
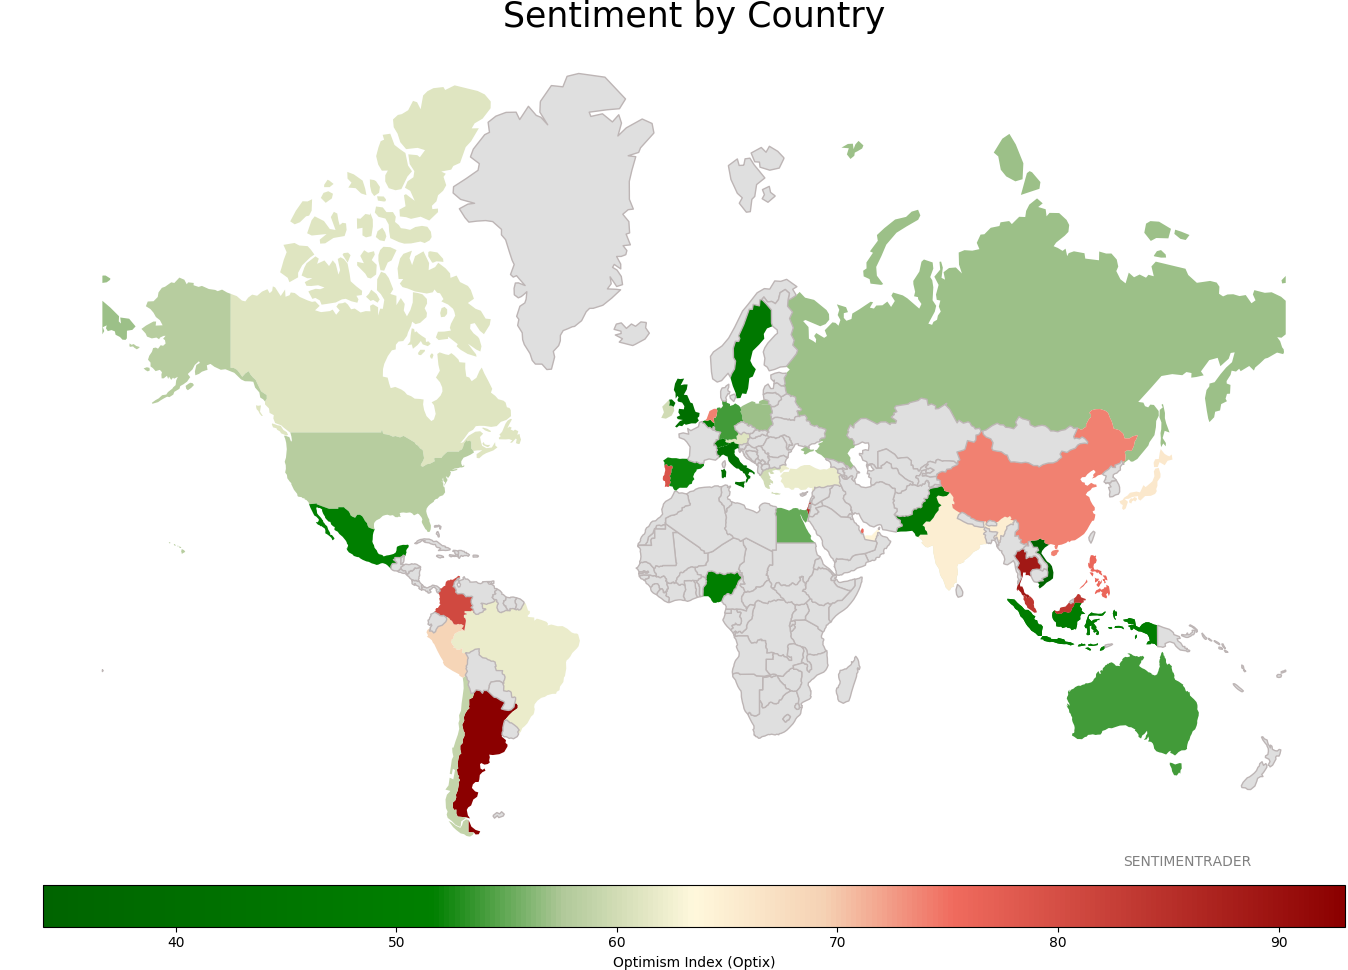
Sentiment Around The World
Optimism Index Thumbnails
|
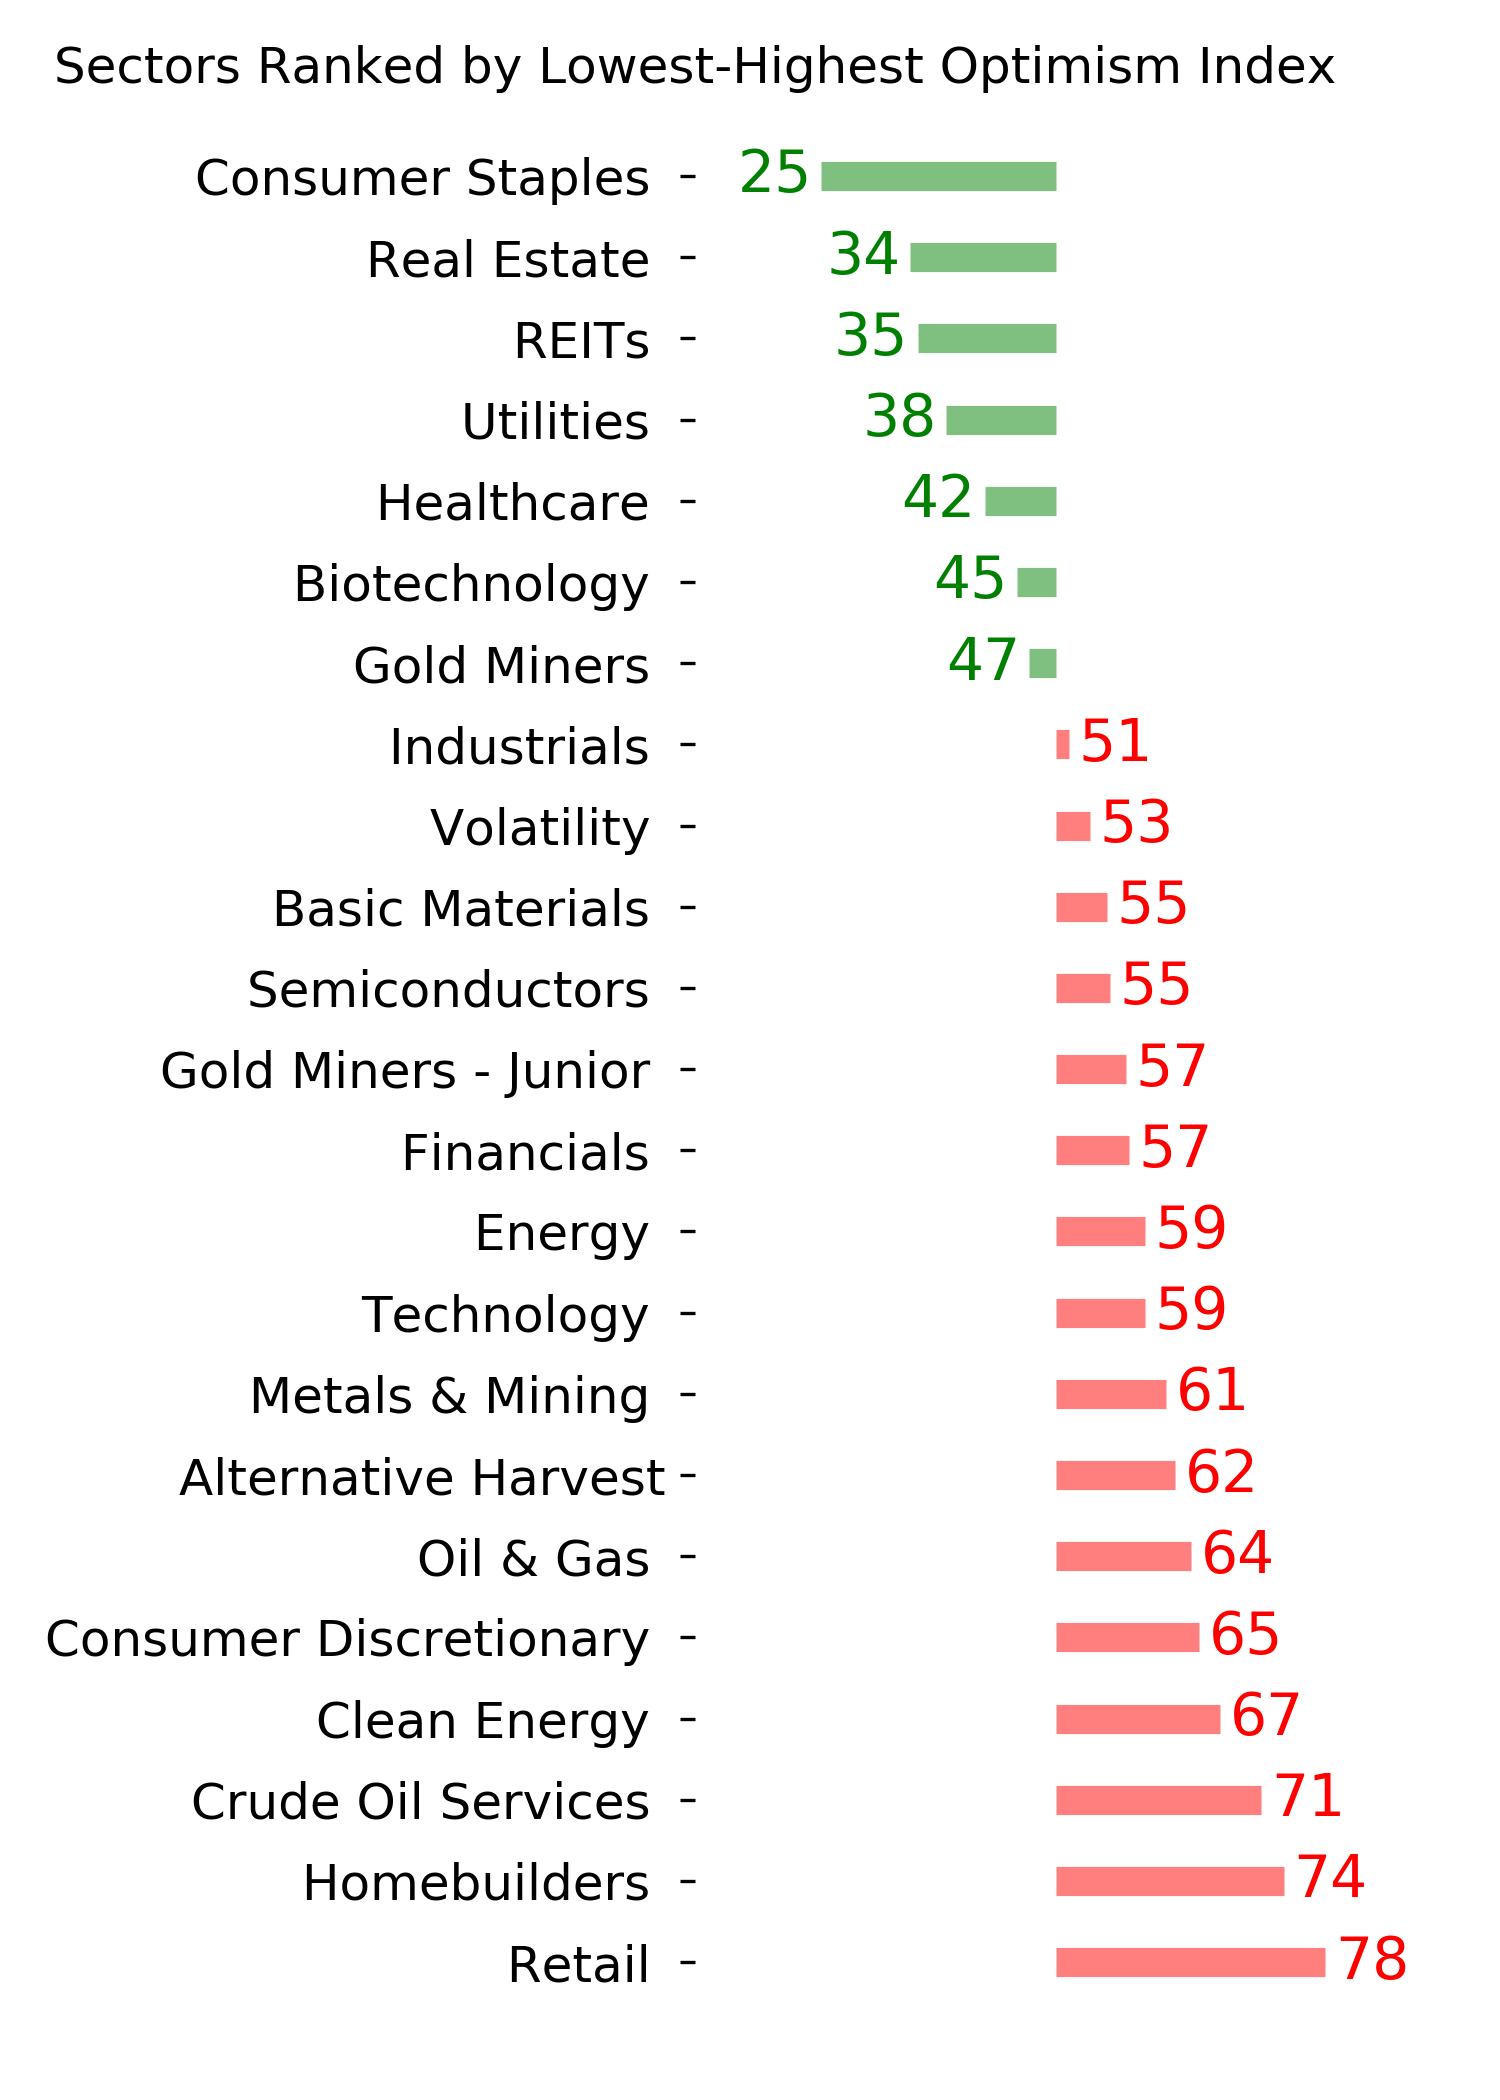
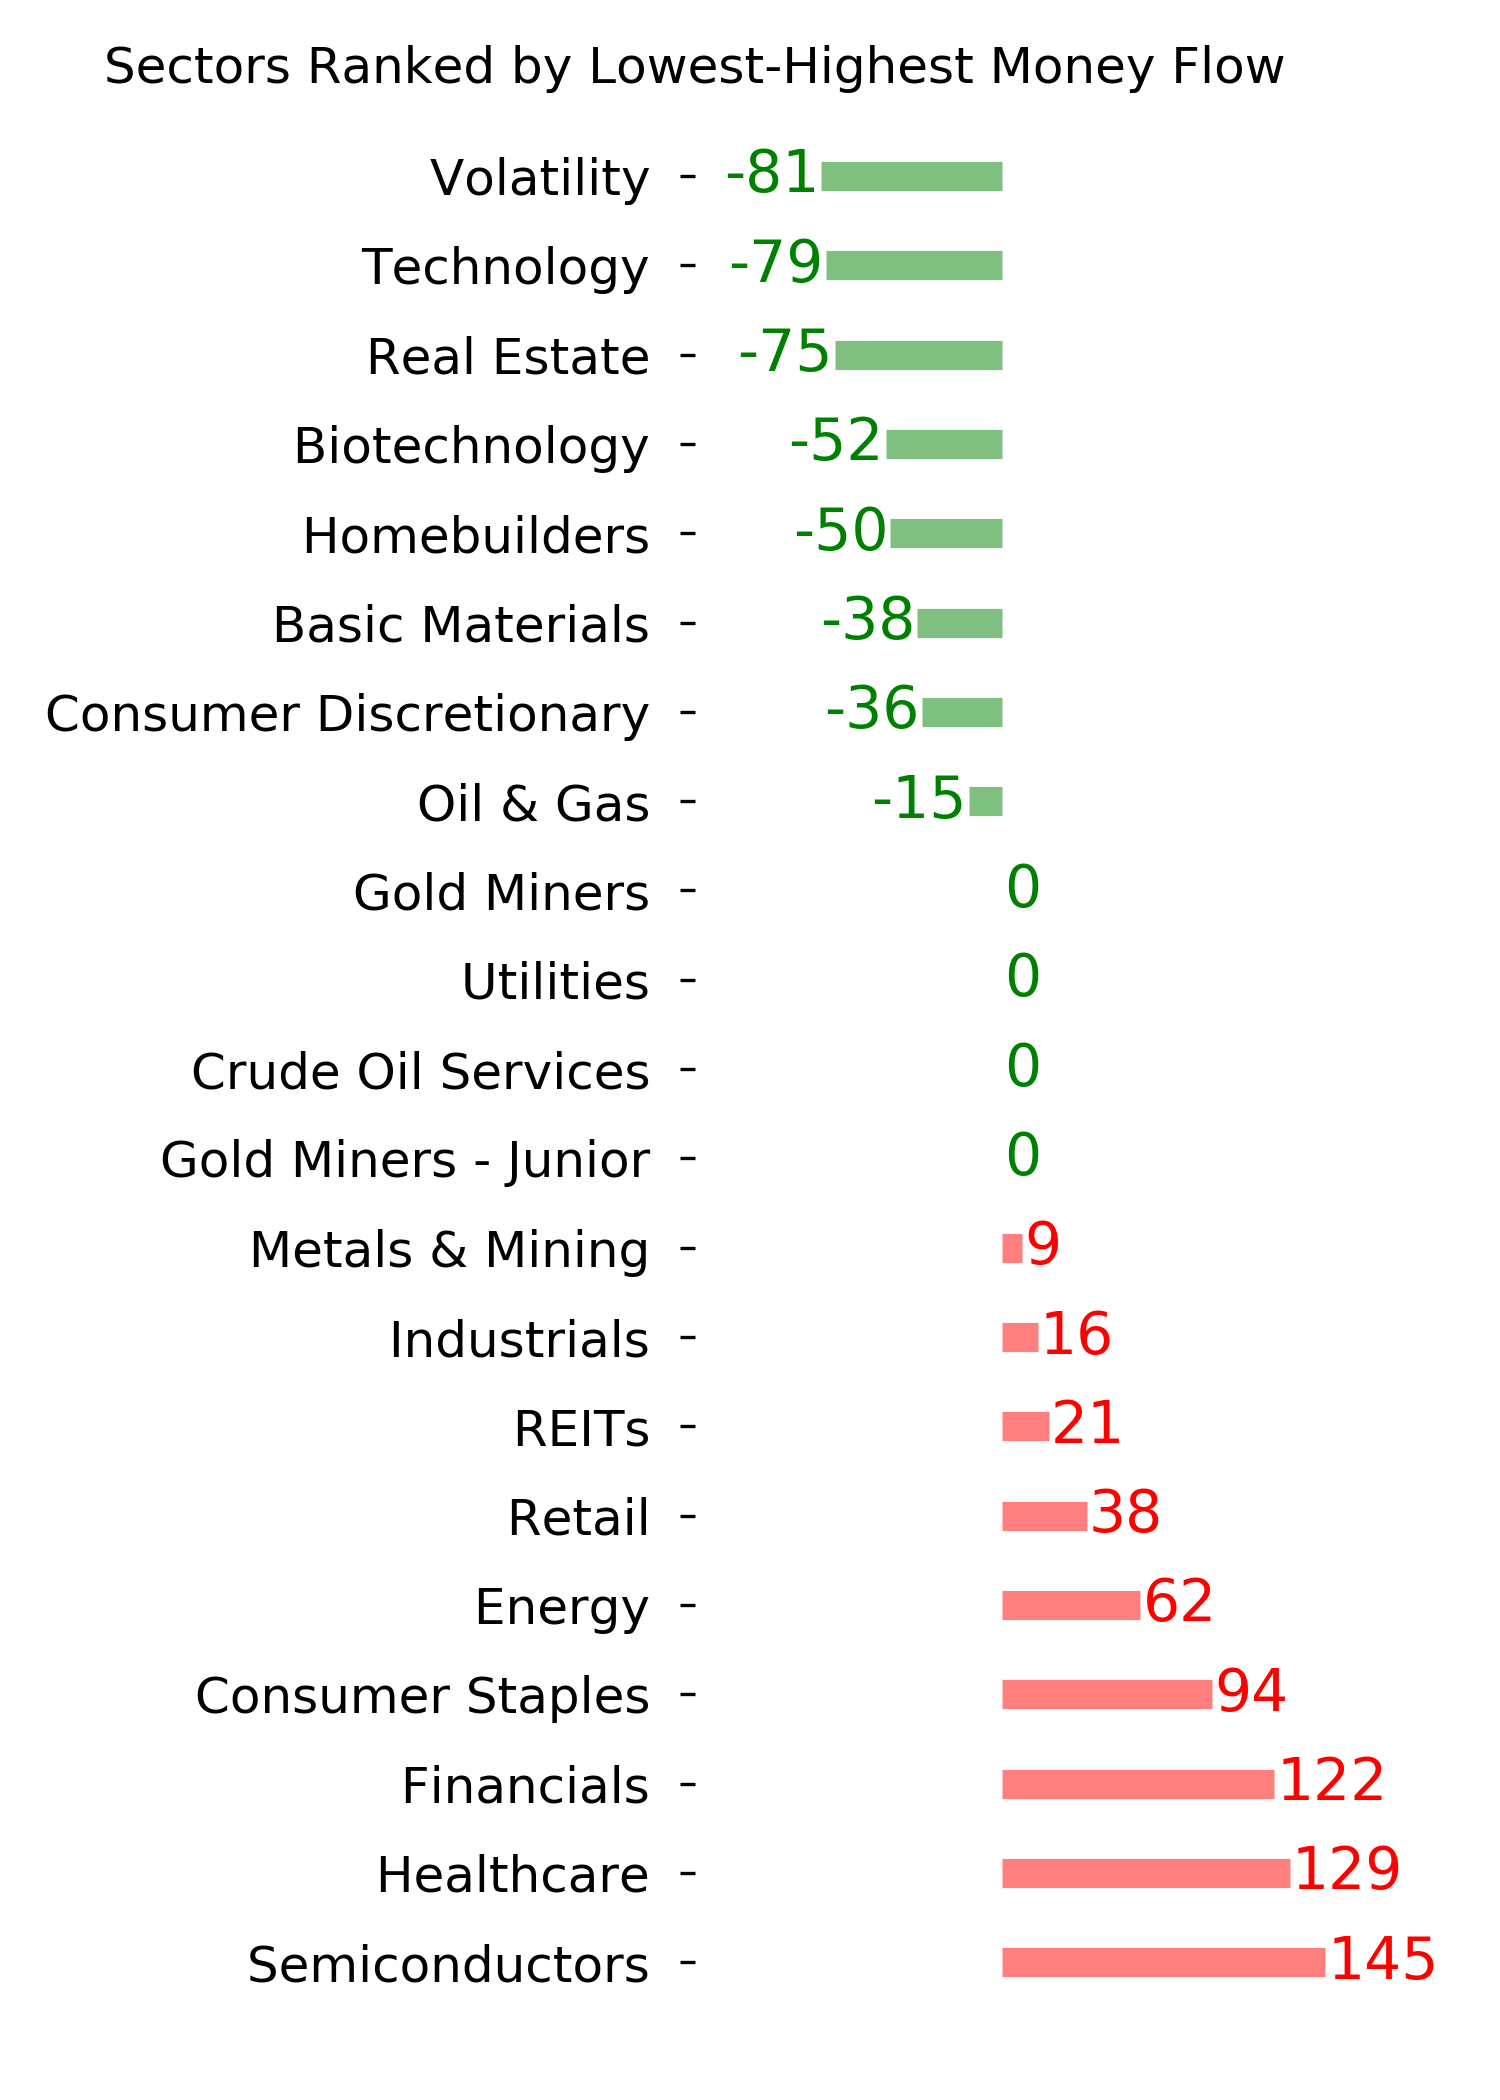
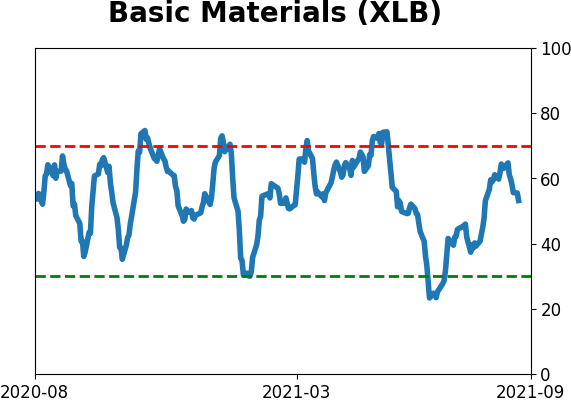
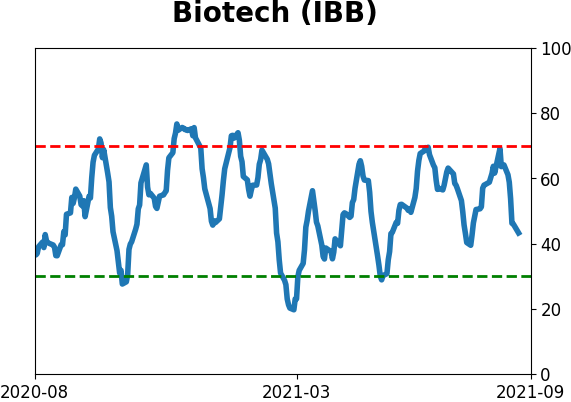
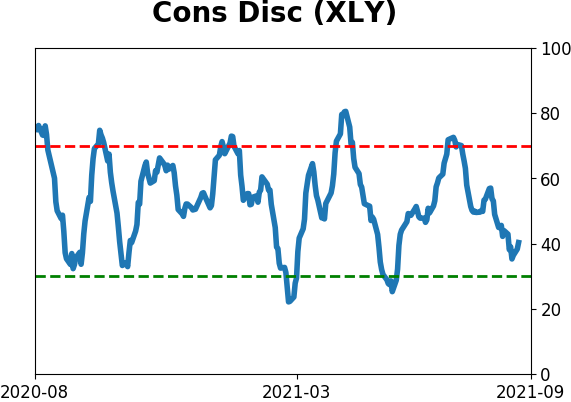
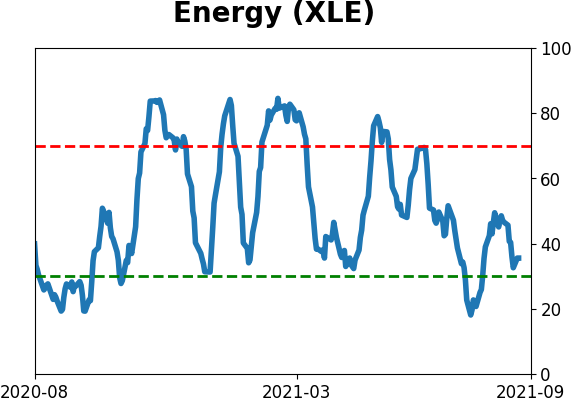
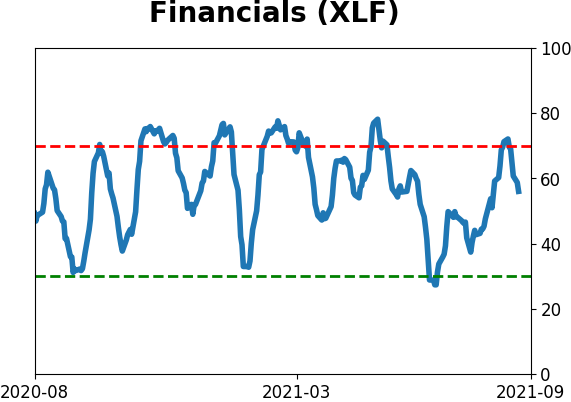
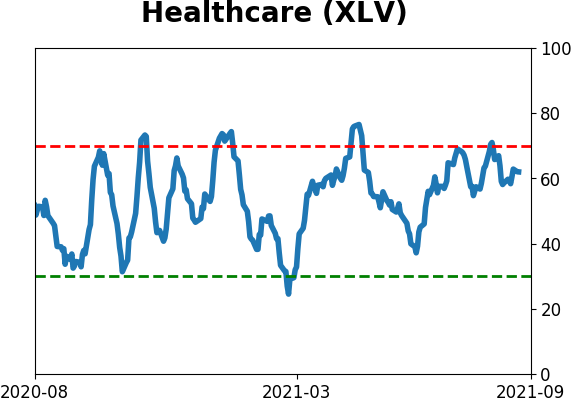
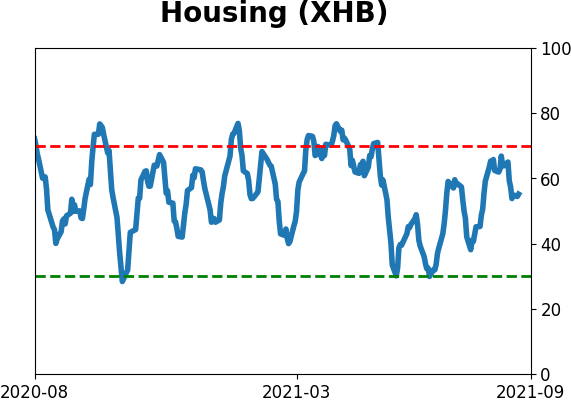
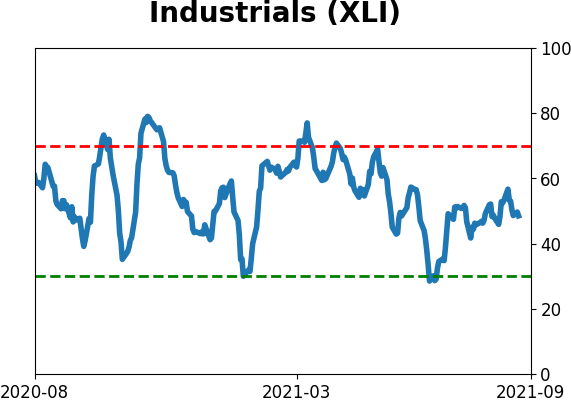
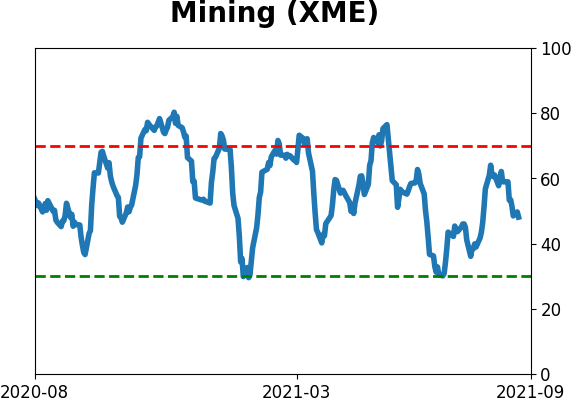
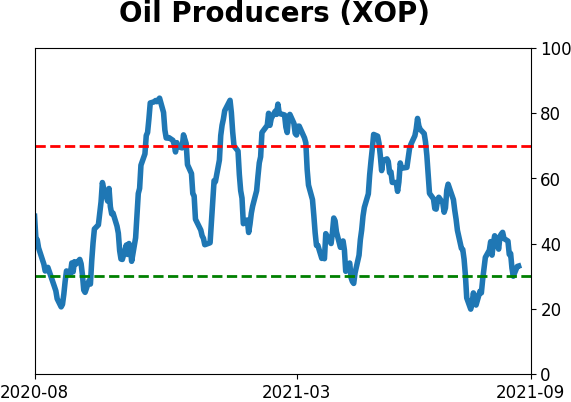
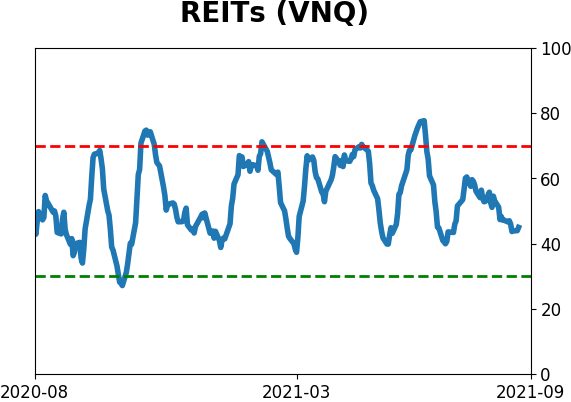
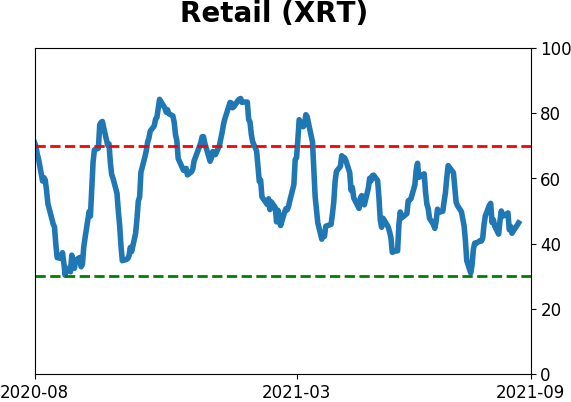
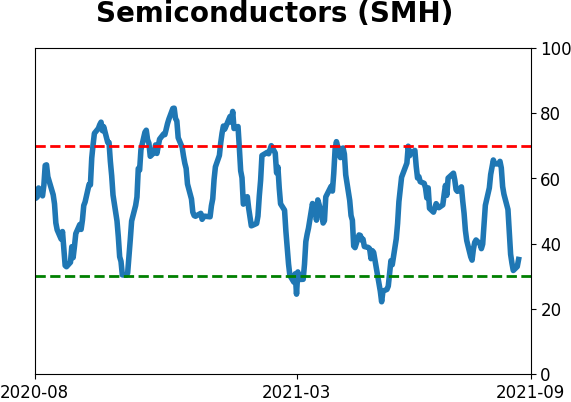
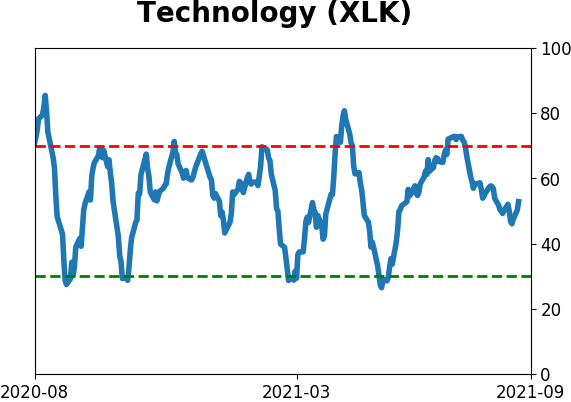
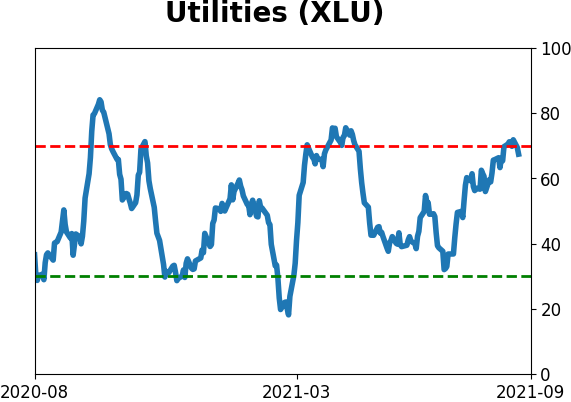
Sector ETF's - 10-Day Moving Average
|
|
|
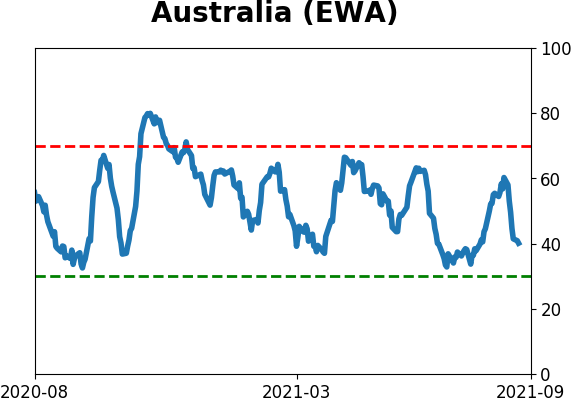
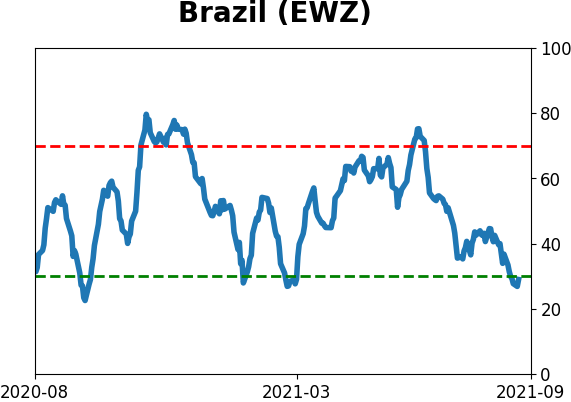
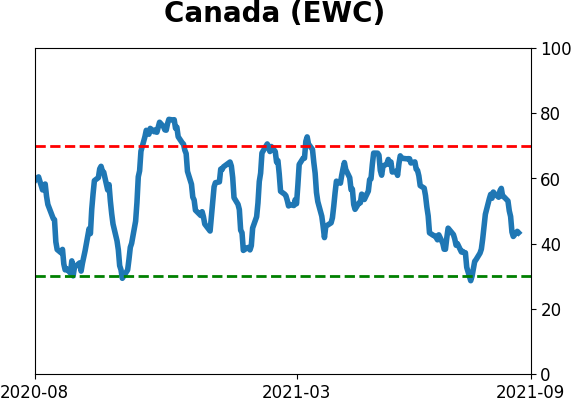
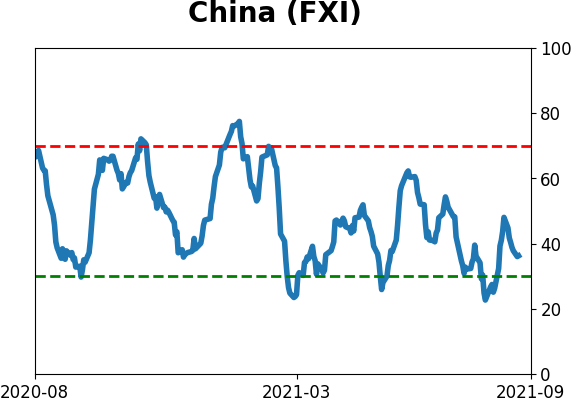
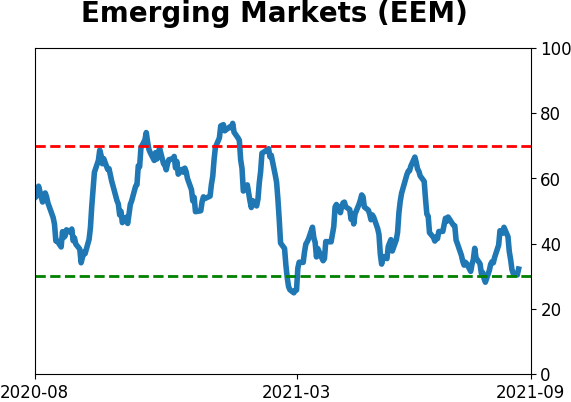
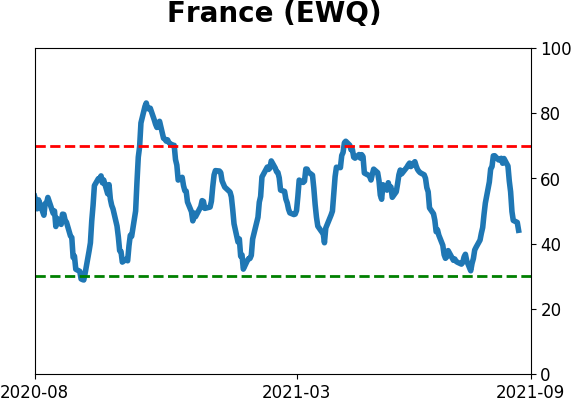
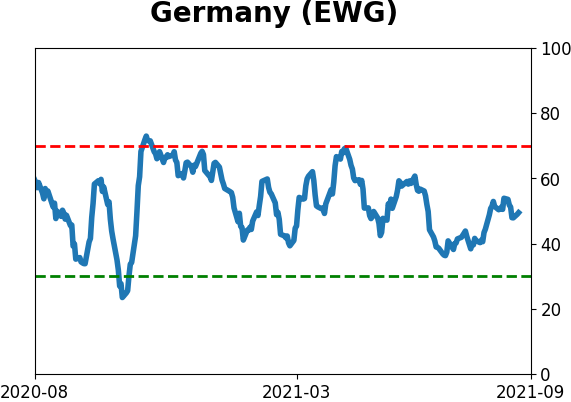
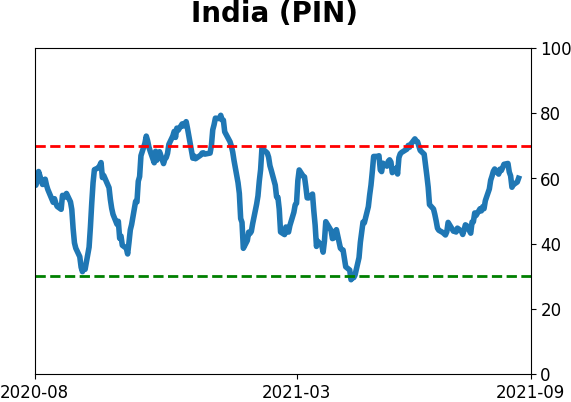
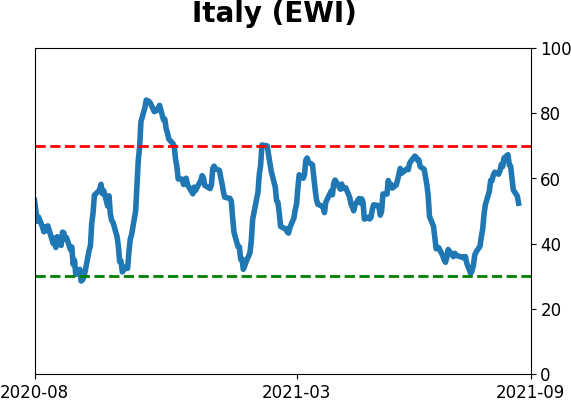
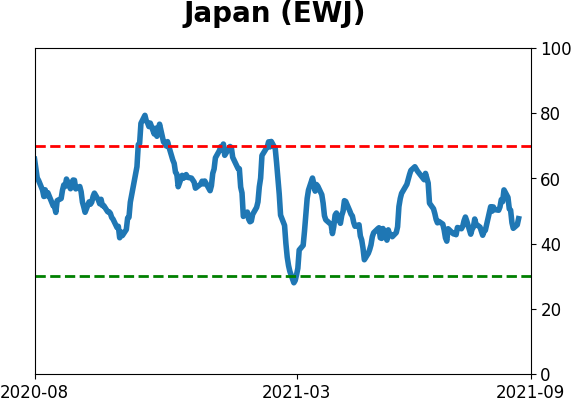
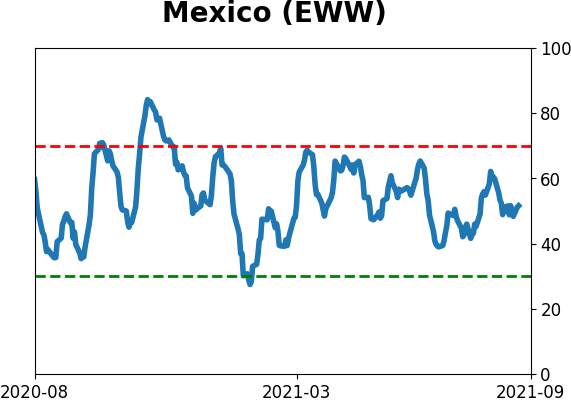
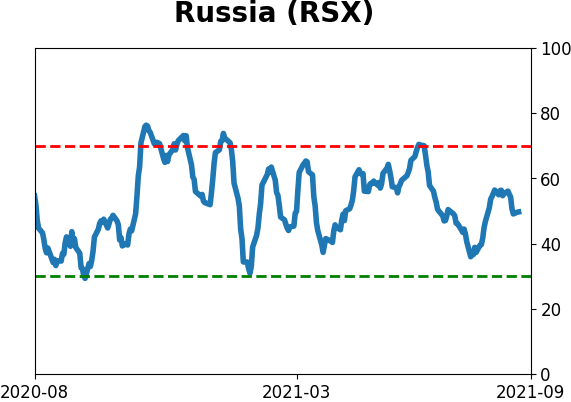
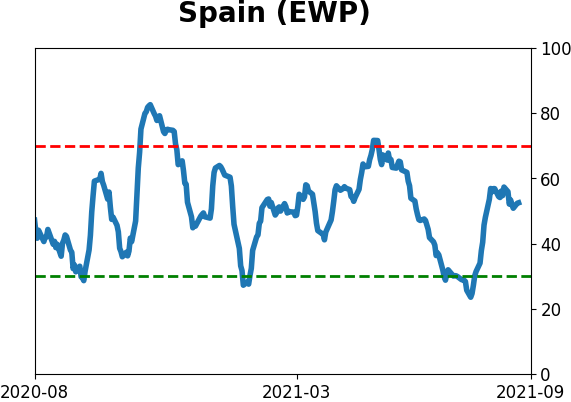
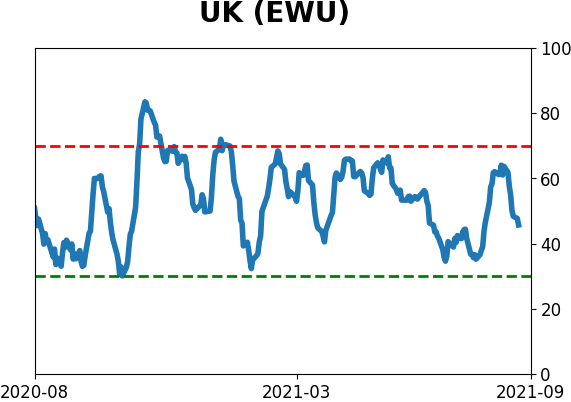
Country ETF's - 10-Day Moving Average
|
|
|
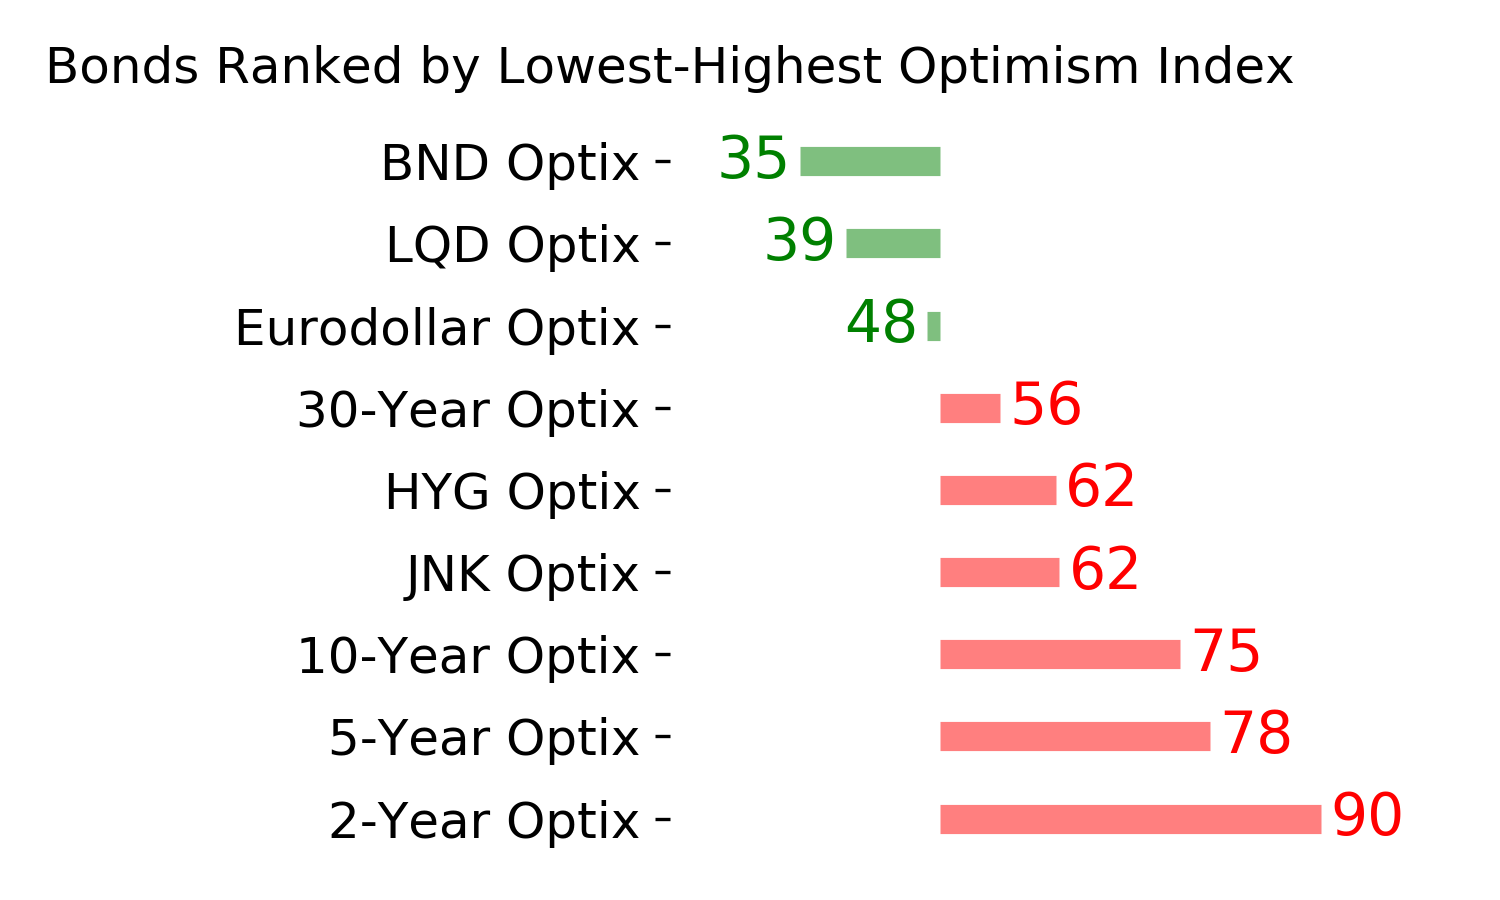
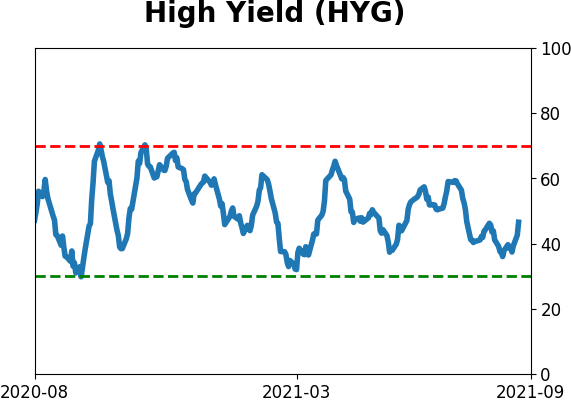
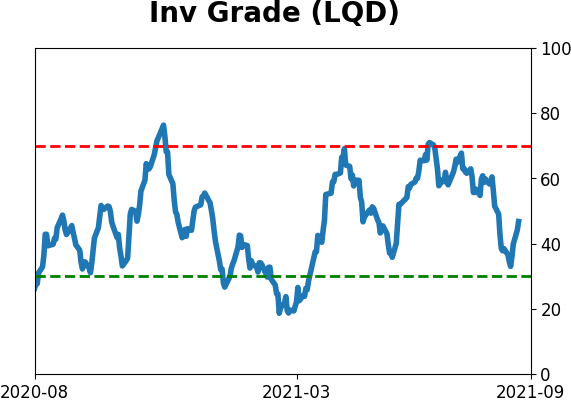
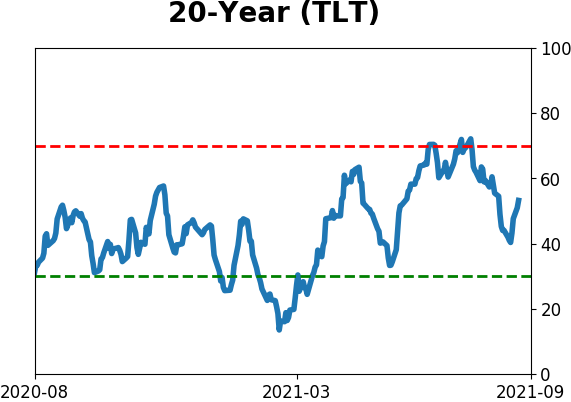
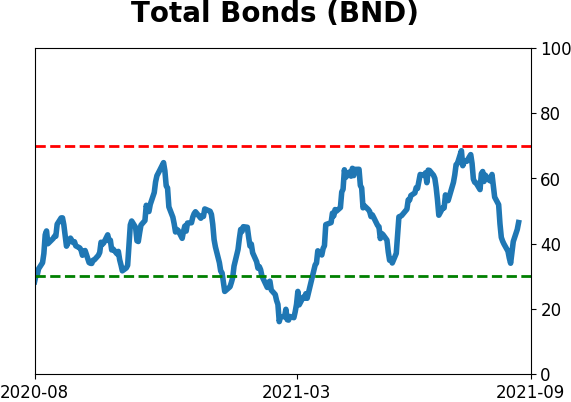
Bond ETF's - 10-Day Moving Average
|
|
|
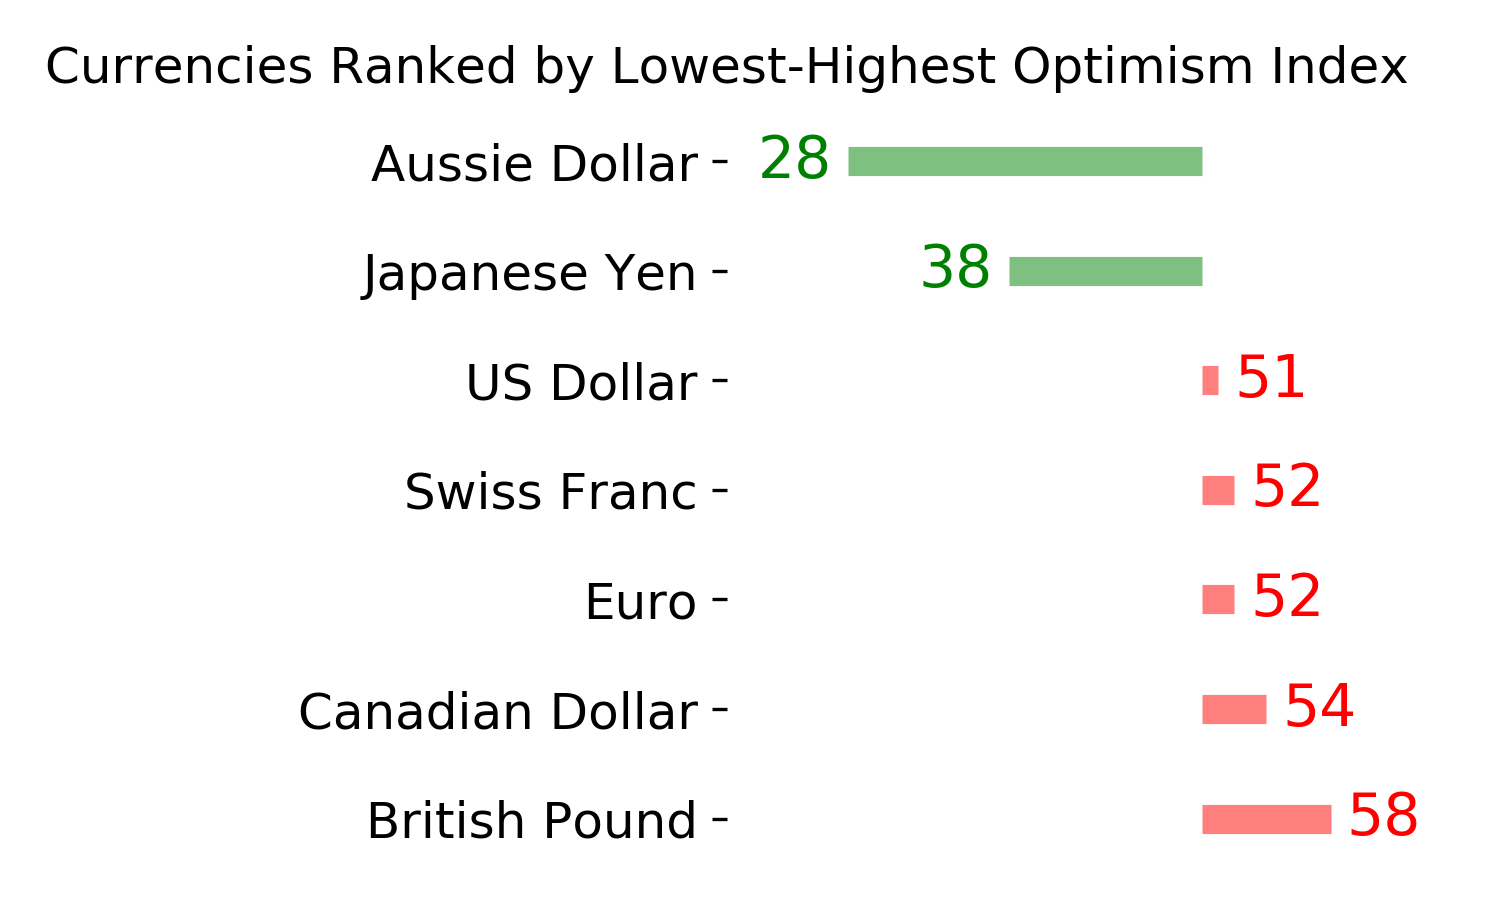
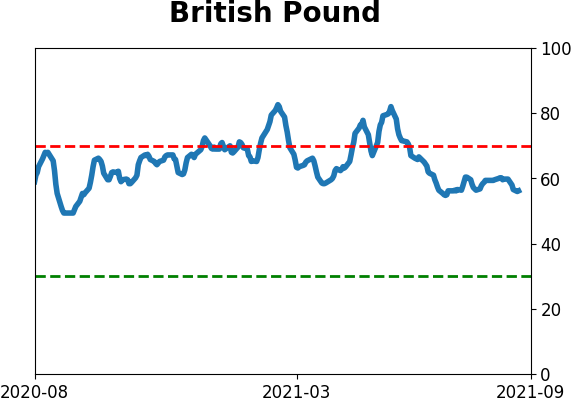
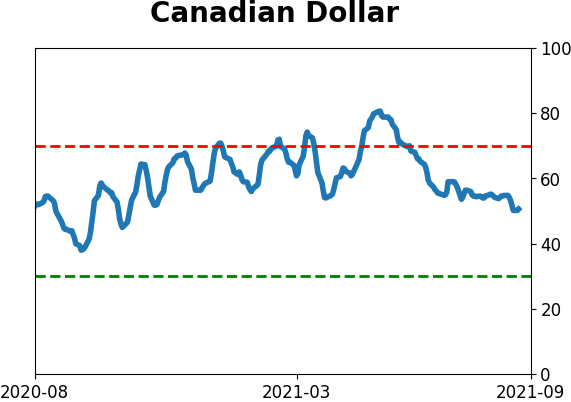
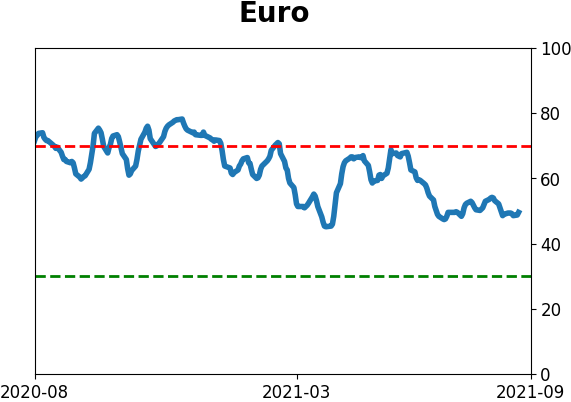
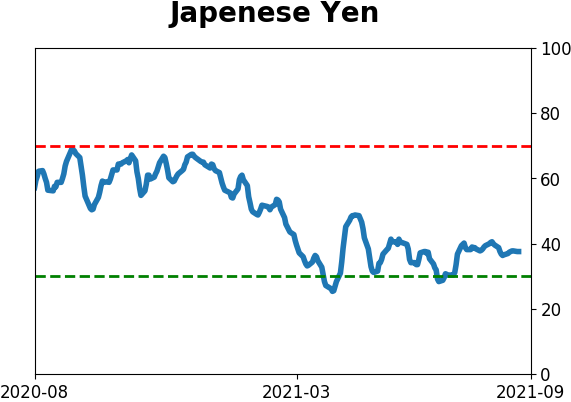
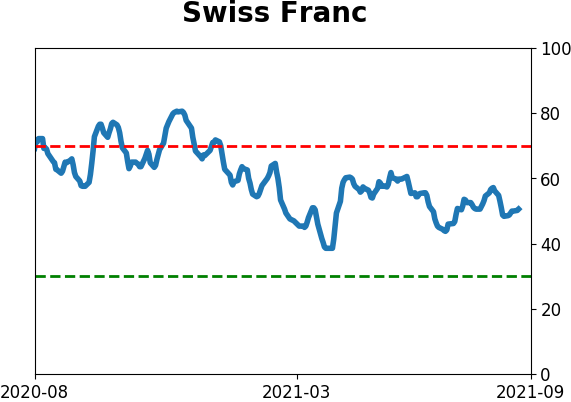
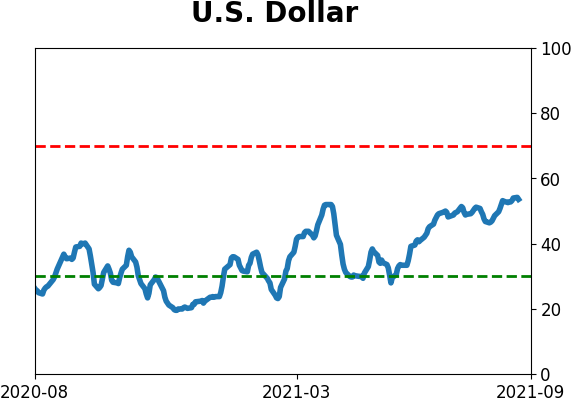
Currency ETF's - 5-Day Moving Average
|
|
|
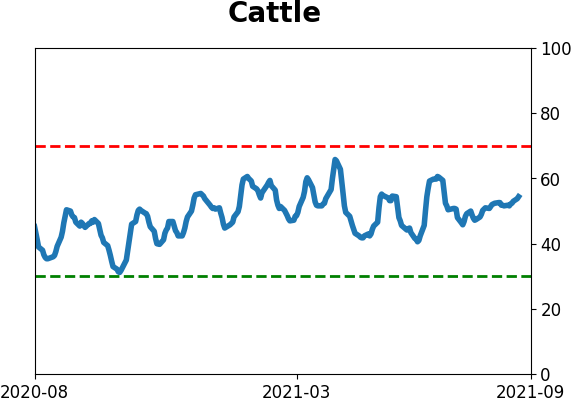
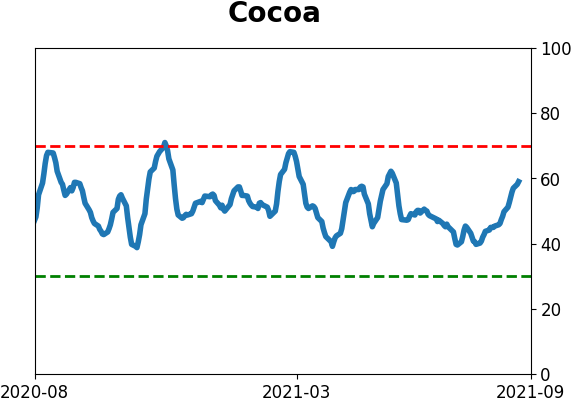
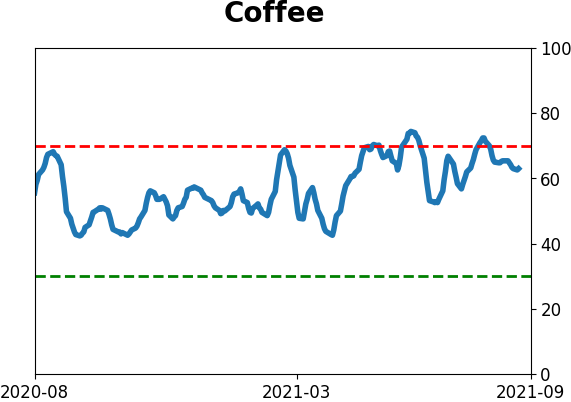
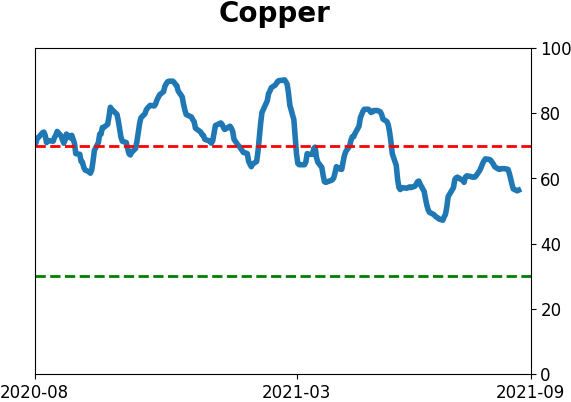
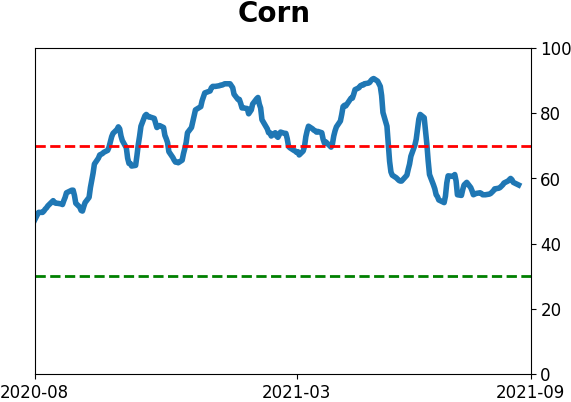
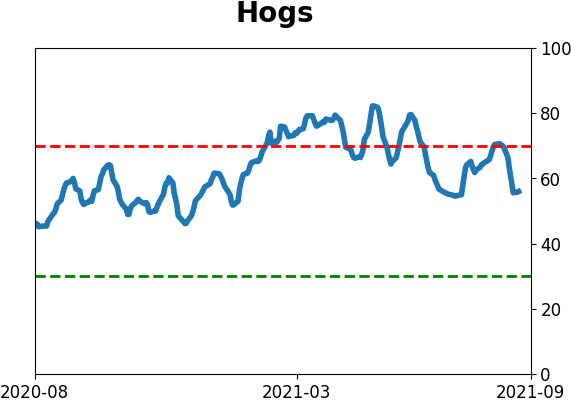
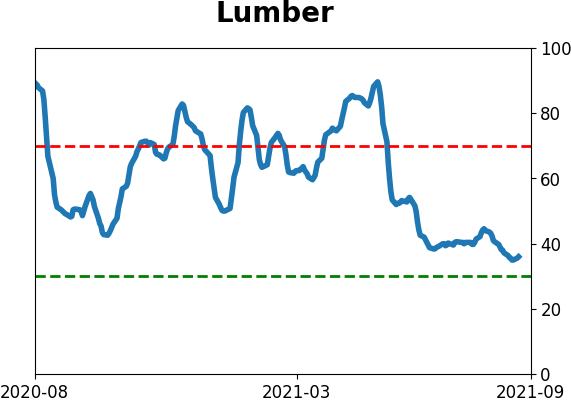
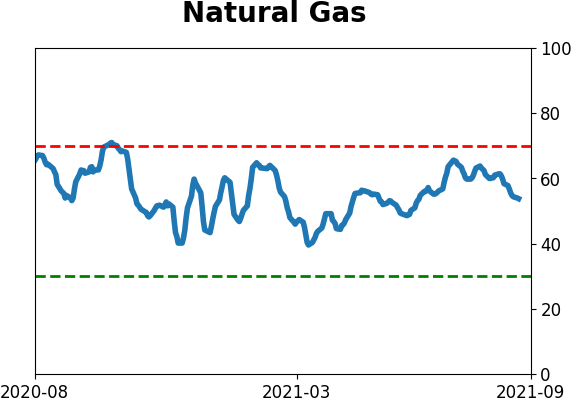
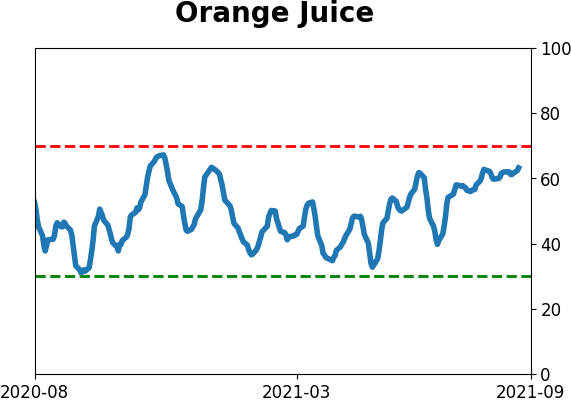
Commodity ETF's - 5-Day Moving Average
|
|