Headlines
|
|
Should we buy the retail stock bloodbath:
The Optimism Indexes for Dick's, Macy's, and Nordstrom's plunged to some of the lowest levels in history, suggesting extreme pessimism. Similar sentiment conditions did not argue for a compelling mean reversion trade higher. In most cases, the stocks continued to fall over the next few months.
|
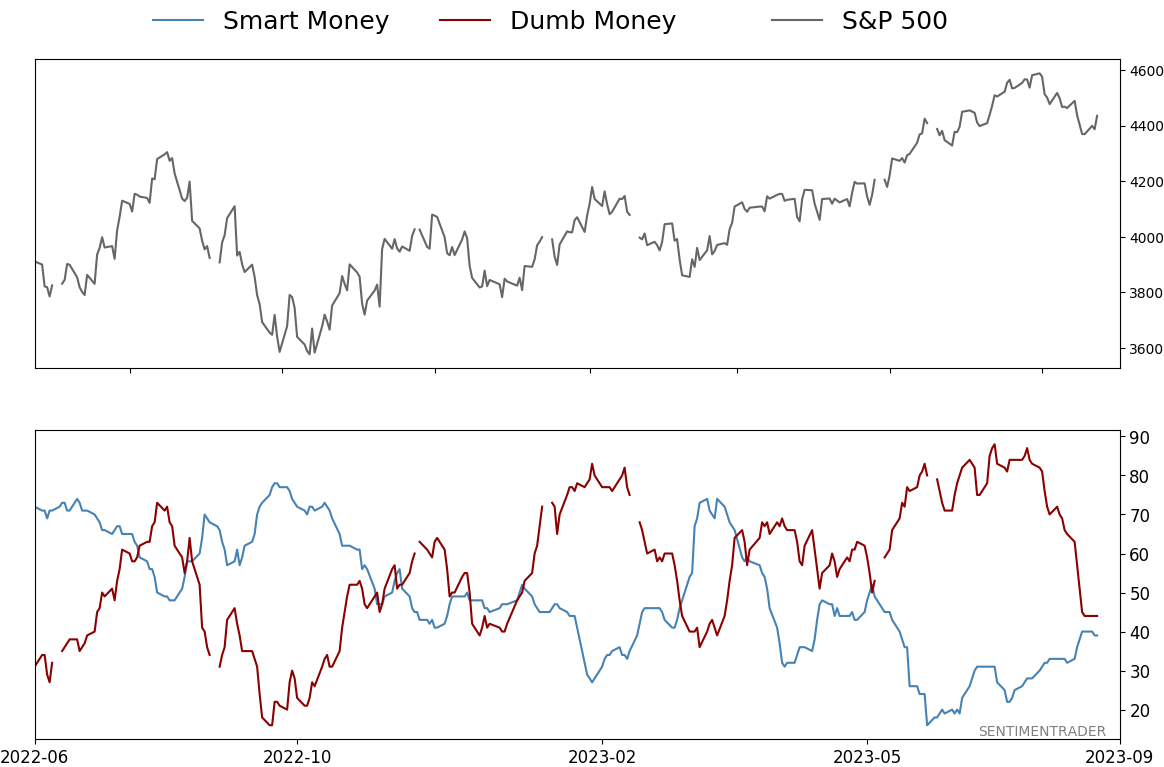
Smart / Dumb Money Confidence
|
Smart Money Confidence: 39%
Dumb Money Confidence: 44%
|
|
Risk Levels
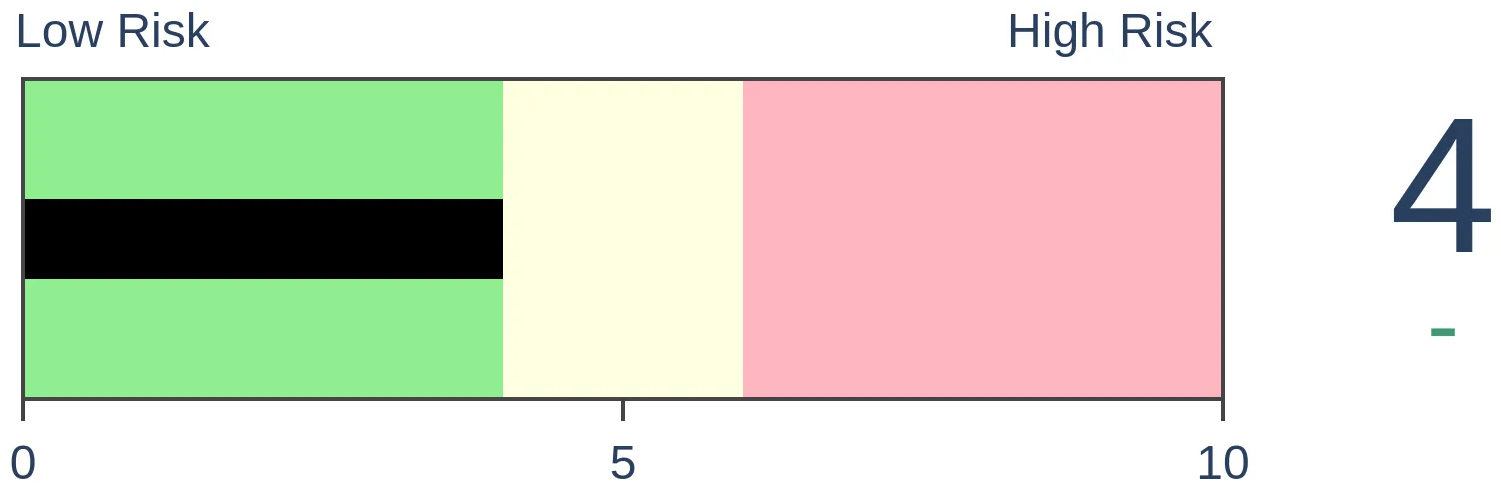
Stocks Short-Term
|
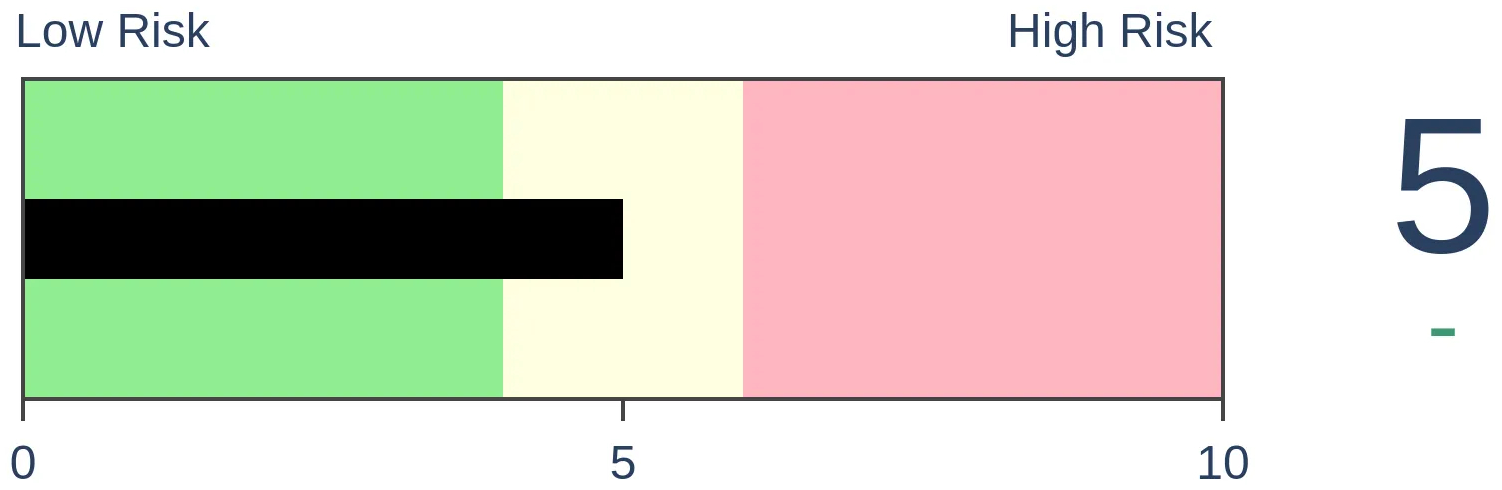
Stocks Medium-Term

|
|
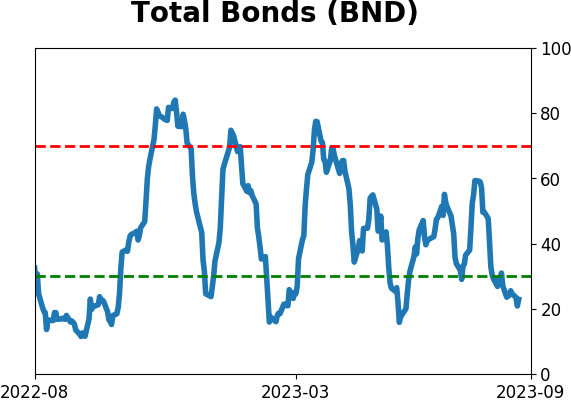
Bonds
|
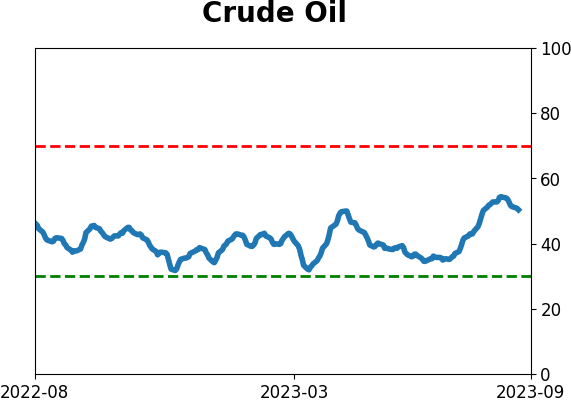
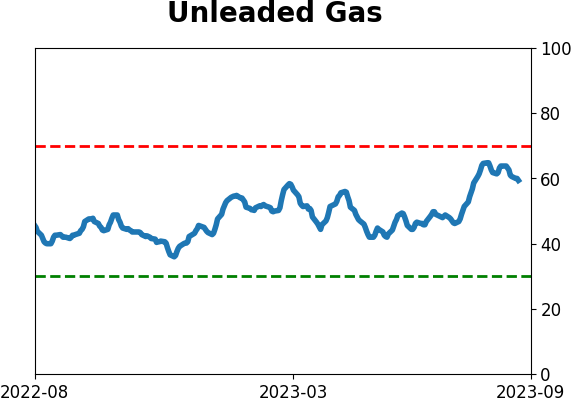
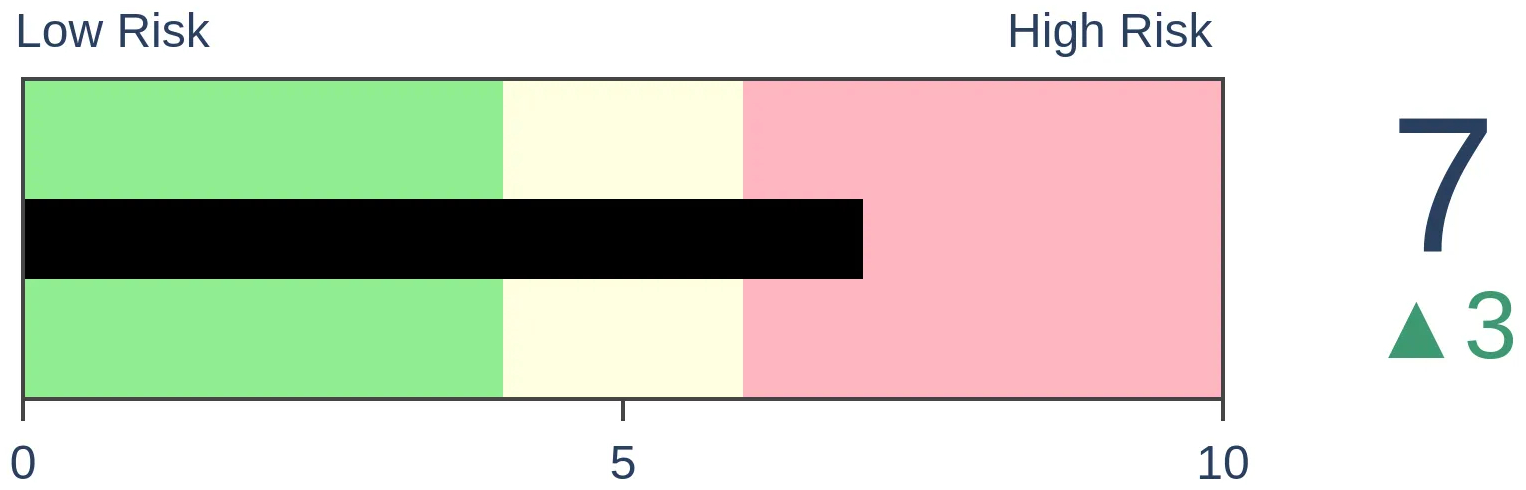
Crude Oil

|
|
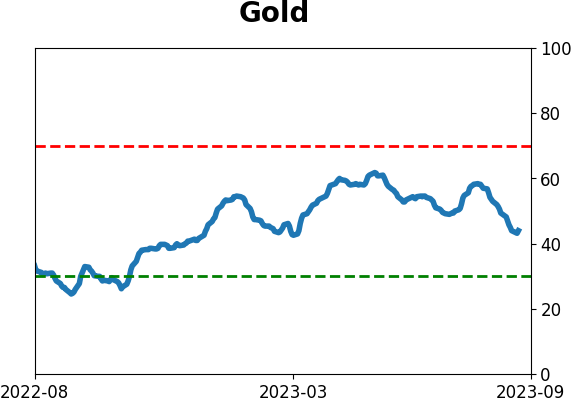
Gold
|
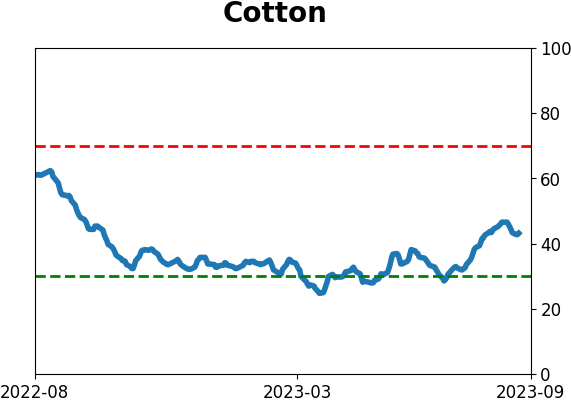
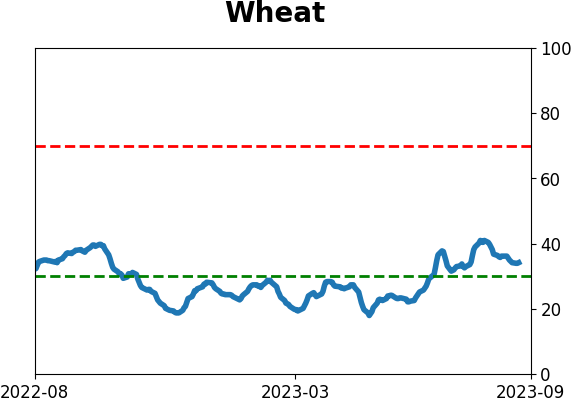
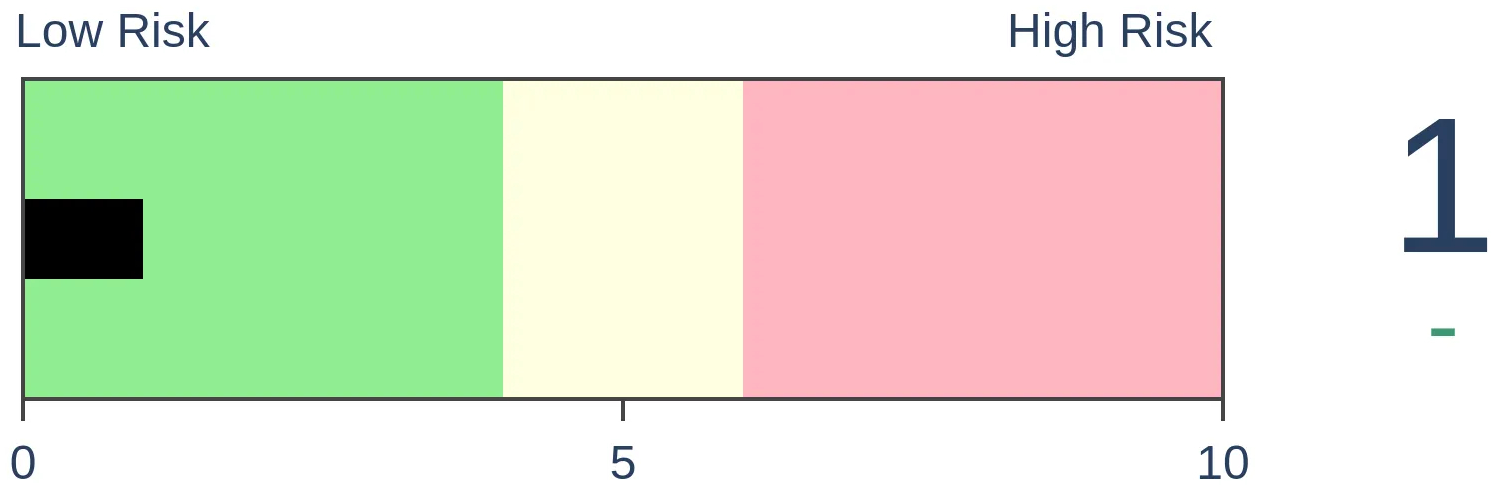
Agriculture
|
|
Research
By Dean Christians
BOTTOM LINE
The Optimism Indexes for Dick's, Macy's, and Nordstrom's plunged to some of the lowest levels in history, suggesting extreme pessimism. Similar sentiment conditions did not argue for a compelling mean reversion trade higher. In most cases, the stocks continued to fall over the next few months.
FORECAST / TIMEFRAME
None
|
Key points:
- The Optimism Indexes for several retail stocks plunged to some of the lowest levels in history
- Similar sentiment extremes suggest further downside over the next few months
Harnessing the power of the Backtest Engine to identify sentiment extremes
Each night, I sort the website's S&P 1500 Optimism Index table to research potential trade ideas. On Tuesday evening, the lowest three values for our proprietary sentiment composite pointed toward retail stocks: Dicks, Macy's, and Nordstrom's.
With sentiment composites falling to some of the lowest levels in history, let's fire up the Backtest Engine to assess if the current extreme sentiment readings can provide a trading edge.
Designed with a point-and-click interface that requires no programming skills, the Backtest Engine allows users to quickly and efficiently test trading ideas with our expansive library of indicators and models.
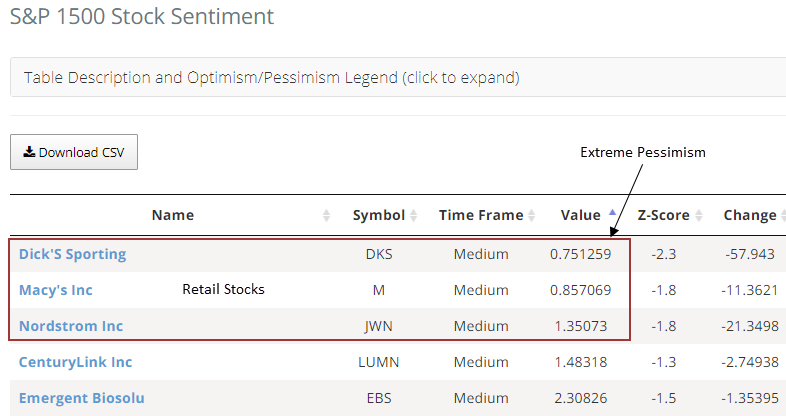
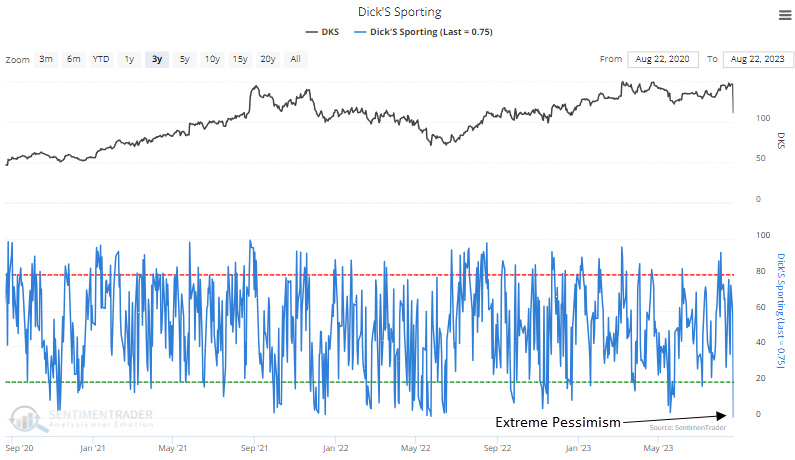
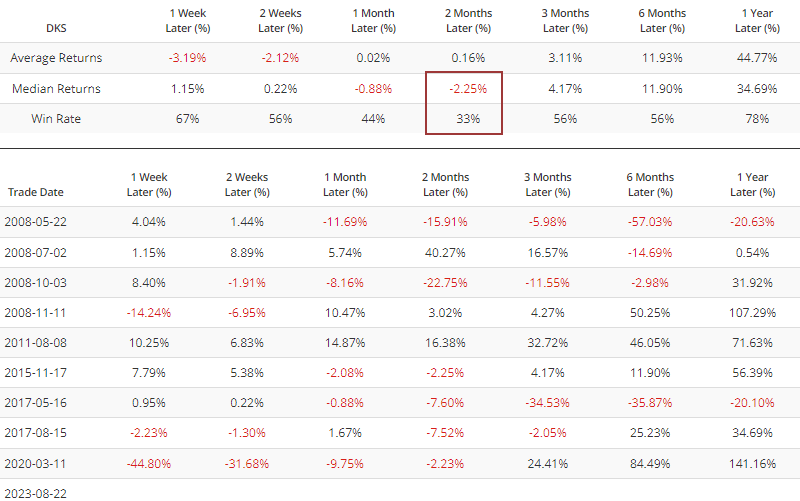
The Optimism Index for Dick's Sporting Goods (DKS) plunged to 0.75%, the lowest level since March 2020.
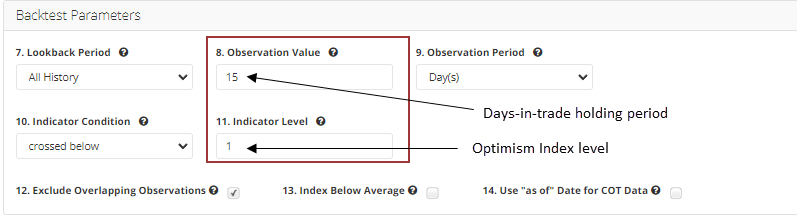
In the Backtest Engine parameters section, I'll apply an Optimism Index reading of 1% to give the signal some breathing room and use a holding period of 15 trading sessions.

The plunge in the Optimism Index below 1% suggests Dick's (DKS) could mean revert higher in the first week. However, two months later, the stock was lower 67% of the time, with a median return of -2.25%.
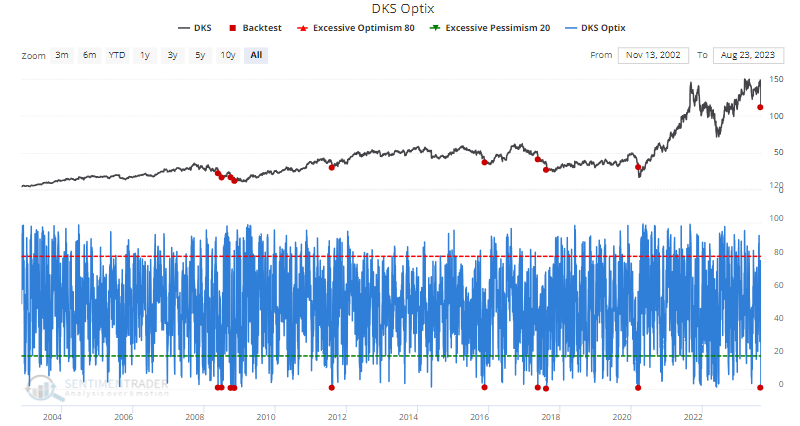
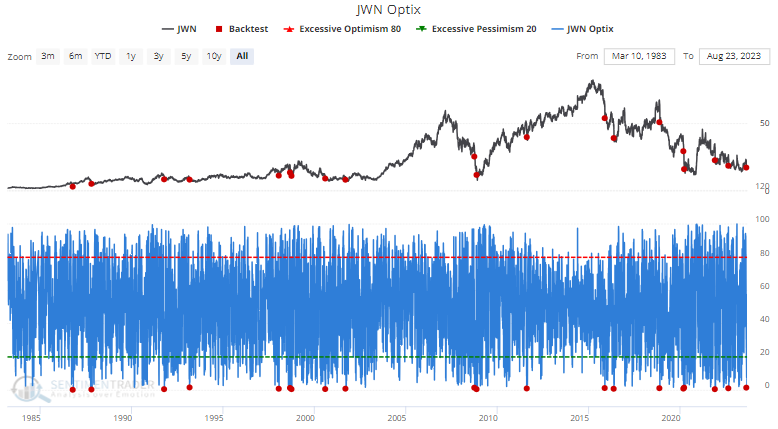
The Backtest Engine provides a chart with historical trading signals (red dots) so users can visualize the context for triggered alerts.
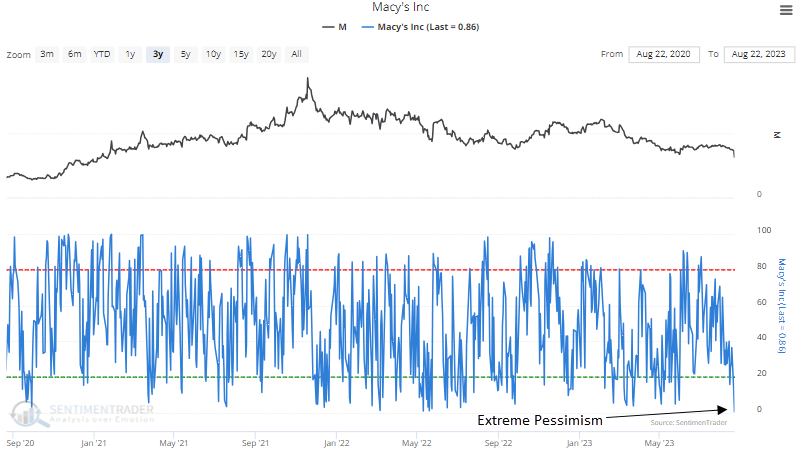
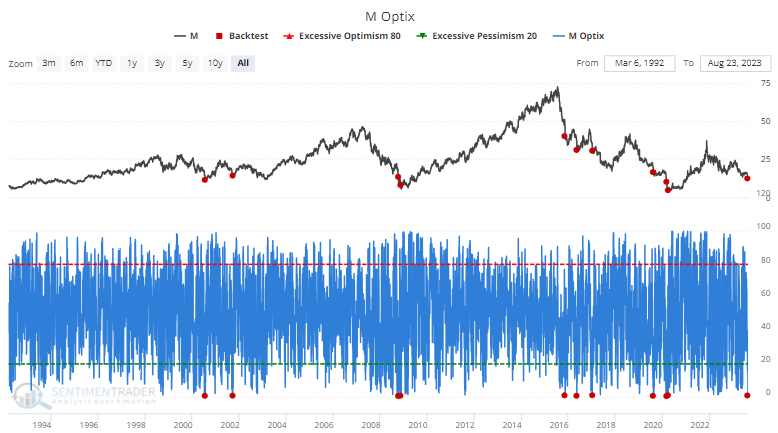
Macy's (M) witnessed its Optimism Index drop to less than 1% for only the 11th time since 2000. The pessimistic extreme reached the lowest level since April 2020.
In the Backtest Engine parameters section, I'll apply an Optimism Index reading of 1% and use a holding period of 15 trading sessions, similar to Dick's setup.
When the Optimism Index for Macy's plunges to a level like now, the stock tends to fall further in the near term. At some point over the next two weeks, Macy's was lower in 8 out of 10 cases.
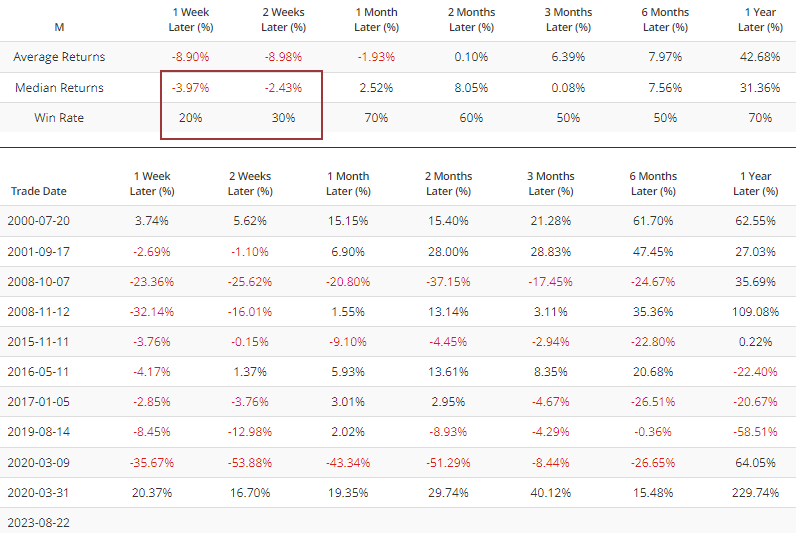
Pessimistic sentiment readings like now typically occur in significant downtrends for Macy's and the broad market. So, with the S&P 500 in an uptrend, this time is different.
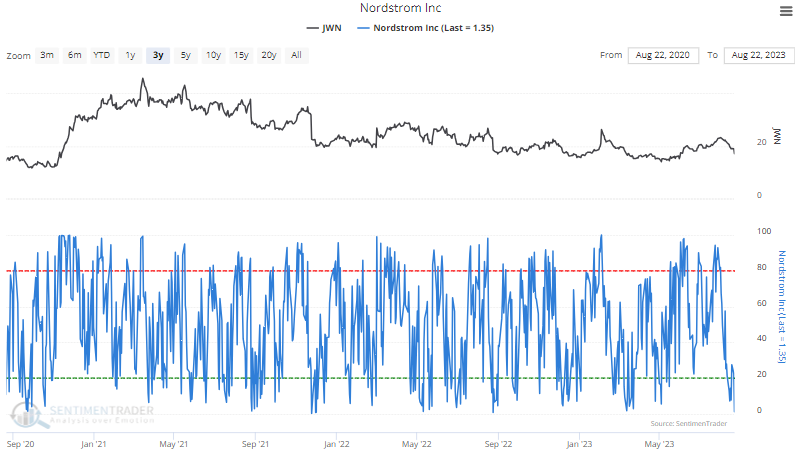
For only the 20th time since 1986, the Optimism Index for Nordstrom (JWN) plunged below 1.5%, the lowest level since August 2022.
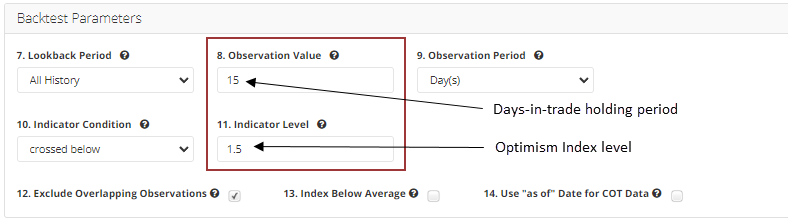
I'll use a similar days-in-trade holding period for Nordstrom but adjust the Optimism Index level to 1.5% to reflect a slightly higher reading in sentiment when compared to Dick's and Macy's.
Recent results over the next month have been weaker, with 9 out of 11 instances closing lower at some point over that time frame. Overall, Nordstrom doesn't provide a significant, long, or short edge.
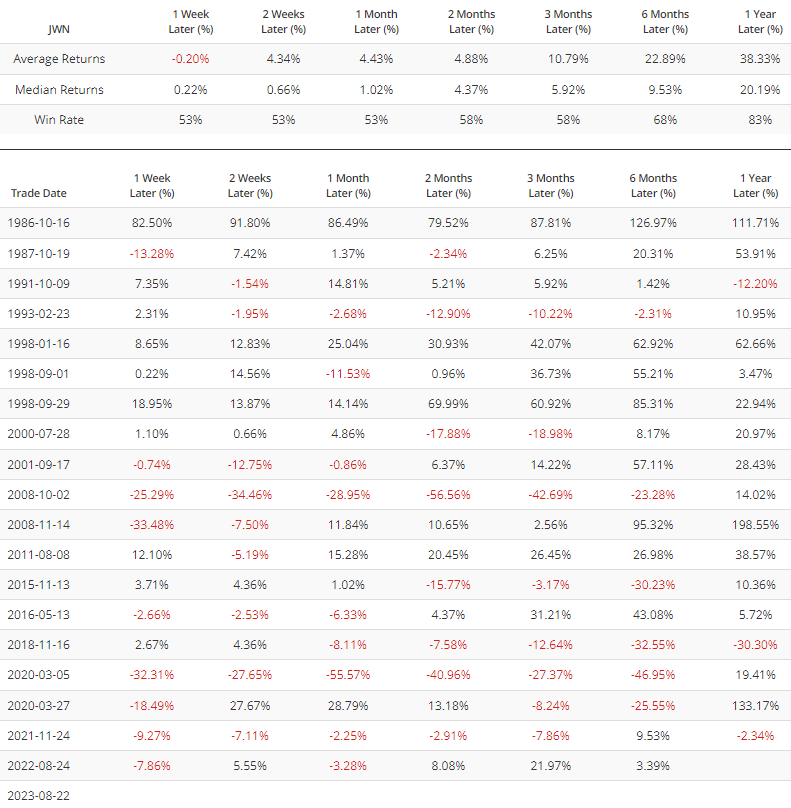
Like the other stocks, pessimistic extremes like now tend to occur in significant drawdown periods.
What the research tells us...
The Optimism Indexes for Dick's, Macy's, and Nordstrom's plunged to some of the lowest levels in history, suggesting extreme pessimism. After similar signals, the stocks tend to decline further over the next few months. When stocks react unfavorably to pessimistic sentiment conditions like now, all is not well. By using our proprietary indicators, data visualizations, and backtest engine, investors can quickly and efficiently test trading ideas like the ones in today's research note.
Indicators at Extremes
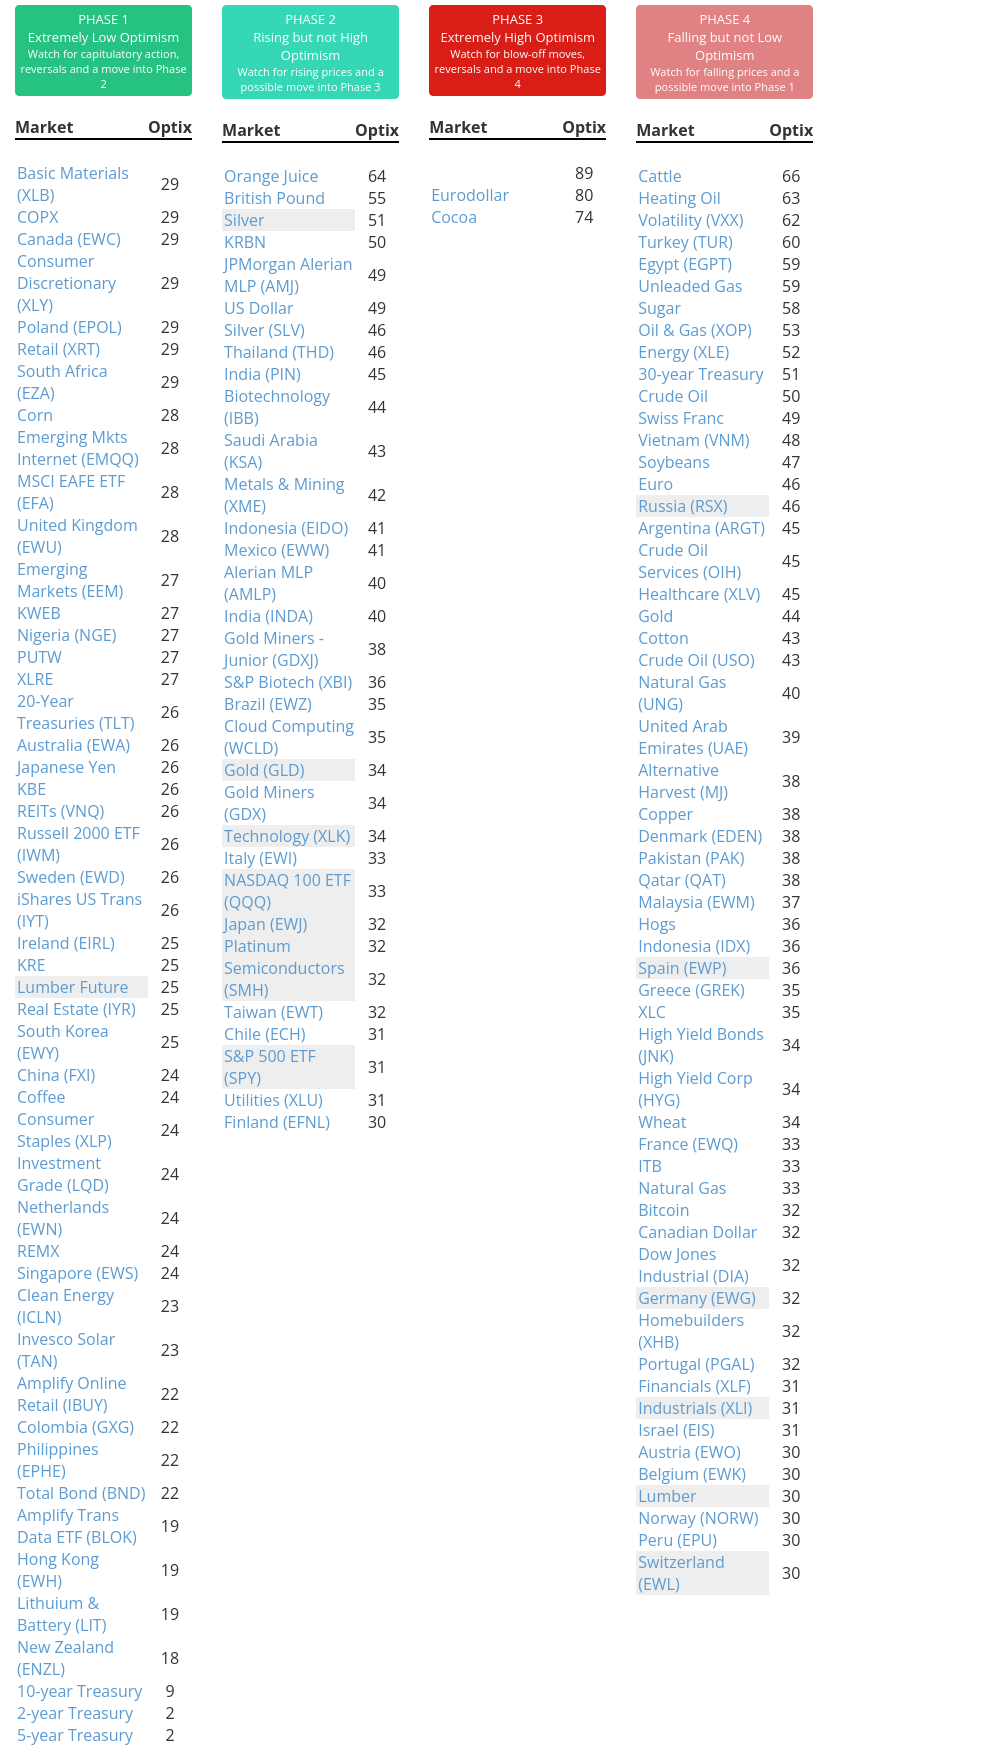
Phase Table
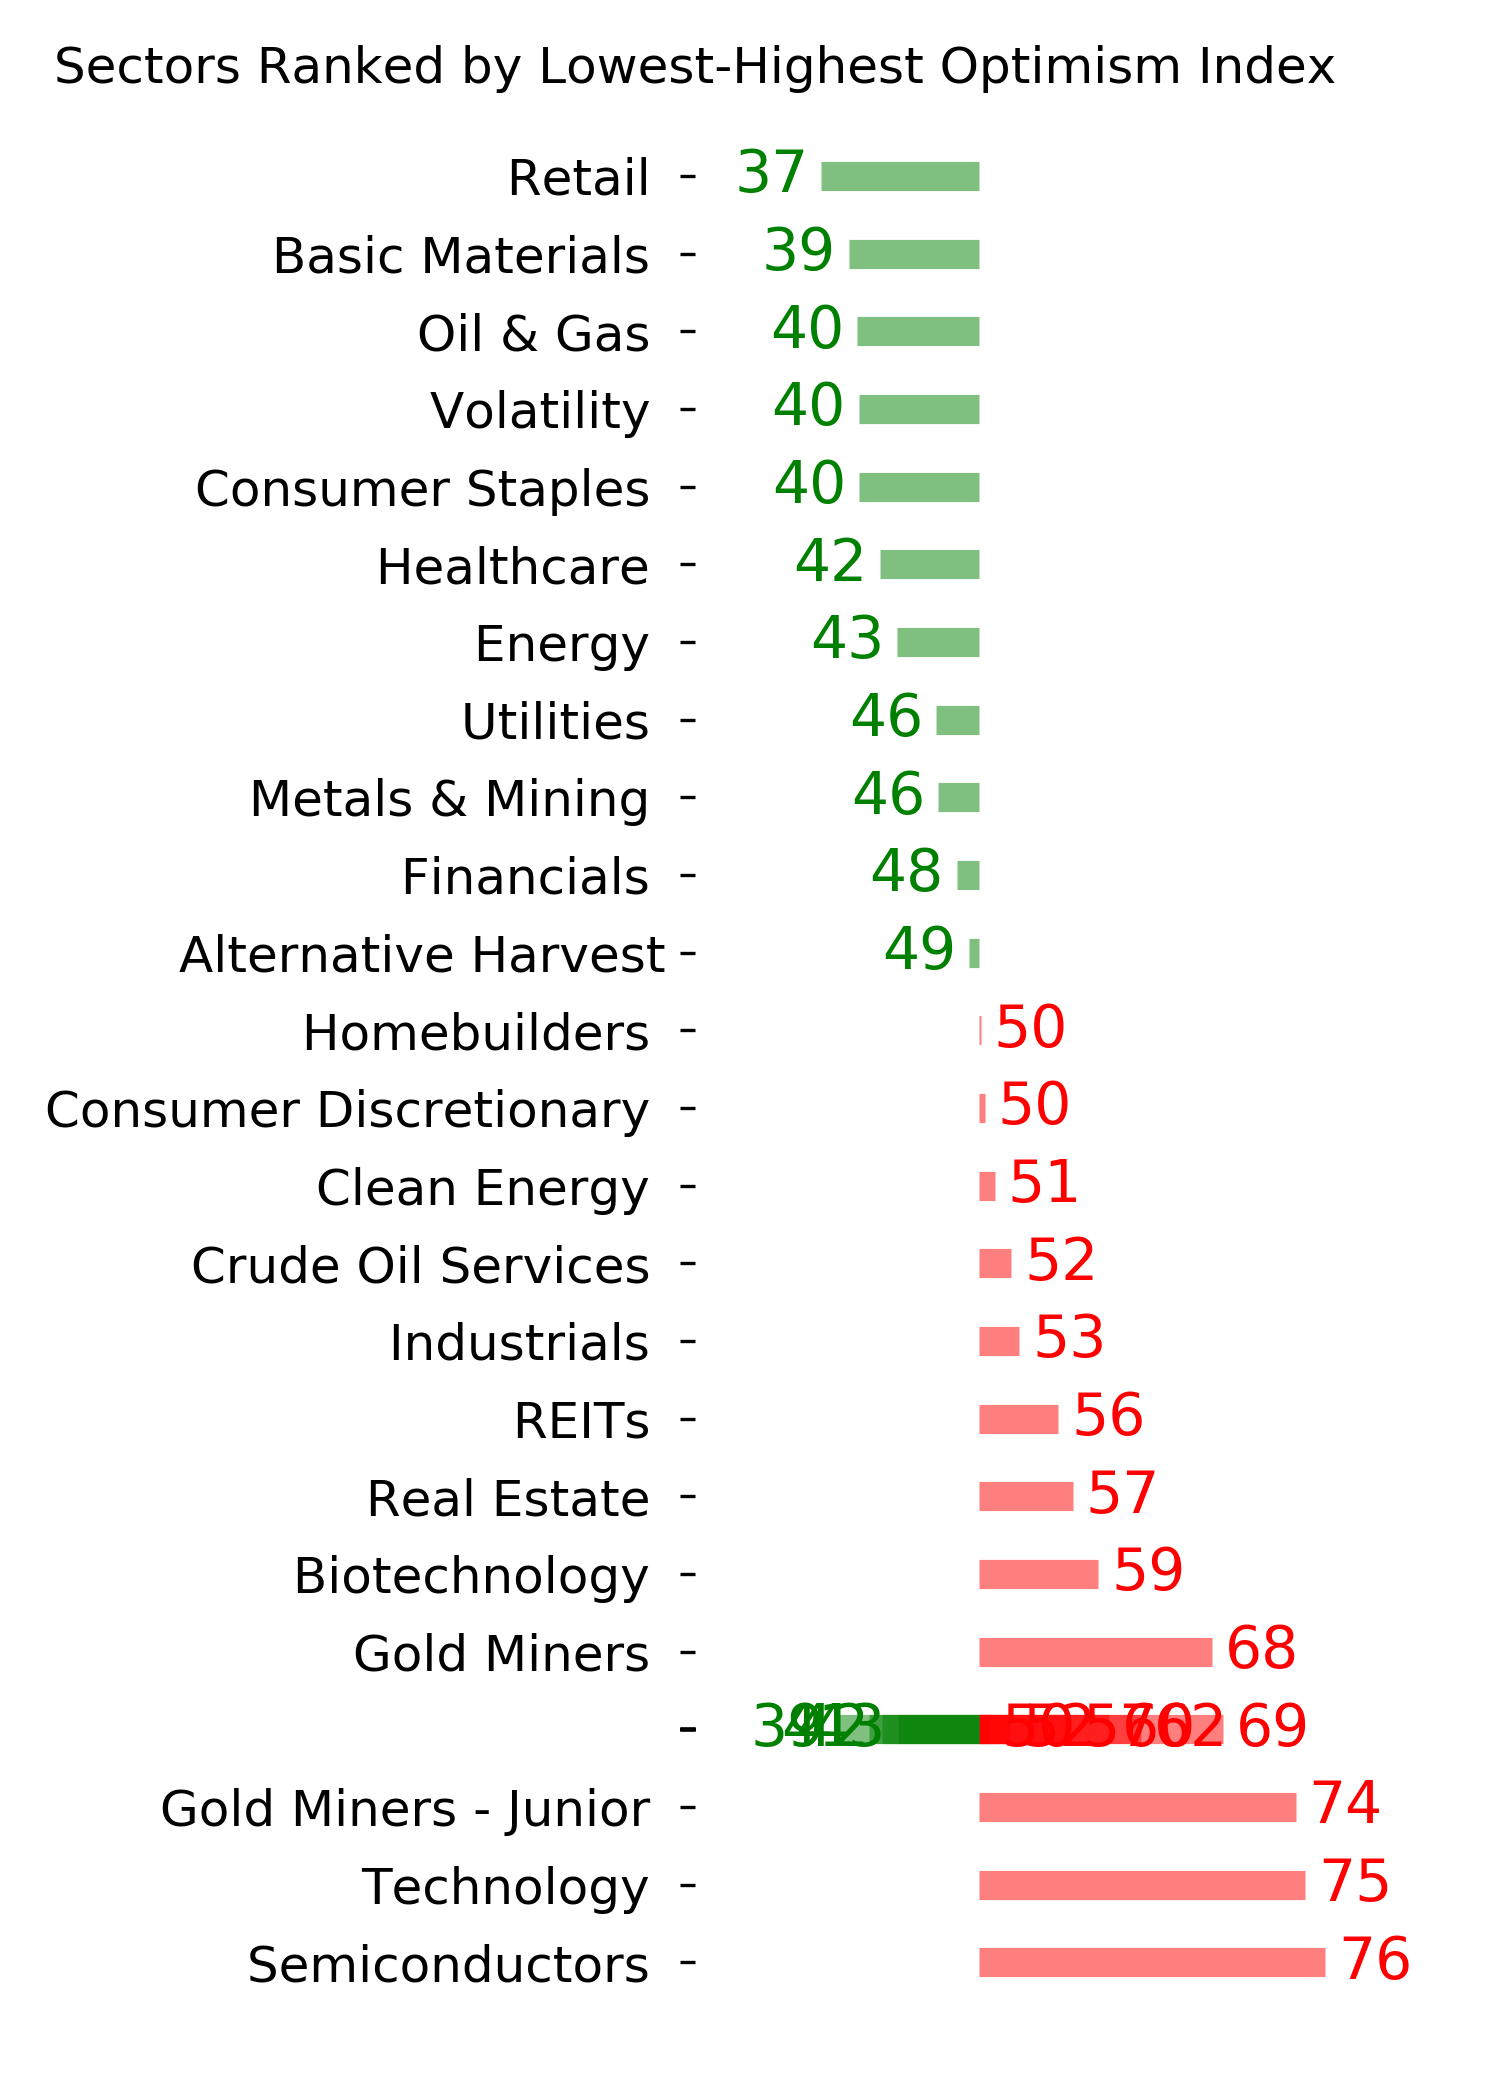
Ranks
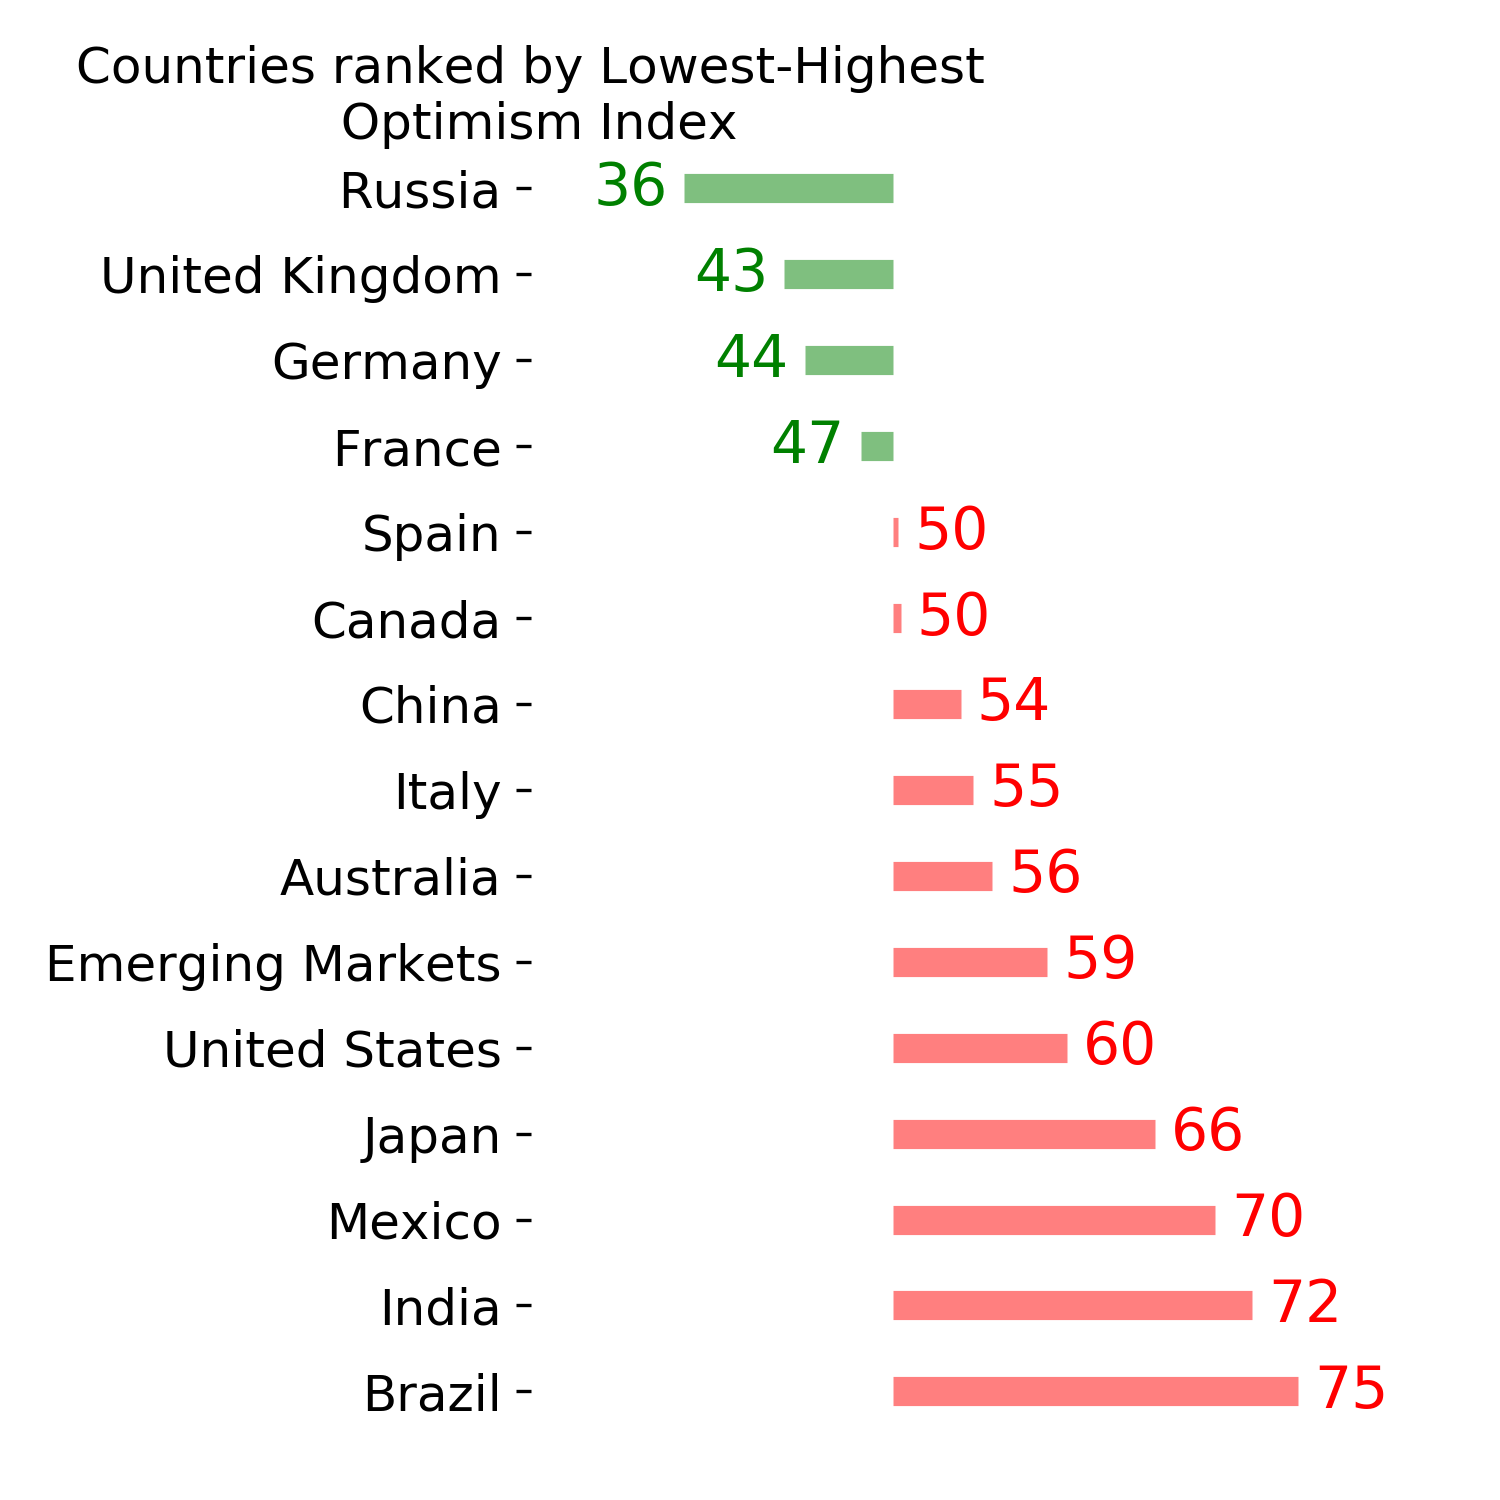
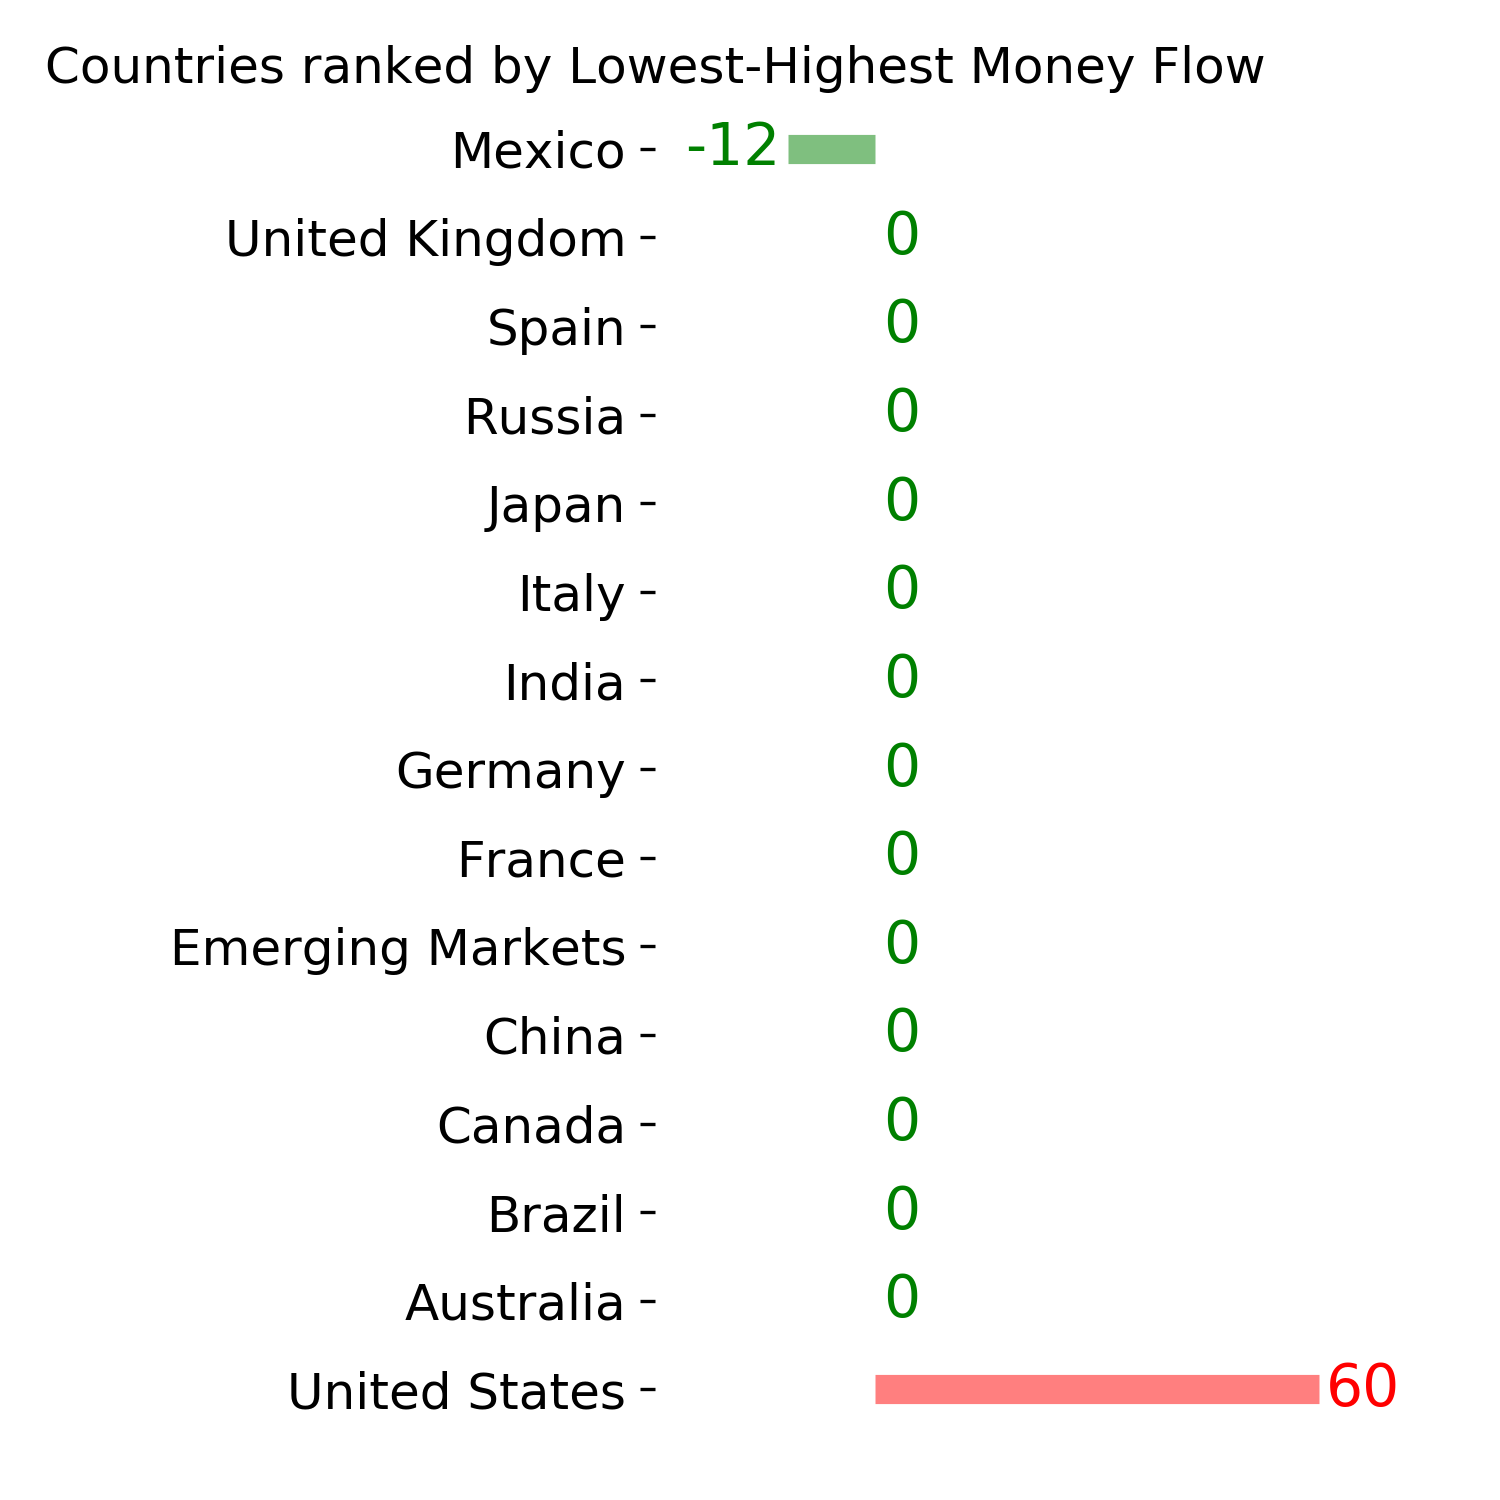
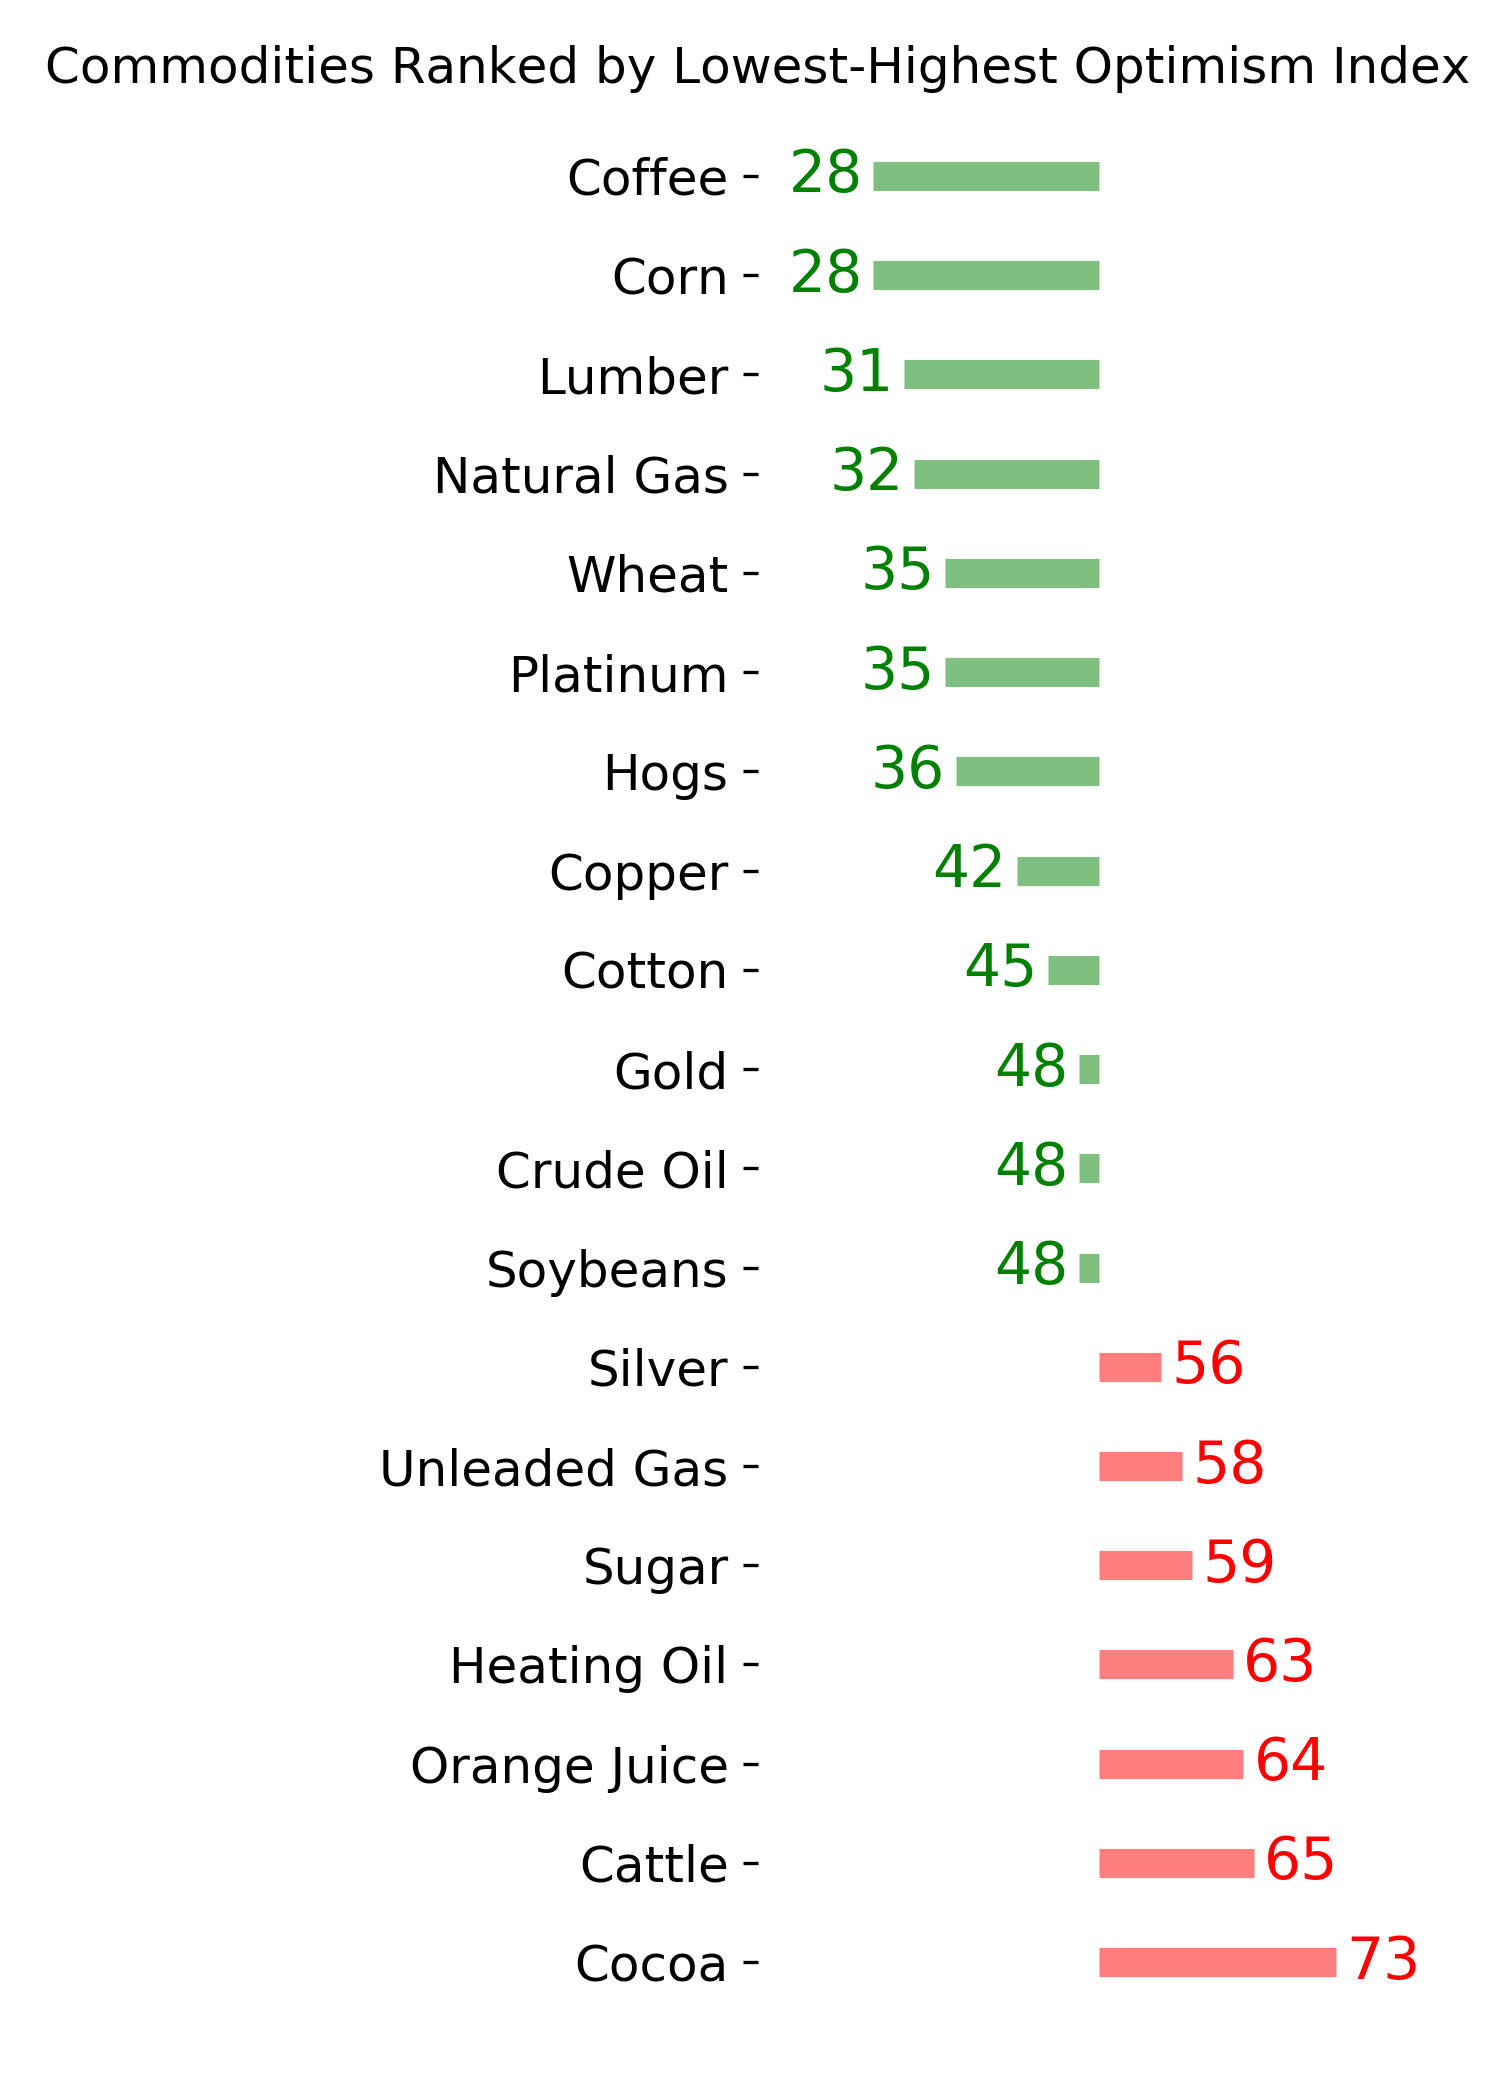
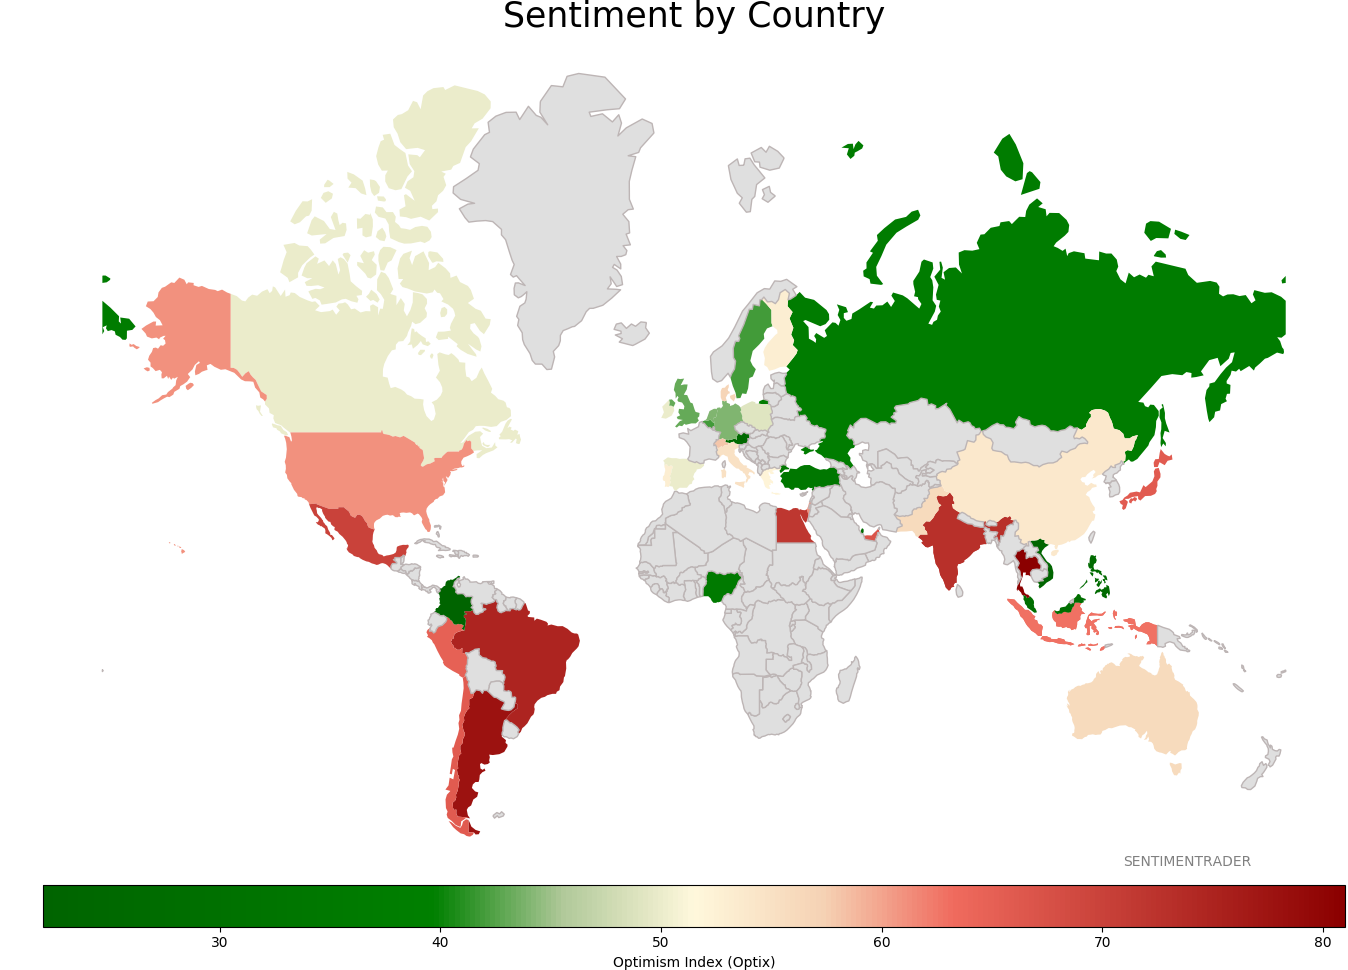
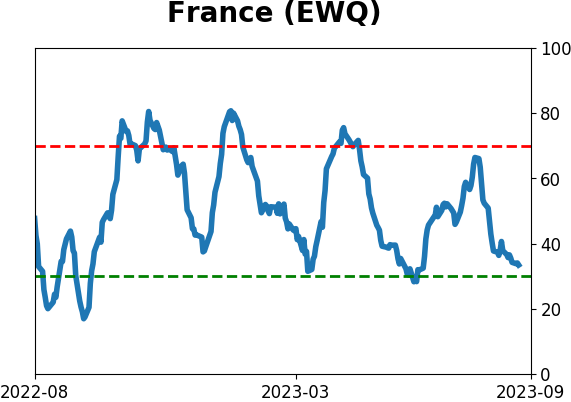
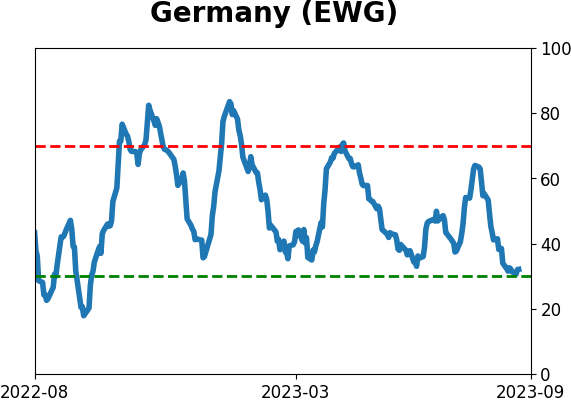
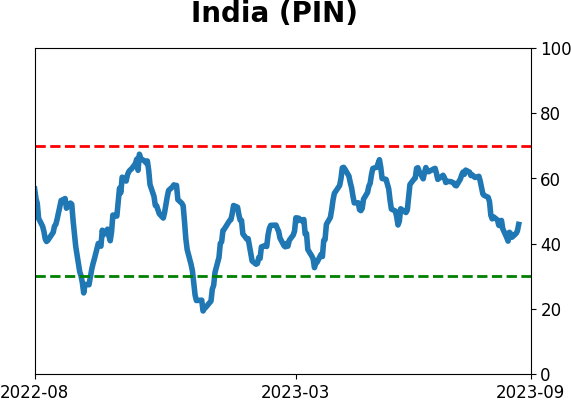
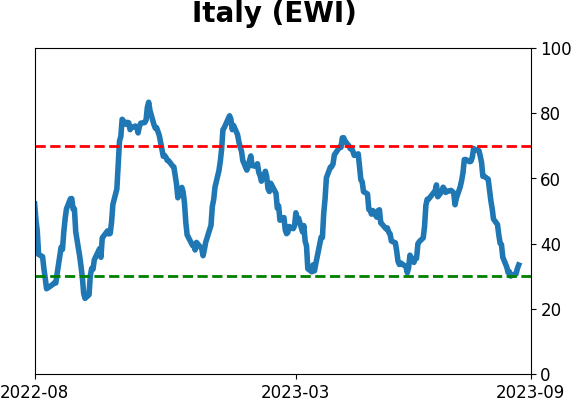
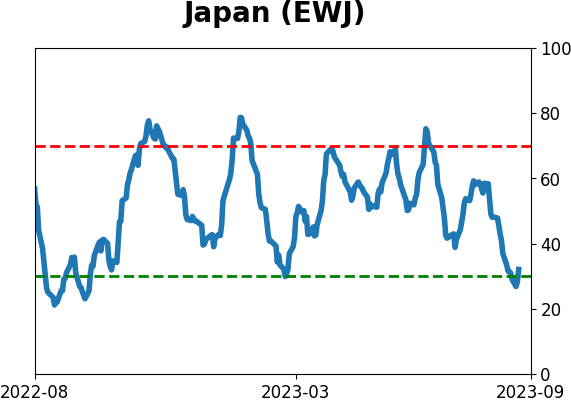
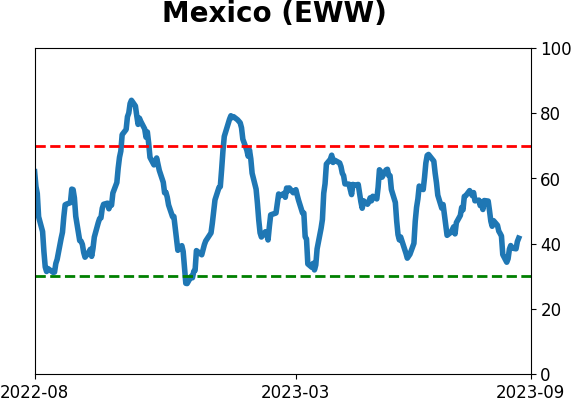
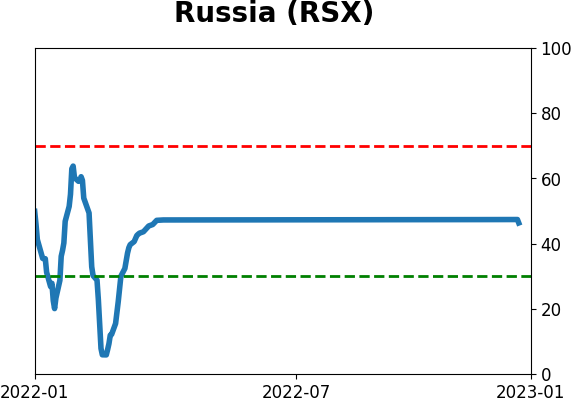
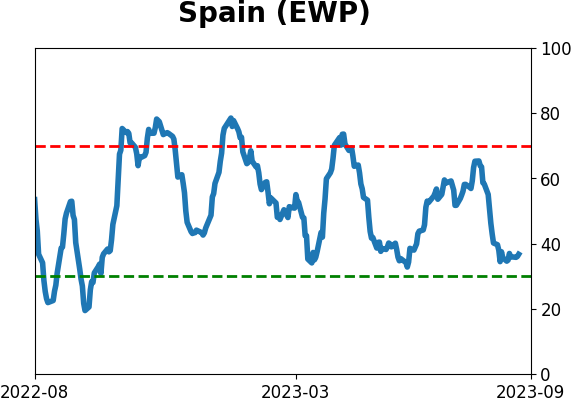
Sentiment Around The World
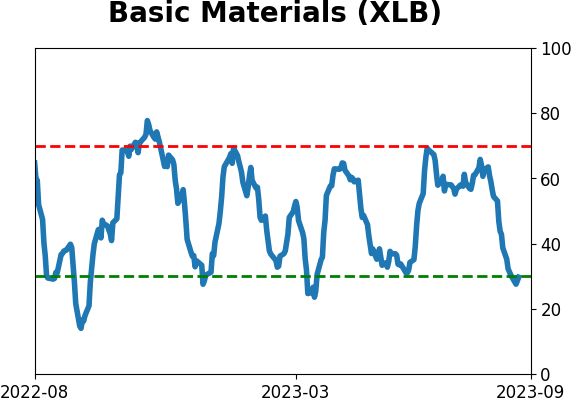
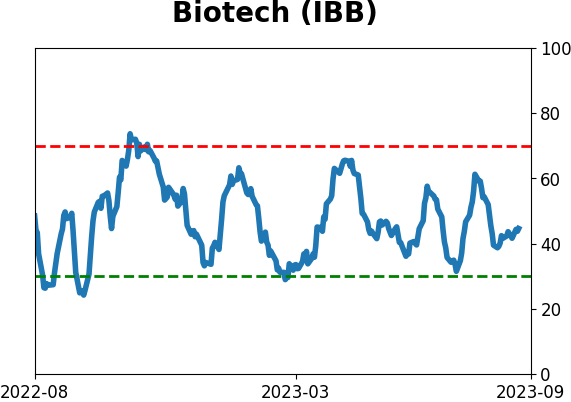
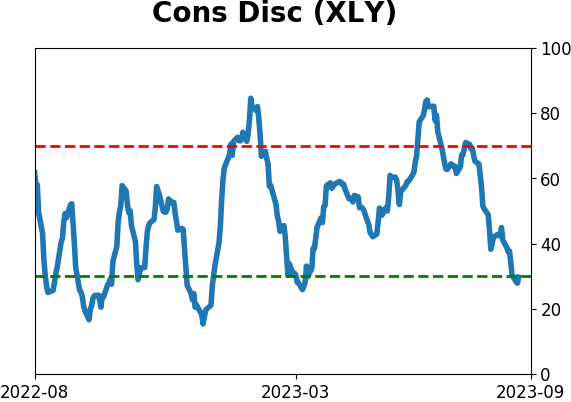
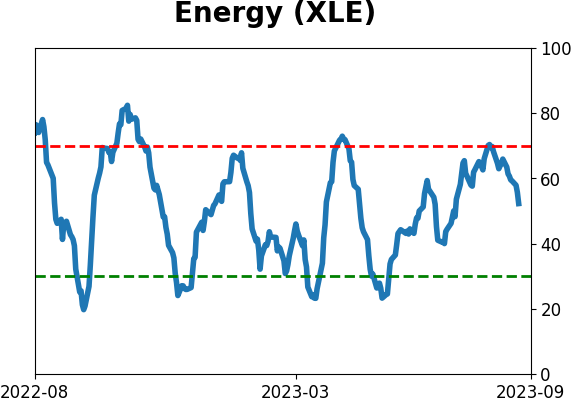
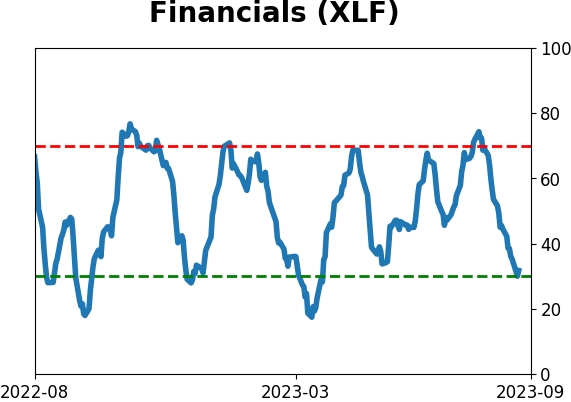
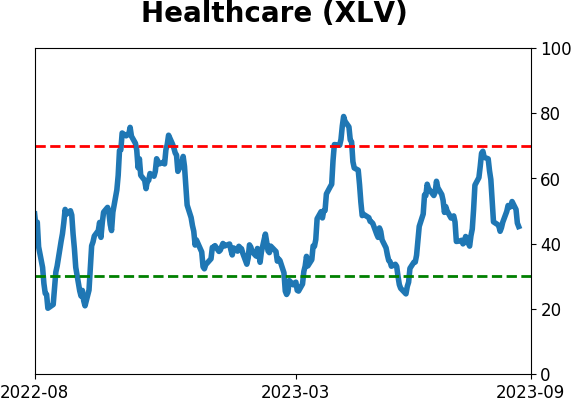
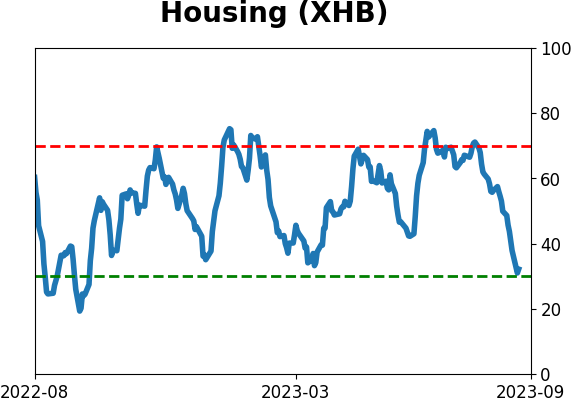
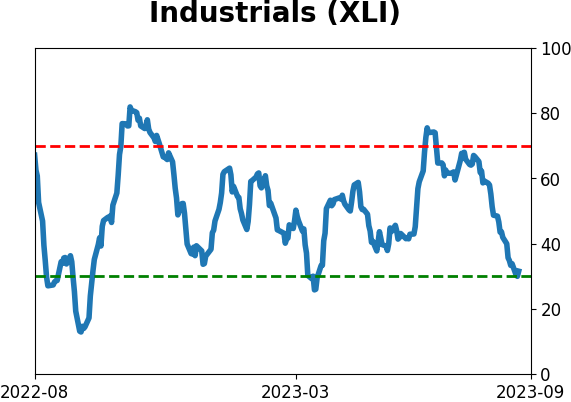
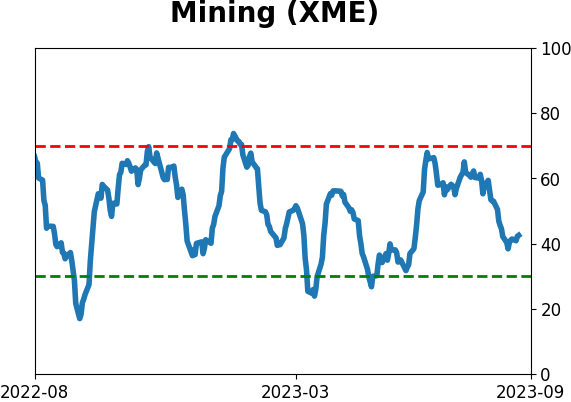
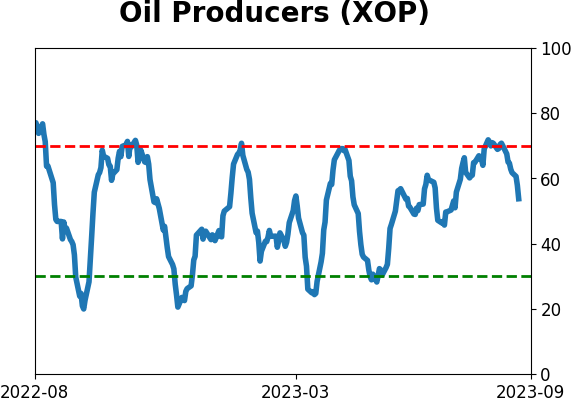
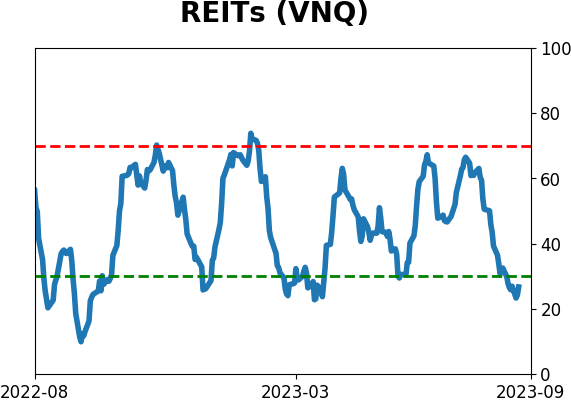
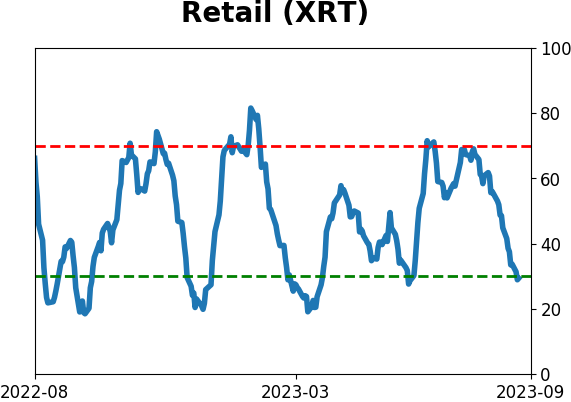
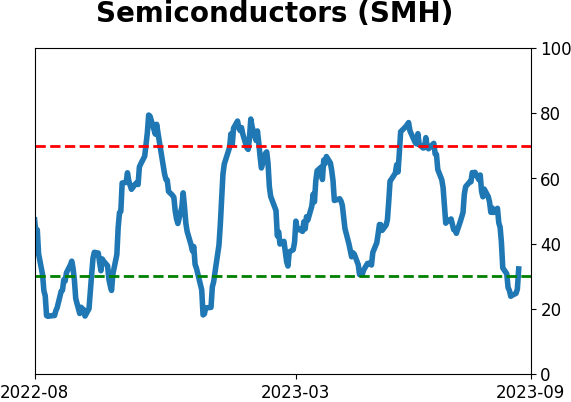
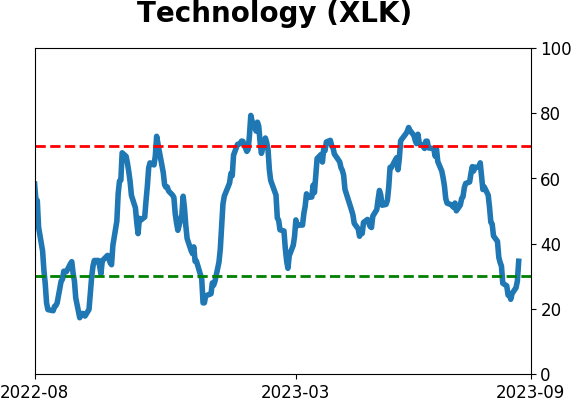
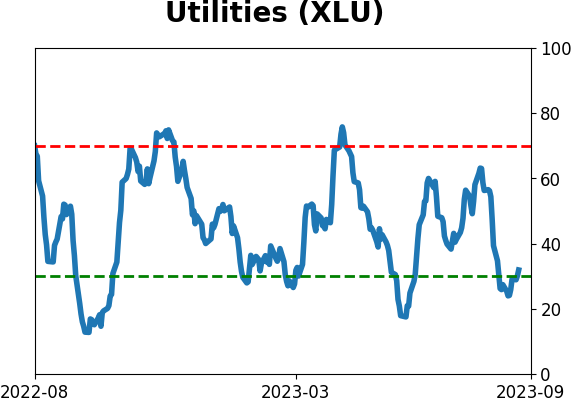
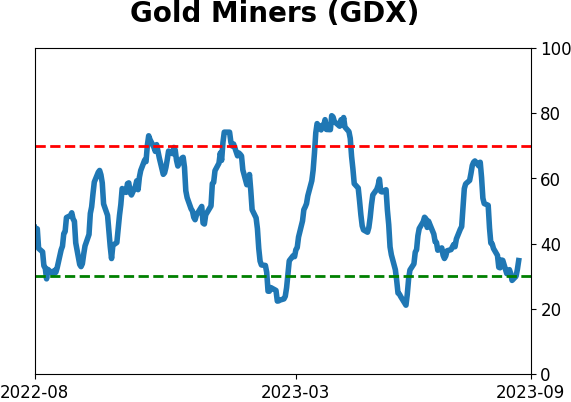
Optimism Index Thumbnails
|
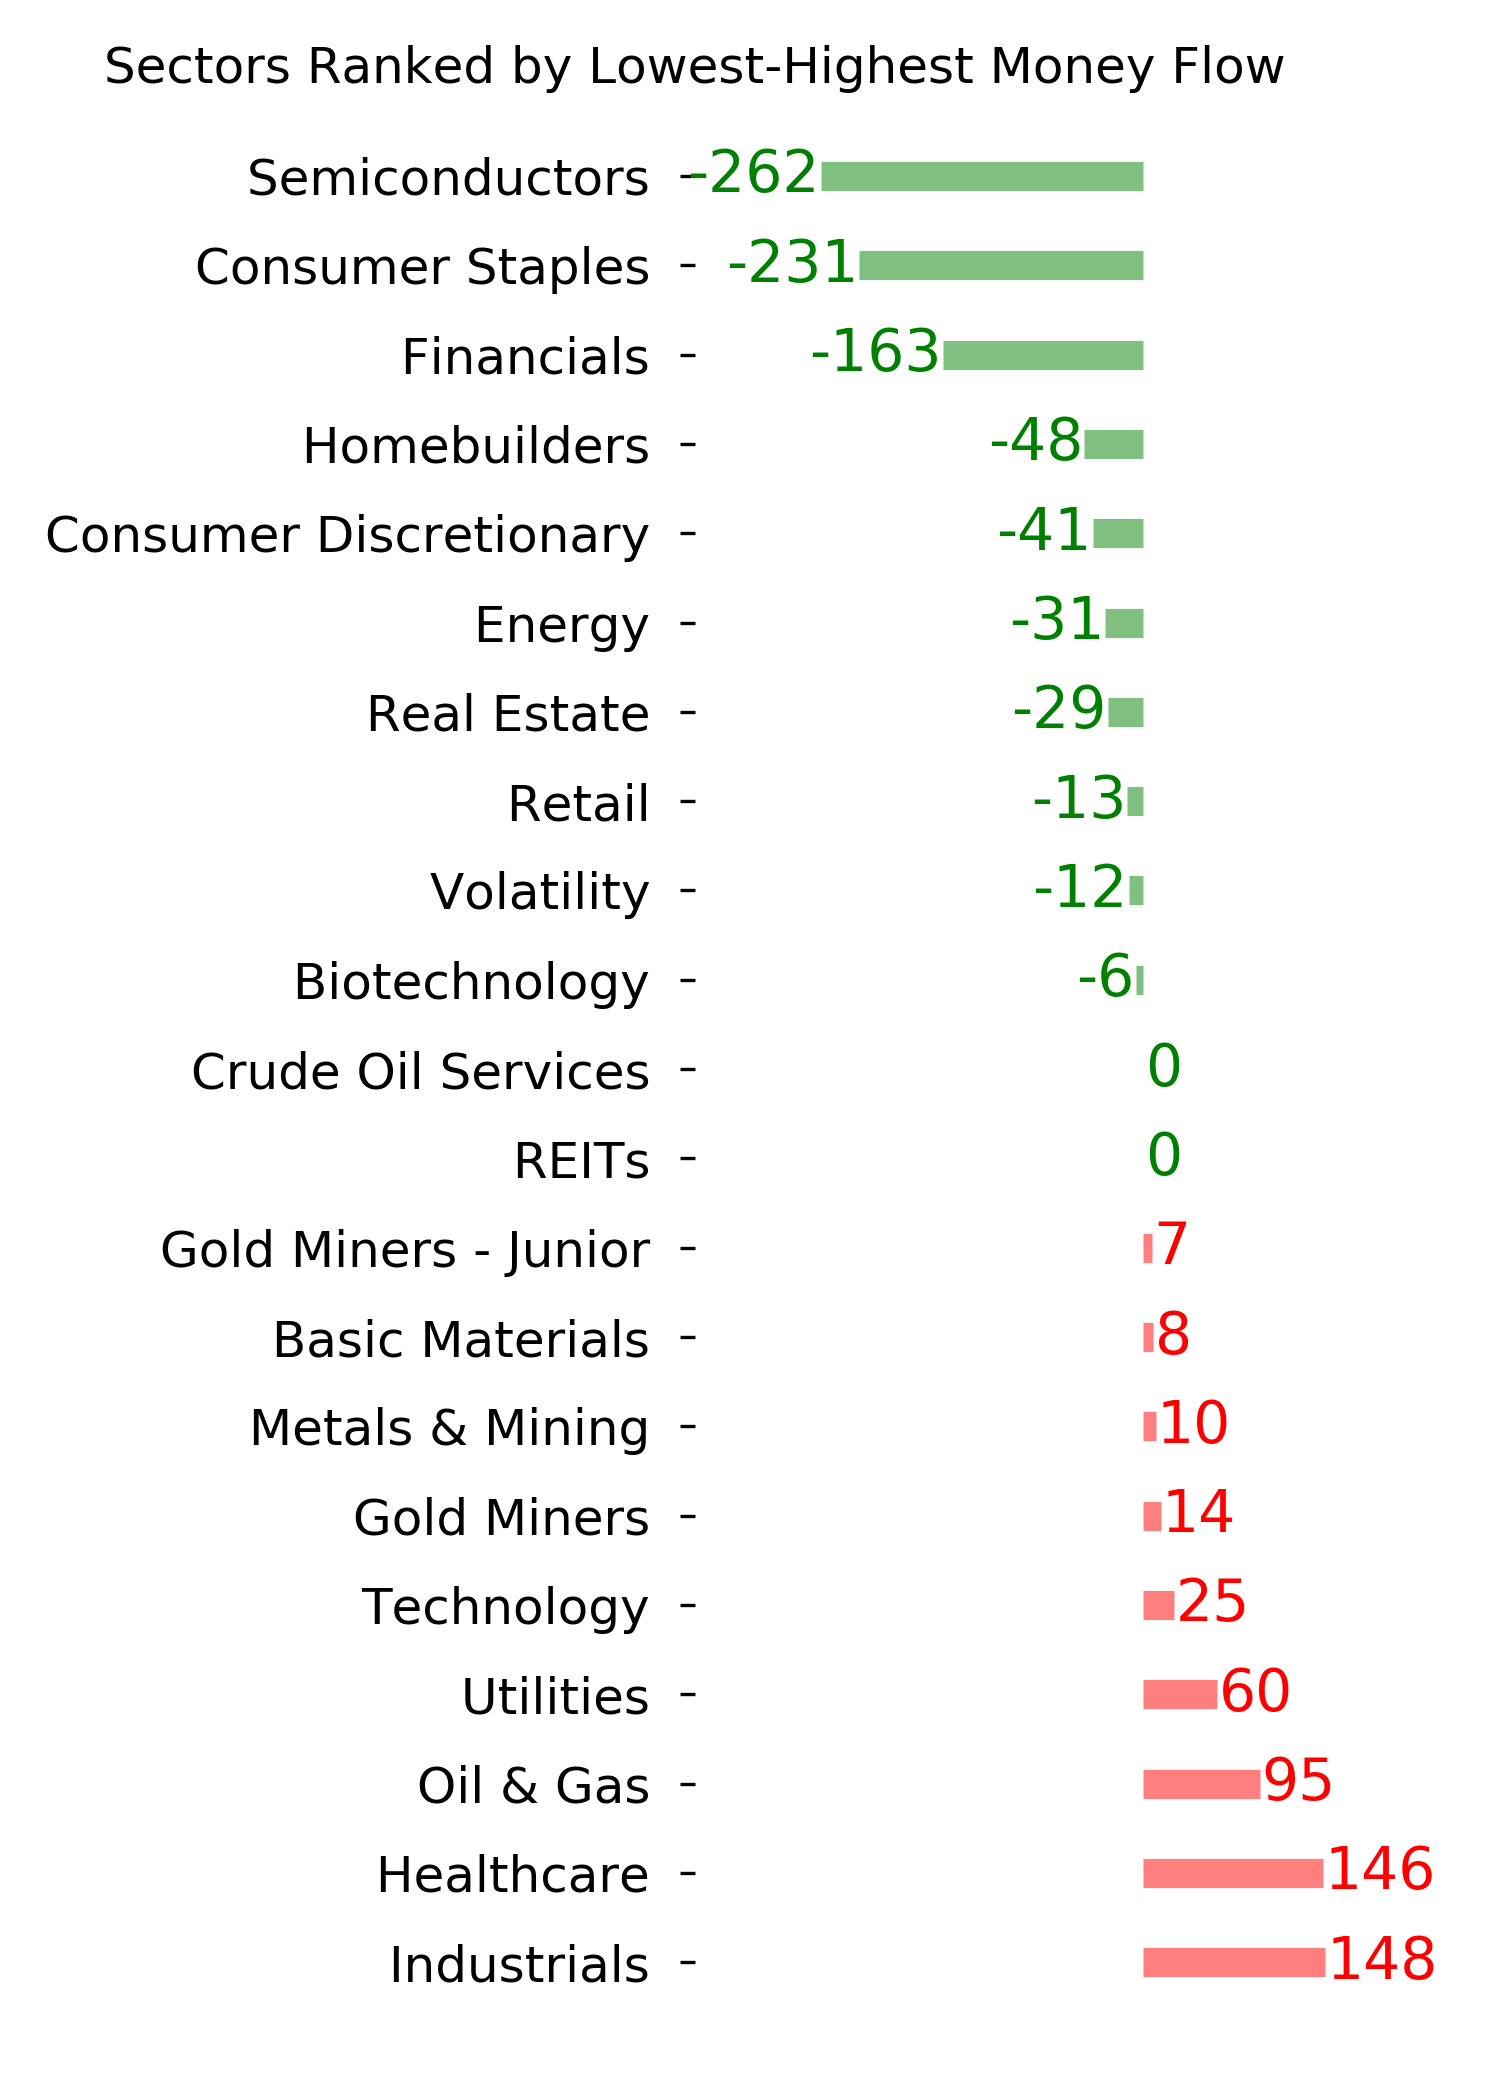
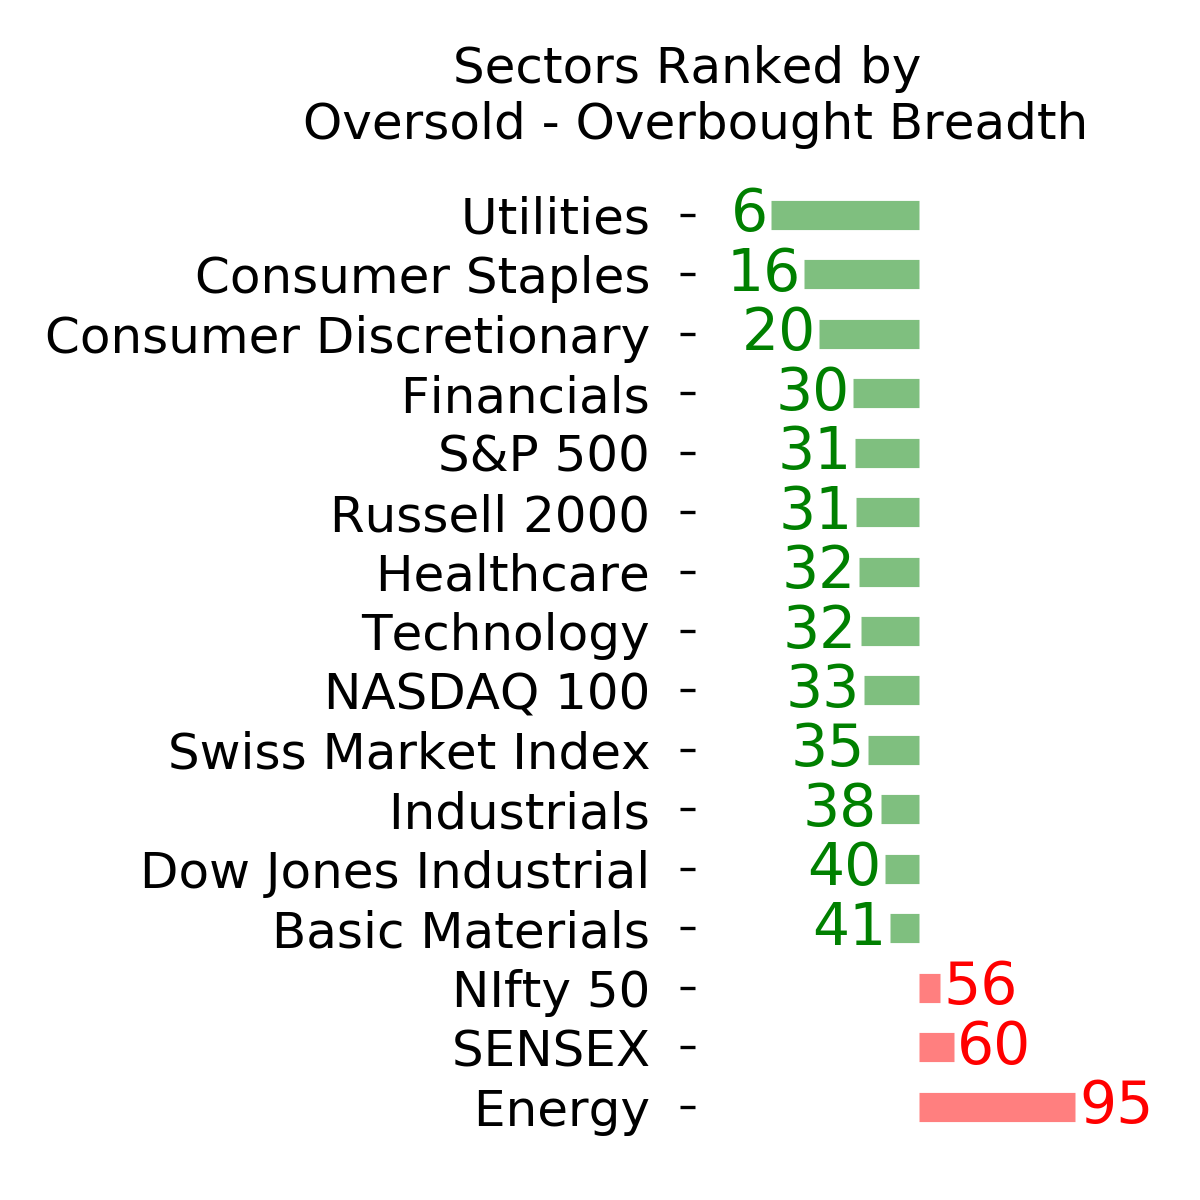
Sector ETF's - 10-Day Moving Average
|
|
|
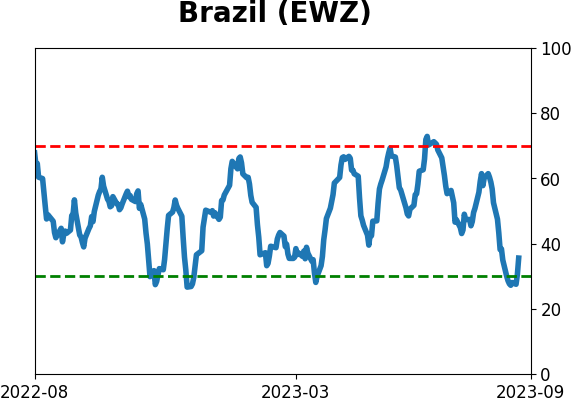
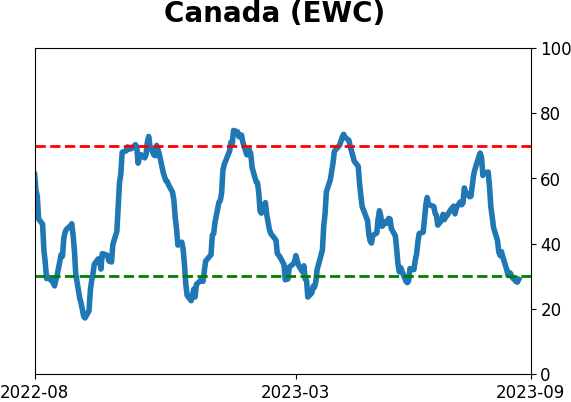
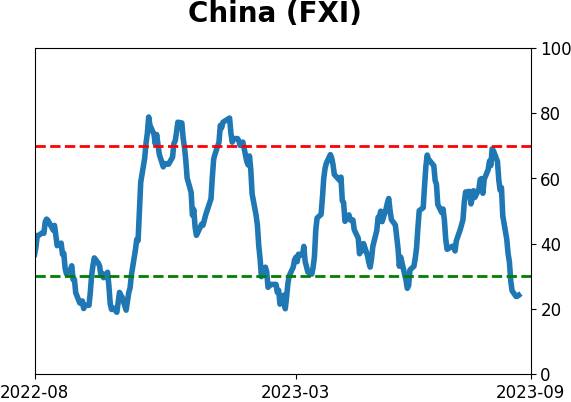
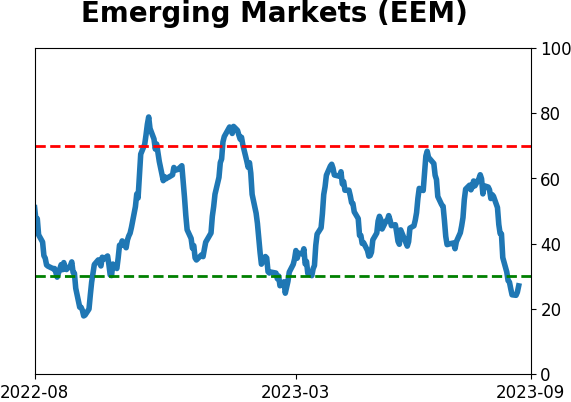
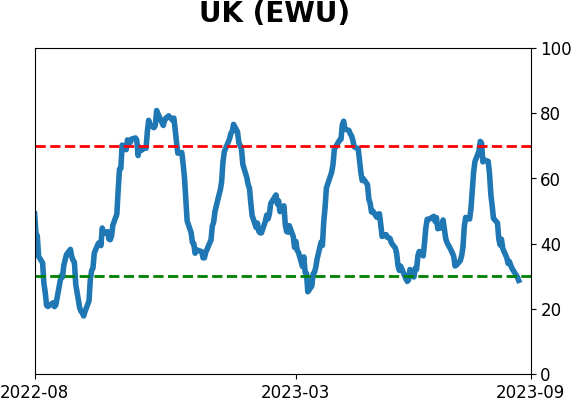
Country ETF's - 10-Day Moving Average
|
|
|
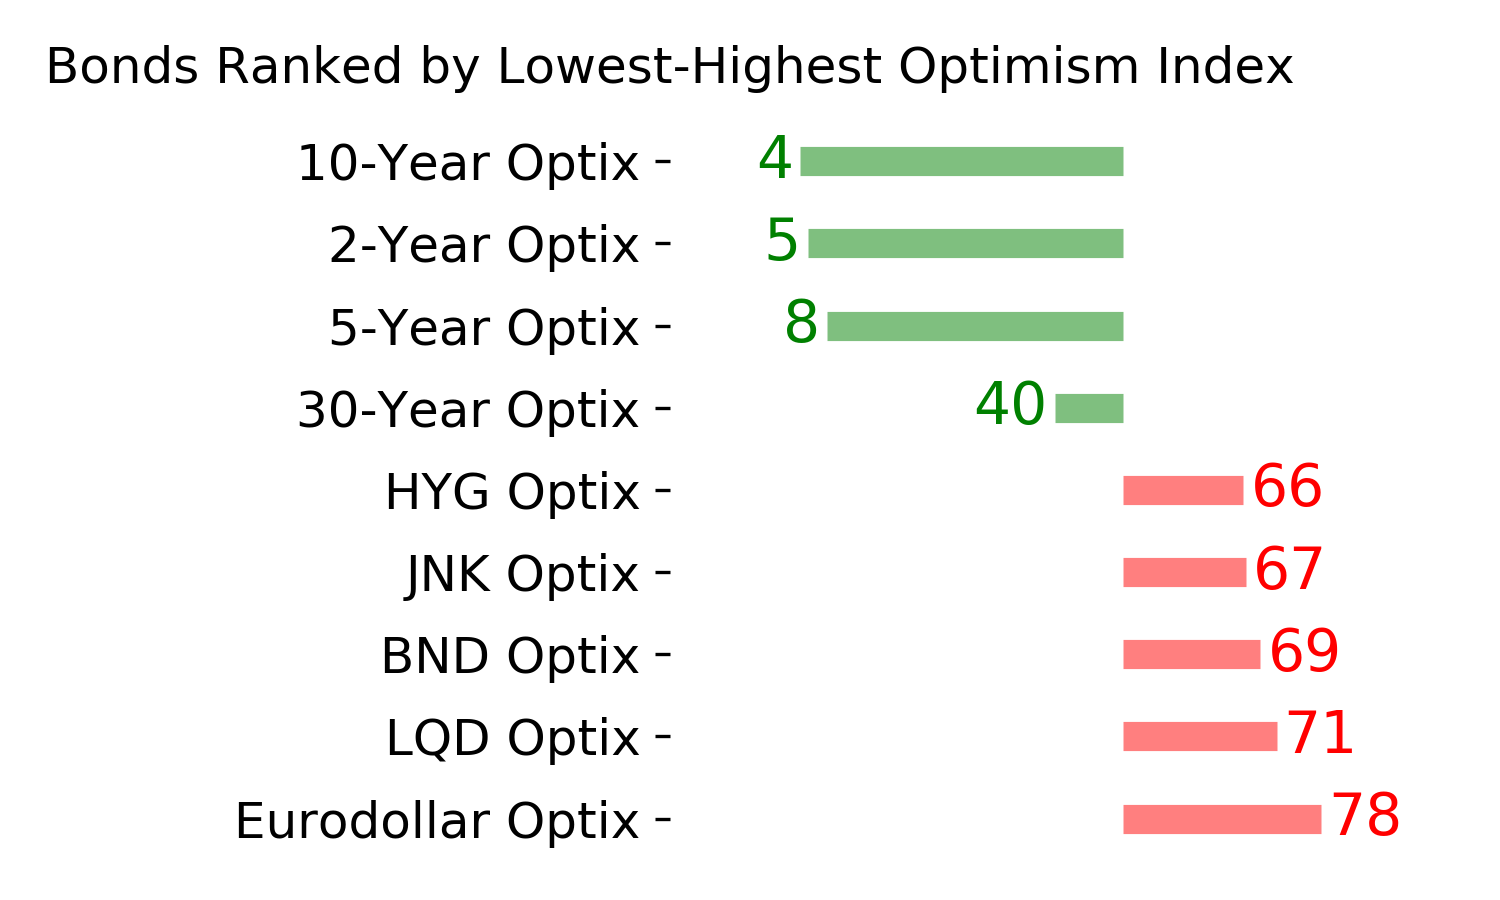
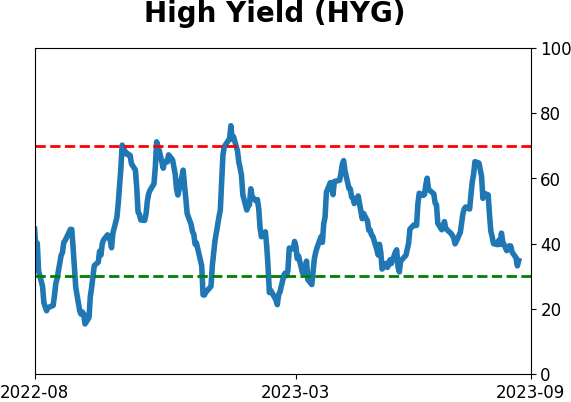
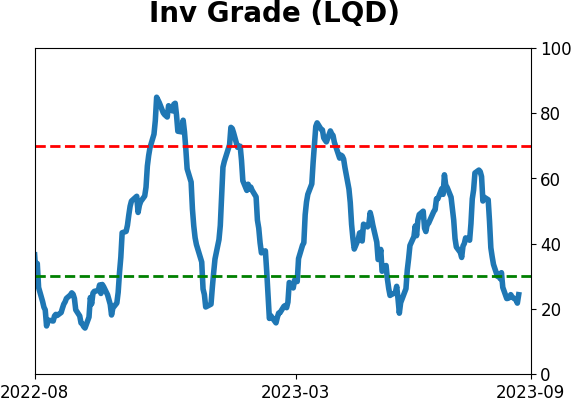
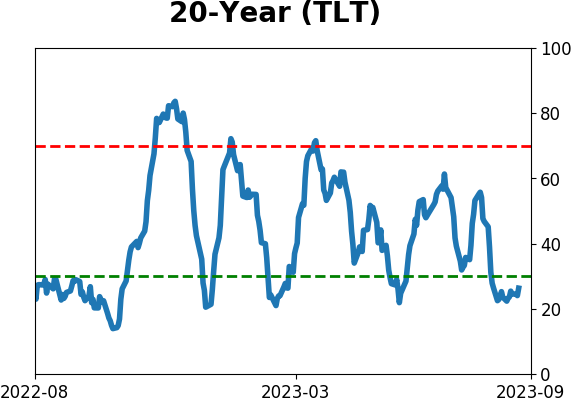
Bond ETF's - 10-Day Moving Average
|
|
|
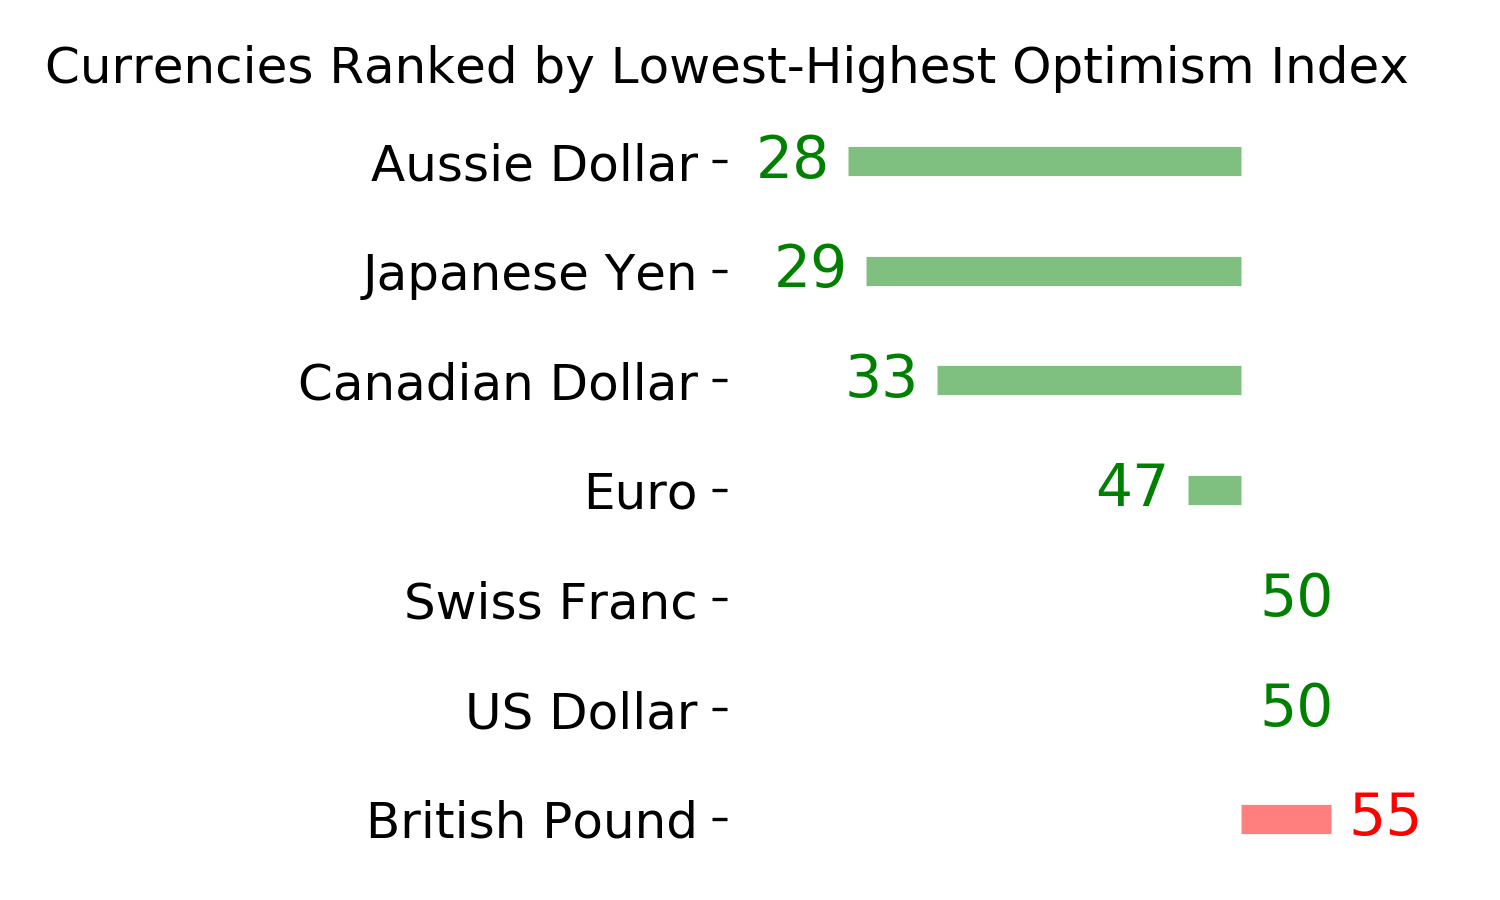
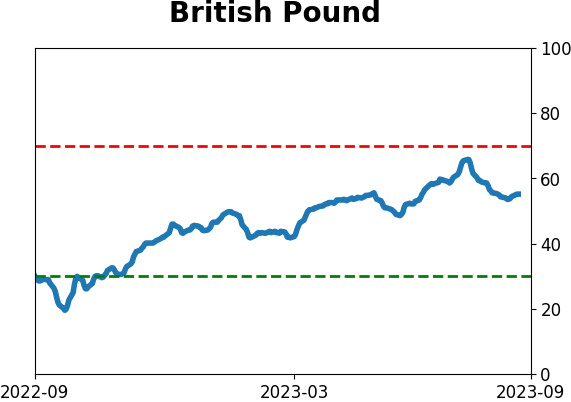
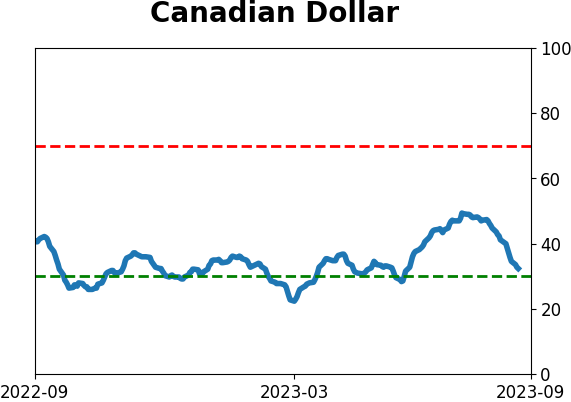
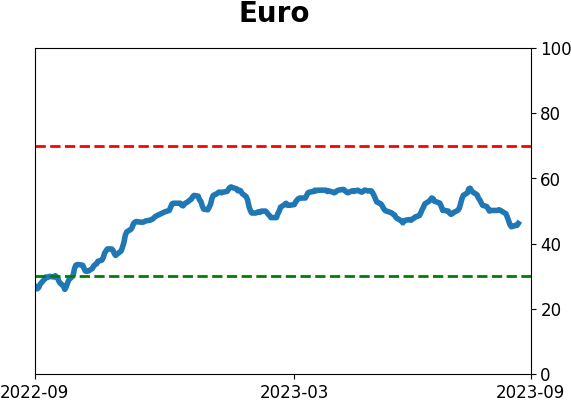
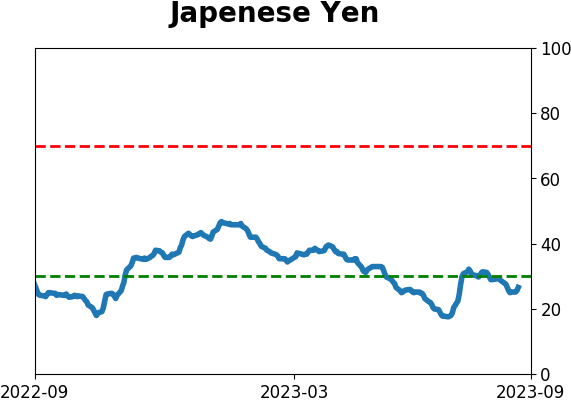
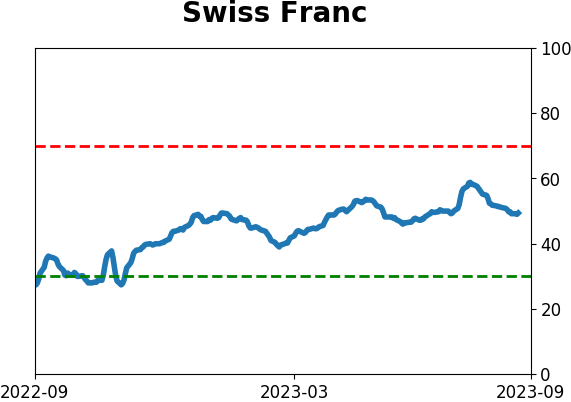
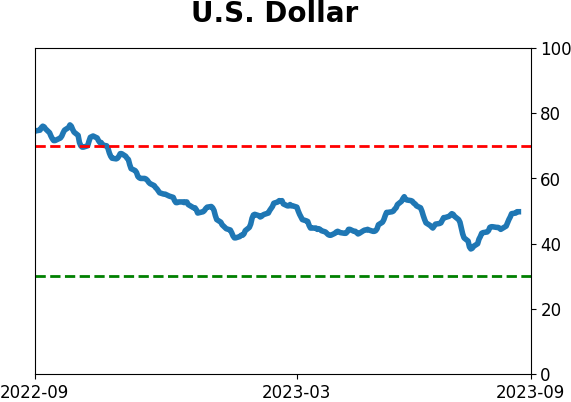
Currency ETF's - 5-Day Moving Average
|
|
|
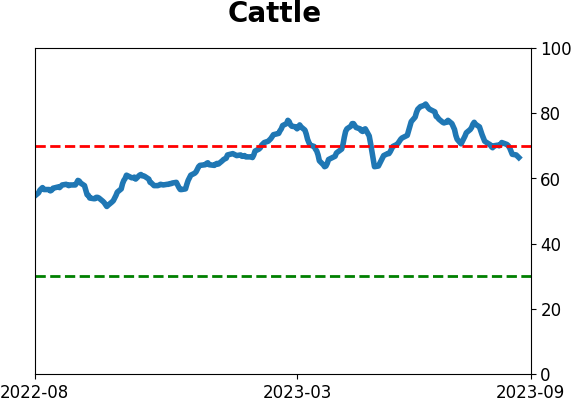
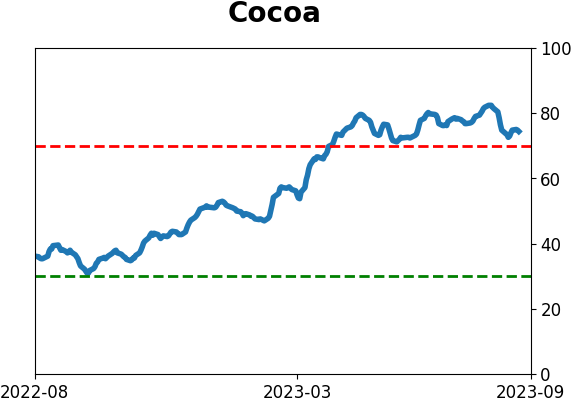
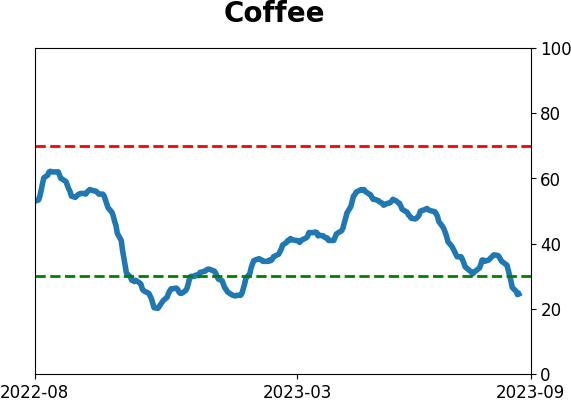
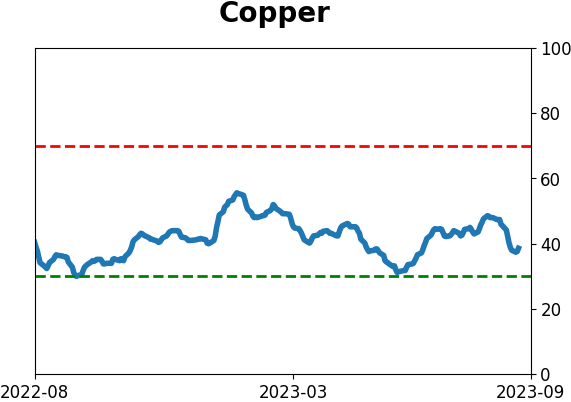
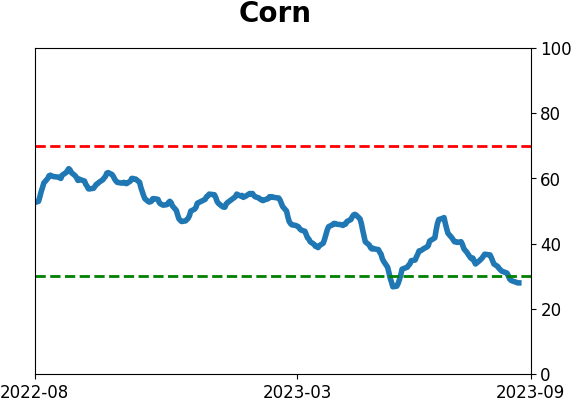
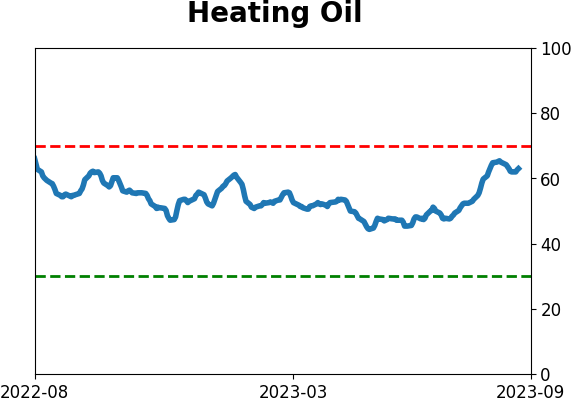
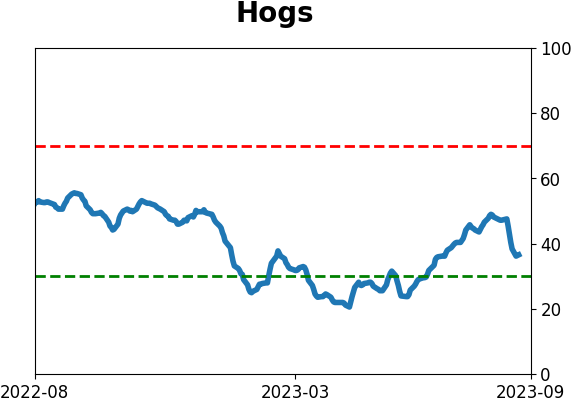
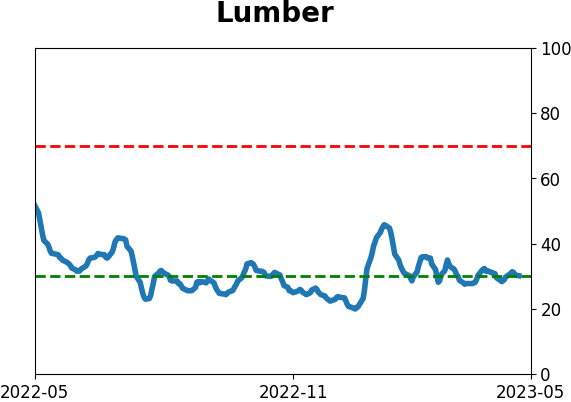
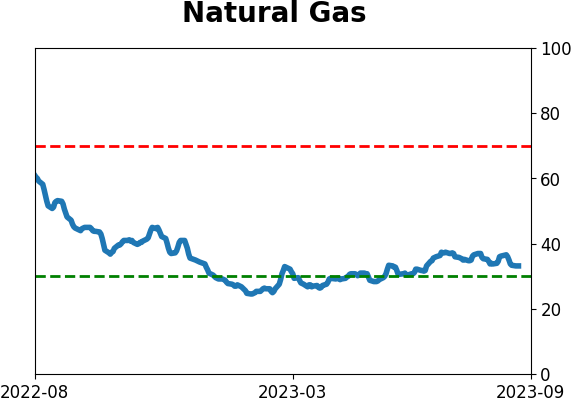
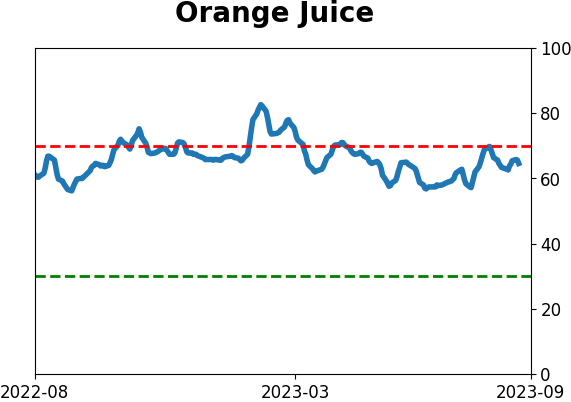
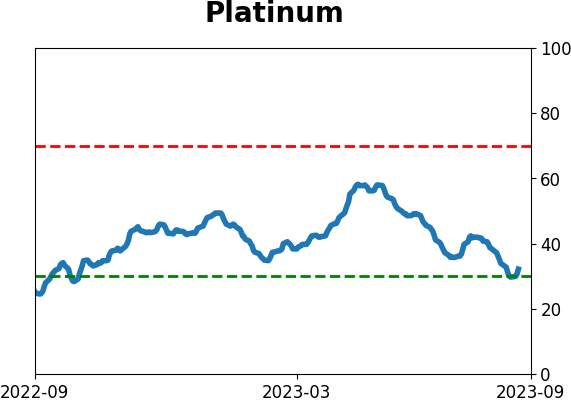
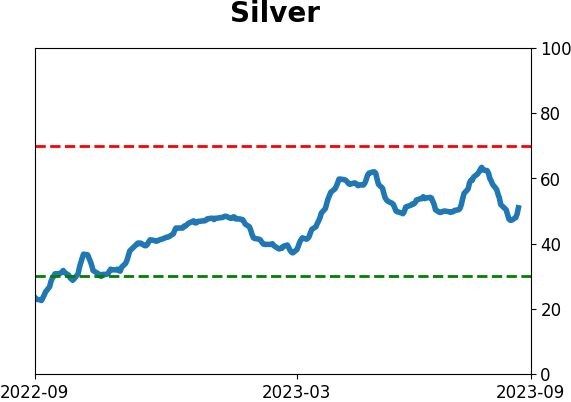
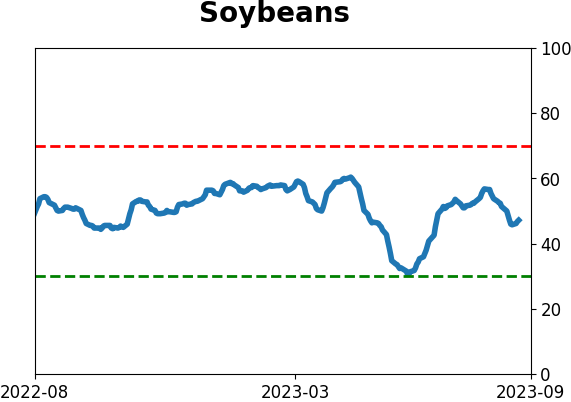
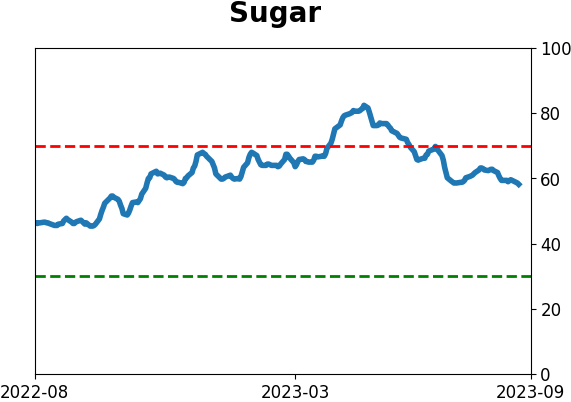
Commodity ETF's - 5-Day Moving Average
|
|