Headlines
|
|
Thrust in high-yield bonds is reversing course:
High-yield bonds enjoyed an enormous surge in buying interest at the end of July, triggering a number of breadth thrusts. The advance/decline line for that market has since moved back to neutral, which has consistently preceded long-term gains in that market.
|
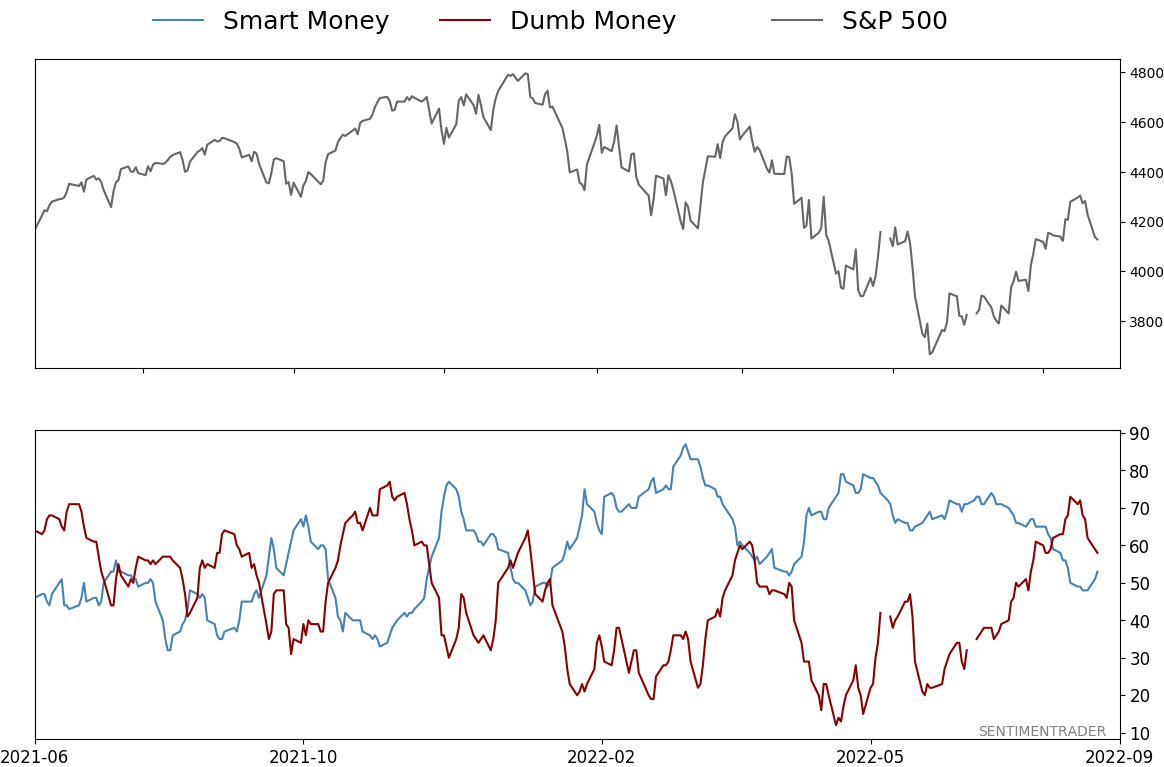
Smart / Dumb Money Confidence
|
Smart Money Confidence: 53%
Dumb Money Confidence: 58%
|
|
Risk Levels
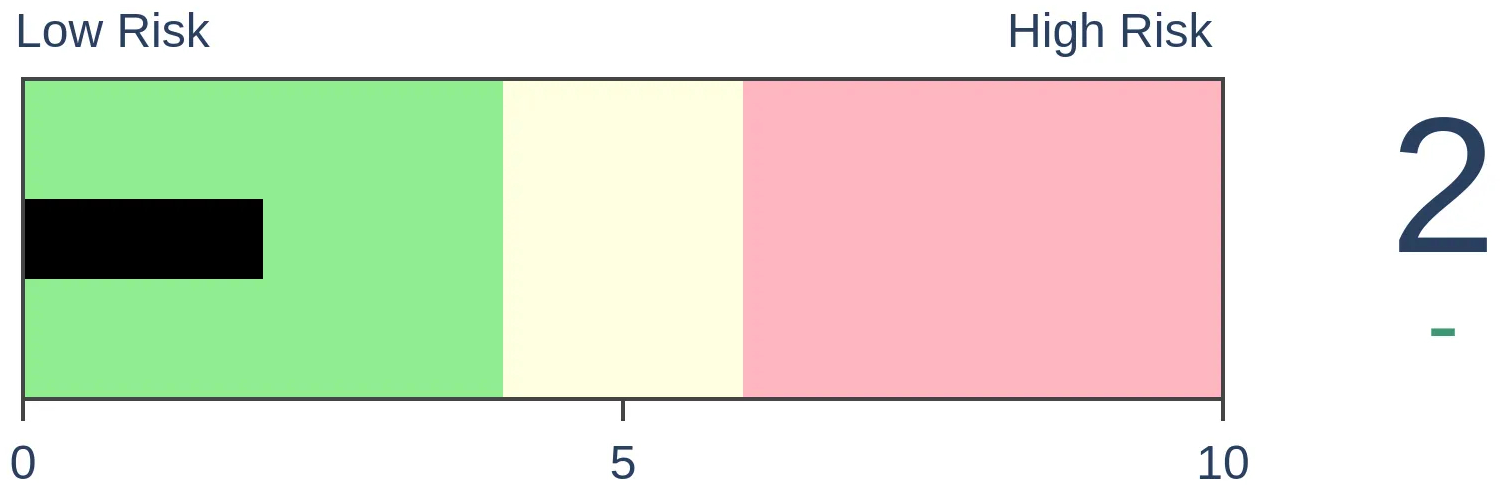
Stocks Short-Term
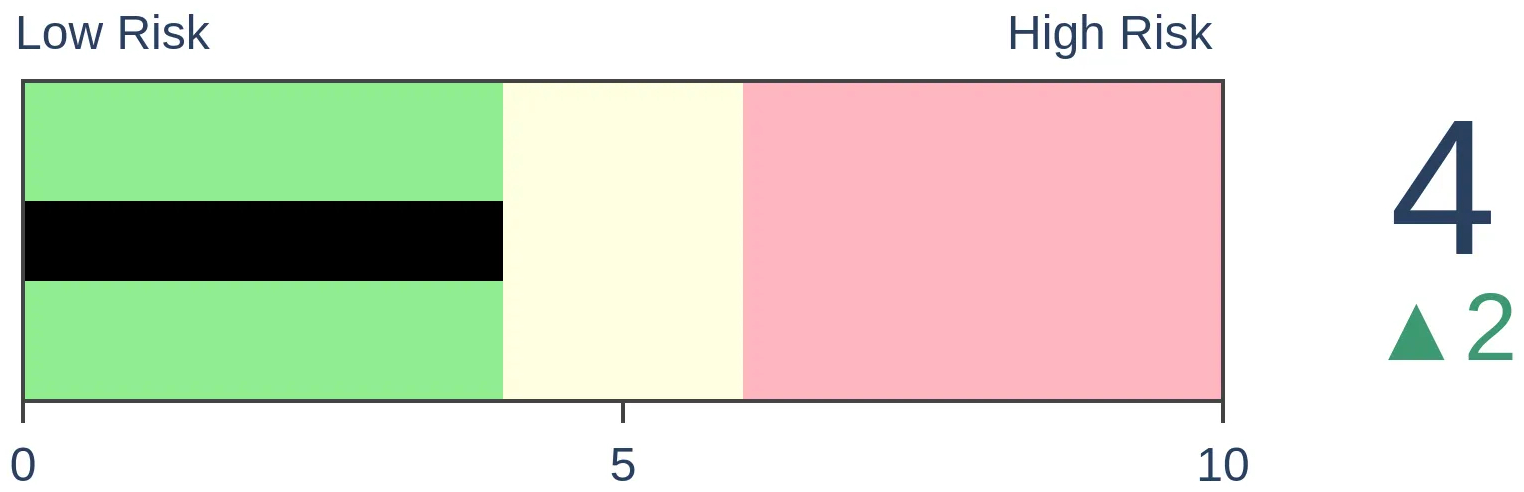
|
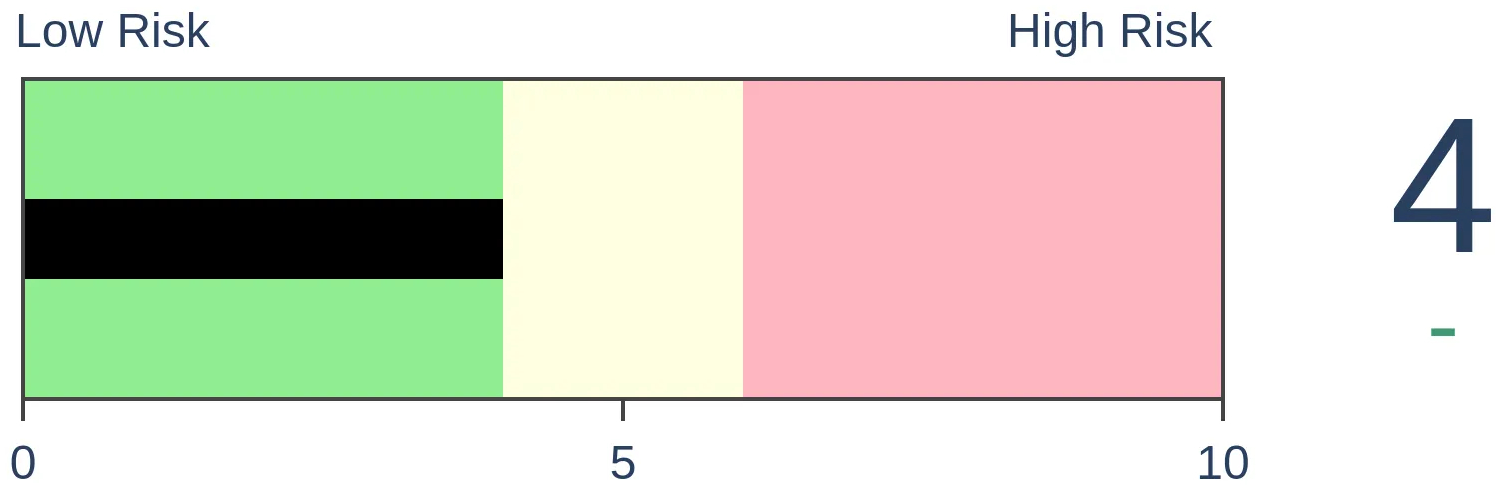
Stocks Medium-Term
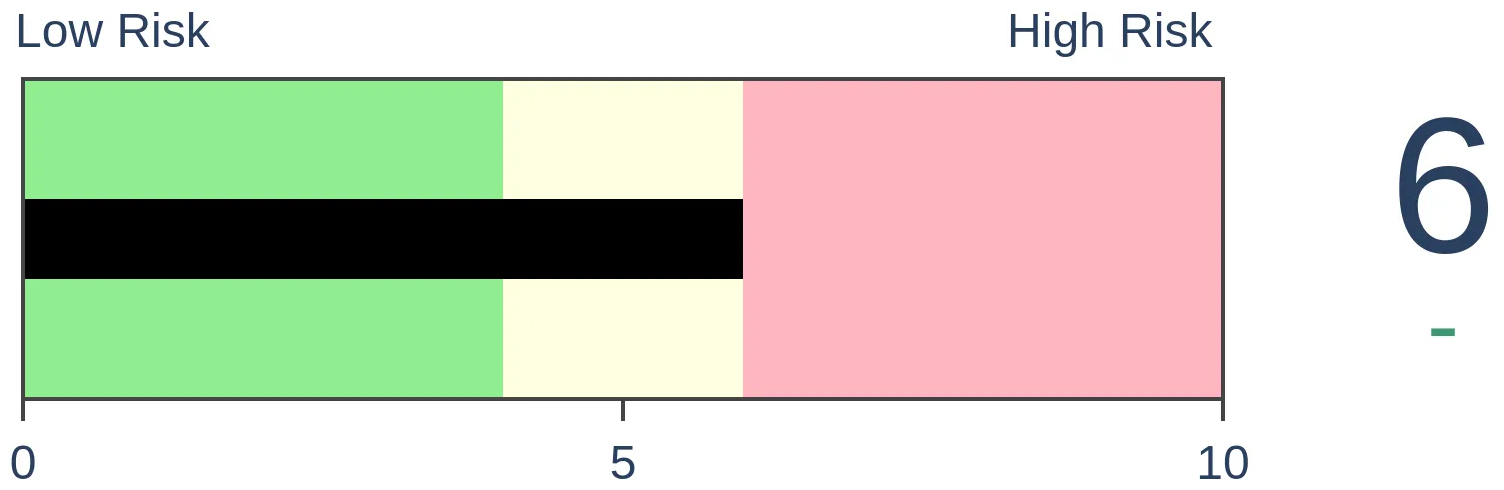
|
|
Bonds
|
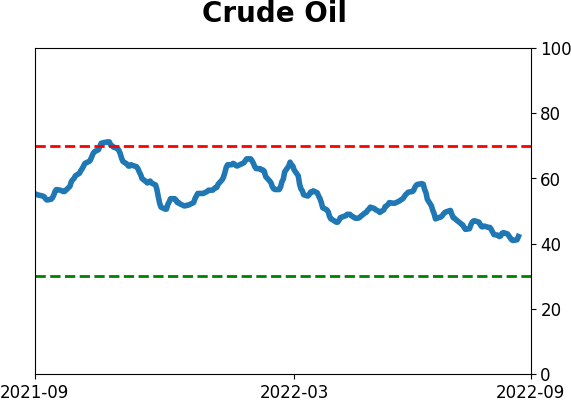
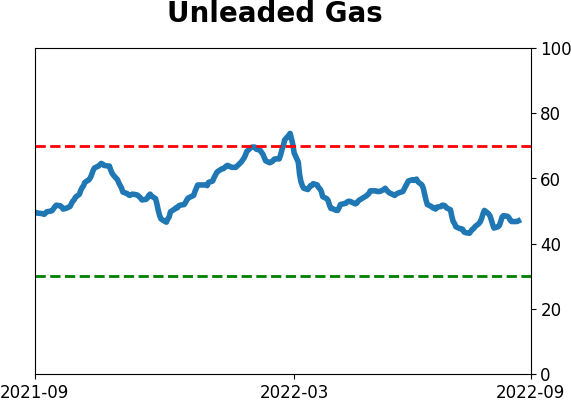
Crude Oil
|
|
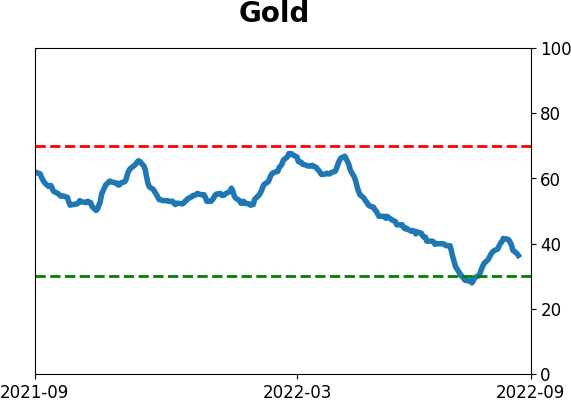
Gold

|
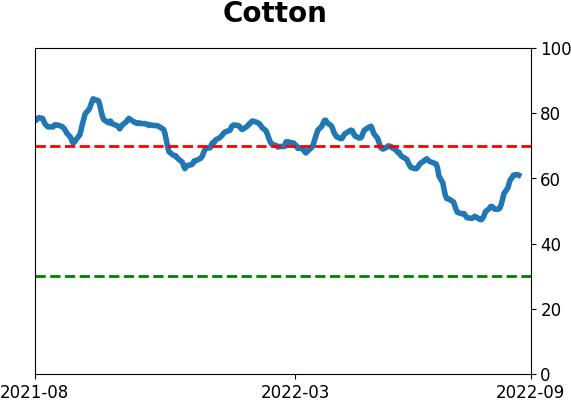
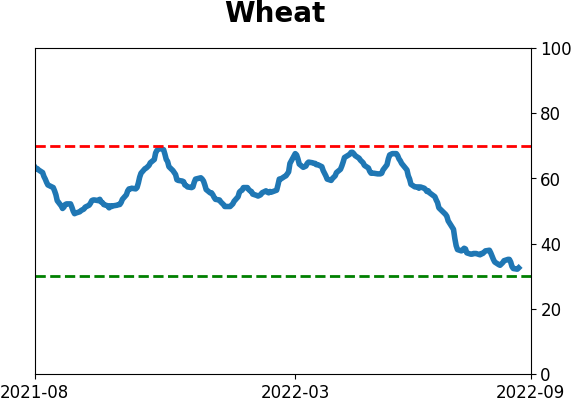
Agriculture

|
|
Research
By Jason Goepfert
BOTTOM LINE
High-yield bonds enjoyed an enormous surge in buying interest at the end of July, triggering a number of breadth thrusts. The advance/decline line for that market has since moved back to neutral, which has consistently preceded long-term gains in that market.
FORECAST / TIMEFRAME
HYG -- Up, Long-Term
|
Key points:
- The high-yield bond market triggered a number of breadth thrusts in recent weeks
- The market has since settled back to neutral
- These bonds showed consistent long-term gains after similar thrusts and retractions
High-yield bonds are settling back after a record surge
Signs of buying thrusts in stocks have been triggering for over a month. It's not the only market that has seen overwhelming bouts of buying interest, as high-yield bonds have as well.
We looked at this on July 28, showing that high-yield bonds are trying to recover, and Dean noted another thrust the next day. The 10-day Advance/Decline Line for high-yield bonds recovered from a severe oversold condition and has since returned to neutral, similar to the move after the pandemic panic.
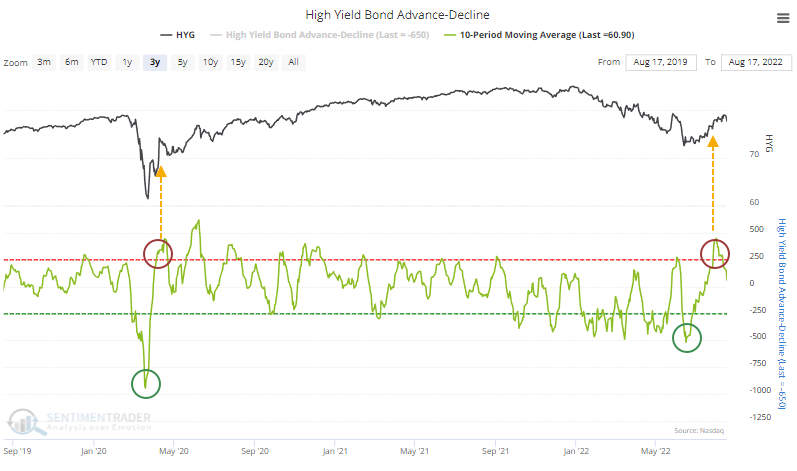
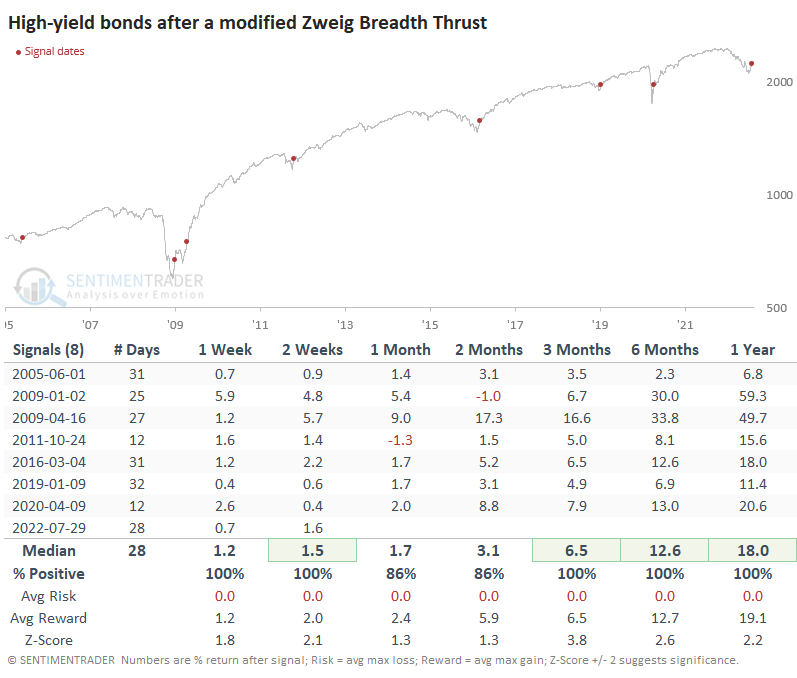
As a result, the market triggered a modified Zweig Breadth Thrust. The table below shows when the 10-day exponential moving average of the Advance/Decline LIne for high-yield bonds cycles from below 40% to above 61.5%. Because this market tends to be slower-moving than stocks, we ignore the number of trading days between the oversold and overbought conditions.
The period that the data encompasses is dominated by bull markets, so we should expect the results to be positive. Even so, they're scewed well above average after these signals. On average, it took high-yield bonds 28 trading days to cycle between extremes, and the recent signal was right at that average.
Buyers continued to show interest in the market (well, except for the last week), and so far the latest signal is showing gains. After some recent losses, the 10-day ema of the A/D Line has moved back below 50%. Anytime that indicator went from above 61.5% to below 50%, gains also followed.

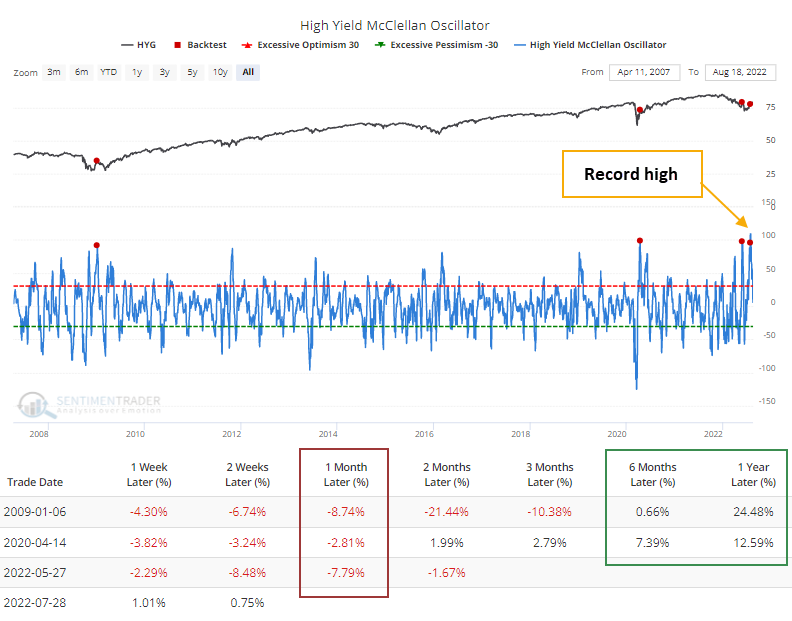
As a result of the internal momentum, the McClellan Oscillator for high-yield is coming down off a record high. The Backtest Engine shows that the few times it exceeded +90, HYG fell back over the next month then rallied.
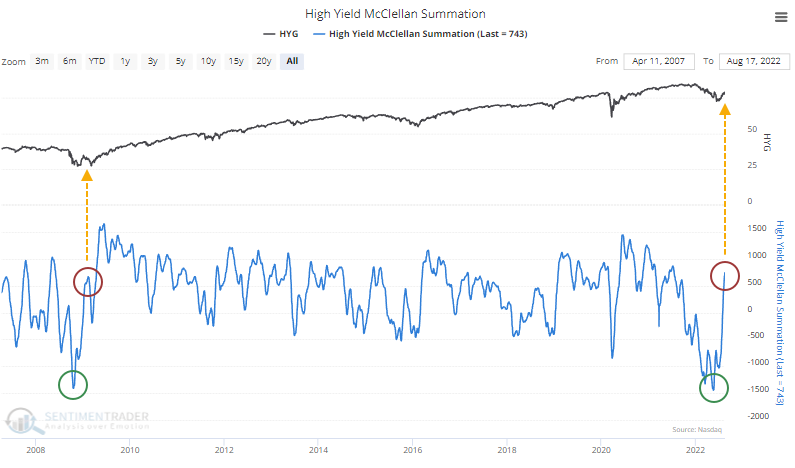
The record high in the Oscillator powered the long-term Summation Index above +500 after what had been a record low. Again, history is limited here but the only comparison is the immediate aftermath of the global financial crisis. After that first surge in the Summation Index, HYG fell back to test its low, which marked the bottom.
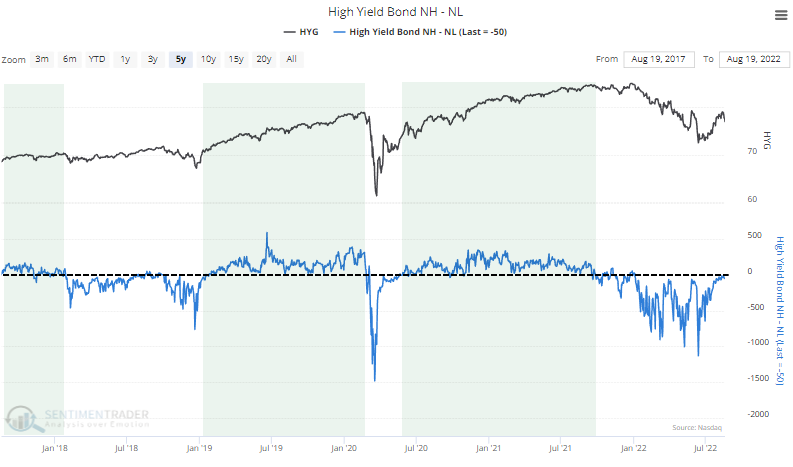
One thing that absolutely needs to change is the dominance of 52-week lows over 52-week highs among junk bonds. There was some improvement early last week, but it's back to being a negative spread, and that is not what we see in healthy markets.
What the research tells us...
The first overbought reading after a severe decline tends to bring out sellers - either lucky traders who bought near the bottom or existing bagholders who are getting out with less of a loss. So, it's not a big surprise to see some selling pressure in high-yield bonds, and based on typical reactions, it could last for weeks longer. But the record amount of selling pressure, followed by a record amount of buying interest, has all the hallmarks of a major change in character, and that has a good track record of leading to long-term gains.
Indicators at Extremes
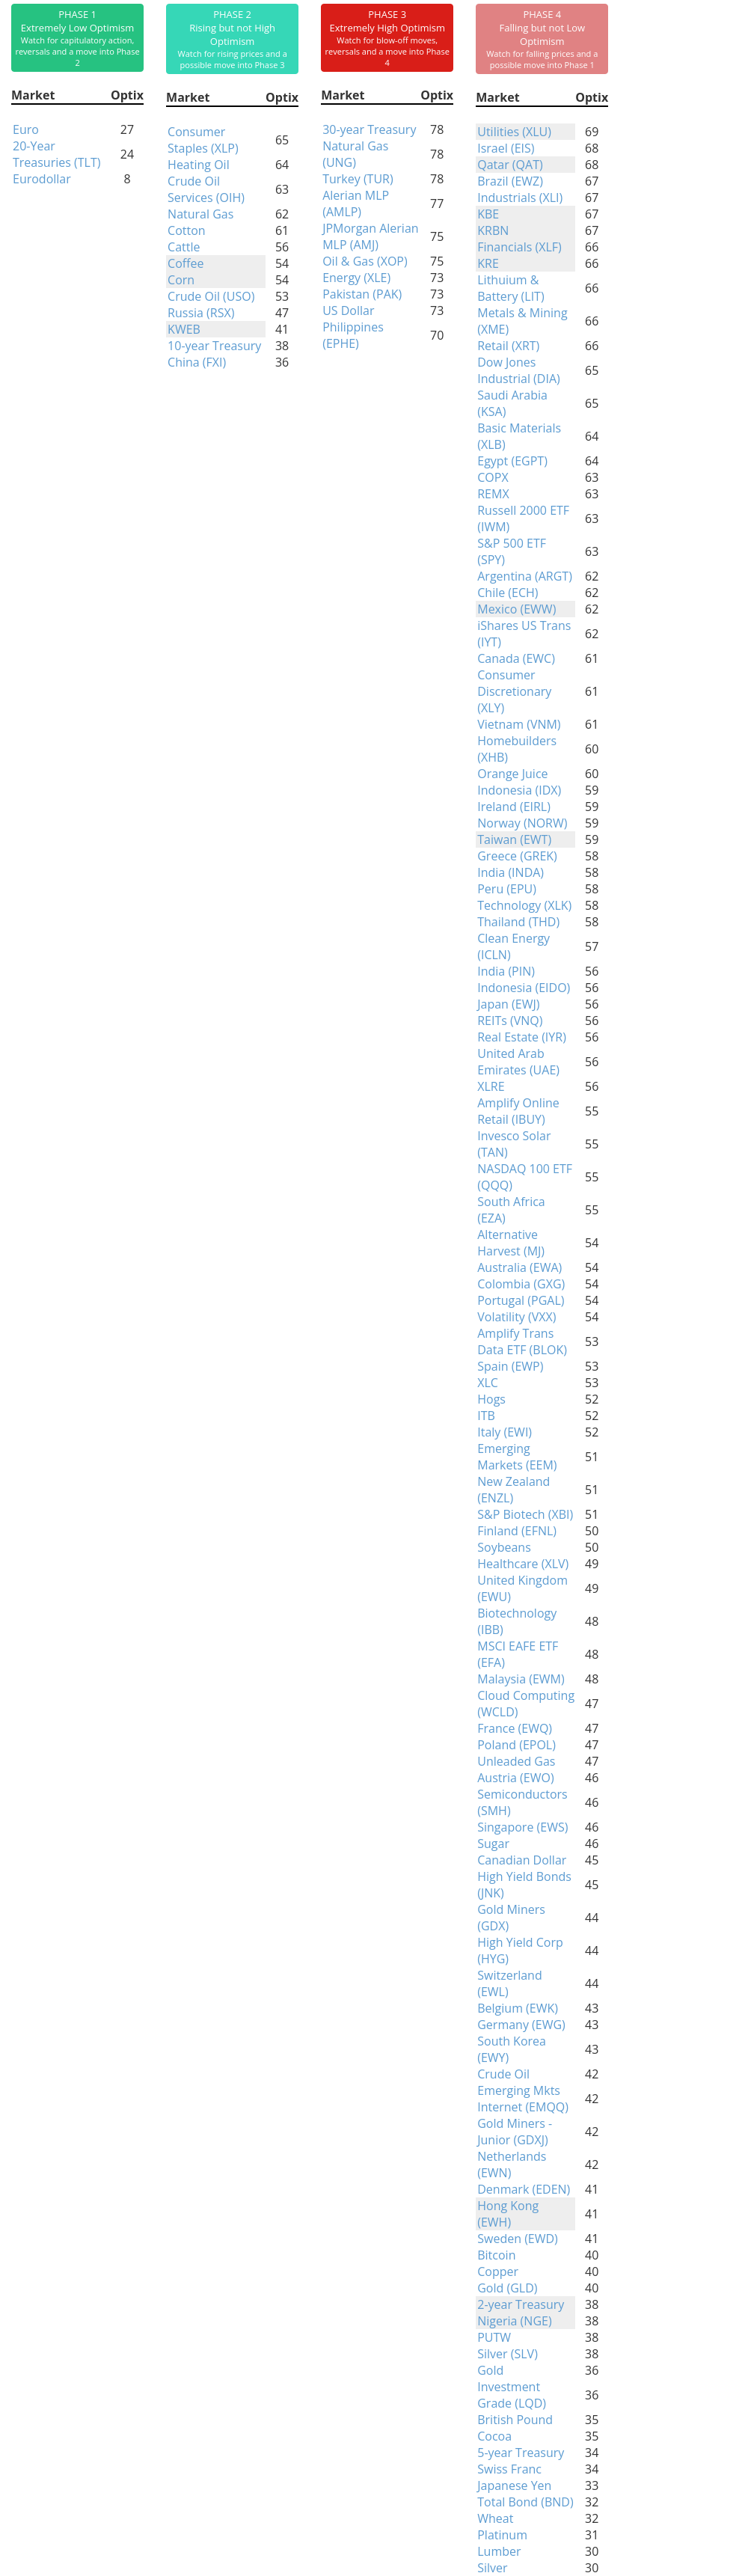
Phase Table
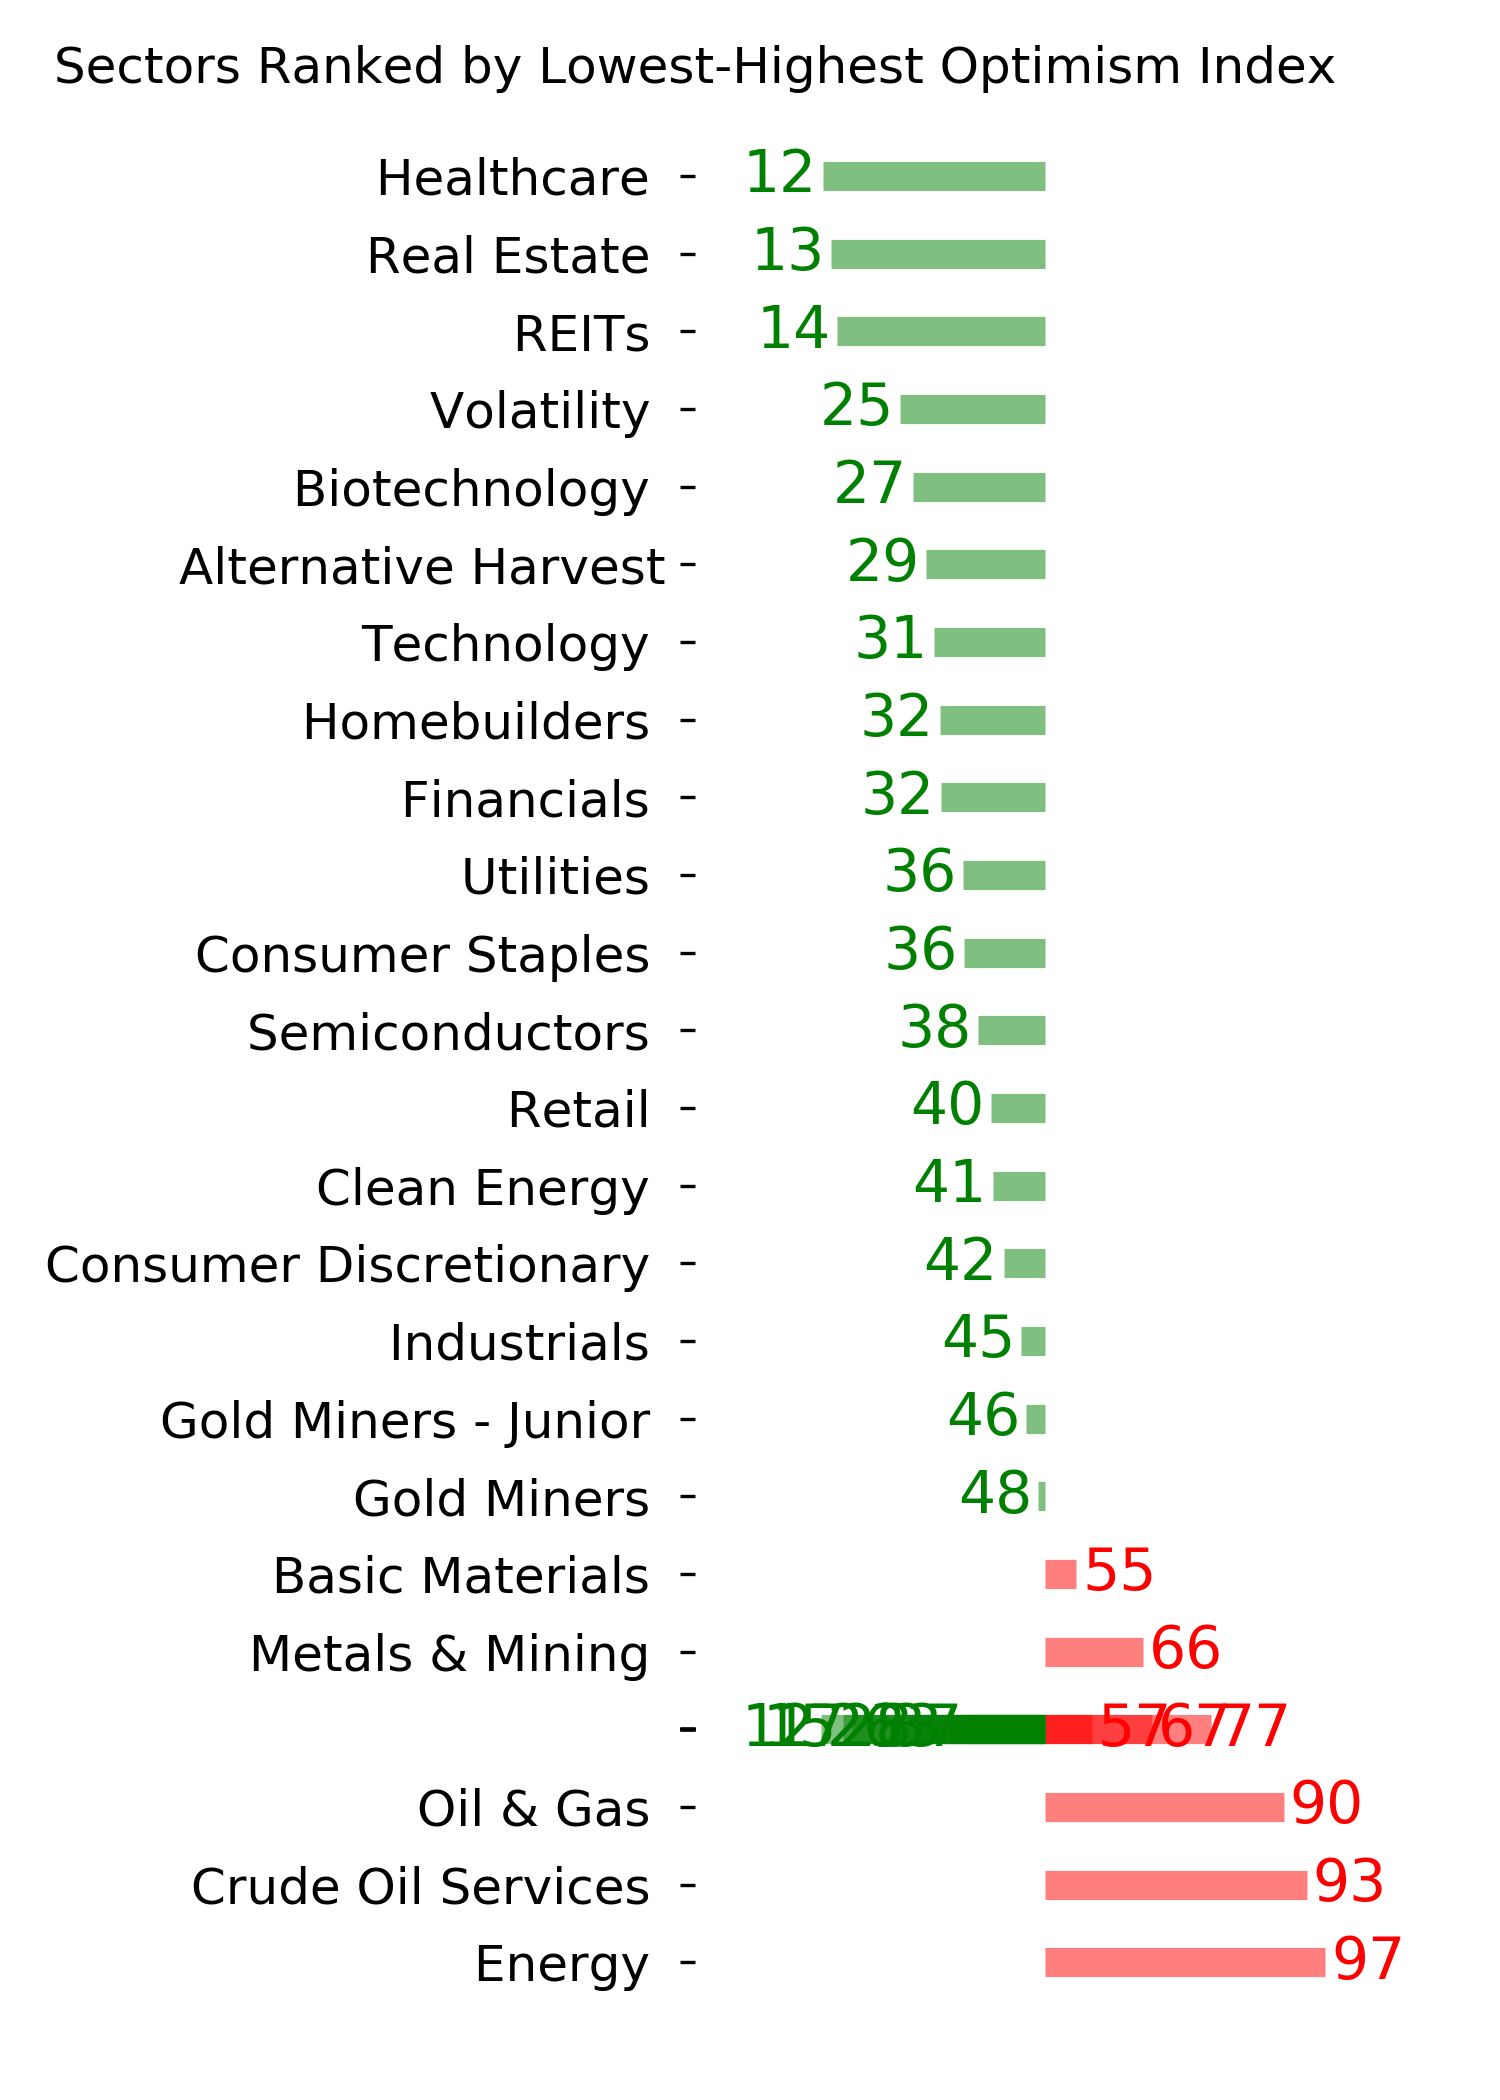
Ranks
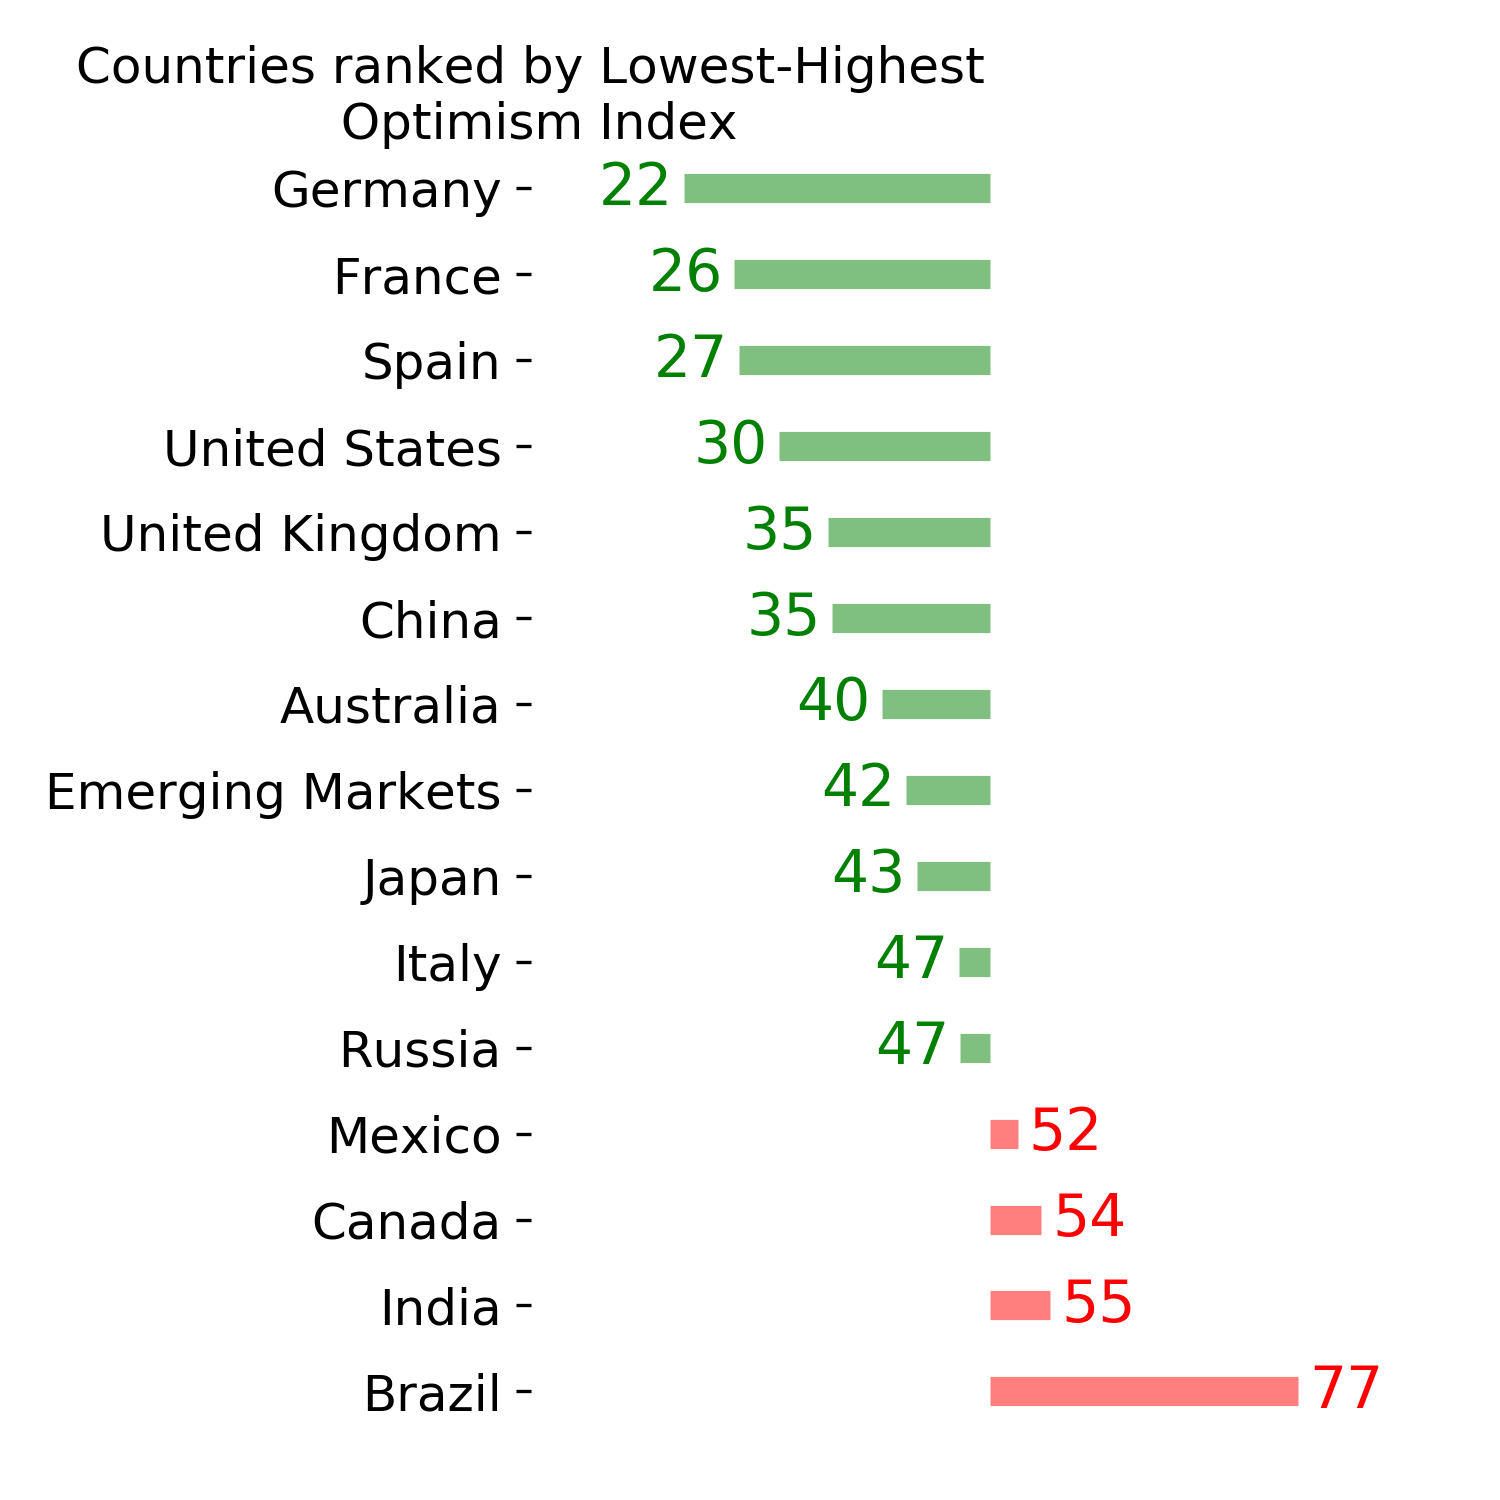
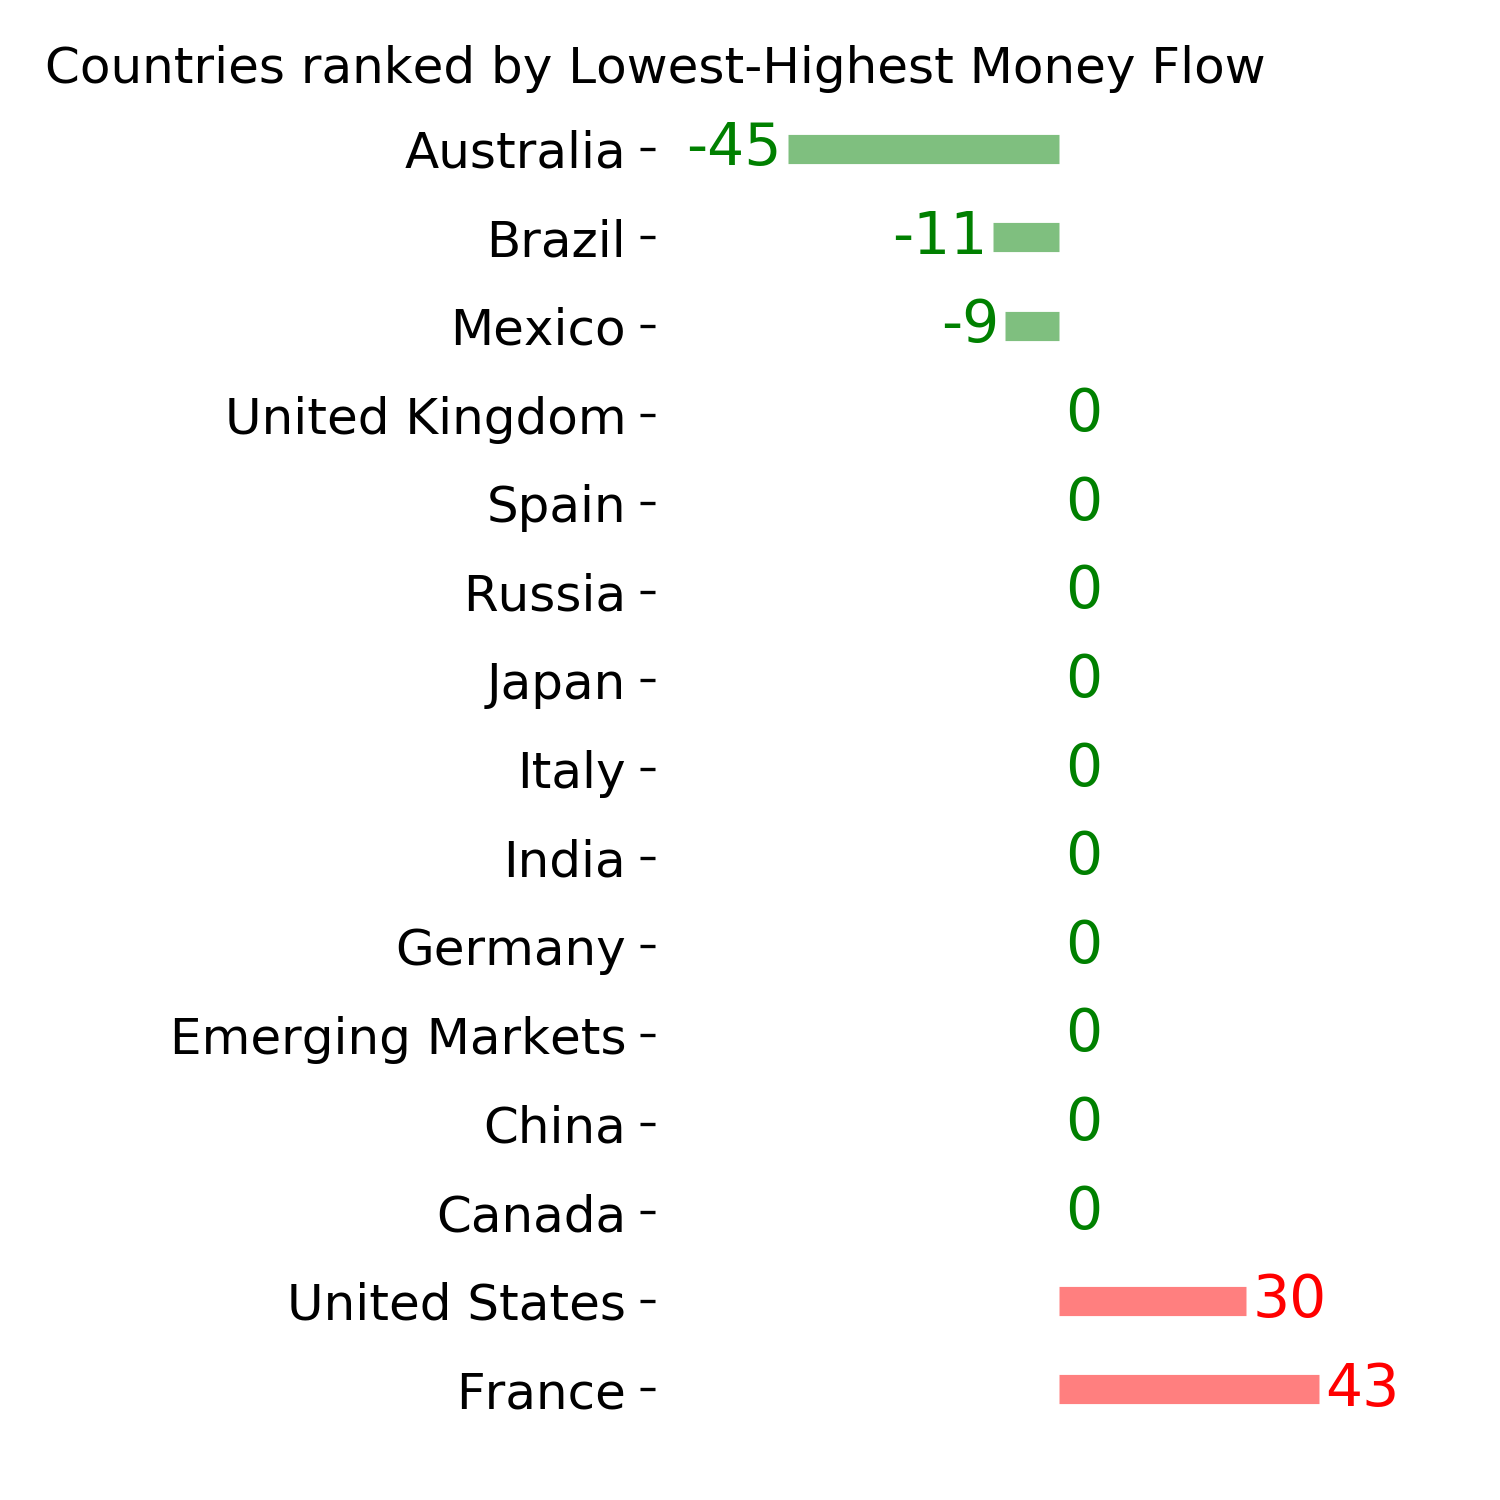
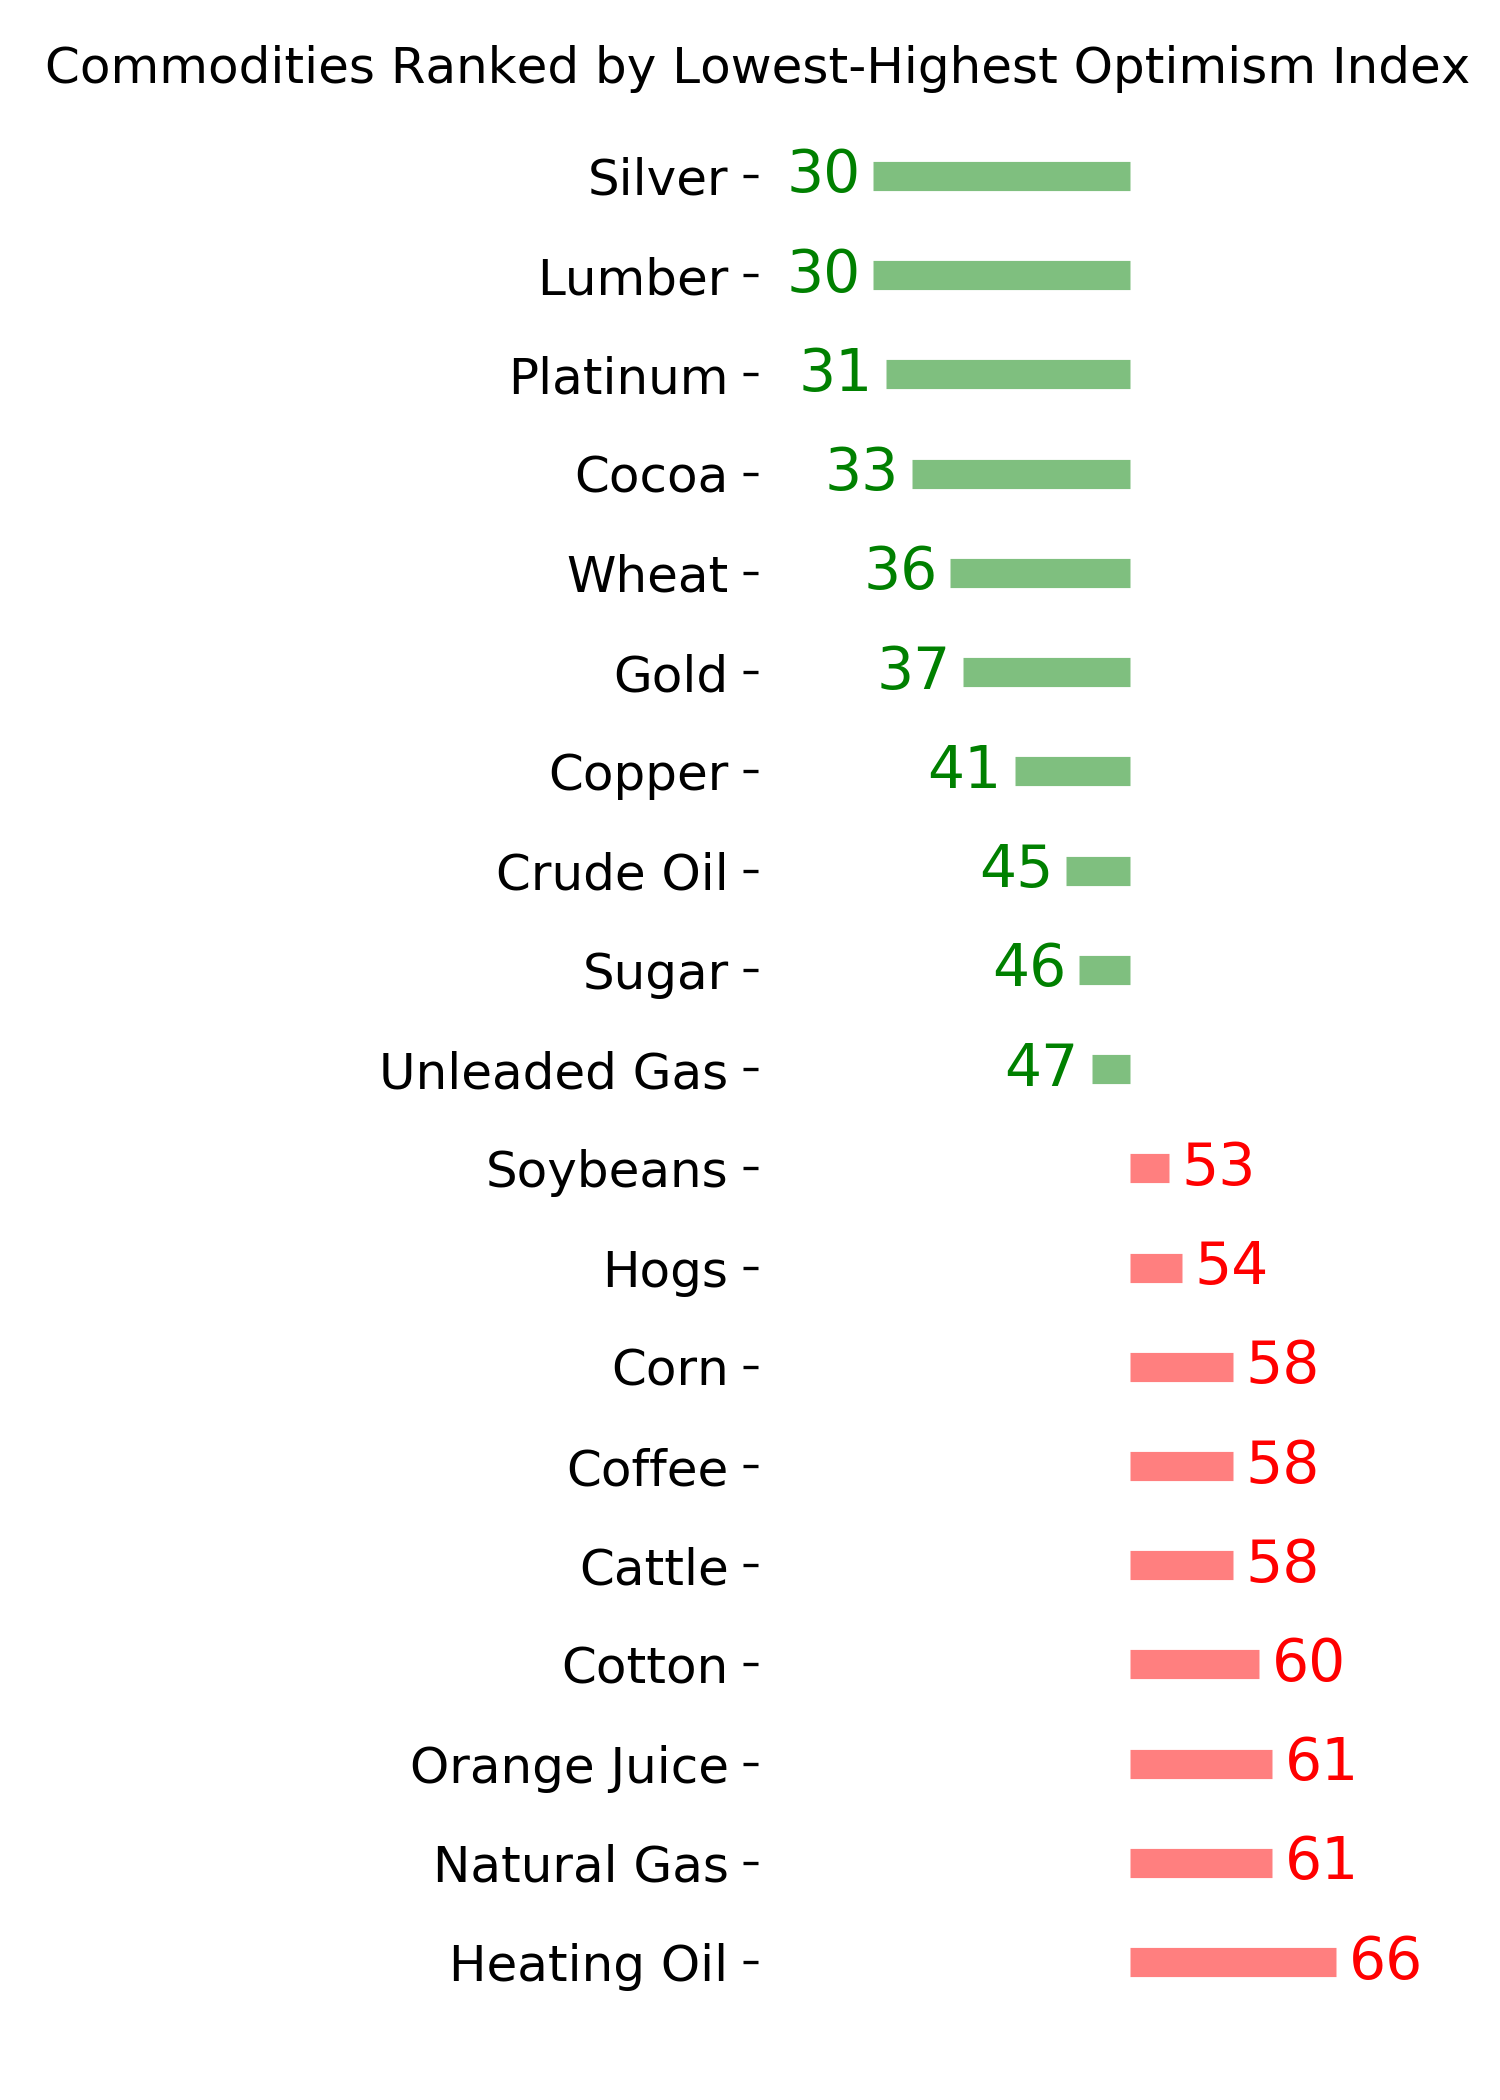
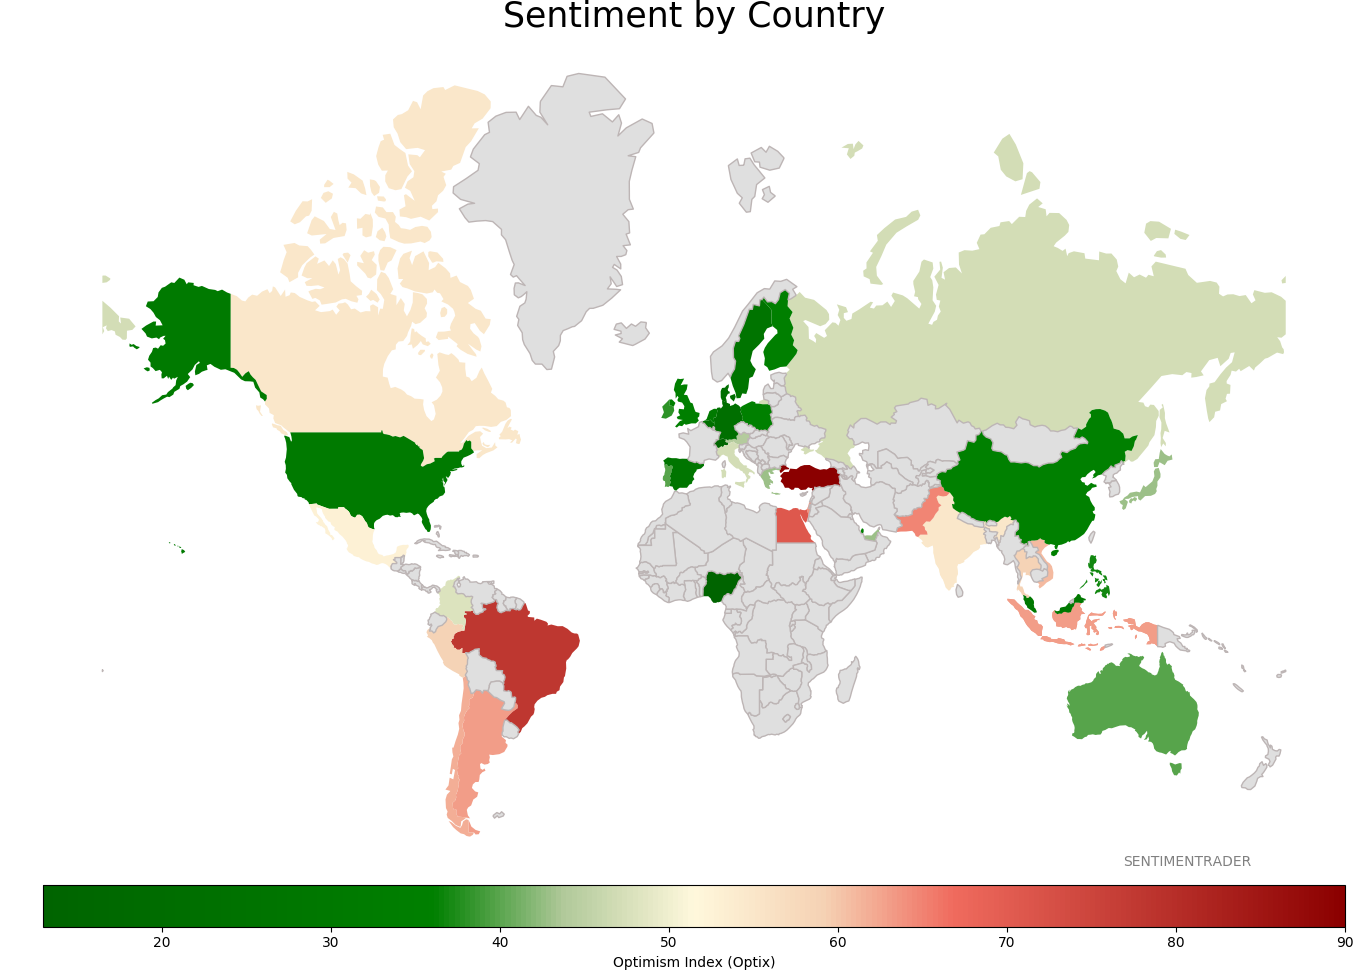
Sentiment Around The World
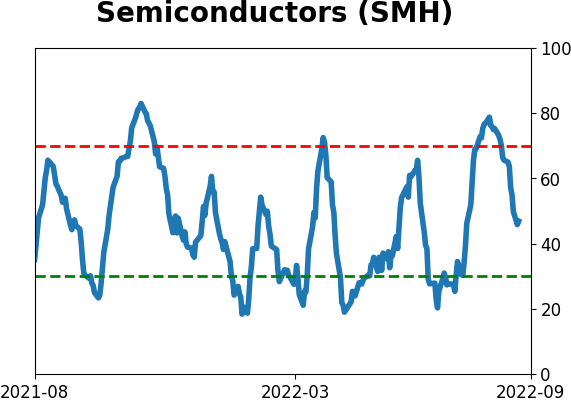
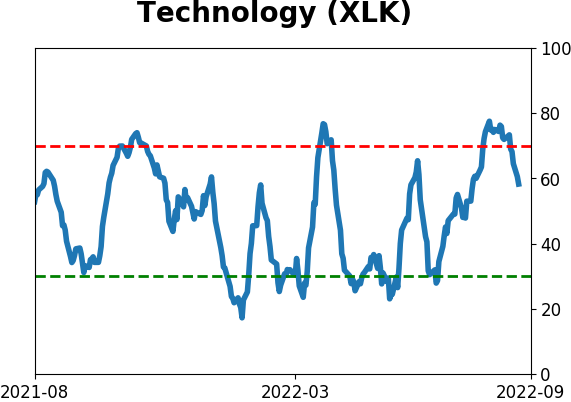
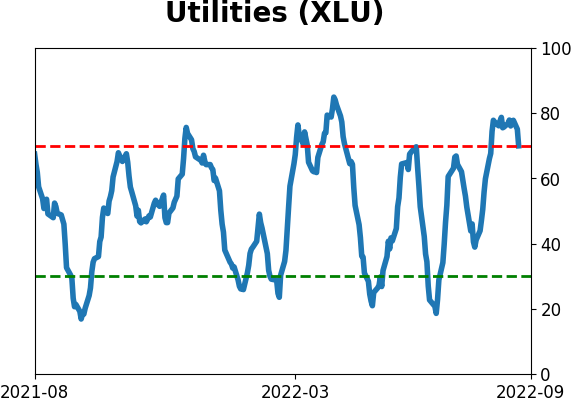
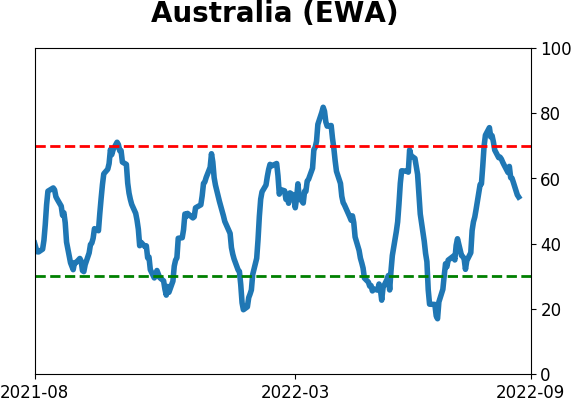
Optimism Index Thumbnails
|
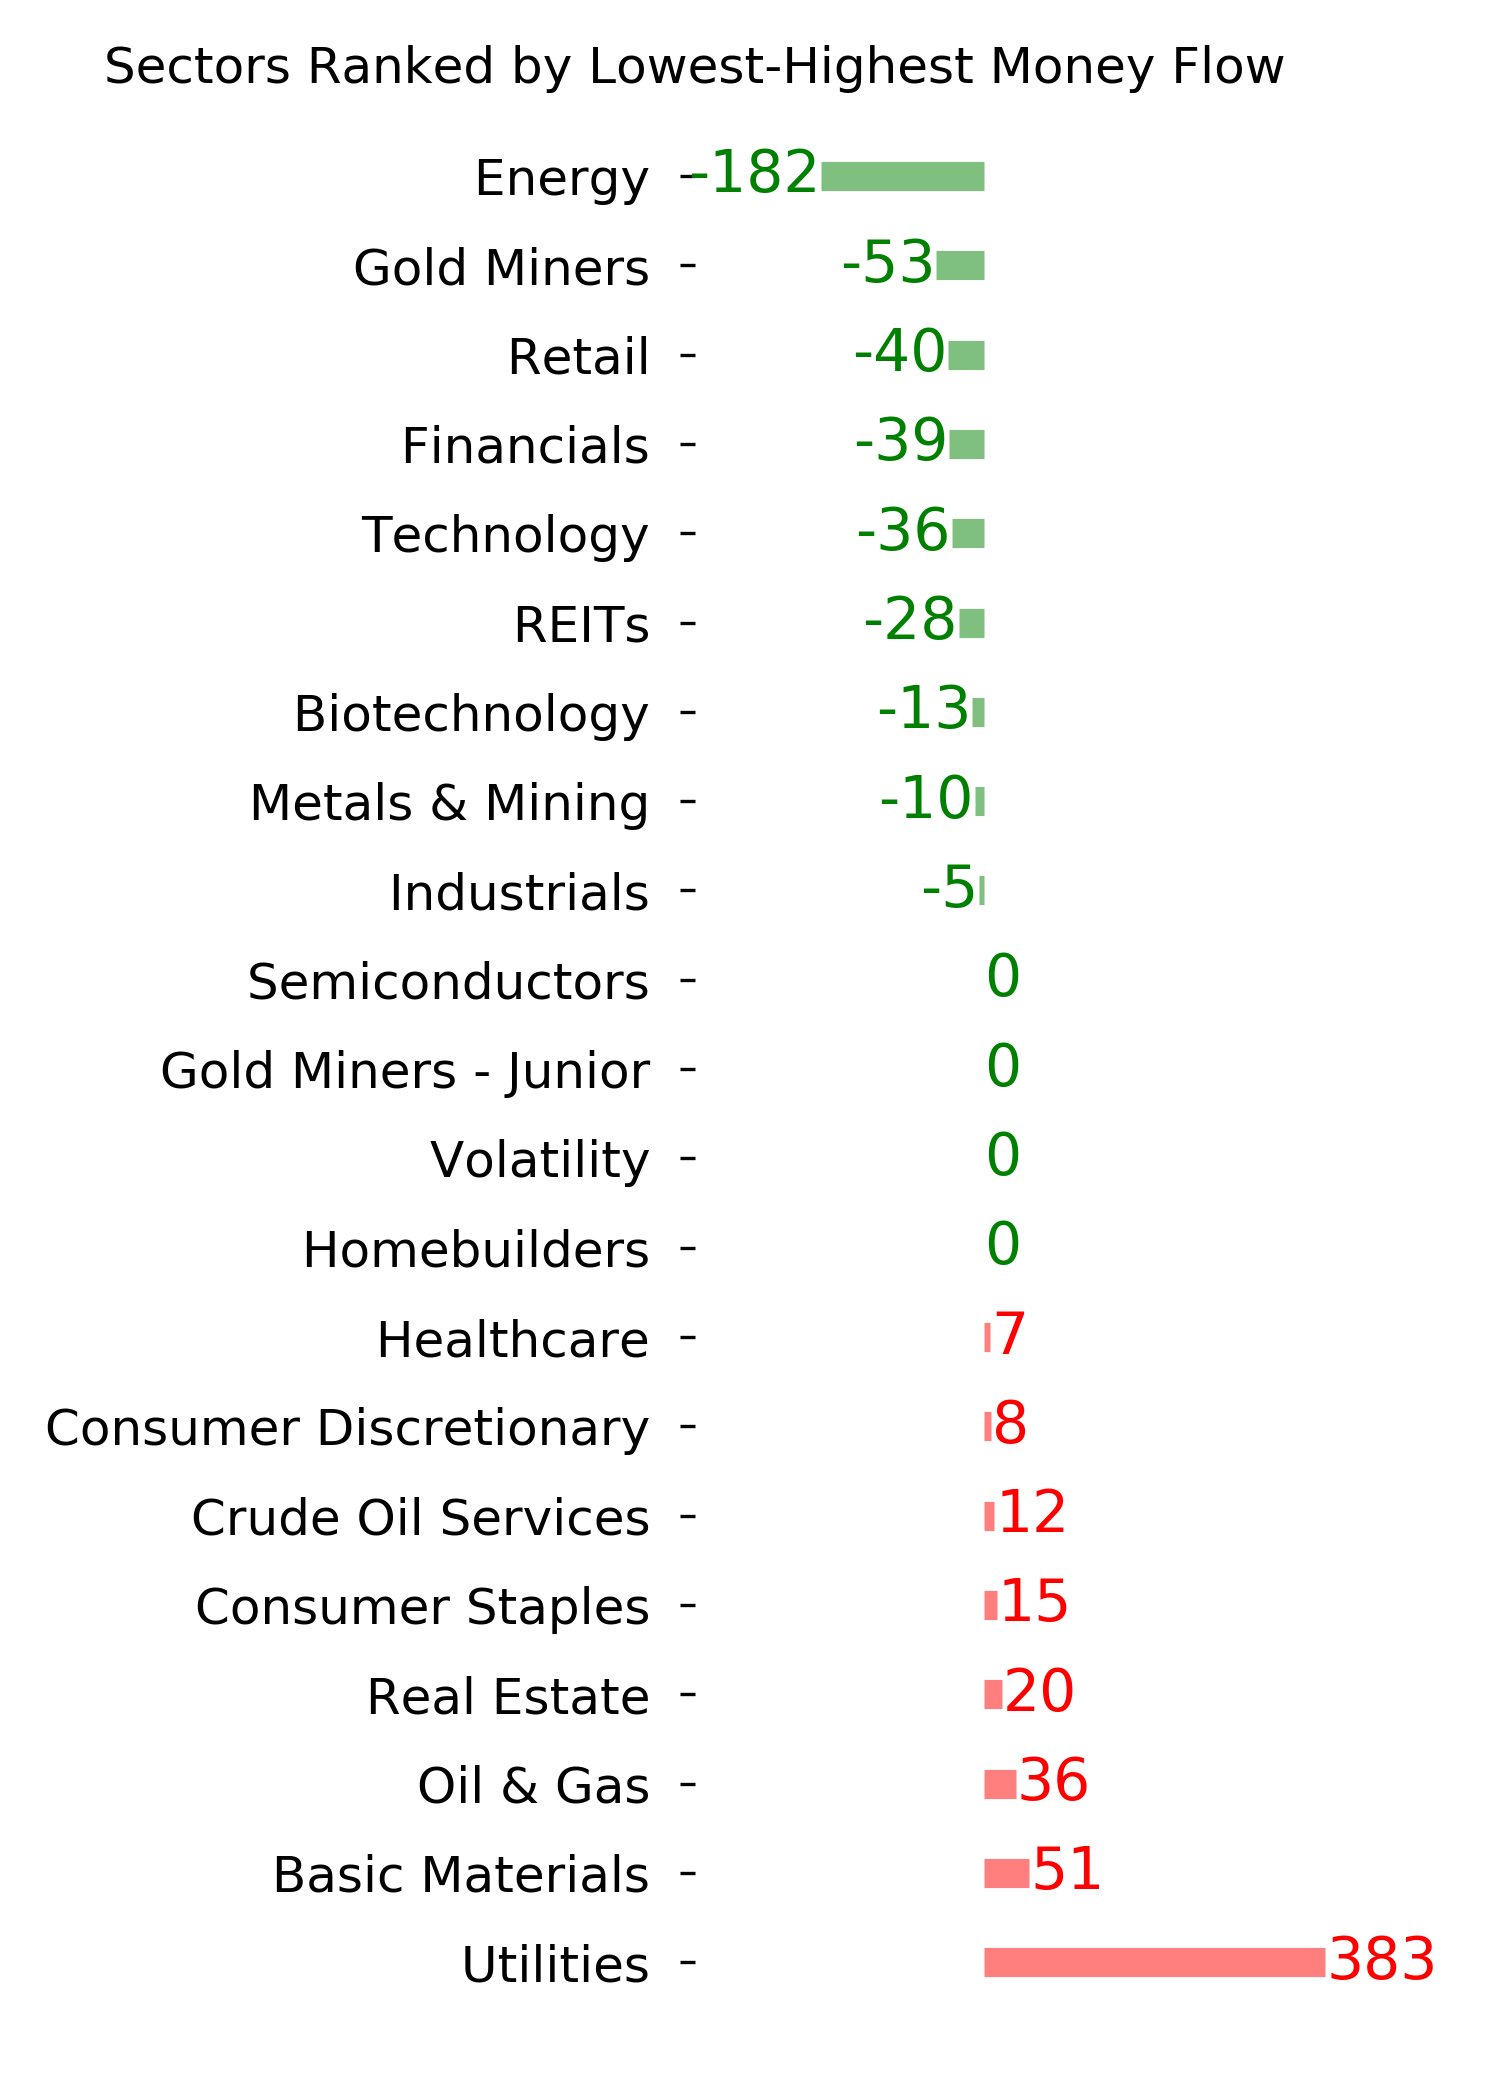
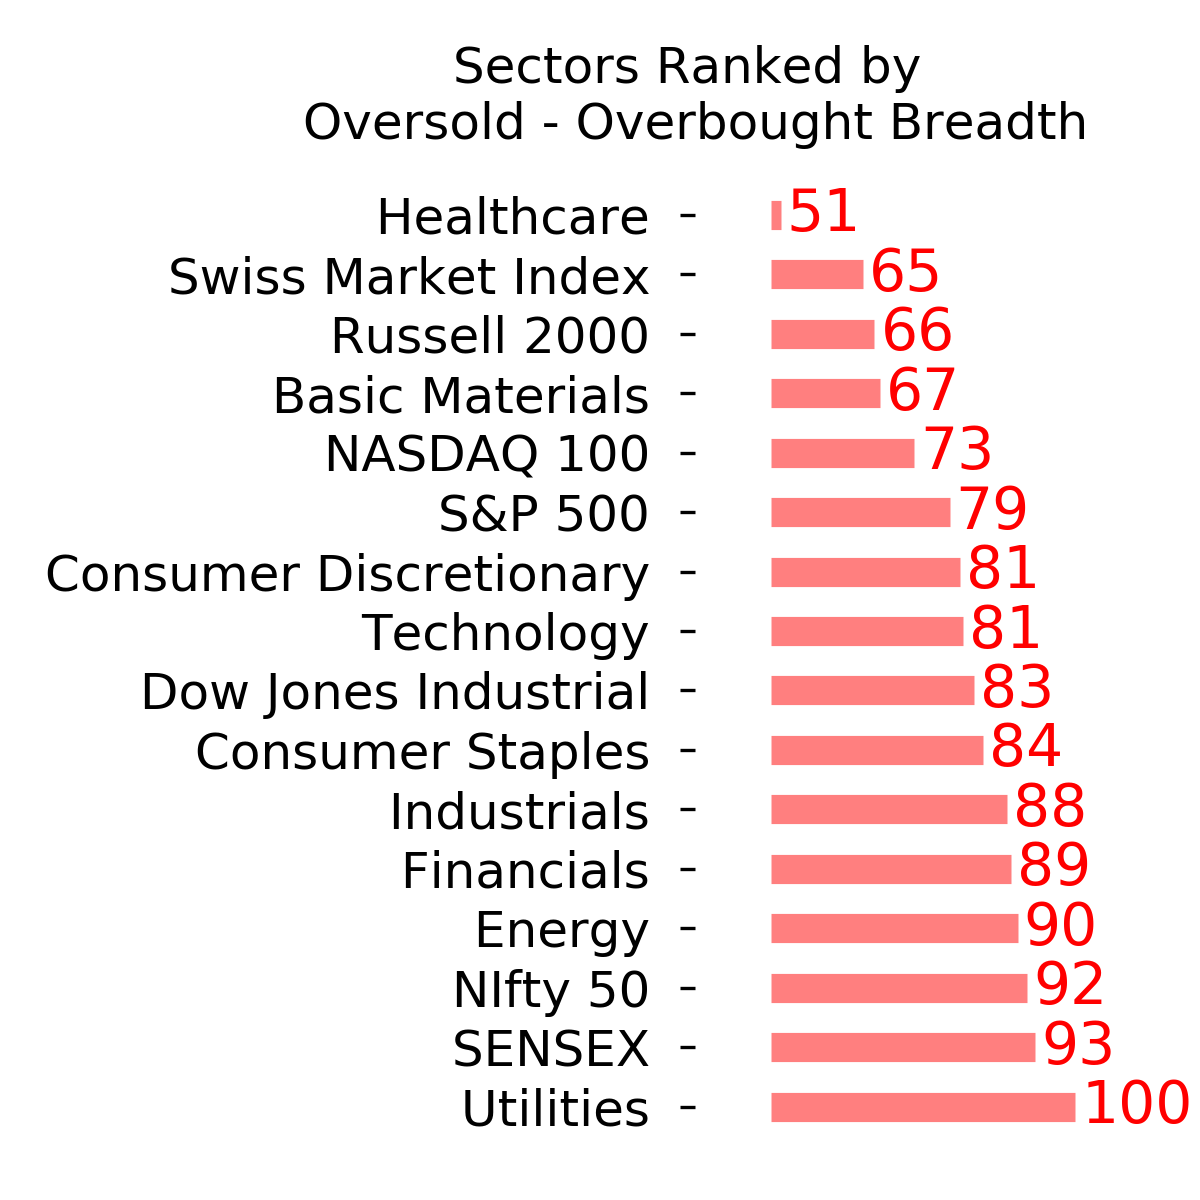
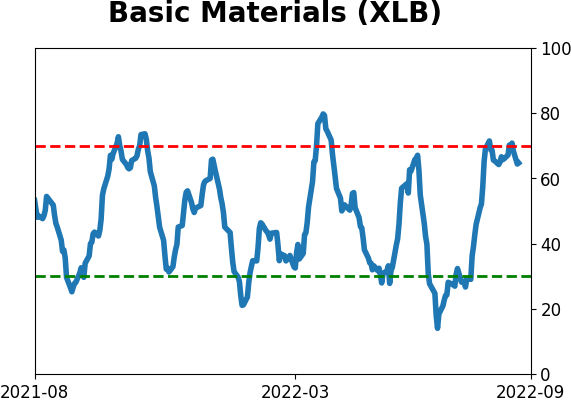
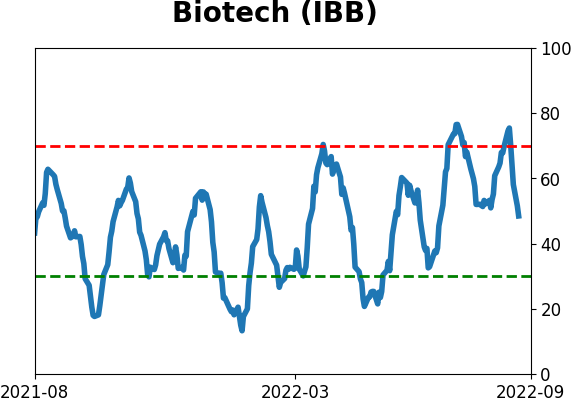
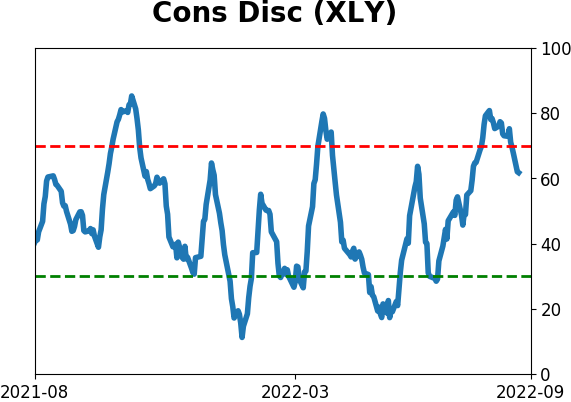
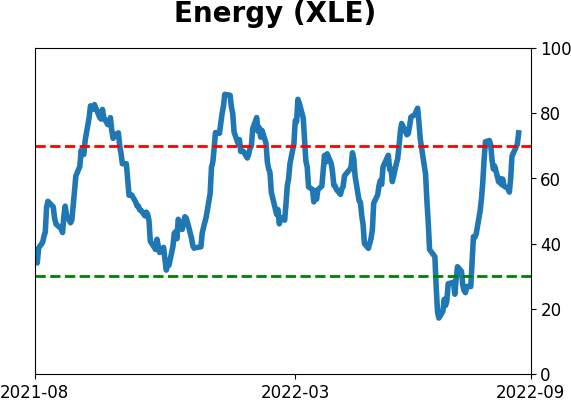
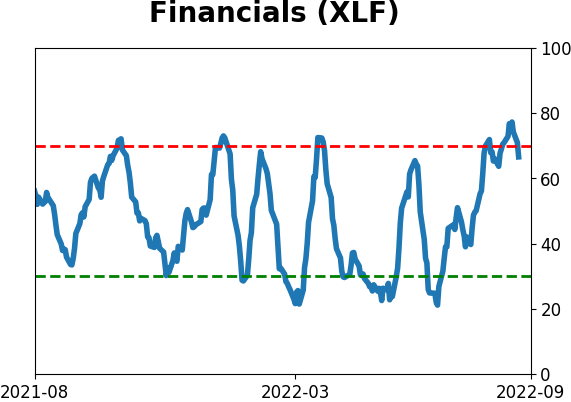
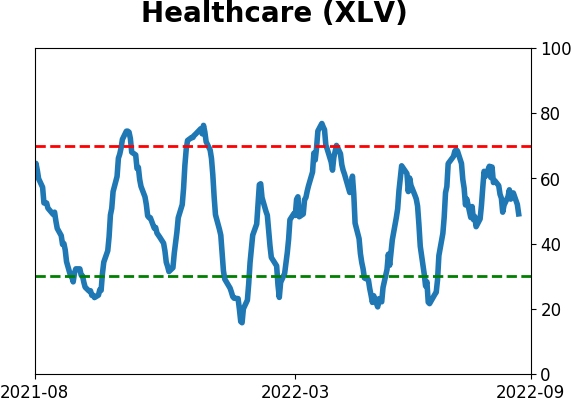
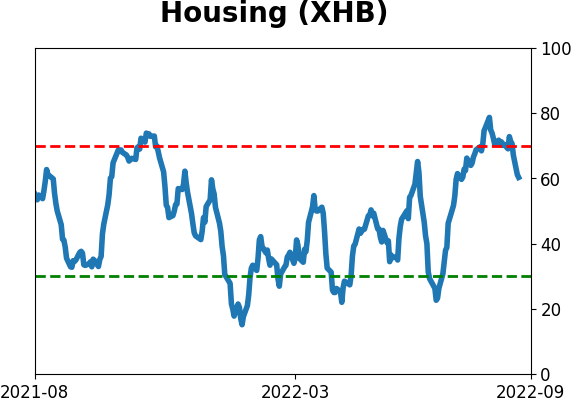
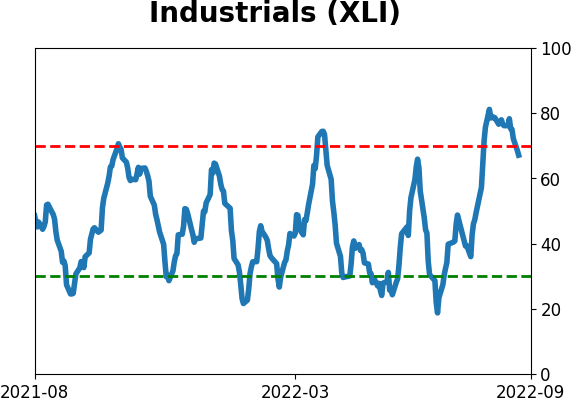
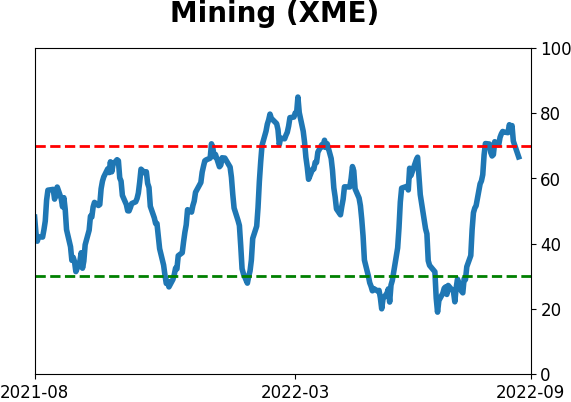
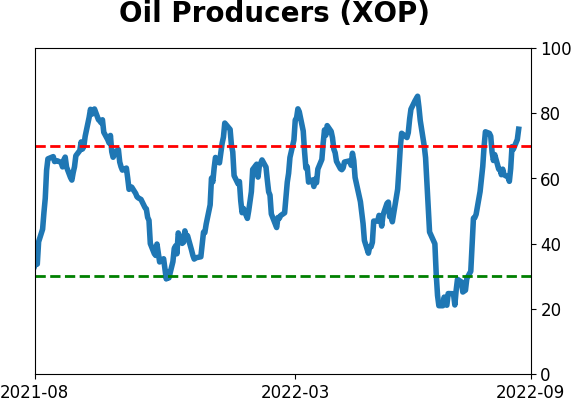
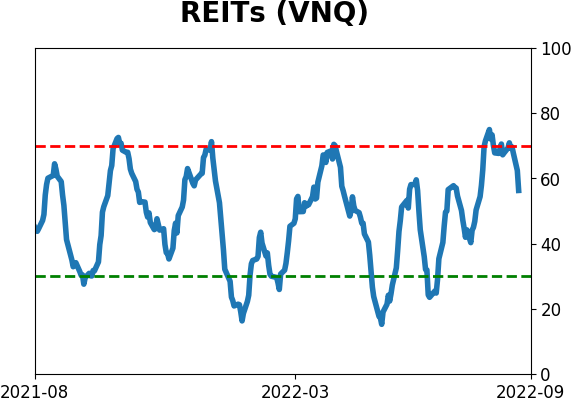
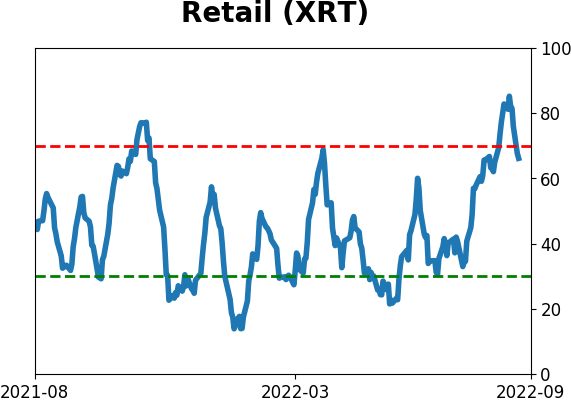
Sector ETF's - 10-Day Moving Average
|
|
|
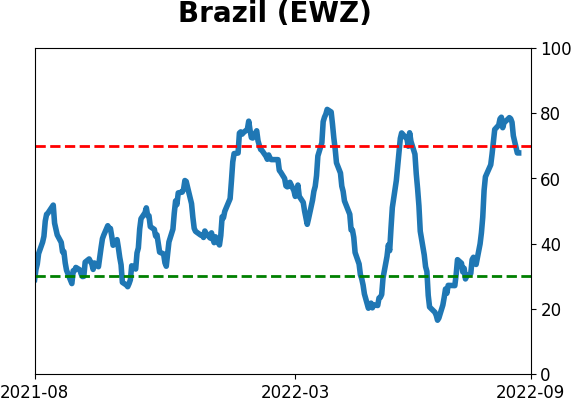
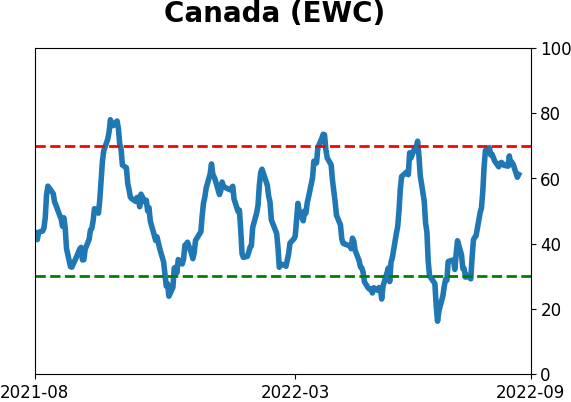
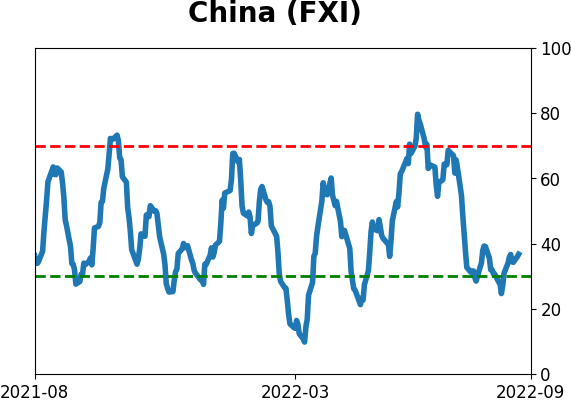
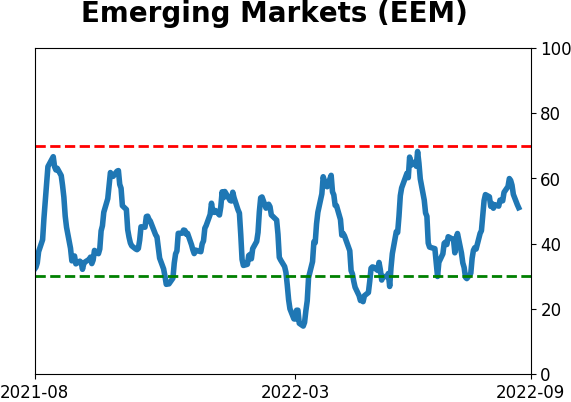
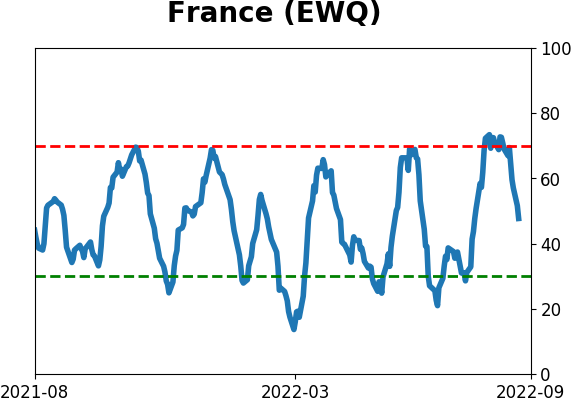
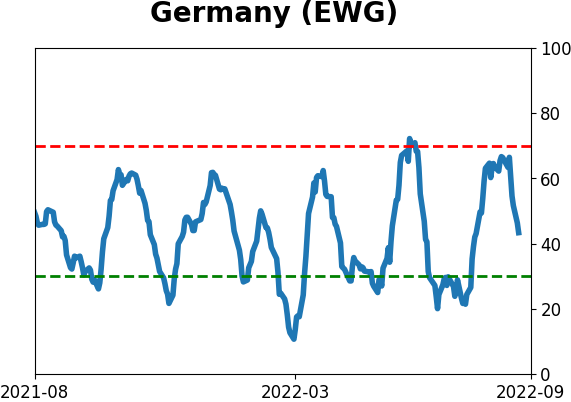
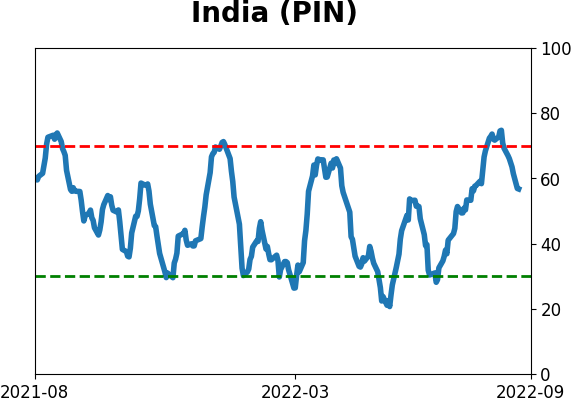
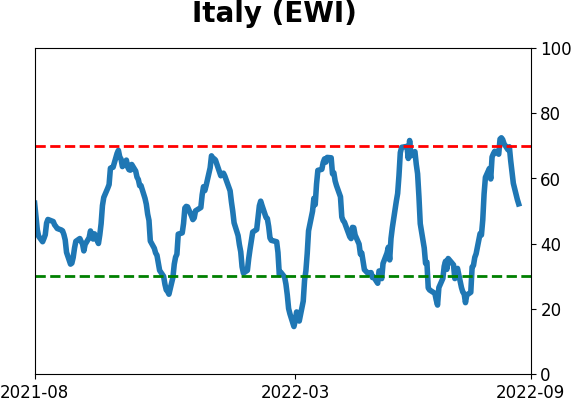
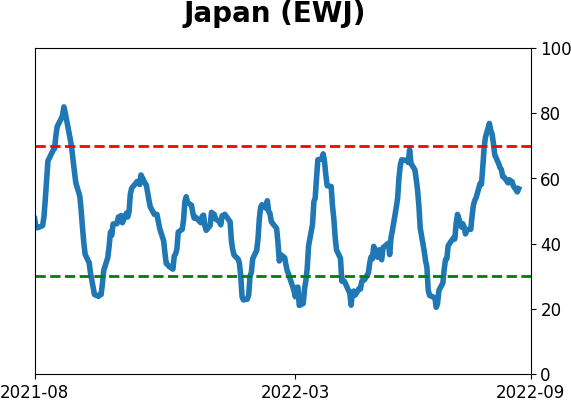
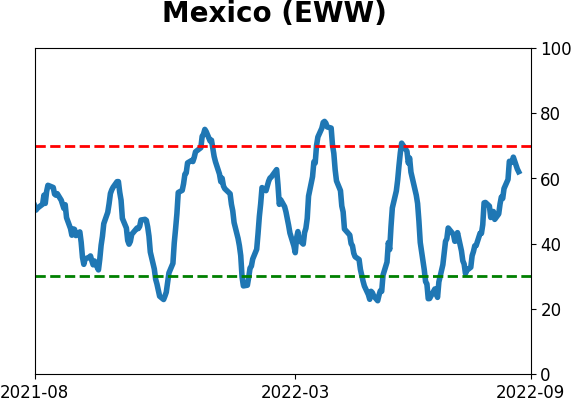
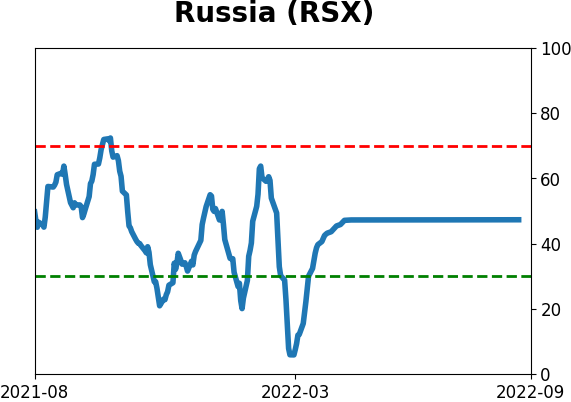
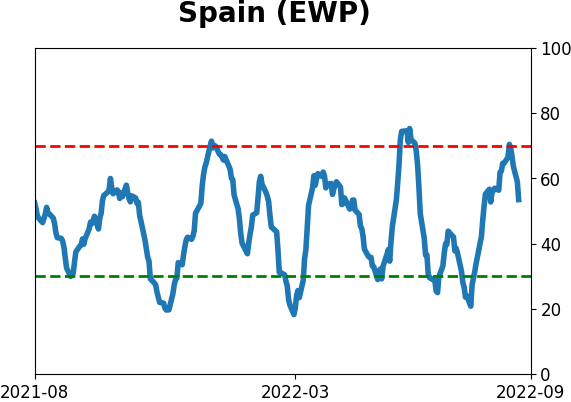
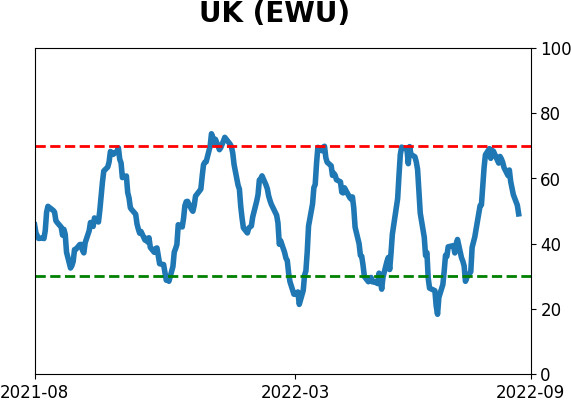
Country ETF's - 10-Day Moving Average
|
|
|
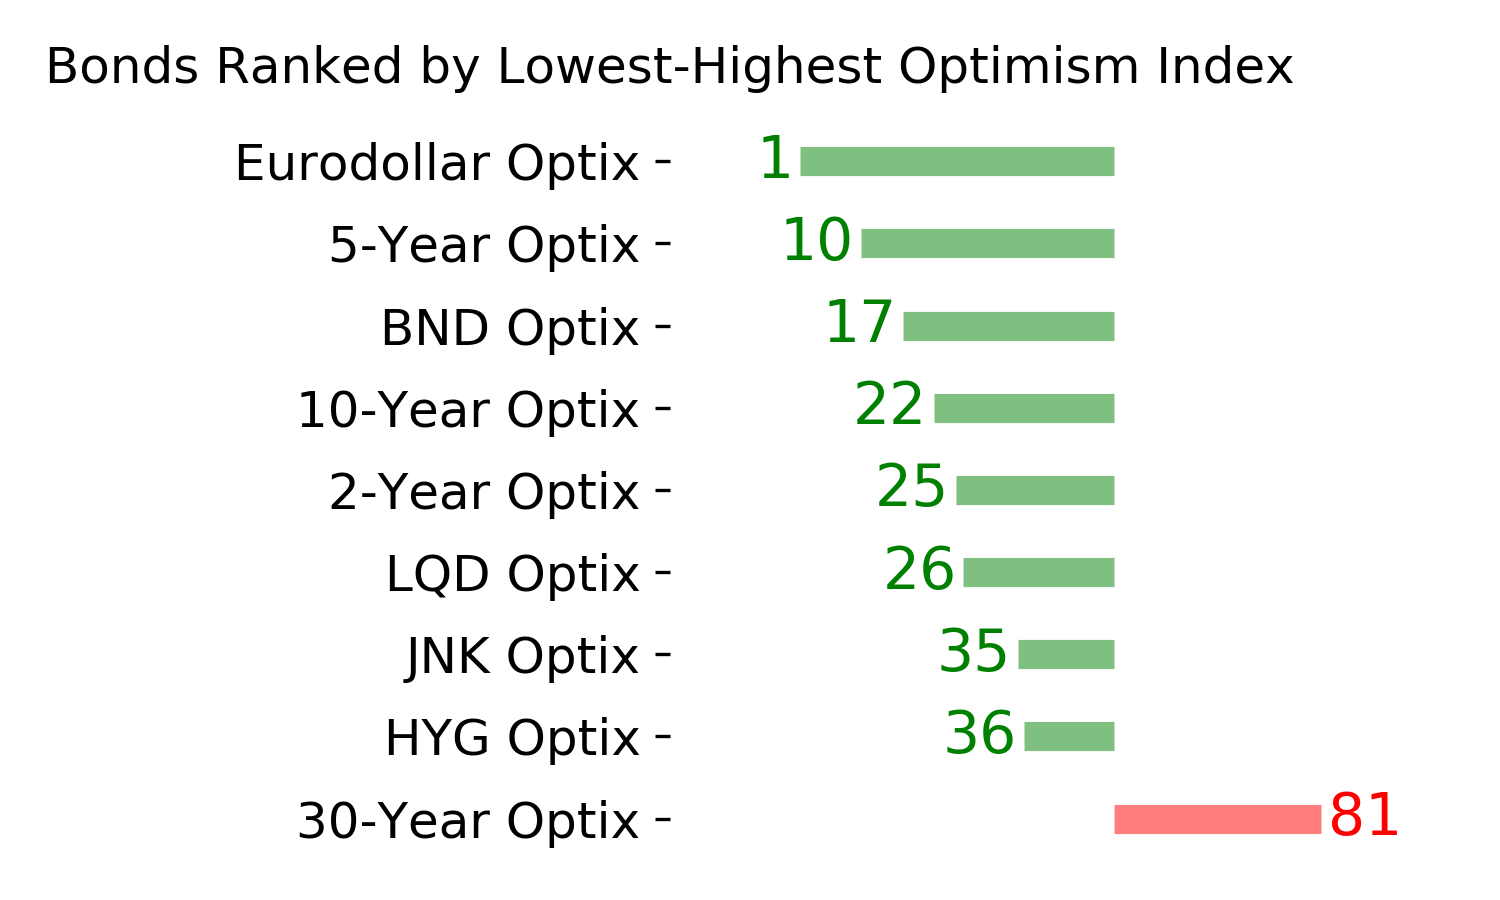
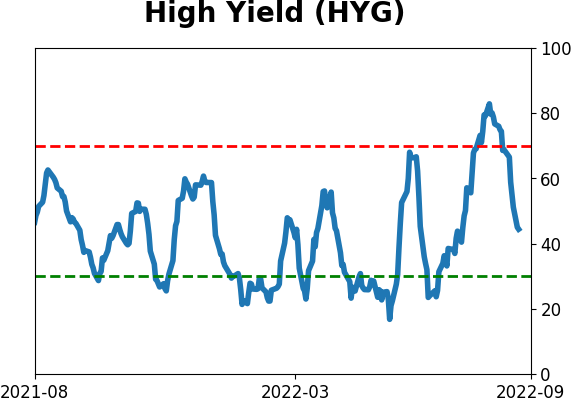
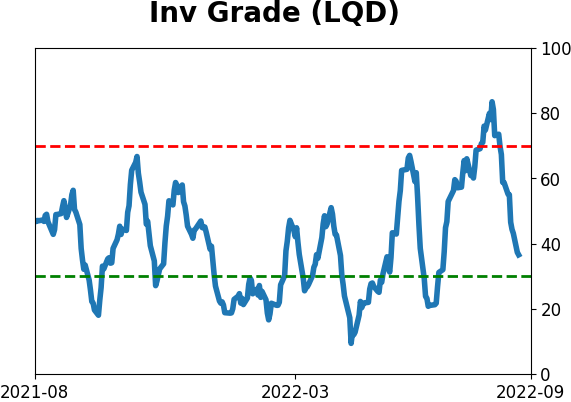
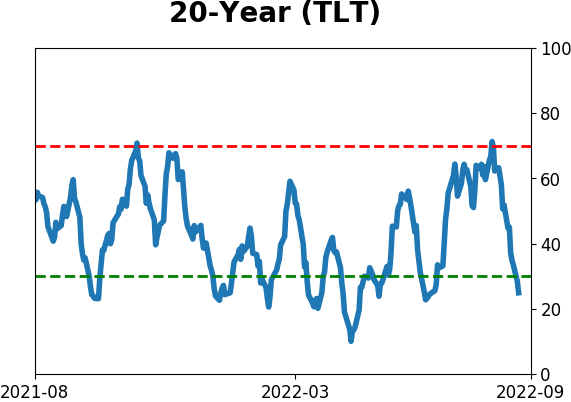
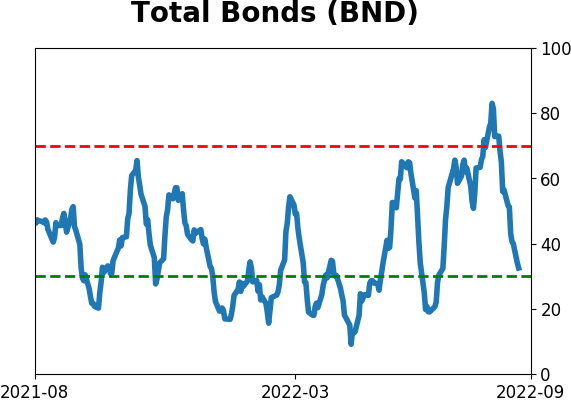
Bond ETF's - 10-Day Moving Average
|
|
|
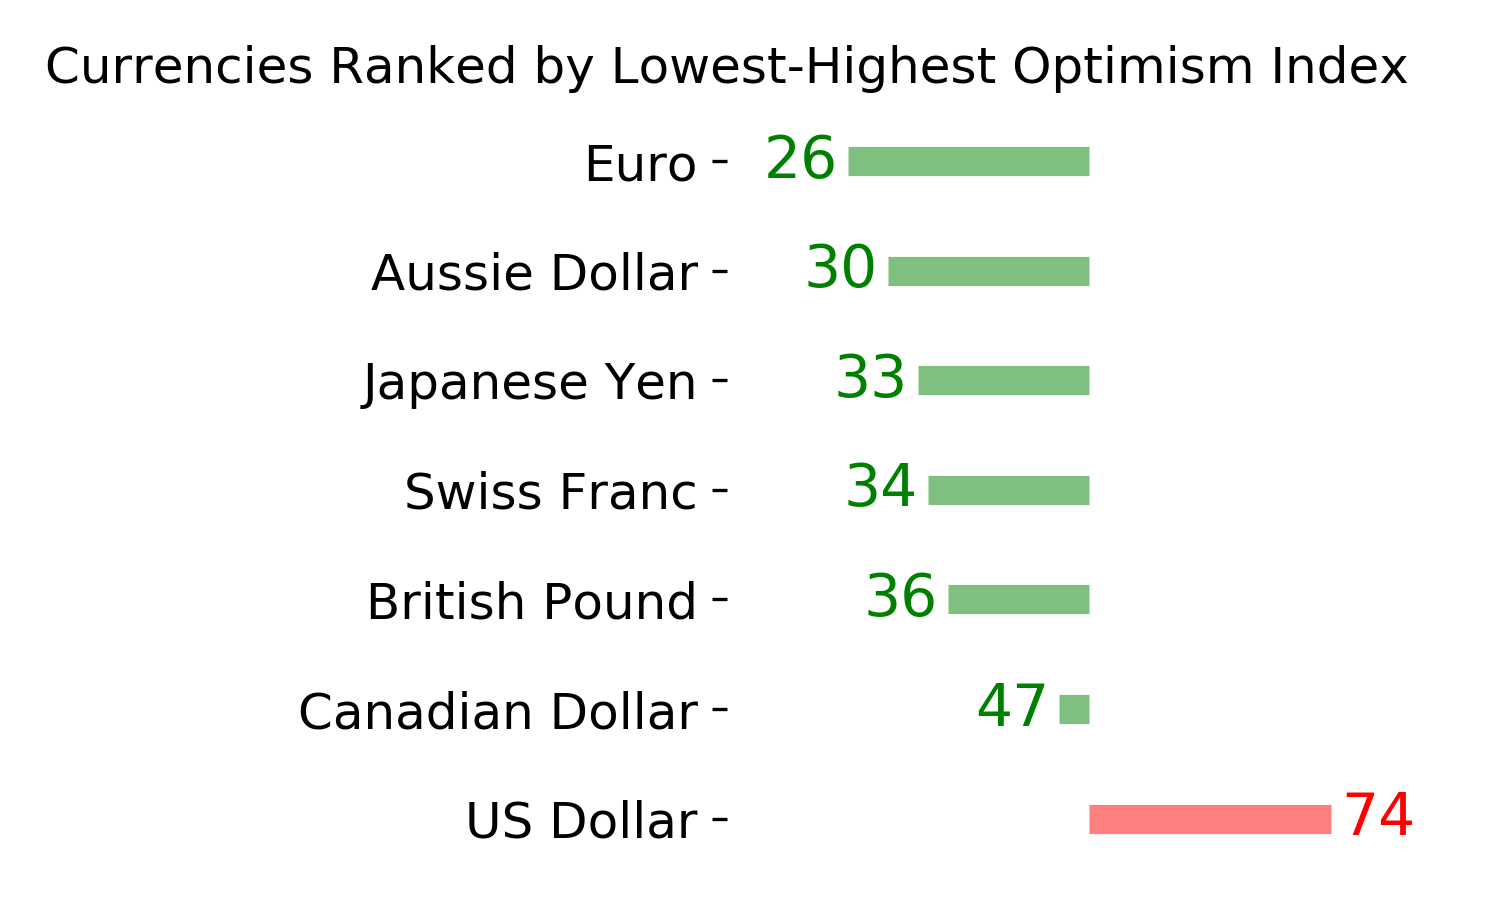
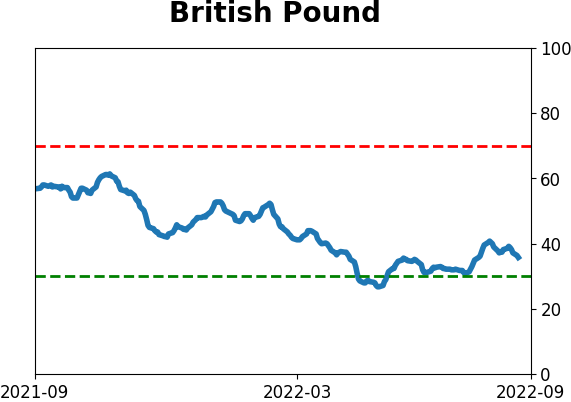
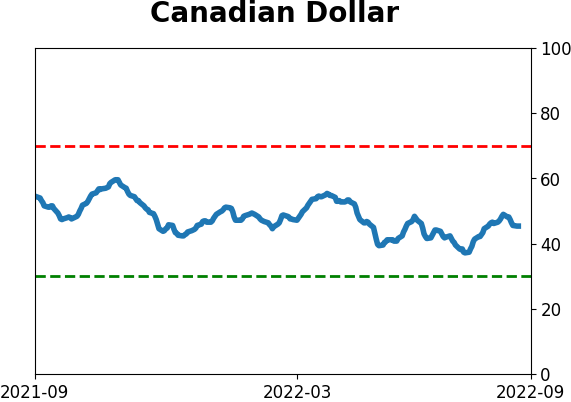
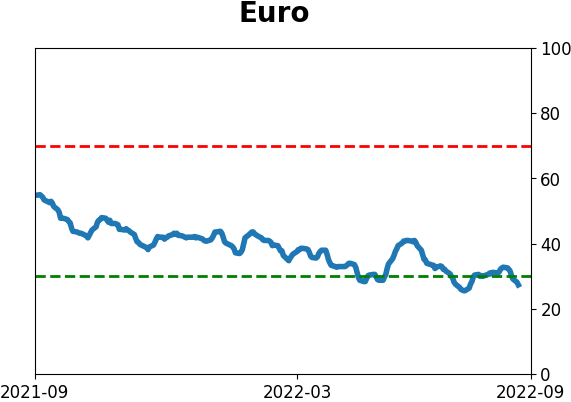
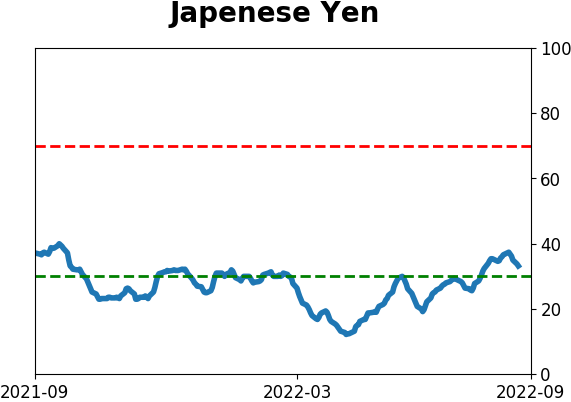
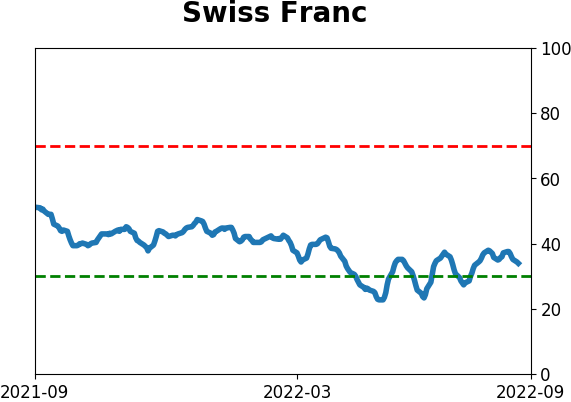
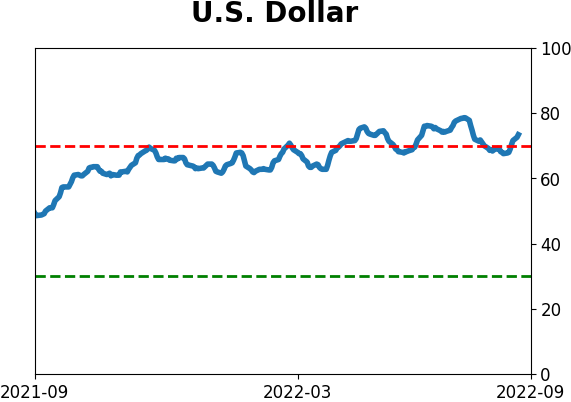
Currency ETF's - 5-Day Moving Average
|
|
|
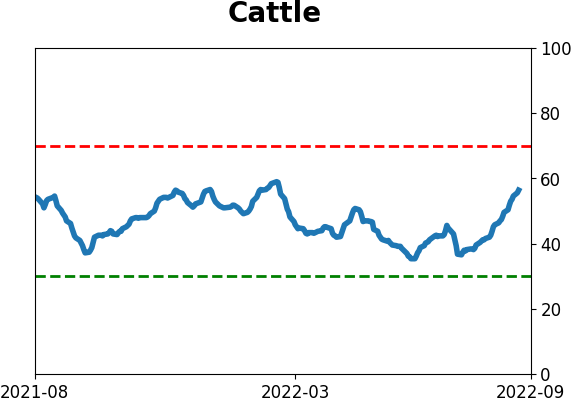
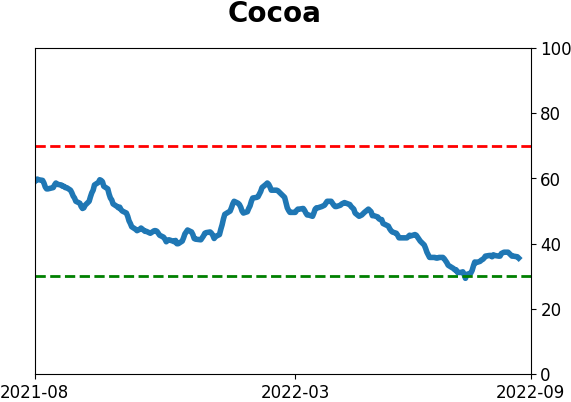
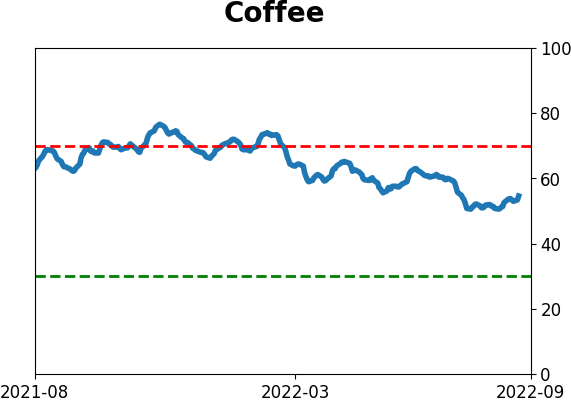
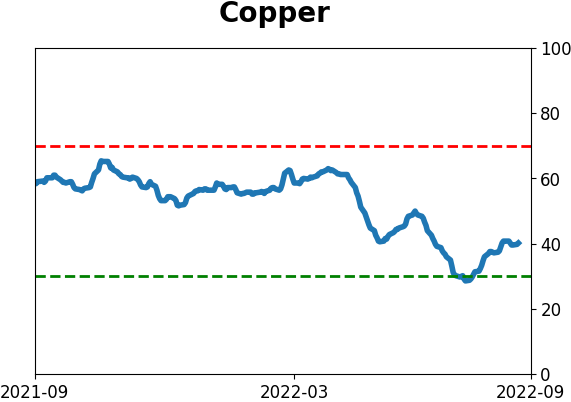
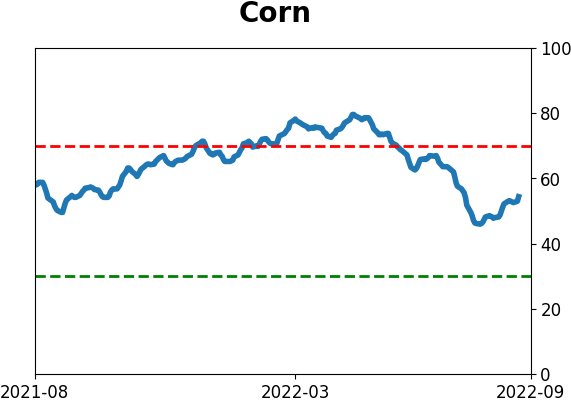
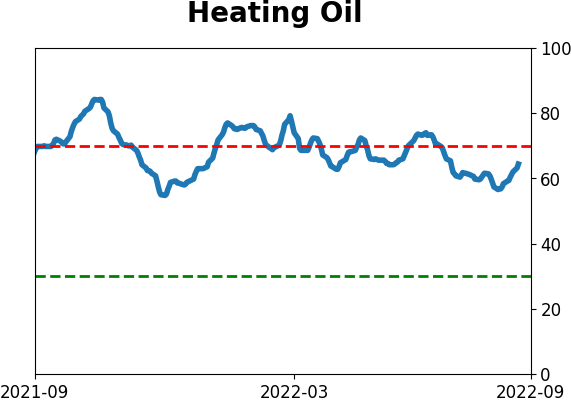
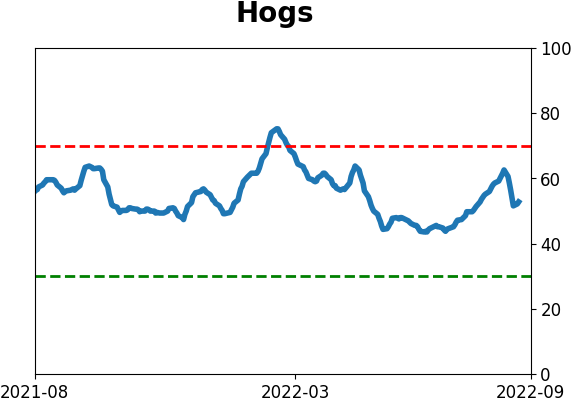
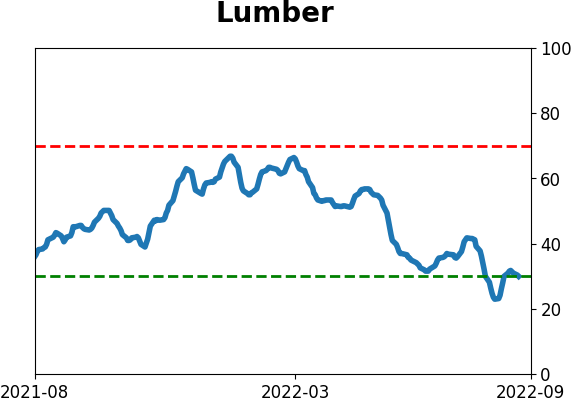
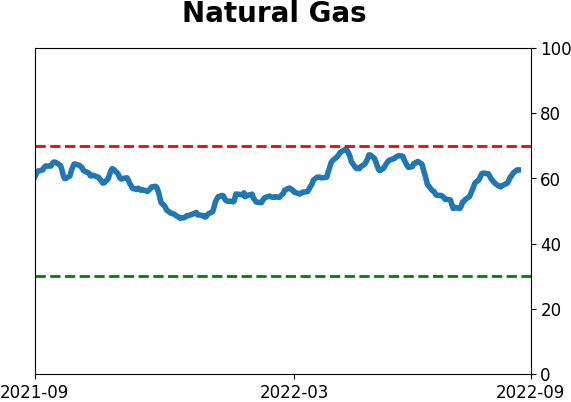
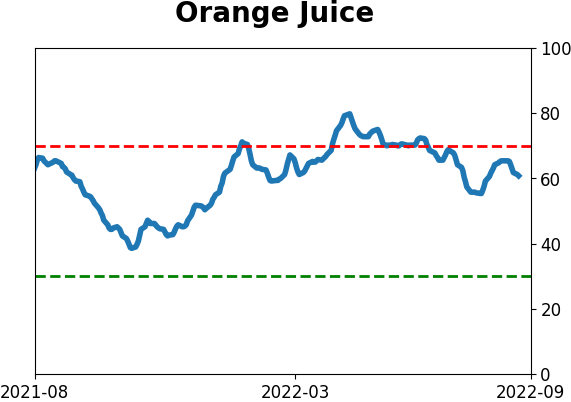
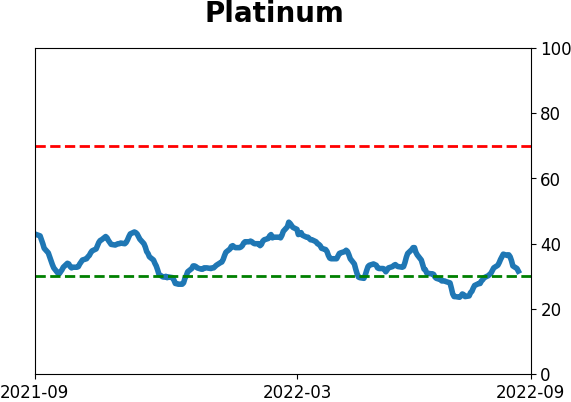
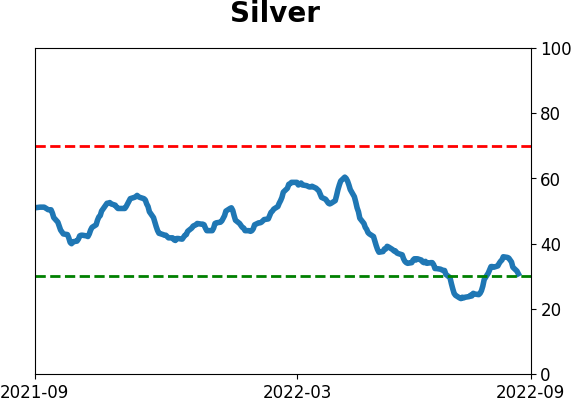
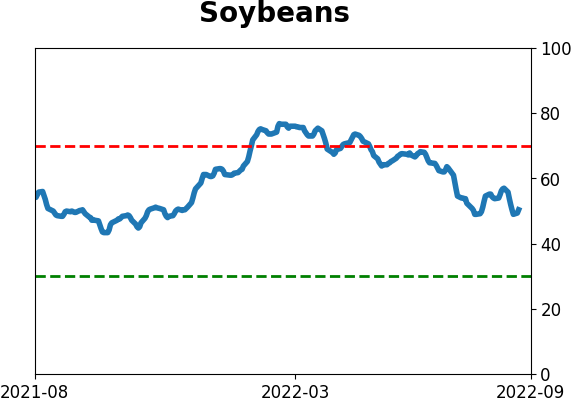
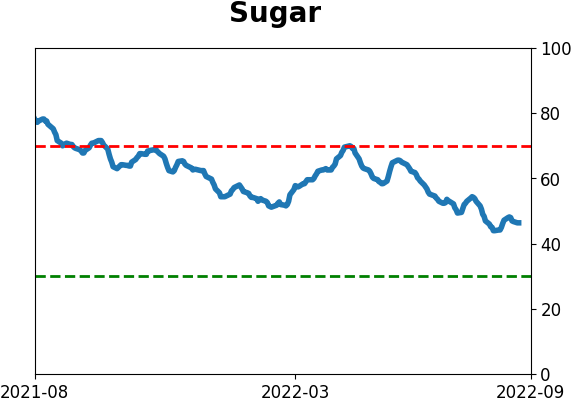
Commodity ETF's - 5-Day Moving Average
|
|