Headlines
|
|
Several put/call ratios reversed from elevated levels, triggering buy signals for stocks:
A trading system that detects bearish-to-bullish reversals in the put/call ratio triggered buy signals for the S&P 500 and Nasdaq 100. Comparable sentiment shifts delivered robust returns and consistency for both indexes across medium and long-term horizons.
|
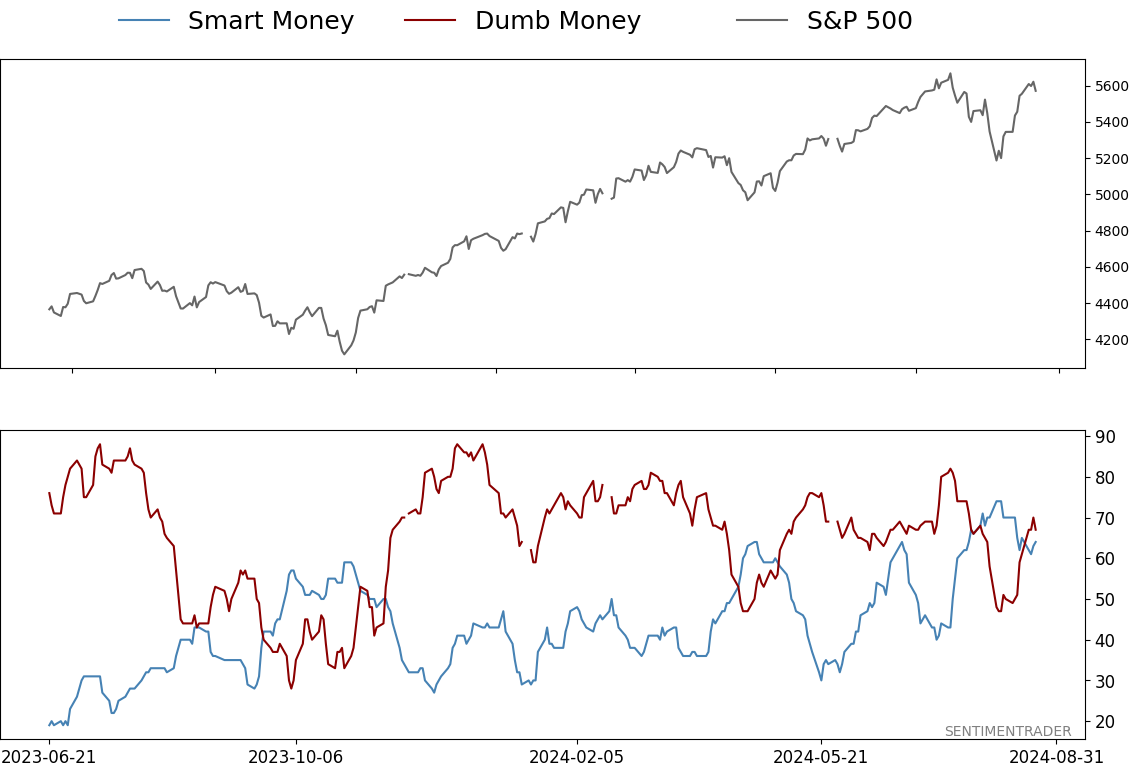
Smart / Dumb Money Confidence
|
Smart Money Confidence: 64%
Dumb Money Confidence: 67%
|
|
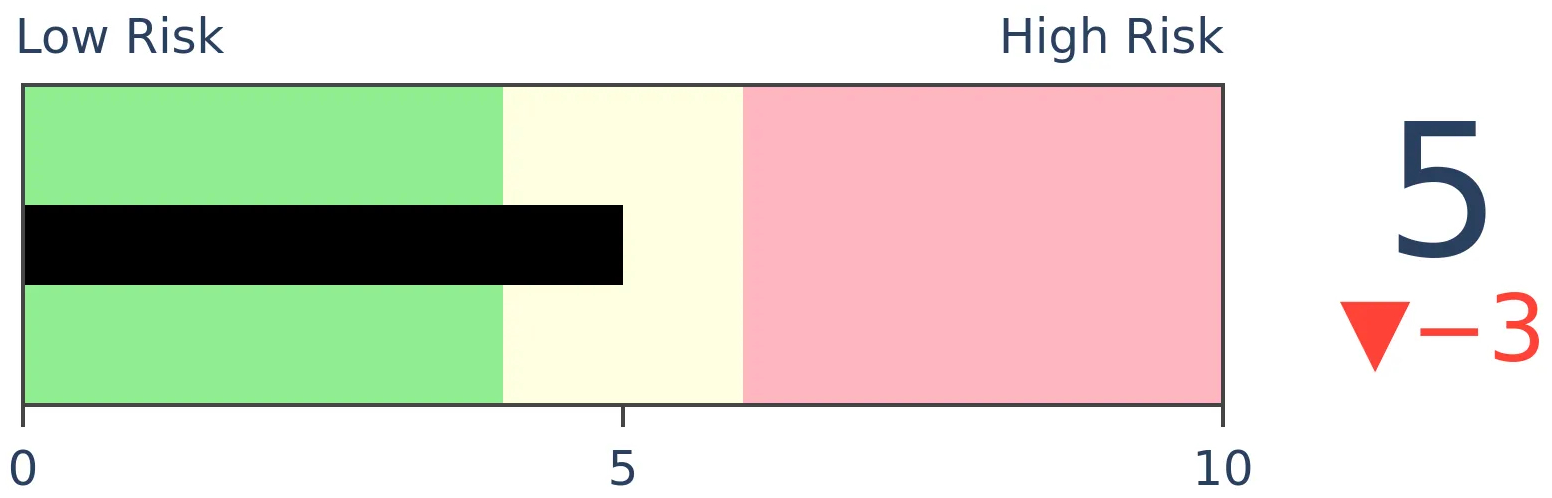
Risk Levels
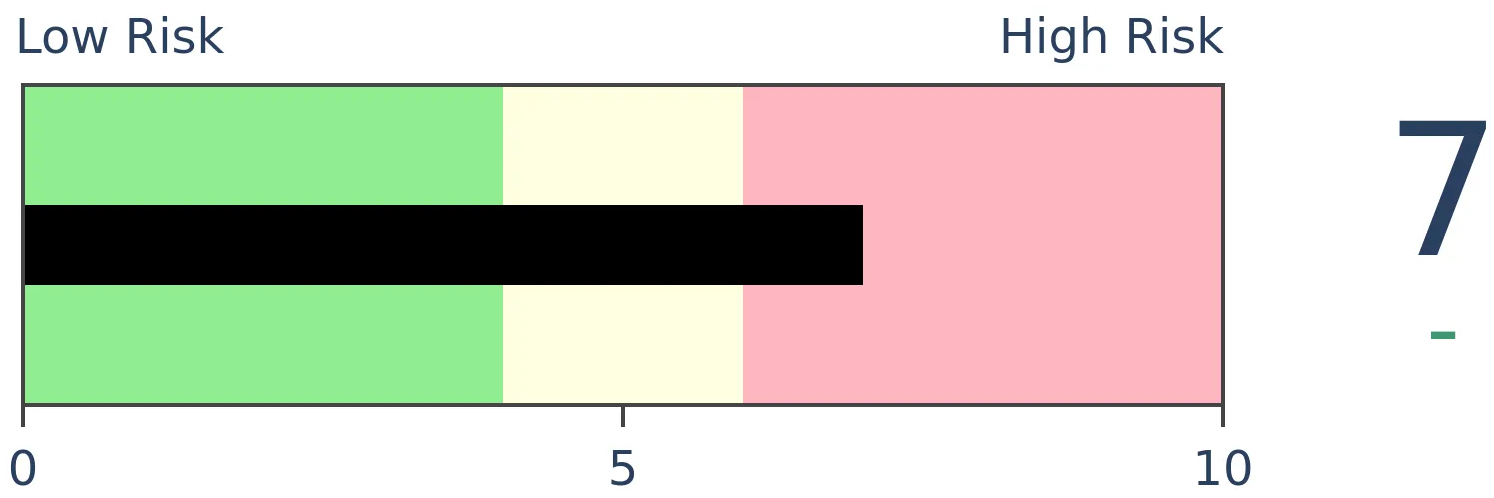
Stocks Short-Term
|
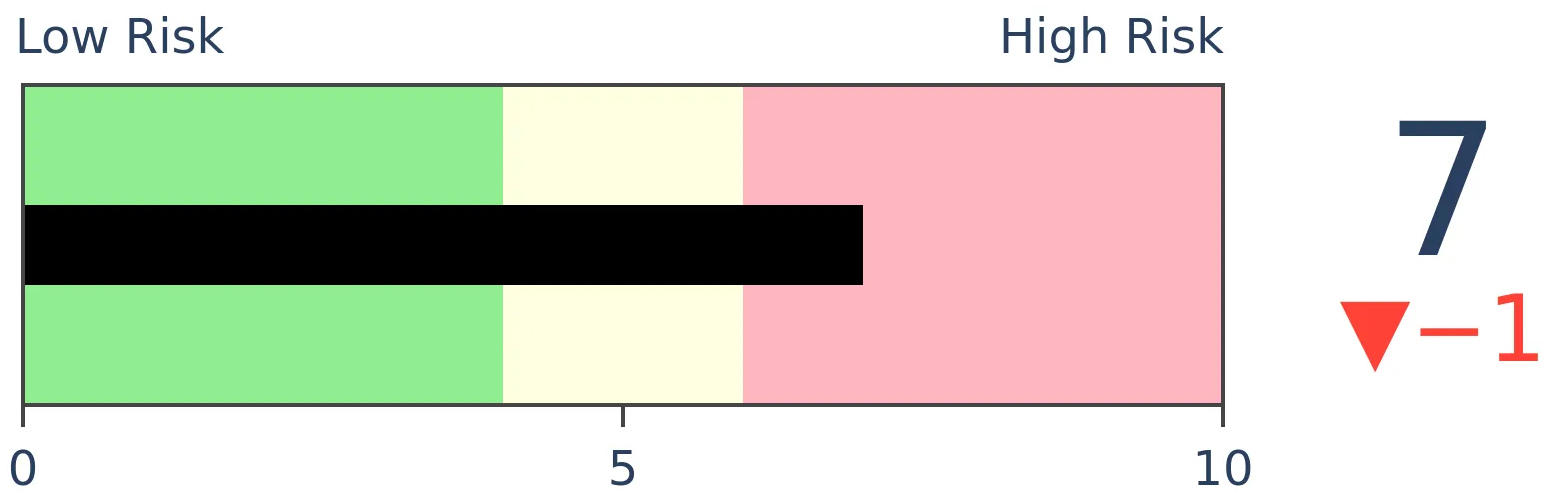
Stocks Medium-Term
|
|
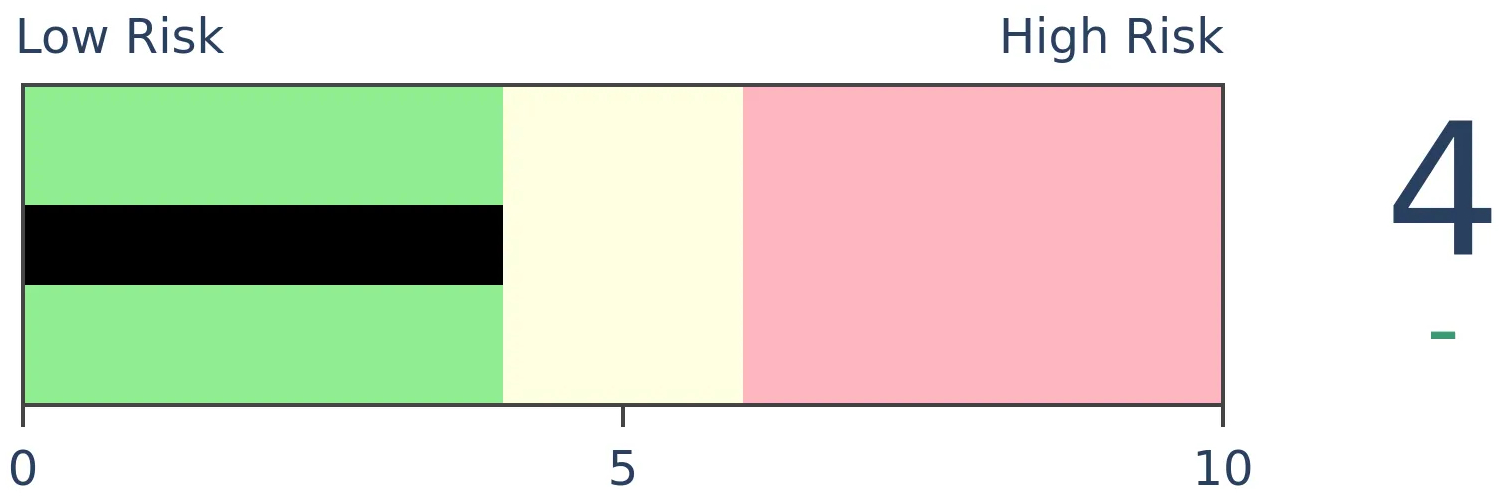
Bonds
|
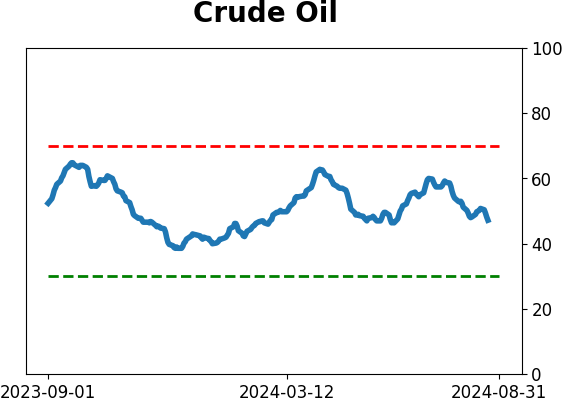
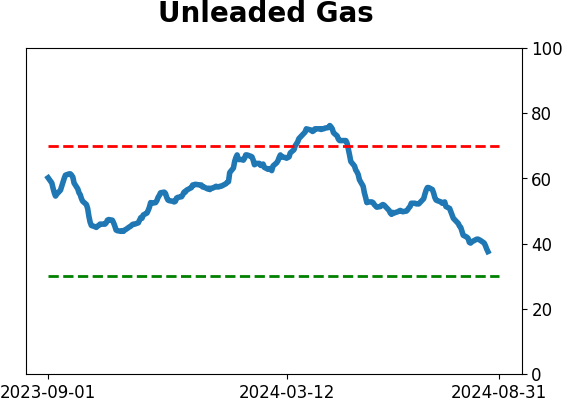
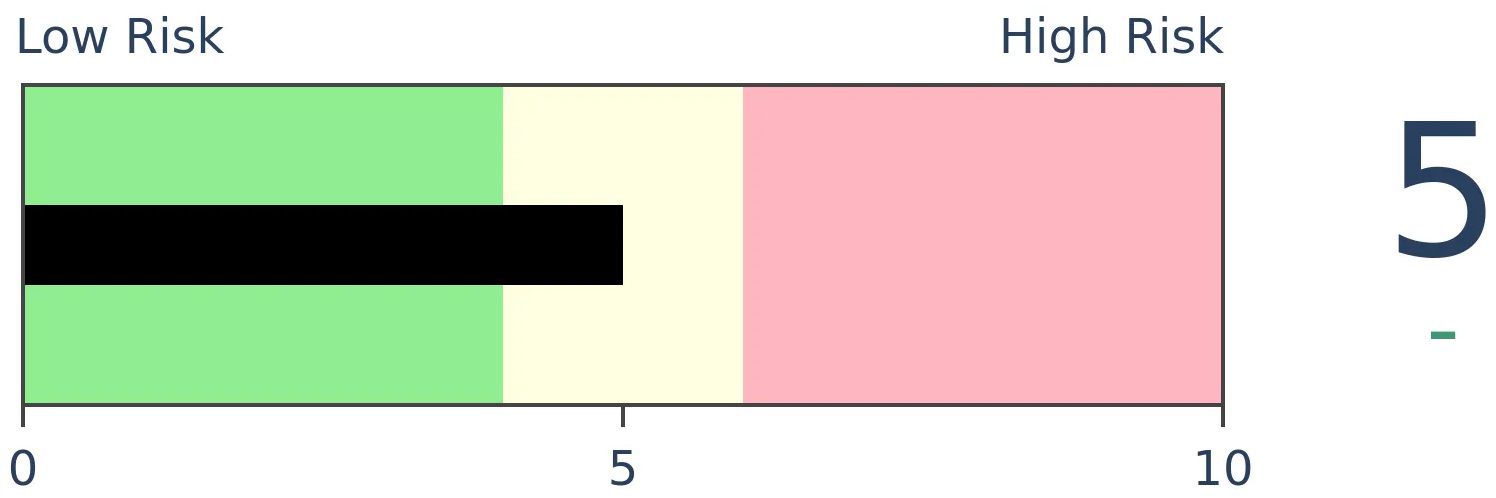
Crude Oil
|
|
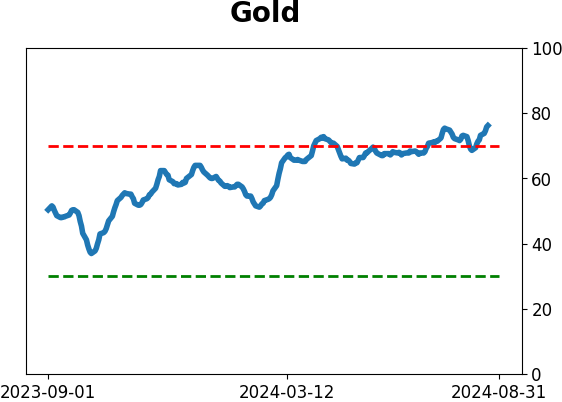
Gold
|
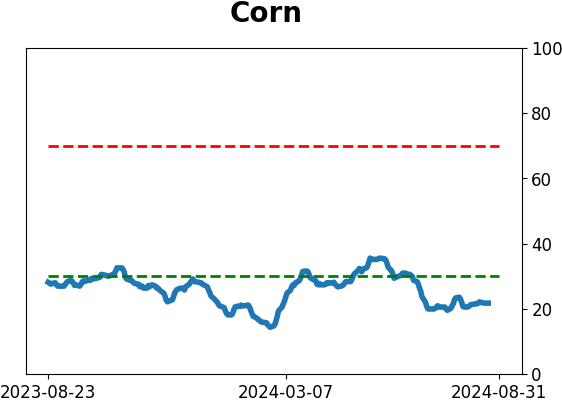
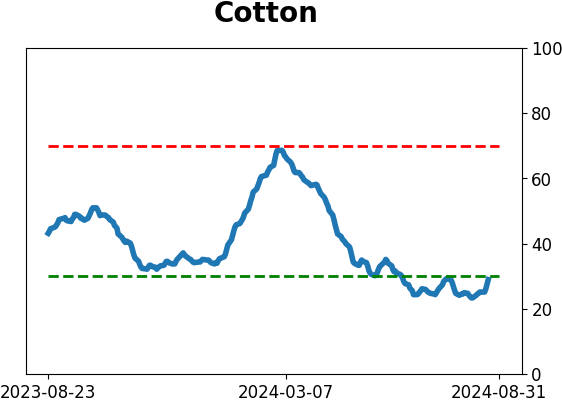
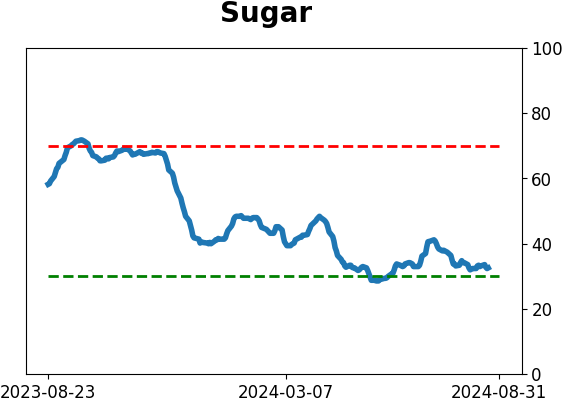
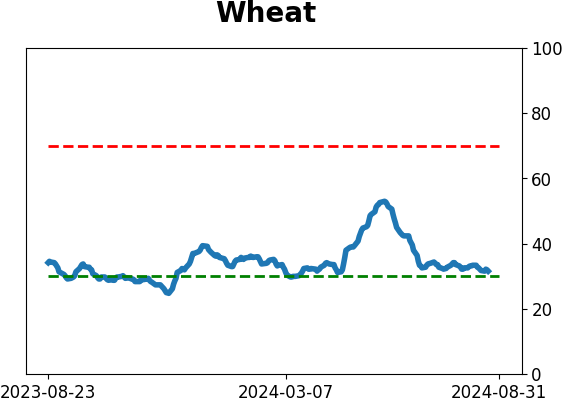
Agriculture

|
|
Research
By Dean Christians
BOTTOM LINE
A trading system that detects bearish-to-bullish reversals in the put/call ratio triggered buy signals for the S&P 500 and Nasdaq 100. Comparable sentiment shifts delivered robust returns and consistency for both indexes across medium and long-term horizons.
FORECAST / TIMEFRAME
SPY -- Up, Medium-Term
|
Key points:
- The CBOE total put/call ratio reversed relative to its recent range, triggering a buy signal
- Similar shifts in sentiment produced an 80% win rate for the S&P 500 over the subsequent three months
- The Nasdaq 100 aggregated put/call ratio reversed relative to its recent range, generating a buy signal
- Comparable shifts in sentiment produced a 77% win rate for the QQQ ETF over the following month
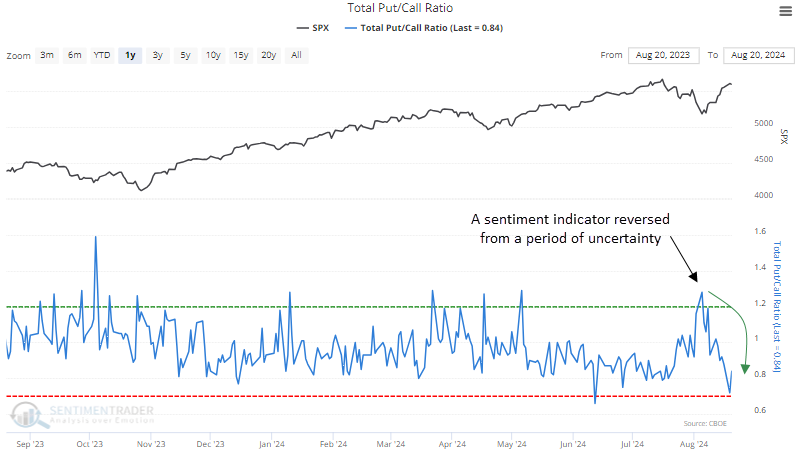
The put-call ratio as a contrary sentiment indicator
Last week, my colleague Jay Kaeppel published a report addressing the overly pessimistic extremes reflected in several sentiment indicators. During such periods of fear or uncertainty, traders often face a tough choice: Should they try to catch the proverbial falling knife or wait until the fear subsides? There's no definitive answer; it all comes down to individual risk tolerance.
I prefer to wait until fear diminishes. In this report, I'll share my method for identifying sentiment reversals.
Following heightened pessimism, the CBOE total put/call ratio reversed relative to its recent range, triggering a buy signal for stocks. The previous alert occurred in April, leading to a 7% gain in the S&P 500 over two months.
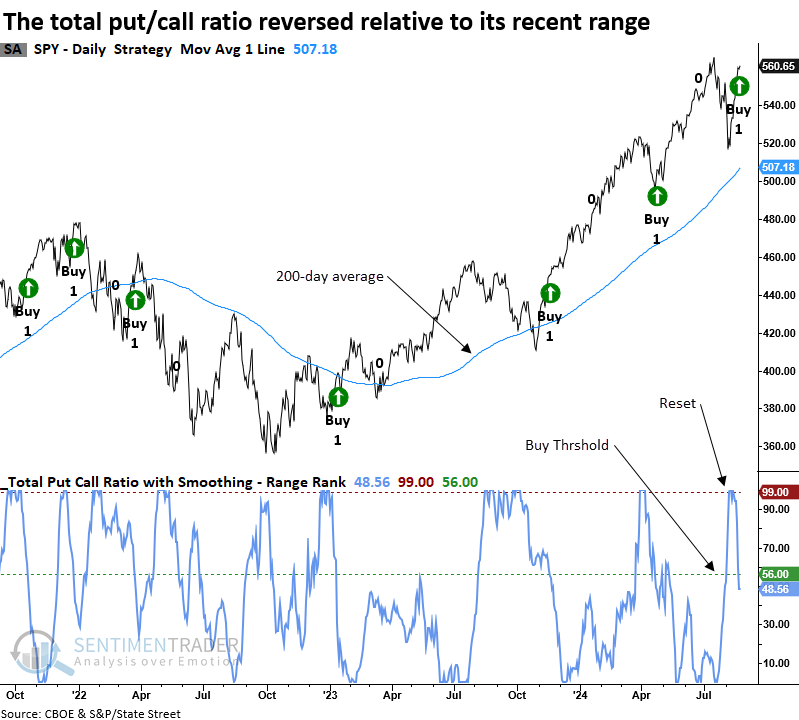
A trading model that identifies a reversal in the put/call ratio
The put/call ratio trading model applies an 84-day range rank to the 10-day moving average of the CBOE total put/call ratio. A pessimistic reset condition is confirmed when the range rank indicator exceeds the 99th percentile. Once the reset is achieved, a new buy signal occurs when the range rank falls below the 56th percentile. Within five sessions of the range rank falling below the buy threshold, the 5-day rate of change for the S&P 500 ETF (SPY) must be > 0%. i.e., market momentum is positive.
Subscribers can click the link below to save the total put/call ratio range rank signal to their favorites folder. Please be aware that this version excludes the 5-day rate of change condition. Click here.
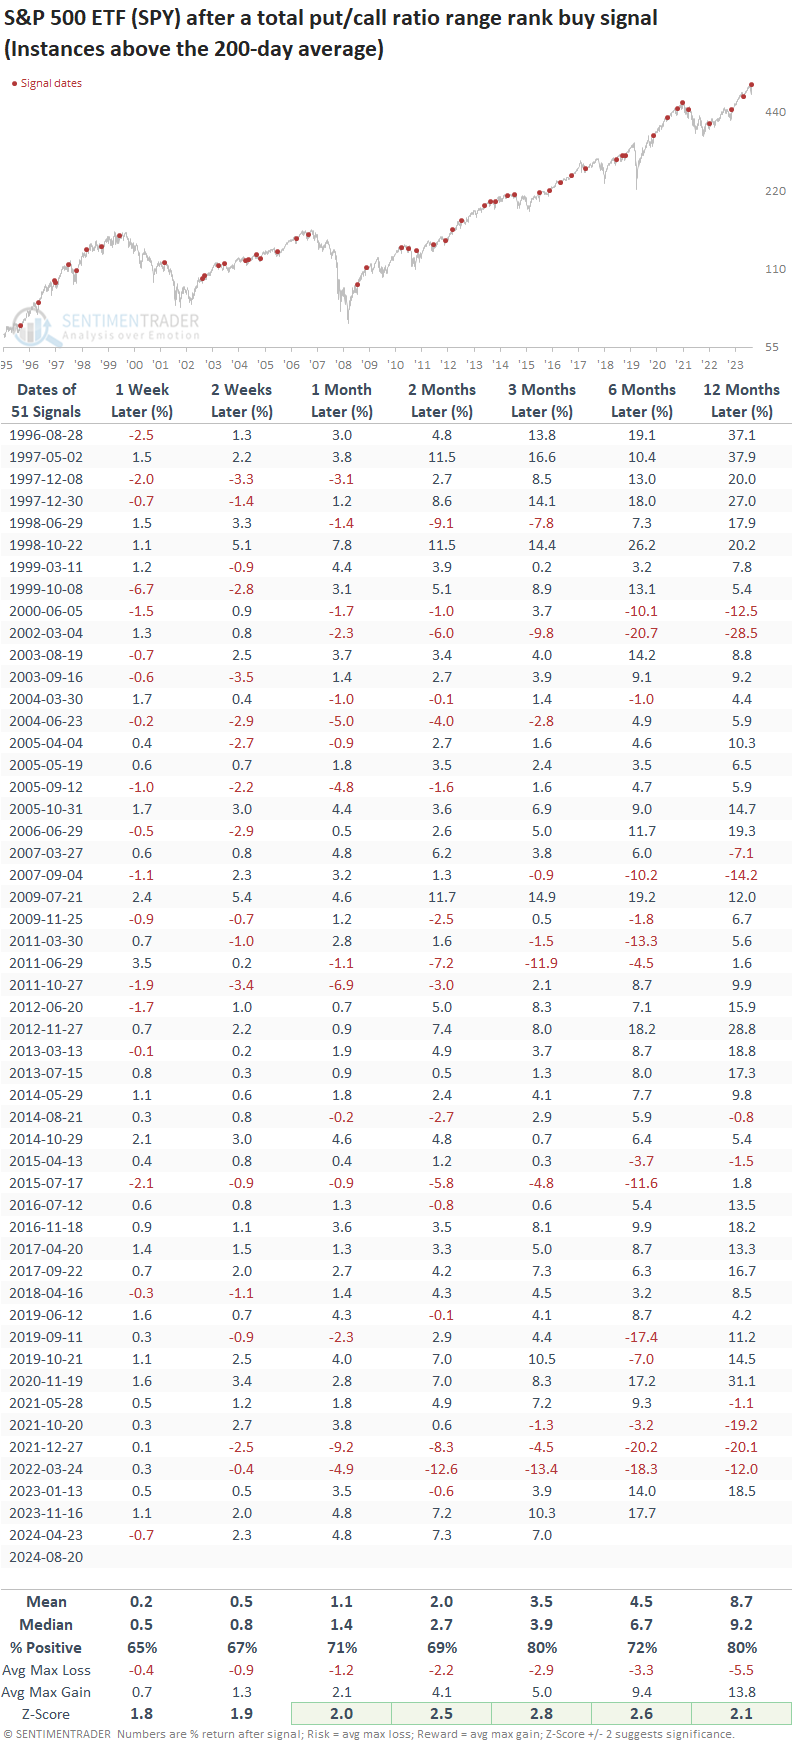
When the range rank for the total put/call ratio reversed relative to its recent range, with the S&P 500 above its 200-day average, the world's most benchmarked index displayed excellent returns and consistency over medium and long-term horizons. Furthermore, returns from one to twelve months later showed significance compared to random returns over the study period.
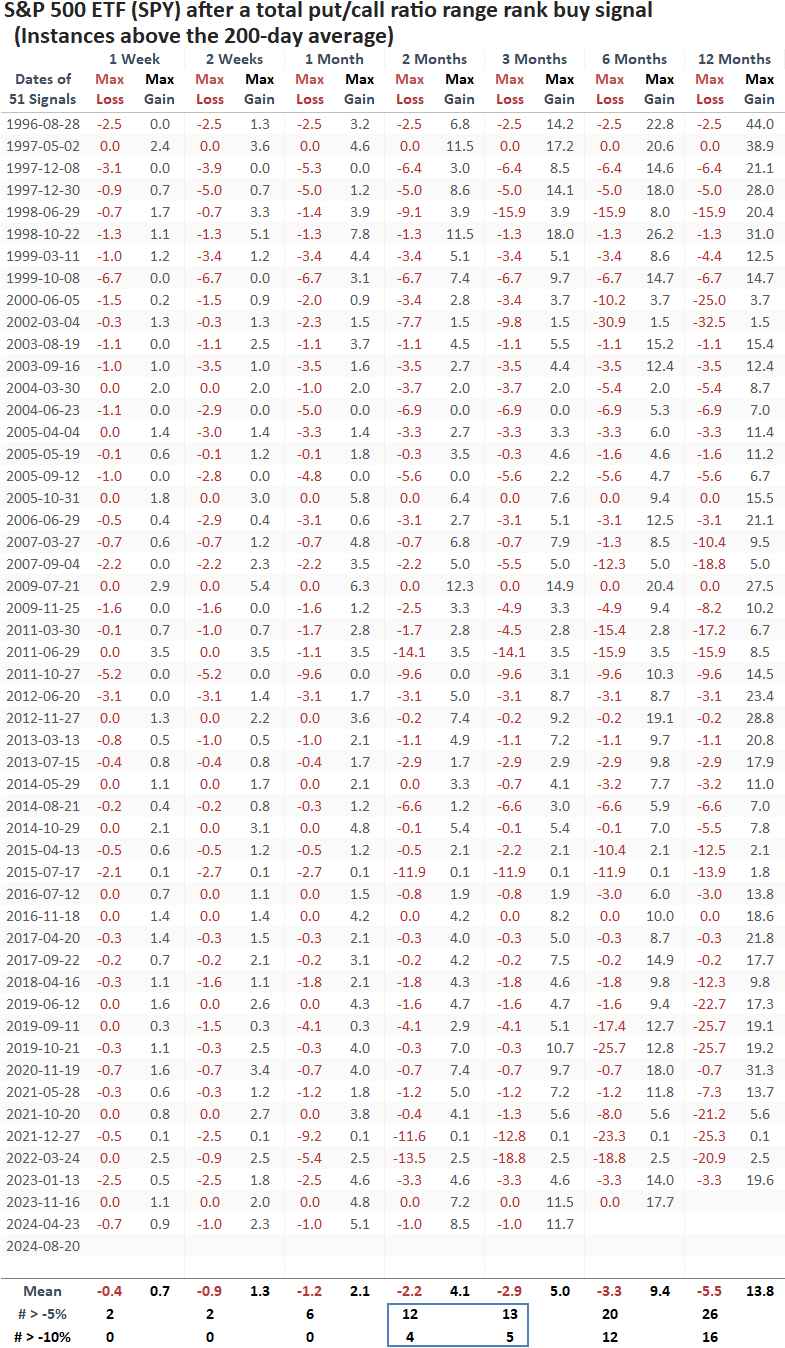
Over the next three months, the signal experienced a maximum loss of over -5% in 13 out of 51 instances and a maximum loss of -10% in 5 out of 51 occurrences, highlighting that no trading signal is without risk.
A put/call ratio for the Nasdaq 100 reversed relative to its recent range
With technology stocks bearing the brunt of the recent sell-off, the aggregated put/call ratio for the Nasdaq 100, which compiles option data for the index's members, spiked to an elevated level relative to its recent range.
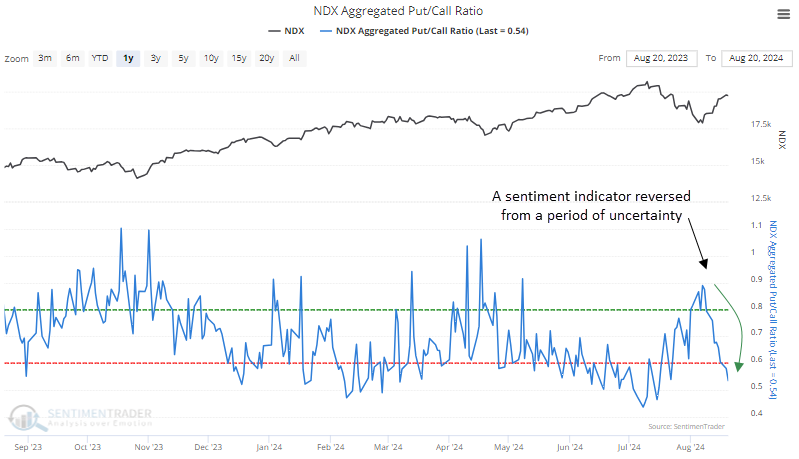
I utilize the same trading system across various put/call ratios with minor parameter adjustments. For the NDX version, the model applies an 84-day range rank to an 8-day average of the aggregated put/call ratio. A buy signal is triggered when the rank drops below 59%.
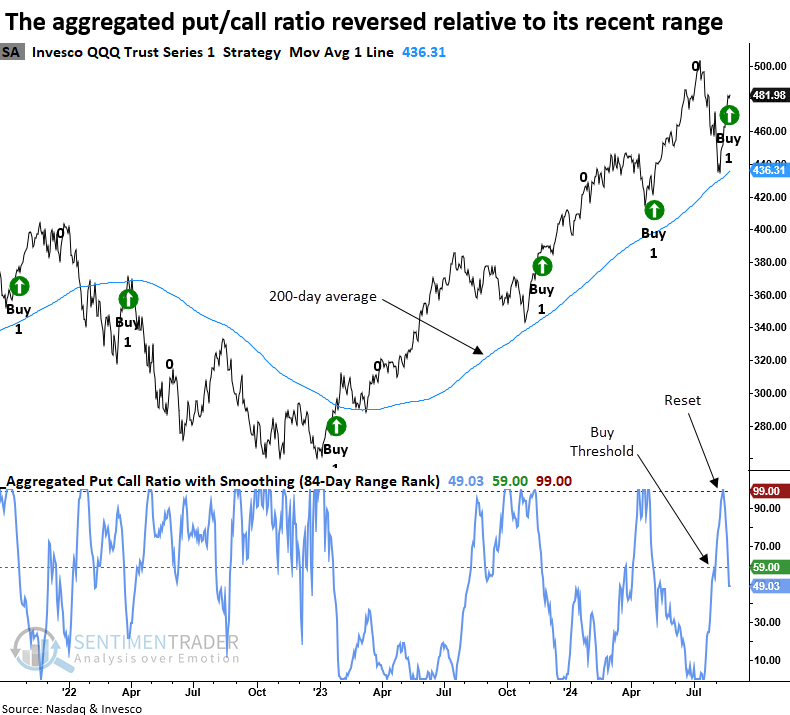
Similar reversals in the aggregated put/call ratio preceded positive returns
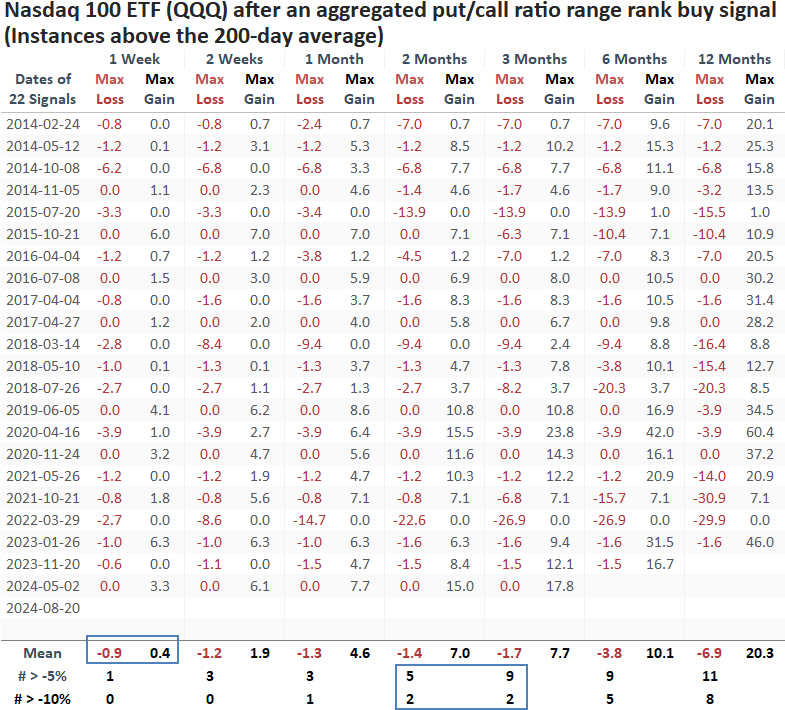
The Nasdaq 100 ETF (QQQ) displayed solid returns and consistency over medium and long-term horizons following similar range rank reversals. Although the one-month horizon is the only timeframe to demonstrate significance compared to random returns, several intervals were close.
The sample size is small due to the relatively new nature of the aggregated put/call ratio data.
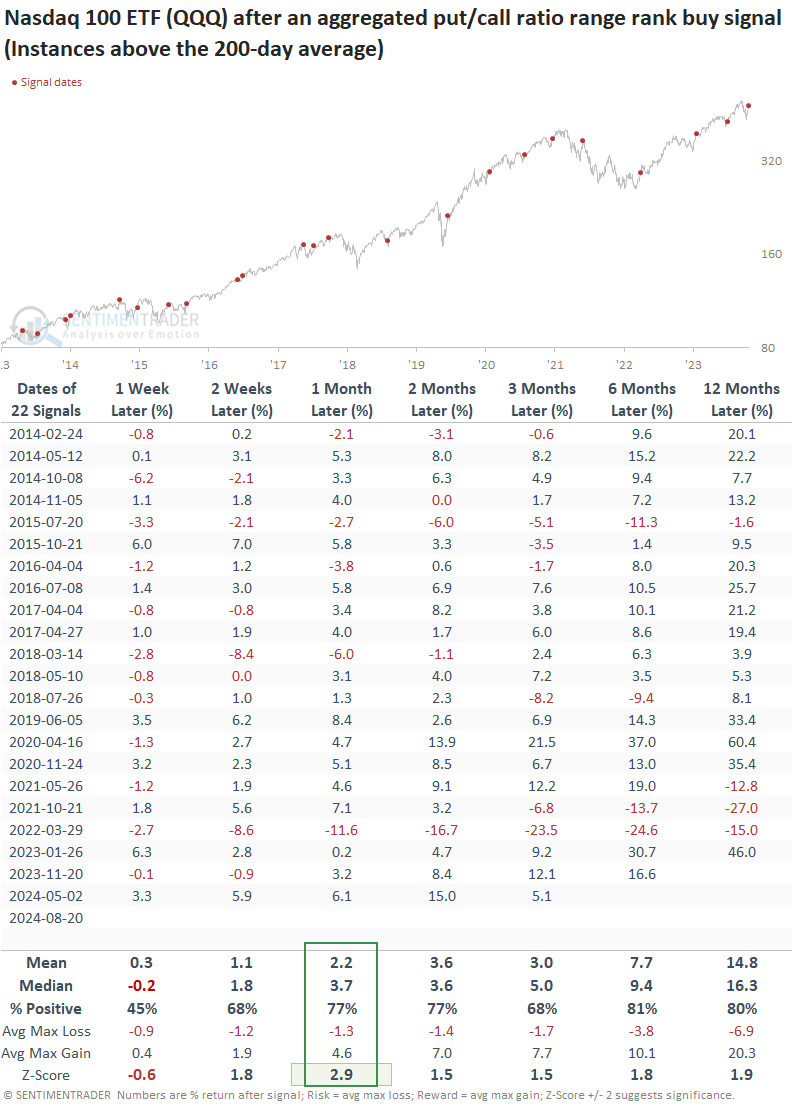
The initial week showed risk outweighing reward, as the average maximum loss exceeded the maximum gain. Consequently, some backing and filling could occur, particularly given the swift stock advance since August 5th.
What the research tells us...
Over the past month, equity markets experienced a typical correction in a bull market. Sentiment indicators, such as the Volatility Index, Stock/Bond ratio, and put/call ratios, signaled heightened fear. As is usually the case, following a panic, traders reverse course, buying stocks once cooler heads prevail. This renewed interest triggered breadth thrusts and a downward shift in sentiment indicators. Notably, the CBOE total put/call ratio and the aggregated put/call ratio for the Nasdaq 100 generated buy signals when they reversed lower relative to their recent ranges. Similar precedents during a long-term uptrend led to outstanding returns and consistency for the S&P 500 and Nasdaq 100 across medium and long-term horizons.
Indicators at Extremes
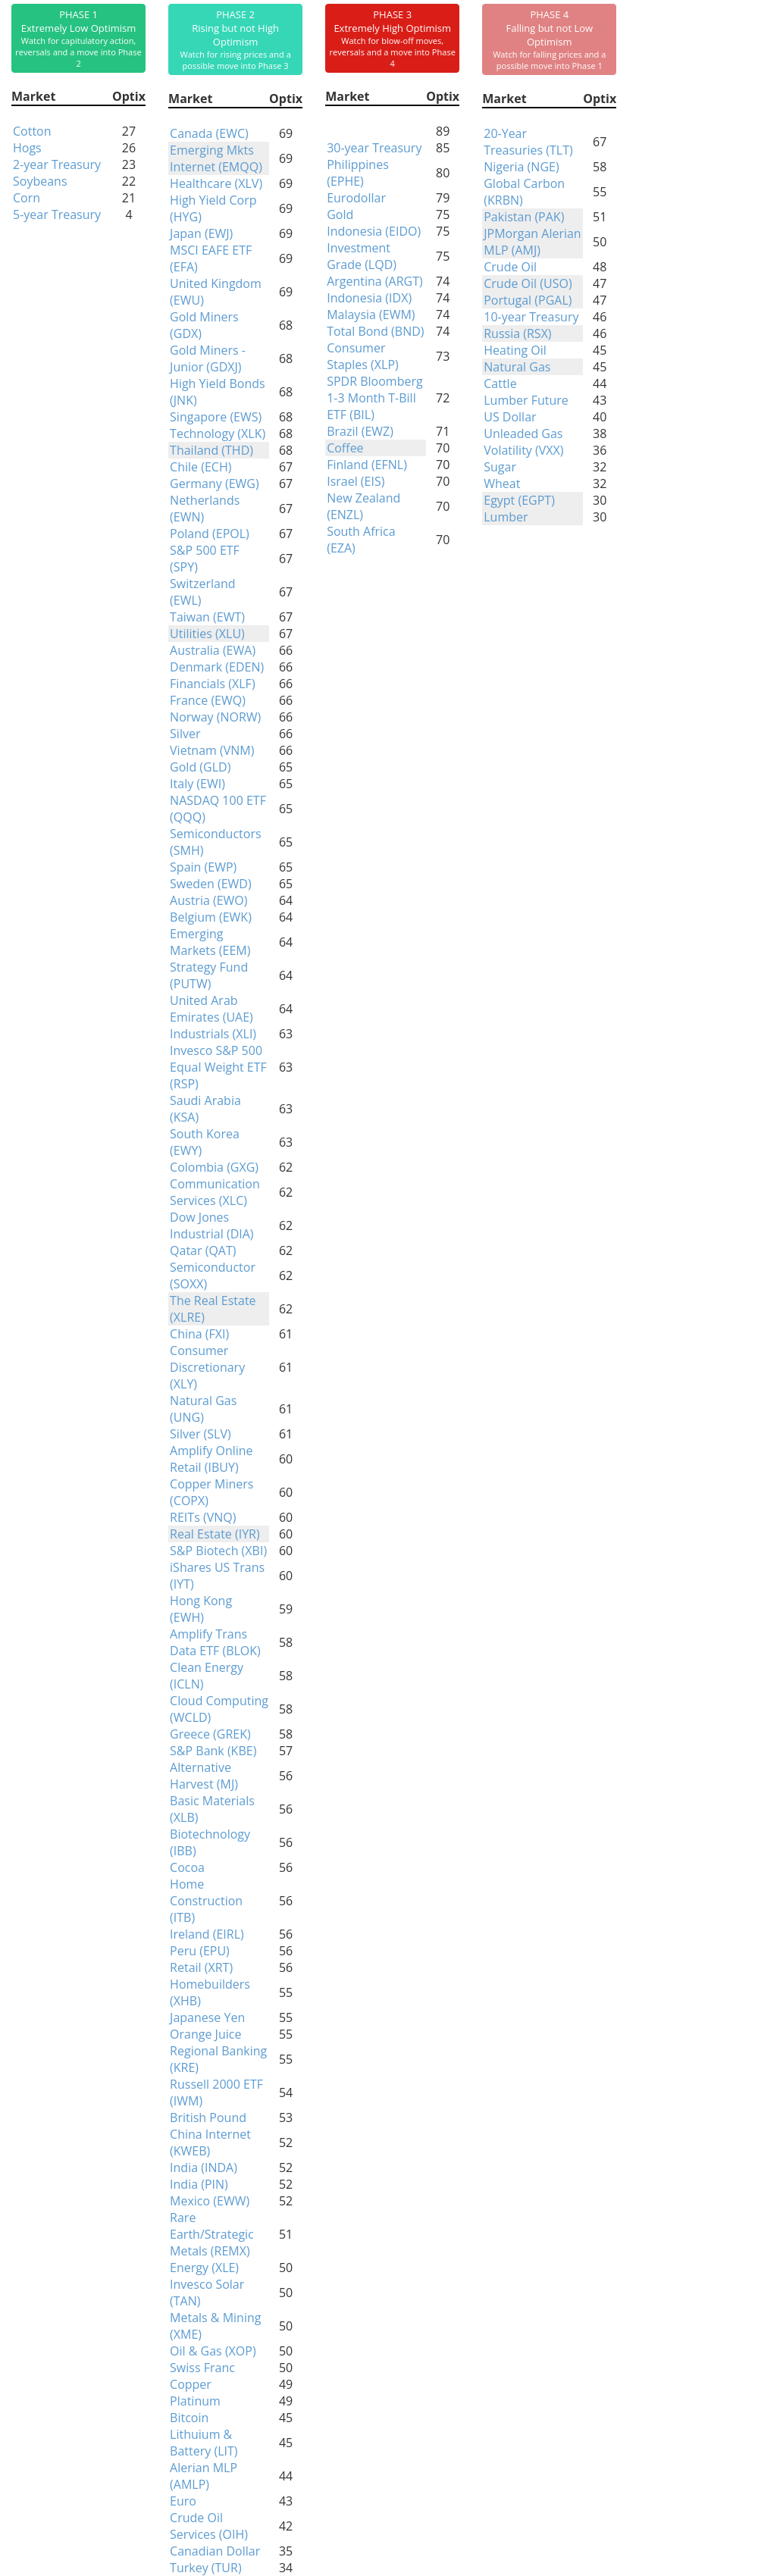
Phase Table
Ranks
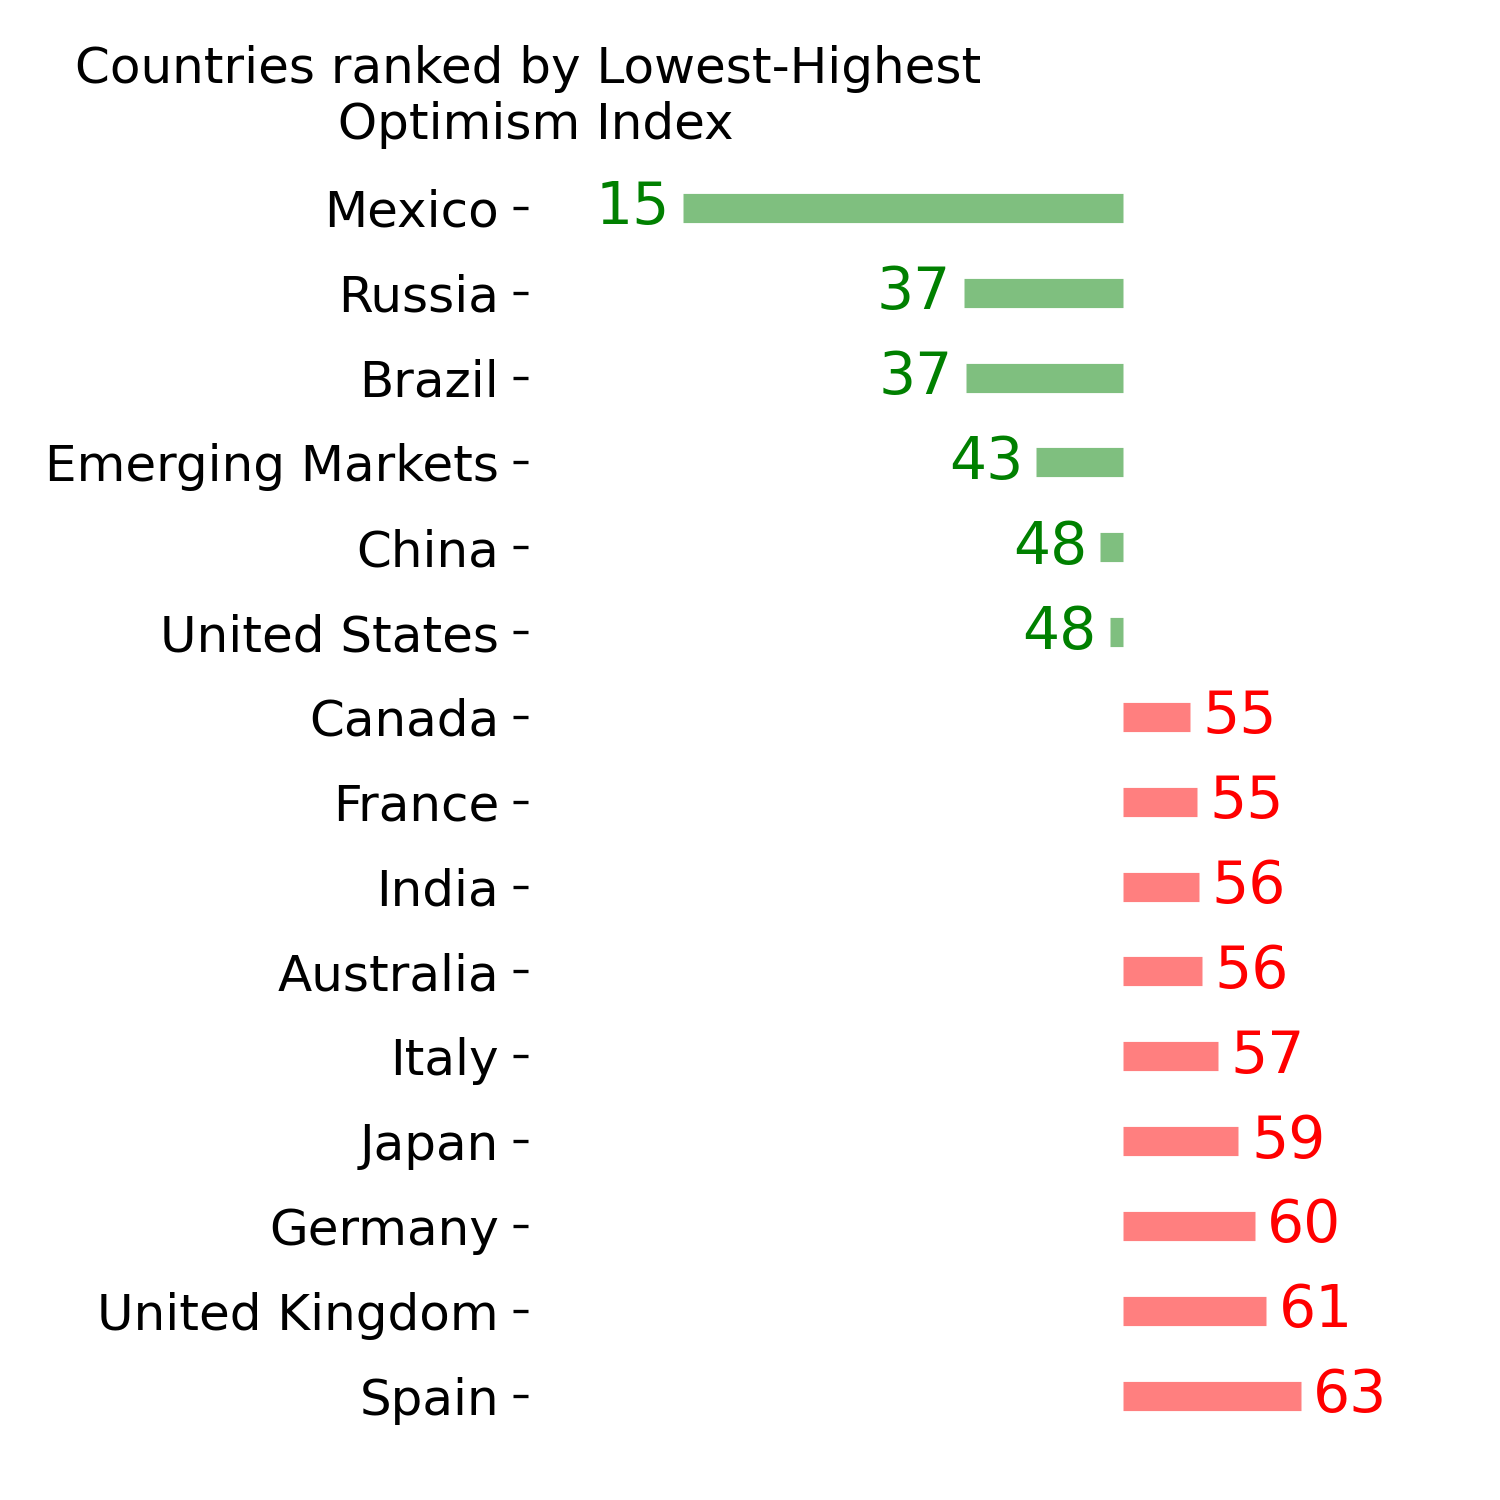
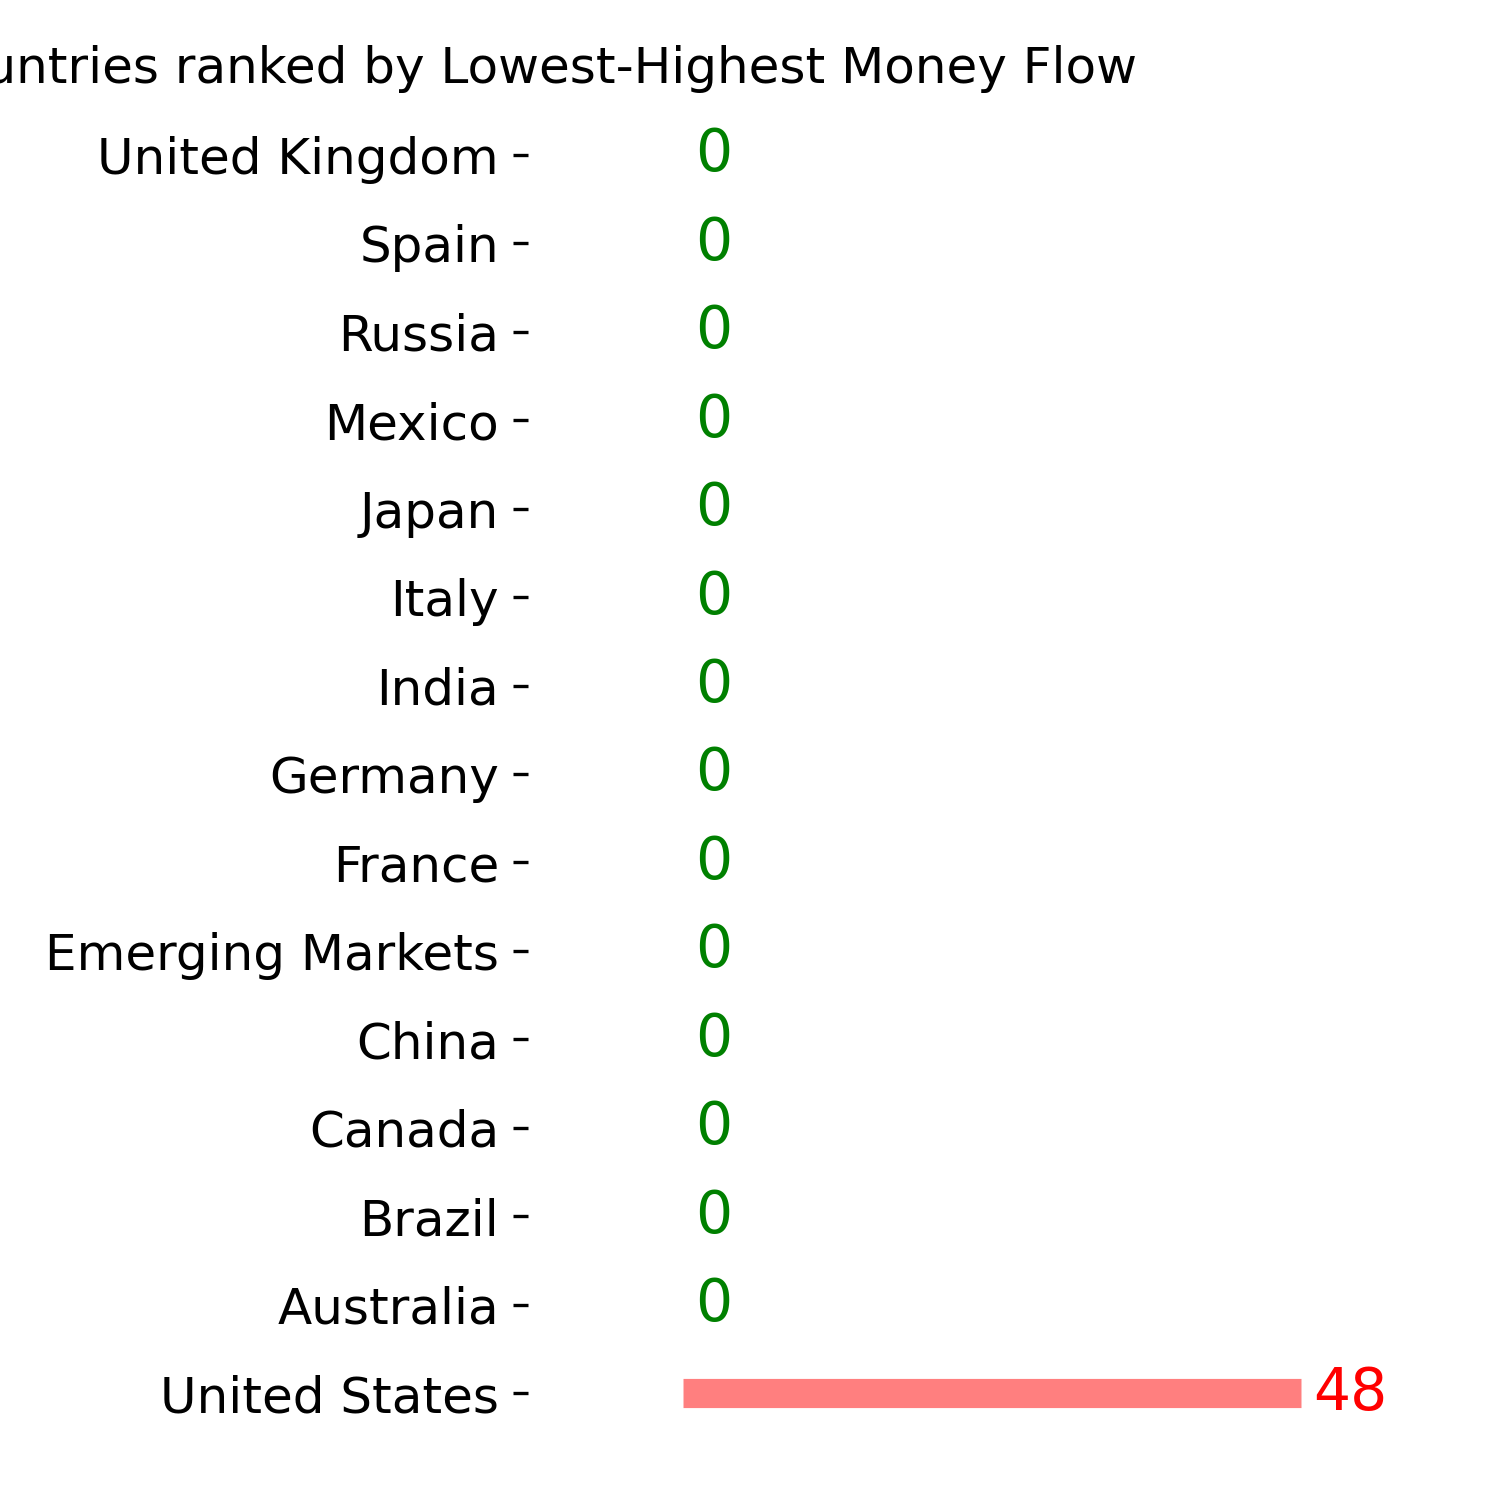
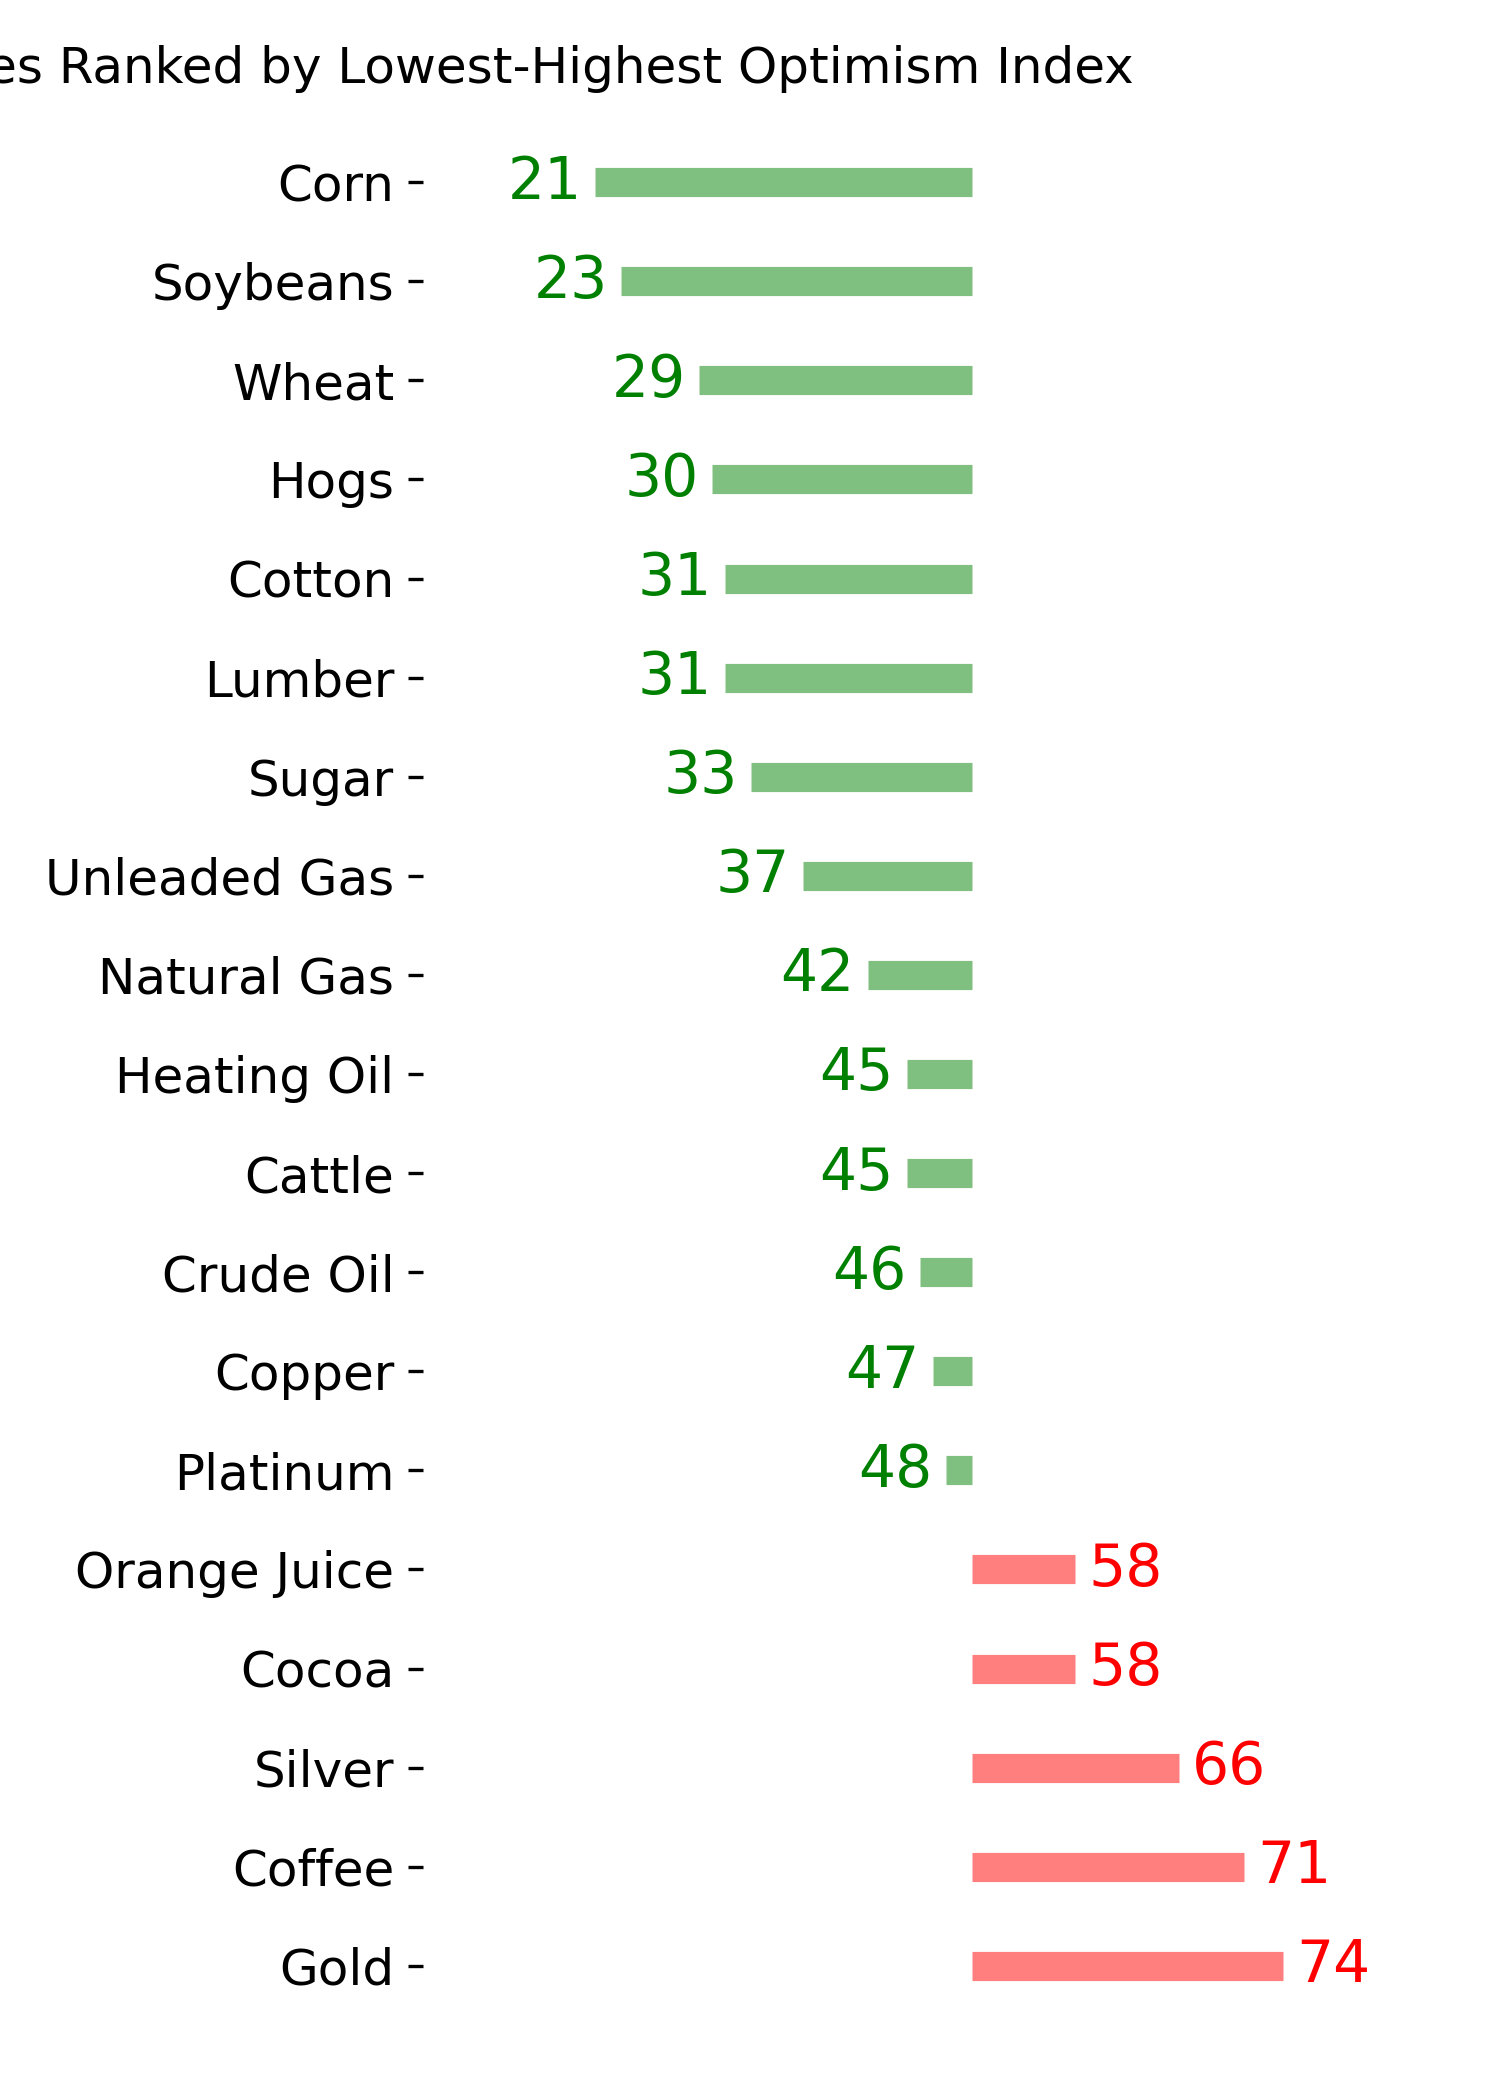
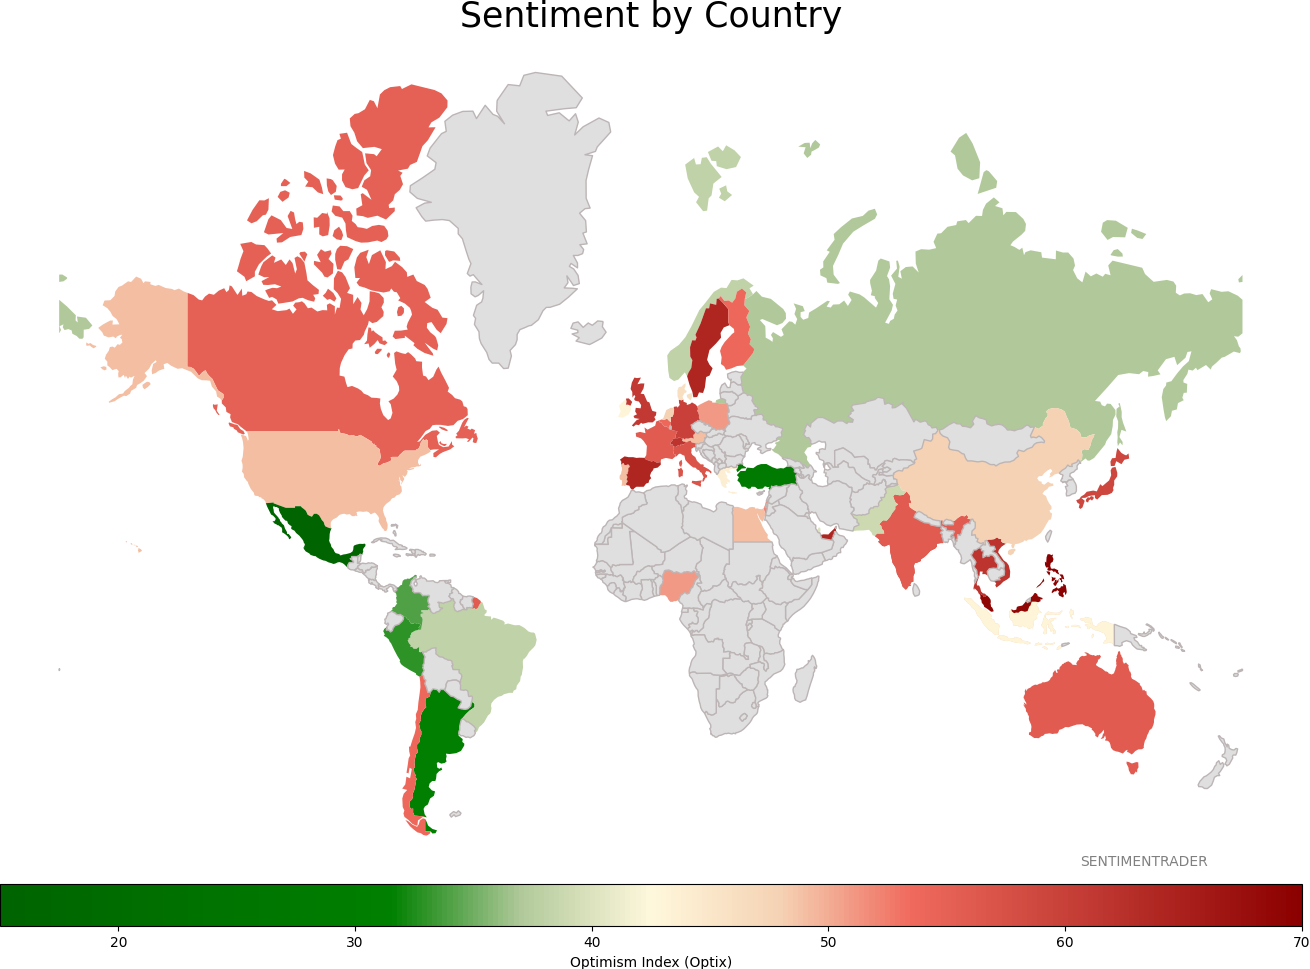
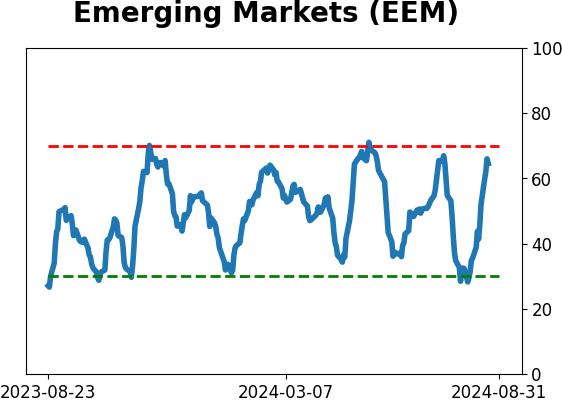
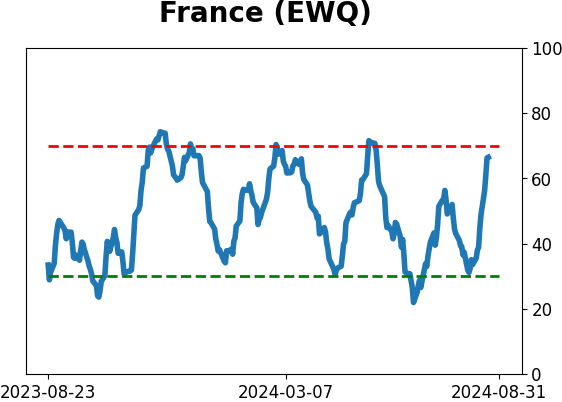
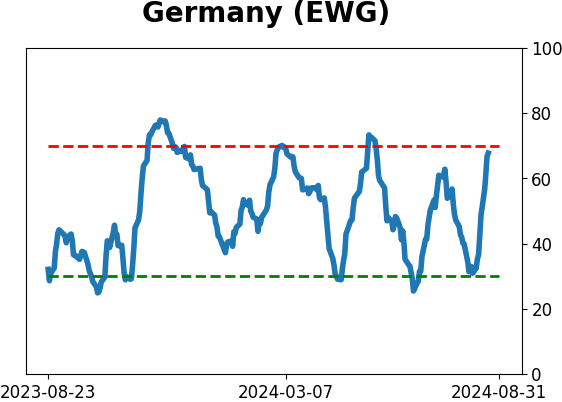
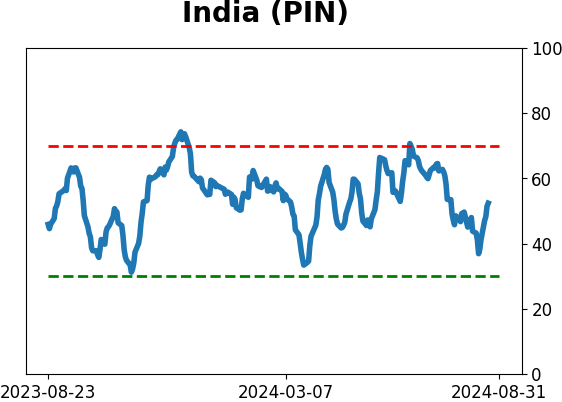
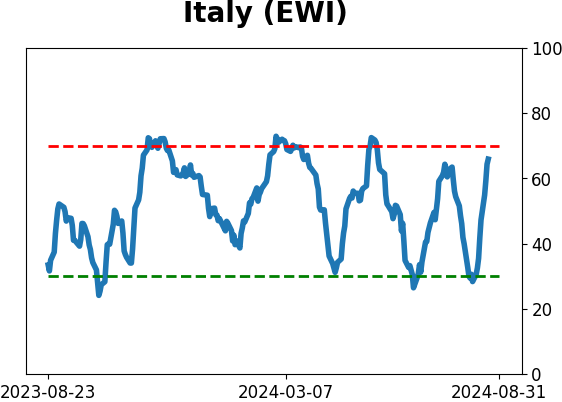
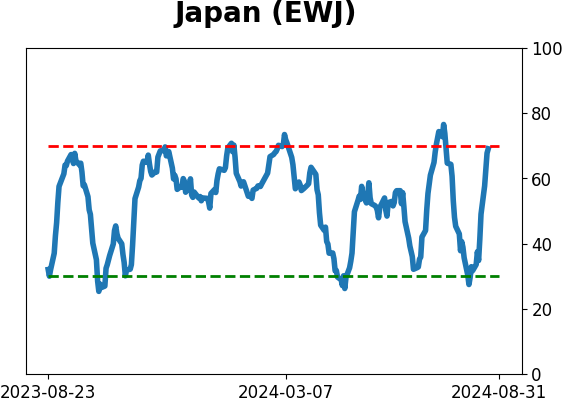
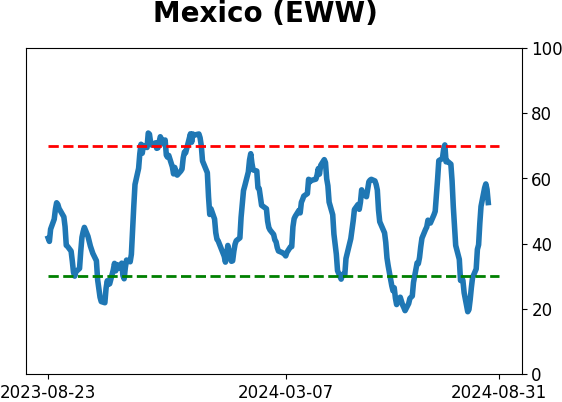
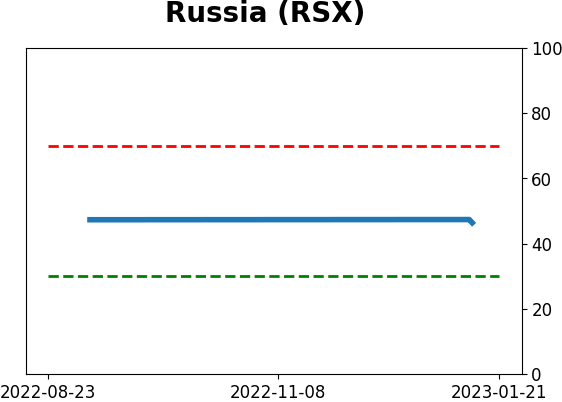
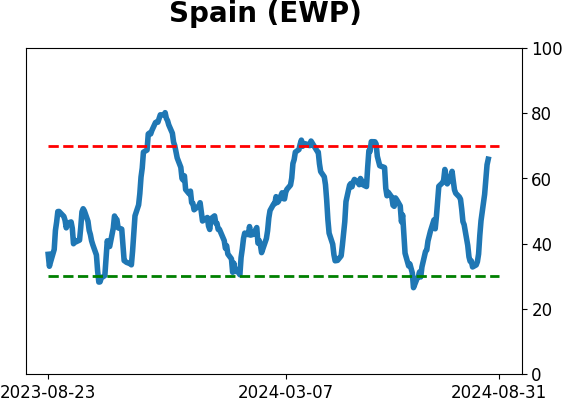
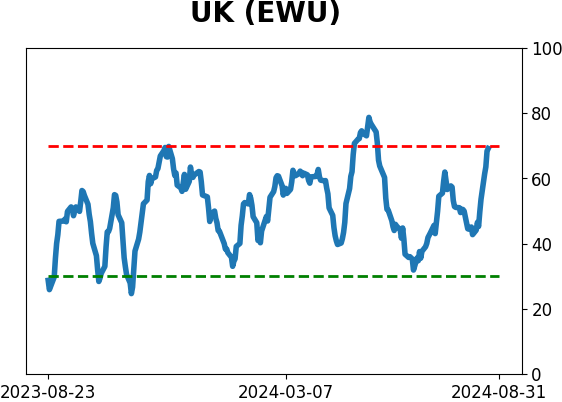
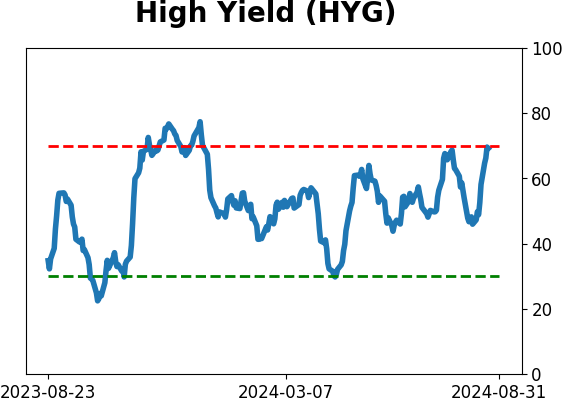
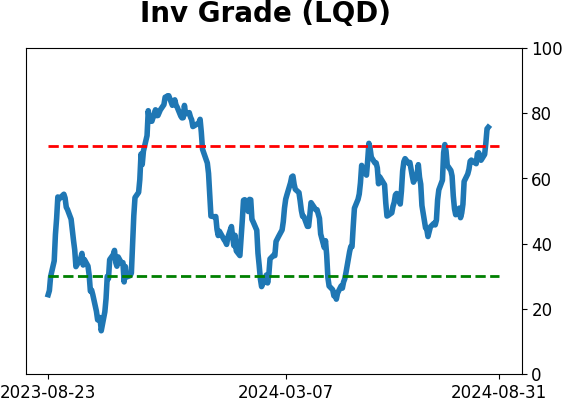
Sentiment Around The World
Optimism Index Thumbnails
|
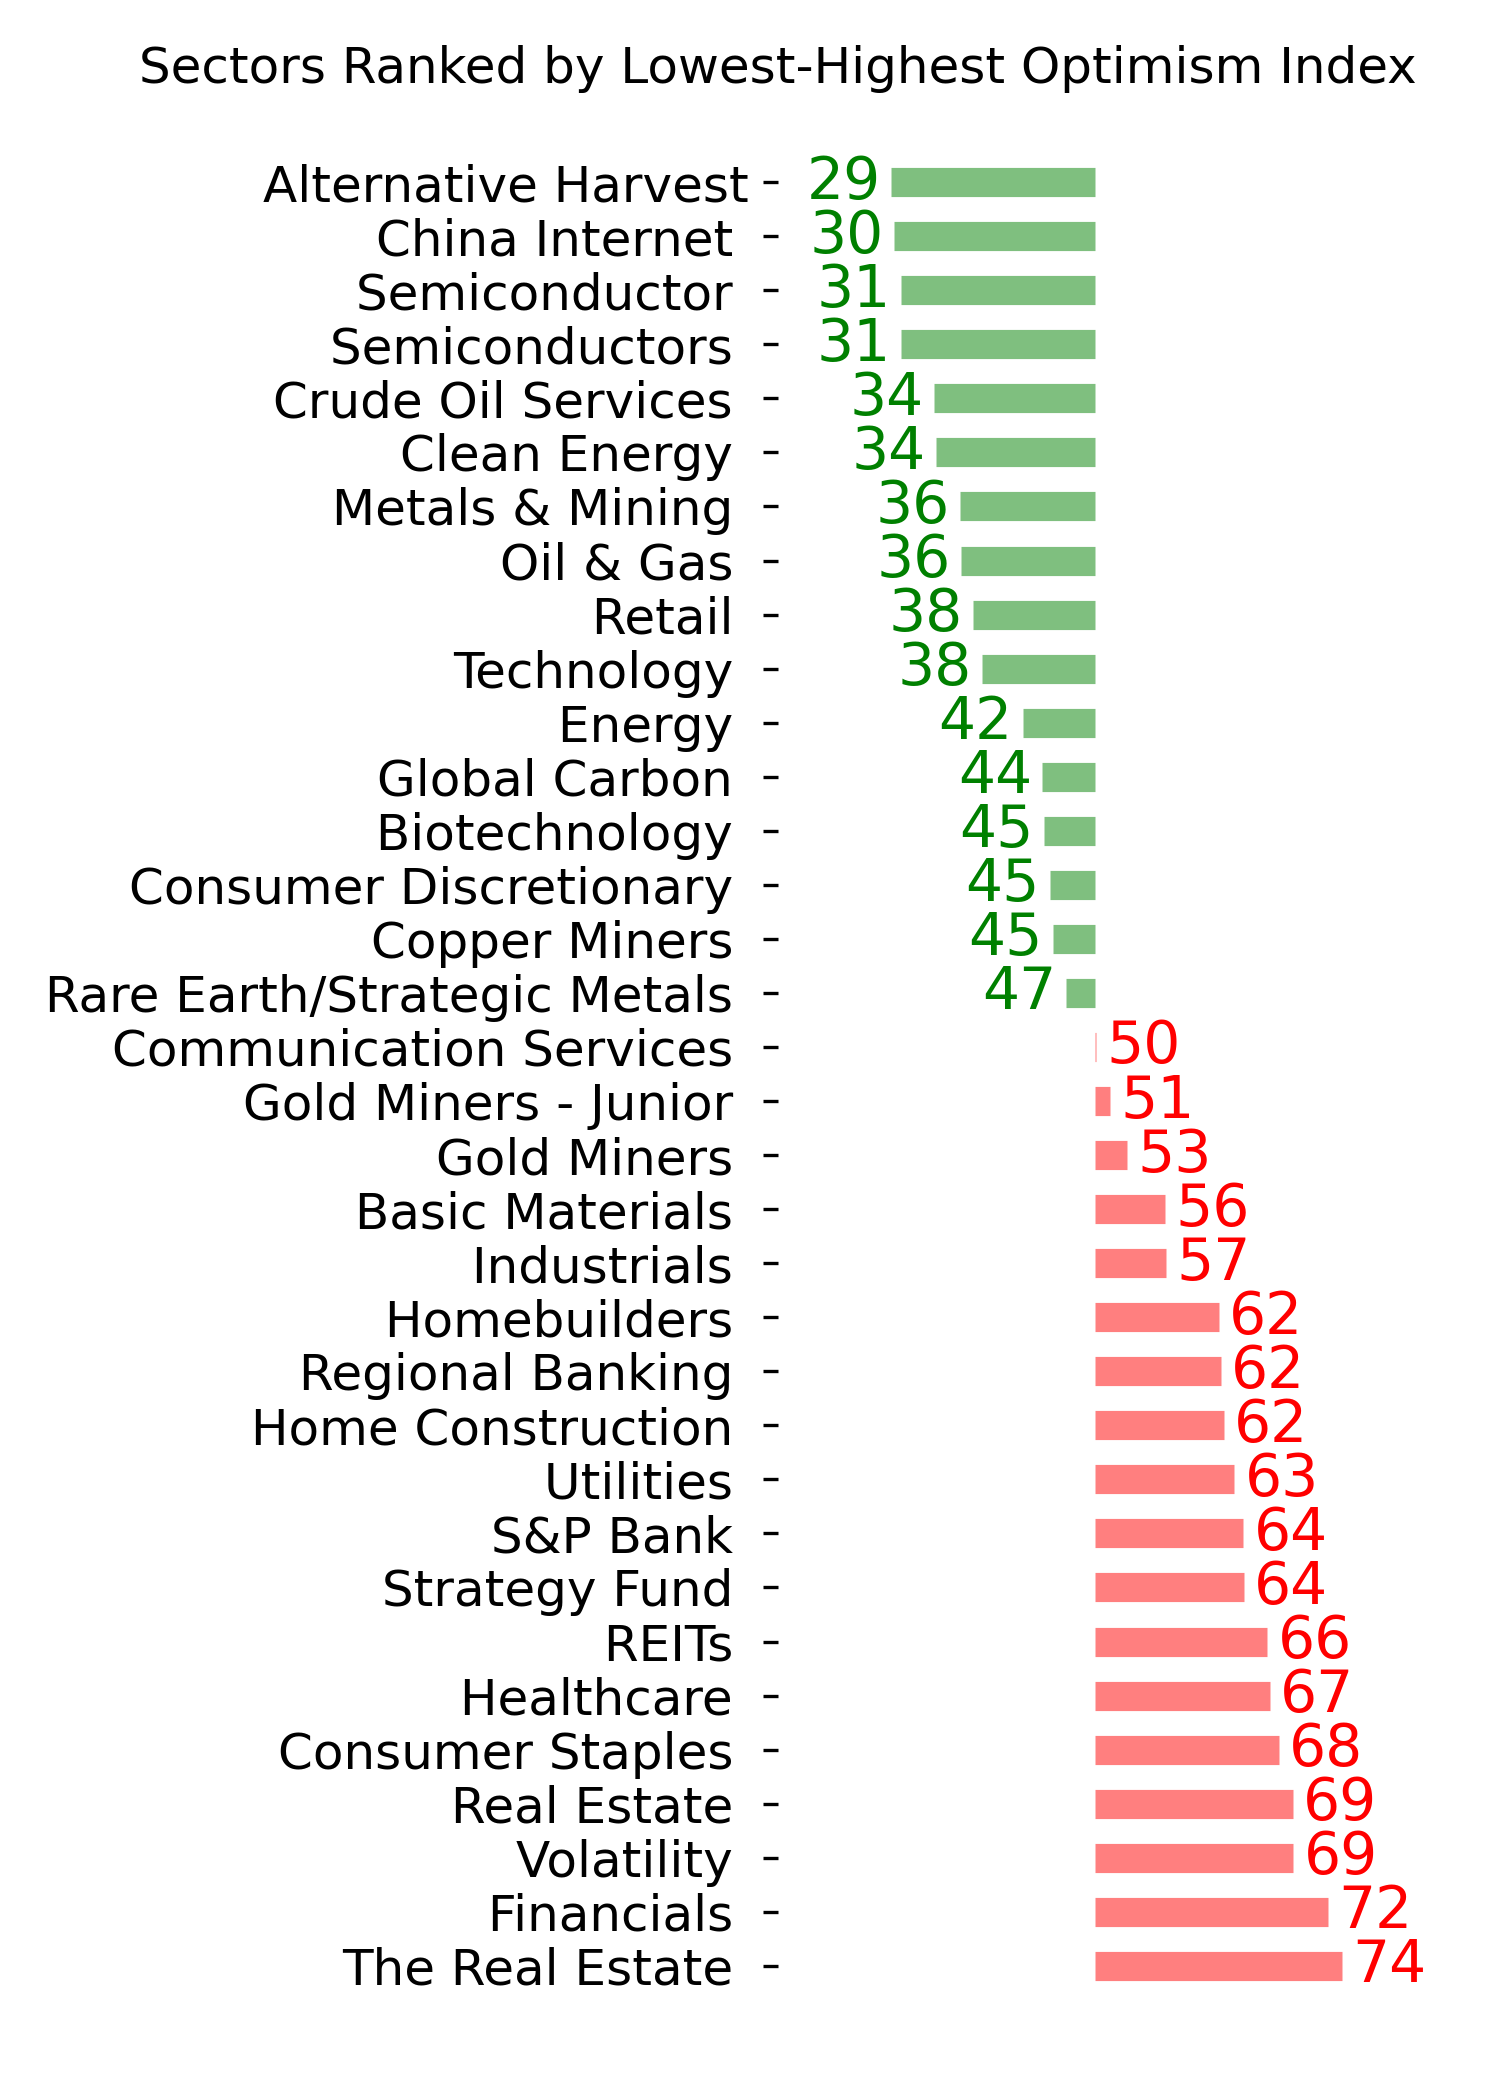
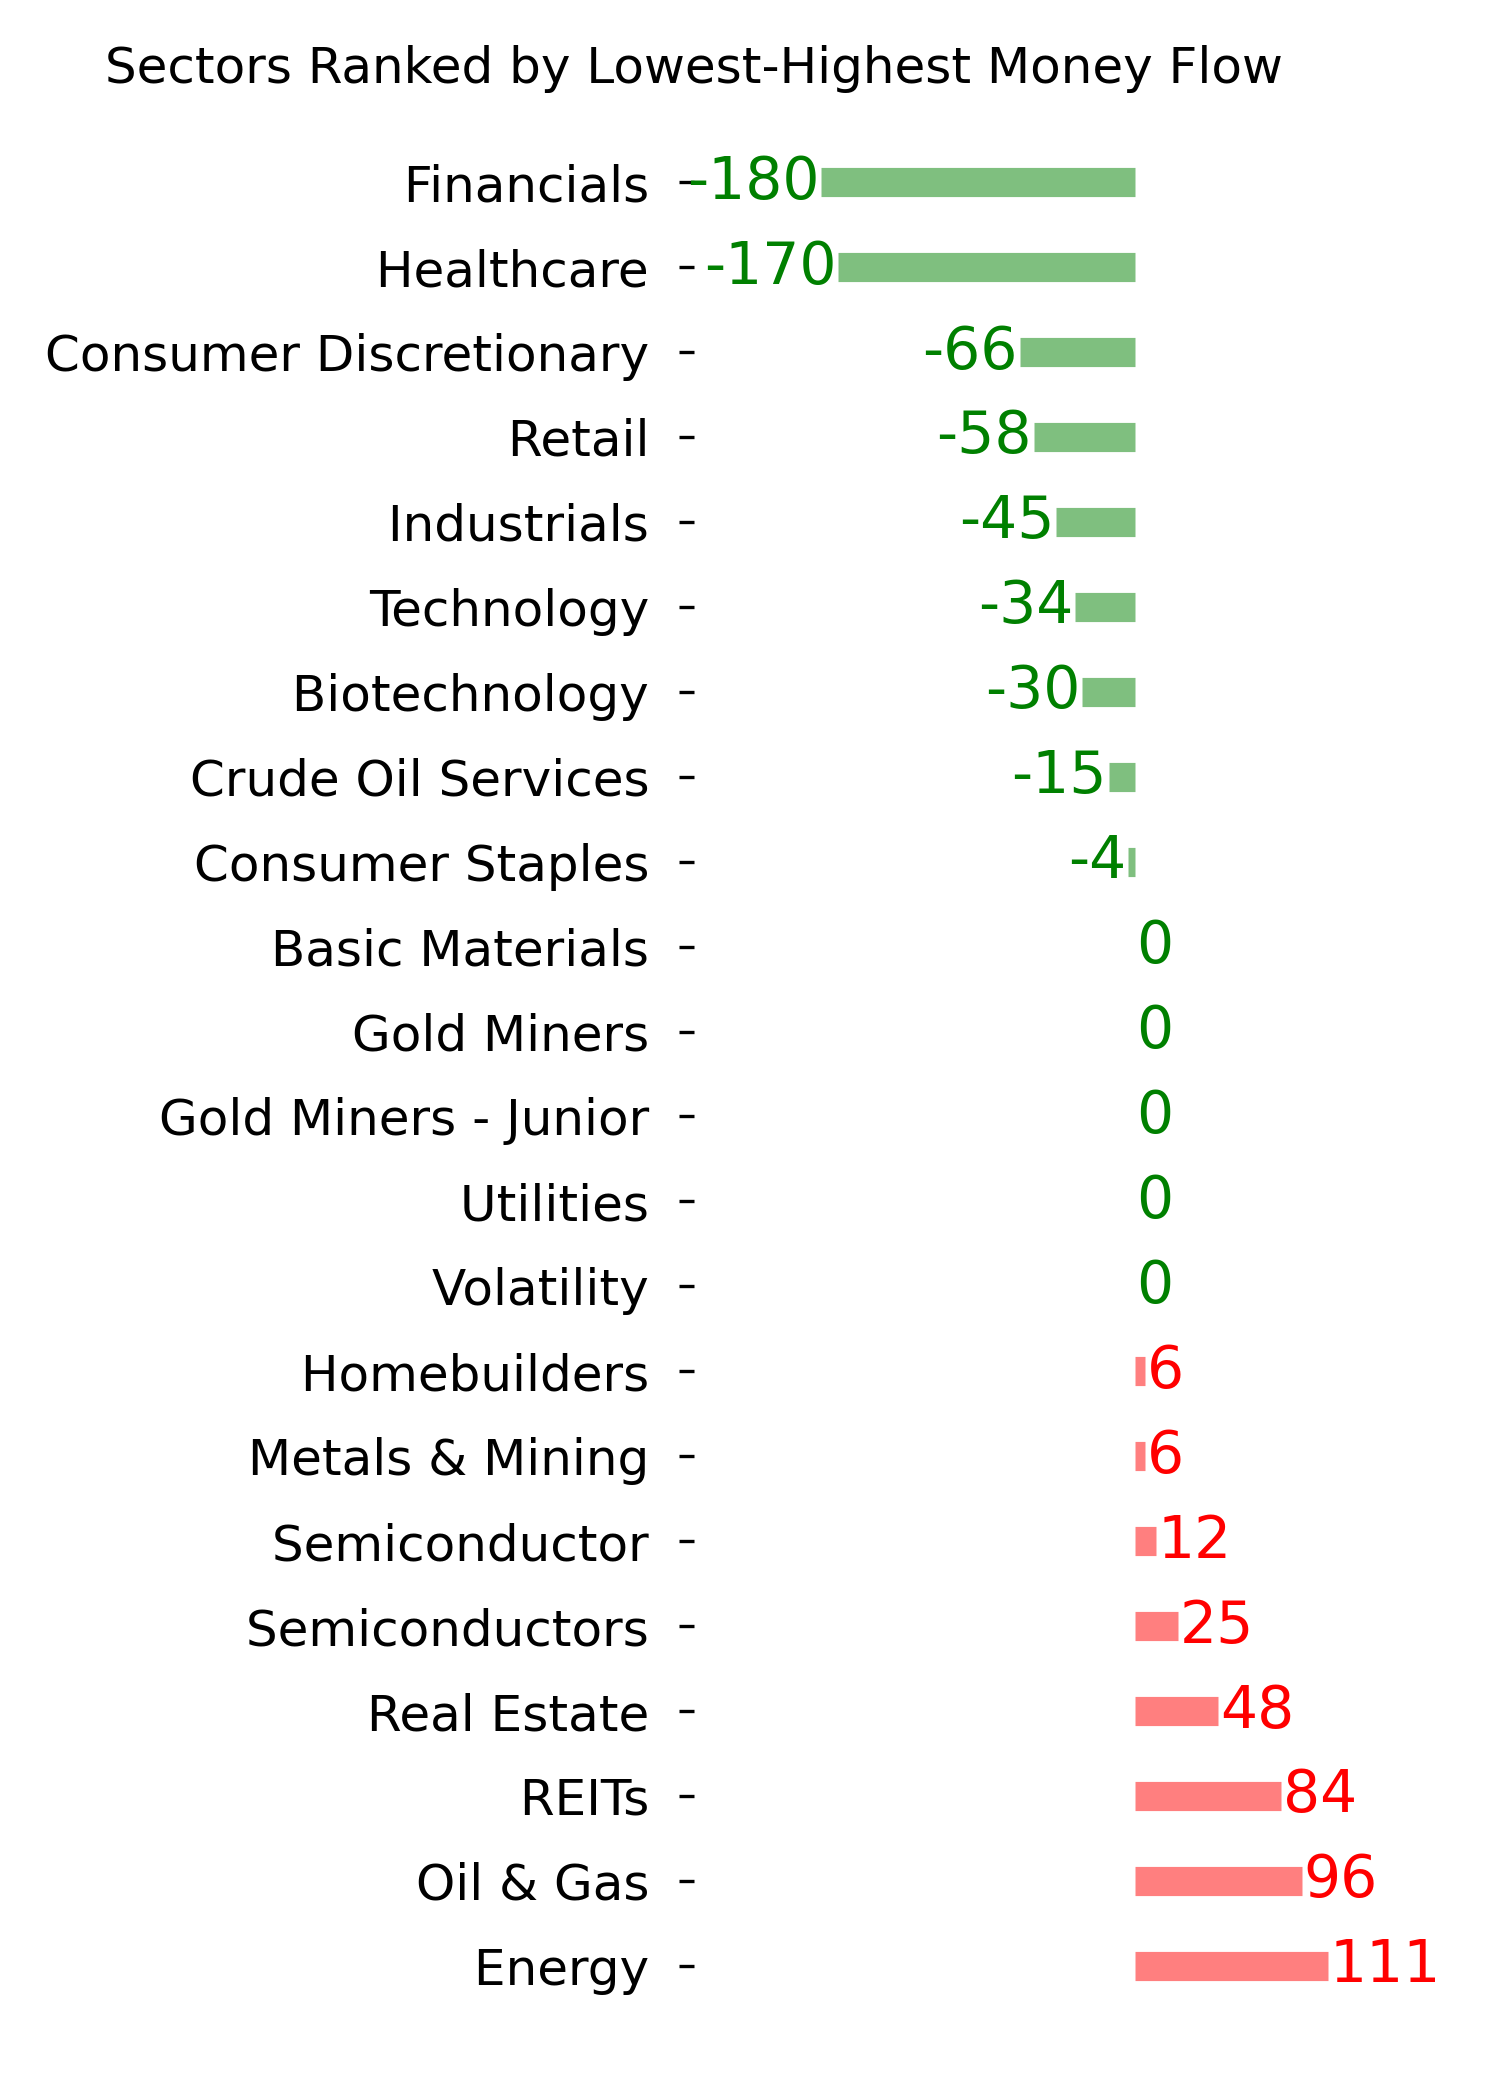
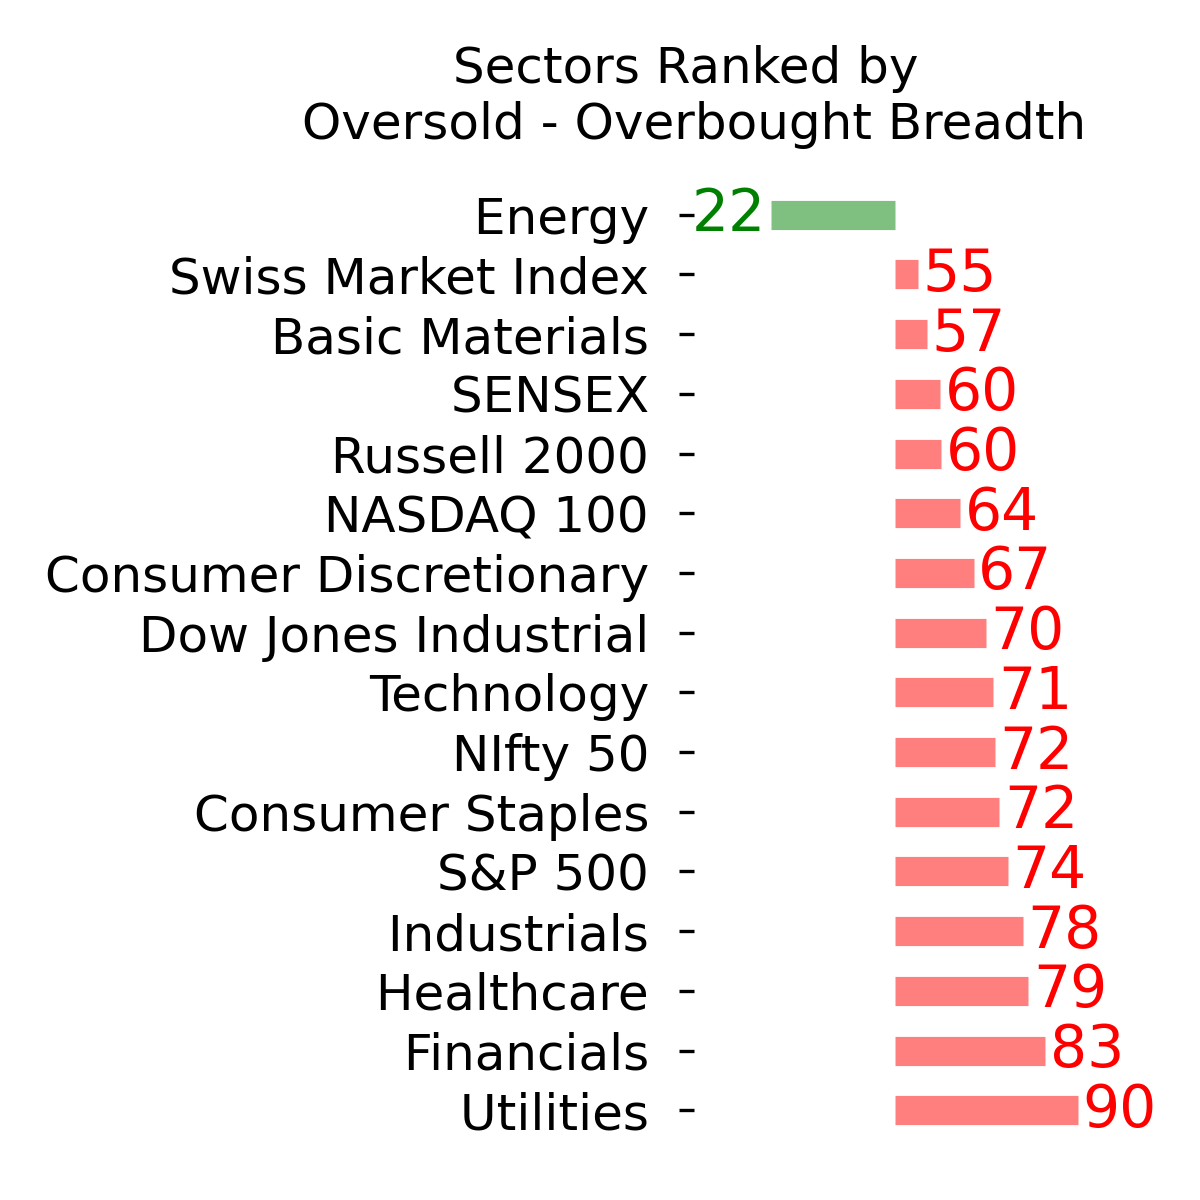
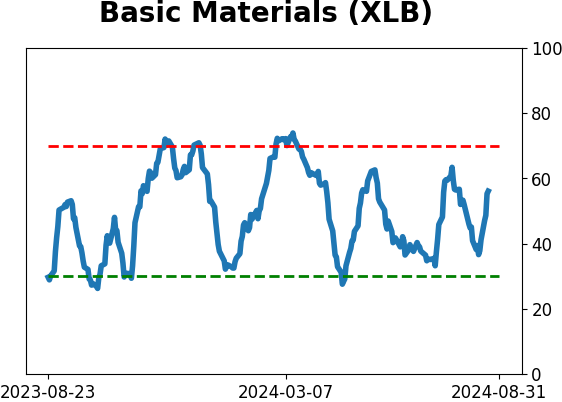
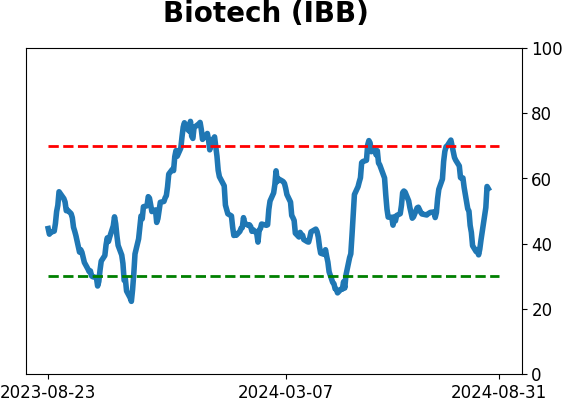
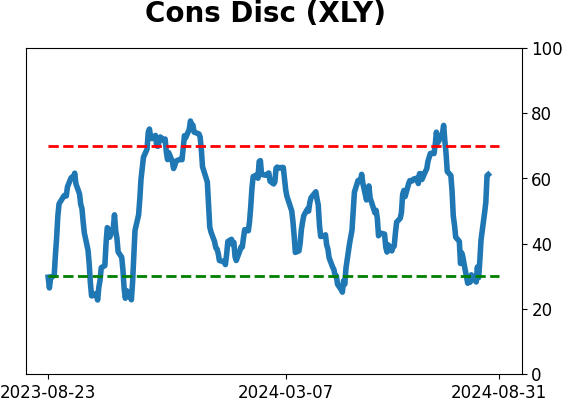
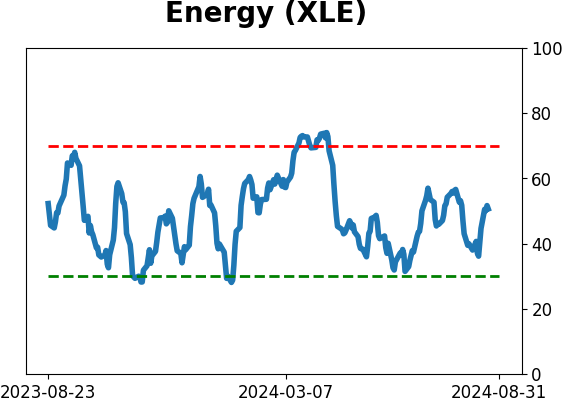
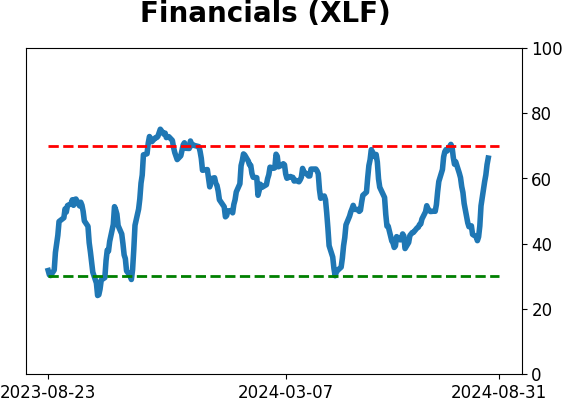
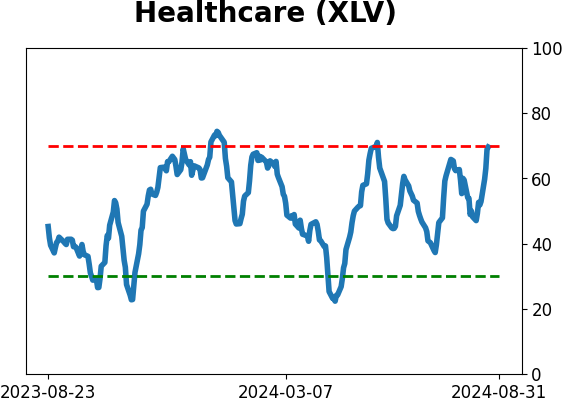
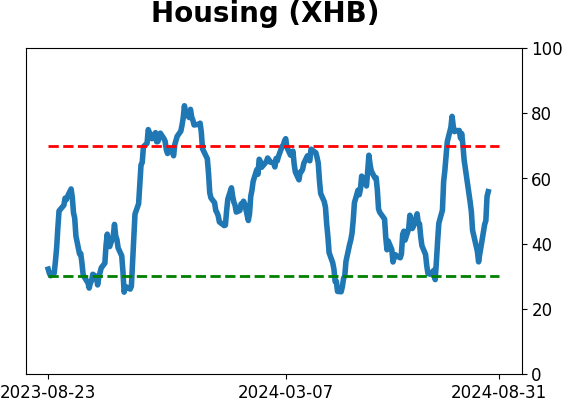
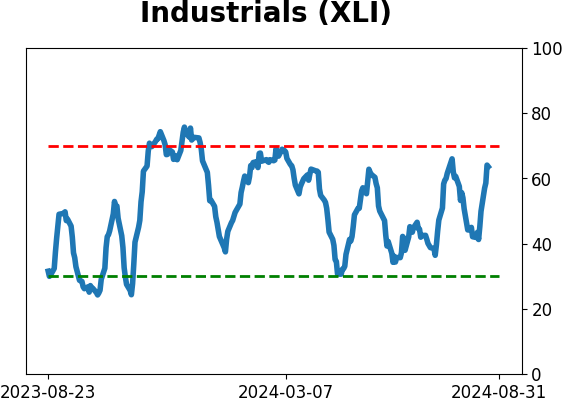
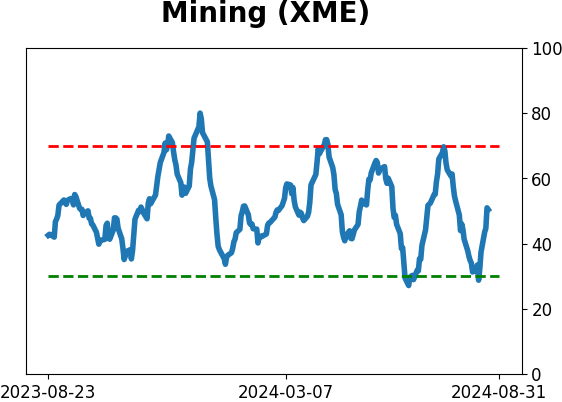
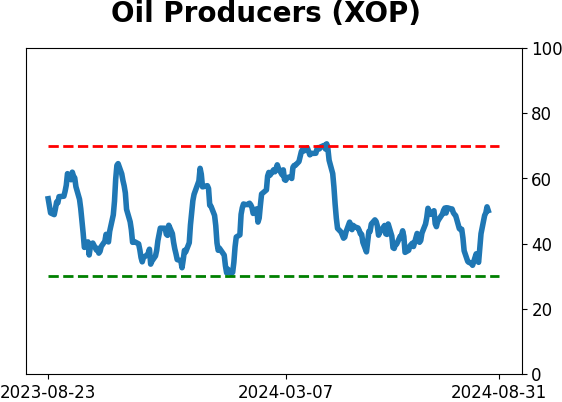
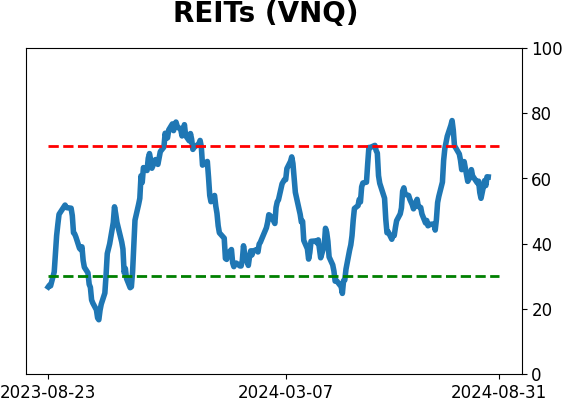
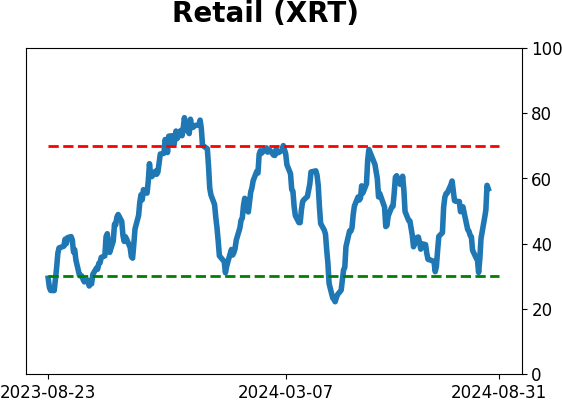
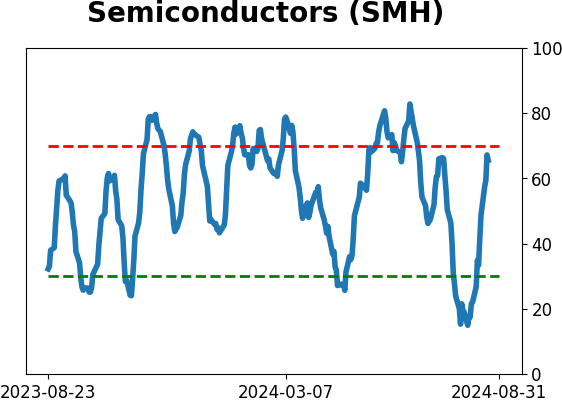
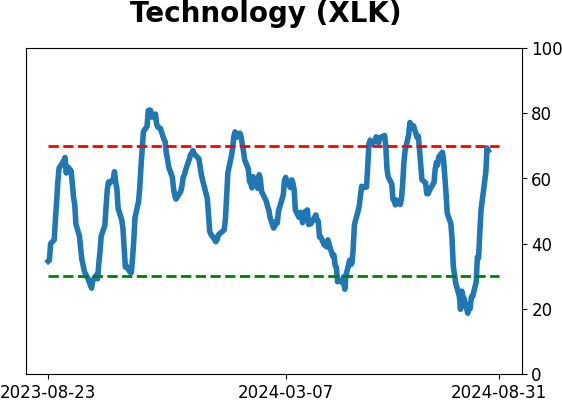
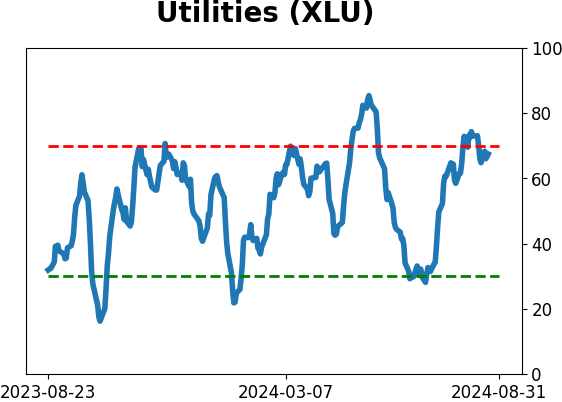
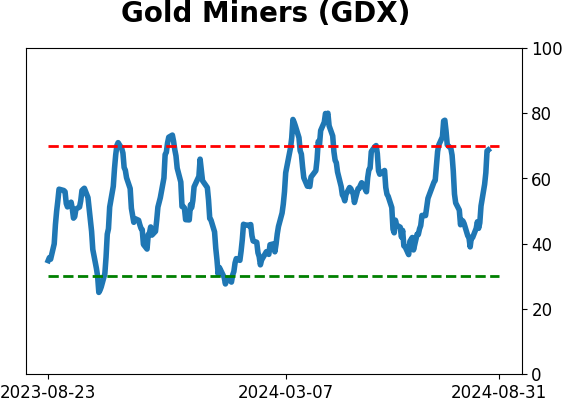
Sector ETF's - 10-Day Moving Average
|
|
|
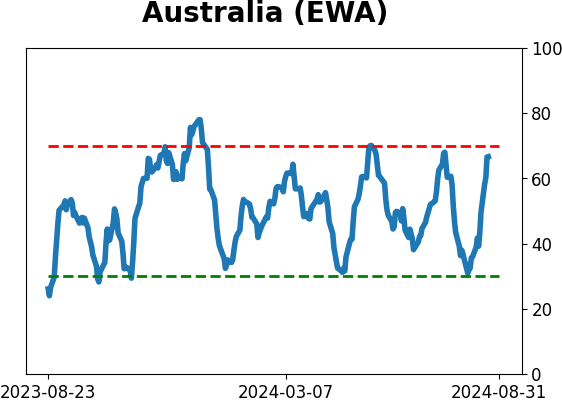
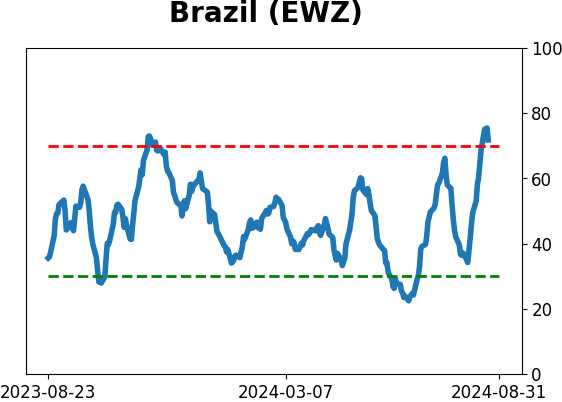
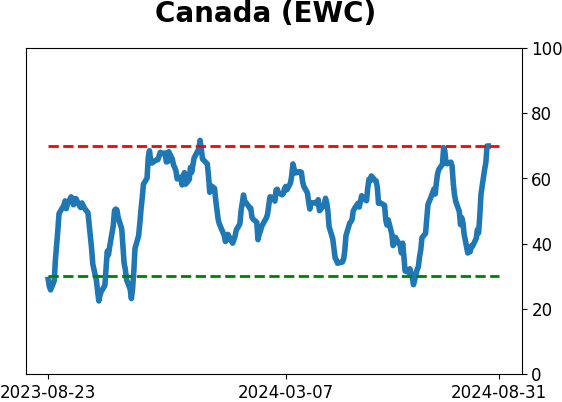
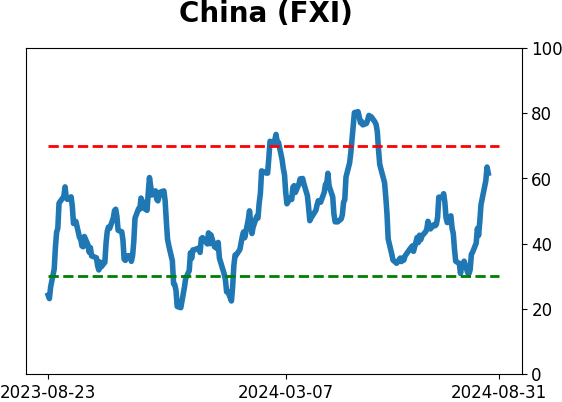
Country ETF's - 10-Day Moving Average
|
|
|
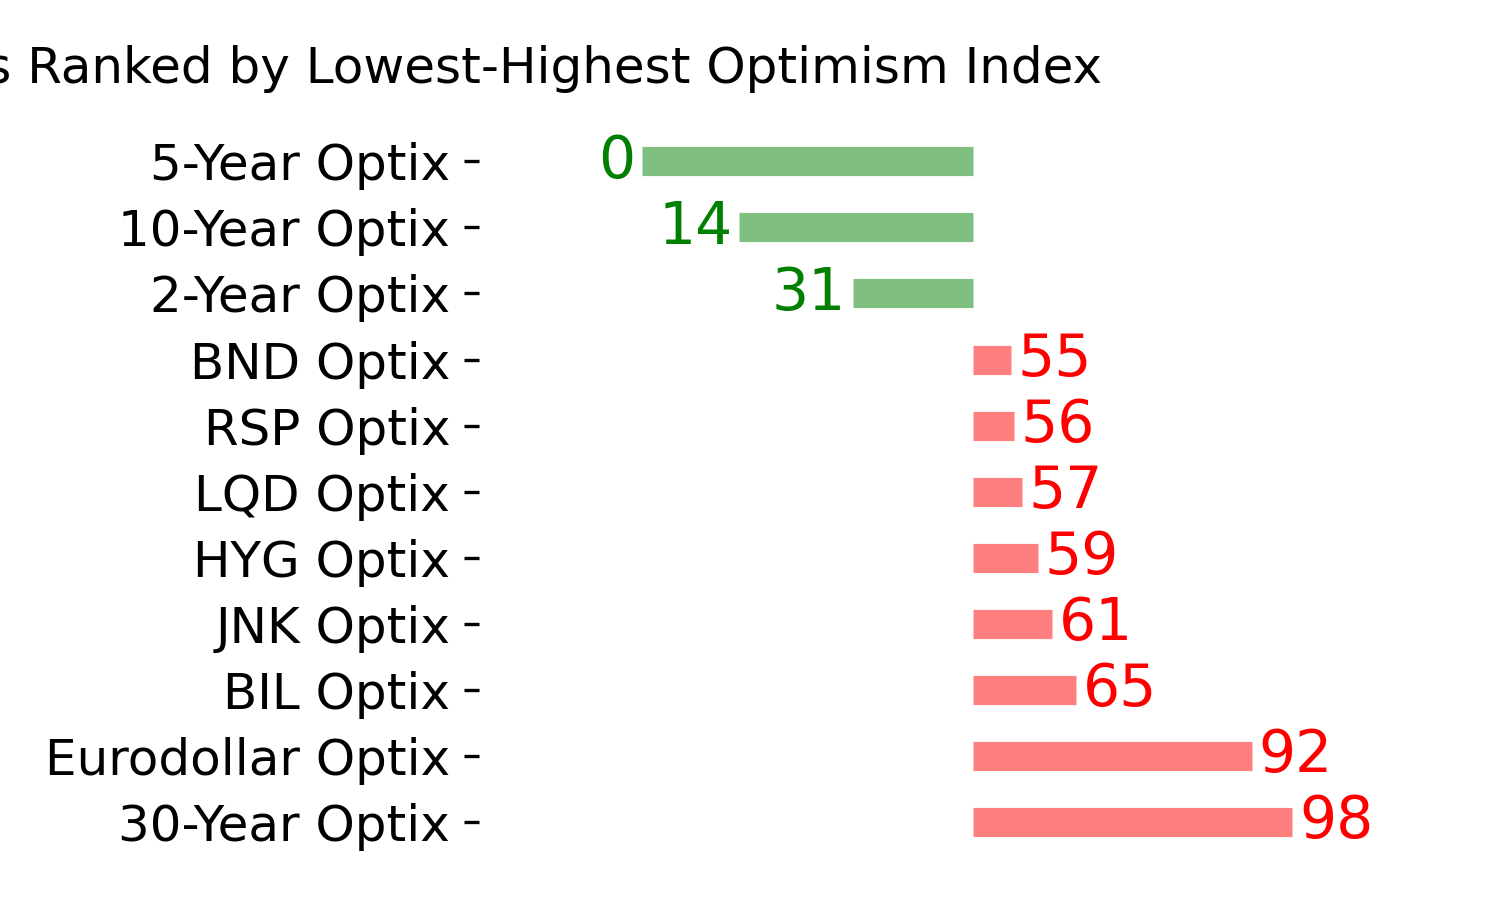
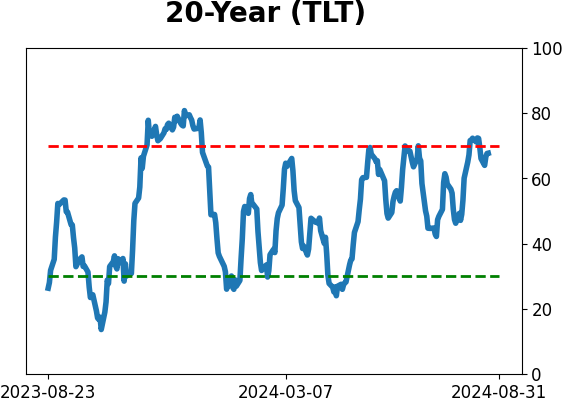
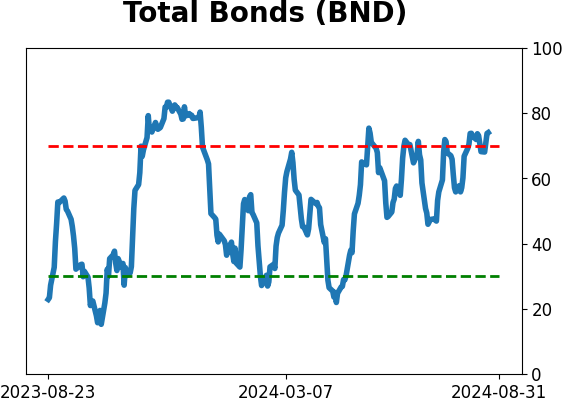
Bond ETF's - 10-Day Moving Average
|
|
|
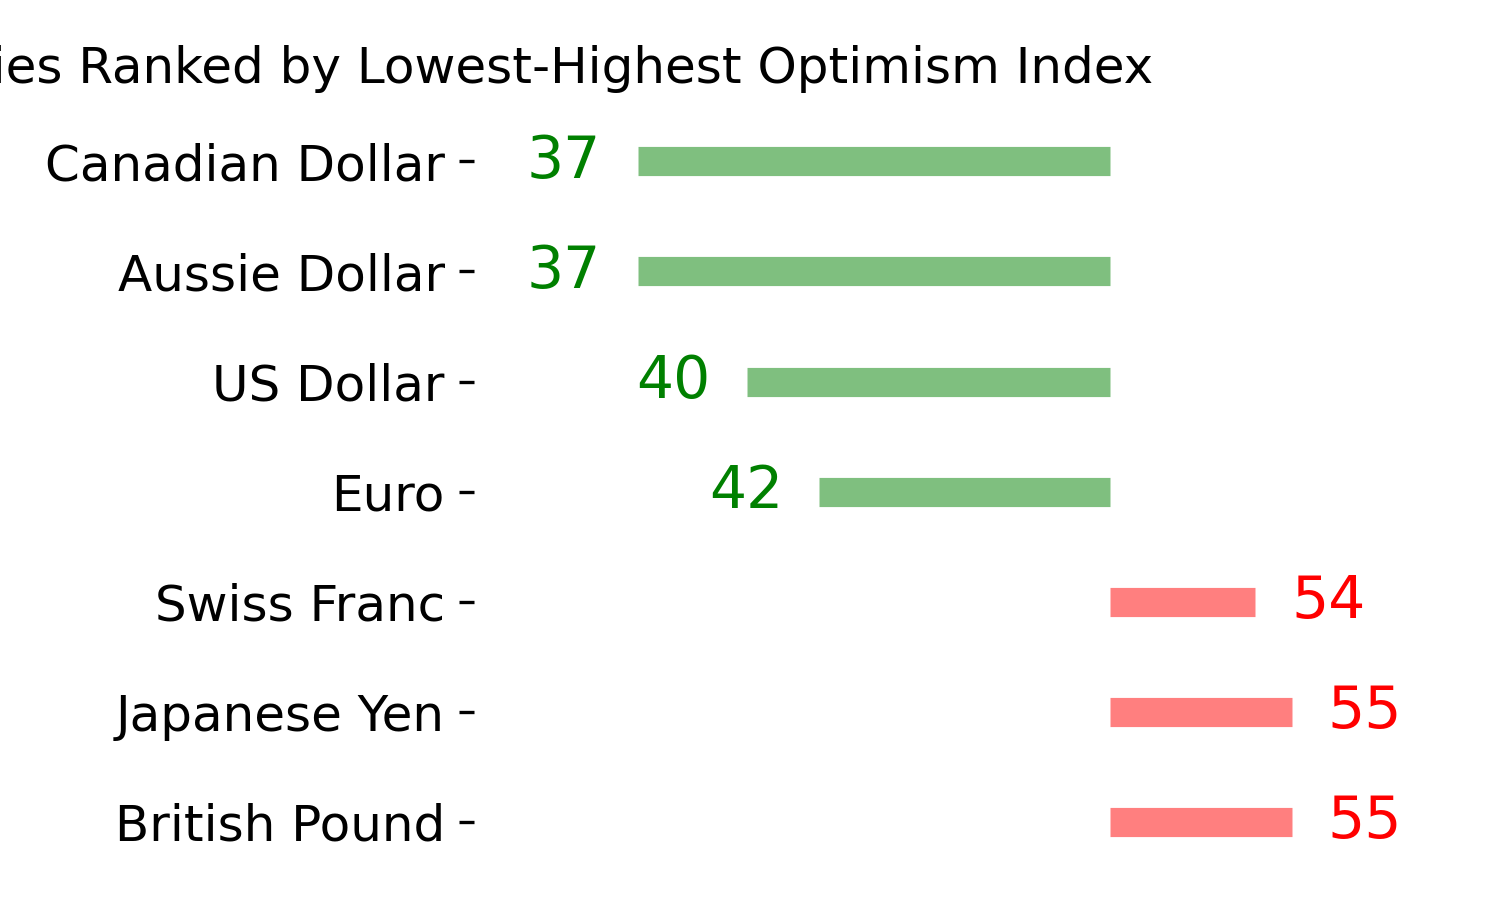
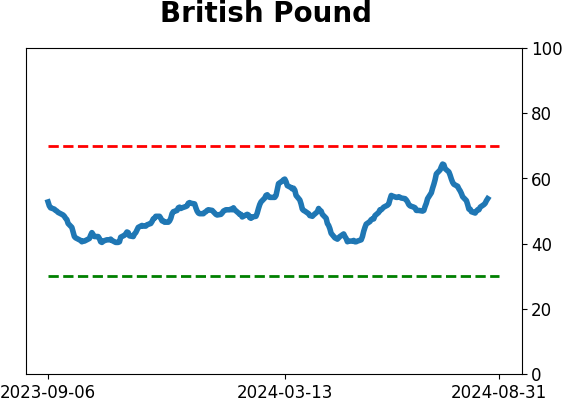
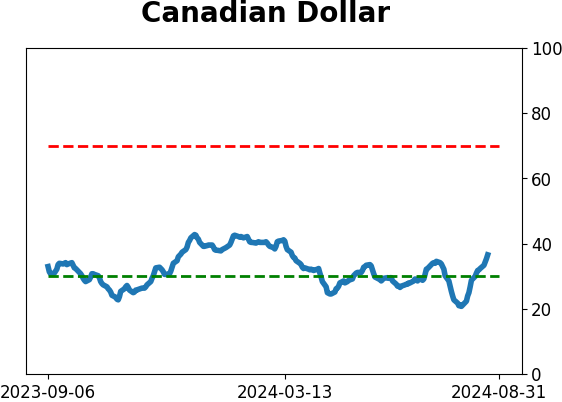
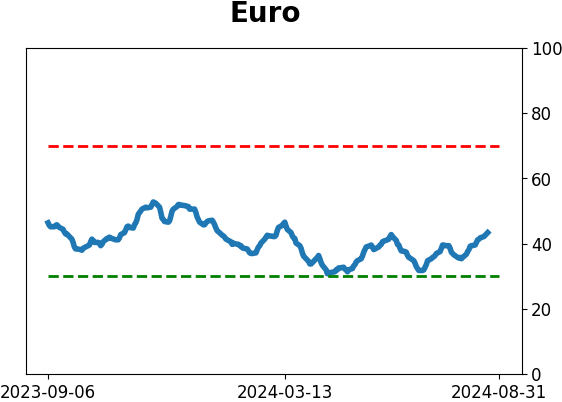
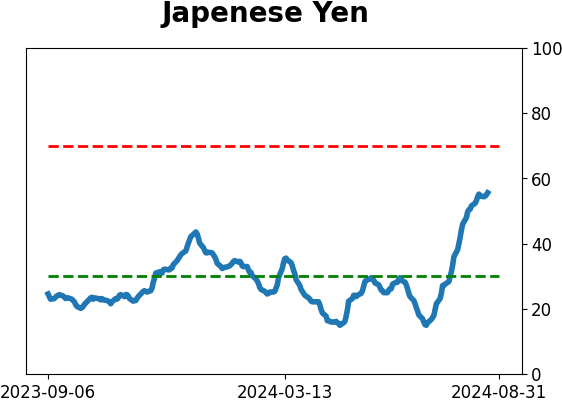
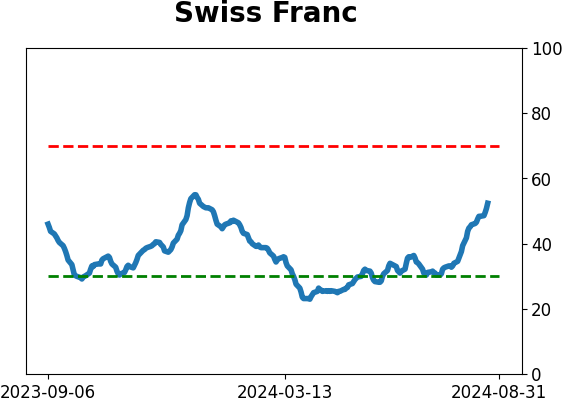
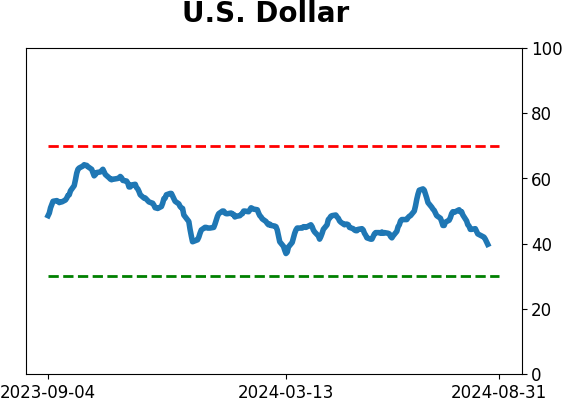
Currency ETF's - 5-Day Moving Average
|
|
|
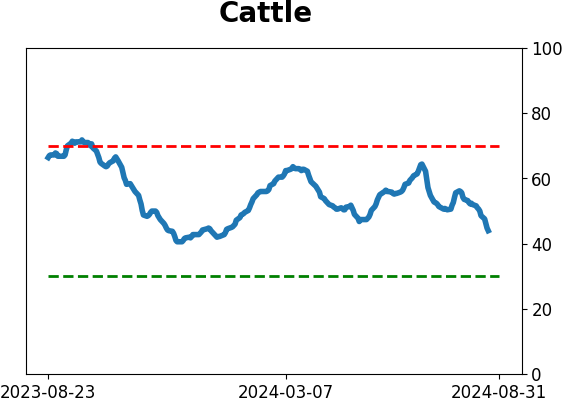
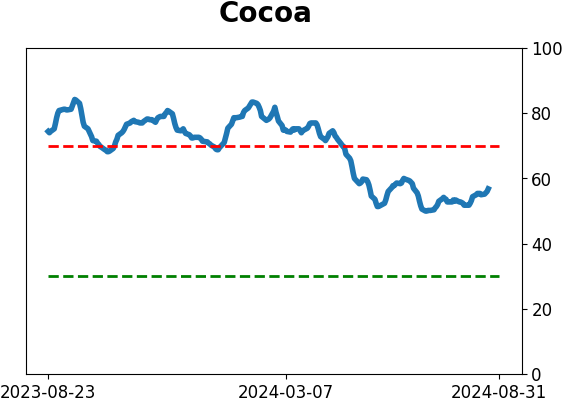
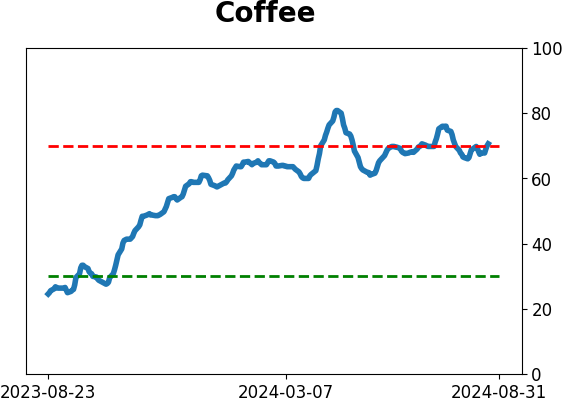
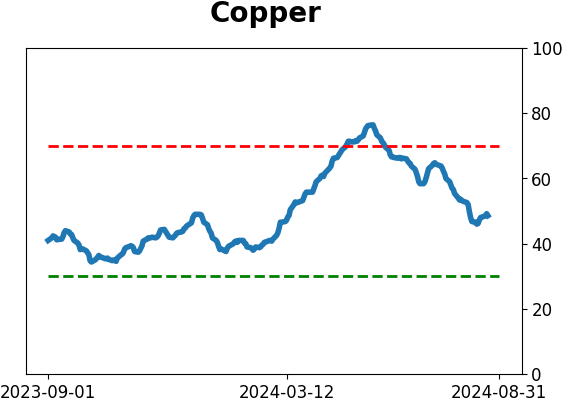
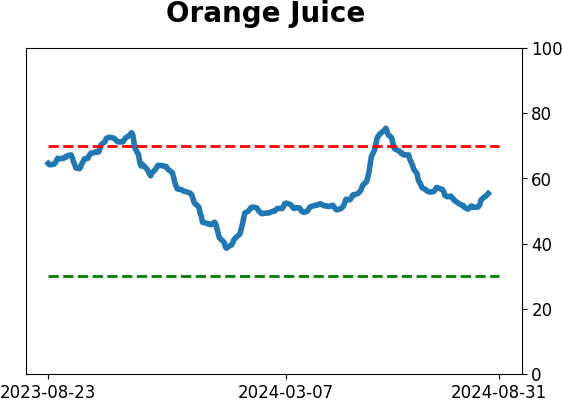
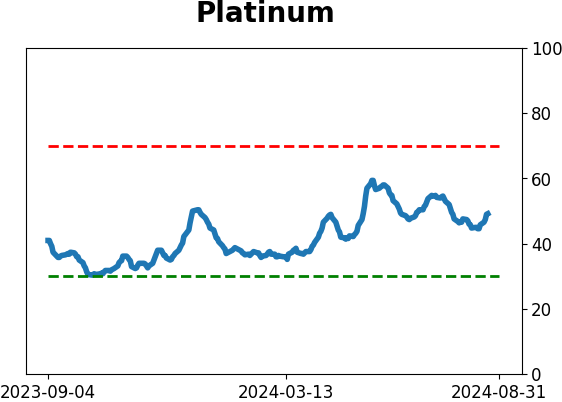
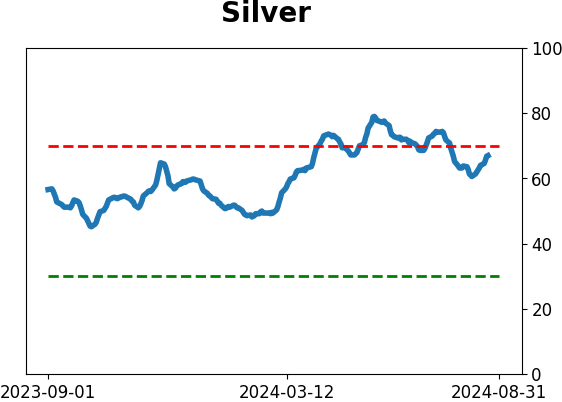
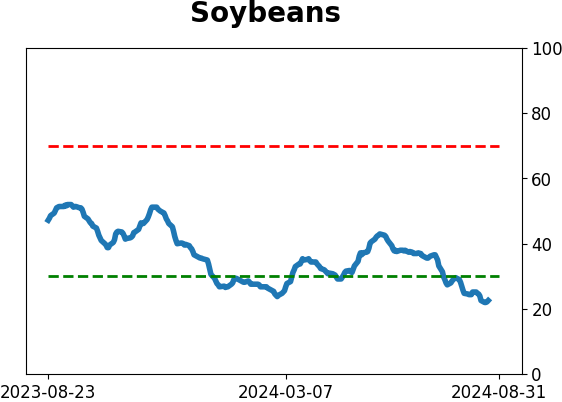
Commodity ETF's - 5-Day Moving Average
|
|